
Howe Barnes Hoefer & Arnett
2006 ASIAN BANKING CONFERENCE
Presentation by: George M. Lee, CEO
November 14, 2006

Forward-Looking Statements
The statements contained in this presentation that are not historical facts are forward-looking statements made pursuant to the safe harbor provisions of the Private Securities Litigation Reform Act of 1995. Forward-looking statements describe MetroCorp’s future plans, projections, strategies and expectations, are based on assumptions and involve a number of risks and uncertainties, many of which are beyond
MetroCorp’s control. Actual results could differ materially from those projected due to changes in interest rates, competition in the industry, changes in local and national economic conditions and various other factors. Additional information concerning such factors that could affect MetroCorp is contained in MetroCorp’s filings with the SEC.
MetroCorp’s control. Actual results could differ materially from those projected due to changes in interest rates, competition in the industry, changes in local and national economic conditions and various other factors. Additional information concerning such factors that could affect MetroCorp is contained in MetroCorp’s filings with the SEC.
2

MetroCorp Bancshares, Inc. is a Texas-based holding company operating banks in Texas and California with special focus on the ethnic markets. The company strives with passion and urgency to provide superior customer service, innovative products and excellent shareholder value through integration of people and technology. Our mission is to be the premier bank in the communities we serve.
Mission
3

18 Years of Growth and Profitability
Largest publicly-owned Independent Asian-American
bank outside of California
Total assets of $1.2 billion
Consecutive profitability for the past 17 years
Record earnings during the past six consecutive
quarters
Established leadership presence in
Houston/Dallas
Recently expanded to Los Angeles/San Diego/
Irvine/San Mateo/City of Industry
4
§
4,756,181
§
797,325
Source: U.S. Census,
estimate 2004
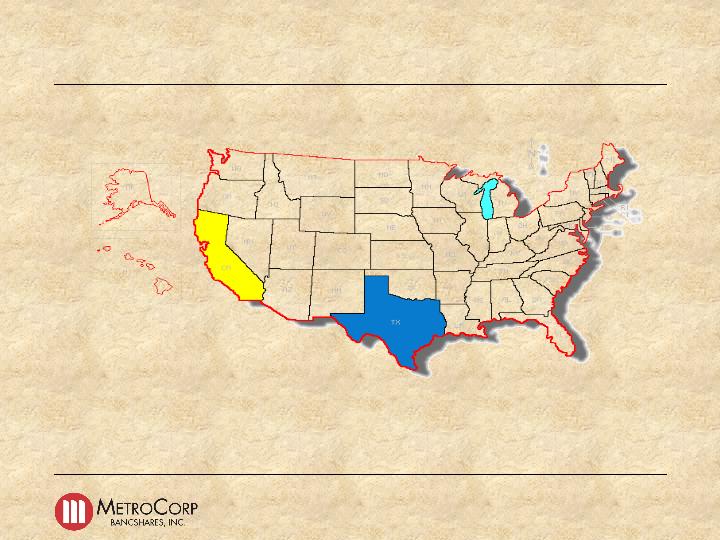
Texas’ Asian Population about 17% of California
Asian Population in California & Texas
5

2000 2004
§
Houston-Galveston 228,212 324,061
§
Dallas-Fort Worth 195,480 277,582
§
Austin-San Marcos 44,029 65,521
§
San Antonio 23,667 33,607
Regional population extrapolation from 2004
total State Census estimates
Total Texas 562,319 797,325
42% Growth
Source: U.S. Bureau of the Census, Census 2000, Census 2004 estimate
Asian Population in Texas 2000-2004
6
2000 2004
v
San Francisco 1,256,258 1,396,565
v
Los Angeles 1,661,456 1,898,205
v
San Diego 386,973 476,773
Source: U.S. Bureau of the Census, Census 2000, Census 2004 estimate
Asian Population in California
7
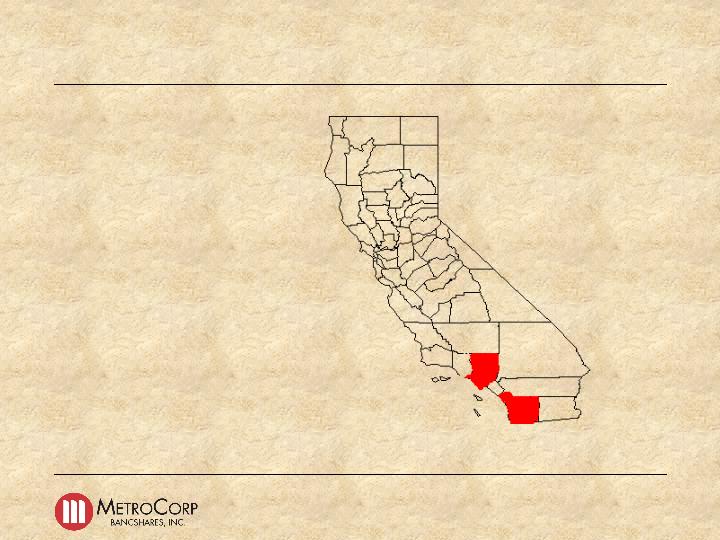
First United Bank
Los Angeles
San Diego
California Offices in Q4 - 2005
8
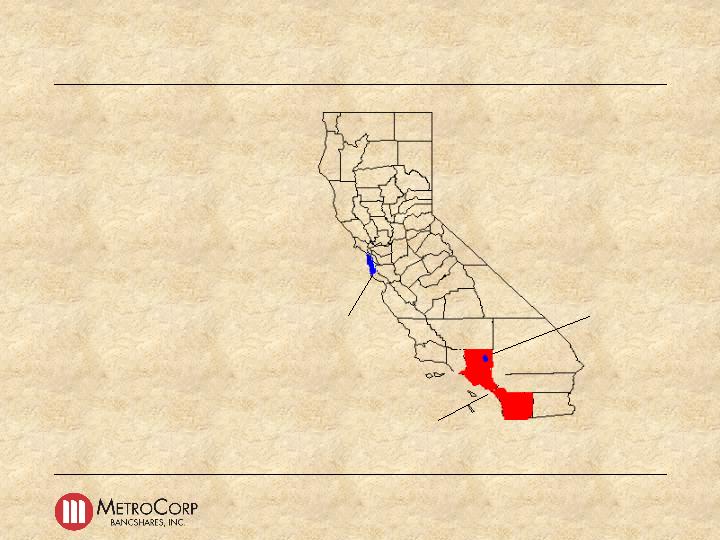
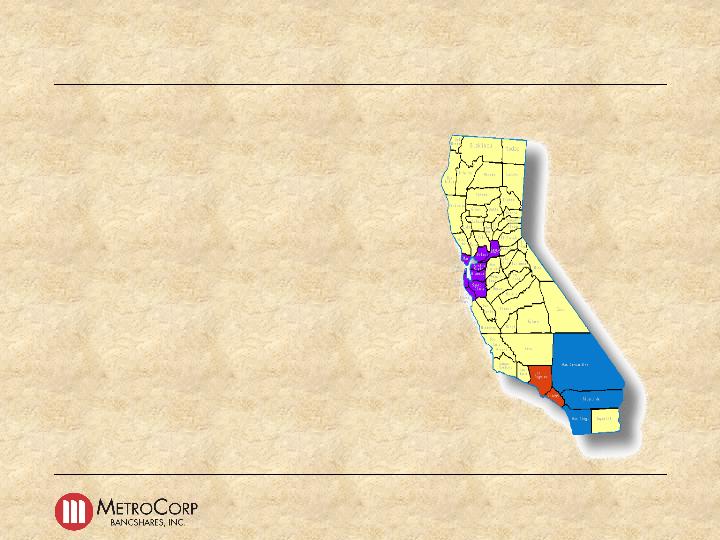
Metro United Bank
San Mateo
Irvine
City of Industry
Los Angeles
San Diego
•
Branch
•
Loan production office
California Offices in Q4- 2006
9
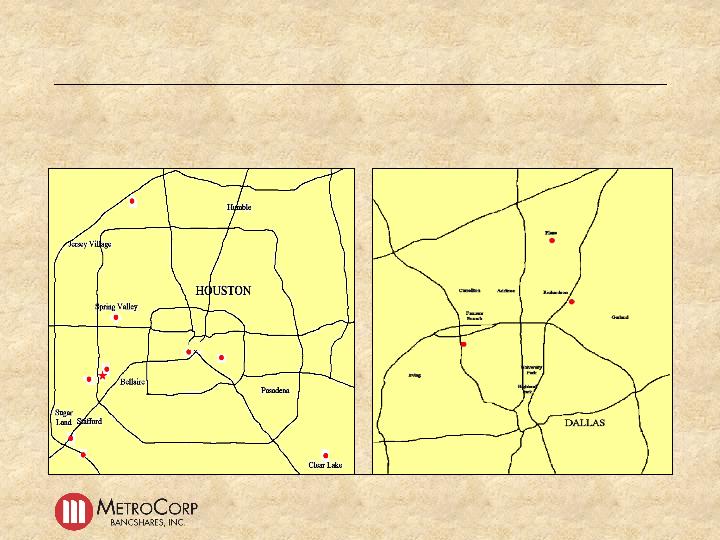
Houston, TX
Dallas, TX
MetroBank Locations
10

Representative Office in China
XIAMEN
11

*Source: 2005 Annual Statistic Report of Xiamen's Economical and Social Development published by the Xiamen City Government
Xiamen – Important Foreign Trade Port
Overview of Xiamen
- One of the four Special Economic Zones
Gross Area Production
- GAP achieved sustained annual growth rate of 15% for 5 years in a row*
Key Industries
- Electronics, Machinery and Chemicals
Foreign Trade
- Total foreign trade was $28 billion in 2005*
( $17 billion exports, up 24%; $11 billion imports, up 12%)
Foreign Investment
- Thirty-five Fortune 500 companies have invested in Xiamen*
12

City View - Xiamen
13

Freeway Surrounding Xiamen
14
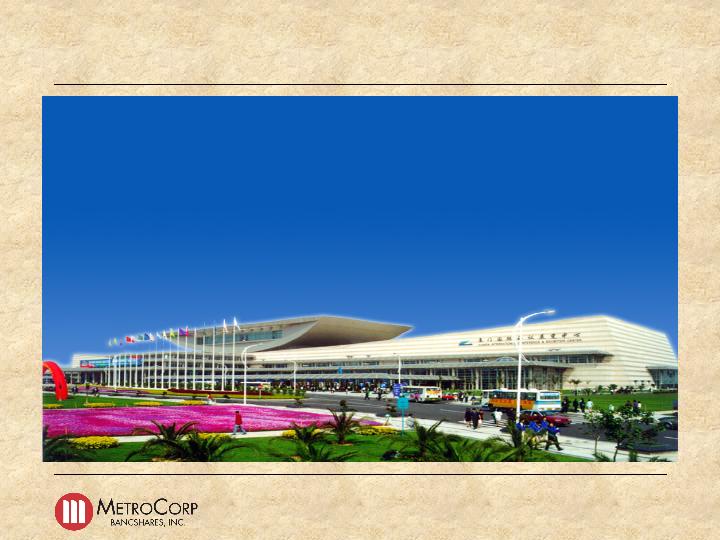
International Exhibition Center
15

Learning from the past.
Moving to the future.
Financial Performance
16
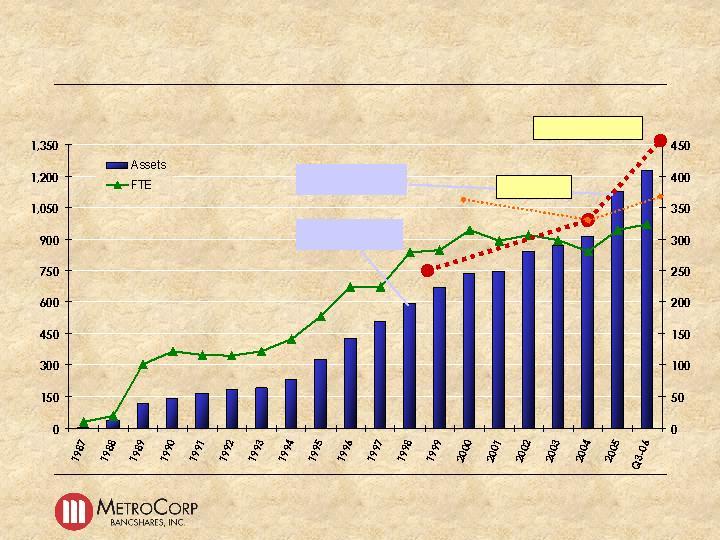
1998: MCBI listed
on NASDAQ
2005: Acquisition –
First United Bank
$ in Millions
FTE ‘s
Asset Growth
FTE trend
Milestones
17
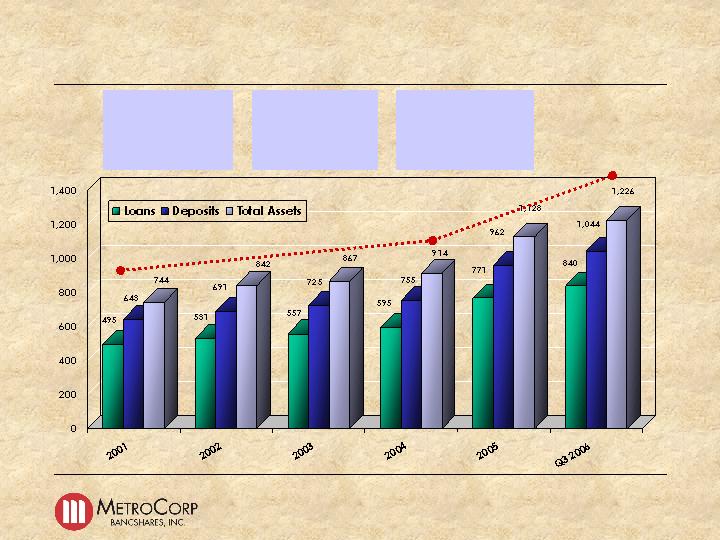
2001~Q3/2006
Loan: 9.8% CAGR
Deposit: 8.9% CAGR
Asset: 9.2% CAGR
$ in Million
2001-2004
Loan: 6.3% CAGR
Deposit: 5.5% CAGR
Asset: 7.1% CAGR
2004~Q3/2006
Loan: 21.9% CAGR
Deposit: 20.4% CAGR
Asset: 18.3% CAGR
Balance Sheet Growth
18
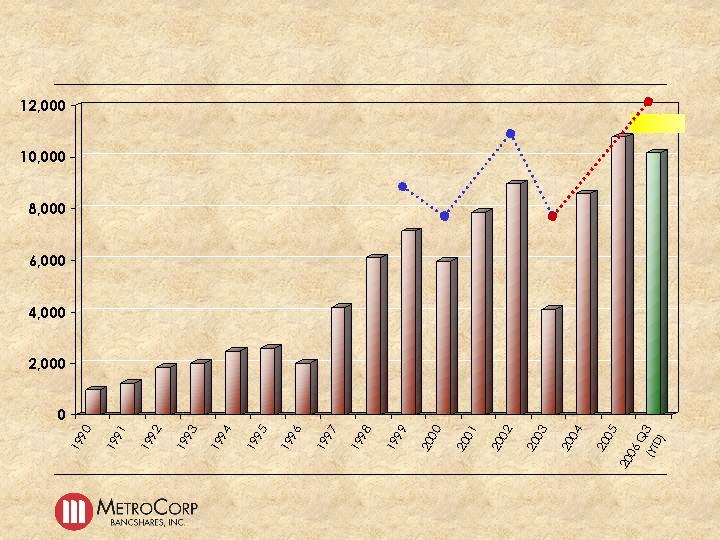
$
$ 10,169
Net Income (in thousands)
Profitable Since 1990
19
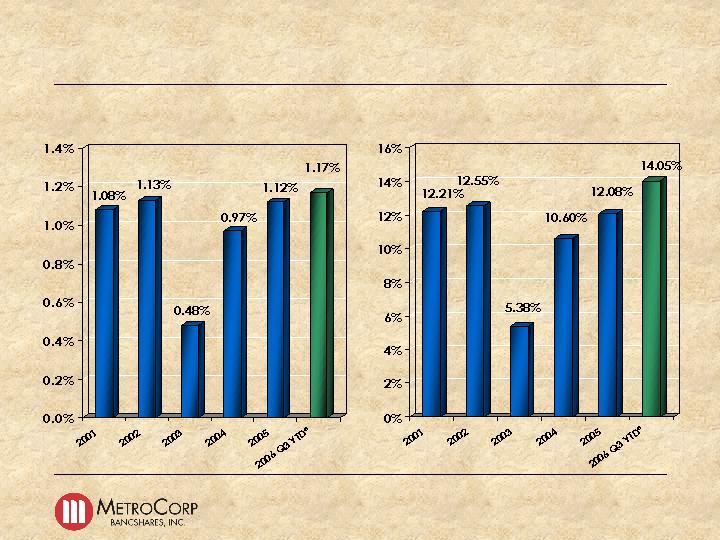
Return on Average Assets
Return on Average Equity
* Annualized
Shareholder Return
20
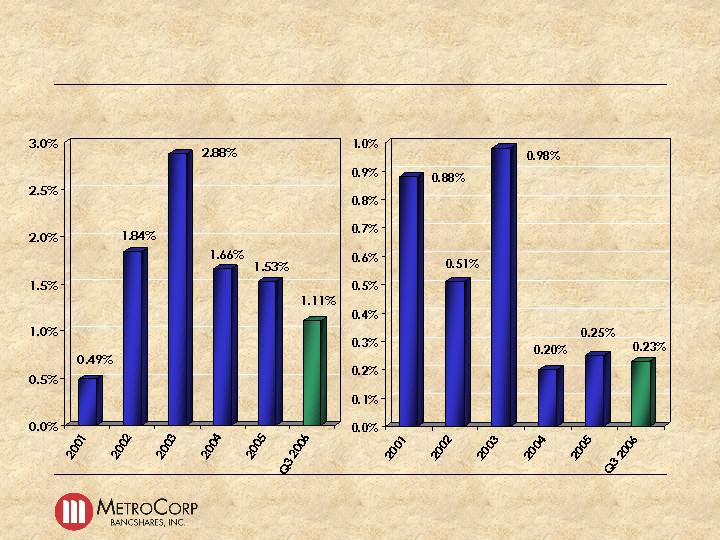
Net Non-performing Assets / Total Assets
Net charge-offs / Avg. total Loans
Asset Quality
21
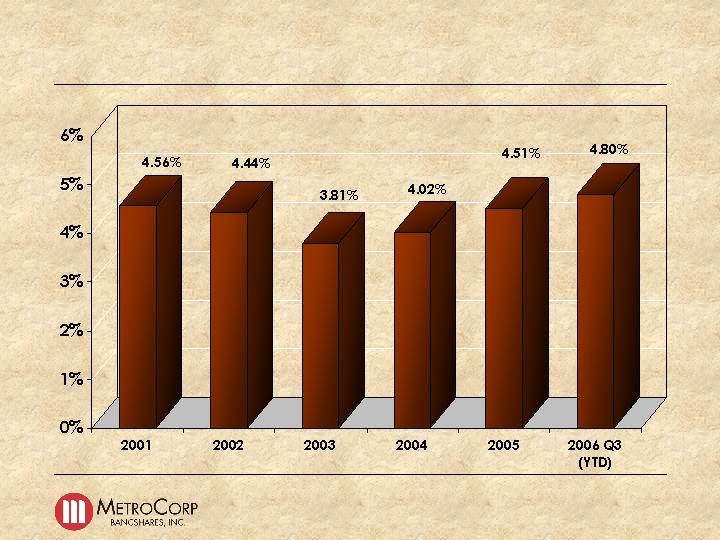
Net Interest Margin
22
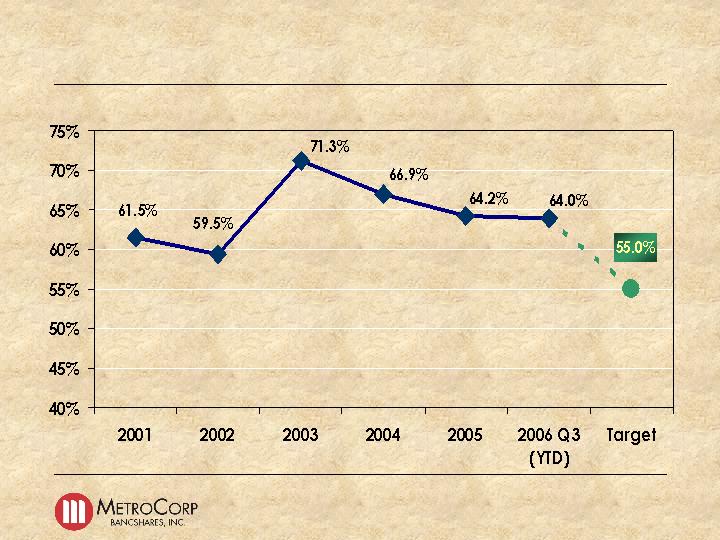
Efficiency Ratio
23

Loan Portfolio
24
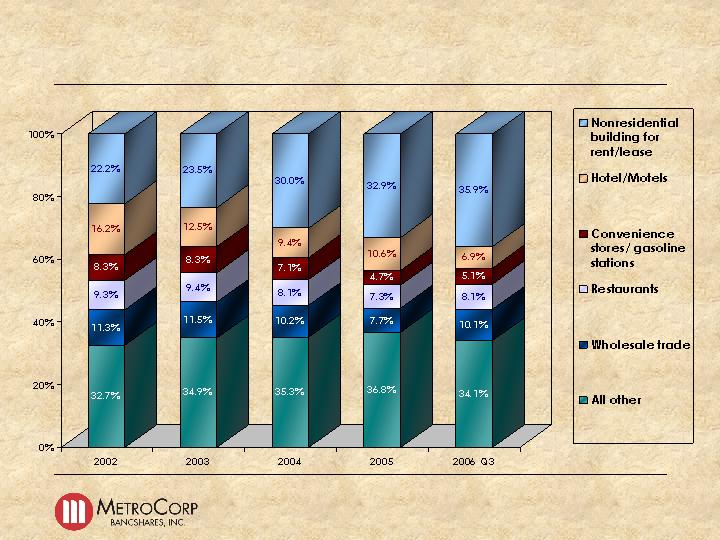
Loan Portfolio – Industry Concentration
25

Learning from the past.
Moving to the future.
Management
26

Management Team
Don J. Wang Chairman of the Board
George M. Lee President, CEO, Executive Vice Chair of MetroCorp
David Tai Chief Business Development Officer, President of MetroBank
Bert Baker Chief Lending Officer of MetroBank
David Choi Chief Financial Officer
Kevin Shu Chief Accounting Officer
Michelle Phung Chief Operations Officer of MetroBank
Terrance Tangen Chief Credit Officer of MetroBank
Mitchell Kitayama Vice Chairman, CEO of Metro United Bank
Robert Bihr Chief Credit Officer of Metro Untied Bank
Val Marquez EVP, IT Strategic Planning of Metro United Bank
27
Well-served Customers with New Enhanced Products
Board of Directors
Line Staff
Process Efficiency
Customer Focus
Middle Management
Empowerment
Accountability
CEO
Senior Management
Strategic
Tactical
Execution
Customer Focused
28

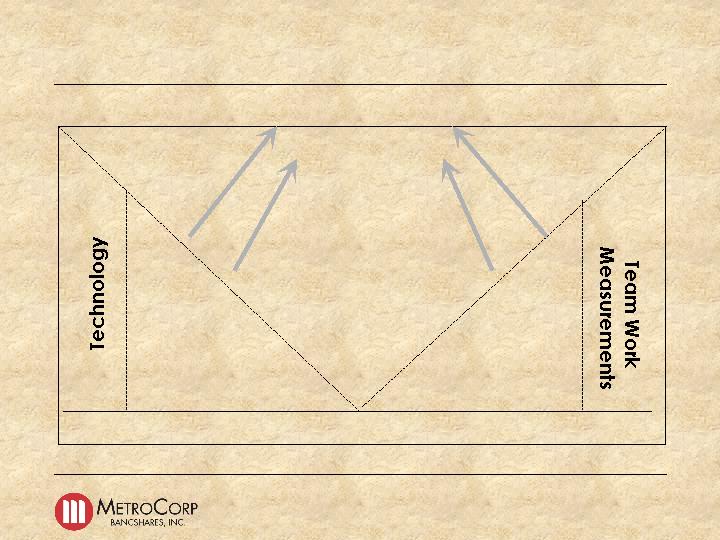
Technology Enhancement
Digital Insight Corporation
- Online Products & Services
- Technology Driven Marketing Culture
- Culturally Sensitive & Innovative Market Penetration
Hartland Financial Solutions
- Risk Management Enhancements
- Integrated Commercial Credit Management System
- Streamlined Workflow
Internal IT & Technology Strength
- Well Rounded Expertise
- Training
- Incentive & Measurements
29

Expectations
Improving asset quality
Efficiency ratio improvement
Balanced asset/earning growth
Expanding & diversification of business
portfolio
Optimizing synergy between Texas and
California
Brand/Image improvement
30
Gee Hwei