Free signup for more
- Track your favorite companies
- Receive email alerts for new filings
- Personalized dashboard of news and more
- Access all data and search results
Filing tables
MetroCorp Bancshares similar filings
- 19 Jun 07 Notice of Delisting or Failure to Satisfy a Continued Listing Rule or Standard
- 13 Jun 07 Departure of Directors or Principal Officers
- 23 May 07 Notice of Delisting or Failure to Satisfy a Continued Listing Rule or Standard
- 22 May 07 Regulation FD Disclosure
- 27 Apr 07 Results of Operations and Financial Condition
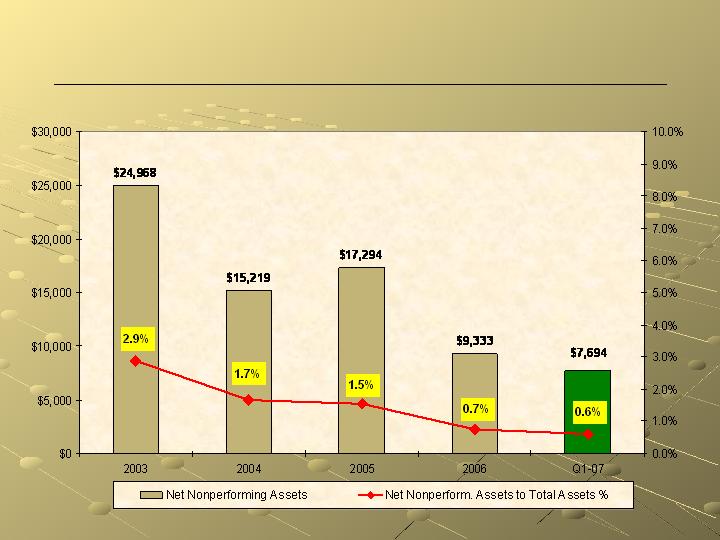
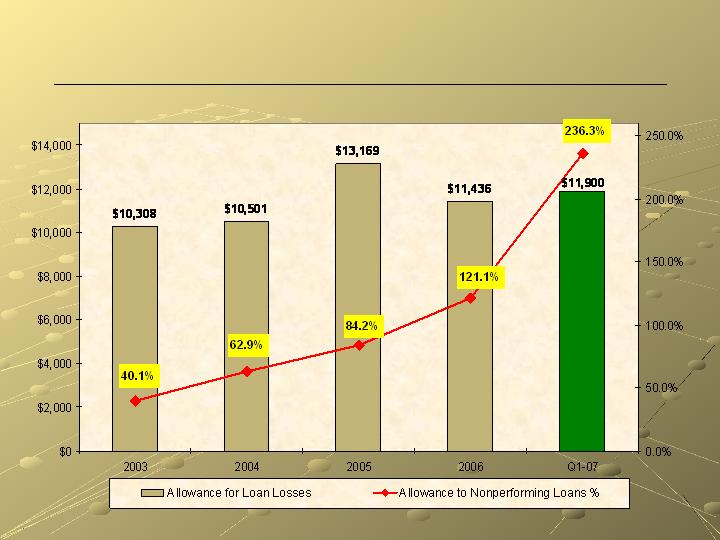
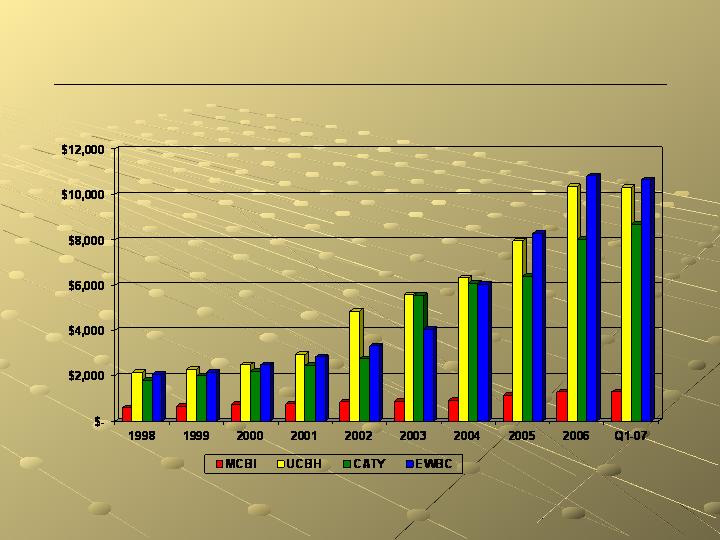
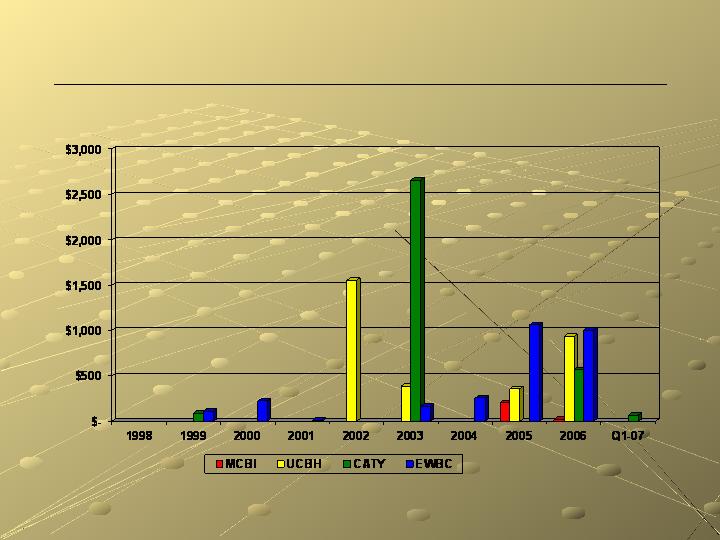
- 22 Feb 07 The statements contained in this presentation that are not
- 2 Feb 07 Results of Operations and Financial Condition
Filing view
External links