
Keefe, Bruyette & Woods
Presentation by: George M. Lee, CEO
December 2007

2
Forward-Looking Statements
facts are forward-looking statements made pursuant to the safe harbor
provisions of the Private Securities Litigation Reform Act of 1995.
Forward-looking statements describe MetroCorp’s future plans,
projections, strategies and expectations, are based on assumptions
and involve a number of risks and uncertainties, many of which are
beyond MetroCorp’s control. Actual results could differ materially from
those projected due to changes in interest rates, competition in the
industry, changes in local and national economic conditions and
various other factors. Additional information concerning such factors
that could affect MetroCorp is contained in MetroCorp’s filings with the SEC.

3
Mission
holding company operating banks in Texas and
California with special focus on the ethnic markets.
The company strives, with passion and urgency, to
provide superior customer service, innovative
products and excellent shareholder value through
integration of people and technology. Our mission is
to be the premier bank in the communities we serve.

4
The Asian population in Texas is about 15.2% of
the Asian population of California in 2000
and 17.6% in 2006 .
Source: U.S. Census Bureau
In thousands
2000
2006
Growth
US
10,243
13,100
28%
CA
3,698
4,483
21%
NY
1,045
1,323
27%
TX
562
787
40%
NJ
480
652
36%
IL
424
537
27%
FL
266
393
48%
VA
261
366
40%
PA
220
289
32%
MD
211
276
31%
GA
173
255
47%
CT
82
117
42%
Asian population (2000-2006)
5
In thousands
HOUSTON
DALLAS-FT
.WORTH
AUSTIN
SAN ANTONIO
2000
2006 *
Houston-Galveston
228
339
Dallas-Fort Worth
195
305
Austin-San Marcos
44
75
San Antonio
24
46
Total Texas
562
787
* Regional population extrapolation from 2006
   State Census estimates
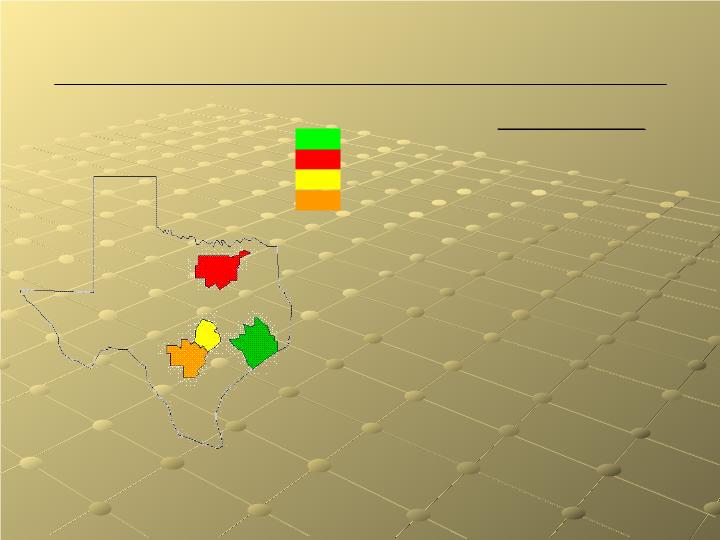
Asian Population in Texas 2000-2006
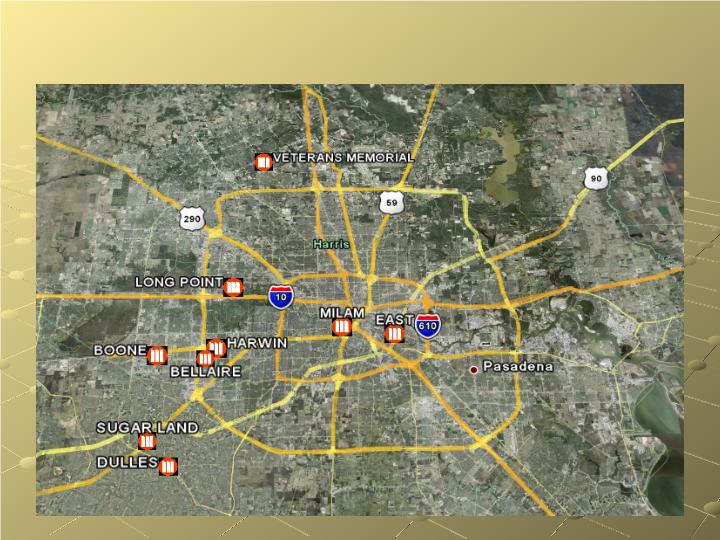
6
9 Branches in Houston
7
(In progress)
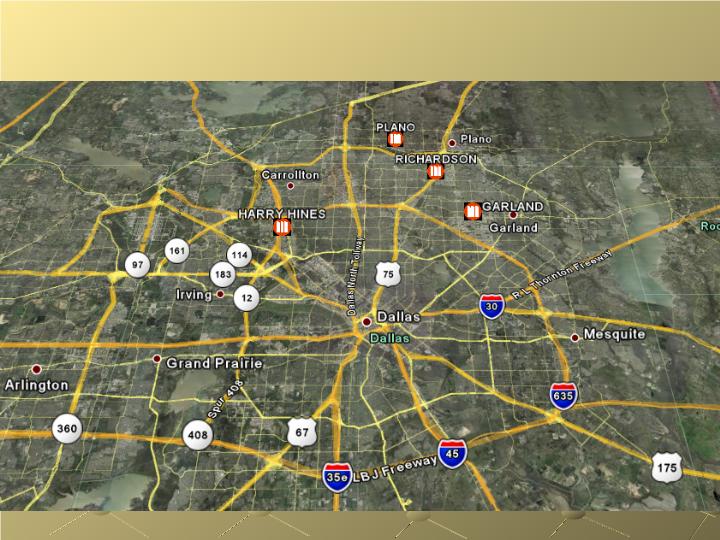
3 Branches in Dallas
8
In thousands
Source: U.S. Census, 2000
* Extrapolation from 2006 Census estimate
2000
2006*
Growth
1,256
1,873
49%
1,661
1,915
15%
387
617
59%
San Francisco
Los Angeles
San Diego
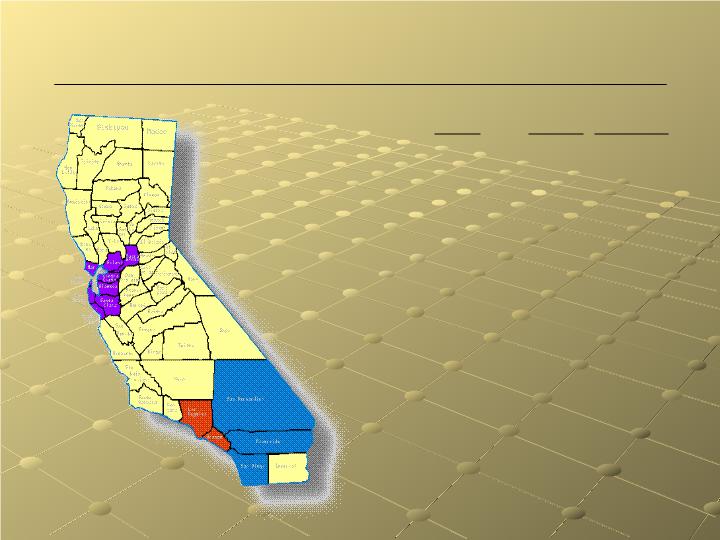
Asian Population in California
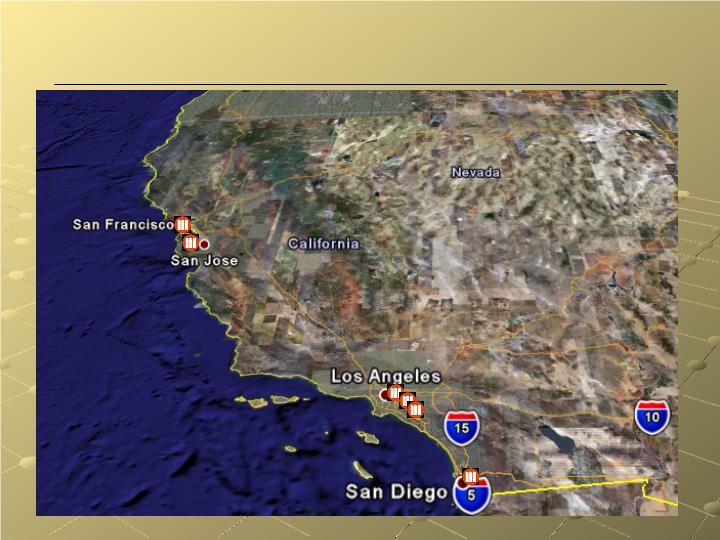
9
BRANCHES
San Francisco
San Mateo
City Of Industry
Alhambra
Irvine
San Diego
6 Branches in California

10
Source: U.S. Census Bureau
U.S.
Asian
Median Income (2006)
$48,201
$64,238
Median Home Value (2002)
$122,800
$199,300
Savings Deposit (Aug 2002)
$10,000
$17,000
Asian-American Economic Attributes
11
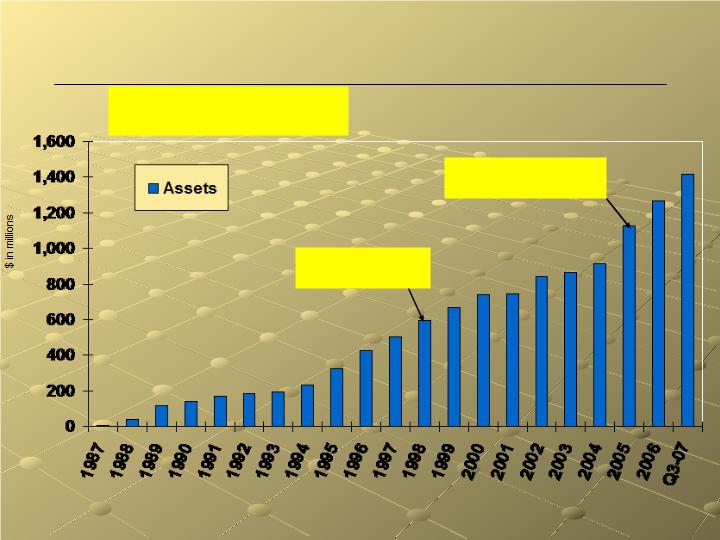
1998: MCBI listed
on NASDAQ
Oct. 2005: Acquisition
- First United Bank
Total Assets
1987 - Q3-07 CAGR: 36.6%
Milestones

12
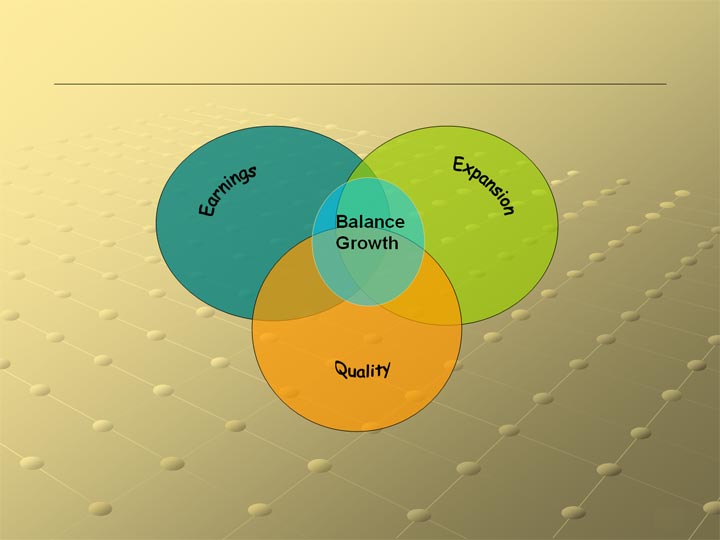
ASSET GROWTH
ASSET QUALITY
EARNINGS
EFFICIENCIES
HUMAN RESOURCE DEVELOPMENT
Company Focus
13
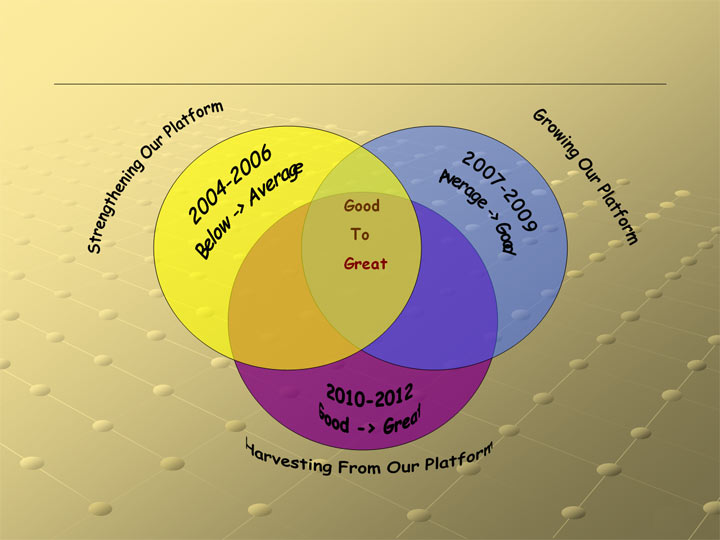
Good
To
Great
Strategic Transformation of MetroCorp
14
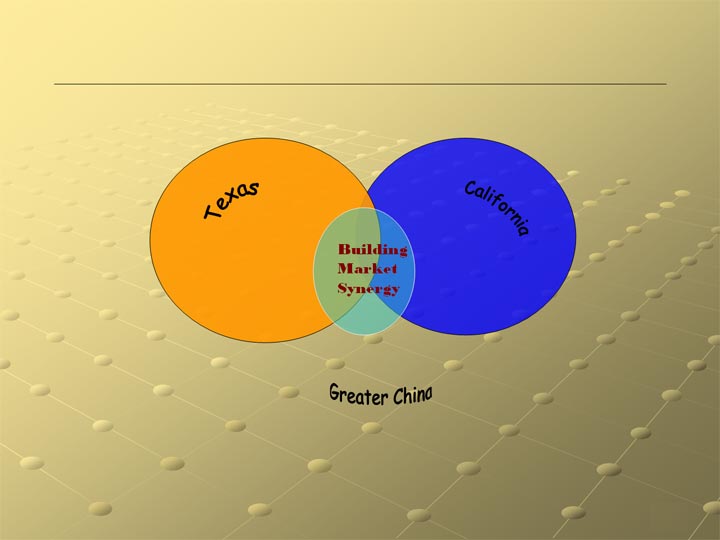
Market Footprint
15
Financial Results
16
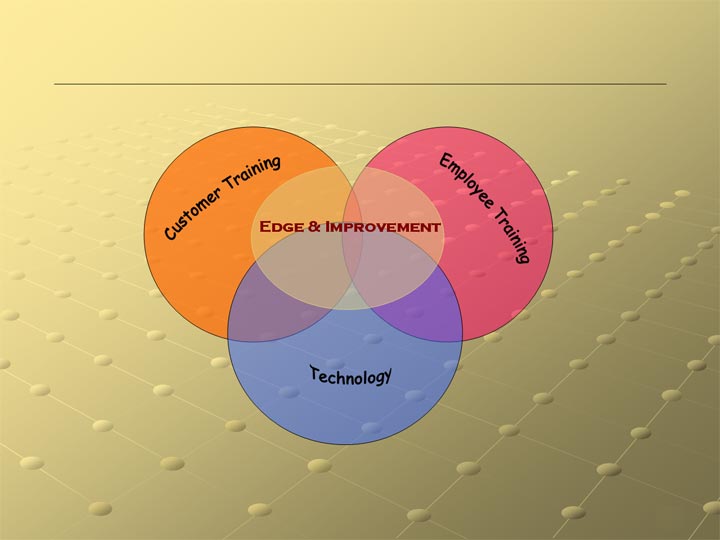
Efficiency + Competitive Edge
17
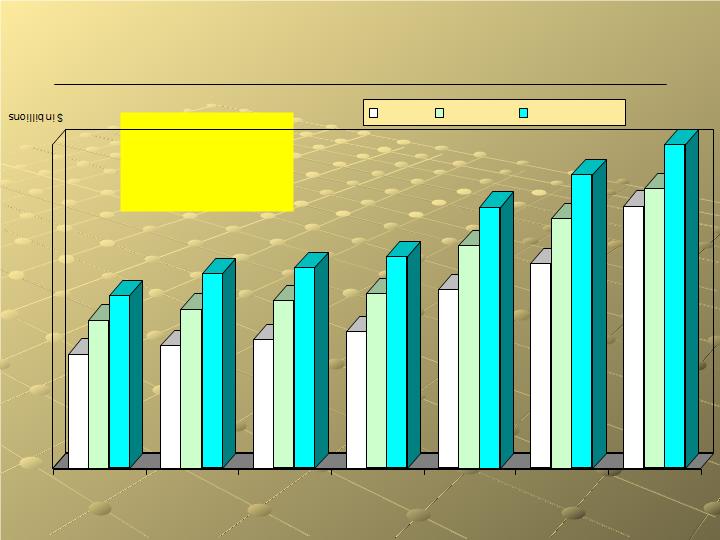
2001 - Q32007 CAGR
Loans: 15.5%
Deposits: 11.6%
Assets: 11.4%
0.5
0.6
0.7
0.5
0.7
0.8
0.6
0.7
0.9
0.6
0.8
0.9
0.8
1.0
1.1
0.9
1.1
1.3
1.1
1.2
1.4
0.0
0.2
0.4
0.6
0.8
1.0
1.2
1.4
2001
2002
2003
2004
2005
2006
Q3-2007
Loans
Deposits
Total Assets
Balance Sheet Growth
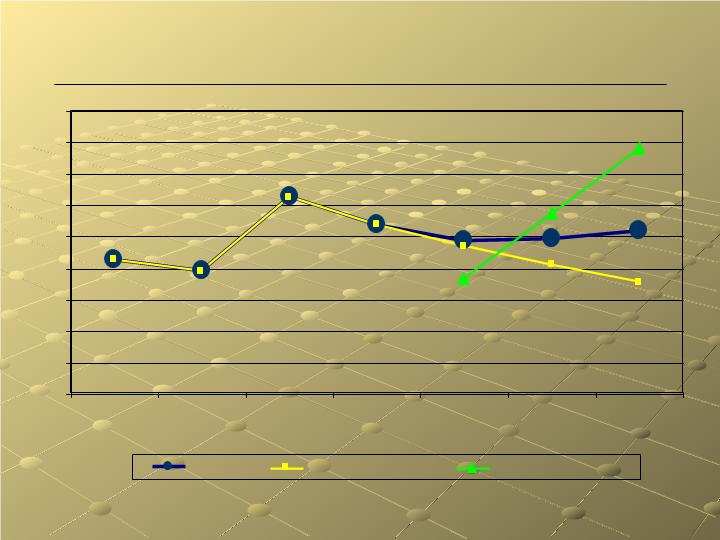
18
65.8%
64.6%
64.2%
66.9%
71.3%
59.5%
61.4%
57.7%
60.5%
63.4%
66.9%
71.3%
61.4%
59.5%
58.3%
79.1%
68.7%
40%
45%
50%
55%
60%
65%
70%
75%
80%
85%
2001
2002
2003
2004
2005
2006
YTD Q3-07
MCBI
METROBANK
METRO UNITED
Efficiency Ratios
19
4,000
8,000
12,000
16,000
20,000
24,000
28,000
32,000
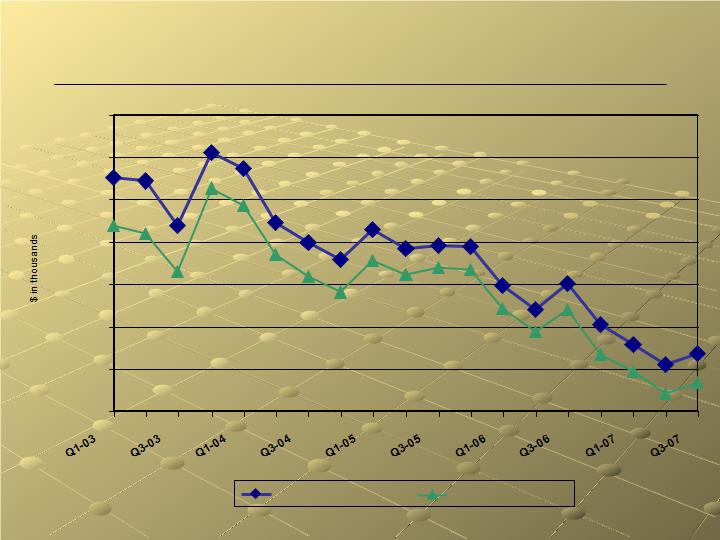
Net Active Principal
Net of Guarantee
Non-performing Assets

20
2001~2006 CAGR: 11.4%
7,854
8,970
4,110
8,594
10,780
13,504
9,371
0
2000
4000
6000
8000
10000
12000
14000
16000
2001
2002
2003
2004
2005
2006
YTQ3-07
Net Income Growth
21
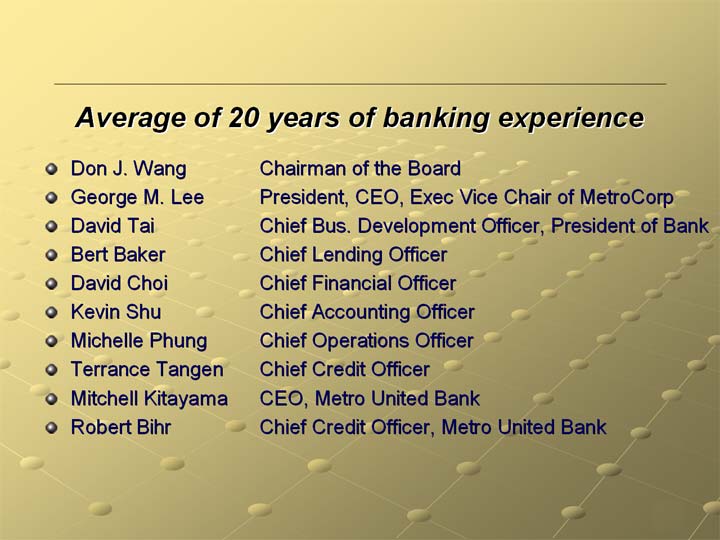
Leaders
22
Investment for the Future

23
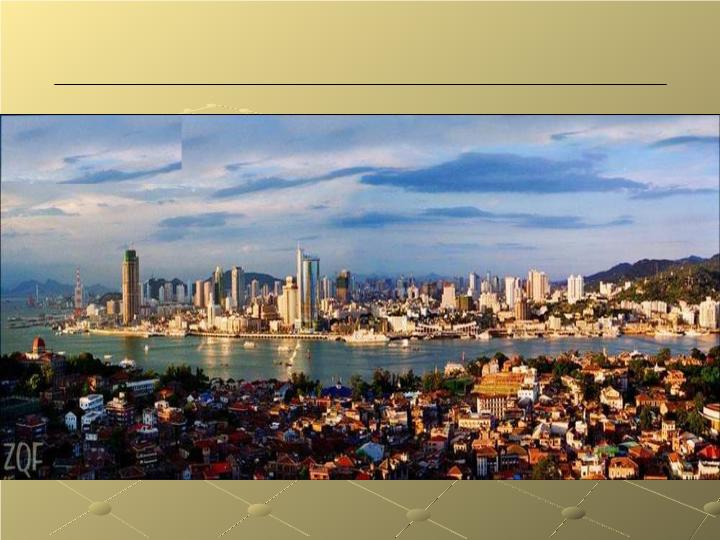
Xiamen - Important Foreign Trade Port
Overview of Xiamen
nOne of the four Special Economic Zones
nOne of top ten most competitive cities*
Gross Area Production
nGAP achieved sustained annual growth rate of 15% for 5
years in a row
Key Industries
nElectronics, Machinery and Chemical industry
Foreign Trade
nTotal foreign trade was $28 billion in 2005
•$17 billion exports, up 24%; $11 billion imports, up 12%
Foreign Investment
nThirty Five Fortune 500 companies have invested in Xiamen
* Source: 2005 Blue Book of City Competitiveness
24
Xiamen - City View

25
Chongqing - The Largest Inland City
Overview of Chongqing
nUnder direct central government’s control, like Beijing,
Shanghai and Tianjin
nPlay a key role in China’s “Go West” Strategy
nSpecial Economic Zone newly set by China in the year of 2007
Gross Area Production
nAverage growth rate of 11% for last 5 years
Key Industries
nFourth biggest motor vehicle manufacturing center
nOne of China’s six chemical production bases
Foreign Trade
nTotal foreign trade was $4.3 billion in 2005
nAn average growth rate of 19% for the past 5 years
Foreign Investment
n24 of Fortune 500 companies have invested in Chongqing
* Source: 2005 Blue Book of City Competitiveness
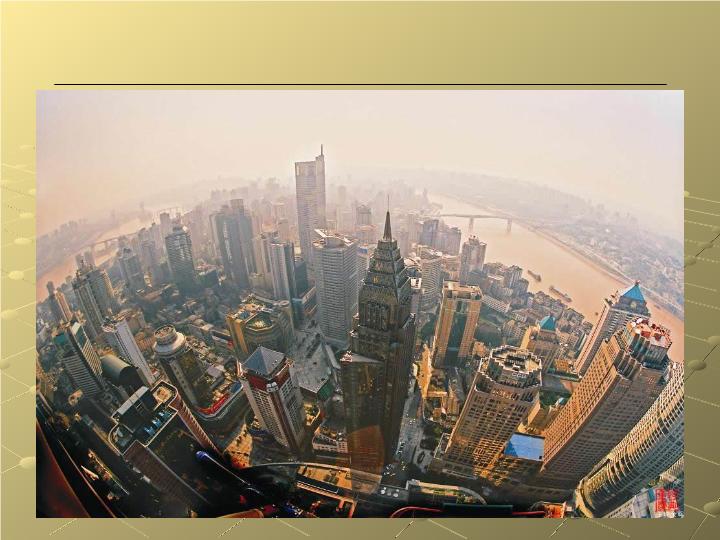
26
Chongqing - City View
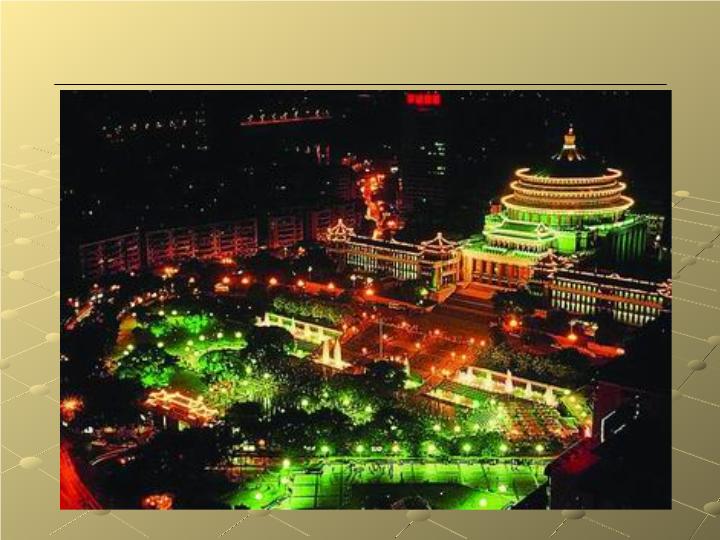
27
Chongqing - Night View

28
Operating Objectives Going Forward
Stay on course with strategic timeline
Tone down growth in 08,09
              Strive to improve & upgrade key
   components of our business
              Focus on becoming a "Premier" Asian
   Ethnic Bank

29
Thank You