KEEFE, BRUYETTE & WOODS
2010 TEXAS FIELD TRIP
February 9 - 11th, 2010
Houston, Texas
Presentation by: George M. Lee
Executive Vice Chairman, President & CEO
2/9/2010
1

The statements contained in this presentation that are not historical facts
are forward-looking statements made pursuant to the Safe Harbor
provisions of the Private Securities Litigation Reform Act of 1995. Forward-
looking statements describe MetroCorp’s future plans, projections,
strategies and expectations, are based on assumptions, and involve a
number of risks and uncertainties, many of which are beyond MetroCorp’s
control. Actual results could differ materially from those projected due to
changes in interest rates, competition in the industry, changes in local and
national economic conditions and various other factors. Additional
information concerning such factors that could affect MetroCorp is
contained in MetroCorp’s 2008 Annual Report on Form 10-K and other
reports and documents filed from time to time with the SEC.
2
Forward Looking Statements

§ Expense Management
§ NIM
§ Capital
§ Balance Sheet
§ Asset / Loan Quality (Terry Tangen)
3
Today’s Agenda
4

5
Expense Management
2007 | 2008 | 2009 | |
FTE | 348 | 321 | 296 |
Compensation | $ 24,846 | $ 24,298 | $ 20,406 |
Legal & Professional | $ 1,443 | $ 2,048 | $ 2,505 |
Regulatory | $ 451 | $ 906 | $ 4,252 |
ORE Related | $ 278 | $ 289 | $ 4,107 |
Net Charge Off | $ 1,456 | $ 5,539 | $ 17,592 |
Loan Loss Provision | $3,145 | $16,649 | $23,513 |
($ in 000’s)
6
7

8
9
Net Interest Margin (%)

10
NIM vs Peer Banks
MCBI | EWBC* | CATY | PFBC | |
2009 Q4 | 3.73 | 3.61 | 2.65 | 2.58 |
2008 Q4 | 3.72 | 2.72 | 2.85 | 3.31 |
2007 Q4 | 4.30 | 3.91 | 3.43 | 4.82 |
2006 Q4 | 4.61 | 3.81 | 4.01 | 5.19 |
2005 Q4 | 4.56 | 4.20 | 4.34 | 4.81 |
* Non-GAAP excluding discount on covered loans from UCBH purchase
11

12
Total Risk-Based Capital Ratio
Tangible Common Equity Ratio
MB | MUB | MCBI | |
12/31/2009 | 14.07% | 12.87% | 13.88% |
12/31/2008 | 10.39% | 10.41% | 10.17% |
MB | MUB | MCBI | |
12/31/2009 | 11.23% | 9.32% | 5.87% |
12/31/2008 | 8.64% | 8.29% | 6.22% |

13
14
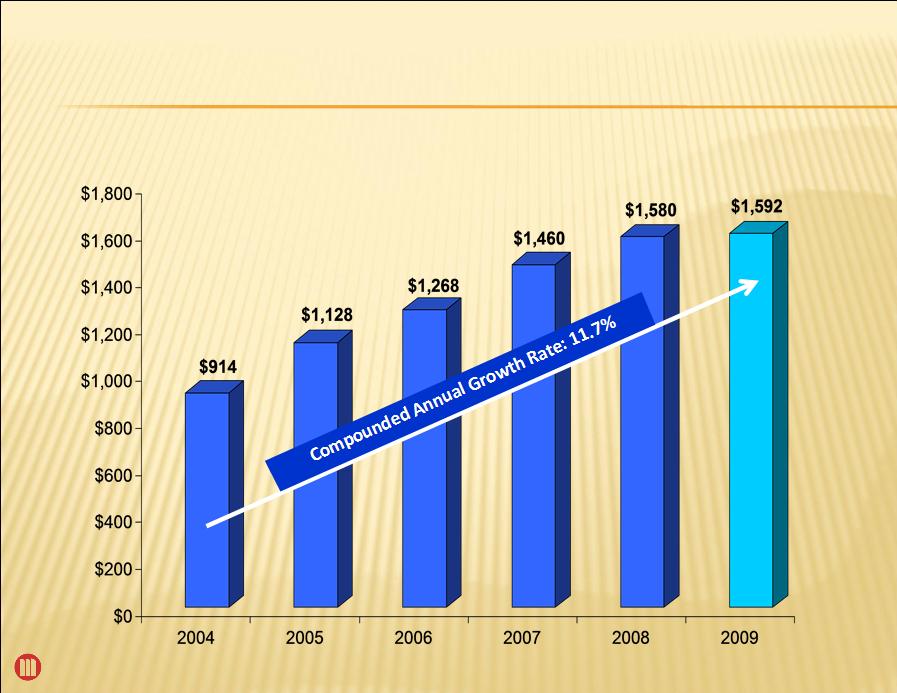
MCBI Total Asset Growth
$ in millions
15
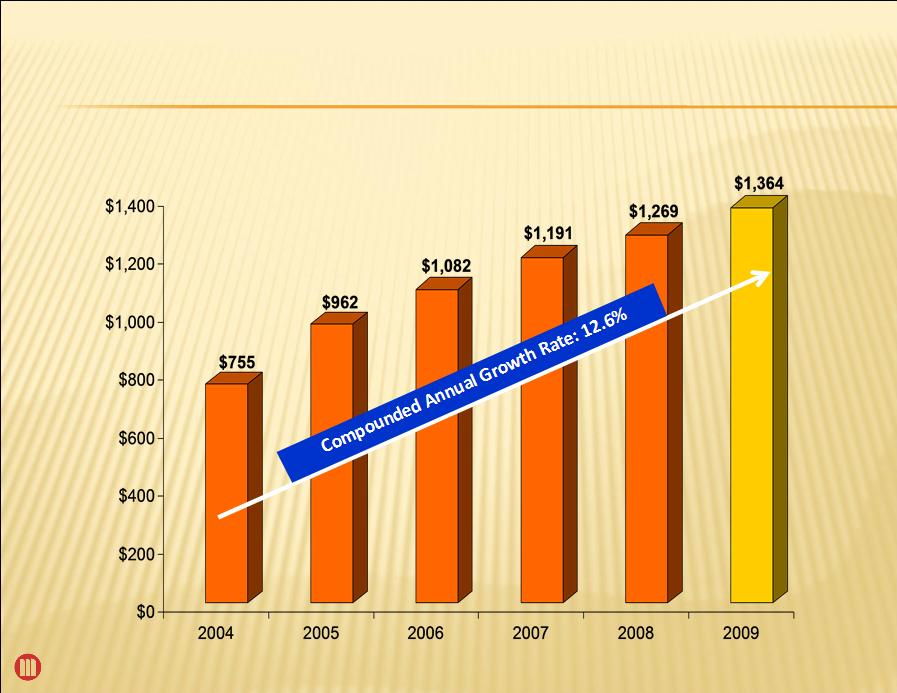
MCBI Total Deposit Growth
$ in millions
16
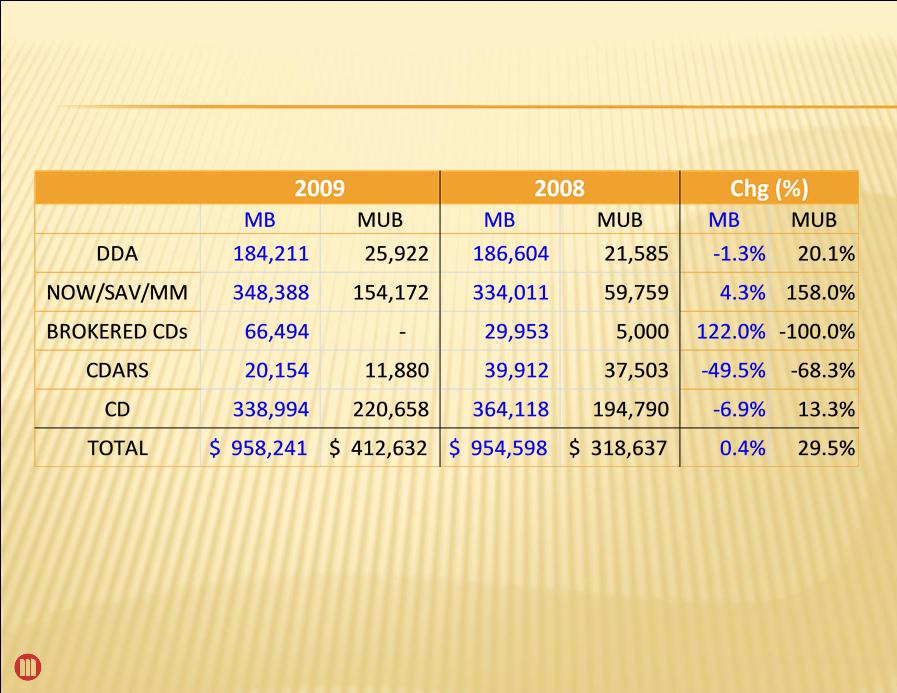
Deposit Composition
17
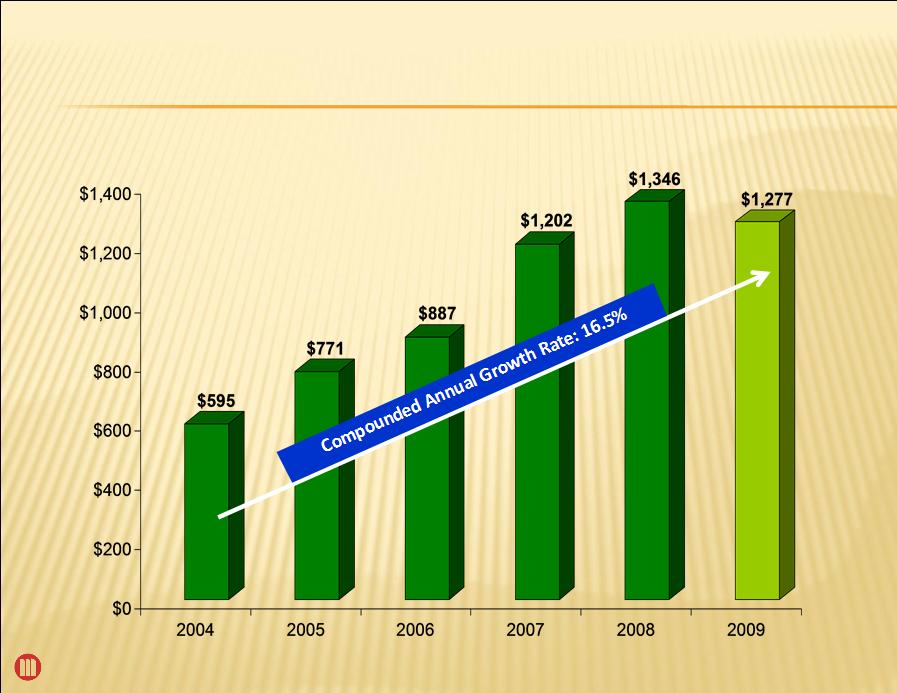
MCBI Total Loan Growth
$ in millions
18
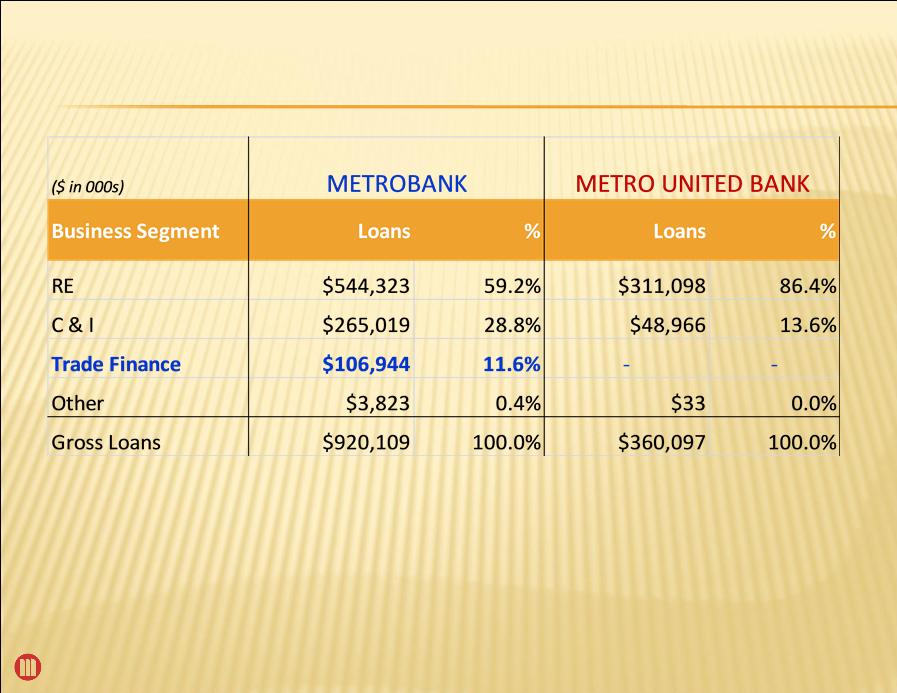
Loan Concentration
19

OPERATING ENVIRONMENT
§ Panama Canal Expansion
§ Turn Houston into potentially the largest port city in the country
§ Trade Business between Texas & China
§ China is Texas’ third largest trading partner
§ Texas is the second largest exporting state to China
§ Houston metro area provides 2/3 of total trade business
§ Dallas/Fort Worth provides 20%
§ Imports from China in 2008: $18 billion
§ Exports to China in 2008: $8.4 billion
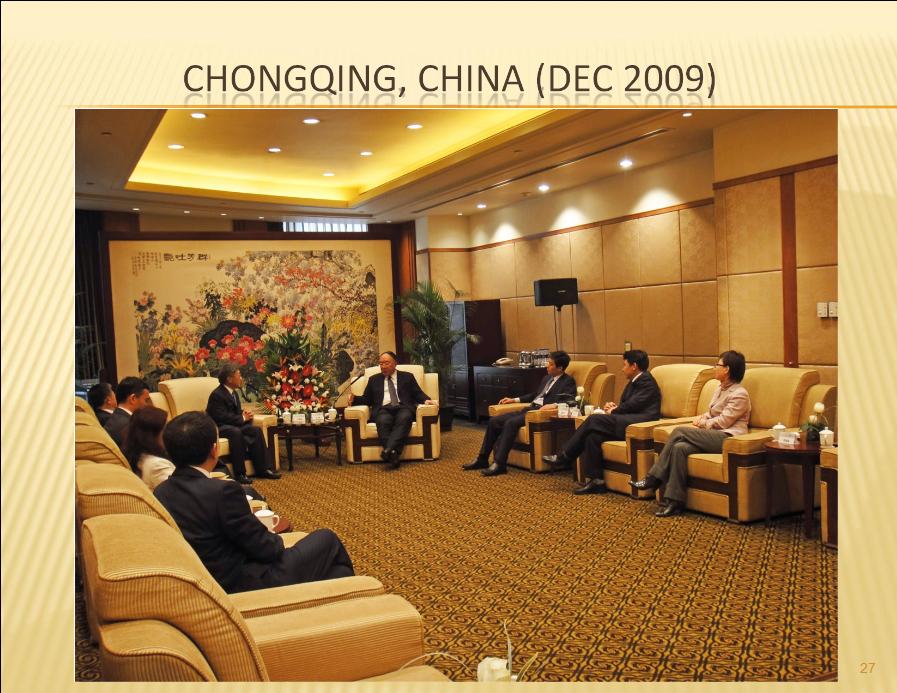
§ Strategic Location of Representative Offices in China
§ Chongqing will be the focus of China’s growth into the inland provinces
§ Xiamen is an important import & export port in China
20

METROBANK’S COMPETITIVE EDGE
§ MetroBank vs. Money Center Banks
§ Location - Headquartered in Texas
§ Trade finance centers of other national banks
located in NY, CA, etc.
located in NY, CA, etc.
§ Language
§ Money center banks focus on very large accounts
21

METROBANK’S COMPETITIVE EDGE
§ MetroBank vs. Community Banks
§ Only few community banks in Texas are able to
handle trade finance
handle trade finance
§ MetroBank has a stronger international
business team
business team
§ MetroBank is the only bank headquartered in
Texas with presence in China
Texas with presence in China
22

METROBANK’S COMPETITIVE EDGE
§ MetroBank vs. Small Ethnic Banks
§ MetroBank has more complete service
§ Two representative offices in China
§ Stronger network of bank relationship in China
§ Branches in the second largest exporting state -
California
California
23

BUSINESS & EARNING OPPORTUNITIES
§ Business Development
§ Export - L/C Advising, Negotiation, & Discounting
§ Import - L/C Issuance & L/C Refinancing
§ Correspondent Banking
§ Related Private Business or Personal Accounts
§ Depository Relationships
24

STRENGTHENING OUR COMPETENCE
§ Staffing
§ Lenders & underwriters to be more international
business minded
business minded
§ Hire a high level international credit professional
§ Monitoring Process
§ Lending Process
25

26
28
29

30

31

KEEFE, BRUYETTE & WOODS
2010 TEXAS FIELD TRIP
February 9 - 11th, 2010
Houston, Texas
Presentation by: Terrance J. Tangen
Executive Vice President & Chief Credit Officer
2/9/2010
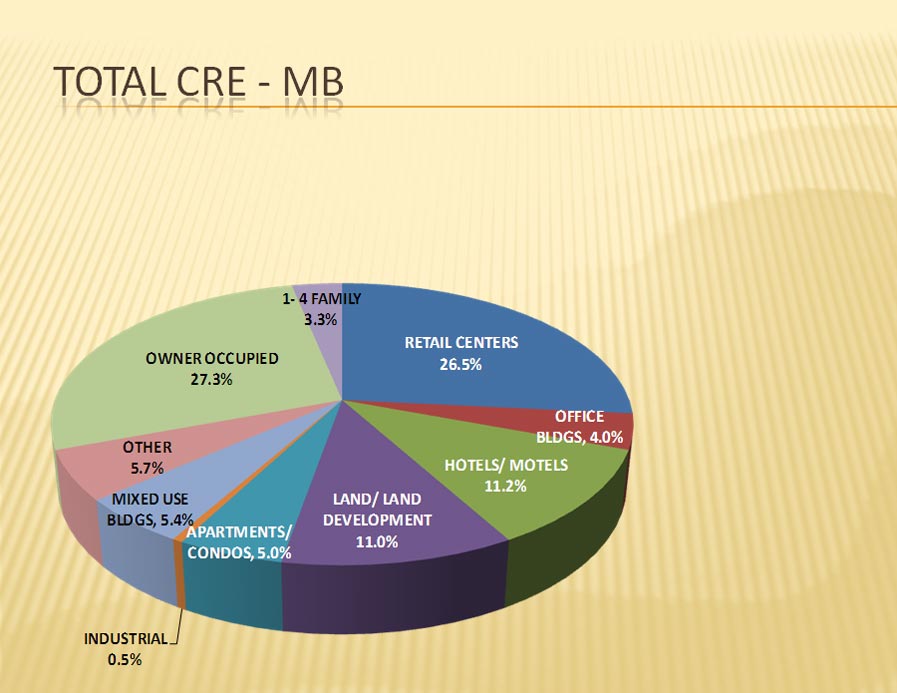
TOTAL REAL ESTATE PORTFOLIO
33
OWNER OCCUPIED
27.3%
RETAIL CENTERS
26.5%
HOTELS/ MOTELS
11.2%
DEVELOPMENT
11.0%
OTHER
5.7%
MIXED USE BLDGS
5.4%
APARTMENTS/CONDOS
5.0%
OFFICE BLDGS
4.0%
1- 4 FAMILY
3.3%
INDUSTRIAL
0.5%
CATEGORY | NET ACTIVE PRINCIPAL BALANCE | % OF BANK CAPITAL | % OF GROSS LOANS |
TOTAL INCOME PRODUCING | $ 561,932,608 | 371.3% | 61.1% |
OWNER OCCUPIED | $ 220,975,716 | 146.0% | 24.0% |
1- 4 FAMILY | $ 26,642,301 | 17.6% | 2.9% |
TOTAL REAL ESTATE SECURED | $ 809,550,625 | 534.9% | 88.0% |
ALL OTHERS | $ 110,558,693 | 73.1% | 12.0% |
TOTAL BANK GROSS LOANS | $ 920,109,319 | 100.0% |
34
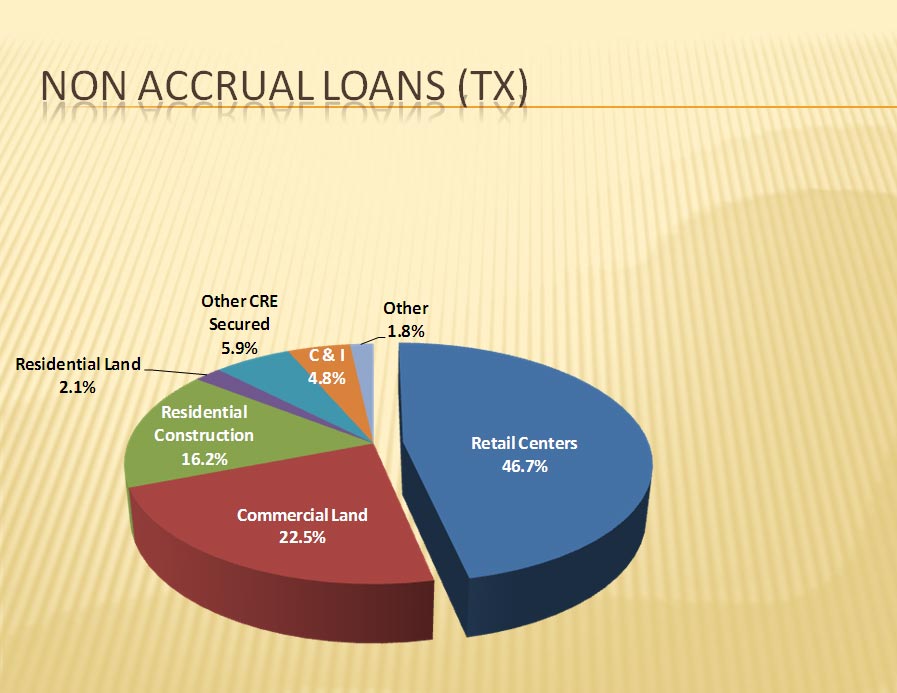
35
Retail Centers
46.7%
Commercial Land
22.5%
Residential Construction
16.2%
Residential Land
2.1%
Other CRE Secured
5.9%
C & I
4.8%
Other
1.8%

ORE - MB
36
Hospital | $5.4 MM |
Commercial Land | $8.2 MM |
Office / Warehouse | $0.9 MM |
Residential | $0.6 MM |
Total | $15.1 MM |
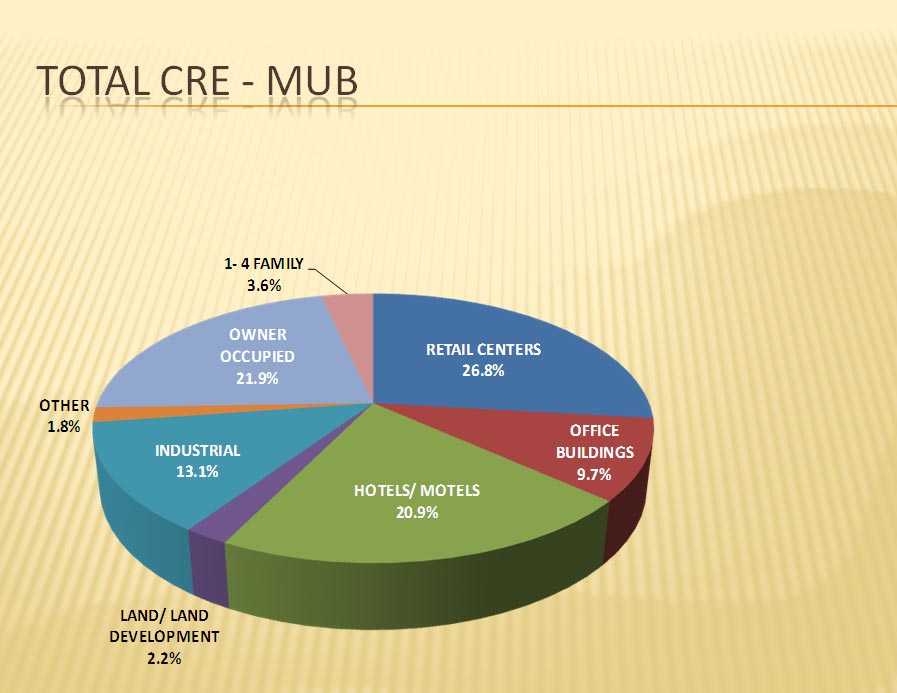
TOTAL REAL ESTATE PORTFOLIO
37
RETAIL CENTERS
26.8%
OWNER OCCUPIED
21.9%
HOTELS/ MOTELS
20.9%
INDUSTRIAL
13.1%
OFFICE BUILDINGS
9.7%
1- 4 FAMILY
3.6%
LAND/ LAND
2.2%
OTHER
1.8%

CATEGORY | NET ACTIVE PRINCIPAL BALANCE | % OF BANK CAPITAL | % OF GROSS LOANS |
TOTAL INCOME PRODUCING | $ 262,556 | 533% | 72.9% |
OWNER OCCUPIED | $ 77,119 | 157% | 21.4% |
1- 4 FAMILY | $ 12,850 | 26% | 3.6% |
TOTAL REAL ESTATE SECURED | $ 352,525 | 718% | 97.9% |
ALL OTHERS | $ 7,572 | 15% | 2.1% |
TOTAL BANK GROSS LOANS | $ 360,097 | 100.0% |
38
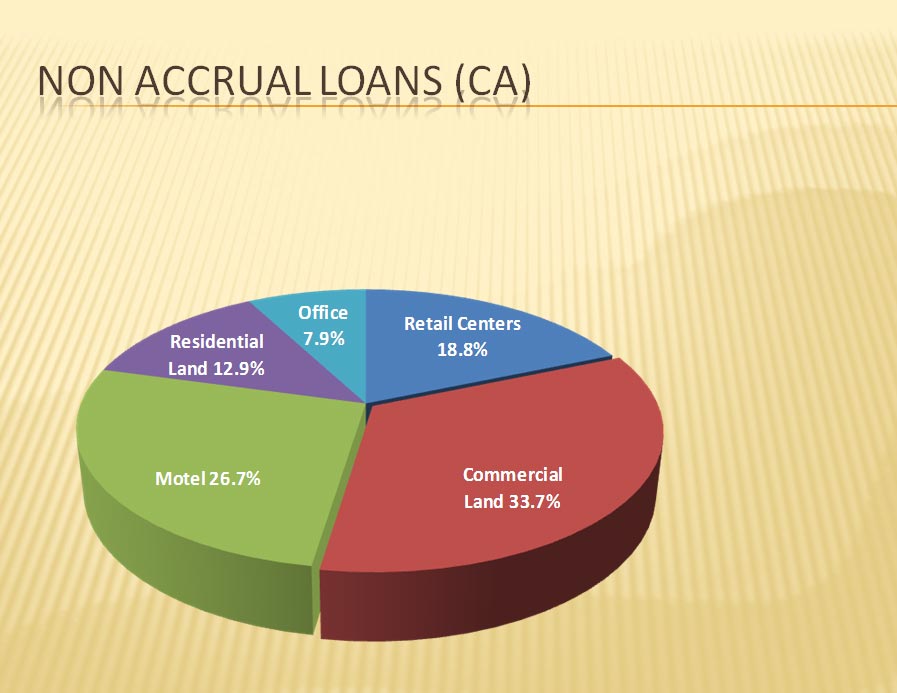
39
Commercial Land
33.7%
Motel
26.7%
Retail Centers
18.8%
Residential Land
12.9%
Office
7.9%

ORE - MUB
40
Hospital | $1.6 MM |
Residential Land | $2.3 MM |
Retail | $2.8 MM |
Commercial Land | $0.4 MM |
Office | $0.1 MM |
Total | $7.2 MM |
41
In $000’s | 2005 | 2006 | 2007 | 2008 | 2009 |
Net Nonperforming Assets * | $17,262 | $9,304 | $5,501 | $55,695 | $103,262 |
Net Nonperforming Assets to Total Assets % | 1.53% | 0.73% | 0.38% | 3.52% | 6.49% |
* Net Nonperforming Assets are net of guarantee and accruing loans > 90 days delinquent.

In $000’s | 2005 | 2006 | 2007 | 2008 | 2009 |
Allowance for Loan Losses | $13,169 | $11,436 | $13,125 | $24,235 | $30,156 |
Allowance to Net Nonperforming Loans % * | 98.31% | 174.41% | 325.93% | 47.64% | 37.24% |
42
* Net Nonperforming Loans are net of guarantee and accruing loans > 90 days delinquent.