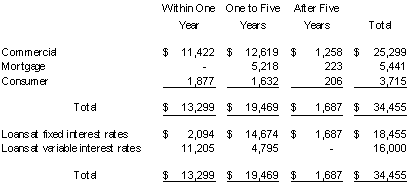
The following table shows the amount of total loans outstanding as of December 31, 2001 which, based on remaining scheduled repayments of principal, are due in the periods indicated.
Below is a schedule of the loan amounts maturing or repricing and are classified according to their sensitivity to changes in interest rates.
                                                                      Interest Sensitivity
                                                          -----------------------------------------------
                                                                    (in thousands of dollars)
                                                            Fixed Rate       Variable Rate        Total
                                                            ----------       -------------        -----

Due within 3 months................................           $ 1,197           $ 3,131          $ 4,328
Due after 3 months within 1 year...................               897             8,074            8,971
Due after one but within five years................            14,674             4,795           19,469
Due after five years...............................             1,687                 0            1,687
                                                              -------           -------          -------
   Total...........................................           $18,455           $16,000          $34,455
Allowance for Loan Losses..........................                                                  419
                                                                                                 -------
Total Loans Receivable, Net........................                                              $34,036
Nonperforming Assets. There was one non-performing loan as of December 31, 2001. Management believes that this loan will be repaid but not according to the original terms of the loan agreement. Based on this belief management is confident that the allowance for loan losses is adequate protection for the loan portfolio. Loan performance is reviewed regularly by external loan review specialists, loan officers, and senior management to assure that policies are being followed and loan quality standards of the Bank are being maintained. Whenever reasonable doubt exists concerning the collectibility of interest or principal on a loan, that loan will be placed in nonaccrual status. Any interest previously accrued but not collected at that time will be reversed and charged against current earnings. As of December 31, 2001, there was one loan on which interest was not being accrued. Management is not aware of any recommendations by regulatory agencies, which, if implemented, would have a material impact on the Corporation's liquidity, capital or operations.
Loan Loss Experience (in thousands)
The following is a summary of loan balances at the end of the period and their daily average balances, changes in the allowance for possible loan losses arising from loans charged off and recoveries on loans previously charged off, and additions to the allowance that have been expensed.
                                                                   December 31,      December 31,      December 31,
                                                                       2001              2000              1999
                                                                       ----              ----              ----

Loans:
   Average daily balance of loans for the year................       $29,261           $18,040           $ 4,707
   Amount of loans outstanding at end of period...............        34,455            25,762            11,263

Allowances for loan losses:
   Balance at beginning of year...............................           379               140                 0
   Additions to allowances charged to operations..............            90               243               142
   Net charge-offs............................................           (50)               (4)               (2)
                                                                     -------           -------
      Balance at end of year..................................       $   419           $   379           $   140
                                                                     =======           =======           =======

Ratios:
   Net charge-offs to loans outstanding at year-end...........           .15%              .02%              .02%
   Allowance for loan losses to loans outstanding at year end.          1.21%             1.47%             1.24%
A-5
Allocation of the Allowance for Loan Losses
The allowance for loan losses as of December 31, 2001, was $419,000 representing approximately 1.21% of gross loans outstanding and at December 31, 2000, was $379,000, which represented approximately 1.47% of gross loans outstanding at that time. The Bank has not experienced any material credit losses in the three years of operations ended December 31, 2001. The allowance for loan losses is maintained at a level management feels is adequate to absorb losses inherent in the loan portfolio. Management prepares an evaluation, which is based on a continuous review of the Bank's lending philosophy, the loan portfolio, delinquency rates, the Bank's and industry's historic loan loss experience, known and inherent risks included in the loan portfolio, composition of loans, growth of the portfolio and current economic conditions. The allowance for loan losses is analyzed quarterly by management. In so doing, management assigns a portion of the gross allowance to each category within the entire portfolio by loan type and to specific credits that have been identified as potential problem loans. During this review management also reviews past loss experience and the collectibility of past losses. The local economy and particular concentrations are considered, as well as a number of other factors.
Allowance for Loan Losses (in thousands)
                                                                  Year Ended December 31
                                     ---------------------------------------------------------------------------------
                                                 2001                       2000                        1999
                                     ---------------------------------------------------------------------------------
                                                     % of each                    % of each                % of each
                                                     category                     category                  category
                                       Allowance     to total      Allowance      to total     Allowance    to total
                                        Amount        loans         Amount         loans        Amount       loans
                                        ------        -----         ------         -----        ------       -----

Commercial......................         $306         .88%           $237          .92%          $ 74         .66%
Real estate mortgages...........           67         .20              58          .22             32         .28
Consumer........................           46         .13              84          .33             34         .30
Unallocated.....................            0           0               0            0              0           0
                                         ----        ----            ----         ----           ----        ----
   Total                                 $419        1.21%           $379         1.47%          $140        1.24%
                                         ====        =====           ====         =====          ====        =====
The above allocations are not intended to imply limitations on the usage of the allowance. The entire allowance is available for any future loans without regard to loan type.
Deposits. Deposits are gathered from the communities the Bank serves. Deposits increased $22.8 million or 44.3% to $74.2 million at December 31, 2001, compared to $51.4 million at December 31, 2000. This increase is due to an increase in the number of Bank customers, expansion of the Bank's market through additional branches being opened and more substantial relationships being developed with existing customers.
Average Daily Deposits (in thousands)
The following table sets forth the average deposit balances and the weighted average rates paid thereon.
                                      Average for the Year         Average for the Year         Average for the Year
                                      --------------------         --------------------         --------------------

                                              2001                         2000                         1999
                                              ----                         ----                         ----
                                     Amount     Average Rate      Amount     Average Rate      Amount     Average Rate
                                     ------     ------------      ------     ------------      ------     ------------

Noninterest bearing demand....      $ 9,531             0%       $ 5,150             0%       $ 1,320             0%
MMDA/Savings..................       10,725          2.73%        10,371          4.04%         5,940          3.16%
Time..........................       38,860          5.91%        19,910          6.24%         4,513          5.43%
                                    -------          -----       -------          -----       -------          -----
   Total Deposits.............      $59,116          4.38%       $35,431          4.69%       $11,773          3.67%
A-6
Maturity Distribution of Time Deposits of $100,000 or More (in thousands)
The following table summarizes time deposits in amounts greater than $100,000 by time remaining until maturity as of December 31, 2001, 2000, and 1999:
                                                                Year Ended December 31
                                                  ------------------------------------------------------
                                                      2001                 2000                  1999
                                                      ----                 ----                  ----

Three months or less.....................           $ 3,797              $ 8,617                $1,153
Over 3 months through 1 year.............             8,860               19,633                 2,484
Over 1 year..............................             7,326                5,631                   202
                                                    -------              -------                ------
                                                    $19,983              $33,881                $3,839
                                                    =======              =======                ======
The Bank operates in a very competitive environment. Management monitors rates at other financial institutions in the area to ascertain that its rates are competitive with the market. Management also attempts to offer a wide variety of products to meet the needs of its customers. The Bank offers business and consumer checking accounts, regular and money market savings accounts, and certificates of deposit having many options in their terms.
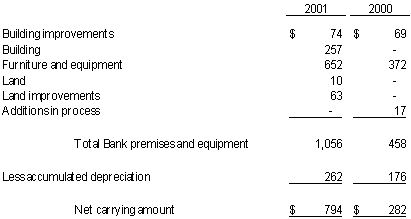
Premises and Equipment. Bank premises and equipment was $794,000 at December 31, 2001 and $282,000 at December 31, 2000.
Accumulated Deficit. As of December 31, 2001 the Company had an accumulated surplus of $88,000 before the mark to market adjustment made for securities held in the Available for Sale category. This surplus is in contrast to an accumulated deficit of $335,000 at December 31, 2000.
Results of Operations
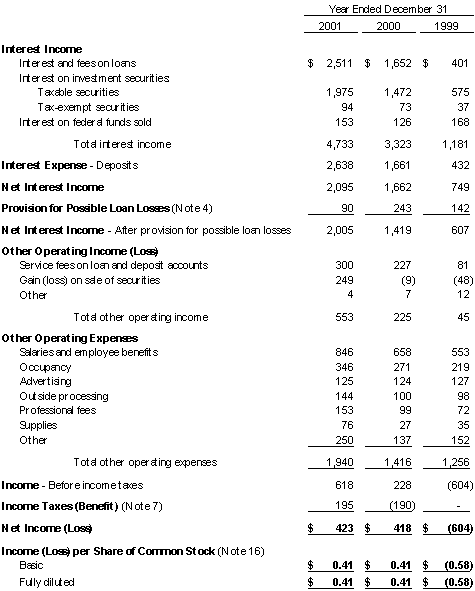
Summary of Results. The Company earned a net profit of $423,500 in 2001, which was the Company's third full year of operations. This profit figure isn't truly comparable with 2000 since the Company paid income taxes for the first time in 2001.
Performance Ratios (in thousands, except per share data).
                                                                         Year Ended December 31
                                                               ------------------------------------------
                                                                  2001            2000            1999
                                                                  ----            ----            ----

Net Profit (loss)                                               $  423          $  418          $ (604)
   Weighted average number of shares outstanding                 1,026           1,026           1,037
   Basic Profit (loss) per share                                $  .41          $  .41          $ (.58)

Earning (Loss) ratios:
   Return on average assets................................        .62%           1.01%          (3.03%)
   Return on average equity................................       4.85%           5.36%          (7.60%)
   Average equity to average assets........................      12.71%          18.10%          39.90%
   Dividend payout ratio...................................          0               0               0
A-7
Net Interest Income. The following schedule presents the average daily balances, interest income, interest expense and average rates earned and paid for the Corporation's major categories of assets, liabilities, and shareholders' equity for the periods indicated:
                                            2001                          2000                           1999
                                 --------------------------     --------------------------     --------------------------
                                 Average             Yield/     Average             Yield/     Average             Yield/
                                 Balance   Interest  Cost       Balance   Interest  Cost       Balance   Interest  Cost

Assets:
   Short term investment            3,538       153    4.32%       2,017       126   6.25%        3,028       168   5.23%
Securities:
   Taxable                         31,747     1,975    6.22%      21,823     1,525   7.00%       10,297       575   5.58%
   Tax-exempt                       1,637        94    5.74%         290        21   7.15%          633        37   5.85%
   Loans                           29,676     2,511    8.46%      18,040     1,635   9.17%        4,707       401   8.52%
   Total earning assets/total      66,918     4,733    7.07%      42,170     3,307   7.84%       18,665     1,181   6.26%
   interest income
   Cash and due from banks          1,342                          1,083                            601
   Unrealized Gain (Loss)            (49)                           (14)                           (22)
   All other assets                   950                            780                            563
   Allowance for loan loss          (415)                          (208)                           (80)
                                   ------     -----    -----      ------     -----   -----       ------     -----   -----
      Total assets                 68,746     4,733    6.88%      43,811     3,307   7.55%       19,950     1,181   5.92%
Liabilities and Stockholders'
Equity
Interest bearing deposits:
   MMDA, Savings/NOW
   accounts                        12,719       343    2.70%      10,371       419   4.04%        5,940       187   3.15%
   Time                            38,860     2,295    5.91%      19,910     1,242   6.24%        4,513       245   5.43%
   Fed Funds Purchased                  0
   Other borrowed Money                 0
   Total interest bearing
   liabilities/interest expense    51,579     2,638    5.11%      30,281     1,661   5.49%       10,453       432   4.13%
   Noninterest bearing deposits     7,536                          5,150                          1,320
      All other liabilities           894                            430                            257
Stockholders' Equity:
   Unrealized Holding Gain
   (Loss)                             214                              0                           (34)
   Common Stock, Surplus,
   Retained Earnings                8,523                          7,950                          7,954
   Total liabilities and stock-
   holders' equity                 68,746     2,638    3.84%      43,811     1,661   3.79%       19,950       432   2.17%
   Interest spread                            2,095                          1,646                            749
   Net interest income - FTE                  2,095                          1,646                            749
   Net Interest Margin as a
   Percentage of Average
   Earnings Assets - FTE           66,918     2,095    3.13%      42,170     1,646   3.90%       18,846       749  3.97%
A-8
Rate / Volume Analysis of Net Interest Income. The following schedule presents the dollar amount of changes in interest income and expense for major components of earning assets and interest-bearing liabilities, distinguishing between changes related to outstanding balances and changes due to interest rates.
                                               2001 Compared to 2000                    2000 Compared to 1999
                                         -------------------------------         ----------------------------------
                                      Change    Change    Change              Change     Change     Change
                                      Due to    Due to    Due to    Total     Due to     Due to     Due to     Total
                                       Rate     Volume      Mix     Change     Rate      Volume       Mix      Change
                                       ----     ------      ---     ------     ----      ------       ---      ------
                                                                      (in thousands)
Federal funds sold                      ($46)     $115     ($42)       $27       $31      ($53)      ($20)      ($42)
Investment securities--taxable          (170)      695      (75)       450       146        643        161        950
Investment securities--tax-exempt         (4)       96      (19)        73         8       (20)        (4)       (16)
Loans, net of unearned income           (128)    1,067      (63)       876        31      1,136         67      1,234
                                       ------   ------   ------      -----      ----      -----     ------      -----
Total interest income                   (348)    1,973     (199)     1,426       216      1,706        204      2,126
                                       ------   ------   ------      -----      ----      -----     ------      -----
Interest bearing deposits               (115)    1,169      (77)       977       142        819        268      1,229
Funds borrowed                             0         0        0          0         0          0          0          0
                                       ------   ------   ------     ------      ----      -----     ------      -----
Total interest expense                  (115)    1,169      (77)       977       142        819        268      1,229
                                       ------   ------   ------     ------      ----      -----     ------      -----
Net interest income                    ($233)   $  804    ($122)      $449      $ 74       $887     ($ 64)       $897
                                       ======   ======   ======     ======      ====      =====     ======      =====
Composition of Average Earning Assets and Interest Bearing Liabilities
                                                          Year Ended            Year Ended            Year Ended
                                                       December 31, 2001    December 31, 2000     December 31, 1999
                                                       -----------------    -----------------     -----------------
As a percentage of average earning assets
   Loans..........................................    $29,676      44.3%   $18,040      42.8%    $ 4,707      25.2%
   Other earning assets...........................     37,242      55.7%    24,130      57.2%     13,958      74.8%
                                                      --------   -------   --------    -------   --------    -------
      Average earning assets......................    $66,918     100.0%   $42,170     100.0%    $18,665     100.0%
                                                      =======              =======               =======

As a percent of average interest bearing liabilities
   Savings and DDA accounts.......................     12,719      24.7%    10,371      34.2%      5,940      56.8%
   Time deposits..................................     38,860      75.3%    19,910      65.8%      4,513      43.2%
   Other borrowings...............................          0         0%         0         0%          0         0%
                                                      -------     ------   -------     ------    -------     ------
      Average interest bearing liabilities........    $51,579     100.0%   $30,281     100.0%    $10,453     100.0%
                                                      =======              =======               =======

Earning asset ratio...............................                 97.3%                96.3%                 93.6%
Provision for Loan Loss. The provision for loan losses for the year ended December 31, 2001 and 2000 was $90,000 and $243,000, respectively. The decrease in provision from 2000 to 2001 was the result of better than expected credit performance in the total loan portfolio. Management considered it prudent during the first years of operations (2000 and 1999) to provide for losses at a level which is consistent with levels maintained by banks with similar loan portfolios. Management will continue to monitor its loan loss performance and adjust its loan loss reserve to more closely align itself to its own history of losses.
Non-Interest Income. Non-Interest income for the year ended December 31, 2001 and 2000 were $304,000 and $234,000, respectively, consisting primarily of service fees on loan and deposit accounts.
Non-Interest Expense. Non-interest expense for the year ended December 31, 2001, was $1.9 million, which is compared with $1.4 million for the year ended December 31, 2000. The main component of non-interest expense is salaries and benefits, which totaled $846,000 and $658,000 for 2001 and 2000 respectively. Other significant components of non-interest expense consisted of occupancy and equipment expenses, data processing fees, supplies and marketing expenses.
A-9
Liquidity and Capital Resources
The Company obtained its initial equity capital in an initial public offering of its common stock in November 1998. The Company's plan of operation for the year of 2002 doesn't contemplate the need to raise additional capital. Management believes that its current capital and liquidity will provide the Company with adequate capital to support its expected level of deposit and loan growth and to otherwise meet its cash and capital requirements for the next year. One of the growth strategies your Company intends to pursue, which could have an effect on its equity and or require additional capital, is growth through acquisition. Such opportunities are difficult to plan and as such we aren't able to state with absolute assurance that additional equity won't be needed.
Capital Resources at December 31, 2001 (in thousands)
                                                           Tier 1
                                                          Leverage         Tier 1        Total Risk-Based
                                                           Ratio        Capital Ratio      Capital Ratio
                                                           -----        -------------      -------------

Minimum regulatory requirement for
   Capital adequacy.................................         4.0%            4.0%                 8.0%
Well capitalized regulatory level...................         5.0%            6.0%                10.0%
Consolidated........................................       10.48%          18.98%               19.91%
Bank................................................       10.48%          18.98%               19.91%
.........The following table shows the dollar amounts by which the Company's capital (on a consolidated basis) exceeds current regulatory requirements on a dollar-enumerated basis:
                                                                                                  Total
                                                           Tier 1            Tier 1            Risk-Based
                                                          Leverage           Capital             Capital
                                                          --------           -------             -------
                                                                      (in thousands of dollars)
Capital balances at December 31, 2001
   Required regulatory capital.....................        $3,282            $1,811               $3,622
   Capital in excess of regulatory minimums........         5,313             6,784                5,392
                                                           ------            ------               ------
Actual capital balances............................        $8,595            $8,595               $9,014
                                                           ======            ======               ======
The Company's sources of liquidity include loan payments by borrowers, maturity and sales of securities available for sale, growth of deposits and deposit equivalents, federal funds sold and the issuance of common stock. Liquidity management involves the ability to meet cash flow requirements of the Company's customers. These customers may be either borrowers with credit needs or depositors wanting to withdraw funds.
Asset Liability Management and Market Risk Analysis
Asset liability management aids the Company in maintaining liquidity while managing a balance between interest earning assets and interest bearing liabilities. Management of interest rate sensitivity attempts to avoid widely varying net interest margins and to achieve consistent net interest income through periods of changing interest rates. Management monitors the Company's exposure to interest rate changes using a GAP analysis.
A-10
Asset / Liability GAP Position for the Year Ended December 31, 2001 (in thousands)
                                                     1 to 3         4 to 12        1 to 5        Over 5
                                                     ------         -------        ------        ------
                                                     Months         Months          Years         Years       Total
                                                     ------         ------          -----         -----       -----

Interest-Earning Assets
   Federal Funds sold.........................        $3,975           $   0          $   0         $  0     $3,975
   Investment securities......................        10,485           5,760          7,230       19,035     42,510
   Loans - by maturity........................         3,645           9,654         19,469        1,687     34,455
                                                       -----           -----         ------        -----     ------

   Total interest-earning assets..............        18,105          15,414         26,699       20,722     80,940

Interest Bearing Liabilities
   DDA and Money Market.......................         3,879           8,305          7,340            0     19,524
   Savings accounts...........................         3,757           1,935              0            0      5,692
   Certificates of deposit....................         8,787          12,129         18,798            0     39,714
                                                       -----          ------         ------        -----     ------

   Total interest-bearing Liabilities.........        16,423          22,369         26,138            0     64,930

   Rate sensitivity gap and ratios:
       Gap for period.........................         1,682          (6,955)           561       20,722     16,010
       Cumulative gap.........................         1,682          (5,273)        (4,712)      16,010     16,010
   Percentage of cumulative gap
      To total assets.........................         2.00%          (6.28%)        (5.61%)      19.08%     19.08%
Other variables besides interest rate changes may have an impact on the financial condition of the Bank including, but not limited to, growth of the Company, structure of the balance sheet, and economic and competitive factors.
Forward Looking Statements
This report contains certain forward-looking statements within the meaning of Section 27A of the Securities Act of 1933, as amended, and Section 21E of the Securities Exchange Act of 1934, as amended. The Company intends such forward-looking statements to be covered by the safe harbor provisions for forward-looking statements contained in the Private Securities Reform Act of 1995, and is including this statement for purposes of these safe harbor provisions. Forward-looking statements, which are based on certain assumptions and describe future plans, strategies and expectations of the Company, are generally identifiable by use of the words "believe," "expect," "intend," "anticipate," "estimate," "project" or similar expressions. The Company's ability to predict results or the actual effect of future plans or strategies is inherently limited and uncertain. Factors which could have a material adverse affect on the operations and future prospects of the Company and the subsidiaries include, but aren't limited to, changes in: interest rates, general economic conditions, legislative / regulatory changes, monetary and fiscal policies of the U.S. Government, including policies of the U.S. Treasury and the Federal Reserve Board, the quality or composition of the loan or investment portfolios, demand for loan products, deposit flows, competition, demand for financial services in the Company's market area and accounting principles, policies and guidelines. These risks and uncertainties should be considered in evaluating forward-looking statements and undue reliance should not be placed on such statements. Further information concerning the Company and its business, including additional factors that could materially affect the Company's financial results, is included in the Company's filings with the Securities and Exchange Commission.
A-11
Independent Auditor's Report
To the Board of Directors and Stockholders
Clarkston Financial Corporation and Subsidiary
We have audited the accompanying consolidated balance sheet of Clarkston Financial Corporation and subsidiary as of December 31, 2001 and 2000 and the related consolidated statements of operations, changes in stockholders’ equity, and cash flows for each year in the three-year period ended December 31, 2001. These consolidated financial statements are the responsibility of the Corporation’s management. Our responsibility is to express an opinion on these consolidated financial statements based on our audits.
We conducted our audits in accordance with auditing standards generally accepted in the United States of America. Those standards require that we plan and perform the audits to obtain reasonable assurance about whether the consolidated financial statements are free of material misstatement. An audit includes examining, on a test basis, evidence supporting the amounts and disclosures in the consolidated financial statements. An audit also includes assessing the accounting principles used and significant estimates made by management, as well as evaluating the overall financial statement presentation. We believe that our audits provide a reasonable basis for our opinion.
In our opinion, the consolidated financial statements referred to above present fairly, in all material respects, the consolidated financial position of Clarkston Financial Corporation and subsidiary as of December 31, 2001 and 2000 and the consolidated results of their operations and their cash flows for each year in the three-year period ended December 31, 2001, in conformity with accounting principles generally accepted in the United States of America.
| | |  |
|
Auburn Hills, Michigan
January 30, 2002 | | | |
A-12
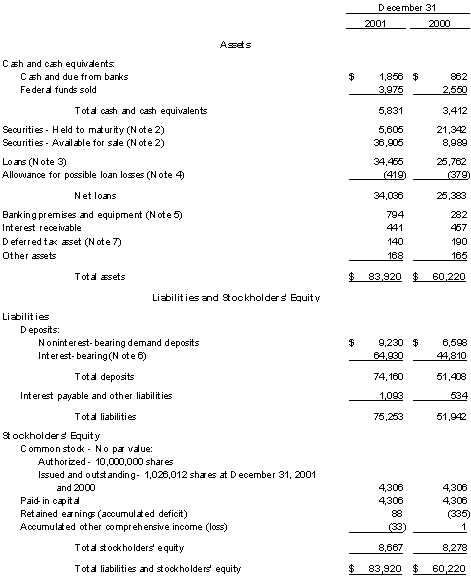
Clarkston Financial Corporation and Subsidiary
Consolidated Balance Sheet
(000s omitted)
See Notes to Consolidated Financial Statements.
A-13
Clarkston Financial Corporation and Subsidiary
Consolidated Statement of Operations
(000s omitted, except per share data)
See Notes to Consolidated Financial Statements.
A-14
Clarkston Financial Corporation and Subsidiary
Consolidated Statement of Changes in Stockholders' Equity
(000s omitted, except per share data)
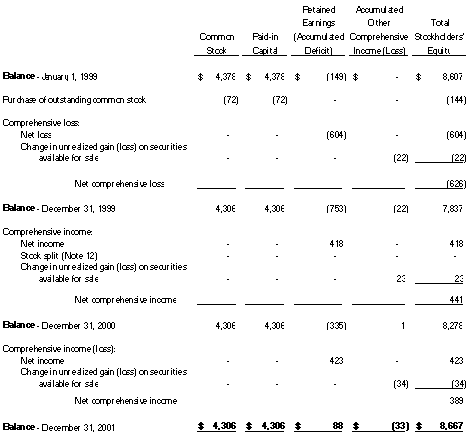 |
Book value per share is $8.45, $8.07, and $7.64 at December 31, 2001, 2000, and 1999, respectively. |
See Notes to Consolidated Financial Statements.
A-15
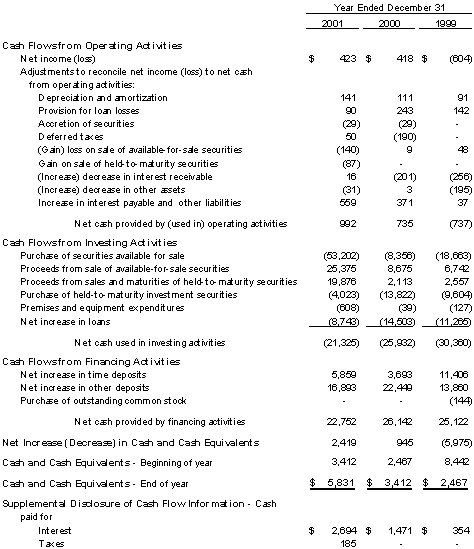
Clarkston Financial Corporation and Subsidiary
Consolidated Statement of Cash Flows
(000s omitted)
See Notes to Consolidated Financial Statements.
A-16
Clarkston Financial Corporation and Subsidiary
Notes to Consolidated Financial Statements
December 31, 2001, 2000, and 1999
Note 1 - Summary of Significant Accounting Policies
| | Basis of Presentation and Consolidation - The consolidated financial statements include the accounts of Clarkston Financial Corporation (the “Corporation”) and its wholly owned subsidiary, Clarkston State Bank (the “Bank”). All significant intercompany transactions are eliminated in consolidation. |
| | Use of Estimates - The accounting and reporting policies of the Corporation and its subsidiary conform to generally accepted accounting principles. Management is required to make estimates and assumptions that affect the amounts reported in the financial statements and accompanying notes. Actual results could differ from these estimates and assumptions. Material estimates that are particularly susceptible to significant change in the near term relate to the determination of the allowance for loan losses. |
| | Nature of Operations - Clarkston State Bank provides full-service commercial banking and consumer banking and provides other financial products and services through five branch offices to Michigan communities in Oakland County. |
| | Significant Group Concentrations of Credit Risk - Most of the Corporation’s activities are with customers located within Michigan. Note 2 discusses the types of securities in which the Corporation invests. Note 3 discusses the types of lending in which the Corporation engages. The Corporation does not have any significant concentrations to any one industry or customer. |
| | Cash and Cash Equivalents - For the purpose of the consolidated statement of cash flows, cash and cash equivalents include cash and balances due from banks and federal funds sold, all of which mature within 90 days. |
| | Securities - Debt securities that management has the positive intent and ability to hold to maturity are classified as “held to maturity” and recorded at amortized cost. Securities not classified as held to maturity or trading, including equity securities with readily determinable fair values, are classified as “available for sale” and recorded at fair value, with unrealized gains and losses excluded from earnings and reported in other comprehensive income. |
| | Purchase premiums and discounts are recognized in interest income using the interest method over the terms of the securities. Declines in the fair value of held-to-maturity and available-for-sale securities below their cost that are deemed to be other than temporary are reflected in earnings as realized losses. Gains and losses on the sale of securities are recorded on the trade date and are determined using the specific identification method. |
A-17
Clarkston Financial Corporation and Subsidiary
Notes to Consolidated Financial Statements
December 31, 2001, 2000, and 1999
Note 1 - Summary of Significant Accounting Policies (Continued)
| | Loans - - The Corporation grants mortgage, commercial, and consumer loans to customers. Loans are reported at their outstanding unpaid principal balances adjusted for charge offs, the allowance for loan losses, and any deferred fees or costs on originated loans. Interest income is accrued on the unpaid principal balance. Loan origination fees, net of certain direct origination costs, are deferred and recognized as an adjustment of the related loan yield using the interest method. |
| | The accrual of interest on loans is discontinued at the time the loan is 90 days’ delinquent unless the credit is well-secured and in process of collection. In all cases, loans are placed on nonaccrual or charged off at an earlier date if collection of principal or interest is considered doubtful. |
| | All interest accrued but not collected for loans that are placed on nonaccrual or charged off is reversed against interest income. The interest on these loans is accounted for on the cash basis or cost-recovery method, until qualifying for return to accrual. Loans are returned to accrual status when all the principal and interest amounts contractually due are brought current and future payments are reasonably assured. |
| | Allowance for Loan Losses - The allowance for loan losses is established as losses are estimated to have occurred through a provision for loan losses charged to earnings. Loan losses are charged against the allowance when management believes the uncollectibility of a loan balance is confirmed. Subsequent recoveries, if any, are credited to the allowance. |
| | The allowance for loan losses is evaluated on a regular basis by management and is based on management’s periodic review of the collectibility of the loans in light of historical experience, the nature and volume of the loan portfolio, adverse situations that may affect the borrower’s ability to repay, estimated value of any underlying collateral, and prevailing economic conditions. This evaluation is inherently subjective as it requires estimates that are susceptible to significant revision as more information becomes available. |
| | A loan is considered impaired when, based on current information and events, it is probable that the Corporation will be unable to collect the scheduled payments of principal or interest when due according to the contractual terms of the loan agreement. Factors considered by management in determining impairment include payment status, collateral value, and the profitability of collecting scheduled principal and interest payments when due. Loans that experience insignificant payment delays and payment shortfalls generally are not classified as impaired. |
A-18
Clarkston Financial Corporation and Subsidiary
Notes to Consolidated Financial Statements
December 31, 2001, 2000, and 1999
Note 1 - Summary of Significant Accounting Policies (Continued)
| | Management determines the significance of payment delays and payment shortfalls on a case-by-case basis, taking into consideration all of the circumstances surrounding the loan and the borrower, including length of the delay, the reasons of the delay, the borrower’s prior payment record, and the amount of the shortfall in relation to the principal and interest owed. Impairment is measured on a loan-by-loan basis for commercial and construction loans by either the present value of expected future cash flows discounted at the loan’s effective interest rate, the loan’s obtainable market price, or the fair value of the collateral if the loan is collateral dependent. |
| | Large groups of homogeneous loans are collectively evaluated for impairment. Accordingly, the Corporation does not separately identify individual consumer and residential loans for impairment disclosures. |
| | Credit-related Financial Instruments - In the ordinary course of business, the Corporation has entered into commitments to extend credit, commercial letters of credit, and standby letters of credit. Such financial instruments are recorded when they are funded. |
| | Adoption of FAS 133 - On January 1, 2001, the Corporation adopted Statement of Financial Accounting Standards No. 133 (FAS 133),Accounting for Derivative Instruments and Hedging Activities. FAS 133 requires that all derivative instruments be recorded on the balance sheet at their fair value. Changes in the fair value of derivatives are recorded each period in current earnings or other comprehensive income, depending on whether a derivative is designated as part of a hedge transaction and, if it is, the type of hedge transaction. The accounting for derivatives had no effect on the financial statements. |
| | Banking Premises and Equipment - Land is carried at cost. Buildings and equipment are stated at cost, less accumulated depreciation and amortization. Depreciation, computed on the straight-line method, is charged to operations over the estimated useful lives of the assets. Leasehold improvements are amortized over the terms of their respective leases or the estimated useful lives of the improvements, whichever is shorter. |
| | Intangible Assets - Intangible assets approximating $105,000, net of accumulated amortization of $77,000, consist entirely of deposit intangibles acquired in a branch acquisition completed during 1999. Amortization is calculated on a straight-line basis over the estimated asset life of eight years. |
A-19
Clarkston Financial Corporation and Subsidiary
Notes to Consolidated Financial Statements
December 31, 2001, 2000, and 1999
Note 1 - Summary of Significant Accounting Policies (Continued)
| | Income Taxes - Deferred income tax assets and liabilities are determined using the liability (or balance sheet) method. Under this method, the net deferred tax asset or liability is determined based on the tax effects of the various temporary differences between the book and tax bases of the various balance sheet assets and liabilities and gives current recognition to changes in tax rates and laws. |
| | Stock Compensation Plans - The Corporation has chosen to measure compensation cost for director and employee stock compensation plans using the intrinsic value-based method of accounting, whereby compensation cost is the excess, if any, of the quoted market price of the stock at the grant date (or other measurement date) over the amount an option holder must pay to acquire the stock. Stock options issued under the Corporation’s stock option plan have no intrinsic value at the grant date, and no compensation cost is recognized is for them. The fair value-based method of accounting for stock compensation plans measures compensation cost at the grant date based on the value of the award and is recognized over the service period, which is usually the vesting period. The Corporation has provided pro forma disclosures of net income and earnings per share and other disclosures, as if the fair value-based method of accounting has been applied. The pro forma disclosures include the effects of all awards granted since the Corporation’s inception (see Note 11). |
| | Earnings per Share-Basic earnings per share represents income available to common stockholders divided by the weighted-average number of common shares outstanding during the period. Diluted earnings per share reflects additional common shares that would have been outstanding if dilutive potential common shares had been issued, as well as any adjustment to income that would result from the assumed issuance. Potential common shares that may be issued by the Corporation relate solely to outstanding stock options, and are determined using the treasury stock method. |
| | Book Value per Share - Book value per share represents total stockholders’ equity divided by the total number of shares outstanding at the end of each period. |
| | Other Comprehensive Income - Accounting principles generally require that recognized revenue, expenses, gains, and losses be included in net income. Certain changes in assets and liabilities, however, such as unrealized gains and losses on available-for-sale securities, are reported as a direct adjustment to the equity section of the balance sheet. Such items, along with net income, are considered components of comprehensive income. At December 31, 2001 and 2000, accumulated other comprehensive income consists solely of unrealized gains (losses) on available-for-sale securities. |
A-20
Clarkston Financial Corporation and Subsidiary
Notes to Consolidated Financial Statements
December 31, 2001, 2000, and 1999
Note 1 - Summary of Significant Accounting Policies (Continued)
| | Recent Accounting Pronouncements - In July 2001, the FASB issued Statement No. 141, Business Combinations (FAS 141). FAS 141 is effective for transactions initiated after June 30, 2001. The statement eliminated the pooling of interest method to account for business combinations, and therefore, the purchase method of accounting is the sole option. |
| | Concurrently with the issuance of FAS 141, the FASB issued Statement No. 142,Goodwill and OtherIntangible Assets. This statement changes the accounting for goodwill and other intangible assets effective for fiscal years beginning after December 15, 2001. The primary provision of the statement is that unless an intangible asset can be separately identified, the asset is considered goodwill. This provision is critical as the accounting for separately identifiable intangible assets has a different accounting treatment than goodwill. Generally, intangible assets that meet certain criteria are recognized and amortized over their estimated useful lives. Goodwill and intangible assets with indefinite lives will not be amortized. Instead, such assets will be tested for impairment at least annually. The initial implementation of FASB Statement No. 142 will have an immaterial impact on the Corporation since it does not have any intangible assets with indefinite lives. |
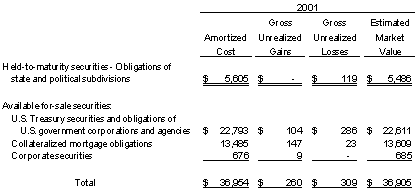
Note 2 - Securities
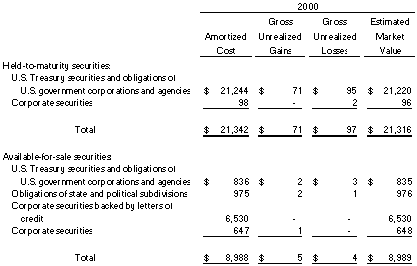
| | The amortized cost and estimated market value of securities are as follows at December 31, 2001 and 2000 (000s omitted): |
A-21
Clarkston Financial Corporation and Subsidiary
Notes to Consolidated Financial Statements
December 31, 2001, 2000, and 1999
Note 2 - Securities (Continued)
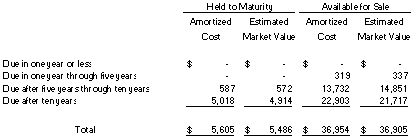
| | The amortized cost and estimated market value of held-to-maturity securities at December 31, 2001, by contractual maturity, are shown below. Expected maturities will differ from contractual maturities because issuers may have the right to call or prepay obligations with or without call or prepayment penalties (000s omitted): |
A-22
Clarkston Financial Corporation and Subsidiary
Notes to Consolidated Financial Statements
December 31, 2001, 2000, and 1999
Note 2 - Securities (Continued)
| | Securities having a carrying value of $6,887,000 and $6,772,000 (market value of $6,946,000 and $6,726,000) were pledged at December 31, 2001 and 2000, respectively, to secure public deposits, repurchase agreements, and for other purposes required by law. |
| | Proceeds from the sale of available-for-sale securities were $25,375,000, $8,675,000, and $6,742,000 in 2001, 2000, and 1999, respectively. Gross gains of $140,000, $1,000, and $0 and gross losses of $0, $10,000, and $48,000 were recognized on those sales in 2001, 2000, and 1999, respectively. |
| | During the year, the bank sold approximately $4,257,000 of held-to-maturity securities, due to concerns about the issuer’s creditworthiness. Proceeds from the sale of held-to-maturity securities were $4,344,000 in 2001. Gross gains of $87,000 were recognized on those sales in 2001. There were no sales of held-to-maturity securities in 2000. |
Note 3 - Loans
| | Major categories of loans included in the portfolio at December 31, 2001 and 2000 are as follows (000s omitted): |
| | Certain directors of the Corporation and the Bank, including their associates, were loan customers of the subsidiary bank. Such loans were made in the ordinary course of business and do not involve more than a normal risk of collectibility. The outstanding loan balance for these persons at December 31, 2001 and 2000 totaled $1,604,000 and $1,308,000, respectively. During 2001, $857,000 of new loans were made and repayments totaled $561,000. The total unused commitments for these loans totaled $490,000 at December 31, 2001. |
A-23
Clarkston Financial Corporation and Subsidiary
Notes to Consolidated Financial Statements
December 31, 2001, 2000, and 1999
Note 3 - Loans (Continued)
| | Loan maturities and rate sensitivity of the loan portfolio at December 31, 2001 are as follows (000s omitted): |
Note 4 - Allowance for Possible Loan Losses
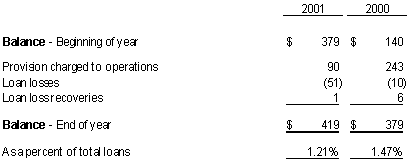
| | A summary of the activity in the allowance for possible loan losses (ALL) is as follows (000s omitted): |
| | The Bank considers all nonaccrual and reduced-rate loans (with the exception of residential mortgages and consumer loans) to be impaired. There are approximately $100,000 of impaired loans outstanding as of December 31, 2001. There was no required specific allowance for the impaired loans. |
A-24
Clarkston Financial Corporation and Subsidiary
Notes to Consolidated Financial Statements
December 31, 2001, 2000, and 1999
Note 5 - Bank Premises and Equipment
| | The following is a summary of Bank premises and equipment for the years ended December 31, 2001 and 2000 (000s omitted): |
| | Depreciation expense for the years ended December 31, 2001, 2000, and 1999 amounted to $86,000, $94,000, and $82,000, respectively. |
Note 6 - Deposits
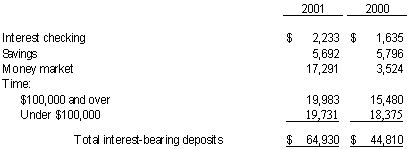
| | The following is a summary of interest-bearing deposit accounts at December 31, 2001 and 2000 (000s omitted): |
A-25
Clarkston Financial Corporation and Subsidiary
Notes to Consolidated Financial Statements
December 31, 2001, 2000, and 1999
Note 6 - Deposits (Continued)
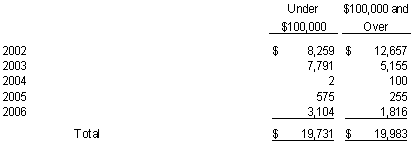
| | The remaining maturities of certificates of deposit outstanding at December 31, 2001 are as follows (000s omitted): |
Note 7 - Income Taxes
| | The Corporation and the Bank file a consolidated income tax return. The following is a summary of the provision for income taxes for the years ended December 31, 2001, 2000, and 1999. |
| | Allocation of income taxes between current and deferred portions is as follows (000s omitted): |
A-26
Clarkston Financial Corporation and Subsidiary
Notes to Consolidated Financial Statements
December 31, 2001, 2000, and 1999
Note 7 - Income Taxes (Continued)
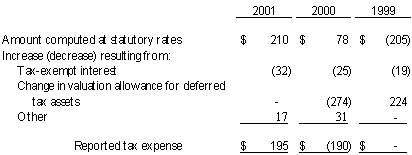
| | The difference between reported federal income tax expense and the amount computed by applying statutory tax rates to income before income taxes is as follows: |
| | The temporary differences that comprise deferred tax assets and liabilities at December 31, 2001 and 2000 are as follows (000s omitted): |
A-27
Clarkston Financial Corporation and Subsidiary
Notes to Consolidated Financial Statements
December 31, 2001, 2000, and 1999
Note 8 - Off-balance-sheet Activities
| | Credit-related Financial Instruments - The Corporation is a party to credit-related financial instruments with off-balance-sheet risk in the normal course of business to meet the financing needs of its customers. These financial instruments include commitments to extend credit, standby letters of credit, and commercial letters of credit. Such commitments involve, to varying degrees, elements of credit and interest rate risk in excess of the amount recognized in the consolidated balance sheet. |
| | The Corporation’s exposure to credit loss is represented by the contractual amount of these commitments. The Corporation follows the same credit policies in making commitments as it does for on-balance-sheet instruments. |
| | The Bank had loan commitments and standby letters of credit totaling $16,125,000 and $14,040,000 at December 31, 2001 and 2000, respectively, on which loans of $11,467,000 and $7,568,000, respectively, were outstanding at year end and included in the Bank’s consolidated balance sheet. |
| | Commitments to extend credit are agreements to lend a customer as long as there is no violation of any condition established in the contract. Commitments generally have fixed expiration dates or other termination clauses and may require payment of a fee. The commitments for equity lines of credit may expire without being drawn upon. Therefore, the total commitment amounts do not necessarily represent future cash requirements. The amount of collateral obtained, if it is deemed necessary by the Corporation, is based on management’s credit evaluation of the customer. |
| | Unfunded commitments under commercial lines of credit, revolving credit lines, and overdraft protection agreements are commitments for possible future extensions of credit to existing customers. These lines of credit are collateralized and usually do not contain a specified maturity date and may not be drawn upon to the total extent to which the Corporation is committed. |
| | Commercial and standby letters of credit are conditional commitments issued by the Corporation to guarantee the performance of a customer to a third party. Those letters of credit are primarily used to support public and private borrowing arrangements. Essentially all letters of credit issued have expiration dates within one year. The Corporation generally holds collateral supporting those commitments if deemed necessary. |
A-28
Clarkston Financial Corporation and Subsidiary
Notes to Consolidated Financial Statements
December 31, 2001, 2000, and 1999
Note 8 - Off-balance-sheet Activities (Continued)
| | Collateral Requirements - To reduce credit risk related to the use of credit-related financial instruments, the Corporation generally obtains collateral. The amount and nature of the collateral obtained is based on the Corporation’s credit evaluation of the customer. Collateral held varies but may include cash, securities, accounts receivable, inventory, property, plant, and equipment, and real estate. |
Note 9 - Related Parties
| | Operating Lease - The Bank entered into a lease for its main operating facility under a noncancelable lease expiring on October 1, 2003. The facility was leased from an entity owned by certain members of the Board of Directors of the Corporation and the Bank. The lease payment obligation was $5,000 per month through December 1, 2000 and is $5,250 per month thereafter. The Bank is responsible for all taxes, utilities, and maintenance costs for the facility. |
| | The annual future minimum lease payments required under the noncancelable operating lease are $63,000 in 2002 and $47,250 in 2003. |
Note 10 - Restriction on Dividends or Dividends from Banking Subsidiary
| | Unless prior regulatory approval is obtained, banking regulations limit the amount of dividends that the Corporation’s banking subsidiary can declare to current year net profits, as defined in the Federal Reserve Act, and retained net profits from prior years. There were no dividends declared or paid by the Bank to the holding company during 2001, 2000, or 1999. |
Note 11 - Stock-based Compensation
| | The Corporation has two stock-based compensation plans. Under the employees’ Stock Compensation Plan (“Employee Plan”), the Corporation may grant options to key employees for up to 26,125 shares of common stock. Under the 1998 Founding Directors Stock Option Plan (“Director Plan”), the Corporation may grant options for up to 78,375 shares of common stock. Under both plans, there is a minimum vesting period of between one to three years before the options may be exercised, and all options expire 10 years after the date of their grant. Certain options (contingent options) under both plans vest on an accelerated basis upon the achievement of various future financial and operational goals. All such options vest 9.5 years after the date of grant regardless of achievement of future goals. Under both plans, the exercise price of each option equals the market price of the Corporation’s common stock on the date of grant. |
A-29
Clarkston Financial Corporation and Subsidiary
Notes to Consolidated Financial Statements
December 31, 2001, 2000, and 1999
Note 11 - Stock-based Compensation (Continued)
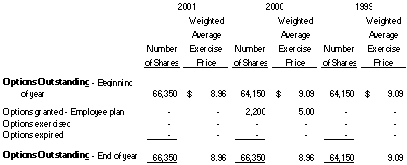
| | The following table summarizes stock option transactions for both plans and the related average exercise prices for the years ended December 31, 2001, 2000, and 1999: |
| | The following table shows summary information about fixed stock options outstanding at December 31, 2001: |
| | The Corporation has adopted the disclosure-only provisions of SFAS No. 123,Accounting for Stock-Based Compensation, but applies the intrinsic value method to account for its plan. The Corporation has estimated fair value of the options granted in 2000 at $2.34 per share, using a “minimum value” concept. The value was calculated using an assumed interest rate of 6.5 percent and estimated life of 5.0 years. |
A-30
Clarkston Financial Corporation and Subsidiary
Notes to Consolidated Financial Statements
December 31, 2001, 2000, and 1999
Note 11 - Stock-based Compensation (Continued)
| | If the Corporation had elected to recognize compensation costs for the plans based on the fair value of awards at the grant date, net income (loss) per share on a pro forma basis would have been as follows (000s omitted, except per share data): |
Note 12 - Common Stock
| | In October 2000, the Corporation declared an 11-for-10 stock split. The Corporation issued the additional shares of common stock to its stockholders for the purpose of effecting a reduction in the unit price of the shares and obtaining a wider distribution and improved marketability of the shares. The additional shares issued were not intended to be a distribution of earnings. All applicable per share amounts for periods presented have been retroactively adjusted to reflect the transaction. |
Note 13 - Financial Instruments
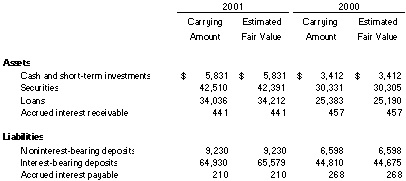
| | Fair Values of Financial Instruments - The fair value of a financial instrument is the current amount that would be exchanged between willing parties, other than in a forced liquidation. Fair value is best determined based on quoted market prices. However, in many instances, there are no quoted market prices for the Corporation’s various financial instruments. In cases where quoted market prices are not available, fair values are based on estimates using present value or other valuation techniques. Those techniques are significantly affected by the assumptions used, including the discount rate and estimates of future cash flows. Accordingly, the fair value estimates may not be realized in an immediate settlement of the instrument. SFAS 107 excludes certain financial instruments and all nonfinancial instruments from its disclosure requirements. Accordingly, the aggregate fair value amounts presented may not necessarily represent the underlying fair value of the Corporation. |
A-31
Note 13 - Financial Instruments (Continued)
| | The terms and short-term nature of certain assets and liabilities result in their carrying amount approximating fair value. These include cash and due from banks, interest-bearing deposits in banks, federal funds sold, and securities purchased under resale agreements, customers’ acceptance liabilities, short-term borrowings, and bank acceptance outstanding. The following methods and assumptions were used by the Bank to estimate the fair values of the remaining classes of financial instruments. |
| | Securities are valued based on quoted market prices, where available. If quoted market prices are not available, fair values are based on quoted market prices of comparable instruments. |
| | For variable rate loans that reprice frequently, fair values are based on carrying amounts, as adjusted for estimated credit losses. The fair values for other loans are estimated using discounted cash flow analyses and employ interest rates currently being offered for loans with similar terms to borrowers of similar credit quality. |
| | The fair values of demand deposits, savings accounts, and money market deposits are, by definition, equal to the amount payable on demand. The fair values of fixed rate time deposits are estimated by discounting cash flows using interest rates currently being offered on certificates with similar maturities. |
| | The fair value of loan commitments and standby letters of credit, valued on the basis of fees currently charged for commitments for similar loan terms to new borrowers with similar credit profiles, is not considered material. |
A-32
Clarkston Financial Corporation and Subsidiary
Notes to Consolidated Financial Statements
December 31, 2001, 2000, and 1999
Note 14 - Minimum Regulatory Capital Requirements
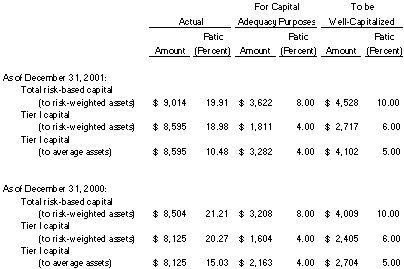
| | The Corporation (on a consolidated basis) and the Bank are subject to various regulatory capital requirements administered by the federal banking agencies. Failure to meet minimum capital requirements can initiate certain mandatory and possibly additional discretionary actions by regulators that, if undertaken, could have a direct material effect on the Corporation’s and the Bank’s financial statements. Under capital adequacy guidelines and the regulatory framework for prompt corrective action, the Corporation and the Bank must meet specific capital guidelines that involve quantitative measures of their assets, liabilities, and certain off-balance-sheet items as calculated under regulatory accounting practices. The capital amounts and classification are also subject to qualitative judgments by the regulators about components, risk weightings, and other factors. Prompt corrective action provisions are not applicable to bank holding companies. |
| | Quantitative measures established by regulation to ensure capital adequacy require the Corporation and the Bank to maintain minimum amounts, and ratios (set forth in the following table) of total and Tier I capital (as defined in the regulations) to risk-weighted assets (as defined) and of Tier I capital (as defined) to average assets (as defined). Management believes, as of December 31, 2001 and 2000, that the Corporation and the Bank met all capital adequacy requirements to which they are subject. |
| | Since the Bank is considered a de novo or start-up bank, the minimum total capital ratio for 2001 is 8 percent. As of December 31, 2001, the most recent notification from the FDIC categorized the Bank as well-capitalized under the regulatory framework for prompt corrective action. To be categorized as well-capitalized, an institution must maintain minimum total risk-based, Tier I risked-based, and Tier I leverage ratios as set forth in the following tables. There are no conditions or events since that notification that management believes have changed the Bank’s capital category. The Corporation’s and the Bank’s actual capital amounts and ratios as of December 31, 2001 and 2000 are also presented in the table. |
A-33
Clarkston Financial Corporation and Subsidiary
Notes to Consolidated Financial Statements
December 31, 2001, 2000, and 1999
Note 14 - Minimum Regulatory Capital Requirements (Continued)
Note 15 - Parent-only Condensed Financial Information
| | The condensed financial information that follows presents the financial condition of Clarkston Financial Corporation (the “Parent Company”), along with the results of its operations and its cash flows. The Parent Company has recorded its investments in its subsidiary at cost plus its share of the undistributed earnings of its subsidiary since inception. The Parent Company recognizes dividends from its subsidiary as revenue and undistributed earnings of its subsidiary as other income. The Parent Company financial information should be read in conjunction with the Corporation’s consolidated financial statements. |
A-34
Clarkston Financial Corporation and Subsidiary
Notes to Consolidated Financial Statements
December 31, 2001, 2000, and 1999
Note 15 - Parent-only Condensed Financial Information (Continued)
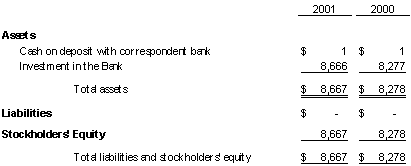
| | The condensed balance sheet as of December 31, 2001 and 2000 (with 000s omitted) is as follows: |
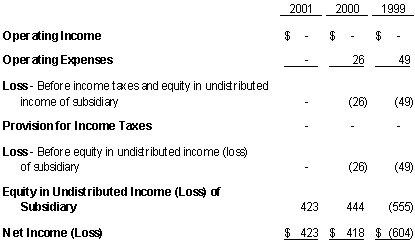
| | The condensed statement of operations for the years ended December 31, 2001, 2000, and 1999 (000s omitted) is as follows: |
A-35
Clarkston Financial Corporation and Subsidiary
Notes to Consolidated Financial Statements
December 31, 2001, 2000, and 1999
Note 15 - Parent-only Condensed Financial Information (Continued)
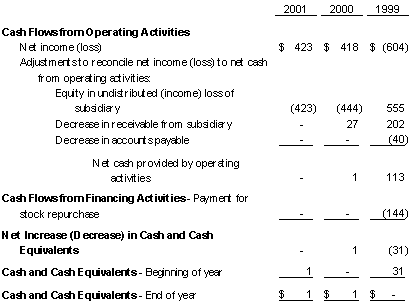
| | The condensed statement of cash flows for the years ended December 31, 2001, 2000, and 1999 (000s omitted) is as follows: |
A-36
Clarkston Financial Corporation and Subsidiary
Notes to Consolidated Financial Statements
December 31, 2001, 2000, and 1999
Note 16 - Earnings per Share
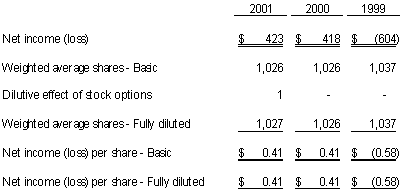
| | Earnings per share data is the amount of earnings for the period available to each share of common stock outstanding during the reporting period. Potential dilutive securities that have an antidilutive effect have been excluded from the computation. The calculation of earnings per share for the years ended December 31, 2001, 2000, and 1999 is as follows: |
A-37
SHAREHOLDER INFORMATION
Notice of Annual Meeting
The Company’s Annual Meeting of Shareholders will be held at 10:00 a.m. on May 7, 2002, at Deer Lake Racquet Club, 6167 White Lake Road, Clarkston, Michigan 48346.
Transfer Agent and Registrar
Continental Stock Transfer & Trust Company serves as the transfer agent and registrar of the Company’s Common Stock. Their address is 2 Broadway, 19th Floor, New York, New York 10004 (telephone 212-509-4000)
Market Makers
The Company had three market makers at December 31, 2001: Hilliard Lyons, Fahnstock, Howe Barnes.
Executive Officers and Directors
| | Executive Officers:
|
| | | Edwin Adler, Chairman of the Company and the Bank
David T. Harrison, President and CEO of the Company and CEO of the Bank
Bruce H. McIntyre, Secretary of the Company
Dawn M. Horner, President and Chief Operating Officer of the Bank
Grant Smith, Chief Financial Officer of the Company and the Bank
|
| | Directors:
|
| | | Edwin L. Adler, Director of the Company and the Bank
Louis D. Beer, Director of the Company and the Bank
William J. Clark, Director of the Company and the Bank
Heather Coats, Director of the Bank
Charles L. Fortinberry, Director of the Company
David T. Harrison, Director of the Company
Bruce H. McIntyre, Director of the Company and the Bank
Lee McNew, Director of the Bank
Robert A. Olsen, Director of the Company and the Bank
Dennis Ritter, Director of the Bank
Ken Rogers, Director of the Bank
Ted J. Simon, Director of the Bank
John H. Welker, Director of the Company and the Bank
|
::ODMA\PCDOCS\GRR\684577\3
A-38
CLARKSTON FINANCIAL CORPORATION
15 South Main Street, Clarkston, Michigan 48346
THIS PROXY IS SOLICITED ON BEHALF OF THE BOARD OF DIRECTORS
The undersigned hereby appoints David T. Harrison and Grant Smith, or either one of them, with power of substitution in each, proxies to vote, as designated on the reverse side, all of the undersigned’s shares of Common Stock of CLARKSTON FINANCIAL CORPORATION, at the Annual Meeting of Shareholders to be held at Deer Lake Racquet Club, 6167 White Lake Road, Clarkston, Michigan 48340 on May 7, 2002, at 10:00 a.m., and any and all adjournments below.
| 1. | Election of Directors - The Board of Directors recommends a vote FOR the nominees named below.
(Check Only One Box) |
| | FOR ALL nominees listed below
(except as marked to the contrary below) | | WITHHOLD AUTHORITY
to vote for all nominees below.
|
| | Louis D. Beer | | William J. Clark
|
(INSTRUCTION: To withhold authority to vote for any individual nominee, write that nominee's name on the space provided below.)
|
| __________________________________________________________________________________________________________________ |
| 2. | IN THEIR DISCRETION, THE PROXIES ARE AUTHORIZED TO VOTE UPON SUCH OTHER MATTERS AS MAY PROPERLY COME BEFORE THE ANNUAL MEETING OR ANY ADJOURNMENTS THEREOF. |
(please sign on the other side)
This Proxy, when properly executed, will be voted in the manner directed herein by the undersigned stockholder(s).IF NO DIRECTION IS MADE, THIS PROXY WILL BE VOTED FOR THE ELECTION OF THE NOMINEES UNDER PROPOSAL 1 AND IN THEIR DISCRETION, THE PROXIES ARE AUTHORIZED TO VOTE UPON SUCH OTHER MATTERS AS MAY PROPERLY COME BEFORE THE ANNUAL MEETING OR ANY ADJOURNMENTS THEREOF PROPOSAL 2.
| | Dated: ___________________________________, 2002
______________________________________________
Signature
______________________________________________
Signature If Held Jointly
Please date, sign exactly as name appears hereon, and mail
promptly in the enclosed envelope which requires no postage
if mailed in the United States. When signing as attorney,
executor, administrator, trustee, guardian, etc., give full
title as such. If shares are held jointly, such owners must sign. |
PLEASE MARK, SIGN, DATE AND RETURN THIS PROXY PROMPTLY USING THE ENCLOSED ENVELOPE.
April 2002
Dear Fellow Shareholders
2001 -- our third year of operation – was another exceptional year for our Corporation and Bank. The Bank posted its third consecutive year of outstanding growth, with assets rising 39%, deposits increasing 46%, loans increasing 34% and pretax income jumping 48%. These results are especially noteworthy given the volatile nature of 2001‘s interest rate environment and softening in loan demand and overall business conditions. Contributing to the positive results for the year was a concerted and successful effort to carefully manage expenses and contain operating costs. We recognize that our shareholders deserve the best we can provide and we are working hard to justify your confidence
In addition to favorable operating results, we successfully grew our franchise with the addition of three branch offices last year. We opened a full service banking center in Waterford Township, a temporary branch facility on North M-15 in Independence Township and a branch office in the Farmer Jack Supermarket located at Dixie Highway and White Lake Road, also in Independence Township. Each of these branch offices has grown nicely since their opening. We believe these strategic locations enhance our ability to serve our growing customer base.
We also enhanced our staff capabilities in several areas. Dawn Horner was named President and Chief Operating Officer of Clarkston State Bank. In addition, we brought on board two experienced and very talented professionals: Grant Smith joined us a Chief Financial Officer and Jim Jeszke is our new Senior Loan Officer. These staff enhancements improve our ability to provide the high level of professional service that our customers have come to expect from our Bank.
Dawn Horner’s new role as President comes at a crucial time in the Bank’s evolution. Over the past three years CSB has been forming its operations and establishing its brand identity and physical presence in the communities it now serves. Having completed these tasks, it is now time for the Bank and staff to begin capitalizing on the opportunities in its marketplace. Dawn is well suited to accomplish these responsibilities, given her strong background in managing CSB’s operations and customer service divisions for the past three years.
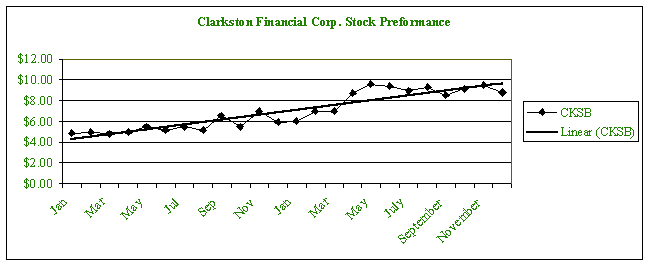
We would also like to note that we have worked hard at improving our P/E and shareprice throughout 2001. The results of this effort are visible in the performance of our stock: from January through December the stock price increased nearly 50%. The chart below depicts our shareprice over the past two years.
Looking forward, the issues we face in 2002 are every bit as challenging as those faced in 2001. Interest rates will undoubtedly remain difficult to predict and manage. Competition will remain strong. Control of our operating expenses will require watchfulness and astute management. We are, however, committed to maintaining solid value for our shareholders and will find ways to continue adding value to your investment.
From time to time shareholders stop in to see us to discuss their investment or the bank. We appreciate the opportunity to visit with our owners and encourage those of you who haven’t visited us at Clarkston State Bank to do so. We always have time to visit and or discuss our Company.
In conclusion, we look forward to seeing and visiting with you at our annual meeting of shareholders on May 7, 2002 at the Deer Lake Racquet Club. In the meantime if you have questions concerning the information presented with this letter don’t hesitate to call or stop in to see us regarding your thoughts our concerns.
/s/ Dave Harrison
Dave Harrison
President and CEO | /s/ Ed Adler
Ed Adler
Chairman |


