UNITED STATES
SECURITIES AND EXCHANGE COMMISSION
Washington, D.C. 20549
FORM N-CSR
CERTIFIED SHAREHOLDER REPORT OF REGISTERED
MANAGEMENT INVESTMENT COMPANIES
Investment Company Act file number | 811-08979 |
|
The Victory Variable Insurance Funds |
(Exact name of registrant as specified in charter) |
|
3435 Stelzer Road, Columbus, Ohio | | 43219 |
(Address of principal executive offices) | | (Zip code) |
|
Citi Fund Services Ohio, Inc., 3435 Stelzer Road, Columbus, Ohio 43219 |
(Name and address of agent for service) |
|
Registrant’s telephone number, including area code: | 614-470-8000 | |
|
Date of fiscal year end: | December 31 | |
|
Date of reporting period: | June 30, 2014 | |
| | | | | | | | |
Item 1. Reports to Stockholders.

June 30, 2014
Semi Annual Report
Diversified Stock Fund
vcm.com
News, Information And Education 24 Hours A Day, 7 Days A Week
The Victory Funds site gives fund shareholders, prospective shareholders, and investment professionals a convenient way to access fund information, get guidance, and track fund performance anywhere they can access the Internet. The site includes:
• Detailed performance records
• Daily share prices
• The latest fund news
• Investment resources to help you become a better investor
• A section dedicated to investment professionals
The Victory Variable Insurance Funds
Table of Contents
Shareholder Letter | | | 3 | | |
Financial Statements | |
Schedule of Portfolio Investments | | | 5 | | |
Statement of Assets and Liabilities | | | 7 | | |
Statement of Operations | | | 8 | | |
Statements of Changes in Net Assets | | | 9 | | |
Financial Highlights | | | 10 | | |
Notes to Financial Statements | | | 11 | | |
Supplemental Information | |
Trustee and Officer Information | | | 16 | | |
Proxy Voting and Form N-Q Information | | | 19 | | |
Expense Examples | | | 19 | | |
Portfolio Holdings | | | 21 | | |
The Fund is distributed by Victory Capital Advisers Inc. Victory Capital Management Inc. is the investment adviser to the Fund and receives fees from the Fund for performing services for the Fund.
This report is not authorized for distribution to prospective investors unless preceded or accompanied by a current prospectus of The Variable Insurance Diversified Stock Fund.
The information in this semi-annual report is based on data obtained from recognized services and sources and is believed to be reliable. Any opinions, projections, or recommendations in this report are subject to change without notice and are not intended as individual investment advice. Furthermore, Victory Capital Management Inc. and its affiliates, as agents for their clients, and any of its officers or employees may have a beneficial interest or position in any of the securities mentioned, which may be contrary to any opinion or projection expressed in this report. Past investment performance of markets or securities mentioned herein should not be considered to be indicative of future results.
• NOT FDIC INSURED • NO BANK GUARANTEE
• MAY LOSE VALUE

Call Victory at:
800-539-FUND (800-539-3863)
Visit our website at:
www.vcm.com
1
This page is intentionally left blank.
2
Letter to Our Shareholders
After an uneven start to the year, equity markets settled into a pattern of quiet trading with a positive bias as the second quarter progressed. Stocks achieved new record highs on several occasions as escalating geopolitical discord failed to discourage investors more focused on the constructive context of strong earnings, low interest rates and optimism over the growth outlook for the second half of the year. For the first half, the S&P 500 Index returned a very solid 7.14%. International stocks also notched all-time highs with the MSCI ACWI ex US Index returning 5.56%. Small cap stocks trailed as measured by the Russell 2000 Index up just 3.19%. From a sector standpoint, Utilities (+18.7%) and Energy (+13.0%) led the way within the S&P 500 while Consumer Discretionary served as the laggard (+0.6%).
Market volatility has retreated to pre-crisis levels, providing a more inviting environment for investors inclined to put money to work. Correlations among individual stocks have also declined, meaning individual company fundamentals have increased in importance. This condition, combined with more generous valuations resulting from recent market gains, has increased the importance of stock selection. In such an environment, the more discerning approach conferred by active management can serve as an advantage, enabling skilled managers to avoid companies where market expectations have outpaced fundamentals in favor of those companies where catalysts exist to drive continued appreciation.
To the surprise of many, fixed income has also proven its mettle in the year's first half. The 10-year U.S. Treasury yield opened 2014 at 3.03%, falling to 2.52% by the close of the second quarter. This decline in interest rates has led to solid gains across the fixed income spectrum with the Barclays U.S. Aggregate Bond Index posting a return of 3.93% in the first half. Long-dated U.S. Treasuries fared best, followed by high yield and investment grade corporate bonds, mortgage backed securities and finally short-dated Treasuries. Mixed data on housing, measured action by the Fed, the growing income requirements of an aging developed world, and strong foreign central bank demand for U.S. Treasuries are several of the factors keeping rates anchored.
On balance it remains a favorable environment for investors. Equities, while not inexpensive, appear fairly priced, particularly when taking the low inflation and low interest rate environment into account. While the risk-reward balance for fixed income is widely viewed as unfavorable longer term given the expectation for an eventual pick-up in inflation and interest rates, investors who have attempted to anticipate this circumstance have thus far missed out on attractive returns. Against this backdrop, each of our investment teams will continue to apply a distinct and disciplined process aimed at consistently delivering superior risk-adjusted returns on behalf of our shareholders.
Shareholder Commitment
As a firm, our mission is to earn our clients' trust by consistently exceeding expectations through a relentless focus on quality, performance and service.
• Consistent Performance and Investment Quality
Our dedicated investment teams maintain investment autonomy and consistently apply transparent, repeatable processes. Reliance on fundamental
3
research ensures high-conviction portfolios, and state-of-the-art risk management tools are employed to ensure ongoing risk monitoring. Finally, value-added trading provides effective execution of investment decisions.
• Client Service Excellence
Our approach is simple: communication is complete, honest, timely and straightforward — our goal is no surprises.
• Empowerment, Ownership and Accountability
Victory has an organizational structure that fosters an environment in which investment professionals thrive, and our compensation plan is built to attract and retain industry-leading talent. Our senior management team is committed to delivering high-quality investment products and services.
We appreciate your confidence in the Victory Funds. If you have questions or would like further information, please feel free to contact us at 800-539-3863 or via our website at www.vcm.com.

Michael Policarpo, II
President,
Victory Funds
4
The Victory Variable Insurance Funds Schedule of Portfolio Investments
Diversified Stock Fund June 30, 2014
(Amounts in Thousands, Except for Shares) (Unaudited)
Security Description | | Shares | | Value | |
Common Stocks (98.4%) | |
Consumer Discretionary (12.1%): | |
Comcast Corp., Class A | | | 33,490 | | | $ | 1,798 | | |
H&R Block, Inc. | | | 23,600 | | | | 791 | | |
Newell Rubbermaid, Inc. | | | 22,800 | | | | 707 | | |
News Corp., Class A (a) | | | 45,700 | | | | 820 | | |
PVH Corp. | | | 8,400 | | | | 979 | | |
Starbucks Corp. | | | 9,900 | | | | 766 | | |
| | | | 5,861 | | |
Consumer Staples (7.7%): | |
Anheuser-Busch InBev NV, ADR | | | 4,220 | | | | 485 | | |
CVS Caremark Corp. | | | 11,600 | | | | 874 | | |
The Procter & Gamble Co. | | | 13,390 | | | | 1,052 | | |
Wal-Mart Stores, Inc. | | | 17,500 | | | | 1,314 | | |
| | | | 3,725 | | |
Energy (11.5%): | |
Anadarko Petroleum Corp. | | | 11,687 | | | | 1,279 | | |
| BP PLC, ADR | | | 29,400 | | | | 1,551 | | |
Chesapeake Energy Corp. | | | 20,800 | | | | 646 | | |
Occidental Petroleum Corp. | | | 16,480 | | | | 1,692 | | |
Weatherford International PLC (a) | | | 17,000 | | | | 391 | | |
| | | | 5,559 | | |
Financials (14.1%): | |
Bank of America Corp. | | | 93,800 | | | | 1,442 | | |
Bank of New York Mellon Corp. | | | 21,200 | | | | 795 | | |
Capital One Financial Corp. | | | 9,100 | | | | 752 | | |
Citigroup, Inc. | | | 34,530 | | | | 1,625 | | |
JPMorgan Chase & Co. | | | 20,600 | | | | 1,187 | | |
MetLife, Inc. | | | 19,268 | | | | 1,071 | | |
| | | | 6,872 | | |
Health Care (12.4%): | |
Abbott Laboratories | | | 17,600 | | | | 720 | | |
Baxter International, Inc. | | | 13,180 | | | | 953 | | |
Eli Lilly & Co. | | | 11,700 | | | | 727 | | |
Merck & Co., Inc. | | | 25,900 | | | | 1,498 | | |
Pfizer, Inc. | | | 43,120 | | | | 1,280 | | |
Roche Holdings Ltd., ADR | | | 22,300 | | | | 832 | | |
| | | | 6,010 | | |
See notes to financial statements.
5
The Victory Variable Insurance Funds Schedule of Portfolio Investments — continued
Diversified Stock Fund June 30, 2014
(Amounts in Thousands, Except for Shares) (Unaudited)
Security Description | | Shares | | Value | |
Industrials (13.8%): | |
C.H. Robinson Worldwide, Inc. | | | 11,700 | | | $ | 746 | | |
Danaher Corp. | | | 16,530 | | | | 1,301 | | |
General Dynamics Corp. | | | 5,220 | | | | 608 | | |
Koninklijke Philips NVR, NYS | | | 28,800 | | | | 915 | | |
Nielsen Holdings NV | | | 19,600 | | | | 949 | | |
Siemens AG, ADR | | | 8,000 | | | | 1,058 | | |
United Parcel Service, Inc., Class B | | | 11,071 | | | | 1,137 | | |
| | | | 6,714 | | |
Information Technology (21.9%): | |
Altera Corp. | | | 28,650 | | | | 996 | | |
Apple, Inc. | | | 17,400 | | | | 1,617 | | |
Applied Materials, Inc. | | | 70,800 | | | | 1,596 | | |
Cisco Systems, Inc. | | | 66,800 | | | | 1,660 | | |
EMC Corp. | | | 66,000 | | | | 1,738 | | |
Google, Inc., Class C (a) | | | 2,678 | | | | 1,541 | | |
Intel Corp. | | | 49,300 | | | | 1,523 | | |
| | | | 10,671 | | |
Materials (4.9%): | |
Air Products & Chemicals, Inc. | | | 10,300 | | | | 1,325 | | |
Nucor Corp. | | | 12,200 | | | | 601 | | |
The Dow Chemical Co. | | | 8,710 | | | | 448 | | |
| | | | 2,374 | | |
Total Common Stocks (Cost $38,619) | | | 47,786 | | |
Investment Companies (1.6%) | |
Federated Treasury Obligations Fund, Institutional Shares, 0.01% (b) | | | 763,780 | | | | 764 | | |
Total Investment Companies (Cost $764) | | | 764 | | |
Total Investments (Cost $39,383) — 100.0% | | | 48,550 | | |
Liabilities in excess of other assets — 0.0% | | | (11 | ) | |
NET ASSETS — 100.0% | | $ | 48,539 | | |
(a) Non-income producing security.
(b) Rate disclosed is the daily yield on 6/30/2014.
ADR — American Depositary Receipt
NYS — New York Registered Shares
PLC — Public Liability Co.
See notes to financial statements.
6
Statement of Assets and Liabilities
The Victory Variable Insurance Funds June 30, 2014
(Amounts in Thousands, Except Per Share Amounts) (Unaudited)
| | | Diversified
Stock Fund | |
ASSETS: | |
Investments, at value (Cost $39,383) | | $ | 48,550 | | |
Dividends receivable | | | 68 | | |
Receivable for capital shares issued | | | 9 | | |
Receivable for investments sold | | | 316 | | |
Prepaid expenses | | | 12 | | |
Total Assets | | | 48,955 | | |
LIABILITIES: | |
Payable for investments purchased | | | 318 | | |
Payable for capital shares redeemed | | | 1 | | |
Accrued expenses and other payables: | |
Investment advisory fees | | | 12 | | |
Administration fees | | | 4 | | |
Custodian fees | | | 2 | | |
Transfer agent fees | | | 1 | | |
Contract owner fees | | | 53 | | |
| 12b-1 fees | | | 10 | | |
Other accrued expenses | | | 15 | | |
Total Liabilities | | | 416 | | |
NET ASSETS: | |
Capital | | | 37,025 | | |
Accumulated undistributed net investment income | | | 32 | | |
Accumulated net realized gains from investments | | | 2,315 | | |
Net unrealized appreciation on investments | | | 9,167 | | |
Net Assets | | $ | 48,539 | | |
Shares (unlimited number of shares authorized with a par value of 0.001 per share) | | | 3,328 | | |
Net asset value, offering price & redemption price per share (a) | | $ | 14.58 | | |
(a) Per share amount may not recalculate due to rounding of net assets and/or shares outstanding.
See notes to financial statements.
7
Statement of Operations
The Victory Variable Insurance Funds For the Six Months Ended June 30, 2014
(Amounts in Thousands) (Unaudited)
| | | Diversified
Stock Fund | |
Investment Income: | |
Dividend income | | $ | 521 | | |
Total Income | | | 521 | | |
Expenses: | |
Investment advisory fees | | | 69 | | |
Administration fees | | | 25 | | |
Contract owner fees | | | 56 | | |
| 12b-1 fees | | | 58 | | |
Custodian fees | | | 5 | | |
Transfer agent fees | | | 7 | | |
Trustees' fees | | | 3 | | |
Chief Compliance Officer fees | | | 1 | | |
Legal and audit fees | | | 22 | | |
Insurance fees | | | 12 | | |
Other expenses | | | 7 | | |
Total Expenses | | | 265 | | |
Net Investment Income | | | 256 | | |
Realized/Unrealized Gains from Investment Transactions: | |
Net realized gains on investment transactions | | | 2,897 | | |
Net change in unrealized appreciation/depreciation on investments | | | (564 | ) | |
Net realized/unrealized gains from investments | | | 2,333 | | |
Change in net assets resulting from operations | | $ | 2,589 | | |
See notes to financial statements.
8
The Victory Variable Insurance Funds Statements of Changes in Net Assets
(Amounts in Thousands)
| | | Diversified Stock Fund | |
| | | Six
Months
Ended
June 30,
2014 | | Year
Ended
December 31,
2013 | |
| | | (Unaudited) | | | |
From Investment Activities: | |
Operations: | |
Net investment income | | $ | 256 | | | $ | 268 | | |
Net realized gains on investment transactions | | | 2,897 | | | | 6,440 | | |
Change in unrealized appreciation/depreciation on investments | | | (564 | ) | | | 4,738 | | |
Change in net assets resulting from operations | | | 2,589 | | | | 11,446 | | |
Distributions to Shareholders: | |
From net investment income | | | (239 | ) | | | (252 | ) | |
Change in net assets resulting from distributions to shareholders | | | (239 | ) | | | (252 | ) | |
Change in net assets from capital transactions | | | (1,479 | ) | | | 3,384 | | |
Change in net assets | | | 871 | | | | 14,578 | | |
Net Assets: | |
Beginning of period | | | 47,668 | | | | 33,090 | | |
End of period | | $ | 48,539 | | | $ | 47,668 | | |
Accumulated undistributed net investment income | | $ | 32 | | | $ | 15 | | |
Capital Transactions: | |
Proceeds from shares issued | | $ | 2,426 | | | $ | 8,318 | | |
Dividends reinvested | | | 239 | | | | 252 | | |
Cost of shares redeemed | | | (4,144 | ) | | | (5,186 | ) | |
Change in net assets from capital transactions | | $ | (1,479 | ) | | $ | 3,384 | | |
Share Transactions: | |
Issued | | | 175 | | | | 667 | | |
Reinvested | | | 17 | | | | 20 | | |
Redeemed | | | (300 | ) | | | (427 | ) | |
Change in Shares | | | (108 | ) | | | 260 | | |
See notes to financial statements.
9
The Victory Variable Insurance Funds Financial Highlights
For a Share Outstanding Throughout Each Period
| | | Diversified Stock Fund | |
| | | Six
Months
Ended
June 30,
2014 | |
Year
Ended
December 31,
2013 | |
Year
Ended
December 31,
2012 | |
Year
Ended
December 31,
2011 | |
Year
Ended
December 31,
2010 | |
Year
Ended
December 31,
2009 | |
| | | (Unaudited) | | | | | | | | | | | |
Net Asset Value, Beginning of Period | | $ | 13.87 | | | $ | 10.42 | | | $ | 9.05 | | | $ | 9.78 | | | $ | 8.77 | | | $ | 6.96 | | |
Investment Activities: | |
Net investment income | | | 0.08 | | | | 0.08 | | | | 0.10 | | | | 0.06 | | | | 0.07 | | | | 0.06 | | |
Net realized and unrealized
gains/(losses) on investments | | | 0.70 | | | | 3.45 | | | | 1.37 | | | | (0.73 | ) | | | 1.01 | | | | 1.81 | | |
Total from Investment
Activities | | | 0.78 | | | | 3.53 | | | | 1.47 | | | | (0.67 | ) | | | 1.08 | | | | 1.87 | | |
Distributions: | |
Net investment income | | | (0.07 | ) | | | (0.08 | ) | | | (0.10 | ) | | | (0.06 | ) | | | (0.07 | ) | | | (0.06 | ) | |
Total Distributions | | | (0.07 | ) | | | (0.08 | ) | | | (0.10 | ) | | | (0.06 | ) | | | (0.07 | ) | | | (0.06 | ) | |
Net Asset Value, End of Period | | $ | 14.58 | | | $ | 13.87 | | | $ | 10.42 | | | $ | 9.05 | | | $ | 9.78 | | | $ | 8.77 | | |
Total Return (a) (b) | | | 5.65 | % | | | 33.93 | % | | | 16.28 | % | | | (6.83 | )% | | | 12.34 | % | | | 27.06 | % | |
Ratios/Supplemental Data: | |
Net assets at end of period (000) | | $ | 48,539 | | | $ | 47,668 | | | $ | 33,090 | | | $ | 32,874 | | | $ | 41,356 | | | $ | 40,585 | | |
Ratio of net expenses to average
net assets (c) | | | 1.15 | % | | | 1.16 | % | | | 1.19 | % | | | 1.26 | % | | | 1.23 | % | | | 1.20 | % | |
Ratio of net investment income
to average net assets (c) | | | 1.11 | % | | | 0.67 | % | | | 0.96 | % | | | 0.62 | % | | | 0.77 | % | | | 0.81 | % | |
Ratio of gross expenses to average
net assets (c) (d) | | | 1.15 | % | | | 1.16 | % | | | 1.19 | % | | | 1.26 | % | | | 1.23 | % | | | 1.24 | % | |
Ratio of net investment income
to average net assets (c) (d) | | | 1.11 | % | | | 0.67 | % | | | 0.96 | % | | | 0.62 | % | | | 0.77 | % | | | 0.77 | % | |
Portfolio turnover | | | 40 | % | | | 82 | % | | | 96 | % | | | 80 | % | | | 91 | % | | | 88 | % | |
(a) Total returns do not include any insurance, sales or administrative charges of variable annuity or life insurance contracts. If these charges were included, the returns would be lower.
(b) Not annualized for periods less than a year.
(c) Annualized for periods less than a year.
(d) During the period, certain fees were reduced and/or reimbursed. If such fee reductions and/or reimbursements had not occurred, the ratios would have been as indicated.
See notes to financial statements.
10
Notes to Financial Statements
The Victory Variable Insurance Funds June 30, 2014
(Unaudited)
1. Organization:
The Victory Variable Insurance Funds (the "Trust") was organized on February 11, 1998 as a Delaware statutory trust. The Trust is a diversified open-end management investment company registered under the Investment Company Act of 1940, as amended (the "1940 Act"). The Trust is authorized to issue an unlimited number of shares, which are units of beneficial interest with a par value of $0.001. The Trust currently offers shares of one fund: the Diversified Stock Fund (the "Fund"). The Fund offers a single class of shares: Class A Shares. Sales of shares of the Fund may only be made to separate accounts of various life insurance companies.
The Fund seeks to provide long-term growth of capital.
Under the Trust's organizational documents, its officers and trustees are indemnified against certain liabilities arising out of the performance of their duties to the Fund. In addition, in the normal course of business, the Fund enters into contracts with its vendors and others that provide for general indemnifications. The Fund's maximum exposure under these arrangements is unknown, as this would involve future claims that may be made against the Fund. However, based on experience, the Fund expects that risk of loss to be remote.
2. Significant Accounting Policies:
The following is a summary of significant accounting policies followed by the Trust in the preparation of its financial statements. The policies are in conformity with accounting principles generally accepted in the United States of America ("GAAP"). The preparation of financial statements requires management to make estimates and assumptions that affect the reported amounts of assets and liabilities at the date of the financial statements and the reported amounts of income and expenses for the period. Actual results could differ from those estimates.
Securities Valuation:
The Fund records investments at fair value. Fair value is defined as the price that would be received to sell an asset or paid to transfer a liability in an orderly transaction between market participants at the measurement date.
The valuation techniques described below maximize the use of observable inputs and minimize the use of unobservable inputs in determining fair value. The inputs used for valuing the Fund's investments are summarized in the three broad levels listed below:
• Level 1 — quoted prices in active markets for identical securities
• Level 2 — other significant observable inputs (including quoted prices for similar securities or interest rates, applicable to those securities, etc.)
• Level 3 — significant unobservable inputs (including the Fund's own assumptions in determining the fair value of investments)
Changes in valuation techniques may result in transfers in or out of an assigned level within the disclosure hierarchy. The Trust determines transfers between fair value hierarchy levels at the reporting period end. The inputs or methodology used for valuing investments are not necessarily an indication of the risk associated with investing in those investments.
Portfolio securities listed or traded on securities exchanges, including American Depositary Receipts ("ADRs"), are valued at the closing price on the exchange or system where the security is principally traded or at the NASDAQ Official Closing Price. If there have been no sales for that day on the exchange or system, a security is valued at the last available bid quotation on the exchange or system where the security is principally traded. These valuations are typically categorized as Level 1 in the fair value hierarchy.
Debt securities of U.S. issuers (other than short-term investments maturing in 60 days or less), including corporate and municipal securities, are valued on the basis of bid valuations provided by dealers or an independent pricing service approved by the Trust's Board of Trustees (the "Board").
11
Notes to Financial Statements — continued
The Victory Variable Insurance Funds June 30, 2014
(Unaudited)
Short-term investments maturing in 60 days or less may be valued at amortized cost, which approximates market value. These valuations are typically categorized as Level 2 in the fair value hierarchy.
Investments in other open-end investment companies are valued at net asset value. These valuations are typically categorized as Level 1 or Level 2 in the fair value hierarchy.
Investments for which there are no such quotations, or for which quotations do not appear reliable, are valued at fair value as determined in good faith by the Pricing Committee under the direction of the Board. These valuations are typically categorized as Level 2 or Level 3 in the fair value hierarchy.
For the six months ended June 30, 2014, there were no Level 3 investments for which significant unobservable inputs were used to determine fair value.
The following is a summary of the inputs used to value the Fund's investments as of June 30, 2014, while the breakdown, by category, of common stocks is disclosed on the Schedule of Portfolio Investments (in thousands):
Investment | | LEVEL 1 —
Quoted Prices | | LEVEL 2 —
Other Significant
Observable Inputs | | Total | |
Common Stocks | | $ | 47,786 | | | $ | — | | | $ | 47,786 | | |
Investment Companies | | | — | | | | 764 | | | | 764 | | |
Total | | $ | 47,786 | | | $ | 764 | | | $ | 48,550 | | |
There were no transfers between Level 1 and Level 2 as of June 30, 2014.
Securities Transactions and Related Income:
Changes in holdings of portfolio securities are accounted for no later than one business day following the trade date. For financial reporting purposes, however, portfolio security transactions are accounted for on trade date on the last business day of the reporting period. Interest income is recognized on the accrual basis and includes, where applicable, the amortization of premium or accretion of discount. Dividend income is recorded on the ex-dividend date. Gains or losses realized on sales of securities are determined by comparing the identified cost of the security lot sold with the net sales proceeds.
Dividends to Shareholders:
Dividends from net investment income are declared and paid quarterly for the Fund. Distributable net realized gains, if any, are declared and distributed at least annually. The amounts of dividends from net investment income and of distributions from net realized gains are determined in accordance with federal income tax regulations which may differ from GAAP. These "book/tax" differences are either considered temporary or permanent in nature. To the extent these differences are permanent in nature (e.g., reclass of market discounts and gain/loss), such amounts are reclassified within the components of net assets based on their federal tax-basis treatment; temporary differences do not require reclassification. To the extent dividends and distributions exceed net investment income and net realized gains for tax purposes, they are reported as distributions of capital. Net investment losses incurred by the Fund may be reclassified as an offset to capital in the accompanying Statement of Assets and Liabilities.
Federal Income Taxes:
It is the policy of the Fund to continue to qualify as a regulated investment company by complying with the provisions available to certain investment companies, as defined in applicable sections of the Internal Revenue Code, and to make distributions of net investment income and net realized gains sufficient to relieve it from all, or substantially all, federal income taxes.
12
Notes to Financial Statements — continued
The Victory Variable Insurance Funds June 30, 2014
(Unaudited)
Management of the Fund has reviewed tax positions taken in tax years that remain subject to examination by all major tax jurisdictions, including federal (i.e., the last four tax year ends and the interim tax period since then). Management believes that there is no tax liability resulting from unrecognized tax benefits related to uncertain tax positions taken.
Withholding taxes on interest, dividends and gains as a result of certain investments in ADRs by the Fund have been provided for in accordance with each investment's applicable country's tax rules and rates.
Subsequent Events:
The Fund has evaluated subsequent events and there are no subsequent events to report.
3. Purchases and Sales of Securities:
Purchases and sales of securities (excluding short-term securities) for the six months ended June 30, 2014 were as follows for the Fund (in thousands):
| Purchases* | | Sales* | |
| $ | 18,380 | | | $ | 19,724 | | |
*There were no Purchases or Sales of U.S. Government Securities during the period.
4. Investment Advisory, Administration, and Distribution Agreements:
Investment advisory services are provided to the Fund by Victory Capital Management Inc. ("VCM" or the "Adviser"), a New York corporation registered as an investment adviser with the Securities and Exchange Commission (the "SEC"). The Adviser is a wholly owned subsidiary of Victory Capital Holdings, Inc. ("VCH"). A majority of the interest in VCH is owned by Crestview Partners II, L.P. and its affiliated funds with a substantial minority interest owned by employees of the Adviser.
Under the terms of the Investment Advisory Agreement, the Adviser is entitled to receive an annual fee of 0.30% of the average daily net assets of the Fund. The Adviser may use its resources to assist with the Fund's distribution and marketing expenses.
KeyBank National Association ("KeyBank"), serving as custodian for the Fund, receives custodian fees at an annualized rate of 0.00774% of the daily net assets of the Trust, plus applicable per transaction fees. The Trust reimburses KeyBank for all of its reasonable out-of-pocket expenses incurred in providing custody services.
VCM also serves as the Fund's administrator and fund accountant. Under an Administration and Fund Accounting Agreement, VCM is paid for its services an annual fee at a rate of 0.108% of the first $8 billion in average daily net assets of the Trust and The Victory Portfolios (collectively, the "Trusts"), 0.078% of the average daily net assets above $8 billion to $10 billion of the Trusts, 0.075% of the average daily net assets above $10 billion to $12 billion of the Trusts and 0.065% of the average daily net assets over $12 billion of the Trusts.
Citi Fund Services Ohio, Inc. ("Citi") acts as sub-administrator and sub-fund accountant to the Fund under a Sub-Administration Agreement between VCM and Citi. VCM pays Citi a fee for providing these services. The Trust reimburses VCM and Citi for all of their reasonable out-of-pocket expenses incurred in providing these services.
Citi also serves as the Fund's transfer agent. Under the terms of the Transfer Agent Agreement, Citi receives for its services an annual fee at a rate of 0.02% of the first $8 billion in average daily net assets of the Trusts, 0.015% of the average daily net assets above $8 billion to $16 billion of the Trusts, 0.01% of the average daily net assets above $16 billion to $20 billion of the Trusts and 0.005% of the average daily net assets over $20 billion of the Trusts. In addition, Citi is entitled to reimbursement of out-of-pocket expenses incurred in providing transfer agent services.
13
Notes to Financial Statements — continued
The Victory Variable Insurance Funds June 30, 2014
(Unaudited)
Victory Capital Advisers, Inc. (the "Distributor"), an affiliate of the Adviser, serves as distributor for the continuous offering of the shares of the Fund pursuant to a Distribution Agreement between the Distributor and the Trust.
Pursuant to the Trust's Distribution and Service Plan adopted in accordance with Rule 12b-1 under the 1940 Act, the Distributor may receive a monthly distribution and service fee, at an annual rate of 0.25% of the average daily net assets of the Fund. The Distributor may pay a 12b-1 fee to life insurance companies for activities primarily intended to result in the sale of Fund shares to life insurance companies for the purpose of funding variable annuity contracts and variable life insurance policies or to provide services to owners of variable annuity contracts and variable life insurance policies whose contracts or policies are funded with shares of the Fund, which services are not otherwise provided by life insurance companies and paid for with fees charged by life insurance companies. The Distributor re-allowed all except for $1 thousand to life insurance companies to provide these services.
The Fund has a Contract Owner Administrative Services Agreement. A contract owner servicing agent performs a number of services for its customers who hold contracts offered by separate accounts that invest in the Fund, such as establishing and maintaining accounts and records, processing additional contract units attributable to Fund dividend payments, arranging for bank wires, assisting in transactions, and changing account information. For these services, Class A Shares of the Fund pay a fee at an annual rate of up to 0.25% of its average daily net assets serviced by the agent. The Fund may enter into these agreements with financial institutions that provide such services. Contract owner servicing agents may waive all or a portion of their fee. (Not all agents may provide all services listed above.)
The Adviser, Citi or other service providers may voluntarily waive or reimburse additional fees to assist the Fund in maintaining a competitive expense ratio. Voluntary waivers and reimbursements applicable to the Fund are not available to be recouped at a future time.
5. Risks:
The Fund will be subject to credit risk with respect to the amount it expects to receive from counterparties to financial instruments entered into by the Fund. The Fund may be negatively impacted if a counterparty becomes bankrupt or otherwise fails to perform its obligations due to financial difficulties. The Fund may experience significant delays in obtaining any recovery in bankruptcy or other reorganization proceeding and the Fund may obtain only limited recovery or may obtain no recovery in such circumstances. The Fund typically enters into transactions with counterparties whose credit ratings are investment grade, as determined by a nationally recognized statistical rating organization or, if unrated, judged by the Adviser to be of comparable quality.
6. Line of Credit:
The Trust, the Victory Portfolios and the Victory Institutional Funds (collectively, the "Victory Trusts"), (except Emerging Markets Small Cap Fund and Select Fund) participate in a short-term, demand note "Line of Credit" agreement with Citibank. Under the agreement, the Victory Trusts may borrow up to $100 million, of which $50 million is committed and $50 million is uncommitted. The purpose of the agreement is to meet temporary or emergency cash needs, including redemption requests that might otherwise require the untimely disposition of securities. Citibank receives an annual commitment fee of 0.10% on $50 million for providing the Line of Credit. For the six months ended June 30, 2014, Citibank earned approximately $25 thousand in Line of Credit fees. Each fund in the Victory Trusts (except Emerging Markets Small Cap Fund and Select Fund) pays a pro-rata portion of this commitment fee plus any interest on amounts borrowed. During the six months ended June 30, 2014, the Fund had no loans outstanding with Citibank.
14
Notes to Financial Statements — continued
The Victory Variable Insurance Funds June 30, 2014
(Unaudited)
7. Federal Income Tax Information:
The tax character of distributions paid and the tax basis of current components of accumulated earnings/(deficit) will be determined at the end of the current tax year ending December 31, 2014.
The tax character of distributions paid during the fiscal year ended December 31, 2013 was as follows (total distributions paid may differ from the Statement of Changes in Net Assets because, for tax purposes, dividends are recognized when actually paid) (in thousands):
Distribution paid from | | | |
Ordinary
Income | | Net
Long-Term
Capital
Gains | | Total
Distributions
Paid | |
| $ | 252 | | | $ | — | | | $ | 252 | | |
As of December 31, 2013, the components of accumulated earnings/(deficit) on a tax basis were as follows (in thousands):
Undistributed
Ordinary
Income | | Undistributed
Long-Term
Capital Gains | | Accumulated
Capital
and Other
Losses | | Unrealized
Appreciation/
Depreciation* | | Total
Accumulated
Earnings/
(Deficit) | |
| $ | 15 | | | $ | — | | | $ | (471 | ) | | $ | 9,620 | | | $ | 9,164 | | |
*The difference between the book-basis unrealized appreciation/depreciation is attributable primarily to the tax deferral of losses on wash sales.
As of the end of its tax year ended December 31, 2013, the Fund had net capital loss carryforwards ("CLCFs") as summarized in the tables below. CLCFs subject to expiration are applied as short-term capital loss regardless of whether the originating capital loss was short-term or long- term. CLCFs that are not subject to expiration are applied as either short-term, or long-term depending on the originating capital loss and must be utilized before those that are subject to expiration.
CLCFs subject to expiration:
The cost basis for federal income tax purposes, gross unrealized appreciation, gross unrealized depreciation and net unrealized appreciation/depreciation as of June 30, 2014, were as follows (in thousands):
Cost of
Investments
for Federal
Tax Purposes | | Gross
Unrealized
Appreciation | | Gross
Unrealized
Depreciation | | Net
Unrealized
Appreciation/
Depreciation | |
| $ | 39,509 | | | $ | 9,338 | | | $ | (297 | ) | | $ | 9,041 | | |
15
Supplemental Information
The Victory Variable Insurance Funds June 30, 2014
(Unaudited)
Trustee and Officer Information
Board of Trustees:
Overall responsibility for management of the Trust rests with the Board. The Trust is managed by the Board in accordance with the laws of the State of Delaware. There are currently seven Trustees, six of whom are not "interested persons" of the Trust within the meaning of that term under the 1940 Act ("Independent Trustees") and one of whom is an "interested person" of the Trust within the meaning of that term under the 1940 Act ("Interested Trustee"). The Trustees, in turn, elect the officers of the Trust to actively supervise its day-to-day operations.
The following tables list the Trustees, their ages, position with the Trust, commencement of service, principal occupations during the past five years and any directorships of other investment companies or companies whose securities are registered under the Securities Exchange Act of 1934, as amended, or who file reports under that Act. Each Trustee oversees one portfolio in the Trust, one portfolio in The Victory Institutional Funds and 16 portfolios in The Victory Portfolios, each a registered investment company that, together with the Trust, comprise the Victory Fund Complex. Each Trustee's address is c/o The Victory Portfolios, 3435 Stelzer Road, Columbus, Ohio 43219. Each Trustee has an indefinite term.
Name and Age | | Position
Held with
the Trust | | Date
Commenced
Service | | Principal Occupation
During Past 5 Years | | Other
Directorships
Held During
Past 5 Years | |
Independent Trustees. | |
David Brooks Adcock, 62 | | Trustee | | February 2005 | | Consultant (since 2006). | | FBR Funds (2011-2012). | |
Nigel D.T. Andrews, 67 | | Vice Chair and Trustee | | August 2002 | | Retired. | | Carlyle GMS Finance, Inc. (since 2012); Chemtura Corporation (2000-2010); Old Mutual plc (2002-2011); Old Mutual US Asset Management (since 2002). | |
E. Lee Beard, 62 | | Trustee | | February 2005 | | Consultant, The Henlee Group, LLC (consulting) (since 2005). | | Penn Millers Holding Corporation (January 2011-November 2011). | |
Sally M. Dungan, 60 | | Trustee | | February 2011 | | Chief Investment Officer, Tufts University (since 2002). | | ProCredit Holding Supervisory Board (2006-2011). | |
David L. Meyer, 57 | | Trustee | | December 2008 | | Retired. | | None. | |
16
Supplemental Information — continued
The Victory Variable Insurance Funds June 30, 2014
(Unaudited)
Name and Age | | Position
Held with
the Trust | | Date
Commenced
Service | | Principal Occupation
During Past 5 Years | | Other
Directorships
Held During
Past 5 Years | |
Leigh A. Wilson, 69 | | Chair and Trustee | | February 1998 | | Private Investor. | | Chair (since 2013) and Director (since 2012 and March-October 2008), Caledonia Mining Corporation; Director, The Mutual Fund Directors Forum (2004-2013); Chair, Old Mutual Funds II (15 portfolios) (2005-2010); Trustee, Old Mutual Funds III (13 portfolios) (2007-2010). | |
Interested Trustee. | |
David C. Brown, 42 | | Trustee | | May 2008 | | Chief Executive Officer (since August 2013), Co-Chief Executive Officer (2011-July 2013), President — Investments and Operations (2010-2011), and Chief Operating Officer (2004-2011), the Adviser; Chief Executive Officer (since 2013), Victory Capital Holdings, Inc. | | None. | |
Mr. Brown is an "Interested Person" by reason of his relationship with the Adviser.
The Board has designated Mr. Meyer and Ms. Beard as its Audit Committee Financial Experts.
The Statement of Additional Information includes additional information about the Trustees of the Trust and is available, without charge, by calling 800-539-3863.
17
Supplemental Information — continued
The Victory Variable Insurance Funds June 30, 2014
(Unaudited)
Officers:
The officers of the Trust, their ages, commencement of service and their principal occupations during the past five years, are detailed in the following table. Each individual holds the same position with the other registered investment companies in the Victory Fund Complex, and each officer serves until the earlier of his or her resignation, removal, retirement, death, or the election of a successor. The mailing address of each officer of the Trust is 3435 Stelzer Road, Columbus, Ohio 43219. Except for the Chief Compliance Officer, the officers of the Trust receive no compensation directly from the Trust for performing the duties of their offices.
Name and Age | | Position with
the Trust | | Date
Commenced
Service | | Principal Occupation During Past 5 Years | |
Michael D. Policarpo, II, 40 | | President | | May 2008 | | Chief Financial Officer (since February 2013), Senior Managing Director (2010-January 2013) and Managing Director (2005-2010), the Adviser; Chief Financial Officer and Treasurer (since 2013), Victory Capital Holdings, Inc. | |
Derrick A. MacDonald, 43 | | Vice President | | August 2010 | | Director of Investment Operations & Technology, the Adviser (since 2008) | |
Christopher K. Dyer, 52 | | Secretary | | February 2006 | | Director of Fund Administration, the Adviser. | |
Jay G. Baris, 60 | | Assistant Secretary | | February 1998 | | Partner, Morrison & Foerster LLP (since 2011); Partner, Kramer Levin Naftalis & Frankel LLP (1994-2011). | |
Christopher E. Sabato, 45 | | Treasurer | | May 2006 | | Senior Vice President, Financial Administration, Citi Fund Services, Inc. | |
Eric B. Phipps, 43 | | Anti-Money Laundering Compliance Officer and Identity Theft Officer | | August 2010 | | Vice President and Chief Compliance Officer, CCO Services, Citi Fund Services, Inc. (since 2006). | |
Edward J. Veilleux, 70 | | Chief Compliance Officer | | October 2005 | | President of EJV Financial Services (mutual fund consulting). | |
18
Supplemental Information — continued
The Victory Variable Insurance Funds June 30, 2014
(Unaudited)
Proxy Voting and Form N-Q Information
Proxy Voting:
Information regarding the policies and procedures that the Fund uses to determine how to vote proxies relating to portfolio securities is available without charge, upon request, by calling 800-539-3863. The information is also included in the Fund's Statement of Additional Information, which is available on the SEC's website at www.sec.gov.
Information relating to how the Fund voted proxies relating to portfolio securities held during the most recent twelve months ended June 30 is available on the SEC's website at www.sec.gov.
Availability of Schedules of Investments:
The Trust files a complete list of schedules of investments with the SEC for the first and third quarters of each fiscal year on Form N-Q. Forms N-Q are available on the SEC's website at www.sec.gov. You may also review or, for a fee, copy those documents by visiting the SEC's Public Reference Room in Washington, D.C. Information on the operation of the Public Reference Room can be obtained by calling the SEC at 202-551-8090.
Expense Examples:
As a shareholder of the Fund, you may incur ongoing costs, including management fees, distribution and service (12b-1) fees, and other Fund expenses. These examples are intended to help you understand your ongoing costs (in dollars) of investing in the Fund and to compare these costs with the ongoing costs of investing in other mutual funds.
These examples are based on an investment of $1,000 invested at the beginning of the period and held for the entire period from January 1, 2014 through June 30, 2014.
Actual Expenses:
The table below provides information about actual account values and actual expenses. You may use the information below, together with the amount you invested, to estimate the expenses that you paid over the period. Simply divide your account value by $1,000 (for example, an $8,600 account value divided by $1,000 = 8.6), then multiply the result by the number in the table under the heading entitled "Expenses Paid During Period" to estimate the expenses you paid on your account during this period.
Beginning
Account Value
1/1/14 | | Ending
Account Value
6/30/14 | | Expenses Paid
During Period*
1/1/14-6/30/14 | | Expense Ratio
During Period**
1/1/14-6/30/14 | |
| $ | 1,000.00 | | | $ | 1,056.50 | | | $ | 5.86 | | | | 1.15 | % | |
* Expenses are equal to the average account value multiplied by the Fund's annualized expense ratio multiplied by 181/365 (the number of days in the most recent fiscal half-year divided by the number of days in the fiscal year).
** Annualized.
19
Supplemental Information — continued
The Victory Variable Insurance Funds June 30, 2014
(Unaudited)
Hypothetical Example for Comparison Purposes:
The table below provides information about hypothetical account values and hypothetical expenses based on the Fund's actual expense ratio and an assumed rate of return of 5% per year before expenses, which is not the Fund's actual return. The hypothetical account values and expenses may not be used to estimate the actual ending account balance or expenses you paid for the period. You may use this information to compare this 5% hypothetical example with the 5% hypothetical examples that appear in the shareholder reports of other funds.
Please note that the expenses shown in the table are meant to highlight your ongoing costs. Therefore, the table will not help you determine the relative total costs of owning different funds.
Beginning
Account Value
1/1/14 | | Ending
Account Value
6/30/14 | | Expenses Paid
During Period*
1/1/14-6/30/14 | | Expense Ratio
During Period**
1/1/14-6/30/14 | |
| $ | 1,000.00 | | | $ | 1,019.09 | | | $ | 5.76 | | | | 1.15 | % | |
* Expenses are equal to the average account value multiplied by the Fund's annualized expense ratio multiplied by 181/365 (the number of days in the most recent fiscal half-year divided by the number of days in the fiscal year).
** Annualized.
20
Supplemental Information — continued
The Victory Variable Insurance Funds June 30, 2014
(Unaudited)
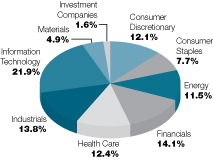
Portfolio Holdings:
(As a Percentage of Total Investments)
21

Visit our website at: | | Call Victory at: | |
www.vcm.com | | 800-539-FUND (800-539-3863) | |
Item 2. Code of Ethics.
Not applicable – only for annual reports.
Item 3. Audit Committee Financial Expert.
Not applicable – only for annual reports.
Item 4. Principal Accountant Fees and Services.
Not applicable – only for annual reports.
Item 5. Audit Committee of Listed Registrants.
Not applicable.
Item 6. Investments.
(a) Not applicable.
(b) Not applicable.
Item 7. Disclosure of Proxy Voting Policies and Procedures for Closed-End Management Investment Companies.
Not applicable.
Item 8. Portfolio Managers of Closed-End Management Investment Companies.
Not applicable.
Item 9. Purchases of Equity Securities by Closed-End Management Investment Company and Affiliated Purchasers.
Not applicable.
Item 10. Submission of Matters to a Vote of Security Holders.
Not applicable.
Item 11. Controls and Procedures.
(a)The registrant’s principal executive officer and principal financial officer have concluded, based on their evaluation of the registrant’s disclosure controls and procedures as conducted within 90 days of the filing date of this report, that these disclosure controls and procedures are adequately designed and are operating effectively to ensure that information required to be disclosed by the registrant on Form N-CSR is recorded, processed, summarized and reported within the time periods specified in the Securities and Exchange Commission’s rules and forms.
(b)There were no changes in the registrant’s internal control over financial reporting (as defined in Rule 30a-3(d) under the Investment Company Act of 1940 (17 CFR 270.30a-3(d)) that occurred during the second fiscal quarter of the period covered by this report that have materially affected or are reasonably likely to materially affect, the registrant’s internal control over financial reporting.
Item 12. Exhibits.
(a)(1) Not applicable.
(a)(2) Certifications pursuant to Rule 30a-2(a) are attached hereto.
(a)(3) Not applicable.
(b) Certifications pursuant to Rule 30a-2(b) are furnished herewith.
SIGNATURES
Pursuant to the requirements of the Securities Exchange Act of 1934 and the Investment Company Act of 1940, the registrant has duly caused this report to be signed on its behalf by the undersigned, thereunto duly authorized.
(Registrant) | The Victory Variable Insurance Funds | |
| | |
By (Signature and Title)* | /s/ Christopher E. Sabato | |
| Christopher E. Sabato, Treasurer | |
Date | August 12, 2014 | |
| | | | |
Pursuant to the requirements of the Securities Exchange Act of 1934 and the Investment Company Act of 1940, this report has been signed below by the following persons on behalf of the registrant and in the capacities and on the dates indicated.
By (Signature and Title)* | /s/ Michael Policarpo, II | |
| Michael Policarpo, II, President | |
Date | August 12, 2014 | |
| | | |
By (Signature and Title)* | /s/ Christopher E. Sabato | |
| Christopher E. Sabato, Treasurer | |
Date | August 12, 2014 | |
| | | |