UNITED STATES
SECURITIES AND EXCHANGE COMMISSION
Washington, D.C. 20549
FORM N-CSR
CERTIFIED SHAREHOLDER REPORT OF REGISTERED
MANAGEMENT INVESTMENT COMPANIES
Investment Company Act file number: 811-08979
Victory Variable Insurance Funds
(Exact name of registrant as specified in charter)
| 4900 Tiedeman Road, 4th Floor, Brooklyn, Ohio | 44144 |
| (Address of principal executive offices) | (Zip code) |
Citi Fund Services Ohio, Inc., 4400 Easton Commons, Suite 200, Columbus, Ohio 43219
(Name and address of agent for service)
Registrant’s telephone number, including area code: 800-539-3863
Date of fiscal year end: December 31
Date of reporting period: June 30, 2022
Item 1. Reports to Stockholders.

June 30, 2022
Semi Annual Report
Victory Variable Insurance Funds
Victory Sophus Emerging Markets VIP Series
www.vcm.com
News, Information And Education 24 Hours A Day, 7 Days A Week
The Victory Capital website gives fund shareholders, prospective shareholders, and investment professionals a convenient way to access fund information, get guidance, and track fund performance anywhere they can access the Internet. The site includes:
• Detailed performance records
• Daily share prices
• The latest fund news
• Investment resources to help you become a better investor
• A section dedicated to investment professionals
Whether you're a potential investor searching for the fund that matches your investment philosophy, a seasoned investor interested in planning tools, or an investment professional, www.vcm.com has what you seek. Visit us anytime. We're always open.
Victory Variable Insurance Funds
TABLE OF CONTENTS
Investment Objective & Portfolio Holdings | | | 3 | | |
Schedule of Portfolio Investments | | | 4 | | |
Financial Statements | |
Statement of Assets and Liabilities | | | 11 | | |
Statement of Operations | | | 12 | | |
Statements of Changes in Net Assets | | | 13 | | |
Financial Highlights | | | 14 | | |
Notes to Financial Statements | | | 16 | | |
Supplemental Information | | | 23 | | |
Proxy Voting and Portfolio Holdings Information | | | 23 | | |
Expense Example | | | 23 | | |
Liquidity Risk Management Program | | | 24 | | |
Privacy Policy (inside back cover) | | | |
1
The Fund is distributed by Victory Capital Services, Inc. Victory Capital Management Inc. is the investment adviser to the Fund and receives fees from the Fund for performing services for the Fund.
This report is not authorized for distribution to prospective investors unless preceded or accompanied by a current prospectus of the Fund.
For additional information about any Victory Fund, including fees, expenses, and risks, view our prospectus online at vcm.com or call 800-539-3863. Read it carefully before you invest or send money.
The information in this report is based on data obtained from recognized services and sources and is believed to be reliable. Any opinions, projections, or recommendations in this report are subject to change without notice and are not intended as individual investment advice. Past investment performance of the Fund markets or securities mentioned herein should not be considered to be indicative of future results.
• NOT FDIC INSURED • NO BANK GUARANTEE • MAY LOSE VALUE

Call Victory at:
800-539-FUND (800-539-3863)
Visit our website at:
www.vcm.com
2
Victory Variable Insurance Funds
Victory Sophus Emerging Markets VIP Series | | June 30, 2022 | |
(Unaudited)
Investment Objective and Portfolio Holdings:
The Fund seeks to provide long-term capital appreciation.
Top 10 Holdings*:
June 30, 2022
(% of Net Assets)
Taiwan Semiconductor Manufacturing Co. Ltd. | | | 6.9 | % | |
Samsung Electronics Co. Ltd. | | | 4.1 | % | |
Alibaba Group Holding Ltd. | | | 3.6 | % | |
Tencent Holdings Ltd. | | | 3.5 | % | |
JD.com, Inc., Class A | | | 2.0 | % | |
ICICI Bank Ltd. | | | 1.9 | % | |
Postal Savings Bank of China Co. Ltd., Class H | | | 1.7 | % | |
Meituan, Class B | | | 1.6 | % | |
Infosys Ltd. | | | 1.5 | % | |
Mahindra & Mahindra Ltd. | | | 1.5 | % | |
Sector Allocation*:
June 30, 2022
(% of Net Assets)
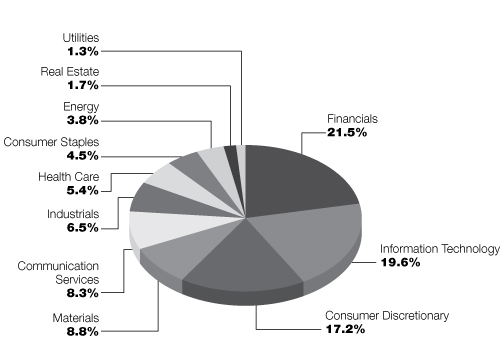
* Does not include futures contracts, money market instruments, and short-term investments purchased with cash collateral from securities loaned.
Percentages are of the net assets of the Fund and may not equal 100%.
Refer to the Schedule of Portfolio Investments for a complete list of securities.
3
Victory Variable Insurance Funds
Victory Sophus Emerging Markets VIP Series | | Schedule of Portfolio Investments
June 30, 2022 | |
(Unaudited)
Security Description | | Shares | | Value | |
Common Stocks (98.6%) | |
Brazil (6.3%): | |
Consumer Discretionary (0.5%): | |
Vibra Energia SA | | | 42,181 | | | $ | 134,695 | | |
Consumer Staples (1.4%): | |
Sao Martinho SA | | | 17,500 | | | | 121,496 | | |
Sendas Distribuidora SA | | | 66,453 | | | | 181,216 | | |
SLC Agricola SA | | | 14,150 | | | | 119,329 | | |
| | | | 422,041 | | |
Energy (1.2%): | |
Petroleo Brasileiro SA, ADR | | | 29,951 | | | | 349,828 | | |
Financials (0.9%): | |
Itau Unibanco Holding SA, ADR | | | 58,165 | | | | 248,946 | | |
Health Care (0.7%): | |
Hypera SA | | | 27,300 | | | | 198,454 | | |
Industrials (0.8%): | |
Randon SA Implementos e Participacoes, Preference Shares | | | 77,800 | | | | 139,457 | | |
SIMPAR SA | | | 60,172 | | | | 106,709 | | |
| | | | 246,166 | | |
Materials (0.8%): | |
Dexco SA | | | 51,602 | | | | 97,329 | | |
Gerdau SA, Preference Shares | | | 32,900 | | | | 140,517 | | |
| | | | 237,846 | | |
| | | | 1,837,976 | | |
Canada (0.5%): | |
Energy (0.5%): | |
Parex Resources, Inc. | | | 8,431 | | | | 142,809 | | |
Chile (0.0%): (a) | |
Financials (0.0%): | |
Banco de Credito e Inversiones SA | | | 1 | | | | 29 | | |
China (32.8%): | |
Communication Services (5.7%): | |
37 Interactive Entertainment Network Technology Group Co. Ltd., Class A | | | 35,500 | | | | 113,039 | | |
Baidu, Inc., Class A (b) | | | 15,784 | | | | 299,007 | | |
NetEase, Inc. | | | 11,415 | | | | 215,058 | | |
Tencent Holdings Ltd. | | | 22,330 | | | | 1,010,797 | | |
| | | | 1,637,901 | | |
Consumer Discretionary (10.7%): | |
Alibaba Group Holding Ltd. (b) | | | 73,348 | | | | 1,046,365 | | |
BYD Co. Ltd., Class H | | | 8,500 | | | | 342,639 | | |
China Meidong Auto Holdings Ltd. | | | 34,000 | | | | 108,044 | | |
Fuyao Glass Industry Group Co. Ltd., Class H (c) | | | 44,400 | | | | 224,622 | | |
JD.com, Inc., Class A | | | 18,506 | | | | 596,335 | | |
See notes to financial statements.
4
Victory Variable Insurance Funds
Victory Sophus Emerging Markets VIP Series | | Schedule of Portfolio Investments — continued
June 30, 2022 | |
(Unaudited)
Security Description | | Shares | | Value | |
Jiumaojiu International Holdings Ltd. (c) | | | 66,000 | | | $ | 175,801 | | |
Meituan, Class B (b) (c) | | | 18,200 | | | | 454,180 | | |
Yadea Group Holdings Ltd. (c) | | | 74,000 | | | | 145,134 | | |
| | | | 3,093,120 | | |
Consumer Staples (2.2%): | |
Chacha Food Co. Ltd., Class A | | | 26,500 | | | | 225,662 | | |
Chenguang Biotech Group Co. Ltd., Class A | | | 80,500 | | | | 187,644 | | |
Inner Mongolia Yili Industrial Group Co. Ltd., Class A | | | 36,800 | | | | 214,402 | | |
| | | | 627,708 | | |
Energy (1.3%): | |
PetroChina Co. Ltd., Class H | | | 830,000 | | | | 389,285 | | |
Financials (4.0%): | |
Industrial & Commercial Bank of China Ltd., Class H | | | 481,000 | | | | 286,996 | | |
PICC Property & Casualty Co. Ltd., Class H | | | 362,000 | | | | 377,505 | | |
Postal Savings Bank of China Co. Ltd., Class H (c) (d) | | | 619,000 | | | | 493,305 | | |
| | | | 1,157,806 | | |
Health Care (1.8%): | |
Hygeia Healthcare Holdings Co. Ltd. (b) (c) | | | 27,000 | | | | 180,053 | | |
Pharmaron Beijing Co. Ltd., Class H (c) | | | 16,800 | | | | 168,750 | | |
Shenzhen Mindray Bio-Medical Electronics Co. Ltd., Class A | | | 3,700 | | | | 173,513 | | |
| | | | 522,316 | | |
Industrials (2.1%): | |
China Railway Group Ltd., Class H | | | 569,000 | | | | 352,242 | | |
Xinte Energy Co. Ltd., Class H | | | 83,600 | | | | 250,841 | | |
| | | | 603,083 | | |
Information Technology (1.9%): | |
Glodon Co. Ltd., Class A | | | 21,700 | | | | 176,701 | | |
Luxshare Precision Industry Co. Ltd., Class A | | | 42,300 | | | | 213,947 | | |
WUS Printed Circuit Kunshan Co. Ltd., Class A | | | 68,320 | | | | 151,057 | | |
| | | | 541,705 | | |
Materials (2.2%): | |
China Hongqiao Group Ltd. (d) | | | 206,500 | | | | 232,637 | | |
Shandong Nanshan Aluminum Co. Ltd., Class A | | | 259,000 | | | | 142,997 | | |
Wanhua Chemical Group Co. Ltd., Class A | | | 18,600 | | | | 270,108 | | |
| | | | 645,742 | | |
Utilities (0.9%): | |
China Longyuan Power Group Corp. Ltd., Class H | | | 140,000 | | | | 271,322 | | |
| | | | 9,489,988 | | |
Greece (1.0%): | |
Financials (0.5%): | |
National Bank of Greece SA (b) | | | 46,204 | | | | 138,203 | | |
Industrials (0.5%): | |
Mytilineos SA | | | 10,918 | | | | 161,586 | | |
| | | | 299,789 | | |
See notes to financial statements.
5
Victory Variable Insurance Funds
Victory Sophus Emerging Markets VIP Series | | Schedule of Portfolio Investments — continued
June 30, 2022 | |
(Unaudited)
Security Description | | Shares | | Value | |
Hong Kong (2.9%): | |
Consumer Discretionary (0.8%): | |
Bosideng International Holdings Ltd. | | | 362,000 | | | $ | 224,905 | | |
Financials (0.5%): | |
BOC Hong Kong Holdings Ltd. | | | 36,500 | | | | 144,945 | | |
Industrials (0.6%): | |
Pacific Basin Shipping Ltd. | | | 408,000 | | | | 156,862 | | |
Real Estate (1.0%): | |
China Resources Land Ltd. | | | 64,000 | | | | 300,122 | | |
| | | | 826,834 | | |
India (11.8%): | |
Communication Services (0.3%): | |
Sun TV Network Ltd. | | | 15,722 | | | | 82,370 | | |
Consumer Discretionary (2.8%): | |
Balkrishna Industries Ltd. | | | 9,877 | | | | 270,077 | | |
Mahindra & Mahindra Ltd. | | | 30,719 | | | | 427,266 | | |
Raymond Ltd. | | | 11,057 | | | | 123,219 | | |
| | | | 820,562 | | |
Consumer Staples (0.4%): | |
Dabur India Ltd. | | | 20,176 | | | | 126,935 | | |
Financials (3.0%): | |
Cholamandalam Investment & Finance Co. Ltd. | | | 35,108 | | | | 276,575 | | |
ICICI Bank Ltd., ADR | | | 30,131 | | | | 534,524 | | |
UTI Asset Management Co. Ltd. | | | 5,035 | | | | 41,352 | | |
| | | | 852,451 | | |
Health Care (0.8%): | |
Apollo Hospitals Enterprise Ltd. | | | 4,735 | | | | 221,550 | | |
Industrials (1.0%): | |
Larsen & Toubro Ltd. | | | 14,173 | | | | 280,982 | | |
Information Technology (2.4%): | |
Infosys Ltd., ADR | | | 23,979 | | | | 443,851 | | |
WNS Holdings Ltd., ADR (b) | | | 3,515 | | | | 262,360 | | |
| | | | 706,211 | | |
Materials (0.7%): | |
Tata Steel Ltd. | | | 17,774 | | | | 195,987 | | |
Utilities (0.4%): | |
GAIL India Ltd. | | | 74,059 | | | | 127,118 | | |
| | | | 3,414,166 | | |
Indonesia (0.8%): | |
Financials (0.8%): | |
PT Bank Mandiri Persero Tbk | | | 436,900 | | | | 233,351 | | |
See notes to financial statements.
6
Victory Variable Insurance Funds
Victory Sophus Emerging Markets VIP Series | | Schedule of Portfolio Investments — continued
June 30, 2022 | |
(Unaudited)
Security Description | | Shares | | Value | |
Korea, Republic Of (12.5%): | |
Communication Services (1.6%): | |
JYP Entertainment Corp. | | | 5,774 | | | $ | 214,923 | | |
LG Uplus Corp. | | | 26,415 | | | | 260,013 | | |
| | | | 474,936 | | |
Consumer Discretionary (0.7%): | |
Shinsegae, Inc. | | | 1,124 | | | | 189,260 | | |
Financials (2.3%): | |
Hana Financial Group, Inc. | | | 8,874 | | | | 269,776 | | |
Samsung Securities Co. Ltd. | | | 5,809 | | | | 150,196 | | |
Woori Financial Group, Inc. | | | 26,713 | | | | 250,111 | | |
| | | | 670,083 | | |
Health Care (1.1%): | |
InBody Co. Ltd. | | | 5,489 | | | | 101,176 | | |
Samsung Biologics Co. Ltd. (b) (c) | | | 337 | | | | 206,078 | | |
| | | | 307,254 | | |
Industrials (0.4%): | |
CJ Corp. | | | 2,065 | | | | 124,020 | | |
Information Technology (6.2%): | |
Innox Advanced Materials Co. Ltd. | | | 5,468 | | | | 140,348 | | |
Samsung Electro-Mechanics Co. Ltd. | | | 1,522 | | | | 154,022 | | |
Samsung Electronics Co. Ltd. | | | 26,672 | | | | 1,176,703 | | |
SK Hynix, Inc. | | | 4,763 | | | | 336,413 | | |
| | | | 1,807,486 | | |
Materials (0.2%): | |
PI Advanced Materials Co. Ltd. | | | 1,734 | | | | 42,694 | | |
| | | | 3,615,733 | | |
Malaysia (2.3%): | |
Consumer Discretionary (0.4%): | |
MR DIY Group M Bhd (c) | | | 245,400 | | | | 115,339 | | |
Consumer Staples (0.5%): | |
Kuala Lumpur Kepong Bhd | | | 27,000 | | | | 134,389 | | |
Financials (0.9%): | |
Public Bank Bhd | | | 274,900 | | | | 272,784 | | |
Materials (0.5%): | |
Petronas Chemicals Group Bhd | | | 69,500 | | | | 141,968 | | |
| | | | 664,480 | | |
Mexico (1.7%): | |
Consumer Discretionary (0.4%): | |
Alsea SAB de CV (b) | | | 68,364 | | | | 129,489 | | |
Financials (1.1%): | |
Grupo Financiero Banorte SAB de CV, Class O | | | 55,441 | | | | 309,326 | | |
See notes to financial statements.
7
Victory Variable Insurance Funds
Victory Sophus Emerging Markets VIP Series | | Schedule of Portfolio Investments — continued
June 30, 2022 | |
(Unaudited)
Security Description | | Shares | | Value | |
Real Estate (0.2%): | |
Corp Inmobiliaria Vesta SAB de CV | | | 23,241 | | | $ | 43,235 | | |
| | | | 482,050 | | |
Peru (0.8%): | |
Financials (0.8%): | |
Credicorp Ltd. | | | 1,898 | | | | 227,589 | | |
Philippines (0.7%): | |
Financials (0.7%): | |
BDO Unibank, Inc. | | | 94,620 | | | | 190,416 | | |
Qatar (0.6%): | |
Industrials (0.6%): | |
Industries Qatar QSC | | | 40,796 | | | | 179,003 | | |
Romania (0.0%): (a) | |
Real Estate (0.0%): | |
NEPI Rockcastle S.A. | | | 1 | | | | 5 | | |
Russian Federation (0.0%): (a) | |
Consumer Staples (0.0%): | |
Magnit PJSC (e) (f) | | | 2,805 | | | | 47 | | |
Energy (0.0%): | |
Gazprom PJSC (e) (f) (g) (h) | | | 117,150 | | | | 5,163 | | |
Rosneft Oil Co. PJSC, GDR (e) (f) (g) (h) | | | 48,095 | | | | 2,254 | | |
| | | | 7,417 | | |
Financials (0.0%): | |
Sberbank of Russia PJSC, ADR (b) (e) (f) (g) (h) | | | 31,735 | | | | 212 | | |
| | | | 7,676 | | |
Saudi Arabia (4.0%): | |
Consumer Discretionary (0.4%): | |
Leejam Sports Co. JSC | | | 5,050 | | | | 120,768 | | |
Financials (2.4%): | |
Alinma Bank | | | 31,585 | | | | 282,277 | | |
The Saudi National Bank | | | 23,636 | | | | 416,073 | | |
| | | | 698,350 | | |
Health Care (0.5%): | |
Mouwasat Medical Services Co. | | | 2,560 | | | | 145,397 | | |
Materials (0.7%): | |
Saudi Arabian Mining Co. (b) | | | 14,666 | | | | 195,752 | | |
| | | | 1,160,267 | | |
South Africa (4.1%): | |
Communication Services (0.7%): | |
MTN Group Ltd. | | | 25,993 | | | | 211,619 | | |
See notes to financial statements.
8
Victory Variable Insurance Funds
Victory Sophus Emerging Markets VIP Series | | Schedule of Portfolio Investments — continued
June 30, 2022 | |
(Unaudited)
Security Description | | Shares | | Value | |
Consumer Discretionary (0.5%): | |
Woolworths Holdings Ltd. | | | 43,651 | | | $ | 145,969 | | |
Financials (1.6%): | |
Absa Group Ltd. (d) | | | 23,174 | | | | 221,375 | | |
Capitec Bank Holdings Ltd. | | | 2,038 | | | | 249,894 | | |
| | | | 471,269 | | |
Industrials (0.5%): | |
The Bidvest Group Ltd. | | | 11,334 | | | | 146,455 | | |
Materials (0.8%): | |
Impala Platinum Holdings Ltd. | | | 19,591 | | | | 217,452 | | |
| | | | 1,192,764 | | |
Taiwan (11.0%): | |
Financials (1.1%): | |
CTBC Financial Holding Co. Ltd. | | | 388,000 | | | | 328,207 | | |
Information Technology (9.1%): | |
Gold Circuit Electronics Ltd. | | | 84,000 | | | | 215,662 | | |
Hon Hai Precision Industry Co. Ltd. | | | 81,000 | | | | 297,378 | | |
Taiwan Semiconductor Manufacturing Co. Ltd. | | | 125,259 | | | | 2,007,546 | | |
Unimicron Technology Corp. | | | 24,000 | | | | 128,451 | | |
| | | | 2,649,037 | | |
Materials (0.8%): | |
Formosa Plastics Corp. | | | 61,000 | | | | 222,749 | | |
| | | | 3,199,993 | | |
Thailand (3.5%): | |
Energy (0.8%): | |
PTT PCL | | | 244,400 | | | | 235,344 | | |
Financials (0.9%): | |
SCB X PCL (b) | | | 89,200 | | | | 262,434 | | |
Health Care (0.5%): | |
Mega Lifesciences PCL | | | 106,300 | | | | 152,054 | | |
Materials (0.8%): | |
Indorama Ventures PCL | | | 161,500 | | | | 215,254 | | |
Real Estate (0.5%): | |
AP Thailand PCL | | | 495,100 | | | | 140,242 | | |
| | | | 1,005,328 | | |
United Kingdom (1.3%): | |
Materials (1.3%): | |
Anglo American PLC | | | 6,526 | | | | 233,256 | | |
Mondi PLC | | | 8,434 | | | | 149,679 | | |
| | | | 382,935 | | |
Total Common Stocks (Cost $28,513,036) | | | 28,553,181 | | |
See notes to financial statements.
9
Victory Variable Insurance Funds
Victory Sophus Emerging Markets VIP Series | | Schedule of Portfolio Investments — continued
June 30, 2022 | |
(Unaudited)
Security Description | | Shares | | Value | |
Collateral for Securities Loaned (3.0%)^ | |
United States (3.0%): | |
BlackRock Liquidity Funds TempFund, Institutional Shares, 1.47% (i) | | | 26,937 | | | $ | 26,937 | | |
Goldman Sachs Financial Square Prime Obligations Fund,
Institutional Shares, 1.42% (i) | | | 13,443 | | | | 13,443 | | |
HSBC U.S. Government Money Market Fund, I Shares, 1.46% (i) | | | 167,663 | | | | 167,663 | | |
JPMorgan Prime Money Market Fund, Capital Shares, 1.50% (i) | | | 107,191 | | | | 107,191 | | |
Morgan Stanley Institutional Liquidity Government Portfolio,
Institutional Shares, 1.39% (i) | | | 71,484 | | | | 71,484 | | |
Morgan Stanley Institutional Liquidity Prime Portfolio,
Institutional Shares, 1.53% (i) | | | 481,953 | | | | 481,953 | | |
Total Collateral for Securities Loaned (Cost $868,671) | | | 868,671 | | |
Total Investments (Cost $29,381,707) — 101.6% | | | 29,421,852 | | |
Liabilities in excess of other assets — (1.6)% | | | (468,581 | ) | |
NET ASSETS — 100.00% | | $ | 28,953,271 | | |
^ Purchased with cash collateral from securities on loan.
(a) Amount represents less than 0.05% of net assets.
(b) Non-income producing security.
(c) Rule 144A security or other security that is restricted as to resale to institutional investors. The Fund's Adviser has deemed this security to be liquid (unless otherwise noted as illiquid) based upon procedures approved by the Board of Trustees. As of June 30, 2022, the fair value of these securities was $2,163,262 and amounted to 7.5% of net assets.
(d) All or a portion of this security is on loan.
(e) The Fund's Adviser has deemed this security to be illiquid based upon procedures approved by the Board of Trustees. As of June 30, 2022, illiquid securities were less than 0.05% of net assets.
(f) Security was fair valued based upon procedures approved by the Board of Trustees and represents less than 0.05% of net assets as of June 30, 2022. This security is classified as Level 3 within the fair value hierarchy. (See Note 2 in the Notes to Financial Statements)
(g) Restricted security that is not registered under the Securities Act of 1933
(h) The following table details the acquisition date and cost of the Fund's restricted securities at June 30, 2022:
Security Name | | Acquisition
Date | | Cost | |
Gazprom PJSC | | 7/28/2021 | | $ | 464,042 | | |
Rosneft Oil Co. PJSC, GDR | | 3/6/2020 | | | 298,051 | | |
Sberbank of Russia PJSC, ADR | | 11/11/2020 | | | 416,883 | | |
(i) Rate disclosed is the daily yield on June 30, 2022.
ADR — American Depositary Receipt
GDR — Global Depositary Receipt
PCL — Public Company Limited
PLC — Public Limited Company
See notes to financial statements.
10
Victory Variable Insurance Funds | | Statement of Assets and Liabilities
June 30, 2022 | |
(Unaudited)
| | | Victory
Sophus Emerging
Markets VIP
Series | |
Assets: | |
Investments, at value (Cost $29,381,707) | | $ | 29,421,852 | (a) | |
Foreign currency, at value (Cost $344,866) | | | 344,823 | | |
Receivables: | |
Interest and dividends | | | 169,340 | | |
Capital shares issued | | | 78,976 | | |
Investments sold | | | 454,161 | | |
Reclaims | | | 486 | | |
From Adviser | | | 16,184 | | |
Prepaid expenses | | | 235 | | |
Total Assets | | | 30,486,057 | | |
Liabilities: | |
Payables: | |
Collateral received on loaned securities | | | 868,671 | | |
Payable to custodian | | | 136,489 | | |
Investments purchased | | | 397,733 | | |
Capital shares redeemed | | | 4,282 | | |
Accrued foreign capital gains taxes | | | 18,718 | | |
Accrued expenses and other payables: | |
Investment advisory fees | | | 24,977 | | |
Administration fees | | | 1,663 | | |
Custodian fees | | | 12,299 | | |
Transfer agent fees | | | 19,044 | | |
Compliance fees | | | 18 | | |
Other accrued expenses | | | 48,892 | | |
Total Liabilities | | | 1,532,786 | | |
Net Assets: | |
Capital | | | 22,898,393 | | |
Total accumulated earnings/(loss) | | | 6,054,878 | | |
Net Assets | | $ | 28,953,271 | | |
Shares (unlimited shares authorized with a par
value of $0.001 per share): | | | 2,163,950 | | |
Net asset value: | | $ | 13.38 | | |
(a) Includes $823,027 of securities on loan.
See notes to financial statements.
11
Victory Variable Insurance Funds | | Statement of Operations
For the Six Months Ended June 30, 2022 | |
(Unaudited)
| | | Victory
Sophus Emerging
Markets VIP
Series | |
Investment Income: | |
Dividends | | $ | 530,239 | | |
Non-cash dividends | | | 50,080 | | |
Securities lending (net of fees) | | | 420 | | |
Foreign tax withholding | | | (64,969 | ) | |
Total Income | | | 515,770 | | |
Expenses: | |
Investment advisory fees | | | 169,088 | | |
Administration fees | | | 9,136 | | |
Sub-Administration fees | | | 8,430 | | |
Custodian fees | | | 26,014 | | |
Transfer agent fees | | | 26,668 | | |
Trustees' fees | | | 1,557 | | |
Compliance fees | | | 123 | | |
Legal and audit fees | | | 17,578 | | |
Interest fees | | | 47 | | |
Other expenses | | | 15,999 | | |
Total Expenses | | | 274,640 | | |
Expenses waived/reimbursed by Adviser | | | (46,648 | ) | |
Net Expenses | | | 227,992 | | |
Net Investment Income (Loss) | | | 287,778 | | |
Realized/Unrealized Gains (Losses) from Investments: | |
Net realized gains (losses) from investment securities and foreign
currency transactions | | | (469,922 | ) | |
Foreign taxes on realized gains | | | (4,912 | ) | |
Net change in unrealized appreciation/depreciation on investment securities and
foreign currency translations | | | (6,812,196 | ) | |
Net change in accrued foreign taxes on unrealized gains | | | 38,986 | | |
Net realized/unrealized gains (losses) on investments | | | (7,248,044 | ) | |
Change in net assets resulting from operations | | $ | (6,960,266 | ) | |
See notes to financial statements.
12
Victory Variable Insurance Funds | | Statements of Changes in Net Assets | |
| | | Victory Sophus Emerging
Markets VIP Series | |
| | | Six Months
Ended
June 30, 2022
(Unaudited) | | Year
Ended
December 31,
2021 | |
From Investment Activities: | |
Operations: | |
Net investment income (loss) | | $ | 287,778 | | | $ | 301,435 | | |
Net realized gains (losses) | | | (474,834 | ) | | | 6,044,584 | | |
Net change in unrealized appreciation/depreciation | | | (6,773,210 | ) | | | (7,912,136 | ) | |
Change in net assets resulting from operations | | | (6,960,266 | ) | | | (1,566,117 | ) | |
Change in net assets resulting from distributions to shareholders | | | — | | | | (1,038,915 | ) | |
Change in net assets resulting from capital transactions | | | (2,100,717 | ) | | | (4,400,240 | ) | |
Change in net assets | | | (9,060,983 | ) | | | (7,005,272 | ) | |
Net Assets: | |
Beginning of period | | | 38,014,254 | | | | 45,019,526 | | |
End of period | | $ | 28,953,271 | | | $ | 38,014,254 | | |
Capital Transactions: | |
Proceeds from shares issued | | $ | 423,741 | | | $ | 2,584,480 | | |
Distributions reinvested | | | — | | | | 1,038,915 | | |
Cost of shares redeemed | | | (2,524,458 | ) | | | (8,023,635 | ) | |
Change in net assets resulting from capital transactions | | $ | (2,100,717 | ) | | $ | (4,400,240 | ) | |
Share Transactions: | |
Issued | | | 28,332 | | | | 139,367 | | |
Reinvested | | | — | | | | 63,135 | | |
Redeemed | | | (166,072 | ) | | | (435,096 | ) | |
Change in Shares | | | (137,740 | ) | | | (232,594 | ) | |
See notes to financial statements.
13
Victory Variable Insurance Funds | | Financial Highlights | |
For a Share Outstanding Throughout Each Period
| | | | | Investment Activities | | Distributions to
Shareholders From | |
| | | Net Asset
Value,
Beginning
of Period | | Net
Investment
Income
(Loss)(a) | | Net
Realized
and
Unrealized
Gains
(Losses) on
Investments | | Total from
Investment
Activities | | Net
Investment
Income | | Net
Realized
Gains from
Investments | |
Victory Sophus Emerging Markets VIP Series | | | |
Six Months Ended
June 30, 2022
(Unaudited) | | $ | 16.52 | | | | 0.13 | | | | (3.27 | ) | | | (3.14 | ) | | | — | | | | — | | |
Year Ended December 31:
2021 | | $ | 17.76 | | | | 0.13 | | | | (0.91 | ) | | | (0.78 | ) | | | (0.16 | ) | | | (0.30 | ) | |
2020 | | $ | 15.73 | | | | 0.07 | | | | 2.42 | | | | 2.49 | | | | (0.32 | ) | | | (0.14 | ) | |
2019 | | $ | 13.59 | | | | 0.29 | | | | 2.85 | | | | 3.14 | | | | (0.16 | ) | | | (0.84 | ) | |
2018 | | $ | 18.79 | | | | 0.20 | | | | (3.79 | ) | | | (3.59 | ) | | | (0.14 | ) | | | (1.47 | ) | |
2017 | | $ | 13.26 | | | | 0.17 | | | | 5.51 | | | | 5.68 | | | | (0.15 | ) | | | — | | |
(a) Per share net investment income (loss) has been calculated using the average daily shares method.
(b) Not annualized for periods less than one year.
(c) Total returns do not reflect the effects of charges deducted pursuant to the terms of The Guardian Insurance & Annuity Company, Inc.'s variable contracts. Inclusion of such charges would reduce the total returns for all periods shown.
(d) Includes adjustments in accordance with U.S. Generally Accepted Accounting Principles.
(e) Annualized for periods less than one year.
(f) Does not include acquired fund fees and expenses, if any.
See notes to financial statements.
14
Victory Variable Insurance Funds | | Financial Highlights — continued | |
For a Share Outstanding Throughout Each Period
| | | | | Ratios to Average Net Assets | | Supplemental Data | |
| | | Total
Distributions | | Net
Asset
Value,
End of
Period | | Total
Return(b)(c)(d) | | Net
Expenses(e)(f) | | Net
Investment
Income
(Loss)(e) | | Gross
Expenses(e)(f) | | Net
Assets,
End of
Period
(000's) | | Portfolio
Turnover(b) | |
Victory Sophus Emerging Markets VIP Series | |
Six Months Ended
June 30, 2022
(Unaudited) | | | — | | | $ | 13.38 | | | | (19.01 | )% | | | 1.35 | % | | | 1.70 | % | | | 1.63 | % | | $ | 28,953 | | | | 25 | % | |
Year Ended December 31:
2021 | | | (0.46 | ) | | $ | 16.52 | | | | (4.42 | )% | | | 1.35 | % | | | 0.68 | % | | | 1.53 | % | | $ | 38,014 | | | | 85 | % | |
2020 | | | (0.46 | ) | | $ | 17.76 | | | | 16.02 | % | | | 1.35 | % | | | 0.49 | % | | | 1.48 | % | | $ | 45,020 | | | | 96 | % | |
2019 | | | (1.00 | ) | | $ | 15.73 | | | | 23.28 | % | | | 1.35 | % | | | 1.93 | % | | | 1.40 | % | | $ | 44,571 | | | | 91 | % | |
2018 | | | (1.61 | ) | | $ | 13.59 | | | | (18.97 | )% | | | 1.34 | % | | | 1.12 | % | | | 1.34 | % | | $ | 42,385 | | | | 105 | % | |
2017 | | | (0.15 | ) | | $ | 18.79 | | | | 42.88 | % | | | 1.33 | % | | | 1.03 | % | | | 1.33 | % | | $ | 62,550 | | | | 99 | % | |
See notes to financial statements.
15
Victory Variable Insurance Funds | | Notes to Financial Statements
June 30, 2022 | |
(Unaudited)
1. Organization:
Victory Variable Insurance Funds (the "Trust") is organized as a Delaware statutory trust and the Trust is registered under the Investment Company Act of 1940, as amended (the "1940 Act"), as an open-end investment company. The Trust is comprised of six funds and is authorized to issue an unlimited number of shares, which are units of beneficial interest with a par value of $0.001 per share.
The accompanying financial statements are those of the Sophus Emerging Markets VIP Series (the "Fund"), a series of the Trust. The Fund offers a single class of shares: Class I. The Fund's shares are only available for purchase by certain separate accounts of insurance companies as investments for certain variable annuity plans and variable life insurance contracts issued by those insurance companies. The Fund is classified as diversified under the 1940 Act.
Under the Trust's organizational documents, its officers and trustees are indemnified against certain liabilities arising out of the performance of their duties to the Fund. In addition, in the normal course of business, the Fund enters into contracts with its vendors and others that provide for general indemnifications. The Fund's maximum exposure under these arrangements is unknown, as this would involve future claims that may be made against the Fund. However, based on experience, the Fund expects that risk of loss to be remote.
2. Significant Accounting Policies:
The following is a summary of significant accounting policies followed by the Trust in the preparation of its financial statements. The policies are in conformity with U.S. Generally Accepted Accounting Principles ("GAAP"). The preparation of financial statements in accordance with GAAP requires management to make estimates and assumptions that affect the reported amounts of assets and liabilities and disclosure of contingent assets and liabilities at the date of the financial statements and the reported amounts of income and expenses for the period. Actual results could differ from those estimates. The Fund follows the specialized accounting and reporting requirements under GAAP that are applicable to investment companies under Accounting Standards Codification Topic 946.
Investment Valuation:
The Fund records investments at fair value. Fair value is defined as the price that would be received to sell an asset or paid to transfer a liability in an orderly transaction between market participants at the measurement date.
The valuation techniques described below maximize the use of observable inputs and minimize the use of unobservable inputs in determining fair value. The inputs used for valuing the Fund's investments are summarized in the three broad levels listed below:
• Level 1 — quoted prices in active markets for identical securities
• Level 2 — other significant observable inputs (including quoted prices for similar securities or interest rates applicable to those securities, etc.)
• Level 3 — significant unobservable inputs (including the Fund's own assumptions in determining the fair value of investments)
Changes in valuation techniques may result in transfers in or out of an assigned level within the disclosure hierarchy. The inputs or methodologies used for valuation techniques are not necessarily an indication of the risk associated with entering into those investments.
Victory Capital Management Inc. ("VCM" or the "Adviser") has established the Pricing and Liquidity Committee (the "Committee"), and subject to the Trust's Board of Trustees' (the "Board") oversight, the Committee administers and oversees the Fund's valuation policies and procedures, which are approved by the Board.
Portfolio securities listed or traded on securities exchanges, including Exchange-Traded Funds ("ETFs"), and American Depositary Receipts ("ADRs"), are valued at the closing price on the exchange or system where the security is principally traded, if available, or at the Nasdaq Official Closing Price. If there have been no sales for that day on the exchange or system, then a security is valued at the last available
16
Victory Variable Insurance Funds | | Notes to Financial Statements — continued
June 30, 2022 | |
(Unaudited)
bid quotation on the exchange or system where the security is principally traded. In each of these situations, valuations are typically categorized as Level 1 in the fair value hierarchy.
Investments in open-end investment companies, other than ETFs, are valued at their net asset value ("NAV"). These valuations are typically categorized as Level 1 in the fair value hierarchy.
In the event that price quotations or valuations are not readily available, investments are valued at fair value in accordance with procedures established by and under the general supervision and responsibility of the Board. These valuations are typically categorized as Level 2 or Level 3 in the fair value hierarchy, based on the observability of inputs used to determine the fair value. The effect of fair value pricing is that securities may not be priced on the basis of quotations from the primary market in which they are traded and the actual price realized from the sale of a security may differ materially from the fair value price. Valuing these securities at fair value is intended to cause the Fund's NAV to be more reliable than it otherwise would be.
In accordance with procedures adopted by the Board, fair value pricing may be used if events materially affecting the value of foreign securities occur between the time the exchange on which they are traded closes and the time the Fund's NAV is calculated. The Fund uses a systematic valuation model, provided daily by an independent third party to fair value its international equity securities. The valuations are categorized as Level 2 in the fair value hierarchy.
A summary of the valuations as of June 30, 2022, is included in the table below while the breakdown, by category, of investments is disclosed on the Schedule of Portfolio Investments:
| | | Level 1 | | Level 2 | | Level 3 | | Total | |
Common Stocks | | $ | 4,193,622 | | | $ | 24,351,883 | | | $ | 7,676 | | | $ | 28,553,181 | | |
Collateral for Securities Loaned | | | 868,671 | | | | — | | | | — | | | | 868,671 | | |
Total | | $ | 5,062,293 | | | $ | 24,351,883 | | | $ | 7,676 | | | $ | 29,421,852 | | |
For the six months ended June 30, 2022, there were no significant changes into/out of Level 3. The transfers into Level 3 investments for the Fund were immaterial, although the change in unrealized appreciation/(depreciation) on these investments was $(1,638,238). These securities were impacted by the invasion of Ukraine and sanctions on market conditions in Russia. From the start of the conflict in Ukraine until June 30, 2022, Russian-held investments were valued at an approximately 99 percent discount from their last traded prices.
Investment Companies:
Open-End Funds:
The Fund may invest in portfolios of open-end investment companies. These investment companies value securities in their portfolios for which market quotations are readily available at their market values (generally the last reported sale price) and all other securities and assets at their fair value by the methods established by the board of directors of the underlying funds.
Derivative Instruments:
Foreign Exchange Currency Contracts:
The Fund may enter into foreign exchange currency contracts to convert U.S. dollars to and from various foreign currencies. A foreign exchange currency contract is an obligation by a Fund to purchase or sell a specific currency at a future date at a price (in U.S. dollars) set at the time of the contract. The Fund does not engage in "cross-currency" foreign exchange contracts (i.e., contracts to purchase or sell one foreign currency in exchange for another foreign currency). The Fund's foreign exchange currency contracts might be considered spot contracts (typically a contract of one week or less) or forward contracts (typically a contract term over one week). A spot contract is entered into for purposes of hedging against foreign currency fluctuations relating to a specific portfolio transaction, such as the delay between a security transaction trade date and settlement date. Forward contracts are entered into for purposes of hedging portfolio holdings or concentrations of such holdings. The Fund enters
17
Victory Variable Insurance Funds | | Notes to Financial Statements — continued
June 30, 2022 | |
(Unaudited)
into foreign exchange currency contracts solely for spot or forward hedging purposes, and not for speculative purposes (i.e., the Fund does not enter into such contracts solely for the purpose of earning foreign currency gains). Each foreign exchange currency contract is adjusted daily by the prevailing spot or forward rate of the underlying currency, and any appreciation or depreciation is recorded for financial statement purposes as unrealized until the contract settlement date, at which time the Fund records realized gains or losses equal to the difference between the value of a contract at the time it was opened and the value at the time it was closed. The Fund could be exposed to risk if a counterparty is unable to meet the terms of a foreign exchange currency contract or if the value of the foreign currency changes unfavorably. In addition, the use of foreign exchange currency contracts does not eliminate fluctuations in the underlying prices of the securities. For the year ended June 30, 2022, the Fund had no open forward foreign exchange currency contracts.
Investment Transactions and Related Income:
Changes in holdings of investments are accounted for no later than one business day following the trade date. For financial reporting purposes, however, investment transactions are accounted for on trade date or the last business day of the reporting period. Interest income is determined on the basis of coupon interest accrued using the effective interest method which adjusts, where applicable, the amortization of premiums or accretion of discounts. Dividend income is recorded on the ex-dividend date. Gains or losses realized on sales of securities are recorded on the identified cost basis.
Withholding taxes on interest, dividends, and gains as a result of certain investments by the Fund have been provided for in accordance with each investment's applicable country's tax rules and rates.
Securities Lending:
The Fund, through a Securities Lending Agreement with Citibank, N.A. ("Citibank"), may lend its securities to qualified financial institutions, such as certain broker-dealers and banks, to earn additional income, net of income retained by Citibank. Borrowers are required to initially secure their loans for collateral in the amount of at least 102% of the value of U.S. securities loaned or at least 105% of the value of non-U.S. securities loaned, marked-to-market daily. Any collateral shortfalls associated with increases in the valuation of the securities loaned are generally cured the next business day. The collateral can be received in the form of cash collateral and/or non-cash collateral. Non-cash collateral can include U.S. Government Securities and other securities as permitted by Securities and Exchange Commission ("SEC") guidelines. The cash collateral is invested in short-term instruments or cash equivalents, primarily open-end investment companies, as noted on the Fund's Schedule of Portfolio Investments. The Fund effectively does not have control of the non-cash collateral and therefore it is not disclosed on the Fund's Schedule of Portfolio Investments. Collateral requirements are determined daily based on the value of the Fund's securities on loan as of the end of the prior business day. During the time portfolio securities are on loan, the borrower will pay the Fund any dividends or interest paid on such securities plus any fee negotiated between the parties to the lending agreement. The Fund also earns a return from the collateral. The Fund pays Citibank various fees in connection with the investment of cash collateral and fees based on the investment income received from securities lending activities. Securities lending income (net of these fees) is disclosed on the Statement of Operations. Loans are terminable upon demand and the borrower must return the loaned securities within the lesser of one standard settlement period or five business days. Although risk is mitigated by the collateral, the Fund could experience a delay in recovering its securities and possible loss of income or value if the borrower fails to return them. In addition, there is a risk that the value of the short-term investments will be less than the amount of cash collateral required to be returned to the borrower.
The Fund's agreement with Citibank does not include master netting provisions. Non-cash collateral received by the Fund may not be sold or repledged, except to satisfy borrower default.
The following table is a summary of the Fund's securities lending transactions as of June 30, 2022.
Value of
Securities on Loan | | Non-Cash
Collateral | | Cash
Collateral | |
| $ | 823,027 | | | $ | — | | | $ | 868,671 | | |
18
Victory Variable Insurance Funds | | Notes to Financial Statements — continued
June 30, 2022 | |
(Unaudited)
Foreign Currency Translations:
The accounting records of the Fund are maintained in U.S. dollars. Investment securities and other assets and liabilities of the Fund denominated in a foreign currency are translated into U.S. dollars at current exchange rates. Purchases and sales of securities, income receipts and expense payments are translated into U.S. dollars at the exchange rates on the date of the transactions. The Fund does not isolate the portion of the results of operations resulting from changes in foreign exchange rates on investments from fluctuations arising from changes in market prices of securities held. Such fluctuations are disclosed as Net change in unrealized appreciation/depreciation on investment securities and foreign currency translations on the Statement of Operations. Any realized gains or losses from these fluctuations are disclosed as Net realized gains (losses) from investment securities and foreign currency transactions on the Statement of Operations.
Foreign Taxes:
The Fund may be subject to foreign taxes related to foreign income received (a portion of which may be reclaimable), capital gains on the sale of securities, and certain foreign currency transactions. All foreign taxes are recorded in accordance with the applicable regulations and rates that exist in the foreign jurisdictions in which the Fund invests.
Federal Income Taxes:
The Fund intends to continue to qualify as a regulated investment company by complying with the provisions available to certain investment companies, as defined in applicable sections of the Internal Revenue Code, and to make distributions of net investment income and net realized gains sufficient to relieve it from all, or substantially all, federal income taxes. Accordingly, no provision for federal income taxes is required in the financial statements. The Fund has a tax year end of December 31.
For the six months ended June 30, 2022, the Fund did not incur any income tax, interest, or penalties, and has recorded no liability for net unrecognized tax benefits relating to uncertain tax positions.
Management of the Fund has reviewed tax positions taken in tax years that remain subject to examination by all major tax jurisdictions, including federal (i.e., the last four tax years, which includes the current fiscal tax year end). Management believes that there is no tax liability resulting from unrecognized tax benefits related to uncertain tax positions taken.
Allocations:
Expenses directly attributable to the Fund are charged to the Fund, while expenses that are attributable to more than one fund in the Trust, or jointly with an affiliated trust, are allocated among the respective funds in the Trust and/or an affiliated trust based upon net assets or another appropriate basis.
3. Purchases and Sales:
Purchases and sales of securities (excluding securities maturing less than one year from acquisition) for the six months ended June 30, 2022, were as follows:
Excluding
U.S. Government Securities | |
Purchases | | Sales | |
$ | 8,623,728 | | | $ | 10,450,083 | | |
4. Fees and Transactions with Affiliates and Related Parties:
Investment Advisory Fees:
Investment advisory services are provided to the Fund by the Adviser, which is a New York corporation registered as an investment adviser with the SEC. The Adviser is an indirect wholly owned subsidiary of Victory Capital Holdings, Inc., a publicly traded Delaware corporation, and a wholly owned direct subsidiary of Victory Capital Operating, LLC.
19
Victory Variable Insurance Funds | | Notes to Financial Statements — continued
June 30, 2022 | |
(Unaudited)
Under the terms of the Investment Advisory Agreement, the Adviser is entitled to receive fees accrued daily and paid monthly at an annualized rate of 1.00% of the Fund's average daily net assets. Amounts incurred and paid to VCM for the six months ended June 30, 2022, are reflected on the Statement of Operations as Investment advisory fees.
Administration and Servicing Fees:
VCM also serves as the Fund's administrator and fund accountant. Under the Administration and Fund Accounting Agreement, VCM is entitled to receive fees based on a percentage of the average daily net assets of the Trust, Victory Portfolios and Victory Portfolios II. The tiered rates at which VCM is paid by the Funds are shown in the table below:
Net Assets | |
Up to $15 billion | | $15 billion – $30 billion | | Over $30 billion | |
| | 0.08 | %, plus | | | 0.05 | %, plus | | | 0.04 | % | |
Amounts incurred for the six months ended June 30, 2022, are reflected on the Statement of Operations as Administration fees.
Citi Fund Services Ohio, Inc. ("Citi"), an affiliate of Citibank, acts as sub-administrator and sub-fund accountant to the Fund pursuant to the Sub-Administration and Sub-Fund Accounting Services Agreement between VCM and Citi. VCM pays Citi a fee for providing these services. The Trust reimburses VCM and Citi for out-of-pocket expenses incurred in providing these services and certain other expenses specifically allocated to the Fund. Amounts incurred for the six months ended June 30, 2022, are reflected on the Statement of Operations as Sub-Administration fees.
The Fund (as part of the Trust) has entered into an agreement with the Adviser to provide compliance services, pursuant to which the Adviser furnishes its compliance personnel, including the services of the Chief Compliance Officer ("CCO"), and other resources reasonably necessary to provide the Trust with compliance oversight services related to the design, administration, and oversight of a compliance program for the Trust in accordance with Rule 38a-1 under the 1940 Act. The CCO is an employee of the Adviser, which pays the compensation of the CCO and support staff. The funds in the Trust, Victory Portfolios, Victory Portfolios II and USAA Mutual Funds (collectively, the "Victory Funds Complex"), in aggregate, compensate the Adviser for these services. Amounts incurred for the six months ended June 30, 2022, are reflected on the Statement of Operations as Compliance fees.
Transfer Agency Fees:
FIS Investor Services, LLC ("FIS") serves as the Fund's transfer agent. Under the Transfer Agent Agreement, the Trust pays FIS a fee for its services and reimburses FIS for all of their reasonable out-of-pocket expenses incurred in providing these services. Amounts incurred for the six months ended June 30, 2022, are reflected on the Statement of Operations as Transfer agent fees.
Distributor/Underwriting Services:
Victory Capital Services, Inc. (the "Distributor"), an affiliate of the Adviser, serves as Distributor for the continuous offering of the shares of the Fund pursuant to a Distribution Agreement between the Distributor and the Trust, and receives no fee or other compensation for these services.
Other Fees:
Citibank serves as the Fund's custodian. The Fund pays Citibank a fee for providing these services. Amounts incurred for the six months ended June 30, 2022, are reflected on the Statement of Operations as Custodian fees.
Sidley Austin LLP provides legal services to the Trust.
The Adviser has entered into an expense limitation agreement with the Fund until at least April 30, 2023. Under the terms of the agreement, the Adviser has agreed to waive fees or reimburse certain expenses to the extent that ordinary operating expenses incurred in any fiscal year exceed the expense limit for the Fund. Such excess amounts will be the liability of the Adviser. Acquired fund fees and
20
Victory Variable Insurance Funds | | Notes to Financial Statements — continued
June 30, 2022 | |
(Unaudited)
expenses, interest, taxes, brokerage commissions, other expenditures which are capitalized in accordance with GAAP, and other extraordinary expenses not incurred in the ordinary course of a Fund's business are excluded from the expense limits. As of June 30, 2022, the expense limit (excluding voluntary waivers) is 1.35%.
Under the terms of the expense limitation agreement, as amended May 1, 2022, the Fund has agreed to repay fees and expenses that were waived or reimbursed by the Adviser for a period of up to three years (thirty-six (36) months) after the waiver or reimbursement took place, subject to the lesser of any operating expense limits in effect at the time of: (a) the original waiver or expense reimbursement; or (b) the recoupment, after giving effect to the recoupment amount.
As of June 30, 2022, the following amounts are available to be repaid to the Adviser. The Fund has not recorded any amounts available to be repaid as a liability due to an assessment that such repayment is not probable at June 30, 2022.
Expires
2022 | | Expires
2023 | | Expires
2024 | | Expires
2025 | | Total | |
| $ | 22,632 | | | $ | 50,693 | | | $ | 78,687 | | | $ | 46,648 | | | $ | 198,660 | | |
The Adviser may voluntarily waive or reimburse additional fees to assist the Fund in maintaining competitive expense ratios. Voluntary waivers and reimbursements applicable to the Fund is not available to be recouped at a future time. There were no voluntary waivers or reimbursements for the six months ended June 30, 2022.
Certain officers and/or interested trustees of the Fund are also officers and/or employees of the Adviser, administrator, fund accountant, sub-administrator, sub-fund accountant, custodian, legal counsel, and Distributor.
5. Risks:
The Fund may be subject to other risks in addition to these identified risks.
Equity Risk — The value of the equity securities in which the Fund invests may decline in response to developments affecting individual companies and/or general economic conditions in the United States or abroad. A company's earnings or dividends may not increase as expected (or may decline) because of poor management, competitive pressures, reliance on particular suppliers or geographical regions, labor problems or shortages, corporate restructurings, fraudulent disclosures, man-made or natural disasters, military confrontations or wars, terrorism, public health crises, or other events, conditions and factors. Price changes may be temporary or last for extended periods.
Emerging Markets Risk — The risks related to investing in foreign securities are generally greater with respect to securities of companies that conduct their business activities in emerging markets or whose securities are traded principally in emerging markets. The risks of investing in emerging markets include the risks of illiquidity, increased price volatility, smaller market capitalizations, less government regulation, less extensive and less frequent accounting, financial and other reporting requirements, risk of loss resulting from problems in share registration and custody, substantial economic and political disruptions and the nationalization of foreign deposits or assets.
Market Risk — Overall market risks may affect the value of the Fund. Domestic and international factors such as political events, war, terrorism, trade disputes, inflation rates, interest rate levels and other fiscal and monetary policy changes, cybersecurity incidents, pandemics and other public health crises, sanctions against a particular foreign country, its nationals, businesses or industries and related geopolitical events, as well as environmental disasters such as earthquakes, fires, and floods or other catastrophes, may add to instability in global economies and markets generally, and may lead to increased market volatility. Global economies and financial markets are highly interconnected, which increases the possibility that conditions in one country or region might adversely affect issuers in another country or region. The impact of these and other factors may be short-term or may last for extended periods.
21
Victory Variable Insurance Funds | | Notes to Financial Statements — continued
June 30, 2022 | |
(Unaudited)
6. Borrowing and Interfund Lending:
Line of Credit:
The Victory Funds Complex participates in a short-term demand note "Line of Credit" agreement with Citibank. The Line of Credit agreement with Citibank was renewed on June 27, 2022, with a termination date of June 26, 2023. Under the agreement with Citibank, the Victory Funds Complex may borrow up to $600 million, of which $300 million is committed and $300 million is uncommitted. $40 million of the Line of Credit is reserved for use by the Victory Floating Rate Fund. another series of the Victory Funds Complex, with Victory Floating Rate Fund paying the related commitment fees for that amount. The purpose of the Line of Credit is to meet temporary or emergency cash needs. For the six months ended June 30, 2022, Citibank received an annual commitment fee of 0.15% on $300 million for providing the Line of Credit. Each fund in the Victory Funds Complex paid a pro-rata portion of the commitment fees plus any interest on amounts borrowed. For the period from January 1, 2022, through June 27, 2022, interest was based on the one-month London Interbank Offered Rate ("LIBOR") plus one percent. Effective with the renewal, for the period June 28, 2022, through June 30, 2022, interest was based on the one-month Secured Overnight Financing Rate (SOFR) plus 1.10 percent. Interest charged to the Fund during the period, if applicable, is reflected on the Statement of Operations under Line of credit fees.
The Fund had no borrowings under the Line of Credit agreement during the six months ended June 30, 2022.
Interfund Lending:
The Trust and the Adviser rely on an exemptive order granted by the SEC in March 2017 (the "Order"), permitting the establishment and operation of an Interfund Lending Facility (the "Facility"). The Facility allows the Fund to directly lend and borrow money to or from any other fund in the Victory Funds Complex that is permitted to participate in the Facility, relying upon the Order at rates beneficial to both the borrowing and lending funds. Advances under the Facility are allowed for temporary or emergency purposes, including the meeting of redemption requests that otherwise might require the untimely disposition of securities, and are subject to each fund's borrowing restrictions. The interfund loan rate is determined, as specified in the Order, by averaging the current repurchase agreement rate and the current bank loan rate. As a Borrower, interest charged to the Fund, if any, during the period, is reflected on the Statement of Operations under Interfund lending fees. As a Lender, interest earned by the Fund, if any, during the period, is reflected on the Statement of Operations under Interfund lending.
The Fund did not utilize or participate in the Facility during the six months ended June 30, 2022.
7. Federal Income Tax Information:
The Fund intends to distribute any net investment income annually. Distributable net realized gains, if any, are declared and paid at least annually.
The amounts of dividends from net investment income and distributions from net realized gains (collectively, distributions to shareholders) are determined in accordance with federal income tax regulations, which may differ from GAAP. To the extent these "book/tax" differences are permanent in nature (e.g., net operating loss and distribution reclassification), such amounts are reclassified within the components of net assets based on their federal tax-basis treatment; temporary differences (e.g., wash sales) do not require reclassification. To the extent dividends and distributions exceed net investment income and net realized gains for tax purposes, they are reported as distributions of capital. Net investment losses incurred by the Fund may be reclassified as an offset to capital on the accompanying Statement of Assets and Liabilities.
The tax character of current year distributions paid and the tax basis of the current components of accumulated earnings (loss) will be determined at the end of the current tax year ending December 31, 2022.
At the tax year ended December 31, 2021, the Fund had no capital loss carryforward for federal income tax purposes.
22
Victory Variable Insurance Funds | | Supplemental Information
June 30, 2022 | |
(Unaudited)
Proxy Voting and Portfolio Holdings Information
Proxy Voting:
Information regarding the policies and procedures the Fund uses to determine how to vote proxies relating to portfolio securities is available without charge, upon request, by calling 800-539-3863. The information is also included in the Fund's Statement of Additional Information, which is available on the SEC's website at www.sec.gov.
Information relating to how the Fund voted proxies relating to portfolio securities held during the most recent 12 months ended June 30 is available on the SEC's website at www.sec.gov.
Availability of Schedules of Portfolio Investments:
The Trust files a complete list of Schedules of Portfolio Investments with the SEC for the first and third quarter of each fiscal year on Form N-PORT. Forms N-PORT are available on the SEC's website at www.sec.gov.
Expense Example
As a shareholder of the Fund, you may incur two types of costs: (1) transaction costs and (2) ongoing costs, including management fees and other Fund expenses. These examples are intended to help you understand your ongoing costs (in dollars) of investing in the Fund and to compare these costs with the ongoing costs of investing in other mutual funds.
These examples are based on an investment of $1,000 invested at the beginning of the period and held for the entire period from January 1, 2022, through June 30, 2022.
The Actual Expense figures in the table below provide information about actual account values and actual expenses. You may use the information below, together with the amount you invested, to estimate the expenses that you paid over the period. Simply divide your account value by $1,000 (for example, an $8,600 account value divided by $1,000 = 8.6), then multiply the result by the number in the table under the heading entitled "Actual Expenses Paid During Period" to estimate the expenses you paid on your account during this period.
The Hypothetical Expense figures in the table below provide information about hypothetical account values and hypothetical expenses based on the Fund's actual expense ratio and an assumed rate of return of 5% per year before expenses, which is not the Fund's actual return. The hypothetical account values and expenses may not be used to estimate the actual ending account balance or expenses you paid for the period. You may use this information to compare this 5% hypothetical example with the 5% hypothetical examples that appear in shareholder reports of other funds.
Please note the expenses shown in the table below are meant to highlight your ongoing costs only and do not reflect any transactional costs. Therefore, the hypothetical expenses in the table are useful in comparing ongoing costs only and will not help you determine the relative total costs of owning different funds. In addition, if these transactional costs were included, your costs would have been higher.
Beginning
Account Value
1/1/22 | | Actual
Ending
Account Value
6/30/22 | | Hypothetical
Ending
Account Value
6/30/22 | | Actual
Expenses Paid
During Period
1/1/22-6/30/22* | | Hypothetical
Expenses Paid
During Period
1/1/22-6/30/22* | | Annualized
Expense Ratio
During Period
1/1/22-6/30/22 | |
| $ | 1,000.00 | | | $ | 809.90 | | | $ | 1,018.10 | | | $ | 6.06 | | | $ | 6.76 | | | | 1.35 | % | |
* Expenses are equal to the average account value multiplied by the Fund's annualized expense ratio multiplied by 181/365 (the number of days in the most recent fiscal half-year divided by the number of days in the fiscal year).
23
Victory Variable Insurance Funds | | Supplemental Information — continued
June 30, 2022 | |
(Unaudited)
Liquidity Risk Management Program:
The Victory Funds have adopted and implemented a written liquidity risk management program (the "LRMP") as required by Rule 22e-4 under the Investment Company Act of 1940, as amended. The LRMP is reasonably designed to assess and manage the Fund's liquidity risk, taking into consideration the Fund's investment strategy and the liquidity of its portfolio investments during normal and reasonably foreseeable stressed market conditions; its short- and long-term cash flow projections; and its cash holdings and access to other liquidity management tools such as available funding sources including the Victory Funds Complex Interfund Lending Facility and Line of Credit (discussed in the Notes to Financial Statements). The Victory Funds' Board of Trustees approved the appointment of the Fund's investment adviser, Victory Capital Management Inc. ("Victory Capital"), as the administrator of the LRMP.
Victory Capital manages liquidity risks associated with the Fund's investments by monitoring, among other things, cash and cash equivalents, any use of derivatives, the concentration of investments, the appropriateness of the Fund's investment strategy, and by classifying every Fund investment as either highly liquid, moderately liquid, less liquid, or illiquid on at least a monthly basis. To assist with the classification of Fund investments, Victory Capital has retained a third-party provider of liquidity evaluation services. This provider determines preliminary liquidity classifications for all portfolio holdings based upon portfolio-level data and certain assumptions provided by Victory Capital. Victory Capital reviews the preliminary liquidity classifications and, when appropriate, considers other information including input from the Fund's portfolio managers (including the portfolio managers employed by any investment sub-advisers) in determining final liquidity classifications.
At a meeting held on February 24, 2022, Victory Capital provided an oral and written report to the Trustees on the operation and effectiveness of the LRMP during the previous year. The report from Victory Capital concluded that the Fund did not experience any significant liquidity challenges during the covered period, and the Fund's LRMP is reasonably designed to assess and manage its liquidity risk. The report also concluded that the LRMP continues to operate adequately and effectively to enable Victory Capital to oversee and manage liquidity risk and ensure the Fund is able to meet redemption requests without significant dilution to the remaining investors' interest in the Fund. During the review period, the Fund's portfolio consisted primarily of highly liquid investments, which are defined as cash and any investments that the Fund reasonably expects to be converted to cash in current market conditions in three business days or less without significantly changing the market value of the investment. Therefore, the Fund has not adopted a highly liquid investment minimum. The Fund's investments were below the limitation on illiquid investments during the review period. Additionally, Victory Capital indicated that no events occurred that would require the filing of Form N-LIQUID and recommended no material changes to the LRMP.
24
Privacy Policy
Protecting the Privacy of Information
The Trust respects your right to privacy. We also know that you expect us to conduct and process your business in an accurate and efficient manner. To do so, we must collect and maintain certain personal information about you. This is the information we collect from you on applications or other forms, and from the transactions you make with us or third parties. It may include your name, address, social security number, account transactions and balances, and information about investment goals and risk tolerance.
We do not disclose any information about you or about former customers to anyone except as permitted or required by law. Specifically, we may disclose the information we collect to companies that perform services on our behalf, such as the transfer agent that processes shareholder accounts and printers and mailers that assist us in the distribution of investor materials. We may also disclose this information to companies that perform marketing services on our behalf. This allows us to continue to offer you Victory investment products and services that meet your investing needs, and to effect transactions that you request or authorize. These companies will use this information only in connection with the services for which we hired them. They are not permitted to use or share this information for any other purpose.
To protect your personal information internally, we permit access only by authorized employees and maintain physical, electronic, and procedural safeguards to guard your personal information.*
* You may have received communications regarding information about privacy policies from other financial institutions which gave you the opportunity to "opt-out" of certain information sharing with companies which are not affiliated with that financial institution. The Trust does not share information with other companies for purposes of marketing solicitations for products other than the Trust. Therefore, the Trust does not provide opt-out options to their shareholders.
Victory Funds
P.O. Box 182593
Columbus, Ohio 43218-2593

Visit our website at: | | Call Victory at: | |
www.vcm.com | | 800-539-FUND (800-539-3863) | |
VVIF-RS-SEMVIP-SAR (6/22)

June 30, 2022
Semi Annual Report
Victory Variable Insurance Funds
Victory High Yield VIP Series
www.vcm.com
News, Information And Education 24 Hours A Day, 7 Days A Week
The Victory Capital website gives fund shareholders, prospective shareholders, and investment professionals a convenient way to access fund information, get guidance, and track fund performance anywhere they can access the Internet. The site includes:
• Detailed performance records
• Daily share prices
• The latest fund news
• Investment resources to help you become a better investor
• A section dedicated to investment professionals
Whether you're a potential investor searching for the fund that matches your investment philosophy, a seasoned investor interested in planning tools, or an investment professional, www.vcm.com has what you seek. Visit us anytime. We're always open.
Victory Variable Insurance Funds
TABLE OF CONTENTS
Investment Objective & Portfolio Holdings | | | 3 | | |
Schedule of Portfolio Investments | | | 4 | | |
Financial Statements | |
Statement of Assets and Liabilities | | | 9 | | |
Statement of Operations | | | 10 | | |
Statements of Changes in Net Assets | | | 11 | | |
Financial Highlights | | | 12 | | |
Notes to Financial Statements | | | 14 | | |
Supplemental Information | | | 22 | | |
Proxy Voting and Portfolio Holdings Information | | | 22 | | |
Expense Example | | | 22 | | |
Liquidity Risk Management Program | | | 23 | | |
Privacy Policy (inside back cover) | | | |
1
The Fund is distributed by Victory Capital Services, Inc. Victory Capital Management Inc. is the investment adviser to the Fund and receives fees from the Fund for performing services for the Fund.
This report is not authorized for distribution to prospective investors unless preceded or accompanied by a current prospectus of the Fund.
For additional information about any Victory Fund, including fees, expenses, and risks, view our prospectus online at vcm.com or call 800-539-3863. Read it carefully before you invest or send money.
The information in this report is based on data obtained from recognized services and sources and is believed to be reliable. Any opinions, projections, or recommendations in this report are subject to change without notice and are not intended as individual investment advice. Past investment performance of the Fund, markets or securities mentioned herein should not be considered to be indicative of future results.
• NOT FDIC INSURED • NO BANK GUARANTEE • MAY LOSE VALUE

Call Victory at:
800-539-FUND (800-539-3863)
Visit our website at:
www.vcm.com
2
Victory Variable Insurance Funds
Victory High Yield VIP Series | | June 30, 2022 | |
(Unaudited)
Investment Objective and Portfolio Holdings:
The Fund seeks to provide current income. Capital appreciation is a secondary objective.
Asset Allocation*:
June 30, 2022
(% of Net Assets)
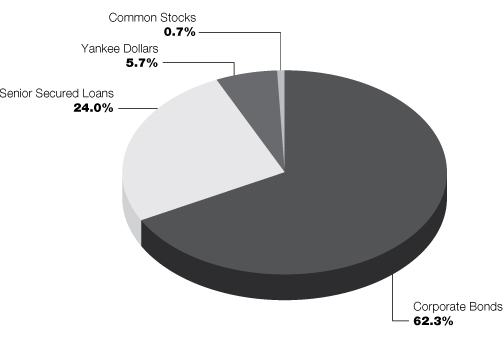
* Does not include futures contracts, money market instruments, and short-term investments purchased with cash collateral from securities loaned.
Percentages are of the net assets of the Fund and may not equal 100%.
Refer to the Schedule of Portfolio Investments for a complete list of securities.
3
Victory Variable Insurance Funds
Victory High Yield VIP Series | | Schedule of Portfolio Investments
June 30, 2022 | |
(Unaudited)
Security Description | | Shares or
Principal
Amount | | Value | |
Common Stocks (0.7%) | |
Communication Services (0.6%): | |
Altice USA, Inc., Class A (a) | | | 4,380 | | | $ | 40,515 | | |
iHeartMedia, Inc., Class A (a) | | | 3,500 | | | | 27,615 | | |
Nexstar Media Group, Inc., Class A | | | 167 | | | | 27,201 | | |
Sinclair Broadcast Group, Inc., Class A | | | 1,800 | | | | 36,720 | | |
| | | | 132,051 | | |
Health Care (0.1%): | |
Surgery Partners, Inc. (a) | | | 939 | | | | 27,156 | | |
Total Common Stocks (Cost $183,979) | | | 159,207 | | |
Senior Secured Loans (24.0%) | |
19th Holdings Golf LLC, Initial Term Loans, First Lien, 4.49%
(SOFR01M+325bps), 1/27/29 (b) | | $ | 250,000 | | | | 236,250 | | |
Air Medical Group Holdings, Inc., Incremental Term Loan B, First Lien, 5.31%
(LIBOR01M+425bps), 3/14/25 (b) | | | 496,141 | | | | 460,483 | | |
Bausch Health Cos., Inc., Term B, First Lien, 6.45% (SOFR01M+525bps),
1/27/27 (b) | | | 250,000 | | | | 213,722 | | |
Caesars Resort Collection LLC, Term B-1 Loans, First Lien, 4.56%
(LIBOR01M+350bps), 6/19/25 (b) | | | 245,625 | | | | 236,230 | | |
Chariot Buyer LLC, Initial Term Loans, First Lien, 4.51% (LIBOR03M+350bps),
11/3/28 (b) | | | 199,000 | | | | 179,265 | | |
Covis Pharma Holdings S.a.r.l., Dollar Term B Loans, First Lien, 7.30%
(SOFR03M+650bps), 2/14/27 (b) | | | 246,875 | | | | 204,906 | | |
Dayco Products LLC, Term Loans, First Lien, 5.82% (LIBOR03M+425bps),
5/19/24 (b) | | | 475,000 | | | | 429,704 | | |
Diamond Sports Group LLC, Term Loan, Second Lien, 4.43% (SOFR01M+325bps),
8/24/26 (b) | | | 422,875 | | | | 98,669 | | |
Diamond Sports Group LLC, Term Loan, First Lien, 9.18% (SOFR01M+800bps),
5/25/26 (b) | | | 37,849 | | | | 37,596 | | |
Envision Healthcare Corp., Initial Term Loans, First Lien, 4.81%
(LIBOR01M+375bps), 10/10/25 (b) | | | 248,443 | | | | 81,738 | | |
Great Outdoors Group LLC, Term B1, First Lien, 4.81% (LIBOR01M+375bps),
3/5/28 (b) | | | 246,264 | | | | 223,854 | | |
Intelsat Jackson Holdings SA, Term B Loan, First Lien, 4.67% (SOFR06M+425bps),
2/1/29 (b) | | | 308,848 | | | | 282,541 | | |
Jo-Ann Stores LLC, Term B-1 Loan, First Lien, 5.96% (LIBOR03M+475bps),
6/30/28 (b) | | | 248,125 | | | | 172,447 | | |
Knight Health Holdings LLC, Term B Loans, First Lien, 6.31% (LIBOR01M+525bps),
12/17/28 (b) | | | 497,500 | | | | 407,950 | | |
Life Time, Inc., 2021 Refinancing Term Loan, First Lien, 6.32% (LIBOR03M+475bps),
12/15/24 (b) | | | 80,478 | | | | 79,271 | | |
LifeScan Global Corp., Initial Term Loan, First Lien, 6.96% (LIBOR03M+600bps),
10/1/24 (b) | | | 377,500 | | | | 327,795 | | |
Lucid Energy Group II Borrower LLC, Term Loan, First Lien, 5.87%
(LIBOR01M+425bps), 11/24/28 (b) | | | 497,500 | | | | 490,217 | | |
Petco Health and Wellness Co., Inc., Initial Term Loans, First Lien, 4.26%
(LIBOR03M+325bps), 2/25/28 (b) | | | 395,000 | | | | 371,486 | | |
See notes to financial statements.
4
Victory Variable Insurance Funds
Victory High Yield VIP Series | | Schedule of Portfolio Investments — continued
June 30, 2022 | |
(Unaudited)
Security Description | | Principal
Amount | | Value | |
PetSmart, Inc., Initial Term Loans, First Lien, 4.50% (LIBOR06M+375bps),
2/12/28 (b) | | $ | 74,438 | | | $ | 69,860 | | |
Radiology Partners, Inc., Term Loan New, First Lien, 5.89% (LIBOR01M+425bps),
7/9/25 (b) | | | 250,000 | | | | 223,375 | | |
SWF Holdings Corp., Initial Term Loans, First Lien, 5.60% (LIBOR01M+400bps),
10/6/28 (b) | | | 399,000 | | | | 326,681 | | |
The Michaels Cos., Inc., Term B Loans, First Lien, 5.26% (LIBOR03M+425bps),
4/15/28 (b) | | | 297,000 | | | | 243,870 | | |
United Airlines, Inc., Class B Term Loans, First Lien, 5.39% (LIBOR01M+375bps),
4/21/28 (b) | | | 172,813 | | | | 160,176 | | |
Total Senior Secured Loans (Cost $6,325,693) | | | 5,558,086 | | |
Corporate Bonds (62.3%) | |
Communication Services (9.9%): | |
CSC Holdings LLC, 5.75%, 1/15/30, Callable 1/15/25 @ 102.88 (c) | | | 250,000 | | | | 181,880 | | |
Cumulus Media New Holdings, Inc., 6.75%, 7/1/26, Callable 8/8/22 @ 103.38 (c) (d) | | | 452,000 | | | | 416,572 | | |
Entercom Media Corp., 6.75%, 3/31/29, Callable 3/31/24 @ 103.38 (c) | | | 200,000 | | | | 106,924 | | |
Gray Television, Inc., 4.75%, 10/15/30, Callable 10/15/25 @ 102.38 (c) | | | 250,000 | | | | 195,698 | | |
iHeartCommunications, Inc., 8.38%, 5/1/27, Callable 7/22/22 @ 104.19 (d) | | | 350,000 | | | | 279,685 | | |
Nexstar Broadcasting, Inc., 5.63%, 7/15/27, Callable 7/18/22 @ 104.22 (c) | | | 500,000 | | | | 461,625 | | |
Sinclair Television Group, Inc., 5.50%, 3/1/30, Callable 12/1/24 @ 102.75 (c) (d) | | | 250,000 | | | | 185,017 | | |
TEGNA, Inc., 5.00%, 9/15/29, Callable 9/15/24 @ 102.5 (d) | | | 500,000 | | | | 472,855 | | |
| | | | 2,300,256 | | |
Consumer Discretionary (15.0%): | |
Academy Ltd., 6.00%, 11/15/27, Callable 11/15/23 @ 103 (c) | | | 200,000 | | | | 182,666 | | |
Affinity Gaming, 6.88%, 12/15/27, Callable 12/1/23 @ 103.44 (c) | | | 250,000 | | | | 210,202 | | |
American Axle & Manufacturing, Inc., 5.00%, 10/1/29,
Callable 10/1/24 @ 102.5 (d) | | | 500,000 | | | | 400,450 | | |
Beazer Homes USA, Inc., 5.88%, 10/15/27, Callable 10/15/22 @ 102.94 | | | 400,000 | | | | 316,040 | | |
Ford Motor Co., 9.00%, 4/22/25, Callable 3/22/25 @ 100 | | | 250,000 | | | | 268,062 | | |
LBM Acquisition LLC, 6.25%, 1/15/29, Callable 1/15/24 @ 103.13 (c) | | | 200,000 | | | | 127,880 | | |
Life Time, Inc., 5.75%, 1/15/26, Callable 1/15/23 @ 102.88 (c) | | | 250,000 | | | | 224,668 | | |
MGM Resorts International, 5.50%, 4/15/27, Callable 1/15/27 @ 100 | | | 250,000 | | | | 225,625 | | |
MIWD Holdco II LLC/MIWD Finance Corp., 5.50%, 2/1/30,
Callable 2/1/25 @ 102.75 (c) | | | 100,000 | | | | 82,798 | | |
Panther BF Aggregator 2 LP/Panther Finance Co., Inc., 8.50%, 5/15/27,
Callable 8/8/22 @ 104.25 (c) | | | 500,000 | | | | 483,655 | | |
Premier Entertainment Sub LLC/Premier Entertainment Finance Corp.
5.63%, 9/1/29, Callable 9/1/24 @ 102.81 (c) | | | 200,000 | | | | 142,724 | | |
5.88%, 9/1/31, Callable 9/1/26 @ 102.98 (c) | | | 400,000 | | | | 277,468 | | |
Scientific Games Holdings LP/Scientific Games US FinCo., Inc., 6.63%, 3/1/30,
Callable 3/1/25 @ 103.31 (c) | | | 250,000 | | | | 212,618 | | |
Viking Cruises Ltd., 13.00%, 5/15/25, Callable 7/22/22 @ 109.75 (c) | | | 300,000 | | | | 307,782 | | |
| | | | 3,462,638 | | |
Consumer Staples (0.8%): | |
Simmons Foods, Inc./Simmons prepared Foods, Inc./Simmons Pet Food, Inc./
Simmons Feed, 4.63%, 3/1/29, Callable 3/1/24 @ 102.31 (c) | | | 50,000 | | | | 42,260 | | |
Triton Water Holdings, Inc., 6.25%, 4/1/29, Callable 4/1/24 @ 103.13 (c) | | | 200,000 | | | | 142,144 | | |
| | | | 184,404 | | |
See notes to financial statements.
5
Victory Variable Insurance Funds
Victory High Yield VIP Series | | Schedule of Portfolio Investments — continued
June 30, 2022 | |
(Unaudited)
Security Description | | Principal
Amount | | Value | |
Energy (7.7%): | |
Antero Midstream Partners LP/Antero Midstream Finance Corp.,
5.38%, 6/15/29, Callable 6/15/24 @ 102.69 (c) | | $ | 50,000 | | | $ | 44,840 | | |
Antero Resources Corp.
8.38%, 7/15/26, Callable 1/15/24 @ 104.19 (c) | | | 162,000 | | | | 171,245 | | |
7.63%, 2/1/29, Callable 2/1/24 @ 103.81 (c) | | | 84,000 | | | | 85,749 | | |
CITGO Holding, Inc., 9.25%, 8/1/24, Callable 8/8/22 @ 102.31 (c) (d) | | | 500,000 | | | | 486,595 | | |
CITGO Petroleum Corp., 7.00%, 6/15/25, Callable 8/8/22 @ 103.5 (c) | | | 250,000 | | | | 241,888 | | |
Comstock Resources, Inc., 6.75%, 3/1/29, Callable 3/1/24 @ 103.38 (c) | | | 250,000 | | | | 224,488 | | |
PBF Holding Co. LLC/PBF Finance Corp.
9.25%, 5/15/25, Callable 7/11/22 @ 104.63 (c) | | | 200,000 | | | | 209,470 | | |
6.00%, 2/15/28, Callable 2/15/23 @ 103 | | | 250,000 | | | | 211,877 | | |
Range Resources Corp., 5.00%, 3/15/23, Callable 12/15/22 @ 100 | | | 100,000 | | | | 99,255 | | |
| | | | 1,775,407 | | |
Financials (4.6%): | |
AmWINS Group, Inc., 4.88%, 6/30/29, Callable 6/30/24 @ 102.44 (c) | | | 150,000 | | | | 123,866 | | |
BCPE Ulysses Intermediate, Inc., 7.75%, 4/1/27, Callable 4/1/23 @ 102 (c) | | | 50,000 | | | | 30,755 | | |
Compass Group Diversified Holdings LLC, 5.25%, 4/15/29,
Callable 4/15/24 @ 102.63 (c) | | | 200,000 | | | | 165,676 | | |
Gray Escrow II, Inc., 5.38%, 11/15/31, Callable 11/15/26 @ 102.69 (c) (d) | | | 125,000 | | | | 100,131 | | |
Gray Television, Inc., 7.00%, 5/15/27, Callable 7/18/22 @ 105.25 (c) (d) | | | 250,000 | | | | 240,915 | | |
SWF Escrow Issuer Corp., 6.50%, 10/1/29, Callable 10/1/24 @ 103.25 (c) | | | 50,000 | | | | 34,923 | | |
U.S. Renal Care, Inc., 10.63%, 7/15/27, Callable 8/8/22 @ 105.31 (c) | | | 300,000 | | | | 116,250 | | |
Victors Merger Corp., 6.38%, 5/15/29, Callable 5/15/24 @ 103.19 (c) (d) | | | 200,000 | | | | 125,810 | | |
White Capital Parent LLC, 8.25%, 3/15/26, Callable 8/8/22 @ 102 (c) | | | 150,000 | | | | 126,207 | | |
| | | | 1,064,533 | | |
Health Care (6.1%): | |
Air Methods Corp., 8.00%, 5/15/25, Callable 8/8/22 @ 100 (c) (d) | | | 350,000 | | | | 229,050 | | |
CHS/Community Health Systems, Inc., 6.13%, 4/1/30,
Callable 4/1/25 @ 103.06 (c) (d) | | | 300,000 | | | | 183,237 | | |
LifePoint Health, Inc., 5.38%, 1/15/29, Callable 1/15/24 @ 102.69 (c) | | | 350,000 | | | | 257,026 | | |
Radiology Partners, Inc., 9.25%, 2/1/28, Callable 2/1/23 @ 104.63 (c) | | | 300,000 | | | | 225,456 | | |
Team Health Holdings, Inc., 6.38%, 2/1/25, Callable 7/22/22 @ 100 (c) | | | 350,000 | | | | 246,603 | | |
Tenet Healthcare Corp., 6.13%, 10/1/28, Callable 10/1/23 @ 103.06 (c) | | | 300,000 | | | | 258,147 | | |
| | | | 1,399,519 | | |
Industrials (13.3%): | |
Ahern Rentals, Inc., 7.38%, 5/15/23, Callable 8/8/22 @ 100 (c) | | | 425,000 | | | | 328,159 | | |
American Airlines, Inc., 11.75%, 7/15/25 (c) | | | 250,000 | | | | 258,748 | | |
American Airlines, Inc./AAdvantage Loyalty IP Ltd., 5.75%, 4/20/29 (c) | | | 150,000 | | | | 128,070 | | |
Aramark Services, Inc., 6.38%, 5/1/25, Callable 8/8/22 @ 103.19 (c) | | | 250,000 | | | | 244,850 | | |
Madison IAQ LLC, 5.88%, 6/30/29, Callable 6/30/24 @ 102.94 (c) | | | 200,000 | | | | 152,546 | | |
Mileage Plus Holdings LLC/Mileage Plus Intellectual Property Assets Ltd.,
6.50%, 6/20/27, Callable 6/30/23 @ 103.25 (c) | | | 250,000 | | | | 245,527 | | |
NESCO Holdings II, Inc., 5.50%, 4/15/29, Callable 4/15/24 @ 102.75 (c) | | | 100,000 | | | | 84,084 | | |
Pike Corp., 5.50%, 9/1/28, Callable 9/1/23 @ 102.75 (c) | | | 500,000 | | | | 400,080 | | |
SRS Distribution, Inc., 6.13%, 7/1/29, Callable 7/1/24 @ 103.06 (c) | | | 125,000 | | | | 98,508 | | |
The Hertz Corp., 5.00%, 12/1/29, Callable 12/1/24 @ 102.5 (c) | | | 500,000 | | | | 385,120 | | |
TransDigm, Inc., 4.63%, 1/15/29, Callable 1/15/24 @ 102.31 | | | 325,000 | | | | 261,648 | | |
See notes to financial statements.
6
Victory Variable Insurance Funds
Victory High Yield VIP Series | | Schedule of Portfolio Investments — continued
June 30, 2022 | |
(Unaudited)
Security Description | | Shares or
Principal
Amount | | Value | |
Triumph Group, Inc., 6.25%, 9/15/24, Callable 8/8/22 @ 101.56 (c) | | $ | 175,000 | | | $ | 156,361 | | |
Wabash National Corp., 4.50%, 10/15/28, Callable 10/15/24 @ 102.25 (c) | | | 100,000 | | | | 77,944 | | |
WESCO Distribution, Inc., 7.25%, 6/15/28, Callable 6/15/23 @ 103.63 (c) | | | 250,000 | | | | 247,182 | | |
| | | | 3,068,827 | | |
Information Technology (1.6%): | |
Black Knight Infoserv LLC, 3.63%, 9/1/28, Callable 9/1/23 @ 101.81 (c) | | | 150,000 | | | | 130,269 | | |
Caesars Entertainment, Inc., 8.13%, 7/1/27, Callable 7/1/23 @ 104.06 (c) | | | 250,000 | | | | 241,065 | | |
| | | | 371,334 | | |
Materials (2.5%): | |
Allegheny Technologies, Inc., 5.13%, 10/1/31, Callable 10/1/26 @ 102.56 | | | 250,000 | | | | 196,035 | | |
CVR Partners LP/CVR Nitrogen Finance Corp., 6.13%, 6/15/28,
Callable 6/15/24 @ 103.06 (c) | | | 200,000 | | | | 183,174 | | |
Midas OpCo Holdings LLC, 5.63%, 8/15/29, Callable 8/15/24 @ 102.81 (c) | | | 250,000 | | | | 200,530 | | |
| | | | 579,739 | | |
Real Estate (0.8%): | |
Adams Homes, Inc., 7.50%, 2/15/25, Callable 7/22/22 @ 103.75 (c) | | | 200,000 | | | | 188,986 | | |
Total Corporate Bonds (Cost $17,140,234) | | | 14,395,643 | | |
Yankee Dollars (5.7%) | |
Communication Services (1.1%): | |
Telesat Canada/Telesat LLC, 5.63%, 12/6/26, Callable 12/6/23 @ 102.81 (c) | | | 400,000 | | | | 249,064 | | |
Energy (0.8%): | |
TechnipFMC PLC, 6.50%, 2/1/26, Callable 2/1/23 @ 103.25 (c) (d) | | | 200,000 | | | | 199,002 | | |
Industrials (1.8%): | |
Bombardier, Inc., 7.88%, 4/15/27, Callable 8/8/22 @ 103.94 (c) (d) | | | 400,000 | | | | 332,928 | | |
VistaJet Malta Finance PLC/XO Management Holding, Inc., 6.38%, 2/1/30,
Callable 2/1/25 @ 103.19 (c) (d) | | | 100,000 | | | | 80,043 | | |
| | | | 412,971 | | |
Information Technology (0.7%): | |
ION Trading Technologies Sarl, 5.75%, 5/15/28, Callable 5/15/24 @ 102.88 (c) | | | 200,000 | | | | 159,108 | | |
Materials (1.3%): | |
Titan Acquisition Ltd./Titan Co-Borrower LLC, 7.75%, 4/15/26,
Callable 8/8/22 @ 101.94 (c) | | | 250,000 | | | | 230,842 | | |
Trinseo Materials Operating SCA/Trinseo Materials Finance, Inc., 5.13%, 4/1/29,
Callable 4/1/24 @ 102.56 (c) | | | 100,000 | | | | 72,178 | | |
| | | | 303,020 | | |
Total Yankee Dollars (Cost $1,597,293) | | | 1,323,165 | | |
Collateral for Securities Loaned (11.2%)^ | |
BlackRock Liquidity Funds TempFund, Institutional Shares, 1.47% (e) | | | 80,499 | | | | 80,499 | | |
Goldman Sachs Financial Square Prime Obligations Fund, Institutional Shares,
1.42% (e) | | | 40,173 | | | | 40,173 | | |
HSBC U.S. Government Money Market Fund, I Shares, 1.46% (e) | | | 501,037 | | | | 501,037 | | |
JPMorgan Prime Money Market Fund, Capital Shares, 1.50% (e) | | | 320,326 | | | | 320,326 | | |
See notes to financial statements.
7
Victory Variable Insurance Funds
Victory High Yield VIP Series | | Schedule of Portfolio Investments — continued
June 30, 2022 | |
(Unaudited)
Security Description | | Shares | | Value | |
Morgan Stanley Institutional Liquidity Government Portfolio, Institutional Shares,
1.39% (e) | | | 213,621 | | | $ | 213,621 | | |
Morgan Stanley Institutional Liquidity Prime Portfolio, Institutional Shares,
1.53% (e) | | | 1,440,249 | | | | 1,440,249 | | |
Total Collateral for Securities Loaned (Cost $2,595,905) | | | 2,595,905 | | |
Total Investments (Cost $27,843,104) — 103.9% | | | 24,032,006 | | |
Liabilities in excess of other assets — (3.9)% | | | (911,553 | ) | |
NET ASSETS — 100.00% | | $ | 23,120,453 | | |
^ Purchased with cash collateral from securities on loan.
(a) Non-income producing security.
(b) Variable or Floating-Rate Security. Rate disclosed is as of June 30, 2022.
(c) Rule 144A security or other security that is restricted as to resale to institutional investors. The Fund's Adviser has deemed this security to be liquid (unless otherwise noted as illiquid) based upon procedures approved by the Board of Trustees. As of June 30, 2022, the fair value of these securities was $12,987,276 and amounted to 56.2% of net assets.
(d) All or a portion of this security is on loan.
(e) Rate disclosed is the daily yield on June 30, 2022.
bps — Basis points
LIBOR — London InterBank Offered Rate
LIBOR01M — 1 Month US Dollar LIBOR, rate disclosed as of June 30, 2022, based on the last reset date of the security
LIBOR03M — 3 Month US Dollar LIBOR, rate disclosed as of June 30, 2022, based on the last reset date of the security
LIBOR06M — 6 Month US Dollar LIBOR, rate disclosed as of June 30, 2022, based on the last reset date of the security
LLC — Limited Liability Company
LP — Limited Partnership
PLC — Public Limited Company
SOFR — Secured Overnight Financing Rate
SOFR01M — 1 Month SOFR, rate disclosed as of June 30, 2022
SOFR03M — 3 Month SOFR, rate disclosed as of June 30, 2022
SOFR06M — 6 Month SOFR, rate disclosed as of June 30, 2022
See notes to financial statements.
8
Victory Variable Insurance Funds | | Statement of Assets and Liabilities
June 30, 2022 | |
(Unaudited)
| | | Victory High Yield
VIP Series | |
Assets: | |
Investments, at value (Cost $27,843,104) | | $ | 24,032,006 | (a) | |
Cash | | | 1,330,510 | | |
Receivables: | |
Interest and dividends | | | 375,500 | | |
Investments sold | | | 57,950 | | |
From Adviser | | | 4,708 | | |
Prepaid expenses | | | 177 | | |
Total Assets | | | 25,800,851 | | |
Liabilities: | |
Payables: | |
Collateral received on loaned securities | | | 2,595,905 | | |
Investments purchased | | | 50,000 | | |
Capital shares redeemed | | | 1,924 | | |
Accrued expenses and other payables: | |
Investment advisory fees | | | 11,951 | | |
Administration fees | | | 1,277 | | |
Custodian fees | | | 1,426 | | |
Transfer agent fees | | | 7,823 | | |
Compliance fees | | | 15 | | |
Other accrued expenses | | | 10,077 | | |
Total Liabilities | | | 2,680,398 | | |
Net Assets: | |
Capital | | | 27,836,257 | | |
Total accumulated earnings/(loss) | | | (4,715,804 | ) | |
Net Assets | | $ | 23,120,453 | | |
Shares (unlimited shares authorized with a par
value of $0.001 per share): | | | 3,638,195 | | |
Net asset value: | | $ | 6.35 | | |
(a) Includes $2,464,704 of securities on loan.
See notes to financial statements.
9
Victory Variable Insurance Funds | | Statement of Operations
For the Six Months Ended June 30, 2022 | |
(Unaudited)
| | | Victory High Yield
VIP Series | |
Investment Income: | |
Dividends | | $ | 2,793 | | |
Interest | | | 902,648 | | |
Securities lending (net of fees) | | | 10,657 | | |
Total Income | | | 916,098 | | |
Expenses: | |
Investment advisory fees | | | 80,397 | | |
Administration fees | | | 7,240 | | |
Sub-Administration fees | | | 8,430 | | |
Custodian fees | | | 4,432 | | |
Transfer agent fees | | | 15,926 | | |
Trustees' fees | | | 1,331 | | |
Compliance fees | | | 97 | | |
Legal and audit fees | | | 6,708 | | |
Other expenses | | | 7,883 | | |
Total Expenses | | | 132,444 | | |
Expenses waived/reimbursed by Adviser | | | (13,353 | ) | |
Net Expenses | | | 119,091 | | |
Net Investment Income (Loss) | | | 797,007 | | |
Realized/Unrealized Gains (Losses) from Investments: | |
Net realized gains (losses) from investment securities | | | (430,865 | ) | |
Net change in unrealized appreciation/depreciation on investment securities | | | (4,304,848 | ) | |
Net realized/unrealized gains (losses) on investments | | | (4,735,713 | ) | |
Change in net assets resulting from operations | | $ | (3,938,706 | ) | |
See notes to financial statements.
10
Victory Variable Insurance Funds | | Statements of Changes in Net Assets | |
| | | Victory High Yield VIP Series | |
| | | Six Months
Ended
June 30,
2022
(Unaudited) | | Year
Ended
December 31,
2021 | |
From Investment Activities: | |
Operations: | |
Net investment income (loss) | | $ | 797,007 | | | $ | 1,622,349 | | |
Net realized gains (losses) | | | (430,865 | ) | | | 719,581 | | |
Net change in unrealized appreciation/depreciation | | | (4,304,848 | ) | | | (602,913 | ) | |
Change in net assets resulting from operations | | | (3,938,706 | ) | | | 1,739,017 | | |
Change in net assets resulting from distributions to shareholders | | | — | | | | (1,738,466 | ) | |
Change in net assets resulting from capital transactions | | | (2,956,872 | ) | | | (103,585 | ) | |
Change in net assets | | | (6,895,578 | ) | | | (103,034 | ) | |
Net Assets: | |
Beginning of period | | | 30,016,031 | | | | 30,119,065 | | |
End of period | | $ | 23,120,453 | | | $ | 30,016,031 | | |
Capital Transactions: | |
Proceeds from shares issued | | | 213,384 | | | | 3,641,373 | | |
Distributions reinvested | | | — | | | | 1,738,466 | | |
Cost of shares redeemed | | | (3,170,256 | ) | | | (5,483,424 | ) | |
Change in net assets resulting from capital transactions | | | (2,956,872 | ) | | | (103,585 | ) | |
Share Transactions: | |
Issued | | | 29,915 | | | | 473,954 | | |
Reinvested | | | — | | | | 235,884 | | |
Redeemed | | | (450,580 | ) | | | (711,051 | ) | |
Change in Shares | | | (420,665 | ) | | | (1,213 | ) | |
See notes to financial statements.
11
Victory Variable Insurance Funds | | Financial Highlights | |
For a Share Outstanding Throughout Each Period
| | | | | Investment Activities | | Distributions to
Shareholders From | |
| | | Net Asset
Value,
Beginning of
Period | | Net
Investment
Income
(Loss)(a) | | Net
Realized and
Unrealized
Gains
(Losses) on
Investments | | Total from
Investment
Activities | | Net
Investment
Income | | Total
Distributions | |
Victory High Yield VIP Series | | | |
Six Months Ended
June 30, 2022
(Unaudited) | | $ | 7.40 | | | | 0.21 | | | | (1.26 | ) | | | (1.05 | ) | | | — | | | | — | | |
Year Ended December 31:
2021 | | $ | 7.42 | | | | 0.40 | | | | 0.03 | | | | 0.43 | | | | (0.45 | ) | | | (0.45 | ) | |
2020 | | $ | 7.36 | | | | 0.44 | | | | 0.14 | | | | 0.58 | | | | (0.52 | ) | | | (0.52 | ) | |
2019 | | $ | 6.84 | | | | 0.47 | | | | 0.62 | | | | 1.09 | | | | (0.57 | ) | | | (0.57 | ) | |
2018 | | $ | 6.86 | | | | 0.45 | | | | (0.43 | ) | | | 0.02 | | | | (0.04 | ) | | | (0.04 | ) | |
2017 | | $ | 6.63 | | | | 0.42 | | | | 0.24 | | | | 0.66 | | | | (0.43 | ) | | | (0.43 | ) | |
(a) Per share net investment income (loss) has been calculated using the average daily shares method.
(b) Not annualized for periods less than one year.
(c) Total returns do not reflect the effects of charges deducted pursuant to the terms of The Guardian Insurance & Annuity Company, Inc.'s variable contracts. Inclusion of such charges would reduce the total returns for all periods shown.
(d) Annualized for periods less than one year.
(e) Does not include acquired fund fees and expenses, if any.
See notes to financial statements.
12
Victory Variable Insurance Funds | | Financial Highlights — continued | |
For a Share Outstanding Throughout Each Period
| | | | | Ratios to Average Net Assets | | Supplemental Data | |
| | | Net Asset
Value,
End of
Period | | Total
Return(b)(c) | | Net
Expenses(d)(e) | | Net
Investment
Income
(Loss)(d) | | Gross
Expenses(d)(e) | | Net Assets,
End of
Period
(000's) | | Portfolio
Turnover(b) | |
Victory High Yield VIP Series | |
Six Months Ended
June 30, 2022
(Unaudited) | | $ | 6.35 | | | | (14.19 | )% | | | 0.89 | % | | | 5.96 | % | | | 0.99 | % | | $ | 23,120 | | | | 22 | % | |
Year Ended December 31:
2021 | | $ | 7.40 | | | | 5.85 | % | | | 0.89 | % | | | 5.21 | % | | | 0.99 | % | | $ | 30,016 | | | | 75 | % | |
2020 | | $ | 7.42 | | | | 7.92 | % | | | 0.89 | % | | | 6.10 | % | | | 1.04 | % | | $ | 30,119 | | | | 91 | % | |
2019 | | $ | 7.36 | | | | 15.89 | % | | | 0.89 | % | | | 6.22 | % | | | 0.99 | % | | $ | 30,739 | | | | 60 | % | |
2018 | | $ | 6.84 | | | | 0.29 | % | | | 0.83 | % | | | 6.38 | % | | | 0.83 | % | | $ | 30,918 | | | | 94 | % | |
2017 | | $ | 6.86 | | | | 9.94 | % | | | 0.79 | % | | | 6.02 | % | | | 0.79 | % | | $ | 37,411 | | | | 173 | % | |
See notes to financial statements.
13
Victory Variable Insurance Funds | | Notes to Financial Statements
June 30, 2022 | |
(Unaudited)
1. Organization:
Victory Variable Insurance Funds (the "Trust") is organized as a Delaware statutory trust and the Trust is registered under the Investment Company Act of 1940, as amended (the "1940 Act"), as an open-end investment company. The Trust is comprised of six funds and is authorized to issue an unlimited number of shares, which are units of beneficial interest with a par value of $0.001 per share.
The accompanying financial statements are those of the High Yield VIP Series (the "Fund"), a series of the Trust. The Fund offers a single class of shares: Class I. The Fund's shares are only available for purchase by certain separate accounts of insurance companies as investments for certain variable annuity plans and variable life insurance contracts issued by those insurance companies. The Fund is classified as diversified under the 1940 Act.
Under the Trust's organizational documents, its officers and trustees are indemnified against certain liabilities arising out of the performance of their duties to the Fund. In addition, in the normal course of business, the Fund enters into contracts with its vendors and others that provide for general indemnifications. The Fund's maximum exposure under these arrangements is unknown, as this would involve future claims that may be made against the Fund. However, based on experience, the Fund expects that risk of loss to be remote.
2. Significant Accounting Policies:
The following is a summary of significant accounting policies followed by the Trust in the preparation of its financial statements. The policies are in conformity with U.S. Generally Accepted Accounting Principles ("GAAP"). The preparation of financial statements in accordance with GAAP requires management to make estimates and assumptions that affect the reported amounts of assets and liabilities and disclosure of contingent assets and liabilities at the date of the financial statements and the reported amounts of income and expenses for the period. Actual results could differ from those estimates. The Fund follows the specialized accounting and reporting requirements under GAAP that are applicable to investment companies under Accounting Standards Codification Topic 946.
Investment Valuation:
The Fund records investments at fair value. Fair value is defined as the price that would be received to sell an asset or paid to transfer a liability in an orderly transaction between market participants at the measurement date.
The valuation techniques described below maximize the use of observable inputs and minimize the use of unobservable inputs in determining fair value. The inputs used for valuing the Fund's investments are summarized in the three broad levels listed below:
• Level 1 — quoted prices in active markets for identical securities
• Level 2 — other significant observable inputs (including quoted prices for similar securities or interest rates applicable to those securities, etc.)
• Level 3 — significant unobservable inputs (including the Fund's own assumptions in determining the fair value of investments)
Changes in valuation techniques may result in transfers in or out of an assigned level within the disclosure hierarchy. The inputs or methodologies used for valuation techniques are not necessarily an indication of the risk associated with entering into those investments.
Victory Capital Management Inc. ("VCM" or the "Adviser") has established the Pricing and Liquidity Committee (the "Committee"), and subject to the Trust's Board of Trustees' (the "Board") oversight, the Committee administers and oversees the Fund's valuation policies and procedures, which are approved by the Board.
Portfolio securities listed or traded on securities exchanges, including Exchange-Traded Funds ("ETFs"), and American Depositary Receipts ("ADRs"), are valued at the closing price on the exchange or system
14
Victory Variable Insurance Funds | | Notes to Financial Statements — continued
June 30, 2022 | |
(Unaudited)
where the security is principally traded, if available, or at the Nasdaq Official Closing Price. If there have been no sales for that day on the exchange or system, then a security is valued at the last available bid quotation on the exchange or system where the security is principally traded. In each of these situations, valuations are typically categorized as Level 1 in the fair value hierarchy.
Investments in open-end investment companies, other than ETFs, are valued at their net asset value ("NAV"). These valuations are typically categorized as Level 1 in the fair value hierarchy.
Debt securities are valued each business day by a pricing service approved by the Board. The approved pricing service uses the evaluated bid or the last sale price to value securities. Debt obligations maturing within 60 days may be valued at amortized cost, provided that the amortized cost represents the fair value of such securities. These valuations are typically categorized as Level 2 in the fair value hierarchy.
In the event that price quotations or valuations are not readily available, investments are valued at fair value in accordance with procedures established by and under the general supervision and responsibility of the Board. These valuations are typically categorized as Level 2 or Level 3 in the fair value hierarchy, based on the observability of inputs used to determine the fair value. The effect of fair value pricing is that securities may not be priced on the basis of quotations from the primary market in which they are traded and the actual price realized from the sale of a security may differ materially from the fair value price. Valuing these securities at fair value is intended to cause the Fund's NAV to be more reliable than it otherwise would be.
A summary of the valuations as of June 30, 2022, is included in the table below while the breakdown, by category, of investments is disclosed on the Schedule of Portfolio Investments:
| | | Level 1 | | Level 2 | | Level 3 | | Total | |
Common Stocks | | $ | 159,207 | | | $ | — | | | $ | — | | | $ | 159,207 | | |
Senior Secured Loans | | | — | | | | 5,558,086 | | | | — | | | | 5,558,086 | | |
Corporate Bonds | | | — | | | | 14,395,643 | | | | — | | | | 14,395,643 | | |
Yankee Dollars | | | — | | | | 1,323,165 | | | | — | | | | 1,323,165 | | |
Collateral for Securities Loaned | | | 2,595,905 | | | | — | | | | — | | | | 2,595,905 | | |
Total | | $ | 2,755,112 | | | $ | 21,276,894 | | | $ | — | | | $ | 24,032,006 | | |
For the six months ended June 30, 2022, there were no transfers in or out of Level 3 in the fair value hierarchy.
Investment Companies:
Open-End Funds:
The Fund may invest in portfolios of open-end investment companies. These investment companies value securities in their portfolios for which market quotations are readily available at their market values (generally the last reported sale price) and all other securities and assets at their fair value by the methods established by the board of directors of the underlying funds.
Loans:
Floating rate loans in which the Fund invests are primarily "senior" loans. Senior floating rate loans typically hold a senior position in the capital structure of the borrower, are typically secured by specific collateral, and have a claim on the assets and/or stock of the borrower that is senior to that held by subordinated debtholders and stockholders of the borrower. While these protections may reduce risk, these investments still present significant credit risk. A significant portion of the Fund's floating rate investments may be issued in connection with highly leveraged transactions such as leveraged buyouts, leveraged recapitalization loans, and other types of acquisition financing. Obligations in these types of transactions are subject to greater credit risk (including default and bankruptcy) than many other investments and may be, or become, illiquid. See note regarding below-investment-grade securities. The Fund may purchase second lien loans (secured loans with a claim on collateral subordinate to a senior lender's claim on such collateral), fixed rate loans, unsecured loans, and other debt obligations.
15
Victory Variable Insurance Funds | | Notes to Financial Statements — continued
June 30, 2022 | |
(Unaudited)
Transactions in loans often settle on a delayed basis, and the Fund may not receive the proceeds from the sale of a loan or pay for a loan purchase for a substantial period of time after entering into the transactions.
Below-Investment-Grade Securities:
The Fund may invest in below-investment-grade securities (i.e., lower-quality, "junk" debt), which are subject to various risks. Lower-quality debt is considered to be speculative because it is less certain that the issuer will be able to pay interest or repay the principal than in the case of investment-grade debt. These securities can involve a substantially greater risk of default than higher-rated securities, and their values can decline significantly over short periods of time. Lower-quality debt securities tend to be more sensitive to adverse news about their issuers, the market and the economy in general, than higher-quality debt securities. The market for these securities can be less liquid, especially during periods of recession or general market decline.
Investment Transactions and Related Income:
Changes in holdings of investments are accounted for no later than one business day following the trade date. For financial reporting purposes, however, investment transactions are accounted for on trade date or the last business day of the reporting period. Interest income is determined on the basis of coupon interest accrued using the effective interest method which adjusts, where applicable, the amortization of premiums or accretion of discounts. Dividend income is recorded on the ex-dividend date. Gains or losses realized on sales of securities are recorded on the identified cost basis. Paydown gains or losses on applicable securities, if any, are recorded as components of Interest Income on the Statement of Operations.
The Fund may receive other income from investments in loan assignments and/or unfunded commitments, including amendment fees, consent fees, and commitment fees. These fees are recorded as income when received. These amounts, if received, are included in Interest income on the Statement of Operations.
Securities Lending:
The Fund, through a Securities Lending Agreement with Citibank, N.A. ("Citibank"), may lend its securities to qualified financial institutions, such as certain broker-dealers and banks, to earn additional income, net of income retained by Citibank. Borrowers are required to initially secure their loans for collateral in the amount of at least 102% of the value of U.S. securities loaned or at least 105% of the value of non-U.S. securities loaned, marked-to-market daily. Any collateral shortfalls associated with increases in the valuation of the securities loaned are generally cured the next business day. The collateral can be received in the form of cash collateral and/or non-cash collateral. Non-cash collateral can include U.S. Government Securities and other securities as permitted by Securities and Exchange Commission ("SEC") guidelines. The cash collateral is invested in short-term instruments or cash equivalents, primarily open-end investment companies, as noted on the Fund's Schedule of Portfolio Investments. The Fund effectively does not have control of the non-cash collateral and therefore it is not disclosed on the Fund's Schedule of Portfolio Investments. Collateral requirements are determined daily based on the value of the Fund's securities on loan as of the end of the prior business day. During the time portfolio securities are on loan, the borrower will pay the Fund any dividends or interest paid on such securities plus any fee negotiated between the parties to the lending agreement. The Fund also earns a return from the collateral. The Fund pays Citibank various fees in connection with the investment of cash collateral and fees based on the investment income received from securities lending activities. Securities lending income (net of these fees) is disclosed on the Statement of Operations. Loans are terminable upon demand and the borrower must return the loaned securities within the lesser of one standard settlement period or five business days. Although risk is mitigated by the collateral, the Fund could experience a delay in recovering its securities and possible loss of income or value if the borrower fails to return them. In addition, there is a risk that the value of the short-term investments will be less than the amount of cash collateral required to be returned to the borrower.
16
Victory Variable Insurance Funds | | Notes to Financial Statements — continued
June 30, 2022 | |
(Unaudited)
The Fund's agreement with Citibank does not include master netting provisions. Non-cash collateral received by the Fund may not be sold or repledged, except to satisfy borrower default.
The following table is a summary of the Fund's securities lending transactions as of June 30, 2022.
Value of
Securities on Loan | | Non-Cash
Collateral | | Cash
Collateral | |
| $ | 2,464,704 | | | $ | — | | | $ | 2,595,905 | | |
Federal Income Taxes:
The Fund intends to continue to qualify as a regulated investment company by complying with the provisions available to certain investment companies, as defined in applicable sections of the Internal Revenue Code, and to make distributions of net investment income and net realized gains sufficient to relieve it from all, or substantially all, federal income taxes. Accordingly, no provision for federal income taxes is required in the financial statements. The Fund has a tax year end of December 31.
For the six months ended June 30, 2022, the Fund did not incur any income tax, interest, or penalties, and has recorded no liability for net unrecognized tax benefits relating to uncertain tax positions.
Management of the Fund has reviewed tax positions taken in tax years that remain subject to examination by all major tax jurisdictions, including federal (i.e., the last four tax years, which includes the current fiscal tax year end). Management believes that there is no tax liability resulting from unrecognized tax benefits related to uncertain tax positions taken.
Allocations:
Expenses directly attributable to the Fund are charged to the Fund, while expenses that are attributable to more than one fund in the Trust, or jointly with an affiliated trust, are allocated among the respective funds in the Trust and/or an affiliated trust based upon net assets or another appropriate basis.
3. Purchases and Sales:
Purchases and sales of securities (excluding securities maturing less than one year from acquisition) for the six months ended June 30, 2022, were as follows:
Excluding
U.S. Government Securities | |
Purchases | | Sales | |
$ | 5,784,021 | | | $ | 8,722,810 | | |
4. Fees and Transactions with Affiliates and Related Parties:
Investment Advisory Fees:
Investment advisory services are provided to the Fund by the Adviser, which is a New York corporation registered as an investment adviser with the SEC. The Adviser is an indirect wholly owned subsidiary of Victory Capital Holdings, Inc., a publicly traded Delaware corporation, and a wholly owned direct subsidiary of Victory Capital Operating, LLC.
Under the terms of the Investment Advisory Agreement, the Adviser is entitled to receive fees accrued daily and paid monthly at an annualized rate of 0.60% of the Fund's average daily net assets. Amounts incurred and paid to VCM for the six months ended June 30, 2022, are reflected on the Statement of Operations as Investment advisory fees.
VCM has entered into a Sub-Advisory Agreement with Park Avenue Institutional Advisers LLC ("Park Avenue") with respect to the Fund. Park Avenue is responsible for providing day-to-day investment advisory services to the Fund, subject to the oversight of the Board. Sub-investment advisory fees, which are paid by VCM to Park Avenue, do not represent a separate or additional expense to the Fund.
17
Victory Variable Insurance Funds | | Notes to Financial Statements — continued
June 30, 2022 | |
(Unaudited)
Administration and Servicing Fees:
VCM also serves as the Fund's administrator and fund accountant. Under the Administration and Fund Accounting Agreement, VCM is entitled to receive fees based on a percentage of the average daily net assets of the Trust, Victory Portfolios and Victory Portfolios II. The tiered rates at which VCM is paid by the Funds are shown in the table below:
Net Assets | |
Up to $15 billion | | $15 billion – $30 billion | | Over $30 billion | |
| | 0.08 | %, plus | | | 0.05 | %, plus | | | 0.04 | % | |
Amounts incurred for the six months ended June 30, 2022, are reflected on the Statement of Operations as Administration fees.
Citi Fund Services Ohio, Inc. ("Citi"), an affiliate of Citibank, acts as sub-administrator and sub-fund accountant to the Fund pursuant to the Sub-Administration and Sub-Fund Accounting Services Agreement between VCM and Citi. VCM pays Citi a fee for providing these services. The Trust reimburses VCM and Citi for out-of-pocket expenses incurred in providing these services and certain other expenses specifically allocated to the Fund. Amounts incurred for the six months ended June 30, 2022, are reflected on the Statement of Operations as Sub-Administration fees.
The Fund (as part of the Trust) has entered into an agreement with the Adviser to provide compliance services, pursuant to which the Adviser furnishes its compliance personnel, including the services of the Chief Compliance Officer ("CCO"), and other resources reasonably necessary to provide the Trust with compliance oversight services related to the design, administration, and oversight of a compliance program for the Trust in accordance with Rule 38a-1 under the 1940 Act. The CCO is an employee of the Adviser, which pays the compensation of the CCO and support staff. The funds in the Trust, Victory Portfolios, Victory Portfolios II and USAA Mutual Funds (collectively, the "Victory Funds Complex"), in aggregate, compensate the Adviser for these services. Amounts incurred for the six months ended June 30, 2022, are reflected on the Statement of Operations as Compliance fees.
Transfer Agency Fees:
FIS Investor Services, LLC ("FIS") serves as the Fund's transfer agent. Under the Transfer Agent Agreement, the Trust pays FIS a fee for its services and reimburses FIS for all of their reasonable out-of-pocket expenses incurred in providing these services. Amounts incurred for the six months ended June 30, 2022, are reflected on the Statement of Operations as Transfer agent fees.
Distributor/Underwriting Services:
Victory Capital Services, Inc. (the "Distributor"), an affiliate of the Adviser, serves as Distributor for the continuous offering of the shares of the Fund pursuant to a Distribution Agreement between the Distributor and the Trust, and receives no fee or other compensation for these services.
Other Fees:
Citibank serves as the Fund's custodian. The Fund pays Citibank a fee for providing these services. Amounts incurred for the six months ended June 30, 2022, are reflected on the Statement of Operations as Custodian fees.
Sidley Austin LLP provides legal services to the Trust.
The Adviser has entered into an expense limitation agreement with the Fund until at least April 30, 2023. Under the terms of the agreement, the Adviser has agreed to waive fees or reimburse certain expenses to the extent that ordinary operating expenses incurred in any fiscal year exceed the expense limit for the Fund. Such excess amounts will be the liability of the Adviser. Acquired fund fees and expenses, interest, taxes, brokerage commissions, other expenditures which are capitalized in accordance with GAAP, and other extraordinary expenses not incurred in the ordinary course of a
18
Victory Variable Insurance Funds | | Notes to Financial Statements — continued
June 30, 2022 | |
(Unaudited)
Fund's business are excluded from the expense limits. As of June 30, 2022, the expense limit (excluding voluntary waivers) is 0.89%.
Under the terms of the expense limitation agreement, as amended May 1, 2022, the Fund has agreed to repay fees and expenses that were waived or reimbursed by the Adviser for a period of up to three years (thirty-six (36) months) after the waiver or reimbursement took place, subject to the lesser of any operating expense limits in effect at the time of: (a) the original waiver or expense reimbursement; or (b) the recoupment, after giving effect to the recoupment amount.
As of June 30, 2022, the following amounts are available to be repaid to the Adviser. The Fund has not recorded any amounts available to be repaid as a liability due to an assessment that such repayment is not probable at June 30, 2022.
Expires
2022 | | Expires
2023 | | Expires
2024 | | Expires
2025 | | Total | |
| $ | 22,090 | | | $ | 43,362 | | | $ | 30,244 | | | $ | 13,353 | | | $ | 109,049 | | |
The Adviser may voluntarily waive or reimburse additional fees to assist the Fund in maintaining competitive expense ratios. Voluntary waivers and reimbursements applicable to the Fund is not available to be recouped at a future time. There were no voluntary waivers or reimbursements for the six months ended June 30, 2022.
Certain officers and/or interested trustees of the Fund are also officers and/or employees of the Adviser, administrator, fund accountant, sub-administrator, sub-fund accountant, custodian, legal counsel, and Distributor.
5. Risks:
The Fund may be subject to other risks in addition to these identified risks.
High-Yield/Junk Bond Risk — Lower-quality debt securities can involve a substantially greater risk of default than higher quality debt securities, and their values can decline significantly over short and longer periods of time. Lower-quality debt securities tend to be more sensitive to adverse news about the issuer, or the market or economy in general.
Debt Securities Risk — The value of a debt security or other income-producing security changes in response to various factors including, for example, market-related factors (such as changes in interest rates or changes in the risk appetite of investors generally) and changes in the actual or perceived ability of the issuer (or of issuers generally) to meet its (or their) obligations.
Other factors that may affect the value of debt securities include, among others, public health crises and responses by governments and companies to such crises. These and other events may affect the creditworthiness of the issuer of a debt security and may impair an issuer's ability to timely meet its debt obligations as they come due.
Floating Rate Loan Risk — Investments in floating rate loans are generally subject to the same risks as investments in other types of debt securities, including, in many cases, investments in high-yield/junk bonds. There may be limited public information available regarding the loan. They may be difficult to value and may be illiquid. The receipt of principal and interest on some loans may be subject to the credit risk of a financial institution that issues or administers the loan. In certain circumstances, the Fund may not have the same protections available to investors under the federal securities laws. In times of unusual or adverse market, economic or political conditions, floating rate loans may experience higher than normal default rates. In the event of a recession or serious credit event, among other eventualities, the value of the Fund's investments in floating rate loans are more likely to decline. Transactions in loans often settle on a delayed basis, and the Fund may not receive the proceeds from the sale of a loan for a substantial period of time after the sale. The secondary market for floating rate loans is limited and, thus, the Fund's ability to sell or realize the full value of its investment in these loans to reinvest sale proceeds or to meet redemption obligations may be impaired. The terms of many floating rate loans and other instruments are tied to the London Interbank Offered Rate ("LIBOR"),
19
Victory Variable Insurance Funds | | Notes to Financial Statements — continued
June 30, 2022 | |
(Unaudited)
which functions as a reference rate or benchmark. LIBOR has been discontinued at the end of 2021, which may cause increased volatility and illiquidity in the markets for instruments with terms tied to LIBOR or other adverse consequences for these instruments. These events may adversely affect the Fund and its investments in such instruments.
LIBOR Discontinuation Risk — The London Interbank Offered Rate ("LIBOR") discontinuation may adversely affect the financial markets generally and the Fund's operations, finances and investments specifically. LIBOR has been the principal floating-rate benchmark in the financial markets. However, LIBOR has been or will be discontinued as a floating rate benchmark. The date of discontinuation depends on the LIBOR currency and tenor. With limited exceptions, no new LIBOR obligations will be entered into after December 31, 2021. Existing LIBOR obligations have transitioned or will transition to another benchmark, depending on the LIBOR currency and tenor. For some existing LIBOR-based obligations, the contractual consequences of the discontinuation of LIBOR may not be clear.
Non-LIBOR floating-rate obligations, including Secured Overnight Financing Rate ("SOFR")-based obligations, may have returns and values that fluctuate more than those of floating-rate debt obligations that are based on LIBOR or other rates. Also, because SOFR and some alternative floating rates are relatively new market indexes, markets for certain non-LIBOR obligations may never develop or may not be liquid. Market terms for non-LIBOR floating rate obligations, such as the spread over the index reflected in interest-rate provisions, may evolve over time, and prices of non-LIBOR floating rate obligations may be different depending on when they are issued and changing views about correct spread levels.
Various SOFR-based rates, including SOFR-based term rates, and various non-SOFR-based rates are expected to develop in response to the discontinuation of U.S. dollar LIBOR, which may create various risks for the Fund and the financial markets more generally. There are non-LIBOR forward-looking floating rates that are not based on SOFR and that may be considered by participants in the financial markets as LIBOR alternatives. Such rates include AMERIBOR (American Interbank Offered Rate), BSBY (Bloomberg Short-Term Bank Yield Index) and BYI (Bank Yield Index). Unlike forward-looking SOFR-based term rates, such rates are intended to reflect a bank credit spread component.
It is not clear how replacement rates for LIBOR — including SOFR-based rates and non-SOFR-based rates — will develop and to what extent they will be used. There is no assurance that these replacement rates will be suitable substitutes for LIBOR, and thus the substitution of such rates for LIBOR could have an adverse effect on the Fund and the financial markets more generally. Concerns about market depth and stability could affect the development of non-SOFR-based term rates, and such rates may create various risks, which may or may not be similar to the risks relating to SOFR.
Market Risk — Overall market risks may affect the value of the Fund. Domestic and international factors such as political events, war, terrorism, trade disputes, inflation rates, interest rate levels and other fiscal and monetary policy changes, cybersecurity incidents, pandemics and other public health crises, sanctions against a particular foreign country, its nationals, businesses or industries and related geopolitical events, as well as environmental disasters such as earthquakes, fires, and floods or other catastrophes, may add to instability in global economies and markets generally, and may lead to increased market volatility. Global economies and financial markets are highly interconnected, which increases the possibility that conditions in one country or region might adversely affect issuers in another country or region. The impact of these and other factors may be short-term or may last for extended periods.
6. Borrowing and Interfund Lending:
Line of Credit:
The Victory Funds Complex participates in a short-term demand note "Line of Credit" agreement with Citibank. The Line of Credit agreement with Citibank was renewed on June 27, 2022, with a termination date of June 26, 2023. Under the agreement with Citibank, the Victory Funds Complex may borrow up to $600 million, of which $300 million is committed and $300 million is uncommitted. $40 million of
20
Victory Variable Insurance Funds | | Notes to Financial Statements — continued
June 30, 2022 | |
(Unaudited)
the Line of Credit is reserved for use by the Victory Floating Rate Fund. another series of the Victory Funds Complex, with Victory Floating Rate Fund paying the related commitment fees for that amount. The purpose of the Line of Credit is to meet temporary or emergency cash needs. For the six months ended June 30, 2022, Citibank received an annual commitment fee of 0.15% on $300 million for providing the Line of Credit. Each fund in the Victory Funds Complex paid a pro-rata portion of the commitment fees plus any interest on amounts borrowed. For the period from January 1, 2022, through June 27, 2022, interest was based on the one-month LIBOR plus one percent. Effective with the renewal, for the period June 28, 2022, through June 30, 2022, interest was based on the one-month SOFR plus 1.10 percent. Interest charged to the Fund during the period, if applicable, is reflected on the Statement of Operations under Line of credit fees.
The Fund had no borrowings under the Line of Credit agreement during the six months ended June 30, 2022.
Interfund Lending:
The Trust and the Adviser rely on an exemptive order granted by the SEC in March 2017 (the "Order"), permitting the establishment and operation of an Interfund Lending Facility (the "Facility"). The Facility allows the Fund to directly lend and borrow money to or from any other fund in the Victory Funds Complex that is permitted to participate in the Facility, relying upon the Order at rates beneficial to both the borrowing and lending funds. Advances under the Facility are allowed for temporary or emergency purposes, including the meeting of redemption requests that otherwise might require the untimely disposition of securities, and are subject to each fund's borrowing restrictions. The interfund loan rate is determined, as specified in the Order, by averaging the current repurchase agreement rate and the current bank loan rate. As a Borrower, interest charged to the Fund, if any, during the period, is reflected on the Statement of Operations under Interfund lending fees. As a Lender, interest earned by the Fund, if any, during the period, is reflected on the Statement of Operations under Interfund lending.
The Fund did not utilize or participate in the Facility during the six months ended June 30, 2022.
7. Federal Income Tax Information:
The Fund intends to distribute any net investment income annually. Distributable net realized gains, if any, are declared and paid at least annually.
The amounts of dividends from net investment income and distributions from net realized gains (collectively, distributions to shareholders) are determined in accordance with federal income tax regulations, which may differ from GAAP. To the extent these "book/tax" differences are permanent in nature (e.g., net operating loss and distribution reclassification), such amounts are reclassified within the components of net assets based on their federal tax-basis treatment; temporary differences (e.g., wash sales) do not require reclassification. To the extent dividends and distributions exceed net investment income and net realized gains for tax purposes, they are reported as distributions of capital. Net investment losses incurred by the Fund may be reclassified as an offset to capital on the accompanying Statement of Assets and Liabilities.
The tax character of current year distributions paid and the tax basis of the current components of accumulated earnings (loss) will be determined at the end of the current tax year ending December 31, 2022.
At the tax year ended December 31, 2021, the Fund had net capital loss carryforwards as summarized in the table below, which is not subject to expiration. It is unlikely that the Board will authorize a distribution of capital gains realized in the future until the capital loss carryforwards have been used.
| Short-Term | | Long-Term | | Total | |
| $ | 406,846 | | | $ | 2,510,210 | | | $ | 2,917,056 | | |
21
Victory Variable Insurance Funds | | Supplemental Information
June 30, 2022 | |
(Unaudited)
Proxy Voting and Portfolio Holdings Information
Proxy Voting:
Information regarding the policies and procedures the Fund uses to determine how to vote proxies relating to portfolio securities is available without charge, upon request, by calling 800-539-3863. The information is also included in the Fund's Statement of Additional Information, which is available on the SEC's website at www.sec.gov.
Information relating to how the Fund voted proxies relating to portfolio securities held during the most recent 12 months ended June 30 is available on the SEC's website at www.sec.gov.
Availability of Schedules of Portfolio Investments:
The Trust files a complete list of Schedules of Portfolio Investments with the SEC for the first and third quarter of each fiscal year on Form N-PORT. Forms N-PORT are available on the SEC's website at www.sec.gov.
Expense Example
As a shareholder of the Fund, you may incur two types of costs: (1) transaction costs and (2) ongoing costs, including management fees and other Fund expenses. These examples are intended to help you understand your ongoing costs (in dollars) of investing in the Fund and to compare these costs with the ongoing costs of investing in other mutual funds.
These examples are based on an investment of $1,000 invested at the beginning of the period and held for the entire period from January 1, 2022, through June 30, 2022.
The Actual Expense figures in the table below provide information about actual account values and actual expenses. You may use the information below, together with the amount you invested, to estimate the expenses that you paid over the period. Simply divide your account value by $1,000 (for example, an $8,600 account value divided by $1,000 = 8.6), then multiply the result by the number in the table under the heading entitled "Actual Expenses Paid During Period" to estimate the expenses you paid on your account during this period.
The Hypothetical Expense figures in the table below provide information about hypothetical account values and hypothetical expenses based on the Fund's actual expense ratio and an assumed rate of return of 5% per year before expenses, which is not the Fund's actual return. The hypothetical account values and expenses may not be used to estimate the actual ending account balance or expenses you paid for the period. You may use this information to compare this 5% hypothetical example with the 5% hypothetical examples that appear in shareholder reports of other funds.
Please note the expenses shown in the table below are meant to highlight your ongoing costs only and do not reflect any transactional costs. Therefore, the hypothetical expenses in the table are useful in comparing ongoing costs only and will not help you determine the relative total costs of owning different funds. In addition, if these transactional costs were included, your costs would have been higher.
Beginning
Account Value
1/1/22 | | Actual
Ending
Account Value
6/30/22 | | Hypothetical
Ending
Account Value
6/30/22 | | Actual
Expenses Paid
During Period
1/1/22-6/30/22* | | Hypothetical
Expenses Paid
During Period
1/1/22-6/30/22* | | Annualized
Expense Ratio
During Period
1/1/22-6/30/22 | |
| $ | 1,000.00 | | | $ | 858.10 | | | $ | 1,020.38 | | | $ | 4.10 | | | $ | 4.46 | | | | 0.89 | % | |
* Expenses are equal to the average account value multiplied by the Fund's annualized expense ratio multiplied by 181/365 (the number of days in the most recent fiscal half-year divided by the number of days in the fiscal year).
22
Victory Variable Insurance Funds | | Supplemental Information — continued
June 30, 2022 | |
(Unaudited)
Liquidity Risk Management Program:
The Victory Funds have adopted and implemented a written liquidity risk management program (the "LRMP") as required by Rule 22e-4 under the Investment Company Act of 1940, as amended. The LRMP is reasonably designed to assess and manage the Fund's liquidity risk, taking into consideration the Fund's investment strategy and the liquidity of its portfolio investments during normal and reasonably foreseeable stressed market conditions; its short- and long-term cash flow projections; and its cash holdings and access to other liquidity management tools such as available funding sources including the Victory Funds Complex Interfund Lending Facility and Line of Credit (discussed in the Notes to Financial Statements). The Victory Funds' Board of Trustees approved the appointment of the Fund's investment adviser, Victory Capital Management Inc. ("Victory Capital"), as the administrator of the LRMP.
Victory Capital manages liquidity risks associated with the Fund's investments by monitoring, among other things, cash and cash equivalents, any use of derivatives, the concentration of investments, the appropriateness of the Fund's investment strategy, and by classifying every Fund investment as either highly liquid, moderately liquid, less liquid, or illiquid on at least a monthly basis. To assist with the classification of Fund investments, Victory Capital has retained a third-party provider of liquidity evaluation services. This provider determines preliminary liquidity classifications for all portfolio holdings based upon portfolio-level data and certain assumptions provided by Victory Capital. Victory Capital reviews the preliminary liquidity classifications and, when appropriate, considers other information including input from the Fund's portfolio managers (including the portfolio managers employed by any investment sub-advisers) in determining final liquidity classifications.
At a meeting held on February 24, 2022, Victory Capital provided an oral and written report to the Trustees on the operation and effectiveness of the LRMP during the previous year. The report from Victory Capital concluded that the Fund did not experience any significant liquidity challenges during the covered period, and the Fund's LRMP is reasonably designed to assess and manage its liquidity risk. The report also concluded that the LRMP continues to operate adequately and effectively to enable Victory Capital to oversee and manage liquidity risk and ensure the Fund is able to meet redemption requests without significant dilution to the remaining investors' interest in the Fund. During the review period, the Fund's portfolio consisted primarily of highly liquid investments, which are defined as cash and any investments that the Fund reasonably expects to be converted to cash in current market conditions in three business days or less without significantly changing the market value of the investment. Therefore, the Fund has not adopted a highly liquid investment minimum. The Fund's investments were below the limitation on illiquid investments during the review period. Additionally, Victory Capital indicated that no events occurred that would require the filing of Form N-LIQUID and recommended no material changes to the LRMP.
23
Privacy Policy
Protecting the Privacy of Information
The Trust respects your right to privacy. We also know that you expect us to conduct and process your business in an accurate and efficient manner. To do so, we must collect and maintain certain personal information about you. This is the information we collect from you on applications or other forms, and from the transactions you make with us or third parties. It may include your name, address, social security number, account transactions and balances, and information about investment goals and risk tolerance.
We do not disclose any information about you or about former customers to anyone except as permitted or required by law. Specifically, we may disclose the information we collect to companies that perform services on our behalf, such as the transfer agent that processes shareholder accounts and printers and mailers that assist us in the distribution of investor materials. We may also disclose this information to companies that perform marketing services on our behalf. This allows us to continue to offer you Victory investment products and services that meet your investing needs, and to effect transactions that you request or authorize. These companies will use this information only in connection with the services for which we hired them. They are not permitted to use or share this information for any other purpose.
To protect your personal information internally, we permit access only by authorized employees and maintain physical, electronic, and procedural safeguards to guard your personal information.*
* You may have received communications regarding information about privacy policies from other financial institutions which gave you the opportunity to "opt-out" of certain information sharing with companies which are not affiliated with that financial institution. The Trust does not share information with other companies for purposes of marketing solicitations for products other than the Trust. Therefore, the Trust does not provide opt-out options to their shareholders.
Victory Funds
P.O. Box 182593
Columbus, Ohio 43218-2593

Visit our website at: | | Call Victory at: | |
www.vcm.com | | 800-539-FUND (800-539-3863) | |

June 30, 2022
Semi Annual Report
Victory Variable Insurance Funds
Victory RS International VIP Series
www.vcm.com
News, Information And Education 24 Hours A Day, 7 Days A Week
The Victory Capital website gives fund shareholders, prospective shareholders, and investment professionals a convenient way to access fund information, get guidance, and track fund performance anywhere they can access the Internet. The site includes:
• Detailed performance records
• Daily share prices
• The latest fund news
• Investment resources to help you become a better investor
• A section dedicated to investment professionals
Whether you're a potential investor searching for the fund that matches your investment philosophy, a seasoned investor interested in planning tools, or an investment professional, www.vcm.com has what you seek. Visit us anytime. We're always open.
Victory Variable Insurance Funds
TABLE OF CONTENTS
Investment Objective & Portfolio Holdings | | | 3 | | |
Schedule of Portfolio Investments | | | 4 | | |
Financial Statements | |
Statement of Assets and Liabilities | | | 9 | | |
Statement of Operations | | | 10 | | |
Statements of Changes in Net Assets | | | 11 | | |
Financial Highlights | | | 12 | | |
Notes to Financial Statements | | | 14 | | |
Supplemental Information | | | 22 | | |
Proxy Voting and Portfolio Holdings Information | | | 22 | | |
Expense Example | | | 22 | | |
Liquidity Risk Management Program | | | 23 | | |
Privacy Policy (inside back cover) | | | |
1
The Fund is distributed by Victory Capital Services, Inc. Victory Capital Management Inc. is the investment adviser to the Fund and receives fees from the Fund for performing services for the Fund.
This report is not authorized for distribution to prospective investors unless preceded or accompanied by a current prospectus of the Fund.
For additional information about any Victory Fund, including fees, expenses, and risks, view our prospectus online at vcm.com or call 800-539-3863. Read it carefully before you invest or send money.
The information in this report is based on data obtained from recognized services and sources and is believed to be reliable. Any opinions, projections, or recommendations in this report are subject to change without notice and are not intended as individual investment advice. Past investment performance of the Fund, markets or securities mentioned herein should not be considered to be indicative of future results.
• NOT FDIC INSURED • NO BANK GUARANTEE • MAY LOSE VALUE

Call Victory at:
800-539-FUND (800-539-3863)
Visit our website at:
www.vcm.com
2
Victory Variable Insurance Funds
Victory RS International VIP Series | | June 30, 2022 | |
(Unaudited)
Investment Objective and Portfolio Holdings:
The Fund seeks to provide long-term capital appreciation.
Top 10 Holdings*:
June 30, 2022
(% of Net Assets)
Nestle SA | | | 4.5 | % | |
Roche Holding AG | | | 3.8 | % | |
Toyota Motor Corp. | | | 3.2 | % | |
LVMH Moet Hennessy Louis Vuitton SE | | | 2.8 | % | |
Novartis AG | | | 2.5 | % | |
Novo Nordisk A/S, Class B | | | 2.4 | % | |
Shell PLC | | | 2.4 | % | |
HSBC Holdings PLC | | | 2.1 | % | |
BHP Group Ltd. | | | 2.1 | % | |
Diageo PLC | | | 2.0 | % | |
Sector Allocation*:
June 30, 2022
(% of Net Assets)
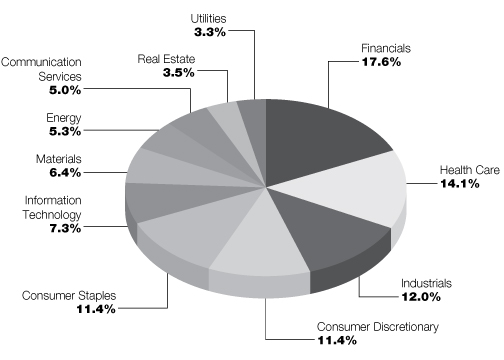
* Does not include futures contracts, money market instruments, and short-term investments purchased with cash collateral from securities loaned.
Percentages are of the net assets of the Fund and may not equal 100%.
Refer to the Schedule of Portfolio Investments for a complete list of securities.
3
Victory Variable Insurance Funds
Victory RS International VIP Series | | Schedule of Portfolio Investments
June 30, 2022 | |
(Unaudited)
Security Description | | Shares | | Value | |
Common Stocks (97.3%) | |
Australia (7.3%): | |
Consumer Discretionary (1.1%): | |
Aristocrat Leisure Ltd. | | | 53,547 | | | $ | 1,273,390 | | |
Financials (1.1%): | |
Macquarie Group Ltd. | | | 11,333 | | | | 1,290,045 | | |
Health Care (2.0%): | |
CSL Ltd. | | | 12,158 | | | | 2,256,937 | | |
Materials (2.1%): | |
BHP Group Ltd. | | | 84,228 | | | | 2,411,220 | | |
Real Estate (1.0%): | |
Scentre Group | | | 675,847 | | | | 1,213,249 | | |
| | | | 8,444,841 | | |
Belgium (0.7%): | |
Information Technology (0.7%): | |
Melexis NV | | | 11,008 | | | | 791,585 | | |
China (0.9%): | |
Communication Services (0.9%): | |
Tencent Holdings Ltd. | | | 23,900 | | | | 1,081,865 | | |
Denmark (4.1%): | |
Consumer Discretionary (0.6%): | |
Pandora A/S | | | 9,770 | | | | 620,813 | | |
Consumer Staples (1.1%): | |
Royal Unibrew A/S | | | 13,983 | | | | 1,244,659 | | |
Health Care (2.4%): | |
Novo Nordisk A/S, Class B | | | 25,197 | | | | 2,794,860 | | |
| | | | 4,660,332 | | |
France (8.4%): | |
Consumer Discretionary (4.0%): | |
La Francaise des Jeux SAEM (a) | | | 38,192 | | | | 1,326,001 | | |
LVMH Moet Hennessy Louis Vuitton SE | | | 5,298 | | | | 3,246,565 | | |
| | | | 4,572,566 | | |
Energy (0.9%): | |
Gaztransport Et Technigaz SA | | | 8,464 | | | | 1,062,965 | | |
Industrials (1.1%): | |
Safran SA | | | 13,037 | | | | 1,297,851 | | |
Information Technology (1.0%): | |
Capgemini SE | | | 7,048 | | | | 1,215,326 | | |
Materials (1.4%): | |
Arkema SA | | | 17,492 | | | | 1,564,480 | | |
| | | | 9,713,188 | | |
See notes to financial statements.
4
Victory Variable Insurance Funds
Victory RS International VIP Series | | Schedule of Portfolio Investments — continued
June 30, 2022 | |
(Unaudited)
Security Description | | Shares | | Value | |
Germany (6.2%): | |
Consumer Discretionary (0.9%): | |
Volkswagen AG, Preference Shares | | | 8,099 | | | $ | 1,090,292 | | |
Financials (1.7%): | |
Allianz SE, Registered Shares | | | 10,424 | | | | 1,998,103 | | |
Industrials (1.9%): | |
Siemens AG, Registered Shares | | | 20,740 | | | | 2,131,696 | | |
Information Technology (1.7%): | |
SAP SE | | | 21,587 | | | | 1,967,385 | | |
| | | | 7,187,476 | | |
Hong Kong (3.6%): | |
Financials (1.7%): | |
AIA Group Ltd. | | | 177,600 | | | | 1,940,608 | | |
Real Estate (1.9%): | |
CK Asset Holdings Ltd. | | | 316,000 | | | | 2,245,338 | | |
| | | | 4,185,946 | | |
Italy (2.6%): | |
Utilities (2.6%): | |
Enel SpA | | | 256,726 | | | | 1,407,742 | | |
Snam SpA | | | 296,090 | | | | 1,553,176 | | |
| | | | 2,960,918 | | |
Japan (21.2%): | |
Communication Services (2.0%): | |
Capcom Co. Ltd. | | | 54,600 | | | | 1,328,393 | | |
Kakaku.com, Inc. | | | 58,100 | | | | 965,129 | | |
| | | | 2,293,522 | | |
Consumer Discretionary (4.0%): | |
Toyota Motor Corp. | | | 236,000 | | | | 3,641,853 | | |
ZOZO, Inc. | | | 53,200 | | | | 962,674 | | |
| | | | 4,604,527 | | |
Consumer Staples (1.3%): | |
Toyo Suisan Kaisha Ltd. | | | 38,200 | | | | 1,491,672 | | |
Financials (3.1%): | |
Mitsubishi UFJ Financial Group, Inc. | | | 344,400 | | | | 1,842,830 | | |
Tokio Marine Holdings, Inc. | | | 30,100 | | | | 1,755,448 | | |
| | | | 3,598,278 | | |
Health Care (2.5%): | |
Hoya Corp. | | | 18,700 | | | | 1,600,637 | | |
Shionogi & Co. Ltd. | | | 24,300 | | | | 1,240,417 | | |
| | | | 2,841,054 | | |
See notes to financial statements.
5
Victory Variable Insurance Funds
Victory RS International VIP Series | | Schedule of Portfolio Investments — continued
June 30, 2022 | |
(Unaudited)
Security Description | | Shares | | Value | |
Industrials (3.9%): | |
Fuji Electric Co. Ltd. | | | 43,900 | | | $ | 1,815,262 | | |
Nippon Yusen KK | | | 12,400 | | | | 850,331 | | |
OKUMA Corp. | | | 14,300 | | | | 537,143 | | |
Sanwa Holdings Corp. | | | 135,000 | | | | 1,292,986 | | |
| | | | 4,495,722 | | |
Information Technology (3.1%): | |
Fujitsu Ltd. | | | 13,600 | | | | 1,701,992 | | |
Oracle Corp. | | | 17,400 | | | | 1,013,441 | | |
Ulvac, Inc. | | | 25,600 | | | | 872,079 | | |
| | | | 3,587,512 | | |
Real Estate (0.6%): | |
Sumitomo Realty & Development Co. Ltd. | | | 27,900 | | | | 736,632 | | |
Utilities (0.7%): | |
Chubu Electric Power Co., Inc. | | | 75,800 | | | | 763,374 | | |
| | | | 24,412,293 | | |
Netherlands (5.3%): | |
Communication Services (1.9%): | |
Koninklijke KPN NV | | | 604,620 | | | | 2,151,010 | | |
Financials (1.2%): | |
ING Groep NV | | | 139,230 | | | | 1,371,444 | | |
Industrials (1.4%): | |
Wolters Kluwer NV | | | 16,467 | | | | 1,595,721 | | |
Information Technology (0.8%): | |
ASM International NV | | | 3,801 | | | | 945,581 | | |
| | | | 6,063,756 | | |
New Zealand (0.5%): | |
Health Care (0.5%): | |
Fisher & Paykel Healthcare Corp. Ltd. | | | 46,461 | | | | 578,567 | | |
Norway (1.6%): | |
Energy (0.6%): | |
Aker BP ASA | | | 20,314 | | | | 703,847 | | |
Financials (1.0%): | |
SpareBank 1 SMN | | | 97,807 | | | | 1,155,488 | | |
| | | | 1,859,335 | | |
Spain (1.4%): | |
Communication Services (0.0%): (b) | |
Telefonica SA | | | 1 | | | | 5 | | |
Financials (1.4%): | |
Banco Bilbao Vizcaya Argentaria SA | | | 352,346 | | | | 1,600,332 | | |
| | | | 1,600,337 | | |
See notes to financial statements.
6
Victory Variable Insurance Funds
Victory RS International VIP Series | | Schedule of Portfolio Investments — continued
June 30, 2022 | |
(Unaudited)
Security Description | | Shares | | Value | |
Sweden (2.1%): | |
Industrials (2.1%): | |
Atlas Copco AB, Class B (c) | | | 203,276 | | | $ | 1,704,159 | | |
Nibe Industrier AB, Class B | | | 100,242 | | | | 756,059 | | |
| | | | 2,460,218 | | |
Switzerland (14.3%): | |
Consumer Staples (5.4%): | |
Coca-Cola HBC AG | | | 46,697 | | | | 1,040,311 | | |
Nestle SA, Registered Shares | | | 44,127 | | | | 5,158,055 | | |
| | | | 6,198,366 | | |
Financials (2.1%): | |
Partners Group Holding AG | | | 676 | | | | 610,589 | | |
UBS Group AG | | | 110,650 | | | | 1,789,130 | | |
| | | | 2,399,719 | | |
Health Care (6.3%): | |
Novartis AG, Registered Shares | | | 33,463 | | | | 2,837,460 | | |
Roche Holding AG | | | 13,166 | | | | 4,402,083 | | |
| | | | 7,239,543 | | |
Industrials (0.5%): | |
Adecco Group AG | | | 17,084 | | | | 582,397 | | |
| | | | 16,420,025 | | |
United Kingdom (17.1%): | |
Communication Services (0.2%): | |
ITV PLC | | | 254,003 | | | | 202,803 | | |
Consumer Discretionary (0.8%): | |
Next PLC | | | 13,399 | | | | 957,066 | | |
Consumer Staples (3.6%): | |
Diageo PLC | | | 52,669 | | | | 2,274,530 | | |
Imperial Brands PLC | | | 83,834 | | | | 1,876,534 | | |
| | | | 4,151,064 | | |
Energy (3.8%): | |
| BP PLC | | | 340,536 | | | | 1,598,713 | | |
Shell PLC | | | 107,182 | | | | 2,790,842 | | |
| | | | 4,389,555 | | |
Financials (4.3%): | |
Barclays PLC | | | 721,038 | | | | 1,348,081 | | |
HSBC Holdings PLC | | | 370,967 | | | | 2,422,938 | | |
Intermediate Capital Group PLC | | | 27,757 | | | | 443,691 | | |
Legal & General Group PLC | | | 246,161 | | | | 719,548 | | |
| | | | 4,934,258 | | |
Health Care (0.4%): | |
CVS Group PLC | | | 21,504 | | | | 434,617 | | |
See notes to financial statements.
7
Victory Variable Insurance Funds
Victory RS International VIP Series | | Schedule of Portfolio Investments — continued
June 30, 2022 | |
(Unaudited)
Security Description | | Shares | | Value | |
Industrials (1.1%): | |
Ashtead Group PLC | | | 28,592 | | | $ | 1,202,619 | | |
Materials (2.9%): | |
Croda International PLC | | | 16,169 | | | | 1,277,813 | | |
Rio Tinto PLC | | | 34,966 | | | | 2,090,144 | | |
| | | | 3,367,957 | | |
| | | | 19,639,939 | | |
Total Common Stocks (Cost $108,710,235) | | | 112,060,621 | | |
Exchange-Traded Funds (0.4%) | |
United States (0.4%): | |
iShares MSCI EAFE ETF | | | 6,772 | | | | 423,182 | | |
Total Exchange-Traded Funds (Cost $447,561) | | | 423,182 | | |
Total Investments (Cost $109,157,796) — 97.7% | | | 112,483,803 | | |
Other assets in excess of liabilities — 2.3% | | | 2,657,539 | | |
NET ASSETS — 100.00% | | $ | 115,141,342 | | |
(a) Rule 144A security or other security that is restricted as to resale to institutional investors. The Fund's Adviser has deemed this security to be liquid (unless otherwise noted as illiquid) based upon procedures approved by the Board of Trustees. As of June 30, 2022, the fair value of these securities was $1,326,001 and amounted to 1.2% of net assets.
(b) Amount represents less than 0.05% of net assets.
(c) Non-income producing security.
ETF — Exchange-Traded Fund
PLC — Public Limited Company
See notes to financial statements.
8
Victory Variable Insurance Funds | | Statement of Assets and Liabilities
June 30, 2022 | |
(Unaudited)
| | | Victory RS International
VIP Series | |
Assets: | |
Investments, at value (Cost $109,157,796) | | $ | 112,483,803 | | |
Foreign currency, at value (Cost $92,382) | | | 92,657 | | |
Cash | | | 1,748,878 | | |
Receivables: | |
Interest and dividends | | | 104,542 | | |
Capital shares issued | | | 13,582 | | |
Investments sold | | | 472,464 | | |
Reclaims | | | 830,993 | | |
From Adviser | | | 34,191 | | |
Prepaid expenses | | | 881 | | |
Total Assets | | | 115,781,991 | | |
Liabilities: | |
Payables: | |
Investments purchased | | | 476,481 | | |
Capital shares redeemed | | | 3,699 | | |
Accrued expenses and other payables: | |
Investment advisory fees | | | 78,591 | | |
Administration fees | | | 6,322 | | |
Custodian fees | | | 7,910 | | |
Transfer agent fees | | | 50,487 | | |
Compliance fees | | | 71 | | |
Other accrued expenses | | | 17,088 | | |
Total Liabilities | | | 640,649 | | |
Net Assets: | |
Capital | | | 100,175,688 | | |
Total accumulated earnings/(loss) | | | 14,965,654 | | |
Net Assets | | $ | 115,141,342 | | |
Shares (unlimited shares authorized with a par value of $0.001 per share): | | | 7,538,886 | | |
Net asset value: | | $ | 15.27 | | |
See notes to financial statements.
9
Victory Variable Insurance Funds | | Statement of Operations
For the Six Months Ended June 30, 2022 | |
(Unaudited)
| | | Victory RS International
VIP Series | |
Investment Income: | |
Dividends | | $ | 3,128,243 | | |
Non-cash dividends | | | 347,602 | | |
Interest | | | 675 | | |
Securities lending (net of fees) | | | 7,280 | | |
Foreign tax withholding | | | (395,569 | ) | |
Total Income | | | 3,088,231 | | |
Expenses: | |
Investment advisory fees | | | 525,721 | | |
Administration fees | | | 35,506 | | |
Sub-Administration fees | | | 8,430 | | |
Custodian fees | | | 22,337 | | |
Transfer agent fees | | | 102,589 | | |
Trustees' fees | | | 4,452 | | |
Compliance fees | | | 477 | | |
Legal and audit fees | | | 8,818 | | |
Other expenses | | | 20,006 | | |
Total Expenses | | | 728,336 | | |
Expenses waived/reimbursed by Adviser | | | (118,055 | ) | |
Net Expenses | | | 610,281 | | |
Net Investment Income (Loss) | | | 2,477,950 | | |
Realized/Unrealized Gains (Losses) from Investments: | |
Net realized gains (losses) from investment securities and foreign
currency transactions | | | 302,543 | | |
Net change in unrealized appreciation/depreciation on investment
securities and foreign currency translations | | | (33,659,998 | ) | |
Net realized/unrealized gains (losses) on investments | | | (33,357,455 | ) | |
Change in net assets resulting from operations | | $ | (30,879,505 | ) | |
See notes to financial statements.
10
Victory Variable Insurance Funds | | Statements of Changes in Net Assets | |
| | | Victory RS International VIP Series | |
| | | Six Months
Ended
June 30, 2022
(Unaudited) | | Year
Ended
December 31,
2021 | |
From Investment Activities: | |
Operations: | |
Net investment income (loss) | | $ | 2,477,950 | | | $ | 3,088,110 | | |
Net realized gains (losses) | | | 302,543 | | | | 10,725,308 | | |
Net change in unrealized appreciation/depreciation | | | (33,659,998 | ) | | | 6,751,760 | | |
Change in net assets resulting from operations | | | (30,879,505 | ) | | | 20,565,178 | | |
Change in net assets resulting from distributions to shareholders | | | — | | | | (5,959,356 | ) | |
Change in net assets resulting from capital transactions | | | (4,234,327 | ) | | | (12,133,257 | ) | |
Change in net assets | | | (35,113,832 | ) | | | 2,472,565 | | |
Net Assets: | |
Beginning of period | | | 150,255,174 | | | | 147,782,609 | | |
End of period | | $ | 115,141,342 | | | $ | 150,255,174 | | |
Capital Transactions: | |
Proceeds from shares issued | | $ | 4,095,026 | | | $ | 3,983,473 | | |
Distributions reinvested | | | — | | | | 5,959,356 | | |
Cost of shares redeemed | | | (8,329,353 | ) | | | (22,076,086 | ) | |
Change in net assets resulting from capital transactions | | $ | (4,234,327 | ) | | $ | (12,133,257 | ) | |
Share Transactions: | |
Issued | | | 249,081 | | | | 203,842 | | |
Reinvested | | | — | | | | 309,776 | | |
Redeemed | | | (484,513 | ) | | | (1,136,496 | ) | |
Change in Shares | | | (235,432 | ) | | | (622,878 | ) | |
See notes to financial statements.
11
Victory Variable Insurance Funds | | Financial Highlights | |
For a Share Outstanding Throughout Each Period
| | | | | Investment Activities | | Distributions to
Shareholders From | |
| | | Net Asset
Value,
Beginning of
Period | | Net
Investment
Income
(Loss)(a) | | Net Realized
and Unrealized
Gains (Losses)
on Investments | | Total from
Investment
Activities | | Net
Investment
Income | | Net Realized
Gains from
Investments | |
Victory RS International VIP Series | | | |
Six Months Ended
June 30, 2022
(Unaudited) | | $ | 19.33 | | | | 0.32 | | | | (4.38 | ) | | | (4.06 | ) | | | — | | | | — | | |
Year Ended December 31:
2021 | | $ | 17.60 | | | | 0.39 | | | | 2.13 | | | | 2.52 | | | | (0.37 | ) | | | (0.42 | ) | |
2020 | | $ | 17.48 | | | | 0.32 | | | | 0.75 | | | | 1.07 | | | | (0.45 | ) | | | (0.50 | ) | |
2019 | | $ | 15.47 | | | | 0.43 | | | | 3.09 | | | | 3.52 | | | | (0.39 | ) | | | (1.12 | ) | |
2018 | | $ | 17.64 | | | | 0.38 | | | | (2.26 | ) | | | (1.88 | ) | | | (0.15 | ) | | | (0.14 | ) | |
2017 | | $ | 14.31 | | | | 0.31 | | | | 3.36 | | | | 3.67 | | | | (0.34 | ) | | | — | | |
(a) Per share net investment income (loss) has been calculated using the average daily shares method.
(b) Not annualized for periods less than one year.
(c) Total returns do not reflect the effects of charges deducted pursuant to the terms of The Guardian Insurance & Annuity Company, Inc.'s variable contracts. Inclusion of such charges would reduce the total returns for all periods shown.
(d) Annualized for periods less than one year.
(e) Does not include acquired fund fees and expenses, if any.
See notes to financial statements.
12
Victory Variable Insurance Funds | | Financial Highlights — continued | |
For a Share Outstanding Throughout Each Period
| | | | | Ratios to Average Net Assets | | Supplemental Data | |
| | | Total
Distributions | | Net Asset
Value,
End of
Period | | Total
Return(b)(c) | | Net
Expenses(d)(e) | | Net
Investment
Income
(Loss)(d) | | Gross
Expenses(d)(e) | | Net Assets,
End of
Period
(000's) | | Portfolio
Turnover(b) | |
Victory RS International VIP Series | |
Six Months Ended
June 30, 2022
(Unaudited) | | | — | | | $ | 15.27 | | | | (21.00 | )% | | | 0.93 | % | | | 3.78 | % | | | 1.11 | % | | $ | 115,141 | | | | 17 | % | |
Year Ended December 31:
2021 | | | (0.79 | ) | | $ | 19.33 | | | | 14.37 | % | | | 0.93 | % | | | 2.02 | % | | | 1.01 | % | | $ | 150,255 | | | | 35 | % | |
2020 | | | (0.95 | ) | | $ | 17.60 | | | | 6.24 | % | | | 0.93 | % | | | 2.02 | % | | | 0.98 | % | | $ | 147,783 | | | | 54 | % | |
2019 | | | (1.51 | ) | | $ | 17.48 | | | | 22.79 | % | | | 0.93 | % | | | 2.49 | % | | | 0.96 | % | | $ | 149,034 | | | | 32 | % | |
2018 | | | (0.29 | ) | | $ | 15.47 | | | | (10.66 | )% | | | 0.93 | % | | | 2.20 | % | | | 0.94 | % | | $ | 142,524 | | | | 44 | % | |
2017 | | | (0.34 | ) | | $ | 17.64 | | | | 25.68 | % | | | 0.93 | % | | | 1.93 | % | | | 0.95 | % | | $ | 181,518 | | | | 57 | % | |
See notes to financial statements.
13
Victory Variable Insurance Funds | | Notes to Financial Statements
June 30, 2022 | |
(Unaudited)
1. Organization:
Victory Variable Insurance Funds (the "Trust") is organized as a Delaware statutory trust and the Trust is registered under the Investment Company Act of 1940, as amended (the "1940 Act"), as an open-end investment company. The Trust is comprised of six funds and is authorized to issue an unlimited number of shares, which are units of beneficial interest with a par value of $0.001 per share.
The accompanying financial statements are those of the RS International VIP Series (the "Fund"), a series of the Trust. The Fund offers a single class of shares: Class I. The Fund's shares are only available for purchase by certain separate accounts of insurance companies as investments for certain variable annuity plans and variable life insurance contracts issued by those insurance companies. The Fund is classified as diversified under the 1940 Act.
Under the Trust's organizational documents, its officers and trustees are indemnified against certain liabilities arising out of the performance of their duties to the Fund. In addition, in the normal course of business, the Fund enters into contracts with its vendors and others that provide for general indemnifications. The Fund's maximum exposure under these arrangements is unknown, as this would involve future claims that may be made against the Fund. However, based on experience, the Fund expects that risk of loss to be remote.
2. Significant Accounting Policies:
The following is a summary of significant accounting policies followed by the Trust in the preparation of its financial statements. The policies are in conformity with U.S. Generally Accepted Accounting Principles ("GAAP"). The preparation of financial statements in accordance with GAAP requires management to make estimates and assumptions that affect the reported amounts of assets and liabilities and disclosure of contingent assets and liabilities at the date of the financial statements and the reported amounts of income and expenses for the period. Actual results could differ from those estimates. The Fund follows the specialized accounting and reporting requirements under GAAP that are applicable to investment companies under Accounting Standards Codification Topic 946.
Investment Valuation:
The Fund records investments at fair value. Fair value is defined as the price that would be received to sell an asset or paid to transfer a liability in an orderly transaction between market participants at the measurement date.
The valuation techniques described below maximize the use of observable inputs and minimize the use of unobservable inputs in determining fair value. The inputs used for valuing the Fund's investments are summarized in the three broad levels listed below:
• Level 1 — quoted prices in active markets for identical securities
• Level 2 — other significant observable inputs (including quoted prices for similar securities or interest rates applicable to those securities, etc.)
• Level 3 — significant unobservable inputs (including the Fund's own assumptions in determining the fair value of investments)
Changes in valuation techniques may result in transfers in or out of an assigned level within the disclosure hierarchy. The inputs or methodologies used for valuation techniques are not necessarily an indication of the risk associated with entering into those investments.
Victory Capital Management Inc. ("VCM" or the "Adviser") has established the Pricing and Liquidity Committee (the "Committee"), and subject to the Trust's Board of Trustees' (the "Board") oversight, the Committee administers and oversees the Fund's valuation policies and procedures, which are approved by the Board.
Portfolio securities listed or traded on securities exchanges, including Exchange-Traded Funds ("ETFs"), are valued at the closing price on the exchange or system where the security is principally traded, if
14
Victory Variable Insurance Funds | | Notes to Financial Statements — continued
June 30, 2022 | |
(Unaudited)
available, or at the Nasdaq Official Closing Price. If there have been no sales for that day on the exchange or system, then a security is valued at the last available bid quotation on the exchange or system where the security is principally traded. In each of these situations, valuations are typically categorized as Level 1 in the fair value hierarchy.
Investments in open-end investment companies, other than ETFs, are valued at their net asset value ("NAV"). These valuations are typically categorized as Level 1 in the fair value hierarchy.
In the event that price quotations or valuations are not readily available, investments are valued at fair value in accordance with procedures established by and under the general supervision and responsibility of the Board. These valuations are typically categorized as Level 2 or Level 3 in the fair value hierarchy, based on the observability of inputs used to determine the fair value. The effect of fair value pricing is that securities may not be priced on the basis of quotations from the primary market in which they are traded and the actual price realized from the sale of a security may differ materially from the fair value price. Valuing these securities at fair value is intended to cause the Fund's NAV to be more reliable than it otherwise would be.
In accordance with procedures adopted by the Board, fair value pricing may be used if events materially affecting the value of foreign securities occur between the time the exchange on which they are traded closes and the time the Fund's NAV is calculated. The Fund uses a systematic valuation model, provided daily by an independent third party to fair value its international equity securities. The valuations are categorized as Level 2 in the fair value hierarchy.
A summary of the valuations as of June 30, 2022, is included in the table below while the breakdown, by category, of investments is disclosed on the Schedule of Portfolio Investments:
| | | Level 1 | | Level 2 | | Level 3 | | Total | |
Common Stocks | | $ | — | | | $ | 112,060,621 | | | $ | — | | | $ | 112,060,621 | | |
Exchange-Traded Funds | | | 423,182 | | | | — | | | | — | | | | 423,182 | | |
Total | | $ | 423,182 | | | $ | 112,060,621 | | | $ | — | | | $ | 112,483,803 | | |
For the six months ended June 30, 2022, there were no transfers in or out of Level 3 in the fair value hierarchy.
Real Estate Investment Trusts ("REITs"):
The Fund may invest in REITs, which report information on the source of their distributions annually. REITs are pooled investment vehicles that invest primarily in income-producing real estate or real-estate related loans or interests (such as mortgages). Certain distributions received from REITs during the year are recorded as realized gains or return of capital as estimated by the Fund or when such information becomes known.
Investment Companies:
Exchange-Traded Funds:
The Fund may invest in ETFs, the shares of which are bought and sold on a securities exchange. An ETF trades like common stock and represents a fixed portfolio of securities often designed to track the performance and dividend yield of a particular domestic or foreign market index. The Fund may purchase shares of an ETF to temporarily gain exposure to a portion of the U.S. or a foreign market while awaiting purchase of underlying securities. The risks of owning an ETF generally reflect the risks of owning the underlying securities they are designed to track, although the lack of liquidity of an ETF could result in it being more volatile. Additionally, ETFs have fees and expenses that reduce their value.
15
Victory Variable Insurance Funds | | Notes to Financial Statements — continued
June 30, 2022 | |
(Unaudited)
Open-End Funds:
The Fund may invest in portfolios of open-end investment companies. These investment companies value securities in their portfolios for which market quotations are readily available at their market values (generally the last reported sale price) and all other securities and assets at their fair value by the methods established by the board of directors of the underlying funds.
Derivative Instruments:
Foreign Exchange Currency Contracts:
The Fund may enter into foreign exchange currency contracts to convert U.S. dollars to and from various foreign currencies. A foreign exchange currency contract is an obligation by a Fund to purchase or sell a specific currency at a future date at a price (in U.S. dollars) set at the time of the contract. The Fund does not engage in "cross-currency" foreign exchange contracts (i.e., contracts to purchase or sell one foreign currency in exchange for another foreign currency). The Fund's foreign exchange currency contracts might be considered spot contracts (typically a contract of one week or less) or forward contracts (typically a contract term over one week). A spot contract is entered into for purposes of hedging against foreign currency fluctuations relating to a specific portfolio transaction, such as the delay between a security transaction trade date and settlement date. Forward contracts are entered into for purposes of hedging portfolio holdings or concentrations of such holdings. The Fund enters into foreign exchange currency contracts solely for spot or forward hedging purposes, and not for speculative purposes (i.e., the Fund does not enter into such contracts solely for the purpose of earning foreign currency gains). Each foreign exchange currency contract is adjusted daily by the prevailing spot or forward rate of the underlying currency, and any appreciation or depreciation is recorded for financial statement purposes as unrealized until the contract settlement date, at which time the Fund records realized gains or losses equal to the difference between the value of a contract at the time it was opened and the value at the time it was closed. The Fund could be exposed to risk if a counterparty is unable to meet the terms of a foreign exchange currency contract or if the value of the foreign currency changes unfavorably. In addition, the use of foreign exchange currency contracts does not eliminate fluctuations in the underlying prices of the securities. For the year ended June 30, 2022, the Fund had no open forward foreign exchange currency contracts.
Investment Transactions and Related Income:
Changes in holdings of investments are accounted for no later than one business day following the trade date. For financial reporting purposes, however, investment transactions are accounted for on trade date or the last business day of the reporting period. Interest income is determined on the basis of coupon interest accrued using the effective interest method which adjusts, where applicable, the amortization of premiums or accretion of discounts. Dividend income is recorded on the ex-dividend date. Gains or losses realized on sales of securities are recorded on the identified cost basis.
Withholding taxes on interest, dividends, and gains as a result of certain investments by the Funds have been provided for in accordance with each investment's applicable country's tax rules and rates.
Securities Lending:
The Fund, through a Securities Lending Agreement with Citibank, N.A. ("Citibank"), may lend its securities to qualified financial institutions, such as certain broker-dealers and banks, to earn additional income, net of income retained by Citibank. Borrowers are required to initially secure their loans for collateral in the amount of at least 102% of the value of U.S. securities loaned or at least 105% of the value of non-U.S. securities loaned, marked-to-market daily. Any collateral shortfalls associated with increases in the valuation of the securities loaned are generally cured the next business day. The collateral can be received in the form of cash collateral and/or non-cash collateral. Non-cash collateral can include U.S. Government Securities and other securities as permitted by Securities and Exchange Commission ("SEC") guidelines. The cash collateral is invested in short-term instruments or cash equivalents, primarily open-end investment companies, as noted on the Fund's Schedule of Portfolio
16
Victory Variable Insurance Funds | | Notes to Financial Statements — continued
June 30, 2022 | |
(Unaudited)
Investments. The Fund effectively does not have control of the non-cash collateral and therefore it is not disclosed on the Fund's Schedule of Portfolio Investments. Collateral requirements are determined daily based on the value of the Fund's securities on loan as of the end of the prior business day. During the time portfolio securities are on loan, the borrower will pay the Fund any dividends or interest paid on such securities plus any fee negotiated between the parties to the lending agreement. The Fund also earns a return from the collateral. The Fund pays Citibank various fees in connection with the investment of cash collateral and fees based on the investment income received from securities lending activities. Securities lending income (net of these fees) is disclosed on the Statement of Operations. Loans are terminable upon demand and the borrower must return the loaned securities within the lesser of one standard settlement period or five business days. Although risk is mitigated by the collateral, the Fund could experience a delay in recovering its securities and possible loss of income or value if the borrower fails to return them. In addition, there is a risk that the value of the short-term investments will be less than the amount of cash collateral required to be returned to the borrower.
The Fund's agreement with Citibank does not include master netting provisions. Non-cash collateral received by the Fund may not be sold or repledged, except to satisfy borrower default.
As of June 30, 2022, the Fund did not have any securities on loan.
Foreign Currency Translations:
The accounting records of the Fund are maintained in U.S. dollars. Investment securities and other assets and liabilities of the Fund denominated in a foreign currency are translated into U.S. dollars at current exchange rates. Purchases and sales of securities, income receipts and expense payments are translated into U.S. dollars at the exchange rates on the date of the transactions. The Fund does not isolate the portion of the results of operations resulting from changes in foreign exchange rates on investments from fluctuations arising from changes in market prices of securities held. Such fluctuations are disclosed as Net change in unrealized appreciation/depreciation on investment securities and foreign currency translations on the Statement of Operations. Any realized gains or losses from these fluctuations are disclosed as Net realized gains (losses) from investment securities and foreign currency transactions on the Statement of Operations.
Foreign Taxes:
The Fund may be subject to foreign taxes related to foreign income received (a portion of which may be reclaimable), capital gains on the sale of securities, and certain foreign currency transactions. All foreign taxes are recorded in accordance with the applicable regulations and rates that exist in the foreign jurisdictions in which the Fund invests.
Federal Income Taxes:
The Fund intends to continue to qualify as a regulated investment company by complying with the provisions available to certain investment companies, as defined in applicable sections of the Internal Revenue Code, and to make distributions of net investment income and net realized gains sufficient to relieve it from all, or substantially all, federal income taxes. Accordingly, no provision for federal income taxes is required in the financial statements. The Fund has a tax year end of December 31.
For the six months ended June 30, 2022, the Fund did not incur any income tax, interest, or penalties, and has recorded no liability for net unrecognized tax benefits relating to uncertain tax positions.
Management of the Fund has reviewed tax positions taken in tax years that remain subject to examination by all major tax jurisdictions, including federal (i.e., the last four tax years, which includes the current fiscal tax year end). Management believes that there is no tax liability resulting from unrecognized tax benefits related to uncertain tax positions taken.
17
Victory Variable Insurance Funds | | Notes to Financial Statements — continued
June 30, 2022 | |
(Unaudited)
Allocations:
Expenses directly attributable to the Fund are charged to the Fund, while expenses that are attributable to more than one fund in the Trust, or jointly with an affiliated trust, are allocated among the respective funds in the Trust and/or an affiliated trust based upon net assets or another appropriate basis.
3. Purchases and Sales:
Purchases and sales of securities (excluding securities maturing less than one year from acquisition) for the six months ended June 30, 2022, were as follows:
Excluding
U.S. Government Securities | |
Purchases | | Sales | |
$ | 22,787,621 | | | $ | 24,835,595 | | |
4. Fees and Transactions with Affiliates and Related Parties:
Investment Advisory Fees:
Investment advisory services are provided to the Fund by the Adviser, which is a New York corporation registered as an investment adviser with the SEC. The Adviser is an indirect wholly owned subsidiary of Victory Capital Holdings, Inc., a publicly traded Delaware corporation, and a wholly owned direct subsidiary of Victory Capital Operating, LLC.
Under the terms of the Investment Advisory Agreement, the Adviser is entitled to receive fees accrued daily and paid monthly at an annualized rate of 0.80% of the Fund's average daily net assets. Amounts incurred and paid to VCM for the six months ended June 30, 2022, are reflected on the Statement of Operations as Investment advisory fees.
Administration and Servicing Fees:
VCM also serves as the Fund's administrator and fund accountant. Under the Administration and Fund Accounting Agreement, VCM is entitled to receive fees based on a percentage of the average daily net assets of the Trust, Victory Portfolios and Victory Portfolios II. The tiered rates at which VCM is paid by the Funds are shown in the table below:
Net Assets | |
Up to $15 billion | | $15 billion – $30 billion | | Over $30 billion | |
| | 0.08 | %, plus | | | 0.05 | %, plus | | | 0.04 | % | |
Amounts incurred for the six months ended June 30, 2022, are reflected on the Statement of Operations as Administration fees.
Citi Fund Services Ohio, Inc. ("Citi"), an affiliate of Citibank, acts as sub-administrator and sub-fund accountant to the Fund pursuant to the Sub-Administration and Sub-Fund Accounting Services Agreement between VCM and Citi. VCM pays Citi a fee for providing these services. The Trust reimburses VCM and Citi for out-of-pocket expenses incurred in providing these services and certain other expenses specifically allocated to the Fund. Amounts incurred for the six months ended June 30, 2022, are reflected on the Statement of Operations as Sub-Administration fees.
The Fund (as part of the Trust) has entered into an agreement with the Adviser to provide compliance services, pursuant to which the Adviser furnishes its compliance personnel, including the services of the Chief Compliance Officer ("CCO"), and other resources reasonably necessary to provide the Trust with compliance oversight services related to the design, administration, and oversight of a compliance program for the Trust in accordance with Rule 38a-1 under the 1940 Act. The CCO is an employee of the Adviser, which pays the compensation of the CCO and support staff. The funds in the Trust, Victory Portfolios, Victory Portfolios II and USAA Mutual Funds (collectively, the "Victory Funds Complex"), in
18
Victory Variable Insurance Funds | | Notes to Financial Statements — continued
June 30, 2022 | |
(Unaudited)
aggregate, compensate the Adviser for these services. Amounts incurred for the six months ended June 30, 2022, are reflected on the Statement of Operations as Compliance fees.
Transfer Agency Fees:
FIS Investor Services, LLC ("FIS") serves as the Fund's transfer agent. Under the Transfer Agent Agreement, the Trust pays FIS a fee for its services and reimburses FIS for all of their reasonable out-of-pocket expenses incurred in providing these services. Amounts incurred for the six months ended June 30, 2022, are reflected on the Statement of Operations as Transfer agent fees.
Distributor/Underwriting Services:
Victory Capital Services, Inc. (the "Distributor"), an affiliate of the Adviser, serves as Distributor for the continuous offering of the shares of the Fund pursuant to a Distribution Agreement between the Distributor and the Trust, and receives no fee or other compensation for these services.
Other Fees:
Citibank serves as the Fund's custodian. The Fund pays Citibank a fee for providing these services. Amounts incurred for the six months ended June 30, 2022, are reflected on the Statement of Operations as Custodian fees.
Sidley Austin LLP provides legal services to the Trust.
The Adviser has entered into an expense limitation agreement with the Fund until at least April 30, 2023. Under the terms of the agreement, the Adviser has agreed to waive fees or reimburse certain expenses to the extent that ordinary operating expenses incurred in any fiscal year exceed the expense limit for the Fund. Such excess amounts will be the liability of the Adviser. Acquired fund fees and expenses, interest, taxes, brokerage commissions, other expenditures which are capitalized in accordance with GAAP, and other extraordinary expenses not incurred in the ordinary course of a Fund's business are excluded from the expense limits. As of June 30, 2022, the expense limit (excluding voluntary waivers) is 0.93%.
Under the terms of the expense limitation agreement, as amended May 1, 2022, the Fund has agreed to repay fees and expenses that were waived or reimbursed by the Adviser for a period of up to three years (thirty-six (36) months) after the waiver or reimbursement took place, subject to the lesser of any operating expense limits in effect at the time of: (a) the original waiver or expense reimbursement; or (b) the recoupment, after giving effect to the recoupment amount.
As of June 30, 2022, the following amounts are available to be repaid to the Adviser. The Fund has not recorded any amounts available to be repaid as a liability due to an assessment that such repayment is not probable at June 30, 2022.
Expires
2022 | | Expires
2023 | | Expires
2024 | | Expires
2025 | | Total | |
| $ | 27,744 | | | $ | 67,482 | | | $ | 115,399 | | | $ | 118,055 | | | $ | 328,680 | | |
The Adviser may voluntarily waive or reimburse additional fees to assist the Fund in maintaining competitive expense ratios. Voluntary waivers and reimbursements applicable to the Fund is not available to be recouped at a future time. There were no voluntary waivers or reimbursements for the six months ended June 30, 2022.
Certain officers and/or interested trustees of the Fund are also officers and/or employees of the Adviser, administrator, fund accountant, sub-administrator, sub-fund accountant, custodian, legal counsel, and Distributor.
19
Victory Variable Insurance Funds | | Notes to Financial Statements — continued
June 30, 2022 | |
(Unaudited)
5. Risks:
The Fund may be subject to other risks in addition to these identified risks.
Equity Risk — The value of the equity securities in which the Fund invests may decline in response to developments affecting individual companies and/or general economic conditions in the United States or abroad. A company's earnings or dividends may not increase as expected (or may decline) because of poor management, competitive pressures, reliance on particular suppliers or geographical regions, labor problems or shortages, corporate restructurings, fraudulent disclosures, man-made or natural disasters, military confrontations or wars, terrorism, public health crises, or other events, conditions and factors. Price changes may be temporary or last for extended periods.
Foreign Securities Risk — The RS International VIP Series invest in securities of foreign issuers in various countries. Investing on an international basis involves certain risks not involved in domestic investments including the risk of nationalization or expropriation of assets, imposition of currency exchange controls or restrictions on the repatriation of foreign currency, confiscatory taxation, political or financial instability and diplomatic developments, which could affect the value of a Fund's investments in certain foreign countries. Governments of many countries have exercised, and continue to exercise, substantial influence over many aspects of the private sector through the ownership or control of many companies, including some of the largest in these countries. As a result, government actions in the future could have a significant effect on economic conditions which may adversely affect prices of certain portfolio securities. There is also generally less government supervision and regulation of stock exchanges, brokers and listed companies than in the U.S. Dividends or interest on, or proceeds from the sale of, foreign securities may be subject to foreign withholding taxes, and special U.S. tax considerations may apply. Moreover, foreign economies may differ favorably or unfavorably from the U.S. economy in such respects as growth of gross national product, rate of inflation, capital reinvestment, resource self-sufficiency and balance of payments position. The Schedule of Portfolio Investments includes information on the Fund's holdings, including industry and/or geographic composition, as relevant.
Market Risk — Overall market risks may affect the value of the Fund. Domestic and international factors such as political events, war, terrorism, trade disputes, inflation rates, interest rate levels and other fiscal and monetary policy changes, cybersecurity incidents, pandemics and other public health crises, sanctions against a particular foreign country, its nationals, businesses or industries and related geopolitical events, as well as environmental disasters such as earthquakes, fires, and floods or other catastrophes, may add to instability in global economies and markets generally, and may lead to increased market volatility. Global economies and financial markets are highly interconnected, which increases the possibility that conditions in one country or region might adversely affect issuers in another country or region. The impact of these and other factors may be short-term or may last for extended periods.
6. Borrowing and Interfund Lending:
Line of Credit:
The Victory Funds Complex participates in a short-term demand note "Line of Credit" agreement with Citibank. The Line of Credit agreement with Citibank was renewed on June 27, 2022, with a termination date of June 26, 2023. Under the agreement with Citibank, the Victory Funds Complex may borrow up to $600 million, of which $300 million is committed and $300 million is uncommitted. $40 million of the Line of Credit is reserved for use by the Victory Floating Rate Fund. another series of the Victory Funds Complex, with Victory Floating Rate Fund paying the related commitment fees for that amount. The purpose of the Line of Credit is to meet temporary or emergency cash needs. For the six months ended June 30, 2022, Citibank received an annual commitment fee of 0.15% on $300 million for providing the Line of Credit. Each fund in the Victory Funds Complex paid a pro-rata portion of the commitment fees plus any interest on amounts borrowed. For the period from January 1, 2022, through June 27, 2022, interest was based on the one-month London Interbank Offered Rate ("LIBOR") plus
20
Victory Variable Insurance Funds | | Notes to Financial Statements — continued
June 30, 2022 | |
(Unaudited)
one percent. Effective with the renewal, for the period June 28, 2022, through June 30, 2022, interest was based on the one-month Secured Overnight Financing Rate (SOFR) plus 1.10 percent. Interest charged to the Fund during the period, if applicable, is reflected on the Statement of Operations under Line of credit fees.
The Fund had no borrowings under the Line of Credit agreement during the six months ended June 30, 2022.
Interfund Lending:
The Trust and the Adviser rely on an exemptive order granted by the SEC in March 2017 (the "Order"), permitting the establishment and operation of an Interfund Lending Facility (the "Facility"). The Facility allows the Fund to directly lend and borrow money to or from any other fund in the Victory Funds Complex that is permitted to participate in the Facility, relying upon the Order at rates beneficial to both the borrowing and lending funds. Advances under the Facility are allowed for temporary or emergency purposes, including the meeting of redemption requests that otherwise might require the untimely disposition of securities, and are subject to each fund's borrowing restrictions. The interfund loan rate is determined, as specified in the Order, by averaging the current repurchase agreement rate and the current bank loan rate. As a Borrower, interest charged to the Fund, if any, during the period, is reflected on the Statement of Operations under Interfund lending fees. As a Lender, interest earned by the Fund, if any, during the period, is reflected on the Statement of Operations under Interfund lending.
The Fund did not utilize or participate in the Facility during the six months ended June 30, 2022.
7. Federal Income Tax Information:
The Fund intends to distribute any net investment income annually. Distributable net realized gains, if any, are declared and paid at least annually.
The amounts of dividends from net investment income and distributions from net realized gains (collectively, distributions to shareholders) are determined in accordance with federal income tax regulations, which may differ from GAAP. To the extent these "book/tax" differences are permanent in nature (e.g., net operating loss and distribution reclassification), such amounts are reclassified within the components of net assets based on their federal tax-basis treatment; temporary differences (e.g., wash sales) do not require reclassification. To the extent dividends and distributions exceed net investment income and net realized gains for tax purposes, they are reported as distributions of capital. Net investment losses incurred by the Fund may be reclassified as an offset to capital on the accompanying Statement of Assets and Liabilities.
The tax character of current year distributions paid and the tax basis of the current components of accumulated earnings (loss) will be determined at the end of the current tax year ending December 31, 2022.
At the tax year ended December 31, 2021, the Fund had no capital loss carryforward for federal income tax purposes.
21
Victory Variable Insurance Funds | | Supplemental Information
June 30, 2022 | |
(Unaudited)
Proxy Voting and Portfolio Holdings Information
Proxy Voting:
Information regarding the policies and procedures the Fund uses to determine how to vote proxies relating to portfolio securities is available without charge, upon request, by calling 800-539-3863. The information is also included in the Fund's Statement of Additional Information, which is available on the SEC's website at www.sec.gov.
Information relating to how the Fund voted proxies relating to portfolio securities held during the most recent 12 months ended June 30 is available on the SEC's website at www.sec.gov.
Availability of Schedules of Portfolio Investments:
The Trust files a complete list of Schedules of Portfolio Investments with the SEC for the first and third quarter of each fiscal year on Form N-PORT. Forms N-PORT are available on the SEC's website at www.sec.gov.
Expense Example
As a shareholder of the Fund, you may incur two types of costs: (1) transaction costs and (2) ongoing costs, including management fees and other Fund expenses. These examples are intended to help you understand your ongoing costs (in dollars) of investing in the Fund and to compare these costs with the ongoing costs of investing in other mutual funds.
These examples are based on an investment of $1,000 invested at the beginning of the period and held for the entire period from January 1, 2022, through June 30, 2022.
The Actual Expense figures in the table below provide information about actual account values and actual expenses. You may use the information below, together with the amount you invested, to estimate the expenses that you paid over the period. Simply divide your account value by $1,000 (for example, an $8,600 account value divided by $1,000 = 8.6), then multiply the result by the number in the table under the heading entitled "Actual Expenses Paid During Period" to estimate the expenses you paid on your account during this period.
The Hypothetical Expense figures in the table below provide information about hypothetical account values and hypothetical expenses based on the Fund's actual expense ratio and an assumed rate of return of 5% per year before expenses, which is not the Fund's actual return. The hypothetical account values and expenses may not be used to estimate the actual ending account balance or expenses you paid for the period. You may use this information to compare this 5% hypothetical example with the 5% hypothetical examples that appear in shareholder reports of other funds.
Please note the expenses shown in the table below are meant to highlight your ongoing costs only and do not reflect any transactional costs. Therefore, the hypothetical expenses in the table are useful in comparing ongoing costs only and will not help you determine the relative total costs of owning different funds. In addition, if these transactional costs were included, your costs would have been higher.
Beginning
Account Value
1/1/22 | | Actual
Ending
Account Value
6/30/22 | | Hypothetical
Ending
Account Value
6/30/22 | | Actual
Expenses Paid
During Period
1/1/22-6/30/22* | | Hypothetical
Expenses Paid
During Period
1/1/22-6/30/22* | | Annualized
Expense Ratio
During Period
1/1/22-6/30/22 | |
| $ | 1,000.00 | | | $ | 790.00 | | | $ | 1,020.18 | | | $ | 4.13 | | | $ | 4.66 | | | | 0.93 | % | |
* Expenses are equal to the average account value multiplied by the Fund's annualized expense ratio multiplied by 181/365 (the number of days in the most recent fiscal half-year divided by the number of days in the fiscal year).
22
Victory Variable Insurance Funds | | Supplemental Information — continued
June 30, 2022 | |
(Unaudited)
Liquidity Risk Management Program:
The Victory Funds have adopted and implemented a written liquidity risk management program (the "LRMP") as required by Rule 22e-4 under the Investment Company Act of 1940, as amended. The LRMP is reasonably designed to assess and manage the Fund's liquidity risk, taking into consideration the Fund's investment strategy and the liquidity of its portfolio investments during normal and reasonably foreseeable stressed market conditions; its short- and long-term cash flow projections; and its cash holdings and access to other liquidity management tools such as available funding sources including the Victory Funds Complex Interfund Lending Facility and Line of Credit (discussed in the Notes to Financial Statements). The Victory Funds' Board of Trustees approved the appointment of the Fund's investment adviser, Victory Capital Management Inc. ("Victory Capital"), as the administrator of the LRMP.
Victory Capital manages liquidity risks associated with the Fund's investments by monitoring, among other things, cash and cash equivalents, any use of derivatives, the concentration of investments, the appropriateness of the Fund's investment strategy, and by classifying every Fund investment as either highly liquid, moderately liquid, less liquid, or illiquid on at least a monthly basis. To assist with the classification of Fund investments, Victory Capital has retained a third-party provider of liquidity evaluation services. This provider determines preliminary liquidity classifications for all portfolio holdings based upon portfolio-level data and certain assumptions provided by Victory Capital. Victory Capital reviews the preliminary liquidity classifications and, when appropriate, considers other information including input from the Fund's portfolio managers (including the portfolio managers employed by any investment sub-advisers) in determining final liquidity classifications.
At a meeting held on February 24, 2022, Victory Capital provided an oral and written report to the Trustees on the operation and effectiveness of the LRMP during the previous year. The report from Victory Capital concluded that the Fund did not experience any significant liquidity challenges during the covered period, and the Fund's LRMP is reasonably designed to assess and manage its liquidity risk. The report also concluded that the LRMP continues to operate adequately and effectively to enable Victory Capital to oversee and manage liquidity risk and ensure the Fund is able to meet redemption requests without significant dilution to the remaining investors' interest in the Fund. During the review period, the Fund's portfolio consisted primarily of highly liquid investments, which are defined as cash and any investments that the Fund reasonably expects to be converted to cash in current market conditions in three business days or less without significantly changing the market value of the investment. Therefore, the Fund has not adopted a highly liquid investment minimum. The Fund's investments were below the limitation on illiquid investments during the review period. Additionally, Victory Capital indicated that no events occurred that would require the filing of Form N-LIQUID and recommended no material changes to the LRMP.
23
Privacy Policy
Protecting the Privacy of Information
The Trust respects your right to privacy. We also know that you expect us to conduct and process your business in an accurate and efficient manner. To do so, we must collect and maintain certain personal information about you. This is the information we collect from you on applications or other forms, and from the transactions you make with us or third parties. It may include your name, address, social security number, account transactions and balances, and information about investment goals and risk tolerance.
We do not disclose any information about you or about former customers to anyone except as permitted or required by law. Specifically, we may disclose the information we collect to companies that perform services on our behalf, such as the transfer agent that processes shareholder accounts and printers and mailers that assist us in the distribution of investor materials. We may also disclose this information to companies that perform marketing services on our behalf. This allows us to continue to offer you Victory investment products and services that meet your investing needs, and to effect transactions that you request or authorize. These companies will use this information only in connection with the services for which we hired them. They are not permitted to use or share this information for any other purpose.
To protect your personal information internally, we permit access only by authorized employees and maintain physical, electronic, and procedural safeguards to guard your personal information.*
* You may have received communications regarding information about privacy policies from other financial institutions which gave you the opportunity to "opt-out" of certain information sharing with companies which are not affiliated with that financial institution. The Trust does not share information with other companies for purposes of marketing solicitations for products other than the Trust. Therefore, the Trust does not provide opt-out options to their shareholders.
Victory Funds
P.O. Box 182593
Columbus, Ohio 43218-2593

Visit our website at: | | Call Victory at: | |
www.vcm.com | | 800-539-FUND (800-539-3863) | |

June 30, 2022
Semi Annual Report
Victory Variable Insurance Funds
Victory RS Large Cap Alpha VIP Series
www.vcm.com
News, Information And Education 24 Hours A Day, 7 Days A Week
The Victory Capital website gives fund shareholders, prospective shareholders, and investment professionals a convenient way to access fund information, get guidance, and track fund performance anywhere they can access the Internet. The site includes:
• Detailed performance records
• Daily share prices
• The latest fund news
• Investment resources to help you become a better investor
• A section dedicated to investment professionals
Whether you're a potential investor searching for the fund that matches your investment philosophy, a seasoned investor interested in planning tools, or an investment professional, www.vcm.com has what you seek. Visit us anytime. We're always open.
Victory Variable Insurance Funds
TABLE OF CONTENTS
Investment Objective & Portfolio Holdings | | | 3 | | |
Schedule of Portfolio Investments | | | 4 | | |
Financial Statements | |
Statement of Assets and Liabilities | | | 6 | | |
Statement of Operations | | | 7 | | |
Statements of Changes in Net Assets | | | 8 | | |
Financial Highlights | | | 10 | | |
Notes to Financial Statements | | | 12 | | |
Supplemental Information | | | 19 | | |
Proxy Voting and Portfolio Holdings Information | | | 19 | | |
Expense Example | | | 19 | | |
Liquidity Risk Management Program | | | 20 | | |
Privacy Policy (inside back cover) | | | |
1
The Fund is distributed by Victory Capital Services, Inc. Victory Capital Management Inc. is the investment adviser to the Fund and receives fees from the Fund for performing services for the Fund.
This report is not authorized for distribution to prospective investors unless preceded or accompanied by a current prospectus of the Fund.
For additional information about any Victory Fund, including fees, expenses, and risks, view our prospectus online at vcm.com or call 800-539-3863. Read it carefully before you invest or send money.
The information in this report is based on data obtained from recognized services and sources and is believed to be reliable. Any opinions, projections, or recommendations in this report are subject to change without notice and are not intended as individual investment advice. Past investment performance of the Fund, markets or securities mentioned herein should not be considered to be indicative of future results.
• NOT FDIC INSURED • NO BANK GUARANTEE • MAY LOSE VALUE

Call Victory at:
800-539-FUND (800-539-3863)
Visit our website at:
www.vcm.com
2
Victory Variable Insurance Funds
Victory RS Large Cap Alpha VIP Series | | June 30, 2022 | |
(Unaudited)
Investment Objective and Portfolio Holdings:
The Fund seeks to provide long-term capital appreciation.
Top 10 Holdings*:
June 30, 2022
(% of Net Assets)
The Progressive Corp. | | | 4.7 | % | |
Fairfax Financial Holdings Ltd. | | | 4.6 | % | |
Humana, Inc. | | | 4.2 | % | |
Vistra Corp. | | | 3.6 | % | |
Cigna Corp. | | | 3.5 | % | |
Cboe Global Markets, Inc. | | | 3.1 | % | |
AbbVie, Inc. | | | 2.8 | % | |
Medtronic PLC | | | 2.8 | % | |
Willis Towers Watson PLC | | | 2.8 | % | |
LKQ Corp. | | | 2.8 | % | |
Sector Allocation*:
June 30, 2022
(% of Net Assets)
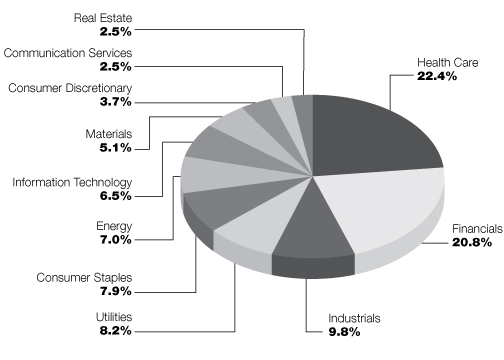
* Does not include futures contracts, money market instruments, and short-term investments purchased with cash collateral from securities loaned.
Percentages are of the net assets of the Fund and may not equal 100%.
Refer to the Schedule of Portfolio Investments for a complete list of securities.
3
Victory Variable Insurance Funds
Victory RS Large Cap Alpha VIP Series | | Schedule of Portfolio Investments
June 30, 2022 | |
(Unaudited)
Security Description | | Shares | | Value | |
Common Stocks (96.4%) | |
Communication Services (2.5%): | |
Alphabet, Inc., Class A (a) | | | 3,325 | | | $ | 7,246,039 | | |
Meta Platforms, Inc., Class A (a) | | | 79,760 | | | | 12,861,300 | | |
| | | | 20,107,339 | | |
Consumer Discretionary (3.7%): | |
LKQ Corp. | | | 450,370 | | | | 22,108,663 | | |
Target Corp. | | | 51,120 | | | | 7,219,678 | | |
| | | | 29,328,341 | | |
Consumer Staples (7.9%): | |
Keurig Dr Pepper, Inc. | | | 527,920 | | | | 18,683,089 | | |
Lamb Weston Holdings, Inc. | | | 171,380 | | | | 12,246,815 | | |
Mondelez International, Inc., Class A | | | 295,470 | | | | 18,345,732 | | |
U.S. Foods Holding Corp. (a) | | | 429,220 | | | | 13,168,470 | | |
| | | | 62,444,106 | | |
Energy (7.0%): | |
Enterprise Products Partners LP | | | 662,330 | | | | 16,140,982 | | |
Hess Corp. | | | 79,350 | | | | 8,406,339 | | |
Marathon Oil Corp. | | | 525,350 | | | | 11,809,868 | | |
Ovintiv, Inc. | | | 266,330 | | | | 11,769,123 | | |
Valero Energy Corp. | | | 72,820 | | | | 7,739,309 | | |
| | | | 55,865,621 | | |
Financials (20.8%): | |
Cboe Global Markets, Inc. | | | 218,560 | | | | 24,738,806 | | |
Comerica, Inc. | | | 299,050 | | | | 21,944,289 | | |
Fairfax Financial Holdings Ltd. | | | 69,630 | | | | 36,903,359 | | |
Interactive Brokers Group, Inc. | | | 267,520 | | | | 14,716,275 | | |
KeyCorp | | | 237,500 | | | | 4,092,125 | | |
State Street Corp. | | | 53,460 | | | | 3,295,809 | | |
The Progressive Corp. | | | 323,340 | | | | 37,594,742 | | |
Willis Towers Watson PLC | | | 113,720 | | | | 22,447,191 | | |
| | | | 165,732,596 | | |
Health Care (22.4%): | |
AbbVie, Inc. | | | 147,380 | | | | 22,572,721 | | |
Cigna Corp. | | | 104,960 | | | | 27,659,059 | | |
Humana, Inc. | | | 71,360 | | | | 33,401,475 | | |
Johnson & Johnson | | | 83,510 | | | | 14,823,860 | | |
Medtronic PLC | | | 250,340 | | | | 22,468,015 | | |
Merck & Co., Inc. | | | 238,400 | | | | 21,734,928 | | |
Sotera Health Co. (a) | | | 804,130 | | | | 15,752,907 | | |
UnitedHealth Group, Inc. | | | 39,145 | | | | 20,106,046 | | |
| | | | 178,519,011 | | |
See notes to financial statements.
4
Victory Variable Insurance Funds
Victory RS Large Cap Alpha VIP Series | | Schedule of Portfolio Investments — continued
June 30, 2022 | |
(Unaudited)
Security Description | | Shares | | Value | |
Industrials (9.8%): | |
FedEx Corp. | | | 35,310 | | | $ | 8,005,130 | | |
Johnson Controls International PLC | | | 165,390 | | | | 7,918,873 | | |
L3Harris Technologies, Inc. | | | 42,210 | | | | 10,202,157 | | |
Leidos Holdings, Inc. | | | 164,490 | | | | 16,565,788 | | |
PACCAR, Inc. | | | 49,000 | | | | 4,034,660 | | |
Raytheon Technologies Corp. | | | 104,071 | | | | 10,002,264 | | |
Sensata Technologies Holding PLC | | | 312,730 | | | | 12,918,876 | | |
Union Pacific Corp. | | | 37,430 | | | | 7,983,071 | | |
| | | | 77,630,819 | | |
Information Technology (6.5%): | |
Euronet Worldwide, Inc. (a) | | | 108,680 | | | | 10,932,121 | | |
Fidelity National Information Services, Inc. | | | 208,310 | | | | 19,095,778 | | |
FleetCor Technologies, Inc. (a) | | | 51,930 | | | | 10,911,012 | | |
Global Payments, Inc. | | | 100,730 | | | | 11,144,767 | | |
| | | | 52,083,678 | | |
Materials (5.1%): | |
Newmont Corp. | | | 244,380 | | | | 14,582,155 | | |
PPG Industries, Inc. | | | 46,650 | | | | 5,333,961 | | |
Sealed Air Corp. | | | 357,470 | | | | 20,633,168 | | |
| | | | 40,549,284 | | |
Real Estate (2.5%): | |
Host Hotels & Resorts, Inc. | | | 337,450 | | | | 5,291,216 | | |
Invitation Homes, Inc. | | | 398,270 | | | | 14,170,447 | | |
| | | | 19,461,663 | | |
Utilities (8.2%): | |
Constellation Energy Corp. | | | 186,149 | | | | 10,658,892 | | |
Exelon Corp. | | | 339,850 | | | | 15,402,002 | | |
FirstEnergy Corp. | | | 292,030 | | | | 11,211,032 | | |
Vistra Corp. | | | 1,237,179 | | | | 28,269,540 | | |
| | | | 65,541,466 | | |
Total Common Stocks (Cost $695,721,807) | | | 767,263,924 | | |
Total Investments (Cost $695,721,807) — 96.4% | | | 767,263,924 | | |
Other assets in excess of liabilities — 3.6% | | | 28,829,464 | | |
NET ASSETS — 100.00% | | $ | 796,093,388 | | |
(a) Non-income producing security.
LP — Limited Partnership
PLC — Public Limited Company
See notes to financial statements.
5
Victory Variable Insurance Funds | | Statement of Assets and Liabilities
June 30, 2022 | |
(Unaudited)
| | | Victory
RS Large Cap
Alpha VIP
Series | |
Assets: | |
Investments, at value (Cost $695,721,807) | | $ | 767,263,924 | | |
Cash | | | 28,546,412 | | |
Receivables: | |
Interest and dividends | | | 1,011,844 | | |
Capital shares issued | | | 208 | | |
From Adviser | | | 230,902 | | |
Prepaid expenses | | | 5,727 | | |
Total Assets | | | 797,059,017 | | |
Liabilities: | |
Payables: | |
Capital shares redeemed | | | 233,950 | | |
Accrued expenses and other payables: | |
Investment advisory fees | | | 336,861 | | |
Administration fees | | | 42,603 | | |
Custodian fees | | | 7,051 | | |
Transfer agent fees | | | 308,081 | | |
Compliance fees | | | 496 | | |
Trustees' fees | | | 36 | | |
Other accrued expenses | | | 36,551 | | |
Total Liabilities | | | 965,629 | | |
Net Assets: | |
Capital | | | 491,702,621 | | |
Total accumulated earnings/(loss) | | | 304,390,767 | | |
Net Assets | | $ | 796,093,388 | | |
Shares (unlimited shares authorized with a par value of $0.001 per share): | | | 15,742,965 | | |
Net asset value: | | $ | 50.57 | | |
See notes to financial statements.
6
Victory Variable Insurance Funds | | Statement of Operations
For the Six Months Ended June 30, 2022 | |
(Unaudited)
| | | Victory
RS Large Cap
Alpha VIP
Series | |
Investment Income: | |
Dividends | | $ | 8,037,961 | | |
Interest | | | 14,094 | | |
Securities lending (net of fees) | | | 1,083 | | |
Total Income | | | 8,053,138 | | |
Expenses: | |
Investment advisory fees | | | 2,207,740 | | |
Administration fees | | | 238,572 | | |
Sub-Administration fees | | | 7,859 | | |
Custodian fees | | | 20,705 | | |
Transfer agent fees | | | 675,448 | | |
Trustees' fees | | | 26,136 | | |
Compliance fees | | | 3,160 | | |
Legal and audit fees | | | 32,704 | | |
Other expenses | | | 11,390 | | |
Total Expenses | | | 3,223,714 | | |
Expenses waived/reimbursed by Adviser | | | (797,467 | ) | |
Net Expenses | | | 2,426,247 | | |
Net Investment Income (Loss) | | | 5,626,891 | | |
Realized/Unrealized Gains (Losses) from Investments: | |
Net realized gains (losses) from investment securities and foreign
currency transactions | | | 67,817,765 | | |
Net change in unrealized appreciation/depreciation on investment securities | | | (133,865,370 | ) | |
Net realized/unrealized gains (losses) on investments | | | (66,047,605 | ) | |
Change in net assets resulting from operations | | $ | (60,420,714 | ) | |
See notes to financial statements.
7
Victory Variable Insurance Funds | | Statements of Changes in Net Assets | |
| | | Victory RS Large Cap Alpha
VIP Series | |
| | | Six Months
Ended
June 30, 2022
(Unaudited) | | Year
Ended
December 31,
2021 | |
From Investment Activities: | |
Operations: | |
Net investment income (loss) | | $ | 5,626,891 | | | $ | 13,945,148 | | |
Net realized gains (losses) from investments | | | 67,817,765 | | | | 152,682,981 | | |
Net change in unrealized appreciation/depreciation
on investments | | | (133,865,370 | ) | | | 33,763,008 | | |
Change in net assets resulting from operations | | | (60,420,714 | ) | | | 200,391,137 | | |
Change in net assets resulting from distributions to shareholders | | | — | | | | (10,232,918 | ) | |
Change in net assets resulting from capital transactions | | | (95,453,398 | ) | | | (139,380,567 | ) | |
Change in net assets | | | (155,874,112 | ) | | | 50,777,652 | | |
Net Assets: | |
Beginning of period | | | 951,967,500 | | | | 901,189,848 | | |
End of period | | $ | 796,093,388 | | | $ | 951,967,500 | | |
Capital Transactions: | |
Proceeds from shares issued | | | 2,944,427 | | | | 15,969,173 | | |
Distributions reinvested | | | — | | | | 10,232,918 | | |
Cost of shares redeemed | | | (98,397,825 | ) | | | (165,582,658 | ) | |
Change in net assets resulting from capital transactions | | | (95,453,398 | ) | | | (139,380,567 | ) | |
Share Transactions: | |
Issued | | | 55,167 | | | | 308,380 | | |
Reinvested | | | — | | | | 192,493 | | |
Redeemed | | | (1,831,257 | ) | | | (3,239,565 | ) | |
Change in Shares | | | (1,776,090 | ) | | | (2,738,692 | ) | |
See notes to financial statements.
8
This page is intentionally left blank.
9
Victory Variable Insurance Funds | | Financial Highlights | |
For a Share Outstanding Throughout Each Period
| | | | | Investment Activities | | Distributions to
Shareholders From | |
| | | Net Asset
Value,
Beginning of
Period | | Net
Investment
Income
(Loss)(a) | | Net
Realized
and
Unrealized
Gains
(Losses) on
Investments | | Total from
Investment
Activities | | Net
Investment
Income | | Net Realized
Gains from
Investments | |
Victory RS Large Cap Alpha VIP Series | | | |
Six Months Ended
June 30, 2022
(Unaudited) | | $ | 54.34 | | | | 0.34 | | | | (4.11 | ) | | | (3.77 | ) | | | — | | | | — | | |
Year Ended December 31:
2021 | | $ | 44.49 | | | | 0.75 | | | | 9.69 | | | | 10.44 | | | | (0.59 | ) | | | — | | |
2020 | | $ | 48.27 | | | | 0.62 | | | | (0.90 | ) | | | (0.28 | ) | | | (0.56 | ) | | | (2.94 | ) | |
2019 | | $ | 43.45 | | | | 0.70 | | | | 12.75 | | | | 13.45 | | | | (0.48 | ) | | | (8.15 | ) | |
2018 | | $ | 54.01 | | | | 0.60 | | | | (5.44 | ) | | | (4.84 | ) | | | (0.02 | ) | | | (5.70 | ) | |
2017 | | $ | 45.98 | | | | 0.51 | | | | 8.07 | | | | 8.58 | | | | (0.55 | ) | | | — | | |
(a) Per share net investment income (loss) has been calculated using the average daily shares method.
(b) Not annualized for periods less than one year.
(c) Total returns do not reflect the effects of charges deducted pursuant to the terms of The Guardian Insurance & Annuity Company, Inc.'s variable contracts. Inclusion of such charges would reduce the total returns for all periods shown.
(d) Annualized for periods less than one year.
(e) Does not include acquire fund fees and expenses, if any.
(f) Reflects a return to normal trading levels after a prior-year strategy or allocation shift.
(g) Reflects an increase in trading activity due to asset allocation shifts.
See notes to financial statements.
10
Victory Variable Insurance Funds | | Financial Highlights — continued | |
For a Share Outstanding Throughout Each Period
| | | | | Ratios to Average Net Assets | | Supplemental Data | |
| | | Total
Distributions | | Net Asset
Value,
End of
Period | | Total
Return(b)(c) | | Net
Expenses(d)(e) | | Net
Investment
Income
(Loss)(d) | | Gross
Expenses(d)(e) | | Net Assets,
End of
Period
(000's) | | Portfolio
Turnover(b) | |
Victory RS Large Cap Alpha VIP Series | |
Six Months Ended
June 30, 2022
(Unaudited) | | | — | | | $ | 50.57 | | | | (6.94 | )% | | | 0.55 | % | | | 1.28 | % | | | 0.73 | % | | $ | 796,093 | | | | 29 | % | |
Year Ended December 31:
2021 | | | (0.59 | ) | | $ | 54.34 | | | | 23.49 | % | | | 0.55 | % | | | 1.47 | % | | | 0.73 | % | | $ | 951,968 | | | | 51 | %(f) | |
2020 | | | (3.50 | ) | | $ | 44.49 | | | | (0.44 | )% | | | 0.55 | % | | | 1.47 | % | | | 0.74 | % | | $ | 901,190 | | | | 101 | %(g) | |
2019 | | | (8.63 | ) | | $ | 48.27 | | | | 31.16 | % | | | 0.55 | % | | | 1.37 | % | | | 0.73 | % | | $ | 958,695 | | | | 50 | % | |
2018 | | | (5.72 | ) | | $ | 43.45 | | | | (9.00 | )% | | | 0.55 | % | | | 1.10 | % | | | 0.62 | % | | $ | 846,990 | | | | 60 | % | |
2017 | | | (0.55 | ) | | $ | 54.01 | | | | 18.67 | % | | | 0.55 | % | | | 1.02 | % | | | 0.60 | % | | $ | 1,060,740 | | | | 56 | % | |
See notes to financial statements.
11
Victory Variable Insurance Funds | | Notes to Financial Statements
June 30, 2022 | |
(Unaudited)
1. Organization:
Victory Variable Insurance Funds (the "Trust") is organized as a Delaware statutory trust and the Trust is registered under the Investment Company Act of 1940, as amended (the "1940 Act"), as an open-end investment company. The Trust is comprised of six funds and is authorized to issue an unlimited number of shares, which are units of beneficial interest with a par value of $0.001 per share.
The accompanying financial statements are those of the RS Large Cap Alpha VIP Series (the "Fund"), a series of the Trust. The Fund offers a single class of shares: Class I. The Fund's shares are only available for purchase by certain separate accounts of insurance companies as investments for certain variable annuity plans and variable life insurance contracts issued by those insurance companies. The Fund is classified as diversified under the 1940 Act.
Under the Trust's organizational documents, its officers and trustees are indemnified against certain liabilities arising out of the performance of their duties to the Fund. In addition, in the normal course of business, the Fund enters into contracts with its vendors and others that provide for general indemnifications. The Fund's maximum exposure under these arrangements is unknown, as this would involve future claims that may be made against the Fund. However, based on experience, the Fund expects that risk of loss to be remote.
2. Significant Accounting Policies:
The following is a summary of significant accounting policies followed by the Trust in the preparation of its financial statements. The policies are in conformity with U.S. Generally Accepted Accounting Principles ("GAAP"). The preparation of financial statements in accordance with GAAP requires management to make estimates and assumptions that affect the reported amounts of assets and liabilities and disclosure of contingent assets and liabilities at the date of the financial statements and the reported amounts of income and expenses for the period. Actual results could differ from those estimates. The Fund follows the specialized accounting and reporting requirements under GAAP that are applicable to investment companies under Accounting Standards Codification Topic 946.
Investment Valuation:
The Fund records investments at fair value. Fair value is defined as the price that would be received to sell an asset or paid to transfer a liability in an orderly transaction between market participants at the measurement date.
The valuation techniques described below maximize the use of observable inputs and minimize the use of unobservable inputs in determining fair value. The inputs used for valuing the Fund's investments are summarized in the three broad levels listed below:
• Level 1 — quoted prices in active markets for identical securities
• Level 2 — other significant observable inputs (including quoted prices for similar securities or interest rates applicable to those securities, etc.)
• Level 3 — significant unobservable inputs (including the Fund's own assumptions in determining the fair value of investments)
Changes in valuation techniques may result in transfers in or out of an assigned level within the disclosure hierarchy. The inputs or methodologies used for valuation techniques are not necessarily an indication of the risk associated with entering into those investments.
Victory Capital Management Inc. ("VCM" or the "Adviser") has established the Pricing and Liquidity Committee (the "Committee"), and subject to the Trust's Board of Trustees' (the "Board") oversight, the Committee administers and oversees the Fund's valuation policies and procedures, which are approved by the Board.
Portfolio securities listed or traded on securities exchanges, including Exchange-Traded Funds ("ETFs"), and American Depositary Receipts ("ADRs"), are valued at the closing price on the exchange or system where the security is principally traded, if available, or at the Nasdaq Official Closing Price. If there have been no sales for that day on the exchange or system, then a security is valued at the last available
12
Victory Variable Insurance Funds | | Notes to Financial Statements — continued
June 30, 2022 | |
(Unaudited)
bid quotation on the exchange or system where the security is principally traded. In each of these situations, valuations are typically categorized as Level 1 in the fair value hierarchy.
Investments in open-end investment companies, other than ETFs, are valued at their net asset value ("NAV"). These valuations are typically categorized as Level 1 in the fair value hierarchy.
In the event that price quotations or valuations are not readily available, investments are valued at fair value in accordance with procedures established by and under the general supervision and responsibility of the Board. These valuations are typically categorized as Level 2 or Level 3 in the fair value hierarchy, based on the observability of inputs used to determine the fair value. The effect of fair value pricing is that securities may not be priced on the basis of quotations from the primary market in which they are traded and the actual price realized from the sale of a security may differ materially from the fair value price. Valuing these securities at fair value is intended to cause the Fund's NAV to be more reliable than it otherwise would be.
A summary of the valuations as of June 30, 2022, is included in the table below while the breakdown, by category, of investments is disclosed on the Schedule of Portfolio Investments:
| | | Level 1 | | Level 2 | | Level 3 | | Total | |
Common Stocks | | $ | 767,263,924 | | | $ | — | | | $ | — | | | $ | 767,263,924 | | |
Total | | $ | 767,263,924 | | | $ | — | | | $ | — | | | $ | 767,263,924 | | |
For the six months ended June 30, 2022, there were no transfers in or out of Level 3 in the fair value hierarchy.
Real Estate Investment Trusts ("REITs"):
The Fund may invest in REITs, which report information on the source of their distributions annually. REITs are pooled investment vehicles that invest primarily in income-producing real estate or real-estate related loans or interests (such as mortgages). Certain distributions received from REITs during the year are recorded as realized gains or return of capital as estimated by the Fund or when such information becomes known.
Investment Companies:
Open-End Funds:
The Fund may invest in portfolios of open-end investment companies. These investment companies value securities in their portfolios for which market quotations are readily available at their market values (generally the last reported sale price) and all other securities and assets at their fair value by the methods established by the board of directors of the underlying funds.
Investment Transactions and Related Income:
Changes in holdings of investments are accounted for no later than one business day following the trade date. For financial reporting purposes, however, investment transactions are accounted for on trade date or the last business day of the reporting period. Interest income is determined on the basis of coupon interest accrued using the effective interest method which adjusts, where applicable, the amortization of premiums or accretion of discounts. Dividend income is recorded on the ex-dividend date. Gains or losses realized on sales of securities are recorded on the identified cost basis.
Securities Lending:
The Fund, through a Securities Lending Agreement with Citibank, N.A. ("Citibank"), may lend its securities to qualified financial institutions, such as certain broker-dealers and banks, to earn additional income, net of income retained by Citibank. Borrowers are required to initially secure their loans for collateral in the amount of at least 102% of the value of U.S. securities loaned or at least 105% of the value of non-U.S. securities loaned, marked-to-market daily. Any collateral shortfalls associated with
13
Victory Variable Insurance Funds | | Notes to Financial Statements — continued
June 30, 2022 | |
(Unaudited)
increases in the valuation of the securities loaned are generally cured the next business day. The collateral can be received in the form of cash collateral and/or non-cash collateral. Non-cash collateral can include U.S. Government Securities and other securities as permitted by Securities and Exchange Commission ("SEC") guidelines. The cash collateral is invested in short-term instruments or cash equivalents, primarily open-end investment companies, as noted on the Fund's Schedule of Portfolio Investments. The Fund effectively does not have control of the non-cash collateral and therefore it is not disclosed on the Fund's Schedule of Portfolio Investments. Collateral requirements are determined daily based on the value of the Fund's securities on loan as of the end of the prior business day. During the time portfolio securities are on loan, the borrower will pay the Fund any dividends or interest paid on such securities plus any fee negotiated between the parties to the lending agreement. The Fund also earns a return from the collateral. The Fund pays Citibank various fees in connection with the investment of cash collateral and fees based on the investment income received from securities lending activities. Securities lending income (net of these fees) is disclosed on the Statement of Operations. Loans are terminable upon demand and the borrower must return the loaned securities within the lesser of one standard settlement period or five business days. Although risk is mitigated by the collateral, the Fund could experience a delay in recovering its securities and possible loss of income or value if the borrower fails to return them. In addition, there is a risk that the value of the short-term investments will be less than the amount of cash collateral required to be returned to the borrower.
The Fund's agreement with Citibank does not include master netting provisions. Non-cash collateral received by the Fund may not be sold or repledged, except to satisfy borrower default.
As of June 30, 2022, the Fund did not have any securities on loan.
Foreign Currency Translations:
The accounting records of the Fund are maintained in U.S. dollars. Investment securities and other assets and liabilities of the Fund denominated in a foreign currency are translated into U.S. dollars at current exchange rates. Purchases and sales of securities, income receipts and expense payments are translated into U.S. dollars at the exchange rates on the date of the transactions. The Fund does not isolate the portion of the results of operations resulting from changes in foreign exchange rates on investments from fluctuations arising from changes in market prices of securities held. Such fluctuations are disclosed as Net change in unrealized appreciation/depreciation on investment securities and foreign currency translations on the Statement of Operations. Any realized gains or losses from these fluctuations are disclosed as Net realized gains (losses) from investment securities and foreign currency transactions on the Statement of Operations.
Federal Income Taxes:
The Fund intends to continue to qualify as a regulated investment company by complying with the provisions available to certain investment companies, as defined in applicable sections of the Internal Revenue Code, and to make distributions of net investment income and net realized gains sufficient to relieve it from all, or substantially all, federal income taxes. Accordingly, no provision for federal income taxes is required in the financial statements. The Fund has a tax year end of December 31.
For the six months ended June 30, 2022, the Fund did not incur any income tax, interest, or penalties, and has recorded no liability for net unrecognized tax benefits relating to uncertain tax positions.
Management of the Fund has reviewed tax positions taken in tax years that remain subject to examination by all major tax jurisdictions, including federal (i.e., the last four tax years, which includes the current fiscal tax year end). Management believes that there is no tax liability resulting from unrecognized tax benefits related to uncertain tax positions taken.
Allocations:
Expenses directly attributable to the Fund are charged to the Fund, while expenses that are attributable to more than one fund in the Trust, or jointly with an affiliated trust, are allocated among the respective funds in the Trust and/or an affiliated trust based upon net assets or another appropriate basis.
14
Victory Variable Insurance Funds | | Notes to Financial Statements — continued
June 30, 2022 | |
(Unaudited)
3. Purchases and Sales:
Purchases and sales of securities (excluding securities maturing less than one year from acquisition) for the six months ended June 30, 2022, were as follows:
Excluding
U.S. Government Securities | |
Purchases | | Sales | |
$ | 248,542,707 | | | $ | 339,158,783 | | |
4. Fees and Transactions with Affiliates and Related Parties:
Investment Advisory Fees:
Investment advisory services are provided to the Fund by the Adviser, which is a New York corporation registered as an investment adviser with the SEC. The Adviser is an indirect wholly owned subsidiary of Victory Capital Holdings, Inc., a publicly traded Delaware corporation, and a wholly owned direct subsidiary of Victory Capital Operating, LLC. Under the terms of the Investment Advisory Agreement, the Adviser is entitled to receive fees accrued daily and paid monthly at an annualized rate of 0.50% of the Fund's average daily net assets. Amounts incurred and paid to VCM for the six months ended June 30, 2022, are reflected on the Statement of Operations as Investment advisory fees.
Administration and Servicing Fees:
VCM also serves as the Fund's administrator and fund accountant. Under the Administration and Fund Accounting Agreement, VCM is entitled to receive fees based on a percentage of the average daily net assets of the Trust, Victory Portfolios and Victory Portfolios II. The tiered rates at which VCM is paid by the Funds are shown in the table below:
Net Assets | |
Up to $15 billion | | $15 billion – $30 billion | | Over $30 billion | |
| | 0.08 | %, plus | | | 0.05 | %, plus | | | 0.04 | % | |
Amounts incurred for the six months ended June 30, 2022, are reflected on the Statement of Operations as Administration fees.
Citi Fund Services Ohio, Inc. ("Citi"), an affiliate of Citibank, acts as sub-administrator and sub-fund accountant to the Fund pursuant to the Sub-Administration and Sub-Fund Accounting Services Agreement between VCM and Citi. VCM pays Citi a fee for providing these services. The Trust reimburses VCM and Citi for out-of-pocket expenses incurred in providing these services and certain other expenses specifically allocated to the Fund. Amounts incurred for the six months ended June 30, 2022, are reflected on the Statement of Operations as Sub-Administration fees.
The Fund (as part of the Trust) has entered into an agreement with the Adviser to provide compliance services, pursuant to which the Adviser furnishes its compliance personnel, including the services of the Chief Compliance Officer ("CCO"), and other resources reasonably necessary to provide the Trust with compliance oversight services related to the design, administration, and oversight of a compliance program for the Trust in accordance with Rule 38a-1 under the 1940 Act. The CCO is an employee of the Adviser, which pays the compensation of the CCO and support staff. The funds in the Trust, Victory Portfolios, Victory Portfolios II and USAA Mutual Funds (collectively, the "Victory Funds Complex"), in aggregate, compensate the Adviser for these services. Amounts incurred for the six months ended June 30, 2022, are reflected on the Statement of Operations as Compliance fees.
Transfer Agency Fees:
FIS Investor Services, LLC ("FIS") serves as the Fund's transfer agent. Under the Transfer Agent Agreement, the Trust pays FIS a fee for its services and reimburses FIS for all of their reasonable out-of-pocket expenses incurred in providing these services. Amounts incurred for the six months ended June 30, 2022, are reflected on the Statement of Operations as Transfer agent fees.
15
Victory Variable Insurance Funds | | Notes to Financial Statements — continued
June 30, 2022 | |
(Unaudited)
Distributor/Underwriting Services:
Victory Capital Services, Inc. (the "Distributor"), an affiliate of the Adviser, serves as Distributor for the continuous offering of the shares of the Fund pursuant to a Distribution Agreement between the Distributor and the Trust, and receives no fee or other compensation for these services.
Other Fees:
Citibank serves as the Fund's custodian. The Fund pays Citibank a fee for providing these services. Amounts incurred for the six months ended June 30, 2022, are reflected on the Statement of Operations as Custodian fees.
Sidley Austin LLP provides legal services to the Trust.
The Adviser has entered into an expense limitation agreement with the Fund until at least April 30, 2023. Under the terms of the agreement, the Adviser has agreed to waive fees or reimburse certain expenses to the extent that ordinary operating expenses incurred in any fiscal year exceed the expense limit for the Fund. Such excess amounts will be the liability of the Adviser. Acquired fund fees and expenses, interest, taxes, brokerage commissions, other expenditures which are capitalized in accordance with GAAP, and other extraordinary expenses not incurred in the ordinary course of a Fund's business are excluded from the expense limits. As of June 30, 2022, the expense limit (excluding voluntary waivers) is 0.55%.
Under the terms of the expense limitation agreement, as amended May 1, 2022, the Fund has agreed to repay fees and expenses that were waived or reimbursed by the Adviser for a period of up to three years (thirty-six (36) months) after the waiver or reimbursement took place, subject to the lesser of any operating expense limits in effect at the time of: (a) the original waiver or expense reimbursement; or (b) the recoupment, after giving effect to the recoupment amount.
As of June 30, 2022, the following amounts are available to be repaid to the Adviser. The Fund has not recorded any amounts available to be repaid as a liability due to an assessment that such repayment is not probable at June 30, 2022.
Expires
2022 | | Expires
2023 | | Expires
2024 | | Expires
2025 | | Total | |
| $ | 850,328 | | | $ | 1,542,248 | | | $ | 1,660,693 | | | $ | 797,466 | | | $ | 4,850,735 | | |
The Adviser may voluntarily waive or reimburse additional fees to assist the Fund in maintaining competitive expense ratios. Voluntary waivers and reimbursements applicable to the Fund is not available to be recouped at a future time. There were no voluntary waivers or reimbursements for the six months ended June 30, 2022.
Certain officers and/or interested trustees of the Fund are also officers and/or employees of the Adviser, administrator, fund accountant, sub-administrator, sub-fund accountant, custodian, legal counsel, and Distributor.
5. Risks:
The Fund may be subject to other risks in addition to these identified risks.
Equity Risk — The value of the equity securities in which the Fund invests may decline in response to developments affecting individual companies and/or general economic conditions in the United States or abroad. A company's earnings or dividends may not increase as expected (or may decline) because of poor management, competitive pressures, reliance on particular suppliers or geographical regions, labor problems or shortages, corporate restructurings, fraudulent disclosures, man-made or natural disasters, military confrontations or wars, terrorism, public health crises, or other events, conditions and factors. Price changes may be temporary or last for extended periods.
Limited Portfolio Risk — To the extent the Fund invests its assets in a more limited number of issuers than many other mutual funds, a decline in the market value of a particular security may affect the Fund's value more than if the Fund invested in a larger number of issuers.
16
Victory Variable Insurance Funds | | Notes to Financial Statements — continued
June 30, 2022 | |
(Unaudited)
Market Risk — Overall market risks may affect the value of the Fund. Domestic and international factors such as political events, war, terrorism, trade disputes, inflation rates, interest rate levels and other fiscal and monetary policy changes, cybersecurity incidents, pandemics and other public health crises, sanctions against a particular foreign country, its nationals, businesses or industries and related geopolitical events, as well as environmental disasters such as earthquakes, fires, and floods or other catastrophes, may add to instability in global economies and markets generally, and may lead to increased market volatility. Global economies and financial markets are highly interconnected, which increases the possibility that conditions in one country or region might adversely affect issuers in another country or region. The impact of these and other factors may be short-term or may last for extended periods.
6. Borrowing and Interfund Lending:
Line of Credit:
The Victory Funds Complex participates in a short-term demand note "Line of Credit" agreement with Citibank. The Line of Credit agreement with Citibank was renewed on June 27, 2022, with a termination date of June 26, 2023. Under the agreement with Citibank, the Victory Funds Complex may borrow up to $600 million, of which $300 million is committed and $300 million is uncommitted. $40 million of the Line of Credit is reserved for use by the Victory Floating Rate Fund. another series of the Victory Funds Complex, with Victory Floating Rate Fund paying the related commitment fees for that amount. The purpose of the Line of Credit is to meet temporary or emergency cash needs. For the six months ended June 30, 2022, Citibank received an annual commitment fee of 0.15% on $300 million for providing the Line of Credit. Each fund in the Victory Funds Complex paid a pro-rata portion of the commitment fees plus any interest on amounts borrowed. For the period from January 1, 2022, through June 27, 2022, interest was based on the one-month London Interbank Offered Rate ("LIBOR") plus one percent. Effective with the renewal, for the period June 28, 2022, through June 30, 2022, interest was based on the one-month Secured Overnight Financing Rate (SOFR) plus 1.10 percent. Interest charged to the Fund during the period, if applicable, is reflected on the Statement of Operations under Line of credit fees.
The Fund had no borrowings under the Line of Credit agreement during the six months ended June 30, 2022.
Interfund Lending:
The Trust and the Adviser rely on an exemptive order granted by the SEC in March 2017 (the "Order"), permitting the establishment and operation of an Interfund Lending Facility (the "Facility"). The Facility allows the Fund to directly lend and borrow money to or from any other fund in the Victory Funds Complex that is permitted to participate in the Facility, relying upon the Order at rates beneficial to both the borrowing and lending funds. Advances under the Facility are allowed for temporary or emergency purposes, including the meeting of redemption requests that otherwise might require the untimely disposition of securities, and are subject to each fund's borrowing restrictions. The interfund loan rate is determined, as specified in the Order, by averaging the current repurchase agreement rate and the current bank loan rate. As a Borrower, interest charged to the Fund, if any, during the period, is reflected on the Statement of Operations under Interfund lending fees. As a Lender, interest earned by the Fund, if any, during the period, is reflected on the Statement of Operations under Interfund lending.
The Fund did not utilize or participate in the Facility during the six months ended June 30, 2022.
17
Victory Variable Insurance Funds | | Notes to Financial Statements — continued
June 30, 2022 | |
(Unaudited)
7. Federal Income Tax Information:
The Fund intends to distribute any net investment income annually. Distributable net realized gains, if any, are declared and paid at least annually.
The amounts of dividends from net investment income and distributions from net realized gains (collectively, distributions to shareholders) are determined in accordance with federal income tax regulations, which may differ from GAAP. To the extent these "book/tax" differences are permanent in nature (e.g., net operating loss and distribution reclassification), such amounts are reclassified within the components of net assets based on their federal tax-basis treatment; temporary differences (e.g., wash sales) do not require reclassification. To the extent dividends and distributions exceed net investment income and net realized gains for tax purposes, they are reported as distributions of capital. Net investment losses incurred by the Fund may be reclassified as an offset to capital on the accompanying Statement of Assets and Liabilities.
The tax character of current year distributions paid and the tax basis of the current components of accumulated earnings (loss) will be determined at the end of the current tax year ending December 31, 2022.
At the tax year ended December 31, 2021, the Fund had no capital loss carryforward for federal income tax purposes.
18
Victory Variable Insurance Funds | | Supplemental Information
June 30, 2022 | |
(Unaudited)
Proxy Voting and Portfolio Holdings Information
Proxy Voting:
Information regarding the policies and procedures the Fund uses to determine how to vote proxies relating to portfolio securities is available without charge, upon request, by calling 800-539-3863. The information is also included in the Fund's Statement of Additional Information, which is available on the SEC's website at www.sec.gov.
Information relating to how the Fund voted proxies relating to portfolio securities held during the most recent 12 months ended June 30 is available on the SEC's website at www.sec.gov.
Availability of Schedules of Portfolio Investments:
The Trust files a complete list of Schedules of Portfolio Investments with the SEC for the first and third quarter of each fiscal year on Form N-PORT. Forms N-PORT are available on the SEC's website at www.sec.gov.
Expense Example
As a shareholder of the Fund, you may incur two types of costs: (1) transaction costs and (2) ongoing costs, including management fees and other Fund expenses. These examples are intended to help you understand your ongoing costs (in dollars) of investing in the Fund and to compare these costs with the ongoing costs of investing in other mutual funds.
These examples are based on an investment of $1,000 invested at the beginning of the period and held for the entire period from January 1, 2022, through June 30, 2022.
The Actual Expense figures in the table below provide information about actual account values and actual expenses. You may use the information below, together with the amount you invested, to estimate the expenses that you paid over the period. Simply divide your account value by $1,000 (for example, an $8,600 account value divided by $1,000 = 8.6), then multiply the result by the number in the table under the heading entitled "Actual Expenses Paid During Period" to estimate the expenses you paid on your account during this period.
The Hypothetical Expense figures in the table below provide information about hypothetical account values and hypothetical expenses based on the Fund's actual expense ratio and an assumed rate of return of 5% per year before expenses, which is not the Fund's actual return. The hypothetical account values and expenses may not be used to estimate the actual ending account balance or expenses you paid for the period. You may use this information to compare this 5% hypothetical example with the 5% hypothetical examples that appear in shareholder reports of other funds.
Please note the expenses shown in the table below are meant to highlight your ongoing costs only and do not reflect any transactional costs. Therefore, the hypothetical expenses in the table are useful in comparing ongoing costs only and will not help you determine the relative total costs of owning different funds. In addition, if these transactional costs were included, your costs would have been higher.
Beginning
Account
Value
1/1/22 | | Actual
Ending
Account
Value
6/30/22 | | Hypothetical
Ending
Account
Value
6/30/22 | | Actual
Expenses
Paid During
Period
1/1/22-6/30/22* | | Hypothetical
Expenses
Paid During
Period
1/1/22-6/30/22* | | Annualized
Expense Ratio
During Period
1/1/22-6/30/22 | |
| $ | 1,000.00 | | | $ | 930.60 | | | $ | 1,022.07 | | | $ | 2.63 | | | $ | 2.76 | | | | 0.55 | % | |
* Expenses are equal to the average account value multiplied by the Fund's annualized expense ratio multiplied by 181/365 (the number of days in the most recent fiscal half-year divided by the number of days in the fiscal year).
19
Victory Variable Insurance Funds | | Supplemental Information — continued
June 30, 2022 | |
(Unaudited)
Liquidity Risk Management Program:
The Victory Funds have adopted and implemented a written liquidity risk management program (the "LRMP") as required by Rule 22e-4 under the Investment Company Act of 1940, as amended. The LRMP is reasonably designed to assess and manage the Fund's liquidity risk, taking into consideration the Fund's investment strategy and the liquidity of its portfolio investments during normal and reasonably foreseeable stressed market conditions; its short- and long-term cash flow projections; and its cash holdings and access to other liquidity management tools such as available funding sources including the Victory Funds Complex Interfund Lending Facility and Line of Credit (discussed in the Notes to Financial Statements). The Victory Funds' Board of Trustees approved the appointment of the Fund's investment adviser, Victory Capital Management Inc. ("Victory Capital"), as the administrator of the LRMP.
Victory Capital manages liquidity risks associated with the Fund's investments by monitoring, among other things, cash and cash equivalents, any use of derivatives, the concentration of investments, the appropriateness of the Fund's investment strategy, and by classifying every Fund investment as either highly liquid, moderately liquid, less liquid, or illiquid on at least a monthly basis. To assist with the classification of Fund investments, Victory Capital has retained a third-party provider of liquidity evaluation services. This provider determines preliminary liquidity classifications for all portfolio holdings based upon portfolio-level data and certain assumptions provided by Victory Capital. Victory Capital reviews the preliminary liquidity classifications and, when appropriate, considers other information including input from the Fund's portfolio managers (including the portfolio managers employed by any investment sub-advisers) in determining final liquidity classifications.
At a meeting held on February 24, 2022, Victory Capital provided an oral and written report to the Trustees on the operation and effectiveness of the LRMP during the previous year. The report from Victory Capital concluded that the Fund did not experience any significant liquidity challenges during the covered period, and the Fund's LRMP is reasonably designed to assess and manage its liquidity risk. The report also concluded that the LRMP continues to operate adequately and effectively to enable Victory Capital to oversee and manage liquidity risk and ensure the Fund is able to meet redemption requests without significant dilution to the remaining investors' interest in the Fund. During the review period, the Fund's portfolio consisted primarily of highly liquid investments, which are defined as cash and any investments that the Fund reasonably expects to be converted to cash in current market conditions in three business days or less without significantly changing the market value of the investment. Therefore, the Fund has not adopted a highly liquid investment minimum. The Fund's investments were below the limitation on illiquid investments during the review period. Additionally, Victory Capital indicated that no events occurred that would require the filing of Form N-LIQUID and recommended no material changes to the LRMP.
20
Privacy Policy
Protecting the Privacy of Information
The Trust respects your right to privacy. We also know that you expect us to conduct and process your business in an accurate and efficient manner. To do so, we must collect and maintain certain personal information about you. This is the information we collect from you on applications or other forms, and from the transactions you make with us or third parties. It may include your name, address, social security number, account transactions and balances, and information about investment goals and risk tolerance.
We do not disclose any information about you or about former customers to anyone except as permitted or required by law. Specifically, we may disclose the information we collect to companies that perform services on our behalf, such as the transfer agent that processes shareholder accounts and printers and mailers that assist us in the distribution of investor materials. We may also disclose this information to companies that perform marketing services on our behalf. This allows us to continue to offer you Victory investment products and services that meet your investing needs, and to effect transactions that you request or authorize. These companies will use this information only in connection with the services for which we hired them. They are not permitted to use or share this information for any other purpose.
To protect your personal information internally, we permit access only by authorized employees and maintain physical, electronic, and procedural safeguards to guard your personal information.*
* You may have received communications regarding information about privacy policies from other financial institutions which gave you the opportunity to "opt-out" of certain information sharing with companies which are not affiliated with that financial institution. The Trust does not share information with other companies for purposes of marketing solicitations for products other than the Trust. Therefore, the Trust does not provide opt-out options to their shareholders.
Victory Funds
P.O. Box 182593
Columbus, Ohio 43218-2593

Visit our website at: | | Call Victory at: | |
www.vcm.com | | 800-539-FUND (800-539-3863) | |
VVIF-RS-LCAVIP-SAR (6/22)

June 30, 2022
Semi Annual Report
Victory Variable Insurance Funds
Victory 500 Index VIP Series
www.vcm.com
News, Information And Education 24 Hours A Day, 7 Days A Week
The Victory Capital website gives fund shareholders, prospective shareholders, and investment professionals a convenient way to access fund information, get guidance, and track fund performance anywhere they can access the Internet. The site includes:
• Detailed performance records
• Daily share prices
• The latest fund news
• Investment resources to help you become a better investor
• A section dedicated to investment professionals
Whether you're a potential investor searching for the fund that matches your investment philosophy, a seasoned investor interested in planning tools, or an investment professional, www.vcm.com has what you seek. Visit us anytime. We're always open.
Victory Variable Insurance Funds
TABLE OF CONTENTS
Investment Objective & Portfolio Holdings | | | 3 | | |
Schedule of Portfolio Investments | | | 4 | | |
Financial Statements | |
Statement of Assets and Liabilities | | | 16 | | |
Statement of Operations | | | 17 | | |
Statements of Changes in Net Assets | | | 18 | | |
Financial Highlights | | | 20 | | |
Notes to Financial Statements | | | 22 | | |
Supplemental Information | | | 30 | | |
Proxy Voting and Portfolio Holdings Information | | | 30 | | |
Expense Example | | | 30 | | |
Liquidity Risk Management Program | | | 31 | | |
Privacy Policy (inside back cover) | | | |
1
The Fund is distributed by Victory Capital Services, Inc. Victory Capital Management Inc. is the investment adviser to the Fund and receives fees from the Fund for performing services for the Fund.
This report is not authorized for distribution to prospective investors unless preceded or accompanied by a current prospectus of the Fund.
For additional information about any Victory Fund, including fees, expenses, and risks, view our prospectus online at vcm.com or call 800-539-3863. Read it carefully before you invest or send money.
The information in this report is based on data obtained from recognized services and sources and is believed to be reliable. Any opinions, projections, or recommendations in this report are subject to change without notice and are not intended as individual investment advice. Past investment performance of the Fund, markets or securities mentioned herein should not be considered to be indicative of future results.
• NOT FDIC INSURED • NO BANK GUARANTEE • MAY LOSE VALUE

Call Victory at:
800-539-FUND (800-539-3863)
Visit our website at:
www.vcm.com
2
Victory Variable Insurance Funds
Victory 500 Index VIP Series | | June 30, 2022 | |
(Unaudited)
Investment Objective and Portfolio Holdings:
The Fund seeks to match, before fees and expenses, the performance of the stocks composing the Victory US Large Cap 500 Index.
Top 10 Holdings*:
June 30, 2022
(% of Net Assets)
Apple, Inc. | | | 7.0 | % | |
Microsoft Corp. | | | 5.9 | % | |
Amazon.com, Inc. | | | 3.2 | % | |
Alphabet, Inc., Class C | | | 2.2 | % | |
Alphabet, Inc., Class A | | | 2.0 | % | |
Tesla, Inc. | | | 2.0 | % | |
UnitedHealth Group, Inc. | | | 1.5 | % | |
Johnson & Johnson | | | 1.4 | % | |
NVIDIA Corp. | | | 1.2 | % | |
Berkshire Hathaway, Inc., Class B | | | 1.2 | % | |
Sector Allocation*:
June 30, 2022
(% of Net Assets)
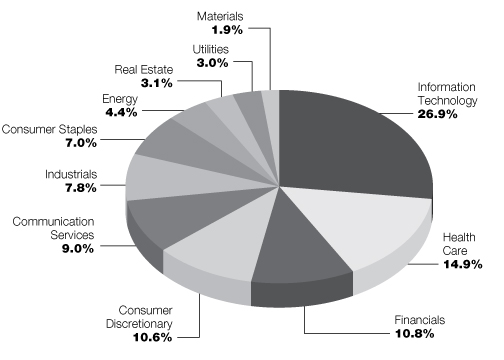
* Does not include futures contracts, money market instruments, and short-term investments purchased with cash collateral from securities loaned.
Percentages are of the net assets of the Fund and may not equal 100%.
Refer to the Schedule of Portfolio Investments for a complete list of securities.
3
Victory Variable Insurance Funds
Victory 500 Index VIP Series | | Schedule of Portfolio Investments
June 30, 2022 | |
(Unaudited)
Security Description | | Shares | | Value | |
Common Stocks (99.4%) | |
Communication Services (9.0%): | |
Activision Blizzard, Inc. | | | 1,999 | | | $ | 155,642 | | |
Alphabet, Inc., Class C (a) | | | 853 | | | | 1,865,895 | | |
Alphabet, Inc., Class A (a) | | | 794 | | | | 1,730,332 | | |
AT&T, Inc. | | | 19,316 | | | | 404,863 | | |
Charter Communications, Inc., Class A (a) | | | 343 | | | | 160,706 | | |
Comcast Corp., Class A | | | 11,794 | | | | 462,796 | | |
DISH Network Corp., Class A (a) | | | 602 | | | | 10,794 | | |
Electronic Arts, Inc. | | | 715 | | | | 86,980 | | |
Endeavor Group Holdings, Inc., Class A (a) | | | 59 | | | | 1,213 | | |
Live Nation Entertainment, Inc. (a) | | | 414 | | | | 34,188 | | |
Match Group, Inc. (a) | | | 762 | | | | 53,104 | | |
Meta Platforms, Inc., Class A (a) | | | 5,935 | | | | 957,019 | | |
Netflix, Inc. (a) | | | 1,186 | | | | 207,396 | | |
Omnicom Group, Inc. | | | 549 | | | | 34,922 | | |
Paramount Global, Class A | | | 27 | | | | 736 | | |
Paramount Global, Class B | | | 1,381 | | | | 34,083 | | |
Pinterest, Inc., Class A (a) | | | 263 | | | | 4,776 | | |
ROBLOX Corp., Class A (a) | | | 572 | | | | 18,796 | | |
Roku, Inc. (a) (b) | | | 58 | | | | 4,764 | | |
Sirius XM Holdings, Inc. (c) | | | 2,124 | | | | 13,020 | | |
Snap, Inc., Class A (a) | | | 3,336 | | | | 43,802 | | |
Take-Two Interactive Software, Inc. (a) | | | 432 | | | | 52,933 | | |
The Interpublic Group of Cos., Inc. | | | 950 | | | | 26,153 | | |
The Walt Disney Co. (a) | | | 4,395 | | | | 414,888 | | |
T-Mobile U.S., Inc. (a) | | | 1,816 | | | | 244,324 | | |
Twitter, Inc. (a) | | | 1,953 | | | | 73,023 | | |
Verizon Communications, Inc. | | | 11,093 | | | | 562,970 | | |
Warner Music Group Corp., Class A | | | 219 | | | | 5,335 | | |
ZoomInfo Technologies, Inc. (a) | | | 721 | | | | 23,966 | | |
| | | | 7,689,419 | | |
Communications Equipment (0.8%): | |
Arista Networks, Inc. (a) | | | 744 | | | | 69,743 | | |
Cisco Systems, Inc. | | | 11,209 | | | | 477,952 | | |
Motorola Solutions, Inc. | | | 418 | | | | 87,613 | | |
Ubiquiti, Inc. (c) | | | 12 | | | | 2,978 | | |
| | | | 638,286 | | |
Consumer Discretionary (10.6%): | |
Airbnb, Inc., Class A (a) | | | 165 | | | | 14,698 | | |
Amazon.com, Inc. (a) | | | 26,015 | | | | 2,763,053 | | |
AutoZone, Inc. (a) | | | 47 | | | | 101,009 | | |
Bath & Body Works, Inc. | | | 559 | | | | 15,048 | | |
Best Buy Co., Inc. | | | 537 | | | | 35,007 | | |
Booking Holdings, Inc. (a) | | | 110 | | | | 192,389 | | |
Burlington Stores, Inc. (a) | | | 163 | | | | 22,205 | | |
Caesars Entertainment, Inc. (a) | | | 487 | | | | 18,652 | | |
CarMax, Inc. (a) | | | 429 | | | | 38,816 | | |
See notes to financial statements.
4
Victory Variable Insurance Funds
Victory 500 Index VIP Series | | Schedule of Portfolio Investments — continued
June 30, 2022 | |
(Unaudited)
Security Description | | Shares | | Value | |
Carnival Corp. (a) (c) | | | 2,417 | | | $ | 20,907 | | |
Carvana Co. (a) | | | 29 | | | | 655 | | |
Chewy, Inc., Class A (a) (c) | | | 143 | | | | 4,965 | | |
Chipotle Mexican Grill, Inc. (a) | | | 73 | | | | 95,430 | | |
D.R. Horton, Inc. | | | 880 | | | | 58,247 | | |
Darden Restaurants, Inc. | | | 266 | | | | 30,090 | | |
Dollar General Corp. | | | 548 | | | | 134,501 | | |
Dollar Tree, Inc. (a) | | | 580 | | | | 90,393 | | |
Domino's Pizza, Inc. | | | 96 | | | | 37,412 | | |
DoorDash, Inc., Class A (a) | | | 100 | | | | 6,417 | | |
DraftKings, Inc. (a) | | | 2,001 | | | | 23,352 | | |
eBay, Inc. | | | 1,495 | | | | 62,297 | | |
Etsy, Inc. (a) (b) | | | 339 | | | | 24,818 | | |
Expedia Group, Inc. (a) | | | 433 | | | | 41,061 | | |
Ford Motor Co. | | | 10,508 | | | | 116,954 | | |
General Motors Co. (a) | | | 3,644 | | | | 115,733 | | |
Genuine Parts Co. | | | 378 | | | | 50,274 | | |
Hilton Worldwide Holdings, Inc. | | | 688 | | | | 76,671 | | |
Las Vegas Sands Corp. (a) (b) | | | 933 | | | | 31,339 | | |
Lennar Corp., Class A | | | 654 | | | | 46,153 | | |
Lennar Corp., Class B | | | 41 | | | | 2,407 | | |
Lowe's Cos., Inc. | | | 1,670 | | | | 291,699 | | |
Lucid Group, Inc. (a) (c) | | | 1,800 | | | | 30,888 | | |
Marriott International, Inc., Class A | | | 827 | | | | 112,480 | | |
McDonald's Corp. | | | 1,828 | | | | 451,297 | | |
MGM Resorts International | | | 1,029 | | | | 29,790 | | |
NIKE, Inc., Class B | | | 3,447 | | | | 352,283 | | |
NVR, Inc. (a) | | | 8 | | | | 32,033 | | |
O'Reilly Automotive, Inc. (a) | | | 177 | | | | 111,821 | | |
Pool Corp. | | | 107 | | | | 37,582 | | |
Rivian Automotive, Inc., Class A (a) | | | 435 | | | | 11,197 | | |
Ross Stores, Inc. | | | 848 | | | | 59,555 | | |
Royal Caribbean Cruises Ltd. (a) (c) | | | 514 | | | | 17,944 | | |
Starbucks Corp. | | | 3,030 | | | | 231,462 | | |
Target Corp. (b) | | | 1,238 | | | | 174,843 | | |
Tesla, Inc. (a) | | | 2,471 | | | | 1,664,021 | | |
The Home Depot, Inc. | | | 2,773 | | | | 760,551 | | |
The TJX Cos., Inc. | | | 3,161 | | | | 176,542 | | |
Tractor Supply Co. | | | 299 | | | | 57,961 | | |
Ulta Beauty, Inc. (a) | | | 138 | | | | 53,196 | | |
VF Corp. | | | 816 | | | | 36,043 | | |
Wayfair, Inc., Class A (a) (c) | | | 128 | | | | 5,576 | | |
Yum! Brands, Inc. | | | 712 | | | | 80,819 | | |
| | | | 9,050,536 | | |
Consumer Staples (7.0%): | |
Altria Group, Inc. | | | 4,834 | | | | 201,916 | | |
Archer-Daniels-Midland Co. | | | 1,358 | | | | 105,381 | | |
Brown-Forman Corp., Class B | | | 707 | | | | 49,603 | | |
Bunge Ltd. | | | 360 | | | | 32,648 | | |
Church & Dwight Co., Inc. | | | 648 | | | | 60,044 | | |
See notes to financial statements.
5
Victory Variable Insurance Funds
Victory 500 Index VIP Series | | Schedule of Portfolio Investments — continued
June 30, 2022 | |
(Unaudited)
Security Description | | Shares | | Value | |
Colgate-Palmolive Co. | | | 2,190 | | | $ | 175,507 | | |
Conagra Brands, Inc. | | | 1,131 | | | | 38,725 | | |
Constellation Brands, Inc., Class A | | | 453 | | | | 105,576 | | |
Costco Wholesale Corp. | | | 1,158 | | | | 555,006 | | |
General Mills, Inc. | | | 1,522 | | | | 114,835 | | |
Hormel Foods Corp. (c) | | | 820 | | | | 38,835 | | |
Kellogg Co. | | | 627 | | | | 44,730 | | |
Keurig Dr Pepper, Inc. | | | 2,458 | | | | 86,989 | | |
Kimberly-Clark Corp. | | | 900 | | | | 121,635 | | |
McCormick & Co., Inc. | | | 533 | | | | 44,372 | | |
Mondelez International, Inc., Class A | | | 3,656 | | | | 227,001 | | |
Monster Beverage Corp. (a) | | | 1,068 | | | | 99,004 | | |
PepsiCo, Inc. | | | 3,731 | | | | 621,808 | | |
Philip Morris International, Inc. | | | 4,182 | | | | 412,931 | | |
Sysco Corp. | | | 1,346 | | | | 114,020 | | |
The Clorox Co. | | | 329 | | | | 46,382 | | |
The Coca-Cola Co. | | | 11,204 | | | | 704,844 | | |
The Estee Lauder Cos., Inc. | | | 539 | | | | 137,267 | | |
The Hershey Co. | | | 374 | | | | 80,470 | | |
The J.M. Smucker Co. | | | 290 | | | | 37,123 | | |
The Kraft Heinz Co. | | | 2,016 | | | | 76,890 | | |
The Kroger Co. | | | 1,744 | | | | 82,544 | | |
The Procter & Gamble Co. | | | 6,337 | | | | 911,197 | | |
Tyson Foods, Inc., Class A | | | 658 | | | | 56,627 | | |
Walgreens Boots Alliance, Inc. | | | 2,036 | | | | 77,164 | | |
Walmart, Inc. | | | 4,144 | | | | 503,828 | | |
| | | | 5,964,902 | | |
Electronic Equipment, Instruments & Components (0.5%): | |
Amphenol Corp., Class A | | | 1,476 | | | | 95,025 | | |
CDW Corp. | | | 365 | | | | 57,509 | | |
Corning, Inc. | | | 2,183 | | | | 68,786 | | |
Keysight Technologies, Inc. (a) | | | 475 | | | | 65,479 | | |
Teledyne Technologies, Inc. (a) | | | 116 | | | | 43,513 | | |
Trimble, Inc. (a) | | | 668 | | | | 38,898 | | |
Zebra Technologies Corp. (a) | | | 140 | | | | 41,153 | | |
| | | | 410,363 | | |
Energy (4.4%): | |
Baker Hughes Co. | | | 1,836 | | | | 53,005 | | |
Cheniere Energy, Inc. | | | 686 | | | | 91,259 | | |
Chevron Corp. | | | 5,245 | | | | 759,371 | | |
ConocoPhillips | | | 3,490 | | | | 313,437 | | |
Continental Resources, Inc. | | | 31 | | | | 2,026 | | |
Coterra Energy, Inc. | | | 1,808 | | | | 46,628 | | |
Devon Energy Corp. | | | 1,762 | | | | 97,104 | | |
Diamondback Energy, Inc. | | | 474 | | | | 57,425 | | |
EOG Resources, Inc. | | | 1,364 | | | | 150,640 | | |
Exxon Mobil Corp. | | | 11,008 | | | | 942,725 | | |
Halliburton Co. | | | 2,254 | | | | 70,686 | | |
Hess Corp. | | | 690 | | | | 73,099 | | |
See notes to financial statements.
6
Victory Variable Insurance Funds
Victory 500 Index VIP Series | | Schedule of Portfolio Investments — continued
June 30, 2022 | |
(Unaudited)
Security Description | | Shares | | Value | |
Kinder Morgan, Inc. | | | 5,732 | | | $ | 96,068 | | |
Marathon Oil Corp. | | | 1,749 | | | | 39,318 | | |
Marathon Petroleum Corp. | | | 1,429 | | | | 117,478 | | |
Occidental Petroleum Corp. | | | 2,263 | | | | 133,245 | | |
ONEOK, Inc. | | | 1,180 | | | | 65,490 | | |
Phillips 66 | | | 1,189 | | | | 97,486 | | |
Pioneer Natural Resources Co. | | | 612 | | | | 136,525 | | |
Schlumberger NV | | | 3,814 | | | | 136,389 | | |
Targa Resources Corp. | | | 596 | | | | 35,563 | | |
The Williams Cos., Inc. | | | 3,286 | | | | 102,556 | | |
Valero Energy Corp. | | | 1,090 | | | | 115,845 | | |
| | | | 3,733,368 | | |
Financials (10.8%): | |
Aflac, Inc. | | | 1,683 | | | | 93,120 | | |
Ally Financial, Inc. | | | 835 | | | | 27,981 | | |
American Express Co. | | | 1,711 | | | | 237,179 | | |
American International Group, Inc. | | | 2,025 | | | | 103,538 | | |
Ameriprise Financial, Inc. | | | 297 | | | | 70,591 | | |
Apollo Global Management, Inc. | | | 1,126 | | | | 54,589 | | |
Arch Capital Group Ltd. (a) | | | 907 | | | | 41,259 | | |
Ares Management Corp., Class A | | | 542 | | | | 30,818 | | |
Arthur J. Gallagher & Co. | | | 565 | | | | 92,118 | | |
Bank of America Corp. | | | 19,909 | | | | 619,767 | | |
Berkshire Hathaway, Inc., Class B (a) | | | 3,652 | | | | 997,069 | | |
Berkshire Hathaway, Inc., Class A (a) | | | 1 | | | | 408,950 | | |
BlackRock, Inc. | | | 408 | | | | 248,488 | | |
Blackstone, Inc. | | | 1,891 | | | | 172,516 | | |
Brown & Brown, Inc. | | | 657 | | | | 38,329 | | |
Capital One Financial Corp. | | | 1,049 | | | | 109,295 | | |
Cincinnati Financial Corp. | | | 405 | | | | 48,187 | | |
Citigroup, Inc. | | | 5,130 | | | | 235,929 | | |
Citizens Financial Group, Inc. | | | 1,252 | | | | 44,684 | | |
CME Group, Inc. | | | 766 | | | | 156,800 | | |
Coinbase Global, Inc., Class A (a) (c) | | | 541 | | | | 25,438 | | |
Discover Financial Services | | | 702 | | | | 66,395 | | |
FactSet Research Systems, Inc. | | | 101 | | | | 38,842 | | |
Fifth Third Bancorp | | | 1,695 | | | | 56,952 | | |
First Republic Bank | | | 477 | | | | 68,783 | | |
Franklin Resources, Inc. | | | 838 | | | | 19,534 | | |
Huntington Bancshares, Inc. | | | 3,802 | | | | 45,738 | | |
Intercontinental Exchange, Inc. | | | 1,506 | | | | 141,624 | | |
JPMorgan Chase & Co. | | | 7,758 | | | | 873,628 | | |
KeyCorp | | | 2,251 | | | | 38,785 | | |
Loews Corp. | | | 510 | | | | 30,223 | | |
LPL Financial Holdings, Inc. | | | 202 | | | | 37,265 | | |
M&T Bank Corp. | | | 459 | | | | 73,160 | | |
Markel Corp. (a) | | | 35 | | | | 45,264 | | |
MarketAxess Holdings, Inc. | | | 90 | | | | 23,041 | | |
Marsh & McLennan Cos., Inc. | | | 1,354 | | | | 210,209 | | |
See notes to financial statements.
7
Victory Variable Insurance Funds
Victory 500 Index VIP Series | | Schedule of Portfolio Investments — continued
June 30, 2022 | |
(Unaudited)
Security Description | | Shares | | Value | |
MetLife, Inc. | | | 1,940 | | | $ | 121,813 | | |
Moody's Corp. | | | 456 | | | | 124,018 | | |
Morgan Stanley | | | 3,890 | | | | 295,873 | | |
MSCI, Inc. | | | 219 | | | | 90,261 | | |
Nasdaq, Inc. | | | 304 | | | | 46,372 | | |
Northern Trust Corp. | | | 562 | | | | 54,222 | | |
Principal Financial Group, Inc. | | | 574 | | | | 38,338 | | |
Prudential Financial, Inc. | | | 1,001 | | | | 95,776 | | |
Raymond James Financial, Inc. | | | 523 | | | | 46,761 | | |
Regions Financial Corp. | | | 2,468 | | | | 46,275 | | |
Rocket Cos., Inc., Class A (c) | | | 280 | | | | 2,061 | | |
S&P Global, Inc. | | | 907 | | | | 305,713 | | |
Signature Bank | | | 142 | | | | 25,448 | | |
State Street Corp. | | | 980 | | | | 60,417 | | |
SVB Financial Group (a) | | | 157 | | | | 62,013 | | |
Synchrony Financial | | | 1,125 | | | | 31,073 | | |
T. Rowe Price Group, Inc. | | | 607 | | | | 68,961 | | |
The Allstate Corp. | | | 742 | | | | 94,034 | | |
The Bank of New York Mellon Corp. | | | 2,088 | | | | 87,091 | | |
The Carlyle Group, Inc. | | | 698 | | | | 22,099 | | |
The Charles Schwab Corp. | | | 4,785 | | | | 302,316 | | |
The Goldman Sachs Group, Inc. | | | 917 | | | | 272,367 | | |
The Hartford Financial Services Group, Inc. | | | 821 | | | | 53,718 | | |
The PNC Financial Services Group, Inc. | | | 1,104 | | | | 174,178 | | |
The Progressive Corp. | | | 1,578 | | | | 183,474 | | |
The Travelers Cos., Inc. | | | 634 | | | | 107,228 | | |
Tradeweb Markets, Inc., Class A | | | 120 | | | | 8,190 | | |
Truist Financial Corp. | | | 3,554 | | | | 168,566 | | |
U.S. Bancorp | | | 3,840 | | | | 176,717 | | |
W.R. Berkley Corp. | | | 595 | | | | 40,615 | | |
Wells Fargo & Co. | | | 10,120 | | | | 396,400 | | |
| | | | 9,228,476 | | |
Health Care (14.9%): | |
Abbott Laboratories | | | 4,725 | | | | 513,371 | | |
AbbVie, Inc. | | | 4,718 | | | | 722,609 | | |
ABIOMED, Inc. (a) | | | 111 | | | | 27,474 | | |
Agilent Technologies, Inc. | | | 742 | | | | 88,127 | | |
Align Technology, Inc. (a) | | | 210 | | | | 49,701 | | |
Alnylam Pharmaceuticals, Inc. (a) | | | 247 | | | | 36,025 | | |
AmerisourceBergen Corp. | | | 446 | | | | 63,100 | | |
Amgen, Inc. | | | 1,426 | | | | 346,946 | | |
Avantor, Inc. (a) | | | 1,680 | | | | 52,248 | | |
Baxter International, Inc. | | | 1,287 | | | | 82,664 | | |
Becton Dickinson & Co. | | | 752 | | | | 185,391 | | |
Biogen, Inc. (a) | | | 349 | | | | 71,175 | | |
BioMarin Pharmaceutical, Inc. (a) | | | 410 | | | | 33,977 | | |
Bio-Rad Laboratories, Inc., Class A (a) | | | 52 | | | | 25,740 | | |
Bio-Techne Corp. | | | 105 | | | | 36,397 | | |
Boston Scientific Corp. (a) | | | 3,809 | | | | 141,961 | | |
See notes to financial statements.
8
Victory Variable Insurance Funds
Victory 500 Index VIP Series | | Schedule of Portfolio Investments — continued
June 30, 2022 | |
(Unaudited)
Security Description | | Shares | | Value | |
Bristol-Myers Squibb Co. | | | 5,745 | | | $ | 442,365 | | |
Cardinal Health, Inc. | | | 689 | | | | 36,014 | | |
Catalent, Inc. (a) | | | 402 | | | | 43,131 | | |
Centene Corp. (a) | | | 1,445 | | | | 122,261 | | |
Charles River Laboratories International, Inc. (a) | | | 128 | | | | 27,388 | | |
Cigna Corp. | | | 847 | | | | 223,201 | | |
CVS Health Corp. | | | 3,352 | | | | 310,596 | | |
Danaher Corp. | | | 1,941 | | | | 492,082 | | |
Dexcom, Inc. (a) | | | 1,048 | | | | 78,107 | | |
Edwards Lifesciences Corp. (a) | | | 1,678 | | | | 159,561 | | |
Elevance Health, Inc. | | | 651 | | | | 314,160 | | |
Eli Lilly & Co. | | | 2,240 | | | | 726,275 | | |
Gilead Sciences, Inc. (b) | | | 3,028 | | | | 187,161 | | |
HCA Healthcare, Inc. | | | 587 | | | | 98,651 | | |
Hologic, Inc. (a) | | | 552 | | | | 38,254 | | |
Horizon Therapeutics PLC (a) | | | 613 | | | | 48,893 | | |
Humana, Inc. | | | 330 | | | | 154,463 | | |
IDEXX Laboratories, Inc. (a) | | | 210 | | | | 73,653 | | |
Illumina, Inc. (a) | | | 388 | | | | 71,532 | | |
Incyte Corp. (a) | | | 591 | | | | 44,898 | | |
Insulet Corp. (a) | | | 128 | | | | 27,896 | | |
Intuitive Surgical, Inc. (a) | | | 948 | | | | 190,273 | | |
IQVIA Holdings, Inc. (a) | | | 511 | | | | 110,882 | | |
Johnson & Johnson (b) | | | 6,876 | | | | 1,220,559 | | |
Laboratory Corp. of America Holdings | | | 251 | | | | 58,824 | | |
McKesson Corp. | | | 392 | | | | 127,874 | | |
Merck & Co., Inc. | | | 6,823 | | | | 622,053 | | |
Mettler-Toledo International, Inc. (a) | | | 57 | | | | 65,480 | | |
Moderna, Inc. (a) | | | 949 | | | | 135,565 | | |
Molina Healthcare, Inc. (a) | | | 132 | | | | 36,908 | | |
PerkinElmer, Inc. | | | 279 | | | | 39,679 | | |
Pfizer, Inc. | | | 15,140 | | | | 793,790 | | |
Quest Diagnostics, Inc. | | | 313 | | | | 41,623 | | |
Regeneron Pharmaceuticals, Inc. (a) | | | 183 | | | | 108,177 | | |
ResMed, Inc. | | | 366 | | | | 76,725 | | |
Royalty Pharma PLC, Class A | | | 224 | | | | 9,417 | | |
Seagen, Inc. (a) | | | 491 | | | | 86,878 | | |
Stryker Corp. | | | 956 | | | | 190,177 | | |
Teleflex, Inc. | | | 108 | | | | 26,552 | | |
The Cooper Cos., Inc. | | | 123 | | | | 38,514 | | |
Thermo Fisher Scientific, Inc. | | | 1,056 | | | | 573,704 | | |
UnitedHealth Group, Inc. | | | 2,531 | | | | 1,299,998 | | |
Veeva Systems, Inc., Class A (a) | | | 281 | | | | 55,649 | | |
Vertex Pharmaceuticals, Inc. (a) | | | 683 | | | | 192,463 | | |
Waters Corp. (a) | | | 147 | | | | 48,654 | | |
West Pharmaceutical Services, Inc. | | | 179 | | | | 54,124 | | |
Zimmer Biomet Holdings, Inc. | | | 530 | | | | 55,682 | | |
Zoetis, Inc. | | | 1,270 | | | | 218,300 | | |
| | | | 12,675,972 | | |
See notes to financial statements.
9
Victory Variable Insurance Funds
Victory 500 Index VIP Series | | Schedule of Portfolio Investments — continued
June 30, 2022 | |
(Unaudited)
Security Description | | Shares | | Value | |
Industrials (7.8%): | |
3M Co. | | | 1,536 | | | $ | 198,774 | | |
AMETEK, Inc. | | | 584 | | | | 64,176 | | |
Builders FirstSource, Inc. (a) | | | 417 | | | | 22,393 | | |
Carrier Global Corp. | | | 1,807 | | | | 64,438 | | |
Caterpillar, Inc. | | | 1,394 | | | | 249,191 | | |
Cintas Corp. | | | 250 | | | | 93,383 | | |
Copart, Inc. (a) | | | 635 | | | | 68,999 | | |
CoStar Group, Inc. (a) (b) | | | 1,047 | | | | 63,249 | | |
CSX Corp. | | | 5,311 | | | | 154,338 | | |
Cummins, Inc. | | | 381 | | | | 73,735 | | |
Deere & Co. | | | 797 | | | | 238,678 | | |
Delta Air Lines, Inc. (a) | | | 1,620 | | | | 46,931 | | |
Dover Corp. | | | 385 | | | | 46,708 | | |
Eaton Corp. PLC | | | 1,077 | | | | 135,691 | | |
Emerson Electric Co. | | | 1,624 | | | | 129,173 | | |
Equifax, Inc. | | | 330 | | | | 60,317 | | |
Expeditors International of Washington, Inc. | | | 438 | | | | 42,688 | | |
Fastenal Co. | | | 1,553 | | | | 77,526 | | |
FedEx Corp. | | | 640 | | | | 145,094 | | |
Fortive Corp. | | | 957 | | | | 52,042 | | |
Generac Holdings, Inc. (a) | | | 170 | | | | 35,799 | | |
General Dynamics Corp. | | | 663 | | | | 146,689 | | |
General Electric Co. | | | 2,626 | | | | 167,197 | | |
Honeywell International, Inc. | | | 1,798 | | | | 312,510 | | |
Howmet Aerospace, Inc. | | | 1,128 | | | | 35,476 | | |
IDEX Corp. | | | 205 | | | | 37,234 | | |
Illinois Tool Works, Inc. | | | 752 | | | | 137,052 | | |
Ingersoll Rand, Inc. (b) | | | 922 | | | | 38,798 | | |
J.B. Hunt Transport Services, Inc. | | | 223 | | | | 35,116 | | |
Jacobs Engineering Group, Inc. | | | 325 | | | | 41,317 | | |
Johnson Controls International PLC | | | 1,877 | | | | 89,871 | | |
L3Harris Technologies, Inc. | | | 504 | | | | 121,817 | | |
Leidos Holdings, Inc. | | | 342 | | | | 34,443 | | |
Lockheed Martin Corp. | | | 680 | | | | 292,373 | | |
Norfolk Southern Corp. | | | 643 | | | | 146,147 | | |
Northrop Grumman Corp. | | | 406 | | | | 194,299 | | |
Old Dominion Freight Line, Inc. | | | 267 | | | | 68,427 | | |
Otis Worldwide Corp. | | | 1,117 | | | | 78,938 | | |
PACCAR, Inc. | | | 938 | | | | 77,235 | | |
Parker-Hannifin Corp. | | | 343 | | | | 84,395 | | |
Plug Power, Inc. (a) (c) | | | 1,396 | | | | 23,132 | | |
Quanta Services, Inc. | | | 388 | | | | 48,632 | | |
Raytheon Technologies Corp. | | | 3,971 | | | | 381,653 | | |
Republic Services, Inc. (b) | | | 583 | | | | 76,297 | | |
Rockwell Automation, Inc. | | | 314 | | | | 62,583 | | |
Rollins, Inc. | | | 769 | | | | 26,853 | | |
Roper Technologies, Inc. | | | 271 | | | | 106,950 | | |
Southwest Airlines Co. (a) | | | 1,533 | | | | 55,372 | | |
Stanley Black & Decker, Inc. | | | 407 | | | | 42,678 | | |
See notes to financial statements.
10
Victory Variable Insurance Funds
Victory 500 Index VIP Series | | Schedule of Portfolio Investments — continued
June 30, 2022 | |
(Unaudited)
Security Description | | Shares | | Value | |
Textron, Inc. | | | 477 | | | $ | 29,130 | | |
The Boeing Co. (a) | | | 1,596 | | | | 218,205 | | |
TransDigm Group, Inc. (a) | | | 127 | | | | 68,157 | | |
TransUnion | | | 481 | | | | 38,475 | | |
Uber Technologies, Inc. (a) | | | 5,186 | | | | 106,106 | | |
Union Pacific Corp. | | | 1,641 | | | | 349,992 | | |
United Airlines Holdings, Inc. (a) | | | 854 | | | | 30,249 | | |
United Parcel Service, Inc., Class B | | | 1,836 | | | | 335,143 | | |
United Rentals, Inc. (a) | | | 193 | | | | 46,882 | | |
Verisk Analytics, Inc. | | | 426 | | | | 73,736 | | |
W.W. Grainger, Inc. | | | 132 | | | | 59,985 | | |
Waste Management, Inc. | | | 1,120 | | | | 171,338 | | |
Westinghouse Air Brake Technologies Corp. | | | 493 | | | | 40,465 | | |
Xylem, Inc. | | | 455 | | | | 35,572 | | |
| | | | 6,630,242 | | |
IT Services (4.0%): | |
Akamai Technologies, Inc. (a) | | | 428 | | | | 39,089 | | |
Automatic Data Processing, Inc. | | | 1,127 | | | | 236,715 | | |
Block, Inc. (a) (b) | | | 971 | | | | 59,678 | | |
Broadridge Financial Solutions, Inc. | | | 313 | | | | 44,618 | | |
Cognizant Technology Solutions Corp., Class A | | | 1,377 | | | | 92,934 | | |
Fidelity National Information Services, Inc. | | | 1,631 | | | | 149,514 | | |
Fiserv, Inc. (a) | | | 1,597 | | | | 142,085 | | |
FleetCor Technologies, Inc. (a) | | | 200 | | | | 42,022 | | |
Gartner, Inc. (a) | | | 215 | | | | 51,993 | | |
Global Payments, Inc. | | | 752 | | | | 83,201 | | |
International Business Machines Corp. | | | 2,426 | | | | 342,527 | | |
Mastercard, Inc., Class A | | | 2,354 | | | | 742,640 | | |
MongoDB, Inc. (a) | | | 137 | | | | 35,552 | | |
Okta, Inc. (a) | | | 102 | | | | 9,221 | | |
Paychex, Inc. | | | 861 | | | | 98,042 | | |
PayPal Holdings, Inc. (a) | | | 3,092 | | | | 215,945 | | |
Snowflake, Inc., Class A (a) | | | 89 | | | | 12,376 | | |
Twilio, Inc., Class A (a) | | | 201 | | | | 16,846 | | |
VeriSign, Inc. (a) | | | 258 | | | | 43,171 | | |
Visa, Inc., Class A | | | 4,810 | | | | 947,041 | | |
| | | | 3,405,210 | | |
Materials (1.9%): | |
Air Products and Chemicals, Inc. | | | 592 | | | | 142,364 | | |
Albemarle Corp. | | | 316 | | | | 66,038 | | |
Avery Dennison Corp. | | | 204 | | | | 33,021 | | |
Ball Corp. | | | 790 | | | | 54,328 | | |
Celanese Corp. | | | 292 | | | | 34,342 | | |
CF Industries Holdings, Inc. | | | 468 | | | | 40,122 | | |
Corteva, Inc. | | | 1,953 | | | | 105,735 | | |
Crown Holdings, Inc. | | | 332 | | | | 30,600 | | |
Dow, Inc. | | | 1,944 | | | | 100,330 | | |
DuPont de Nemours, Inc. | | | 1,358 | | | | 75,478 | | |
Eastman Chemical Co. | | | 300 | | | | 26,931 | | |
See notes to financial statements.
11
Victory Variable Insurance Funds
Victory 500 Index VIP Series | | Schedule of Portfolio Investments — continued
June 30, 2022 | |
(Unaudited)
Security Description | | Shares | | Value | |
Ecolab, Inc. | | | 722 | | | $ | 111,015 | | |
FMC Corp. | | | 300 | | | | 32,103 | | |
Freeport-McMoRan, Inc. | | | 3,622 | | | | 105,980 | | |
International Flavors & Fragrances, Inc. | | | 651 | | | | 77,547 | | |
International Paper Co. | | | 905 | | | | 37,856 | | |
Martin Marietta Materials, Inc. | | | 156 | | | | 46,681 | | |
Newmont Corp. | | | 2,119 | | | | 126,441 | | |
Nucor Corp. | | | 597 | | | | 62,333 | | |
PPG Industries, Inc. | | | 637 | | | | 72,835 | | |
Southern Copper Corp. | | | 242 | | | | 12,054 | | |
The Mosaic Co. | | | 895 | | | | 42,271 | | |
The Sherwin-Williams Co. | | | 680 | | | | 152,259 | | |
Vulcan Materials Co. | | | 351 | | | | 49,877 | | |
| | | | 1,638,541 | | |
Real Estate (3.1%): | |
Alexandria Real Estate Equities, Inc. | | | 426 | | | | 61,783 | | |
American Tower Corp. | | | 1,231 | | | | 314,631 | | |
AvalonBay Communities, Inc. | | | 397 | | | | 77,117 | | |
Boston Properties, Inc. | | | 405 | | | | 36,037 | | |
Camden Property Trust | | | 302 | | | | 40,613 | | |
CBRE Group, Inc., Class A (a) | | | 883 | | | | 64,998 | | |
Crown Castle International Corp. | | | 1,168 | | | | 196,668 | | |
Digital Realty Trust, Inc. | | | 808 | | | | 104,903 | | |
Duke Realty Corp. | | | 1,092 | | | | 60,005 | | |
Equinix, Inc. | | | 259 | | | | 170,168 | | |
Equity Residential | | | 972 | | | | 70,198 | | |
Essex Property Trust, Inc. | | | 186 | | | | 48,641 | | |
Extra Space Storage, Inc. | | | 381 | | | | 64,816 | | |
Healthpeak Properties, Inc. | | | 1,532 | | | | 39,694 | | |
Invitation Homes, Inc. | | | 1,733 | | | | 61,660 | | |
Iron Mountain, Inc. | | | 685 | | | | 33,353 | | |
Kimco Realty Corp. | | | 1,755 | | | | 34,696 | | |
Mid-America Apartment Communities, Inc. | | | 328 | | | | 57,292 | | |
Prologis, Inc. | | | 2,103 | | | | 247,418 | | |
Public Storage | | | 444 | | | | 138,825 | | |
Realty Income Corp. | | | 1,606 | | | | 109,626 | | |
SBA Communications Corp. | | | 306 | | | | 97,935 | | |
Simon Property Group, Inc. | | | 868 | | | | 82,391 | | |
Sun Communities, Inc. | | | 345 | | | | 54,979 | | |
UDR, Inc. | | | 904 | | | | 41,620 | | |
Ventas, Inc. | | | 1,135 | | | | 58,373 | | |
VICI Properties, Inc. | | | 2,562 | | | | 76,322 | | |
Welltower, Inc. | | | 1,289 | | | | 106,149 | | |
Weyerhaeuser Co. | | | 1,861 | | | | 61,636 | | |
WP Carey, Inc. | | | 548 | | | | 45,407 | | |
| | | | 2,657,954 | | |
See notes to financial statements.
12
Victory Variable Insurance Funds
Victory 500 Index VIP Series | | Schedule of Portfolio Investments — continued
June 30, 2022 | |
(Unaudited)
Security Description | | Shares | | Value | |
Semiconductors & Semiconductor Equipment (5.0%): | |
Advanced Micro Devices, Inc. (a) | | | 4,373 | | | $ | 334,403 | | |
Analog Devices, Inc. | | | 1,373 | | | | 200,582 | | |
Applied Materials, Inc. | | | 2,347 | | | | 213,530 | | |
Broadcom, Inc. | | | 883 | | | | 428,970 | | |
Enphase Energy, Inc. (a) | | | 357 | | | | 69,701 | | |
Entegris, Inc. | | | 324 | | | | 29,850 | | |
GLOBALFOUNDRIES, Inc. (a) (c) | | | 166 | | | | 6,696 | | |
Intel Corp. | | | 10,917 | | | | 408,405 | | |
KLA Corp. | | | 381 | | | | 121,570 | | |
Lam Research Corp. | | | 374 | | | | 159,380 | | |
Marvell Technology, Inc. | | | 2,071 | | | | 90,151 | | |
Microchip Technology, Inc. | | | 1,480 | | | | 85,958 | | |
Micron Technology, Inc. | | | 3,013 | | | | 166,559 | | |
Monolithic Power Systems, Inc. | | | 125 | | | | 48,005 | | |
NVIDIA Corp. | | | 6,685 | | | | 1,013,379 | | |
ON Semiconductor Corp. (a) | | | 1,074 | | | | 54,033 | | |
Qorvo, Inc. (a) | | | 268 | | | | 25,278 | | |
QUALCOMM, Inc. | | | 3,022 | | | | 386,030 | | |
Skyworks Solutions, Inc. | | | 425 | | | | 39,372 | | |
Teradyne, Inc. | | | 400 | | | | 35,820 | | |
Texas Instruments, Inc. | | | 2,488 | | | | 382,281 | | |
| | | | 4,299,953 | | |
Software (9.3%): | |
Adobe, Inc. (a) | | | 1,275 | | | | 466,727 | | |
ANSYS, Inc. (a) | | | 222 | | | | 53,122 | | |
AppLovin Corp., Class A (a) (c) | | | 75 | | | | 2,583 | | |
Autodesk, Inc. (a) | | | 575 | | | | 98,877 | | |
Bill.com Holdings, Inc. (a) | | | 249 | | | | 27,375 | | |
Cadence Design Systems, Inc. (a) | | | 736 | | | | 110,422 | | |
Cloudflare, Inc., Class A (a) | | | 111 | | | | 4,856 | | |
Crowdstrike Holdings, Inc., Class A (a) | | | 589 | | | | 99,282 | | |
Datadog, Inc., Class A (a) | | | 72 | | | | 6,857 | | |
DocuSign, Inc. (a) | | | 539 | | | | 30,928 | | |
Fortinet, Inc. (a) | | | 1,710 | | | | 96,752 | | |
HubSpot, Inc. (a) | | | 122 | | | | 36,679 | | |
Intuit, Inc. | | | 715 | | | | 275,590 | | |
Microsoft Corp. (b) | | | 19,544 | | | | 5,019,486 | | |
NortonLifeLock, Inc. | | | 1,400 | | | | 30,744 | | |
Oracle Corp. | | | 4,320 | | | | 301,838 | | |
Palantir Technologies, Inc., Class A (a) | | | 813 | | | | 7,374 | | |
Palo Alto Networks, Inc. (a) (b) | | | 260 | | | | 128,424 | | |
Paycom Software, Inc. (a) | | | 147 | | | | 41,178 | | |
Qualtrics International, Inc., Class A (a) | | | 149 | | | | 1,864 | | |
Salesforce, Inc. (a) | | | 2,625 | | | | 433,230 | | |
ServiceNow, Inc. (a) (b) | | | 529 | | | | 251,550 | | |
Splunk, Inc. (a) | | | 424 | | | | 37,507 | | |
SS&C Technologies Holdings, Inc. | | | 637 | | | | 36,991 | | |
Synopsys, Inc. (a) | | | 382 | | | | 116,013 | | |
The Trade Desk, Inc., Class A (a) | | | 828 | | | | 34,685 | | |
See notes to financial statements.
13
Victory Variable Insurance Funds
Victory 500 Index VIP Series | | Schedule of Portfolio Investments — continued
June 30, 2022 | |
(Unaudited)
Security Description | | Shares | | Value | |
Tyler Technologies, Inc. (a) | | | 110 | | | $ | 36,573 | | |
UiPath, Inc., Class A (a) | | | 77 | | | | 1,401 | | |
Unity Software, Inc. (a) | | | 570 | | | | 20,987 | | |
VMware, Inc., Class A | | | 478 | | | | 54,482 | | |
Workday, Inc., Class A (a) | | | 267 | | | | 37,268 | | |
Zendesk, Inc. (a) | | | 306 | | | | 22,665 | | |
Zoom Video Communications, Inc., Class A (a) | | | 68 | | | | 7,342 | | |
Zscaler, Inc. (a) | | | 248 | | | | 37,079 | | |
| | | | 7,968,731 | | |
Technology Hardware, Storage & Peripherals (7.3%): | |
Apple, Inc. | | | 43,673 | | | | 5,970,973 | | |
Dell Technologies, Inc., Class C | | | 587 | | | | 27,125 | | |
Hewlett Packard Enterprise Co. | | | 3,471 | | | | 46,026 | | |
HP, Inc. | | | 2,812 | | | | 92,177 | | |
NetApp, Inc. | | | 493 | | | | 32,163 | | |
Western Digital Corp. (a) | | | 845 | | | | 37,881 | | |
| | | | 6,206,345 | | |
Utilities (3.0%): | |
Alliant Energy Corp. | | | 648 | | | | 37,979 | | |
Ameren Corp. | | | 623 | | | | 56,294 | | |
American Electric Power Co., Inc. (b) | | | 1,385 | | | | 132,877 | | |
American Water Works Co., Inc. | | | 490 | | | | 72,897 | | |
Atmos Energy Corp. | | | 367 | | | | 41,141 | | |
Avangrid, Inc. | | | 198 | | | | 9,132 | | |
CenterPoint Energy, Inc. | | | 1,555 | | | | 45,997 | | |
CMS Energy Corp. | | | 717 | | | | 48,398 | | |
Consolidated Edison, Inc. (b) | | | 936 | | | | 89,014 | | |
Constellation Energy Corp. | | | 826 | | | | 47,297 | | |
Dominion Energy, Inc. | | | 2,240 | | | | 178,774 | | |
DTE Energy Co. | | | 473 | | | | 59,953 | | |
Duke Energy Corp. (b) | | | 2,077 | | | | 222,675 | | |
Edison International | | | 953 | | | | 60,268 | | |
Entergy Corp. | | | 508 | | | | 57,221 | | |
Evergy, Inc. (b) | | | 619 | | | | 40,390 | | |
Eversource Energy (b) | | | 911 | | | | 76,952 | | |
Exelon Corp. | | | 2,478 | | | | 112,303 | | |
FirstEnergy Corp. | | | 1,524 | | | | 58,506 | | |
NextEra Energy, Inc. (b) | | | 5,301 | | | | 410,616 | | |
PG&E Corp. (a) | | | 4,390 | | | | 43,812 | | |
PPL Corp. | | | 1,965 | | | | 53,310 | | |
Public Service Enterprise Group, Inc. | | | 1,333 | | | | 84,352 | | |
Sempra Energy | | | 732 | | | | 109,998 | | |
The AES Corp. | | | 1,536 | | | | 32,271 | | |
The Southern Co. (b) | | | 2,867 | | | | 204,446 | | |
WEC Energy Group, Inc. (b) | | | 833 | | | | 83,833 | | |
Xcel Energy, Inc. (b) | | | 1,454 | | | | 102,885 | | |
| | | | 2,573,591 | | |
Total Common Stocks (Cost $27,612,835) | | | 84,771,889 | | |
See notes to financial statements.
14
Victory Variable Insurance Funds
Victory 500 Index VIP Series | | Schedule of Portfolio Investments — continued
June 30, 2022 | |
(Unaudited)
Security Description | | Shares | | Value | |
Collateral for Securities Loaned (0.2%)^ | |
BlackRock Liquidity Funds TempFund, Institutional Shares, 1.47% (d) | | | 5,583 | | | $ | 5,583 | | |
Goldman Sachs Financial Square Prime Obligations Fund,
Institutional Shares, 1.42% (d) | | | 2,786 | | | | 2,786 | | |
HSBC U.S. Government Money Market Fund, I Shares, 1.46% (d) | | | 34,746 | | | | 34,746 | | |
JPMorgan Prime Money Market Fund, Capital Shares, 1.50% (d) | | | 22,214 | | | | 22,214 | | |
Morgan Stanley Institutional Liquidity Government Portfolio,
Institutional Shares, 1.39% (d) | | | 14,814 | | | | 14,814 | | |
Morgan Stanley Institutional Liquidity Prime Portfolio,
Institutional Shares, 1.53% (d) | | | 99,880 | | | | 99,880 | | |
Total Collateral for Securities Loaned (Cost $180,023) | | | 180,023 | | |
Total Investments (Cost $27,792,858) — 99.6% | | | 84,951,912 | | |
Other assets in excess of liabilities — 0.4% | | | 318,337 | | |
NET ASSETS — 100.00% | | $ | 85,270,249 | | |
^ Purchased with cash collateral from securities on loan.
(a) Non-income producing security.
(b) All or a portion of this security has been segregated as collateral for derivative instruments.
(c) All or a portion of this security is on loan.
(d) Rate disclosed is the daily yield on June 30, 2022.
PLC — Public Limited Company
Futures Contracts Purchased
| | | Number of
Contracts | | Expiration
Date | | Notional
Amount | | Value | | Unrealized
Appreciation
(Depreciation) | |
E-Mini S&P 500 Futures | | | 3 | | | 9/16/22 | | $ | 617,325 | | | $ | 568,425 | | | $ | (48,900 | ) | |
Total unrealized appreciation | | | | | | | | | | $ | — | | |
Total unrealized depreciation | | | | | | | | | | | (48,900 | ) | |
Total net unrealized appreciation (depreciation) | | | | | | | | | | $ | (48,900 | ) | |
See notes to financial statements.
15
Victory Variable Insurance Funds | | Statement of Assets and Liabilities
June 30, 2022 | |
(Unaudited)
| | | Victory
500 Index
VIP Series | |
Assets: | |
Investments, at value (Cost $27,792,858) | | $ | 84,951,912 | (a) | |
Cash | | | 368,630 | | |
Deposit with broker for futures contracts | | | 126,440 | | |
Receivables: | |
Interest and dividends | | | 63,184 | | |
Capital shares issued | | | 3,571 | | |
From Adviser | | | 20,053 | | |
Prepaid expenses | | | 657 | | |
Total Assets | | | 85,534,447 | | |
Liabilities: | |
Payables: | |
Collateral received on loaned securities | | | 180,023 | | |
Capital shares redeemed | | | 26,366 | | |
Variation margin on open futures contracts | | | 4,762 | | |
Accrued expenses and other payables: | |
Investment advisory fees | | | 18,151 | | |
Administration fees | | | 4,614 | | |
Custodian fees | | | 1,039 | | |
Transfer agent fees | | | 1,559 | | |
Compliance fees | | | 53 | | |
Other accrued expenses | | | 27,631 | | |
Total Liabilities | | | 264,198 | | |
Net Assets: | |
Capital | | | 11,633,596 | | |
Total accumulated earnings/(loss) | | | 73,636,653 | | |
Net Assets | | $ | 85,270,249 | | |
Shares (unlimited shares authorized with a par value of $0.001 per share): | | | 5,448,681 | | |
Net asset value: | | $ | 15.65 | | |
(a) Includes $170,945 of securities on loan.
See notes to financial statements.
16
Victory Variable Insurance Funds | | Statement of Operations
For the Six Months Ended June 30, 2022 | |
(Unaudited)
| | | Victory
500 Index
VIP Series | |
Investment Income: | |
Dividends | | $ | 737,599 | | |
Interest | | | 218 | | |
Securities lending (net of fees) | | | 2,276 | | |
Total Income | | | 740,093 | | |
Expenses: | |
Investment advisory fees | | | 124,256 | | |
Administration fees | | | 26,853 | | |
Sub-Administration fees | | | 8,836 | | |
Custodian fees | | | 2,949 | | |
Transfer agent fees | | | 3,416 | | |
Trustees' fees | | | 3,511 | | |
Compliance fees | | | 363 | | |
Legal and audit fees | | | 6,964 | | |
Licensing fees | | | 16,875 | | |
Other expenses | | | 6,123 | | |
Total Expenses | | | 200,146 | | |
Expenses waived/reimbursed by Adviser | | | (61,209 | ) | |
Net Expenses | | | 138,937 | | |
Net Investment Income (Loss) | | | 601,156 | | |
Realized/Unrealized Gains (Losses) from Investments: | |
Net realized gains (losses) from investment securities | | | 5,386,861 | | |
Net realized gains (losses) from futures contracts | | | (119,144 | ) | |
Net change in unrealized appreciation/depreciation on investment securities | | | (29,204,807 | ) | |
Net change in unrealized appreciation/depreciation on futures contracts | | | (65,800 | ) | |
Net realized/unrealized gains (losses) on investments | | | (24,002,890 | ) | |
Change in net assets resulting from operations | | $ | (23,401,734 | ) | |
See notes to financial statements.
17
Victory Variable Insurance Funds | | Statements of Changes in Net Assets | |
| | | Victory 500 Index VIP Series | |
| | | Six Months
Ended
June 30,
2022
(Unaudited) | | Year
Ended
December 31,
2021 | |
From Investment Activities: | |
Operations: | |
Net investment income (loss) | | $ | 601,156 | | | $ | 1,151,816 | | |
Net realized gains (losses) from investments | | | 5,267,717 | | | | 12,072,376 | | |
Net change in unrealized appreciation/depreciation
on investments | | | (29,270,607 | ) | | | 13,641,209 | | |
Change in net assets resulting from operations | | | (23,401,734 | ) | | | 26,865,401 | | |
Change in net assets resulting from distributions to
shareholders | | | — | | | | (14,222,411 | ) | |
Change in net assets resulting from capital transactions | | | (7,372,256 | ) | | | (170,219 | ) | |
Change in net assets | | | (30,773,990 | ) | | | 12,472,771 | | |
Net Assets: | |
Beginning of period | | | 116,044,239 | | | | 103,571,468 | | |
End of period | | $ | 85,270,249 | | | $ | 116,044,239 | | |
Capital Transactions: | |
Proceeds from shares issued | | | 2,208,570 | | | | 7,352,188 | | |
Distributions reinvested | | | — | | | | 14,222,411 | | |
Cost of shares redeemed | | | (9,580,826 | ) | | | (21,744,818 | ) | |
Change in net assets resulting from capital transactions | | | (7,372,256 | ) | | | (170,219 | ) | |
Share Transactions: | |
Issued | | | 123,196 | | | | 358,747 | | |
Reinvested | | | — | | | | 725,547 | | |
Redeemed | | | (537,248 | ) | | | (1,070,115 | ) | |
Change in Shares | | | (414,052 | ) | | | 14,179 | | |
See notes to financial statements.
18
This page is intentionally left blank.
19
Victory Variable Insurance Funds | | Financial Highlights | |
For a Share Outstanding Throughout Each Period
| | | | Investment Activities | | Distributions to
Shareholders From | |
| | | Net Asset
Value,
Beginning
of Period | | Net
Investment
Income
(Loss)(a) | | Net
Realized
and
Unrealized
Gains
(Losses) on
Investments | | Total from
Investment
Activities | | Net
Investment
Income | | Net
Realized
Gains from
Investments | |
Victory 500 Index VIP Series | | | |
Six Months Ended
June 30, 2022
(Unaudited) | | $ | 19.79 | | | | 0.11 | | | | (4.25 | ) | | | (4.14 | ) | | | — | | | | — | | |
Year Ended December 31:
2021 | | $ | 17.71 | | | | 0.21 | | | | 4.59 | | | | 4.80 | | | | (0.23 | ) | | | (2.49 | ) | |
2020 | | $ | 19.35 | | | | 0.28 | | | | 3.53 | | | | 3.81 | | | | (0.32 | ) | | | (5.13 | ) | |
2019 | | $ | 16.92 | | | | 0.34 | | | | 4.88 | | | | 5.22 | | | | (0.37 | ) | | | (2.42 | ) | |
2018 | | $ | 19.06 | | | | 0.32 | | | | (1.21 | ) | | | (0.89 | ) | | | (0.02 | ) | | | (1.23 | ) | |
2017 | | $ | 15.98 | | | | 0.30 | | | | 3.15 | | | | 3.45 | | | | (0.33 | ) | | | (0.04 | ) | |
(a) Per share net investment income (loss) has been calculated using the average daily shares method.
(b) Not annualized for periods less than one year.
(c) Total returns do not reflect the effects of charges deducted pursuant to the terms of The Guardian Insurance & Annuity Company, Inc.'s variable contracts. Inclusion of such charges would reduce the total returns for all periods shown.
(d) Annualized for periods less than one year.
(e) Does not include acquire fund fees and expenses, if any.
See notes to financial statements.
20
Victory Variable Insurance Funds | | Financial Highlights — continued | |
For a Share Outstanding Throughout Each Period
| | | | | Ratios to Average Net Assets | | Supplemental Data | |
| | | Total
Distributions | | Net
Asset
Value,
End of
Period | | Total
Return(b)(c) | | Net
Expenses(d)(e) | | Net
Investment
Income
(Loss)(d) | | Gross
Expenses(d)(e) | | Net
Assets,
End of
Period
(000's) | | Portfolio
Turnover(b) | |
Victory 500 Index VIP Series | |
Six Months Ended
June 30, 2022
(Unaudited) | | | — | | | $ | 15.65 | | | | (20.92 | )% | | | 0.28 | % | | | 1.21 | % | | | 0.40 | % | | $ | 85,270 | | | | 3 | % | |
Year Ended December 31:
2021 | | | (2.72 | ) | | $ | 19.79 | | | | 27.43 | % | | | 0.28 | % | | | 1.04 | % | | | 0.48 | % | | $ | 116,044 | | | | 9 | % | |
2020 | | | (5.45 | ) | | $ | 17.71 | | | | 20.13 | % | | | 0.28 | % | | | 1.46 | % | | | 0.58 | % | | $ | 103,571 | | | | 13 | % | |
2019 | | | (2.79 | ) | | $ | 19.35 | | | | 31.04 | % | | | 0.28 | % | | | 1.71 | % | | | 0.52 | % | | $ | 100,139 | | | | 3 | % | |
2018 | | | (1.25 | ) | | $ | 16.92 | | | | (4.65 | )% | | | 0.28 | % | | | 1.65 | % | | | 0.38 | % | | $ | 106,432 | | | | 3 | % | |
2017 | | | (0.37 | ) | | $ | 19.06 | | | | 21.60 | % | | | 0.28 | % | | | 1.70 | % | | | 0.41 | % | | $ | 129,081 | | | | 3 | % | |
See notes to financial statements.
21
Victory Variable Insurance Funds | | Notes to Financial Statements
June 30, 2022 | |
(Unaudited)
1. Organization:
Victory Variable Insurance Funds (the "Trust") is organized as a Delaware statutory trust and the Trust is registered under the Investment Company Act of 1940, as amended (the "1940 Act"), as an open-end investment company. The Trust is comprised of six funds and is authorized to issue an unlimited number of shares, which are units of beneficial interest with a par value of $0.001 per share.
The accompanying financial statements are those of the 500 Index VIP Series (the "Fund"), a series of the Trust. The Fund offers a single class of shares: Class I. The Fund's shares are only available for purchase by certain separate accounts of insurance companies as investments for certain variable annuity plans and variable life insurance contracts issued by those insurance companies. The Fund is classified as diversified under the 1940 Act.
Under the Trust's organizational documents, its officers and trustees are indemnified against certain liabilities arising out of the performance of their duties to the Fund. In addition, in the normal course of business, the Fund enters into contracts with its vendors and others that provide for general indemnifications. The Fund's maximum exposure under these arrangements is unknown, as this would involve future claims that may be made against the Fund. However, based on experience, the Fund expects that risk of loss to be remote.
2. Significant Accounting Policies:
The following is a summary of significant accounting policies followed by the Trust in the preparation of its financial statements. The policies are in conformity with U.S. Generally Accepted Accounting Principles ("GAAP"). The preparation of financial statements in accordance with GAAP requires management to make estimates and assumptions that affect the reported amounts of assets and liabilities and disclosure of contingent assets and liabilities at the date of the financial statements and the reported amounts of income and expenses for the period. Actual results could differ from those estimates. The Fund follows the specialized accounting and reporting requirements under GAAP that are applicable to investment companies under Accounting Standards Codification Topic 946.
Investment Valuation:
The Fund records investments at fair value. Fair value is defined as the price that would be received to sell an asset or paid to transfer a liability in an orderly transaction between market participants at the measurement date.
The valuation techniques described below maximize the use of observable inputs and minimize the use of unobservable inputs in determining fair value. The inputs used for valuing the Fund's investments are summarized in the three broad levels listed below:
• Level 1 — quoted prices in active markets for identical securities
• Level 2 — other significant observable inputs (including quoted prices for similar securities or interest rates applicable to those securities, etc.)
• Level 3 — significant unobservable inputs (including the Fund's own assumptions in determining the fair value of investments)
Changes in valuation techniques may result in transfers in or out of an assigned level within the disclosure hierarchy. The inputs or methodologies used for valuation techniques are not necessarily an indication of the risk associated with entering into those investments.
Victory Capital Management Inc. ("VCM" or the "Adviser") has established the Pricing and Liquidity Committee (the "Committee"), and subject to the Trust's Board of Trustees' (the "Board") oversight, the Committee administers and oversees the Fund's valuation policies and procedures, which are approved by the Board.
Portfolio securities listed or traded on securities exchanges, including Exchange-Traded Funds ("ETFs"), are valued at the closing price on the exchange or system where the security is principally traded, if
22
Victory Variable Insurance Funds | | Notes to Financial Statements — continued
June 30, 2022 | |
(Unaudited)
available, or at the Nasdaq Official Closing Price. If there have been no sales for that day on the exchange or system, then a security is valued at the last available bid quotation on the exchange or system where the security is principally traded. In each of these situations, valuations are typically categorized as Level 1 in the fair value hierarchy.
Investments in open-end investment companies, other than ETFs, are valued at their net asset value ("NAV"). These valuations are typically categorized as Level 1 in the fair value hierarchy.
Futures contracts are valued at the settlement price established each day by the board of trade or an exchange on which they are traded. These valuations are typically categorized as Level 1 in the fair value hierarchy.
In the event that price quotations or valuations are not readily available, investments are valued at fair value in accordance with procedures established by and under the general supervision and responsibility of the Board. These valuations are typically categorized as Level 2 or Level 3 in the fair value hierarchy, based on the observability of inputs used to determine the fair value. The effect of fair value pricing is that securities may not be priced on the basis of quotations from the primary market in which they are traded and the actual price realized from the sale of a security may differ materially from the fair value price. Valuing these securities at fair value is intended to cause the Fund's NAV to be more reliable than it otherwise would be.
A summary of the valuations as of June 30, 2022, is included in the table below while the breakdown, by category, of investments is disclosed on the Schedule of Portfolio Investments:
| | | Level 1 | | Level 2 | | Level 3 | | Total | |
Common Stocks | | $ | 84,771,889 | | | $ | — | | | $ | — | | | $ | 84,771,889 | | |
Collateral for Securities Loaned | | | 180,023 | | | | — | | | | — | | | | 180,023 | | |
Total | | $ | 84,951,912 | | | $ | — | | | $ | — | | | $ | 84,951,912 | | |
Other Financial Investments*: | |
Liabilities: | | | | | | | | | |
Futures Contracts | | $ | (48,900 | ) | | $ | — | | | $ | — | | | $ | (48,900 | ) | |
Total | | $ | (48,900 | ) | | $ | — | | | $ | — | | | $ | (48,900 | ) | |
* Futures contracts are valued at the unrealized appreciation (depreciation) on the investment.
For the six months ended June 30, 2022, there were no transfers in or out of Level 3 in the fair value hierarchy.
Investment Companies:
Open-End Funds:
The Fund may invest in portfolios of open-end investment companies. These investment companies value securities in their portfolios for which market quotations are readily available at their market values (generally the last reported sale price) and all other securities and assets at their fair value by the methods established by the board of directors of the underlying funds.
Derivative Instruments:
Futures Contracts:
The Fund may enter into contracts for the future delivery of securities or foreign currencies and futures contracts based on a specific security, class of securities, foreign currency or an index, and purchase or sell options on any such futures contracts. A futures contract on a securities index is an agreement obligating either party to pay, and entitling the other party to receive, while the contract is outstanding, cash payments based on the level of a specified securities index. No physical delivery of the underlying asset is made. The Fund may enter into futures contracts in an effort to hedge against market risks.
23
Victory Variable Insurance Funds | | Notes to Financial Statements — continued
June 30, 2022 | |
(Unaudited)
The acquisition of put and call options on futures contracts will give the Fund the right (but not the obligation), for a specified price, to sell or to purchase the underlying futures contract, upon exercise of the option, at any time during the option period. Futures transactions involve brokerage costs and require the Fund to segregate assets to cover contracts that would require it to purchase securities or currencies. A good faith margin deposit, known as initial margin, of cash or government securities with a broker or custodian is required to initiate and maintain open positions in futures contracts. Subsequent payments, known as variation margin, are made or received by the Fund based on the change in the market value of the position and are recorded as unrealized appreciation or depreciation until the contract is closed out, at which time the gain or loss is realized. The Fund may lose the expected benefit of futures transactions if interest rates, exchange rates or securities prices change in an unanticipated manner. Such unanticipated changes may also result in lower overall performance than if the Fund had not entered into any futures transactions. In addition, the value of the Fund's futures positions may not prove to be perfectly or even highly correlated with the value of its portfolio securities or foreign currencies, limiting the Fund's ability to hedge effectively against interest rate, exchange rate and/or market risk and giving rise to additional risks. There is no assurance of liquidity in the secondary market for purposes of closing out futures positions. The collateral held by the Fund is reflected on the Statement of Assets and Liabilities under Deposit with broker for futures contracts.
Management has determined that no offsetting requirements exist as a result of their conclusion that the Fund is not subject to master netting agreements for futures contracts. During the six months ended June 30, 2022, the Fund entered into futures contracts primarily for the strategy of hedging or other purposes, including but not limited to, providing liquidity and equitizing cash.
Summary of Derivative Instruments:
The following table summarizes the fair values of derivative instruments on the Statement of Assets and Liabilities, categorized by risk exposure, as of June 30, 2022:
| | | Liabilities | |
| | | Variation Margin
Payable on
Open Futures
Contracts* | |
Equity Risk Exposure | | $ | 48,900 | | |
* Includes cumulative appreciation (depreciation) of futures contracts as reported on the Schedule of Portfolio Investments. Only current day's variation margin for futures contracts is reported within the Statement of Assets and Liabilities.
The following table presents the effect of derivative instruments on the Statement of Operations, categorized by risk exposure, for the period ended June 30, 2022:
| | | Net Realized Gains (Losses)
on Derivatives
Recognized as a
Result of Operations | | Net Change in Unrealized
Appreciation/Depreciation
on Derivatives Recognized
as a Result of Operations | |
| | | Net Realized
Gains (Losses) from
Futures Contracts | | Net Change in Unrealized
Appreciation/Depreciation
on Futures Contracts | |
Equity Risk Exposure | | $ | (119,144 | ) | | $ | (65,800 | ) | |
All open derivative positions at period end are reflected on the Fund's Schedule of Portfolio Investments. The underlying face value of open derivative positions relative to the Fund's net assets at period end is generally representative of the notional amount of open positions to net assets throughout the period.
Investment Transactions and Related Income:
Changes in holdings of investments are accounted for no later than one business day following the trade date. For financial reporting purposes, however, investment transactions are accounted for on
24
Victory Variable Insurance Funds | | Notes to Financial Statements — continued
June 30, 2022 | |
(Unaudited)
trade date or the last business day of the reporting period. Interest income is determined on the basis of coupon interest accrued using the effective interest method which adjusts, where applicable, the amortization of premiums or accretion of discounts. Dividend income is recorded on the ex-dividend date. Gains or losses realized on sales of securities are recorded on the identified cost basis.
Securities Lending:
The Fund, through a Securities Lending Agreement with Citibank, N.A. ("Citibank"), may lend its securities to qualified financial institutions, such as certain broker-dealers and banks, to earn additional income, net of income retained by Citibank. Borrowers are required to initially secure their loans for collateral in the amount of at least 102% of the value of U.S. securities loaned or at least 105% of the value of non-U.S. securities loaned, marked-to-market daily. Any collateral shortfalls associated with increases in the valuation of the securities loaned are generally cured the next business day. The collateral can be received in the form of cash collateral and/or non-cash collateral. Non-cash collateral can include U.S. Government Securities and other securities as permitted by Securities and Exchange Commission ("SEC") guidelines. The cash collateral is invested in short-term instruments or cash equivalents, primarily open-end investment companies, as noted on the Fund's Schedule of Portfolio Investments. The Fund effectively does not have control of the non-cash collateral and therefore it is not disclosed on the Fund's Schedule of Portfolio Investments. Collateral requirements are determined daily based on the value of the Fund's securities on loan as of the end of the prior business day. During the time portfolio securities are on loan, the borrower will pay the Fund any dividends or interest paid on such securities plus any fee negotiated between the parties to the lending agreement. The Fund also earns a return from the collateral. The Fund pays Citibank various fees in connection with the investment of cash collateral and fees based on the investment income received from securities lending activities. Securities lending income (net of these fees) is disclosed on the Statement of Operations. Loans are terminable upon demand and the borrower must return the loaned securities within the lesser of one standard settlement period or five business days. Although risk is mitigated by the collateral, the Fund could experience a delay in recovering its securities and possible loss of income or value if the borrower fails to return them. In addition, there is a risk that the value of the short-term investments will be less than the amount of cash collateral required to be returned to the borrower.
The Fund's agreement with Citibank does not include master netting provisions. Non-cash collateral received by the Fund may not be sold or repledged, except to satisfy borrower default.
The following table is a summary of the Fund's securities lending transactions as of June 30, 2022.
Value of
Securities on Loan | | Non-Cash
Collateral | | Cash
Collateral | |
| $ | 170,945 | | | $ | — | | | $ | 180,023 | | |
Federal Income Taxes:
The Fund intends to continue to qualify as a regulated investment company by complying with the provisions available to certain investment companies, as defined in applicable sections of the Internal Revenue Code, and to make distributions of net investment income and net realized gains sufficient to relieve it from all, or substantially all, federal income taxes. Accordingly, no provision for federal income taxes is required in the financial statements. The Fund has a tax year end of December 31.
For the six months ended June 30, 2022, the Fund did not incur any income tax, interest, or penalties, and has recorded no liability for net unrecognized tax benefits relating to uncertain tax positions.
Management of the Fund has reviewed tax positions taken in tax years that remain subject to examination by all major tax jurisdictions, including federal (i.e., the last four tax years, which includes the current fiscal tax year end). Management believes that there is no tax liability resulting from unrecognized tax benefits related to uncertain tax positions taken.
25
Victory Variable Insurance Funds | | Notes to Financial Statements — continued
June 30, 2022 | |
(Unaudited)
Allocations:
Expenses directly attributable to the Fund are charged to the Fund, while expenses that are attributable to more than one fund in the Trust, or jointly with an affiliated trust, are allocated among the respective funds in the Trust and/or an affiliated trust based upon net assets or another appropriate basis.
3. Purchases and Sales:
Purchases and sales of securities (excluding securities maturing less than one year from acquisition) for the six months ended June 30, 2022, were as follows:
Excluding
U.S. Government Securities | |
Purchases | | Sales | |
$ | 2,616,094 | | | $ | 9,401,477 | | |
4. Fees and Transactions with Affiliates and Related Parties:
Investment Advisory Fees:
Investment advisory services are provided to the Fund by the Adviser, which is a New York corporation registered as an investment adviser with the SEC. The Adviser is an indirect wholly owned subsidiary of Victory Capital Holdings, Inc., a publicly traded Delaware corporation, and a wholly owned direct subsidiary of Victory Capital Operating, LLC.
Under the terms of the Investment Advisory Agreement, the Adviser is entitled to receive fees accrued daily and paid monthly at an annualized rate of 0.25% of the Fund's average daily net assets. Amounts incurred and paid to VCM for the six months ended June 30, 2022, are reflected on the Statement of Operations as Investment advisory fees.
Administration and Servicing Fees:
VCM also serves as the Fund's administrator and fund accountant. Under the Administration and Fund Accounting Agreement, VCM is entitled to receive fees based on a percentage of the average daily net assets of the Trust, Victory Portfolios and Victory Portfolios II. The tiered rates at which VCM is paid by the Funds are shown in the table below:
Net Assets | |
Up to $15 billion | | $15 billion – $30 billion | | Over $30 billion | |
| | 0.08 | %, plus | | | 0.05 | %, plus | | | 0.04 | % | |
Amounts incurred for the six months ended June 30, 2022, are reflected on the Statement of Operations as Administration fees.
Citi Fund Services Ohio, Inc. ("Citi"), an affiliate of Citibank, acts as sub-administrator and sub-fund accountant to the Fund pursuant to the Sub-Administration and Sub-Fund Accounting Services Agreement between VCM and Citi. VCM pays Citi a fee for providing these services. The Trust reimburses VCM and Citi for out-of-pocket expenses incurred in providing these services and certain other expenses specifically allocated to the Fund. Amounts incurred for the six months ended June 30, 2022, are reflected on the Statement of Operations as Sub-Administration fees.
The Fund (as part of the Trust) has entered into an agreement with the Adviser to provide compliance services, pursuant to which the Adviser furnishes its compliance personnel, including the services of the Chief Compliance Officer ("CCO"), and other resources reasonably necessary to provide the Trust with compliance oversight services related to the design, administration, and oversight of a compliance program for the Trust in accordance with Rule 38a-1 under the 1940 Act. The CCO is an employee of the Adviser, which pays the compensation of the CCO and support staff. The funds in the Trust, Victory Portfolios, Victory Portfolios II and USAA Mutual Funds (collectively, the "Victory Funds Complex"), in
26
Victory Variable Insurance Funds | | Notes to Financial Statements — continued
June 30, 2022 | |
(Unaudited)
aggregate, compensate the Adviser for these services. Amounts incurred for the six months ended June 30, 2022, are reflected on the Statement of Operations as Compliance fees.
Transfer Agency Fees:
FIS Investor Services, LLC ("FIS") serves as the Fund's transfer agent. Under the Transfer Agent Agreement, the Trust pays FIS a fee for its services and reimburses FIS for all of their reasonable out-of-pocket expenses incurred in providing these services. Amounts incurred for the six months ended June 30, 2022, are reflected on the Statement of Operations as Transfer agent fees.
Distributor/Underwriting Services:
Victory Capital Services, Inc. (the "Distributor"), an affiliate of the Adviser, serves as Distributor for the continuous offering of the shares of the Fund pursuant to a Distribution Agreement between the Distributor and the Trust, and receives no fee or other compensation for these services.
Other Fees:
Citibank serves as the Fund's custodian. The Fund pays Citibank a fee for providing these services. Amounts incurred for the six months ended June 30, 2022, are reflected on the Statement of Operations as Custodian fees.
Sidley Austin LLP provides legal services to the Trust.
The Adviser has entered into an expense limitation agreement with the Fund until at least April 30, 2023. Under the terms of the agreement, the Adviser has agreed to waive fees or reimburse certain expenses to the extent that ordinary operating expenses incurred in any fiscal year exceed the expense limit for the Fund. Such excess amounts will be the liability of the Adviser. Acquired fund fees and expenses, interest, taxes, brokerage commissions, other expenditures which are capitalized in accordance with GAAP, and other extraordinary expenses not incurred in the ordinary course of a Fund's business are excluded from the expense limits. As of June 30, 2022, the expense limit (excluding voluntary waivers) is 0.28%.
Under the terms of the expense limitation agreement, as amended May 1, 2022, the Fund has agreed to repay fees and expenses that were waived or reimbursed by the Adviser for a period of up to three years (thirty-six (36) months) after the waiver or reimbursement took place, subject to the lesser of any operating expense limits in effect at the time of: (a) the original waiver or expense reimbursement; or (b) the recoupment, after giving effect to the recoupment amount.
As of June 30, 2022, the following amounts are available to be repaid to the Adviser. The Fund has not recorded any amounts available to be repaid as a liability due to an assessment that such repayment is not probable at June 30, 2022.
Expires
2022 | | Expires
2023 | | Expires
2024 | | Expires
2025 | | Total | |
| $ | 128,160 | | | $ | 277,986 | | | $ | 220,169 | | | $ | 61,209 | | | $ | 687,524 | | |
The Adviser may voluntarily waive or reimburse additional fees to assist the Fund in maintaining competitive expense ratios. Voluntary waivers and reimbursements applicable to the Fund is not available to be recouped at a future time. There were no voluntary waivers or reimbursements for the six months ended June 30, 2022.
Certain officers and/or interested trustees of the Fund are also officers and/or employees of the Adviser, administrator, fund accountant, sub-administrator, sub-fund accountant, custodian, legal counsel, and Distributor.
27
Victory Variable Insurance Funds | | Notes to Financial Statements — continued
June 30, 2022 | |
(Unaudited)
5. Risks:
The Fund may be subject to other risks in addition to these identified risks.
Equity Risk — The value of the equity securities in which the Fund invests may decline in response to developments affecting individual companies and/or general economic conditions in the United States or abroad. A company's earnings or dividends may not increase as expected (or may decline) because of poor management, competitive pressures, reliance on particular suppliers or geographical regions, labor problems or shortages, corporate restructurings, fraudulent disclosures, man-made or natural disasters, military confrontations or wars, terrorism, public health crises, or other events, conditions and factors. Price changes may be temporary or last for extended periods.
Large-Capitalization Stock Risk — The securities of large-capitalization companies may underperform the securities of smaller-capitalization companies or the market as a whole. The growth rate of larger, more established companies may lag those of smaller companies, especially during periods of economic expansion.
Passive Investment Risk/Index Risk — The Fund is designed to track the Index and is not actively managed. The Fund will not buy or sell shares of an equity security due to current or projected performance of a security, industry or sector, unless that security is added to or removed, respectively, from the Index. The Fund does not, therefore, seek returns in excess of the Index, and does not attempt to take defensive positions or hedge against potential risks unless such defensive positions are also taken by the Index.
Derivatives Risk — The use of derivative instruments, such as futures contracts and credit default swaps, exposes the Fund to additional risks and transaction costs. Risks of derivative instruments include: (1) the risk that interest rates, securities prices, asset values, and currency markets will not move in the direction that a portfolio manager anticipates; (2) imperfect correlation between the price of derivative instruments and movements in the prices of the securities, assets, interest rates or currencies being hedged; (3) the fact that skills needed to use these strategies are different than those needed to select portfolio securities; (4) the possible absence of a liquid secondary market for any particular instrument and possible exchange imposed price fluctuation limits, either of which may make it difficult or impossible to close out a position when desired; (5) the risk that adverse price movements in an instrument can result in a loss substantially greater than the Fund's initial investment in that instrument (in some cases, the potential loss is unlimited); (6) particularly in the case of privately-negotiated instruments, the risk that the counterparty will not perform its obligations, which could leave the Fund worse off than if it had not entered into the position; and (7) the inability to close out certain hedged positions to avoid adverse tax consequences.
Market Risk — Overall market risks may affect the value of the Fund. Domestic and international factors such as political events, war, terrorism, trade disputes, inflation rates, interest rate levels and other fiscal and monetary policy changes, cybersecurity incidents, pandemics and other public health crises, sanctions against a particular foreign country, its nationals, businesses or industries and related geopolitical events, as well as environmental disasters such as earthquakes, fires, and floods or other catastrophes, may add to instability in global economies and markets generally, and may lead to increased market volatility. Global economies and financial markets are highly interconnected, which increases the possibility that conditions in one country or region might adversely affect issuers in another country or region. The impact of these and other factors may be short-term or may last for extended periods.
6. Borrowing and Interfund Lending:
Line of Credit:
The Victory Funds Complex participates in a short-term demand note "Line of Credit" agreement with Citibank. The Line of Credit agreement with Citibank was renewed on June 27, 2022, with a termination date of June 26, 2023. Under the agreement with Citibank, the Victory Funds Complex may borrow up to $600 million, of which $300 million is committed and $300 million is uncommitted. $40 million of
28
Victory Variable Insurance Funds | | Notes to Financial Statements — continued
June 30, 2022 | |
(Unaudited)
the Line of Credit is reserved for use by the Victory Floating Rate Fund. another series of the Victory Funds Complex, with Victory Floating Rate Fund paying the related commitment fees for that amount. The purpose of the Line of Credit is to meet temporary or emergency cash needs. For the six months ended June 30, 2022, Citibank received an annual commitment fee of 0.15% on $300 million for providing the Line of Credit. Each fund in the Victory Funds Complex paid a pro-rata portion of the commitment fees plus any interest on amounts borrowed. For the period from January 1, 2022, through June 27, 2022, interest was based on the one-month London Interbank Offered Rate ("LIBOR") plus one percent. Effective with the renewal, for the period June 28, 2022, through June 30, 2022, interest was based on the one-month Secured Overnight Financing Rate (SOFR) plus 1.10 percent. Interest charged to the Fund during the period, if applicable, is reflected on the Statement of Operations under Line of credit fees.
The fund had no borrowings under the Line of Credit agreement during the six months ended June 30, 2022.
Interfund Lending:
The Trust and the Adviser rely on an exemptive order granted by the SEC in March 2017 (the "Order"), permitting the establishment and operation of an Interfund Lending Facility (the "Facility"). The Facility allows the Fund to directly lend and borrow money to or from any other fund in the Victory Funds Complex that is permitted to participate in the Facility, relying upon the Order at rates beneficial to both the borrowing and lending funds. Advances under the Facility are allowed for temporary or emergency purposes, including the meeting of redemption requests that otherwise might require the untimely disposition of securities, and are subject to each fund's borrowing restrictions. The interfund loan rate is determined, as specified in the Order, by averaging the current repurchase agreement rate and the current bank loan rate. As a Borrower, interest charged to the Fund, if any, during the period, is reflected on the Statement of Operations under Interfund lending fees. As a Lender, interest earned by the Fund, if any, during the period, is reflected on the Statement of Operations under Interfund lending.
The Fund did not utilize or participate in the Facility during the six months ended June 30, 2022.
7. Federal Income Tax Information:
The Fund intends to distribute any net investment income annually. Distributable net realized gains, if any, are declared and paid at least annually.
The amounts of dividends from net investment income and distributions from net realized gains (collectively, distributions to shareholders) are determined in accordance with federal income tax regulations, which may differ from GAAP. To the extent these "book/tax" differences are permanent in nature (e.g., net operating loss and distribution reclassification), such amounts are reclassified within the components of net assets based on their federal tax-basis treatment; temporary differences (e.g., wash sales) do not require reclassification. To the extent dividends and distributions exceed net investment income and net realized gains for tax purposes, they are reported as distributions of capital. Net investment losses incurred by the Fund may be reclassified as an offset to capital on the accompanying Statement of Assets and Liabilities.
The tax character of current year distributions paid and the tax basis of the current components of accumulated earnings (loss) will be determined at the end of the current tax year ending December 31, 2022.
At the tax year ended December 31, 2021, the Fund had no capital loss carryforward for federal income tax purposes.
29
Victory Variable Insurance Funds | | Supplemental Information
June 30, 2022 | |
(Unaudited)
Proxy Voting and Portfolio Holdings Information
Proxy Voting:
Information regarding the policies and procedures the Fund uses to determine how to vote proxies relating to portfolio securities is available without charge, upon request, by calling 800-539-3863. The information is also included in the Fund's Statement of Additional Information, which is available on the SEC's website at www.sec.gov.
Information relating to how the Fund voted proxies relating to portfolio securities held during the most recent 12 months ended June 30 is available on the SEC's website at www.sec.gov.
Availability of Schedules of Portfolio Investments:
The Trust files a complete list of Schedules of Portfolio Investments with the SEC for the first and third quarter of each fiscal year on Form N-PORT. Forms N-PORT are available on the SEC's website at www.sec.gov.
Expense Example
As a shareholder of the Fund, you may incur two types of costs: (1) transaction costs and (2) ongoing costs, including management fees and other Fund expenses. These examples are intended to help you understand your ongoing costs (in dollars) of investing in the Fund and to compare these costs with the ongoing costs of investing in other mutual funds.
These examples are based on an investment of $1,000 invested at the beginning of the period and held for the entire period from January 1, 2022, through June 30, 2022.
The Actual Expense figures in the table below provide information about actual account values and actual expenses. You may use the information below, together with the amount you invested, to estimate the expenses that you paid over the period. Simply divide your account value by $1,000 (for example, an $8,600 account value divided by $1,000 = 8.6), then multiply the result by the number in the table under the heading entitled "Actual Expenses Paid During Period" to estimate the expenses you paid on your account during this period.
The Hypothetical Expense figures in the table below provide information about hypothetical account values and hypothetical expenses based on the Fund's actual expense ratio and an assumed rate of return of 5% per year before expenses, which is not the Fund's actual return. The hypothetical account values and expenses may not be used to estimate the actual ending account balance or expenses you paid for the period. You may use this information to compare this 5% hypothetical example with the 5% hypothetical examples that appear in shareholder reports of other funds.
Please note the expenses shown in the table below are meant to highlight your ongoing costs only and do not reflect any transactional costs. Therefore, the hypothetical expenses in the table are useful in comparing ongoing costs only and will not help you determine the relative total costs of owning different funds. In addition, if these transactional costs were included, your costs would have been higher.
Beginning
Account Value
1/1/22 | | Actual
Ending
Account Value
6/30/22 | | Hypothetical
Ending
Account Value
6/30/22 | | Actual
Expenses Paid
During Period
1/1/22-6/30/22* | | Hypothetical
Expenses Paid
During Period
1/1/22-6/30/22* | | Annualized
Expense Ratio
During Period
1/1/22-6/30/22 | |
| $ | 1,000.00 | | | $ | 790.80 | | | $ | 1,023.41 | | | $ | 1.24 | | | $ | 1.40 | | | | 0.28 | % | |
* Expenses are equal to the average account value multiplied by the Fund's annualized expense ratio multiplied by 181/365 (the number of days in the most recent fiscal half-year divided by the number of days in the fiscal year).
30
Victory Variable Insurance Funds | | Supplemental Information — continued
June 30, 2022 | |
(Unaudited)
Liquidity Risk Management Program:
The Victory Funds have adopted and implemented a written liquidity risk management program (the "LRMP") as required by Rule 22e-4 under the Investment Company Act of 1940, as amended. The LRMP is reasonably designed to assess and manage the Fund's liquidity risk, taking into consideration the Fund's investment strategy and the liquidity of its portfolio investments during normal and reasonably foreseeable stressed market conditions; its short- and long-term cash flow projections; and its cash holdings and access to other liquidity management tools such as available funding sources including the Victory Funds Complex Interfund Lending Facility and Line of Credit (discussed in the Notes to Financial Statements). The Victory Funds' Board of Trustees approved the appointment of the Fund's investment adviser, Victory Capital Management Inc. ("Victory Capital"), as the administrator of the LRMP.
Victory Capital manages liquidity risks associated with the Fund's investments by monitoring, among other things, cash and cash equivalents, any use of derivatives, the concentration of investments, the appropriateness of the Fund's investment strategy, and by classifying every Fund investment as either highly liquid, moderately liquid, less liquid, or illiquid on at least a monthly basis. To assist with the classification of Fund investments, Victory Capital has retained a third-party provider of liquidity evaluation services. This provider determines preliminary liquidity classifications for all portfolio holdings based upon portfolio-level data and certain assumptions provided by Victory Capital. Victory Capital reviews the preliminary liquidity classifications and, when appropriate, considers other information including input from the Fund's portfolio managers (including the portfolio managers employed by any investment sub-advisers) in determining final liquidity classifications.
At a meeting held on February 24, 2022, Victory Capital provided an oral and written report to the Trustees on the operation and effectiveness of the LRMP during the previous year. The report from Victory Capital concluded that the Fund did not experience any significant liquidity challenges during the covered period, and the Fund's LRMP is reasonably designed to assess and manage its liquidity risk. The report also concluded that the LRMP continues to operate adequately and effectively to enable Victory Capital to oversee and manage liquidity risk and ensure the Fund is able to meet redemption requests without significant dilution to the remaining investors' interest in the Fund. During the review period, the Fund's portfolio consisted primarily of highly liquid investments, which are defined as cash and any investments that the Fund reasonably expects to be converted to cash in current market conditions in three business days or less without significantly changing the market value of the investment. Therefore, the Fund has not adopted a highly liquid investment minimum. The Fund's investments were below the limitation on illiquid investments during the review period. Additionally, Victory Capital indicated that no events occurred that would require the filing of Form N-LIQUID and recommended no material changes to the LRMP.
31
Privacy Policy
Protecting the Privacy of Information
The Trust respects your right to privacy. We also know that you expect us to conduct and process your business in an accurate and efficient manner. To do so, we must collect and maintain certain personal information about you. This is the information we collect from you on applications or other forms, and from the transactions you make with us or third parties. It may include your name, address, social security number, account transactions and balances, and information about investment goals and risk tolerance.
We do not disclose any information about you or about former customers to anyone except as permitted or required by law. Specifically, we may disclose the information we collect to companies that perform services on our behalf, such as the transfer agent that processes shareholder accounts and printers and mailers that assist us in the distribution of investor materials. We may also disclose this information to companies that perform marketing services on our behalf. This allows us to continue to offer you Victory investment products and services that meet your investing needs, and to effect transactions that you request or authorize. These companies will use this information only in connection with the services for which we hired them. They are not permitted to use or share this information for any other purpose.
To protect your personal information internally, we permit access only by authorized employees and maintain physical, electronic, and procedural safeguards to guard your personal information.*
* You may have received communications regarding information about privacy policies from other financial institutions which gave you the opportunity to "opt-out" of certain information sharing with companies which are not affiliated with that financial institution. The Trust does not share information with other companies for purposes of marketing solicitations for products other than the Trust. Therefore, the Trust does not provide opt-out options to their shareholders.
Victory Funds
P.O. Box 182593
Columbus, Ohio 43218-2593

Visit our website at: | | Call Victory at: | |
www.vcm.com | | 800-539-FUND (800-539-3863) | |
VVIF-RS-SPIVIP-SAR (6/22)

June 30, 2022
Semi Annual Report
Victory Variable Insurance Funds
Victory RS Small Cap Growth Equity VIP Series
www.vcm.com
News, Information And Education 24 Hours A Day, 7 Days A Week
The Victory Capital website gives fund shareholders, prospective shareholders, and investment professionals a convenient way to access fund information, get guidance, and track fund performance anywhere they can access the Internet. The site includes:
• Detailed performance records
• Daily share prices
• The latest fund news
• Investment resources to help you become a better investor
• A section dedicated to investment professionals
Whether you're a potential investor searching for the fund that matches your investment philosophy, a seasoned investor interested in planning tools, or an investment professional, www.vcm.com has what you seek. Visit us anytime. We're always open.
Victory Variable Insurance Funds
TABLE OF CONTENTS
Investment Objective & Portfolio Holdings | | | 3 | | |
Schedule of Portfolio Investments | | | 4 | | |
Financial Statements | |
Statement of Assets and Liabilities | | | 8 | | |
Statement of Operations | | | 9 | | |
Statements of Changes in Net Assets | | | 10 | | |
Financial Highlights | | | 12 | | |
Notes to Financial Statements | | | 14 | | |
Supplemental Information | | | 21 | | |
Proxy Voting and Portfolio Holdings Information | | | 21 | | |
Expense Example | | | 21 | | |
Liquidity Risk Management Program | | | 22 | | |
Privacy Policy (inside back cover) | | | |
1
The Fund is distributed by Victory Capital Services, Inc. Victory Capital Management Inc. is the investment adviser to the Fund and receives fees from the Fund for performing services for the Fund.
This report is not authorized for distribution to prospective investors unless preceded or accompanied by a current prospectus of the Fund.
For additional information about any Victory Fund, including fees, expenses, and risks, view our prospectus online at vcm.com or call 800-539-3863. Read it carefully before you invest or send money.
The information in this report is based on data obtained from recognized services and sources and is believed to be reliable. Any opinions, projections, or recommendations in this report are subject to change without notice and are not intended as individual investment advice. Past investment performance of the Fund, markets or securities mentioned herein should not be considered to be indicative of future results.
• NOT FDIC INSURED • NO BANK GUARANTEE • MAY LOSE VALUE

Call Victory at:
800-539-FUND (800-539-3863)
Visit our website at:
www.vcm.com
2
Victory Variable Insurance Funds
Victory RS Small Cap Growth Equity VIP Series | | June 30, 2022 | |
(Unaudited)
Investment Objective and Portfolio Holdings:
The Fund seeks long-term capital growth.
Top 10 Holdings*:
June 30, 2022
(% of Net Assets)
MACOM Technology Solutions Holdings, Inc. | | | 3.0 | % | |
Evoqua Water Technologies Corp. | | | 2.7 | % | |
Advanced Energy Industries, Inc. | | | 2.5 | % | |
WNS Holdings Ltd. | | | 2.5 | % | |
Acushnet Holdings Corp. | | | 2.1 | % | |
Inspire Medical Systems, Inc. | | | 2.1 | % | |
Chart Industries, Inc. | | | 2.0 | % | |
HealthEquity, Inc. | | | 1.9 | % | |
Matador Resources Co. | | | 1.9 | % | |
Varonis Systems, Inc. | | | 1.8 | % | |
Sector Allocation*:
June 30, 2022
(% of Net Assets)
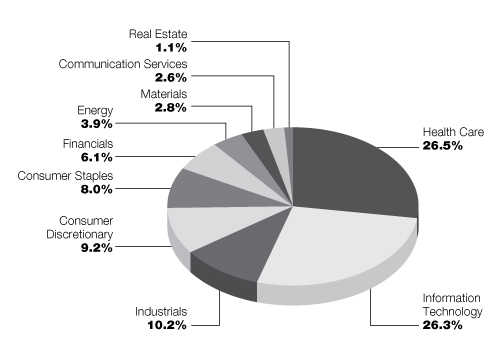
* Does not include futures contracts, money market instruments, and short-term investments purchased with cash collateral from securities loaned.
Percentages are of the net assets of the Fund and may not equal 100%.
Refer to the Schedule of Portfolio Investments for a complete list of securities.
3
Victory Variable Insurance Funds
Victory RS Small Cap Growth Equity VIP Series | | Schedule of Portfolio Investments
June 30, 2022 | |
(Unaudited)
Security Description | | Shares | | Value | |
Common Stocks (96.7%) | |
Biotechnology (10.2%): | |
Alkermes PLC (a) | | | 29,680 | | | $ | 884,167 | | |
Apellis Pharmaceuticals, Inc. (a) | | | 17,380 | | | | 785,924 | | |
BioCryst Pharmaceuticals, Inc. (a) (b) | | | 92,050 | | | | 973,889 | | |
DermTech, Inc. (a) (b) | | | 28,460 | | | | 157,668 | | |
Equillium, Inc. (a) | | | 81,017 | | | | 165,275 | | |
Fate Therapeutics, Inc. (a) | | | 28,140 | | | | 697,309 | | |
Halozyme Therapeutics, Inc. (a) | | | 22,200 | | | | 976,800 | | |
Karuna Therapeutics, Inc. (a) | | | 5,750 | | | | 727,433 | | |
Kezar Life Sciences, Inc. (a) | | | 70,970 | | | | 586,922 | | |
Kura Oncology, Inc. (a) | | | 20,180 | | | | 369,899 | | |
Opthea Ltd., ADR (a) (c) | | | 37,920 | | | | 238,896 | | |
SpringWorks Therapeutics, Inc. (a) | | | 25,660 | | | | 631,749 | | |
| | | | 7,195,931 | | |
Communication Services (2.6%): | |
World Wrestling Entertainment, Inc., Class A | | | 18,410 | | | | 1,150,441 | | |
ZipRecruiter, Inc. (a) | | | 48,150 | | | | 713,583 | | |
| | | | 1,864,024 | | |
Consumer Discretionary (9.2%): | |
Acushnet Holdings Corp. (b) | | | 36,460 | | | | 1,519,653 | | |
Boot Barn Holdings, Inc. (a) | | | 11,860 | | | | 817,272 | | |
Funko, Inc., Class A (a) | | | 22,140 | | | | 494,165 | | |
Gentherm, Inc. (a) | | | 11,980 | | | | 747,672 | | |
Ollie's Bargain Outlet Holdings, Inc. (a) | | | 9,420 | | | | 553,425 | | |
Papa John's International, Inc. | | | 6,950 | | | | 580,464 | | |
Wingstop, Inc. | | | 8,540 | | | | 638,536 | | |
YETI Holdings, Inc. (a) | | | 27,430 | | | | 1,186,896 | | |
| | | | 6,538,083 | | |
Consumer Staples (8.0%): | |
BellRing Brands, Inc. (a) | | | 45,560 | | | | 1,133,988 | | |
e.l.f. Beauty, Inc. (a) | | | 33,750 | | | | 1,035,450 | | |
Freshpet, Inc. (a) | | | 9,760 | | | | 506,446 | | |
Grocery Outlet Holding Corp. (a) | | | 22,450 | | | | 957,044 | | |
Hostess Brands, Inc. (a) | | | 16,740 | | | | 355,055 | | |
The Beauty Health Co. (a) (b) | | | 50,360 | | | | 647,630 | | |
The Simply Good Foods Co. (a) | | | 27,390 | | | | 1,034,520 | | |
| | | | 5,670,133 | | |
Energy (3.9%): | |
Callon Petroleum Co. (a) | | | 14,140 | | | | 554,288 | | |
Matador Resources Co. | | | 28,550 | | | | 1,330,145 | | |
Ranger Oil Corp. (a) | | | 26,060 | | | | 856,592 | | |
| | | | 2,741,025 | | |
Financials (6.1%): | |
Customers Bancorp, Inc. (a) | | | 19,160 | | | | 649,524 | | |
Focus Financial Partners, Inc., Class A (a) | | | 25,220 | | | | 858,993 | | |
PRA Group, Inc. (a) | | | 24,530 | | | | 891,911 | | |
See notes to financial statements.
4
Victory Variable Insurance Funds
Victory RS Small Cap Growth Equity VIP Series | | Schedule of Portfolio Investments — continued
June 30, 2022 | |
(Unaudited)
Security Description | | Shares | | Value | |
Walker & Dunlop, Inc. | | | 6,900 | | | $ | 664,746 | | |
Wintrust Financial Corp. | | | 15,430 | | | | 1,236,714 | | |
| | | | 4,301,888 | | |
Health Care Equipment & Supplies (5.5%): | |
Axonics, Inc. (a) | | | 11,320 | | | | 641,504 | | |
CONMED Corp. | | | 420 | | | | 40,219 | | |
CryoPort, Inc. (a) | | | 29,530 | | | | 914,839 | | |
LivaNova PLC (a) | | | 12,130 | | | | 757,761 | | |
Nevro Corp. (a) | | | 13,680 | | | | 599,595 | | |
Shockwave Medical, Inc. (a) | | | 4,850 | | | | 927,175 | | |
| | | | 3,881,093 | | |
Health Care Providers & Services (5.9%): | |
Acadia Healthcare Co., Inc. (a) | | | 18,040 | | | | 1,220,045 | | |
HealthEquity, Inc. (a) | | | 22,230 | | | | 1,364,700 | | |
Option Care Health, Inc. (a) | | | 27,290 | | | | 758,389 | | |
Surgery Partners, Inc. (a) | | | 29,950 | | | | 866,154 | | |
| | | | 4,209,288 | | |
Health Care Technology (3.1%): | |
Evolent Health, Inc., Class A (a) | | | 12,290 | | | | 377,426 | | |
Health Catalyst, Inc. (a) | | | 24,886 | | | | 360,598 | | |
Inspire Medical Systems, Inc. (a) | | | 7,960 | | | | 1,454,053 | | |
| | | | 2,192,077 | | |
Industrials (10.2%): | |
AAON, Inc. | | | 1,620 | | | | 88,711 | | |
AAR Corp. (a) | | | 14,780 | | | | 618,395 | | |
Applied Industrial Technologies, Inc. | | | 7,250 | | | | 697,233 | | |
Chart Industries, Inc. (a) | | | 8,530 | | | | 1,427,751 | | |
Evoqua Water Technologies Corp. (a) | | | 59,060 | | | | 1,920,041 | | |
Mercury Systems, Inc. (a) | | | 7,200 | | | | 463,176 | | |
Simpson Manufacturing Co., Inc. | | | 8,120 | | | | 816,953 | | |
Trex Co., Inc. (a) | | | 6,510 | | | | 354,274 | | |
Zurn Water Solutions Corp. | | | 31,000 | | | | 844,440 | | |
| | | | 7,230,974 | | |
IT Services (6.4%): | |
DigitalOcean Holdings, Inc. (a) (b) | | | 24,550 | | | | 1,015,388 | | |
Evo Payments, Inc., Class A (a) | | | 13,080 | | | | 307,642 | | |
Flywire Corp. (a) | | | 24,350 | | | | 429,290 | | |
Marqeta, Inc., Class A (a) | | | 44,450 | | | | 360,489 | | |
Paya Holdings, Inc. (a) | | | 54,540 | | | | 358,328 | | |
Paymentus Holdings, Inc., Class A (a) (b) | | | 22,870 | | | | 305,772 | | |
WNS Holdings Ltd., ADR (a) | | | 23,326 | | | | 1,741,053 | | |
| | | | 4,517,962 | | |
Materials (2.8%): | |
Avient Corp. | | | 18,120 | | | | 726,250 | | |
Silgan Holdings, Inc. | | | 8,710 | | | | 360,158 | | |
Summit Materials, Inc., Class A (a) | | | 38,130 | | | | 888,048 | | |
| | | | 1,974,456 | | |
See notes to financial statements.
5
Victory Variable Insurance Funds
Victory RS Small Cap Growth Equity VIP Series | | Schedule of Portfolio Investments — continued
June 30, 2022 | |
(Unaudited)
Security Description | | Shares | | Value | |
Pharmaceuticals (1.8%): | |
Intra-Cellular Therapies, Inc. (a) | | | 21,950 | | | $ | 1,252,906 | | |
Real Estate (1.1%): | |
National Storage Affiliates Trust | | | 16,240 | | | | 813,137 | | |
Semiconductors & Semiconductor Equipment (9.2%): | |
Advanced Energy Industries, Inc. | | | 24,530 | | | | 1,790,199 | | |
Impinj, Inc. (a) (b) | | | 15,580 | | | | 914,079 | | |
Lattice Semiconductor Corp. (a) | | | 14,280 | | | | 692,580 | | |
MACOM Technology Solutions Holdings, Inc. (a) | | | 46,460 | | | | 2,141,806 | | |
Silicon Laboratories, Inc. (a) | | | 4,410 | | | | 618,370 | | |
SiTime Corp. (a) | | | 2,160 | | | | 352,145 | | |
| | | | 6,509,179 | | |
Software (10.7%): | |
ACI Worldwide, Inc. (a) | | | 39,170 | | | | 1,014,111 | | |
Avaya Holdings Corp. (a) | | | 41,260 | | | | 92,422 | | |
Box, Inc., Class A (a) | | | 27,090 | | | | 681,043 | | |
Gitlab, Inc., Class A (a) (b) | | | 8,630 | | | | 458,598 | | |
Jamf Holding Corp. (a) (b) | | | 38,470 | | | | 952,902 | | |
Smartsheet, Inc., Class A (a) | | | 18,050 | | | | 567,312 | | |
Sprout Social, Inc., Class A (a) | | | 17,640 | | | | 1,024,355 | | |
Telos Corp. (a) | | | 50,710 | | | | 409,737 | | |
Tenable Holdings, Inc. (a) | | | 24,280 | | | | 1,102,555 | | |
Varonis Systems, Inc. (a) | | | 44,370 | | | | 1,300,928 | | |
| | | | 7,603,963 | | |
Total Common Stocks (Cost $79,981,153) | | | 68,496,119 | | |
Collateral for Securities Loaned (4.7%)^ | |
BlackRock Liquidity Funds TempFund, Institutional Shares, 1.47% (d) | | | 102,483 | | | | 102,483 | | |
Goldman Sachs Financial Square Prime Obligations Fund, Institutional
Shares, 1.42% (d) | | | 51,144 | | | | 51,144 | | |
HSBC U.S. Government Money Market Fund, I Shares, 1.46% (d) | | | 637,871 | | | | 637,871 | | |
JPMorgan Prime Money Market Fund, Capital Shares, 1.50% (d) | | | 407,808 | | | | 407,808 | | |
Morgan Stanley Institutional Liquidity Government Portfolio, Institutional
Shares, 1.39% (d) | | | 271,962 | | | | 271,962 | | |
Morgan Stanley Institutional Liquidity Prime Portfolio, Institutional
Shares, 1.53% (d) | | | 1,833,584 | | | | 1,833,584 | | |
Total Collateral for Securities Loaned (Cost $3,304,852) | | | 3,304,852 | | |
Total Investments (Cost $83,286,005) — 101.4% | | | 71,800,971 | | |
Liabilities in excess of other assets — (1.4%) | | | (1,004,762 | ) | |
NET ASSETS — 100.00% | | $ | 70,796,209 | | |
^ Purchased with cash collateral from securities on loan.
(a) Non-income producing security.
(b) All or a portion of this security is on loan.
See notes to financial statements.
6
Victory Variable Insurance Funds
Victory RS Small Cap Growth Equity VIP Series | | Schedule of Portfolio Investments — continued
June 30, 2022 | |
(Unaudited)
(c) The Fund's Adviser has deemed this security to be illiquid based upon procedures approved by the Board of Trustees. As of June 30, 2022, illiquid securities were 0.3% of net assets.
(d) Rate disclosed is the daily yield on June 30, 2022.
ADR — American Depositary Receipt
PLC — Public Limited Company
See notes to financial statements.
7
Victory Variable Insurance Funds | | Statement of Assets and Liabilities
June 30, 2022 | |
(Unaudited)
| | | Victory RS Small Cap
Growth Equity VIP Series | |
Assets: | |
Investments, at value (Cost $83,286,005) | | $ | 71,800,971 | (a) | |
Cash | | | 2,188,041 | | |
Receivables: | |
Interest and dividends | | | 6,023 | | |
Capital shares issued | | | 317,500 | | |
Investments sold | | | 1,523,423 | | |
From Adviser | | | 15,278 | | |
Prepaid expenses | | | 588 | | |
Total Assets | | | 75,851,824 | | |
Liabilities: | |
Payables: | |
Collateral received on loaned securities | | | 3,304,852 | | |
Investments purchased | | | 1,649,604 | | |
Capital shares redeemed | | | 4,114 | | |
Accrued expenses and other payables: | |
Investment advisory fees | | | 44,671 | | |
Administration fees | | | 4,187 | | |
Custodian fees | | | 1,311 | | |
Transfer agent fees | | | 37,694 | | |
Compliance fees | | | 36 | | |
Other accrued expenses | | | 9,146 | | |
Total Liabilities | | | 5,055,615 | | |
Net Assets: | |
Capital | | | 80,062,584 | | |
Total accumulated earnings/(loss) | | | (9,266,375 | ) | |
Net Assets | | $ | 70,796,209 | | |
Shares (unlimited shares authorized with a par value of $0.001 per share): | | | 6,822,375 | | |
Net asset value: | | $ | 10.38 | | |
(a) Includes $3,124,906 of securities on loan.
See notes to financial statements.
8
Victory Variable Insurance Funds | | Statement of Operations
For the Six Months Ended June 30, 2022 | |
(Unaudited)
| | | Victory RS Small Cap
Growth Equity VIP Series | |
Investment Income: | |
Dividends | | $ | 146,676 | | |
Interest | | | 927 | | |
Securities lending (net of fees) | | | 2,648 | | |
Total Income | | | 150,251 | | |
Expenses: | |
Investment advisory fees | | | 322,027 | | |
Administration fees | | | 23,197 | | |
Sub-Administration fees | | | 8,430 | | |
Custodian fees | | | 4,106 | | |
Transfer agent fees | | | 67,303 | | |
Trustees' fees | | | 3,288 | | |
Compliance fees | | | 323 | | |
Legal and audit fees | | | 6,390 | | |
Other expenses | | | 5,685 | | |
Total Expenses | | | 440,749 | | |
Expenses waived/reimbursed by Adviser | | | (63,913 | ) | |
Net Expenses | | | 376,836 | | |
Net Investment Income (Loss) | | | (226,585 | ) | |
Realized/Unrealized Gains (Losses) from Investments: | |
Net realized gains (losses) from investment securities | | | (15,154,720 | ) | |
Net change in unrealized appreciation/depreciation on investment securities | | | (25,590,918 | ) | |
Net realized/unrealized gains (losses) on investments | | | (40,745,638 | ) | |
Change in net assets resulting from operations | | $ | (40,972,223 | ) | |
See notes to financial statements.
9
Victory Variable Insurance Funds | | Statements of Changes in Net Assets | |
| | | Victory RS Small Cap Growth
Equity VIP Series | |
| | | Six Months
Ended
June 30, 2022
(Unaudited) | | Year
Ended
December 31,
2021 | |
From Investment Activities: | |
Operations: | |
Net investment income (loss) | | $ | (226,585 | ) | | $ | (997,483 | ) | |
Net realized gains (losses) from investments | | | (15,154,720 | ) | | | 18,931,340 | | |
Net change in unrealized appreciation/depreciation
on investments | | | (25,590,918 | ) | | | (31,860,727 | ) | |
Change in net assets resulting from operations | | | (40,972,223 | ) | | | (13,926,870 | ) | |
Change in net assets resulting from distributions to shareholders | | | — | | | | (8,854,544 | ) | |
Change in net assets resulting from capital transactions | | | (1,465,319 | ) | | | (6,604,640 | ) | |
Change in net assets | | | (42,437,542 | ) | | | (29,386,054 | ) | |
Net Assets: | |
Beginning of period | | | 113,233,751 | | | | 142,619,805 | | |
End of period | | $ | 70,796,209 | | | $ | 113,233,751 | | |
Capital Transactions: | |
Proceeds from shares issued | | $ | 6,773,836 | | | $ | 17,744,088 | | |
Distributions reinvested | | | — | | | | 8,854,544 | | |
Cost of shares redeemed | | | (8,239,155 | ) | | | (33,203,272 | ) | |
Change in net assets resulting from capital transactions | | $ | (1,465,319 | ) | | $ | (6,604,640 | ) | |
Share Transactions: | |
Issued | | | 547,367 | | | | 899,924 | | |
Reinvested | | | — | | | | 565,424 | | |
Redeemed | | | (635,888 | ) | | | (1,719,218 | ) | |
Change in Shares | | | (88,521 | ) | | | (253,870 | ) | |
See notes to financial statements.
10
This page is intentionally left blank.
11
Victory Variable Insurance Funds | | Financial Highlights | |
For a Share Outstanding Throughout Each Period
| | | | | Investment Activities | | Distributions to
Shareholders From | | | |
| | | Net Asset
Value,
Beginning
of Period | | Net
Investment
Income
(Loss)(a) | | Net
Realized
and
Unrealized
Gains
(Losses) on
Investments | | Total from
Investment
Activities | | Net
Realized
Gains from
Investments | | Total
Distributions | | Net
Asset
Value,
End of
Period | | Total
Return(b)(c) | |
Victory RS Small Cap Growth Equity VIP Series | | | |
Six Months Ended
June 30, 2022
(Unaudited) | | $ | 16.38 | | | | (0.03 | ) | | | (5.97 | ) | | | (6.00 | ) | | | — | | | | — | | | $ | 10.38 | | | | (36.63 | )% | |
Year Ended December 31:
2021 | | $ | 19.91 | | | | (0.15 | ) | | | (1.99 | ) | | | (2.14 | ) | | | (1.39 | ) | | | (1.39 | ) | | $ | 16.38 | | | | (10.43 | )% | |
2020 | | $ | 16.76 | | | | (0.12 | ) | | | 6.45 | | | | 6.33 | | | | (3.18 | ) | | | (3.18 | ) | | $ | 19.91 | | | | 38.06 | % | |
2019 | | $ | 15.29 | | | | (0.10 | ) | | | 5.95 | | | | 5.85 | | | | (4.38 | ) | | | (4.38 | ) | | $ | 16.76 | | | | 38.78 | % | |
2018 | | $ | 20.48 | | | | (0.10 | ) | | | (1.62 | ) | | | (1.72 | ) | | | (3.47 | ) | | | (3.47 | ) | | $ | 15.29 | | | | (8.25 | )% | |
2017 | | $ | 14.82 | | | | (0.05 | ) | | | 5.71 | | | | 5.66 | | | | — | | | | — | | | $ | 20.48 | | | | 38.19 | % | |
(a) Per share net investment income (loss) has been calculated using the average daily shares method.
(b) Not annualized for periods less than one year.
(c) Total returns do not reflect the effects of charges deducted pursuant to the terms of The Guardian Insurance & Annuity Company, Inc.'s variable contracts. Inclusion of such charges would reduce the total returns for all periods shown.
(d) Annualized for periods less than one year.
(e) Does not include acquire fund fees and expenses, if any.
See notes to financial statements.
12
Victory Variable Insurance Funds | | Financial Highlights — continued | |
For a Share Outstanding Throughout Each Period
| | Ratios to Average Net Assets | | Supplemental Data | |
| | | Net
Expenses(d)(e) | | Net
Investment
Income
(Loss)(d) | | Gross
Expenses(d)(e) | | Net
Assets,
End of
Period
(000's) | | Portfolio
Turnover(b) | |
Victory RS Small Cap Growth Equity VIP Series | |
Six Months Ended
June 30, 2022
(Unaudited) | | | 0.88 | % | | | (0.53 | )% | | | 1.03 | % | | $ | 70,796 | | | | 73 | % | |
Year Ended December 31:
2021 | | | 0.88 | % | | | (0.75 | )% | | | 0.99 | % | | $ | 113,234 | | | | 92 | % | |
2020 | | | 0.88 | % | | | (0.69 | )% | | | 1.01 | % | | $ | 142,620 | | | | 74 | % | |
2019 | | | 0.88 | % | | | (0.54 | )% | | | 1.01 | % | | $ | 105,112 | | | | 90 | % | |
2018 | | | 0.88 | % | | | (0.44 | )% | | | 0.89 | % | | $ | 89,056 | | | | 76 | % | |
2017 | | | 0.87 | % | | | (0.30 | )% | | | 0.87 | % | | $ | 111,470 | | | | 71 | % | |
See notes to financial statements.
13
Victory Variable Insurance Funds | | Notes to Financial Statements
June 30, 2022 | |
(Unaudited)
1. Organization:
Victory Variable Insurance Funds (the "Trust") is organized as a Delaware statutory trust and the Trust is registered under the Investment Company Act of 1940, as amended (the "1940 Act"), as an open-end investment company. The Trust is comprised of six funds and is authorized to issue an unlimited number of shares, which are units of beneficial interest with a par value of $0.001 per share.
The accompanying financial statements are those of the RS Small Cap Growth Equity VIP Series (the "Fund"), a series of the Trust. The Fund offers a single class of shares: Class I. The Fund's shares are only available for purchase by certain separate accounts of insurance companies as investments for certain variable annuity plans and variable life insurance contracts issued by those insurance companies. The Fund is classified as diversified under the 1940 Act.
Under the Trust's organizational documents, its officers and trustees are indemnified against certain liabilities arising out of the performance of their duties to the Fund. In addition, in the normal course of business, the Fund enters into contracts with its vendors and others that provide for general indemnifications. The Fund's maximum exposure under these arrangements is unknown, as this would involve future claims that may be made against the Fund. However, based on experience, the Fund expects that risk of loss to be remote.
2. Significant Accounting Policies:
The following is a summary of significant accounting policies followed by the Trust in the preparation of its financial statements. The policies are in conformity with U.S. Generally Accepted Accounting Principles ("GAAP"). The preparation of financial statements in accordance with GAAP requires management to make estimates and assumptions that affect the reported amounts of assets and liabilities and disclosure of contingent assets and liabilities at the date of the financial statements and the reported amounts of income and expenses for the period. Actual results could differ from those estimates. The Fund follows the specialized accounting and reporting requirements under GAAP that are applicable to investment companies under Accounting Standards Codification Topic 946.
Investment Valuation:
The Fund records investments at fair value. Fair value is defined as the price that would be received to sell an asset or paid to transfer a liability in an orderly transaction between market participants at the measurement date.
The valuation techniques described below maximize the use of observable inputs and minimize the use of unobservable inputs in determining fair value. The inputs used for valuing the Fund's investments are summarized in the three broad levels listed below:
• Level 1 — quoted prices in active markets for identical securities
• Level 2 — other significant observable inputs (including quoted prices for similar securities or interest rates applicable to those securities, etc.)
• Level 3 — significant unobservable inputs (including the Fund's own assumptions in determining the fair value of investments)
Changes in valuation techniques may result in transfers in or out of an assigned level within the disclosure hierarchy. The inputs or methodologies used for valuation techniques are not necessarily an indication of the risk associated with entering into those investments.
Victory Capital Management Inc. ("VCM" or the "Adviser") has established the Pricing and Liquidity Committee (the "Committee"), and subject to the Trust's Board of Trustees' (the "Board") oversight, the Committee administers and oversees the Fund's valuation policies and procedures, which are approved by the Board.
Portfolio securities listed or traded on securities exchanges, including Exchange-Traded Funds ("ETFs"), and American Depositary Receipts ("ADRs"), are valued at the closing price on the exchange or system where the security is principally traded, if available, or at the Nasdaq Official Closing Price. If there have been no sales for that day on the exchange or system, then a security is valued at the last available
14
Victory Variable Insurance Funds | | Notes to Financial Statements — continued
June 30, 2022 | |
(Unaudited)
bid quotation on the exchange or system where the security is principally traded. In each of these situations, valuations are typically categorized as Level 1 in the fair value hierarchy.
Investments in open-end investment companies, other than ETFs, are valued at their net asset value ("NAV"). These valuations are typically categorized as Level 1 in the fair value hierarchy.
In the event that price quotations or valuations are not readily available, investments are valued at fair value in accordance with procedures established by and under the general supervision and responsibility of the Board. These valuations are typically categorized as Level 2 or Level 3 in the fair value hierarchy, based on the observability of inputs used to determine the fair value. The effect of fair value pricing is that securities may not be priced on the basis of quotations from the primary market in which they are traded and the actual price realized from the sale of a security may differ materially from the fair value price. Valuing these securities at fair value is intended to cause the Fund's NAV to be more reliable than it otherwise would be.
A summary of the valuations as of June 30, 2022, is included in the table below while the breakdown, by category, of investments is disclosed on the Schedule of Portfolio Investments:
| | | Level 1 | | Level 2 | | Level 3 | | Total | |
Common Stocks | | $ | 68,496,119 | | | $ | — | | | $ | — | | | $ | 68,496,119 | | |
Collateral for Securities Loaned | | | 3,304,852 | | | | — | | | | — | | | | 3,304,852 | | |
Total | | $ | 71,800,971 | | | $ | — | | | $ | — | | | $ | 71,800,971 | | |
For the six months ended June 30, 2022, there were no transfers in or out of Level 3 in the fair value hierarchy.
Real Estate Investment Trusts ("REITs):
The Fund may invest in REITs, which report information on the source of their distributions annually. REITs are pooled investment vehicles that invest primarily in income-producing real estate or real-estate related loans or interests (such as mortgages). Certain distributions received from REITs during the year are recorded as realized gains or return of capital as estimated by the Fund or when such information becomes known.
Investment Companies:
Open-End Funds:
The Fund may invest in portfolios of open-end investment companies. These investment companies value securities in their portfolios for which market quotations are readily available at their market values (generally the last reported sale price) and all other securities and assets at their fair value by the methods established by the board of directors of the underlying funds.
Investment Transactions and Related Income:
Changes in holdings of investments are accounted for no later than one business day following the trade date. For financial reporting purposes, however, investment transactions are accounted for on trade date or the last business day of the reporting period. Interest income is determined on the basis of coupon interest accrued using the effective interest method which adjusts, where applicable, the amortization of premiums or accretion of discounts. Dividend income is recorded on the ex-dividend date. Gains or losses realized on sales of securities are recorded on the identified cost basis.
Securities Lending:
The Fund, through a Securities Lending Agreement with Citibank, N.A. ("Citibank"), may lend its securities to qualified financial institutions, such as certain broker-dealers and banks, to earn additional income, net of income retained by Citibank. Borrowers are required to initially secure their loans for collateral in the amount of at least 102% of the value of U.S. securities loaned or at least 105% of the value of non-U.S. securities loaned, marked-to-market daily. Any collateral shortfalls associated with
15
Victory Variable Insurance Funds | | Notes to Financial Statements — continued
June 30, 2022 | |
(Unaudited)
increases in the valuation of the securities loaned are generally cured the next business day. The collateral can be received in the form of cash collateral and/or non-cash collateral. Non-cash collateral can include U.S. Government Securities and other securities as permitted by Securities and Exchange Commission ("SEC") guidelines. The cash collateral is invested in short-term instruments or cash equivalents, primarily open-end investment companies, as noted on the Fund's Schedule of Portfolio Investments. The Fund effectively does not have control of the non-cash collateral and therefore it is not disclosed on the Fund's Schedule of Portfolio Investments. Collateral requirements are determined daily based on the value of the Fund's securities on loan as of the end of the prior business day. During the time portfolio securities are on loan, the borrower will pay the Fund any dividends or interest paid on such securities plus any fee negotiated between the parties to the lending agreement. The Fund also earns a return from the collateral. The Fund pays Citibank various fees in connection with the investment of cash collateral and fees based on the investment income received from securities lending activities. Securities lending income (net of these fees) is disclosed on the Statement of Operations. Loans are terminable upon demand and the borrower must return the loaned securities within the lesser of one standard settlement period or five business days. Although risk is mitigated by the collateral, the Fund could experience a delay in recovering its securities and possible loss of income or value if the borrower fails to return them. In addition, there is a risk that the value of the short-term investments will be less than the amount of cash collateral required to be returned to the borrower.
The Fund's agreement with Citibank does not include master netting provisions. Non-cash collateral received by the Fund may not be sold or repledged, except to satisfy borrower default.
The following table is a summary of the Fund's securities lending transactions as of June 30, 2022.
Value of
Securities on Loan | | Non-Cash
Collateral | | Cash
Collateral | |
| $ | 3,124,906 | | | $ | — | | | $ | 3,304,852 | | |
Federal Income Taxes:
The Fund intends policy to continue to qualify as a regulated investment company by complying with the provisions available to certain investment companies, as defined in applicable sections of the Internal Revenue Code, and to make distributions of net investment income and net realized gains sufficient to relieve it from all, or substantially all, federal income taxes. Accordingly, no provision for federal income taxes is required in the financial statements. The Fund has a tax year end of December 31.
For the six months ended June 30, 2022, the Fund did not incur any income tax, interest, or penalties, and has recorded no liability for net unrecognized tax benefits relating to uncertain tax positions.
Management of the Fund has reviewed tax positions taken in tax years that remain subject to examination by all major tax jurisdictions, including federal (i.e., the last four tax years, which includes the current fiscal tax year end). Management believes that there is no tax liability resulting from unrecognized tax benefits related to uncertain tax positions taken.
Allocations:
Expenses directly attributable to the Fund are charged to the Fund, while expenses that are attributable to more than one fund in the Trust, or jointly with an affiliated trust, are allocated among the respective funds in the Trust and/or an affiliated trust based upon net assets or another appropriate basis.
3. Purchases and Sales:
Purchases and sales of securities (excluding securities maturing less than one year from acquisition) for the six months ended June 30, 2022, were as follows:
Excluding
U.S. Government Securities | |
Purchases | | Sales | |
$ | 62,716,062 | | | $ | 64,906,380 | | |
16
Victory Variable Insurance Funds | | Notes to Financial Statements — continued
June 30, 2022 | |
(Unaudited)
4. Fees and Transactions with Affiliates and Related Parties:
Investment Advisory Fees:
Investment advisory services are provided to the Fund by the Adviser, which is a New York corporation registered as an investment adviser with the SEC. The Adviser is an indirect wholly owned subsidiary of Victory Capital Holdings, Inc., a publicly traded Delaware corporation, and a wholly owned direct subsidiary of Victory Capital Operating, LLC. Under the terms of the Investment Advisory Agreement, the Adviser is entitled to receive fees accrued daily and paid monthly at an annualized rate of 0.75% of the Fund's average daily net assets. Amounts incurred and paid to VCM for the six months ended June 30, 2022, are reflected on the Statement of Operations as Investment advisory fees.
Administration and Servicing Fees:
VCM also serves as the Fund's administrator and fund accountant. Under the Administration and Fund Accounting Agreement, VCM is entitled to receive fees based on a percentage of the average daily net assets of the Trust, Victory Portfolios and Victory Portfolios II. The tiered rates at which VCM is paid by the Funds are shown in the table below:
Net Assets | |
Up to $15 billion | | $15 billion – $30 billion | | Over $30 billion | |
| | 0.08 | %, plus | | | 0.05 | %, plus | | | 0.04 | % | |
Amounts incurred for the six months ended June 30, 2022, are reflected on the Statement of Operations as Administration fees.
Citi Fund Services Ohio, Inc. ("Citi"), an affiliate of Citibank, acts as sub-administrator and sub-fund accountant to the Fund pursuant to the Sub-Administration and Sub-Fund Accounting Services Agreement between VCM and Citi. VCM pays Citi a fee for providing these services. The Trust reimburses VCM and Citi for out-of-pocket expenses incurred in providing these services and certain other expenses specifically allocated to the Fund. Amounts incurred for the six months ended June 30, 2022, are reflected on the Statement of Operations as Sub-Administration fees.
The Fund (as part of the Trust) has entered into an agreement with the Adviser to provide compliance services, pursuant to which the Adviser furnishes its compliance personnel, including the services of the Chief Compliance Officer ("CCO"), and other resources reasonably necessary to provide the Trust with compliance oversight services related to the design, administration, and oversight of a compliance program for the Trust in accordance with Rule 38a-1 under the 1940 Act. The CCO is an employee of the Adviser, which pays the compensation of the CCO and support staff. The funds in the Trust, Victory Portfolios, Victory Portfolios II and USAA Mutual Funds (collectively, the "Victory Funds Complex"), in aggregate, compensate the Adviser for these services. Amounts incurred for the six months ended June 30, 2022, are reflected on the Statement of Operations as Compliance fees.
Transfer Agency Fees:
FIS Investor Services, LLC ("FIS") serves as the Fund's transfer agent. Under the Transfer Agent Agreement, the Trust pays FIS a fee for its services and reimburses FIS for all of their reasonable out-of-pocket expenses incurred in providing these services. Amounts incurred for the six months ended June 30, 2022, are reflected on the Statement of Operations as Transfer agent fees.
Distributor/Underwriting Services:
Victory Capital Services, Inc. (the "Distributor"), an affiliate of the Adviser, serves as Distributor for the continuous offering of the shares of the Fund pursuant to a Distribution Agreement between the Distributor and the Trust, and receives no fee or other compensation for these services.
17
Victory Variable Insurance Funds | | Notes to Financial Statements — continued
June 30, 2022 | |
(Unaudited)
Other Fees:
Citibank serves as the Fund's custodian. The Fund pays Citibank a fee for providing these services. Amounts incurred for the six months ended June 30, 2022, are reflected on the Statement of Operations as Custodian fees.
Sidley Austin LLP provides legal services to the Trust.
The Adviser has entered into an expense limitation agreement with the Fund until at least April 30, 2023. Under the terms of the agreement, the Adviser has agreed to waive fees or reimburse certain expenses to the extent that ordinary operating expenses incurred in any fiscal year exceed the expense limit for the Fund. Such excess amounts will be the liability of the Adviser. Acquired fund fees and expenses, interest, taxes, brokerage commissions, other expenditures which are capitalized in accordance with GAAP, and other extraordinary expenses not incurred in the ordinary course of a Fund's business are excluded from the expense limits. As of June 30, 2022, the expense limit (excluding voluntary waivers) is 0.88%.
Under the terms of the expense limitation agreement, as amended May 1, 2022, the Fund has agreed to repay fees and expenses that were waived or reimbursed by the Adviser for a period of up to three years (thirty-six (36) months) after the waiver or reimbursement took place, subject to the lesser of any operating expense limits in effect at the time of: (a) the original waiver or expense reimbursement; or (b) the recoupment, after giving effect to the recoupment amount.
As of June 30, 2022, the following amounts are available to be repaid to the Adviser. The Fund has not recorded any amounts available to be repaid as a liability due to an assessment that such repayment is not probable at June 30, 2022.
Expires
2022 | | Expires
2023 | | Expires
2024 | | Expires
2025 | | Total | |
| $ | 73,437 | | | $ | 140,421 | | | $ | 147,496 | | | $ | 63,913 | | | $ | 425,267 | | |
The Adviser may voluntarily waive or reimburse additional fees to assist the Fund in maintaining competitive expense ratios. Voluntary waivers and reimbursements applicable to the Fund is not available to be recouped at a future time. There were no voluntary waivers or reimbursements for the six months ended June 30, 2022.
Certain officers and/or interested trustees of the Fund are also officers and/or employees of the Adviser, administrator, fund accountant, sub-administrator, sub-fund accountant, custodian, legal counsel, and Distributor.
5. Risks:
The Fund may be subject to other risks in addition to these identified risks.
Equity Risk — The value of the equity securities in which the Fund invests may decline in response to developments affecting individual companies and/or general economic conditions in the United States or abroad. A company's earnings or dividends may not increase as expected (or may decline) because of poor management, competitive pressures, reliance on particular suppliers or geographical regions, labor problems or shortages, corporate restructurings, fraudulent disclosures, man-made or natural disasters, military confrontations or wars, terrorism, public health crises, or other events, conditions and factors. Price changes may be temporary or last for extended periods.
Small-Capitalization Stock Risk — Small-capitalization companies are subject to a number of risks not associated with larger, more established companies, potentially making their stock prices more volatile and increasing the risk of loss. Smaller companies may have limited markets, product lines, or financial resources and lack management experience and may experience higher failure rates than larger companies.
Market Risk — Overall market risks may affect the value of the Fund. Domestic and international factors such as political events, war, terrorism, trade disputes, inflation rates, interest rate levels and other fiscal and monetary policy changes, cybersecurity incidents, pandemics and other public health crises, sanctions against a particular foreign country, its nationals, businesses or industries and related
18
Victory Variable Insurance Funds | | Notes to Financial Statements — continued
June 30, 2022 | |
(Unaudited)
geopolitical events, as well as environmental disasters such as earthquakes, fires, and floods or other catastrophes, may add to instability in global economies and markets generally, and may lead to increased market volatility. Global economies and financial markets are highly interconnected, which increases the possibility that conditions in one country or region might adversely affect issuers in another country or region. The impact of these and other factors may be short-term or may last for extended periods.
6. Borrowing and Interfund Lending:
Line of Credit:
The Victory Funds Complex participates in a short-term demand note "Line of Credit" agreement with Citibank. The Line of Credit agreement with Citibank was renewed on June 27, 2022, with a termination date of June 26, 2023. Under the agreement with Citibank, the Victory Funds Complex may borrow up to $600 million, of which $300 million is committed and $300 million is uncommitted. $40 million of the Line of Credit is reserved for use by the Victory Floating Rate Fund. another series of the Victory Funds Complex, with Victory Floating Rate Fund paying the related commitment fees for that amount. The purpose of the Line of Credit is to meet temporary or emergency cash needs. For the six months ended June 30, 2022, Citibank received an annual commitment fee of 0.15% on $300 million for providing the Line of Credit. Each fund in the Victory Funds Complex paid a pro-rata portion of the commitment fees plus any interest on amounts borrowed. For the period from January 1, 2022, through June 27, 2022, interest was based on the one-month London Interbank Offered Rate ("LIBOR") plus one percent. Effective with the renewal, for the period June 28, 2022, through June 30, 2022, interest was based on the one-month Secured Overnight Financing Rate (SOFR) plus 1.10 percent. Interest charged to the Fund during the period, if applicable, is reflected on the Statement of Operations under Line of credit fees.
The Fund had no borrowings under the Line of Credit agreement during the six months ended June 30, 2022.
Interfund Lending:
The Trust and the Adviser rely on an exemptive order granted by the SEC in March 2017 (the "Order"), permitting the establishment and operation of an Interfund Lending Facility (the "Facility"). The Facility allows the Fund to directly lend and borrow money to or from any other fund in the Victory Funds Complex that is permitted to participate in the Facility, relying upon the Order at rates beneficial to both the borrowing and lending funds. Advances under the Facility are allowed for temporary or emergency purposes, including the meeting of redemption requests that otherwise might require the untimely disposition of securities, and are subject to each fund's borrowing restrictions. The interfund loan rate is determined, as specified in the Order, by averaging the current repurchase agreement rate and the current bank loan rate. As a Borrower, interest charged to the Fund, if any, during the period, is reflected on the Statement of Operations under Interfund lending fees. As a Lender, interest earned by the Fund, if any, during the period, is reflected on the Statement of Operations under Interfund lending.
The Fund did not utilize or participate in the Facility during the six months ended June 30, 2022.
7. Federal Income Tax Information:
The Fund intends to distribute any net investment income annually. Distributable net realized gains, if any, are declared and paid at least annually.
The amounts of dividends from net investment income and distributions from net realized gains (collectively, distributions to shareholders) are determined in accordance with federal income tax regulations, which may differ from GAAP. To the extent these "book/tax" differences are permanent in nature (e.g., net operating loss and distribution reclassification), such amounts are reclassified within the components of net assets based on their federal tax-basis treatment; temporary differences (e.g., wash sales) do not require reclassification. To the extent dividends and distributions exceed net
19
Victory Variable Insurance Funds | | Notes to Financial Statements — continued
June 30, 2022 | |
(Unaudited)
investment income and net realized gains for tax purposes, they are reported as distributions of capital. Net investment losses incurred by the Fund may be reclassified as an offset to capital on the accompanying Statement of Assets and Liabilities.
The tax character of current year distributions paid and the tax basis of the current components of accumulated earnings (loss) will be determined at the end of the current tax year ending December 31, 2022.
At the tax year ended December 31, 2021, the Fund had no capital loss carryforward for federal income tax purposes.
20
Victory Variable Insurance Funds | | Supplemental Information
June 30, 2022 | |
(Unaudited)
Proxy Voting and Portfolio Holdings Information
Proxy Voting:
Information regarding the policies and procedures the Fund uses to determine how to vote proxies relating to portfolio securities is available without charge, upon request, by calling 800-539-3863. The information is also included in the Fund's Statement of Additional Information, which is available on the SEC's website at www.sec.gov.
Information relating to how the Fund voted proxies relating to portfolio securities held during the most recent 12 months ended June 30 is available on the SEC's website at www.sec.gov.
Availability of Schedules of Portfolio Investments:
The Trust files a complete list of Schedules of Portfolio Investments with the SEC for the first and third quarter of each fiscal year on Form N-PORT. Forms N-PORT are available on the SEC's website at www.sec.gov.
Expense Example
As a shareholder of the Fund, you may incur two types of costs: (1) transaction costs and (2) ongoing costs, including management fees and other Fund expenses. These examples are intended to help you understand your ongoing costs (in dollars) of investing in the Fund and to compare these costs with the ongoing costs of investing in other mutual funds.
These examples are based on an investment of $1,000 invested at the beginning of the period and held for the entire period from January 1, 2022, through June 30, 2022.
The Actual Expense figures in the table below provide information about actual account values and actual expenses. You may use the information below, together with the amount you invested, to estimate the expenses that you paid over the period. Simply divide your account value by $1,000 (for example, an $8,600 account value divided by $1,000 = 8.6), then multiply the result by the number in the table under the heading entitled "Actual Expenses Paid During Period" to estimate the expenses you paid on your account during this period.
The Hypothetical Expense figures in the table below provide information about hypothetical account values and hypothetical expenses based on the Fund's actual expense ratio and an assumed rate of return of 5% per year before expenses, which is not the Fund's actual return. The hypothetical account values and expenses may not be used to estimate the actual ending account balance or expenses you paid for the period. You may use this information to compare this 5% hypothetical example with the 5% hypothetical examples that appear in shareholder reports of other funds.
Please note the expenses shown in the table below are meant to highlight your ongoing costs only and do not reflect any transactional costs. Therefore, the hypothetical expenses in the table are useful in comparing ongoing costs only and will not help you determine the relative total costs of owning different funds. In addition, if these transactional costs were included, your costs would have been higher.
Beginning
Account Value
1/1/22 | | Actual
Ending
Account Value
6/30/22 | | Hypothetical
Ending
Account Value
6/30/22 | | Actual
Expenses Paid
During Period
1/1/22-6/30/22* | | Hypothetical
Expenses Paid
During Period
1/1/22-6/30/22* | | Annualized
Expense Ratio
During Period
1/1/22-6/30/22 | |
| $ | 1,000.00 | | | $ | 633.70 | | | $ | 1,020.43 | | | $ | 3.56 | | | $ | 4.41 | | | | 0.88 | % | |
* Expenses are equal to the average account value multiplied by the Fund's annualized expense ratio multiplied by 181/365 (the number of days in the most recent fiscal half-year divided by the number of days in the fiscal year).
21
Victory Variable Insurance Funds | | Supplemental Information — continued
June 30, 2022 | |
(Unaudited)
Liquidity Risk Management Program:
The Victory Funds have adopted and implemented a written liquidity risk management program (the "LRMP") as required by Rule 22e-4 under the Investment Company Act of 1940, as amended. The LRMP is reasonably designed to assess and manage the Fund's liquidity risk, taking into consideration the Fund's investment strategy and the liquidity of its portfolio investments during normal and reasonably foreseeable stressed market conditions; its short- and long-term cash flow projections; and its cash holdings and access to other liquidity management tools such as available funding sources including the Victory Funds Complex Interfund Lending Facility and Line of Credit (discussed in the Notes to Financial Statements). The Victory Funds' Board of Trustees approved the appointment of the Fund's investment adviser, Victory Capital Management Inc. ("Victory Capital"), as the administrator of the LRMP.
Victory Capital manages liquidity risks associated with the Fund's investments by monitoring, among other things, cash and cash equivalents, any use of derivatives, the concentration of investments, the appropriateness of the Fund's investment strategy, and by classifying every Fund investment as either highly liquid, moderately liquid, less liquid, or illiquid on at least a monthly basis. To assist with the classification of Fund investments, Victory Capital has retained a third-party provider of liquidity evaluation services. This provider determines preliminary liquidity classifications for all portfolio holdings based upon portfolio-level data and certain assumptions provided by Victory Capital. Victory Capital reviews the preliminary liquidity classifications and, when appropriate, considers other information including input from the Fund's portfolio managers (including the portfolio managers employed by any investment sub-advisers) in determining final liquidity classifications.
At a meeting held on February 24, 2022, Victory Capital provided an oral and written report to the Trustees on the operation and effectiveness of the LRMP during the previous year. The report from Victory Capital concluded that the Fund did not experience any significant liquidity challenges during the covered period, and the Fund's LRMP is reasonably designed to assess and manage its liquidity risk. The report also concluded that the LRMP continues to operate adequately and effectively to enable Victory Capital to oversee and manage liquidity risk and ensure the Fund is able to meet redemption requests without significant dilution to the remaining investors' interest in the Fund. During the review period, the Fund's portfolio consisted primarily of highly liquid investments, which are defined as cash and any investments that the Fund reasonably expects to be converted to cash in current market conditions in three business days or less without significantly changing the market value of the investment. Therefore, the Fund has not adopted a highly liquid investment minimum. The Fund's investments were below the limitation on illiquid investments during the review period. Additionally, Victory Capital indicated that no events occurred that would require the filing of Form N-LIQUID and recommended no material changes to the LRMP.
22
Privacy Policy
Protecting the Privacy of Information
The Trust respects your right to privacy. We also know that you expect us to conduct and process your business in an accurate and efficient manner. To do so, we must collect and maintain certain personal information about you. This is the information we collect from you on applications or other forms, and from the transactions you make with us or third parties. It may include your name, address, social security number, account transactions and balances, and information about investment goals and risk tolerance.
We do not disclose any information about you or about former customers to anyone except as permitted or required by law. Specifically, we may disclose the information we collect to companies that perform services on our behalf, such as the transfer agent that processes shareholder accounts and printers and mailers that assist us in the distribution of investor materials. We may also disclose this information to companies that perform marketing services on our behalf. This allows us to continue to offer you Victory investment products and services that meet your investing needs, and to effect transactions that you request or authorize. These companies will use this information only in connection with the services for which we hired them. They are not permitted to use or share this information for any other purpose.
To protect your personal information internally, we permit access only by authorized employees and maintain physical, electronic, and procedural safeguards to guard your personal information.*
* You may have received communications regarding information about privacy policies from other financial institutions which gave you the opportunity to "opt-out" of certain information sharing with companies which are not affiliated with that financial institution. The Trust does not share information with other companies for purposes of marketing solicitations for products other than the Trust. Therefore, the Trust does not provide opt-out options to their shareholders.
Victory Funds
P.O. Box 182593
Columbus, Ohio 43218-2593

Visit our website at: | | Call Victory at: | |
www.vcm.com | | 800-539-FUND (800-539-3863) | |
VVIF-RS-SCGEVIP-SAR (6/22)
Item 2. Code of Ethics.
Not applicable — only for annual reports.
Item 3. Audit Committee Financial Experts.
Not applicable — only for annual reports.
Item 4. Principal Accountant Fees and Services.
Not applicable — only for annual reports.
Item 5. Audit Committee of Listed Registrants.
Not applicable.
Item 6. Investments.
(a) Not applicable.
(b) Not applicable.
Item 7. Disclosure of Proxy Voting Policies and Procedures for Closed-End Management Investment Companies.
Not applicable.
Item 8. Portfolio Managers of Closed-End Management Investment Companies.
Not applicable.
Item 9. Purchases of Equity Securities by Closed-End Management Investment Company and Affiliated Purchasers.
Not applicable.
Item 10. Submission of Matters to a Vote of Security Holders.
Not applicable.
Item 11. Controls and Procedures.
| (a) | The registrant’s principal executive officer and principal financial officer have concluded, based on their evaluation of the registrant's disclosure controls and procedures as conducted within 90 days of the filing date of this report, that these disclosure controls and procedures are adequately designed and are operating effectively to ensure that information required to be disclosed by the registrant on Form N-CSR is recorded, processed, summarized and reported within the time periods specified in the Securities and Exchange Commission's rules and forms. |
| (b) | There were no changes in the registrant’s internal control over financial reporting (as defined in Rule 30a-3(d) under the Investment Company Act of 1940 (17 CFR 270.30a-3(d)) that occurred during the period covered by this report that have materially affected or are reasonably likely to materially affect, the registrant’s internal control over financial reporting. |
Item 12. Disclosure of Securities Lending Activities for Closed-End Management Investment Companies.
(a)(1) Not applicable.
(a)(2) Not applicable.
(a)(3) Not applicable.
(a)(4) Not applicable.
(b) Not applicable.
Item 13. Exhibits.
(a)(1) Not applicable.
(a)(2) Certifications pursuant to Rule 30a-2(a) are attached hereto.
(a)(3) Not applicable.
(b) Certifications pursuant to Rule 30a-2(b) are furnished herewith.
SIGNATURES
Pursuant to the requirements of the Securities Exchange Act of 1934 and the Investment Company Act of 1940, the registrant has duly caused this report to be signed on its behalf by the undersigned, thereunto duly authorized.
| (Registrant) | Victory Variable Insurance Funds | |
| By (Signature and Title)* | /s/ Allan Shaer | |
| | Allan Shaer, Principal Financial Officer | |
Pursuant to the requirements of the Securities Exchange Act of 1934 and the Investment Company Act of 1940, this report has been signed below by the following persons on behalf of the registrant and in the capacities and on the dates indicated.
| By (Signature and Title)* | /s/ Christopher K. Dyer | |
| | Christopher K. Dyer, Principal Executive Officer | |
| | | |
| By (Signature and Title)* | /s/ Allan Shaer | |
| | Allan Shaer, Principal Financial Officer | |