
Exhibit 99.1
“Safe Harbor” Statement under the Private Securities Litigation Reform Act of 1999
The statements contained in this presentation which are not historical facts contain forward-looking information with respect to plans, projections, or future performance of Prosperity Bancshares, Inc. and its subsidiaries. Forward-looking statements, within the meaning of Section 21E of the Securities Exchange Act of 1934, may have been made in this document. Prosperity’s results may differ materially from those in the forward-looking statements for a variety of reasons, including actions of competitors; changes in laws and regulations; customer and consumer response to marketing; effectiveness of spending, investment or programs; and economic conditions. These factors, and others, are more fully described in Prosperity Bancshares, Inc.’s filings with the Securities and Exchange Commission.
Copies of Prosperity Bancshares, Inc.’s SEC filings are available over the Internet at no charge from www.freeedgar.com.
2
Prosperity is . . . ..
a Track Record of Success
A $3.5 billion Texas based Financial Holding Company Customer focused Results oriented Shareholder driven Accretive acquisition Excellent asset quality Fast growing Serving Houston, Dallas, Austin, Corpus Christi and many communities southwest of Houston.
3
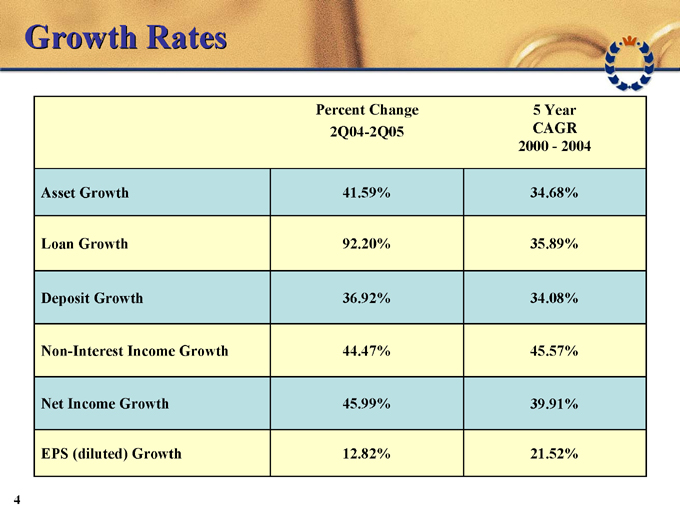
Growth Rates
Percent Change 5 Year
2Q04-2Q05 CAGR
2000—2004
Asset Growth 41.59% 34.68%
Loan Growth 92.20% 35.89%
Deposit Growth 36.92% 34.08%
Non-Interest Income Growth 44.47% 45.57%
Net Income Growth 45.99% 39.91%
EPS (diluted) Growth 12.82% 21.52%
4
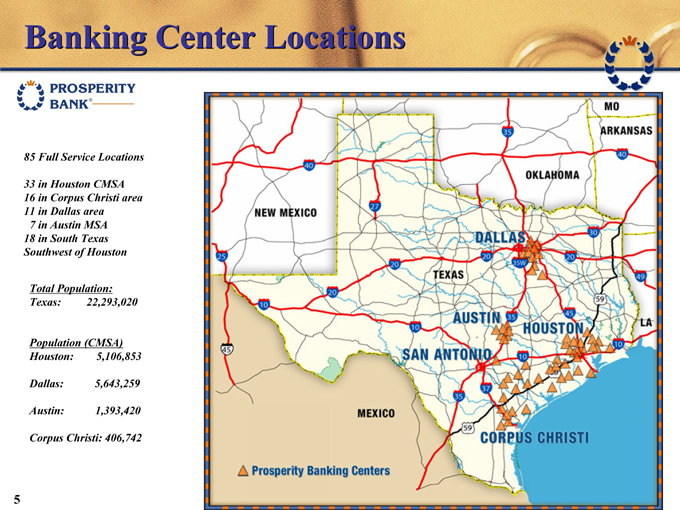
Banking Center Locations
85 Full Service Locations
33 in Houston CMSA 16 in Corpus Christi area 11 in Dallas area 7 in Austin MSA 18 in South Texas Southwest of Houston
Total Population:
Texas:
22,293,020
Population (CMSA)
Houston:
5,106,853
Dallas:
5,643,259
Austin:
1,393,420
Corpus Christi: 406,742
5
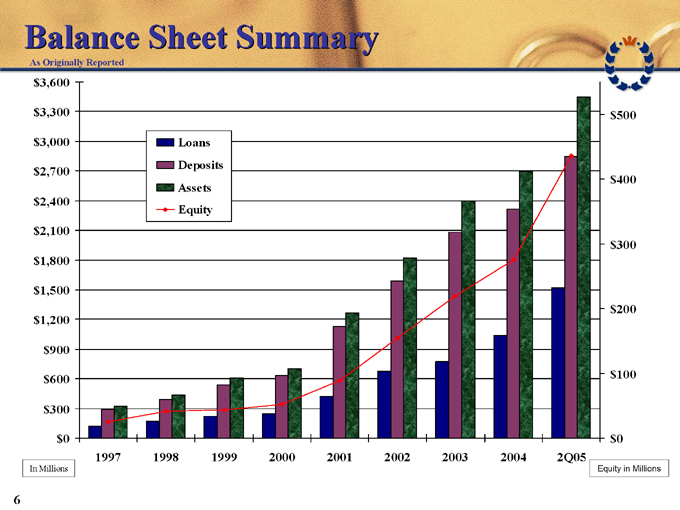
Balance Sheet Summary
As Originally Reported $3,600 $3,300 $3,000 $2,700 $2,400 $2,100 $1,800 $1,500 $1,200 $900 $600 $300 $0
Loans Deposits Assets Equity
In Millions
1997 1998 1999 2000 2001 2002 2003 2004 2Q05
Equity in Millions $500 $400 $300 $200 $100 $0
6
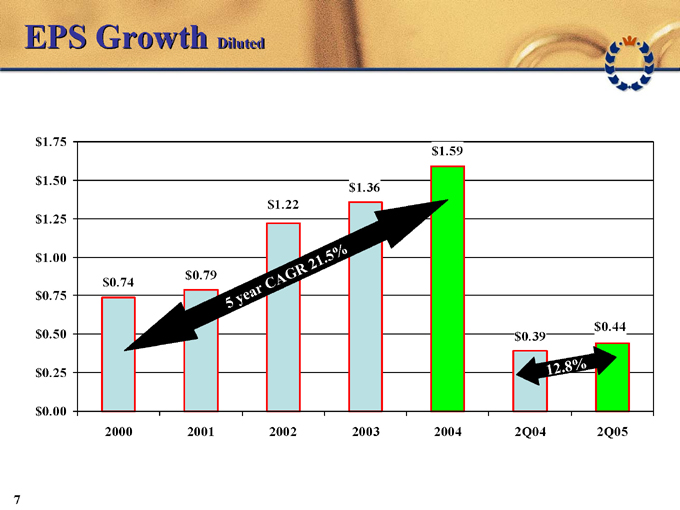
EPS Growth Diluted $1.75 $1.50 $1.25 $1.00 $0.75 $0.50 $0.25 $0.00 $0.74 $0.79 $1.22 $1.36 $1.59
2000 2001 2002 2003 2004 2Q04 2Q05 $0.39 $0.44
12.8% 5 year CAGR 21.5%

Net Interest Income and Margin (fte) $35,000 $30,000 $25,000 $20,000 $15,000 $10,000 $5,000 $0
Net Intere st Income Net Interest Margin
3.65%
3.57%
3.62%
3.68%
3.81%
3.82%
1Q04 2Q04 3Q04 4Q04 1Q05 2Q05
3.85% 3.80% 3.75% 3.70% 3.65% 3.60% 3.55% 3.50% 3.45% 3.40%
In Thousands
8
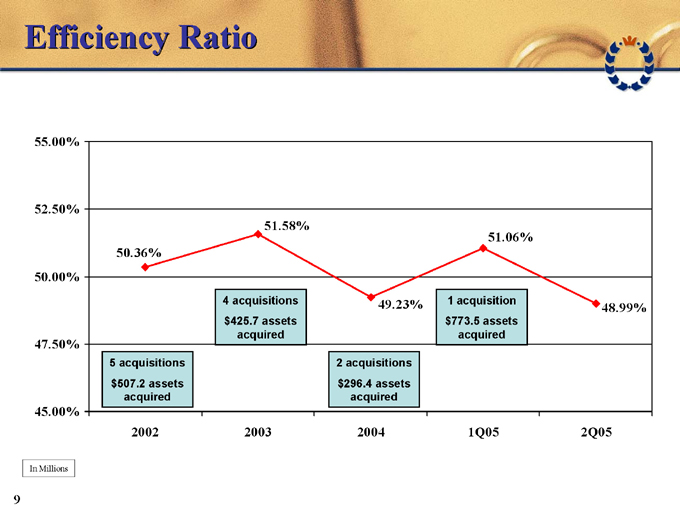
Efficiency Ratio
55.00% 52.50% 50.00% 47.50% 45.00%
50.36%
51.58%
51.06%
49.23%
48.99%
4 acquisitions $425.7 assets acquired
5 acquisitions $507.2 assets acquired
2 acquisitions $296.4 assets acquired
1 acquisition $773.5 assets acquired
2002 2003 2004 1Q05 2Q05
In Millions
9
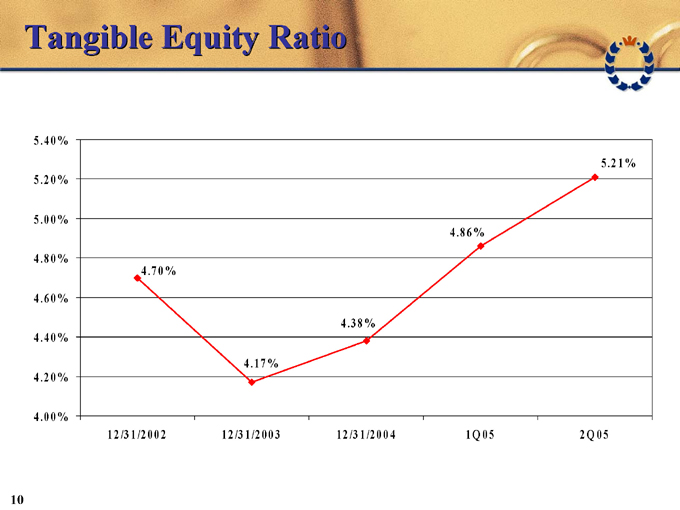
Tangible Equity Ratio
5.40% 5.20% 5.00% 4.80% 4.60% 4.40% 4.20% 4.00%
4.70%
4.17%
4.38%
4.86%
5.21%
12 /31/2002 12/31/2003 12/31/2004 1Q05 2Q05
10
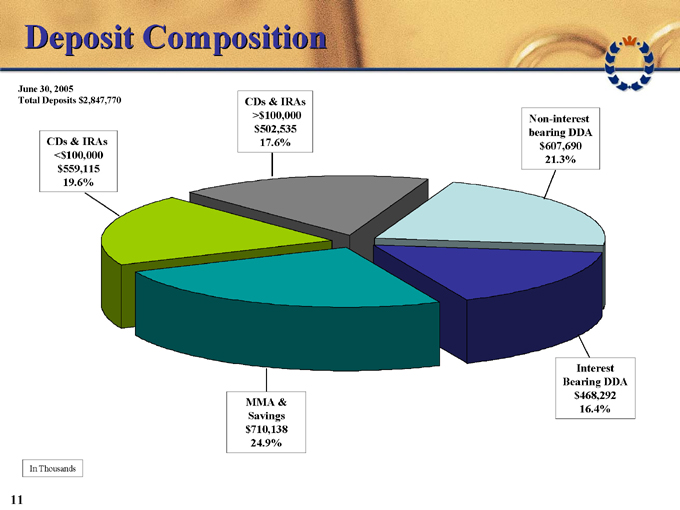
Deposit Composition
June 30, 2005
Total Deposits $2,847,770
CDs & IRAs
<$100,000 $559,115 19.6%
CDs & IRAs
>$100,000 $502,535 17.6%
Non-interest bearing DDA $607,690 21.3%
MMA & Savings $710,138 24.9%
Interest Bearing DDA $468,292 16.4%
In Thousands
11
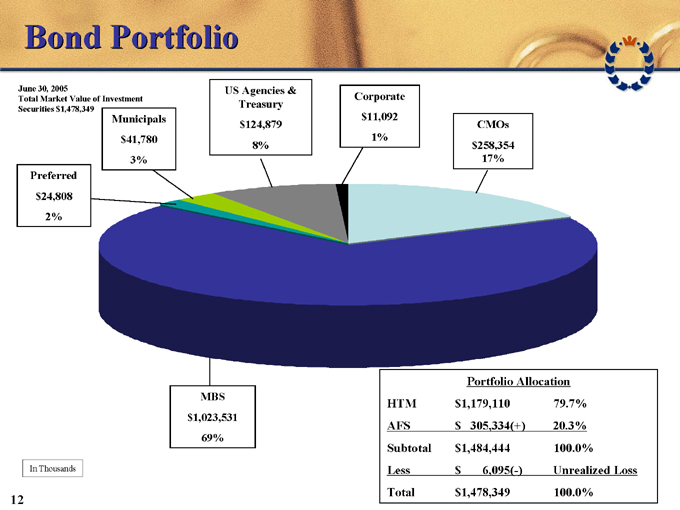
Bond Portfolio
June 30, 2005
Total Market Value of Investment Securities $1,478,349
Municipals $41,780 3%
Preferred $24,808 2%
US Agencies & Treasury $124,879 8%
Corporate $11,092 1%
CMOs $258,354 17%
MBS $1,023,531 69%
In Thousands
Portfolio Allocation
HTM $ 1,179,110 79.7%
AFS $ 305,334(+) 20.3%
Subtotal $ 1,484,444 100.0%
Less $ 6,095(-) Unrealized Loss
Total $ 1,478,349 100.0%
12
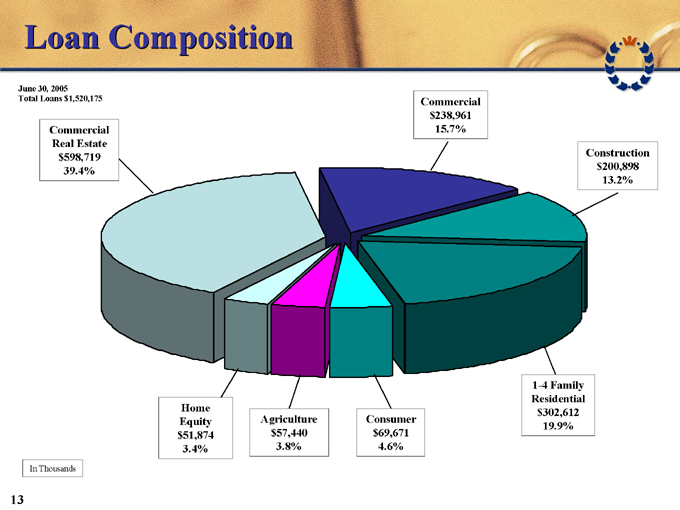
Loan Composition
June 30, 2005
Total Loans $1,520,175
Commercial Real Estate $598,719 39.4%
Commercial $238,961 15.7%
Construction $200,898 13.2%
Home Equity $51,874 3.4%
Agriculture $57,440 3.8%
Consumer $69,671 4.6%
1-4 Family Residential $302,612 19.9%
In Thousands
13
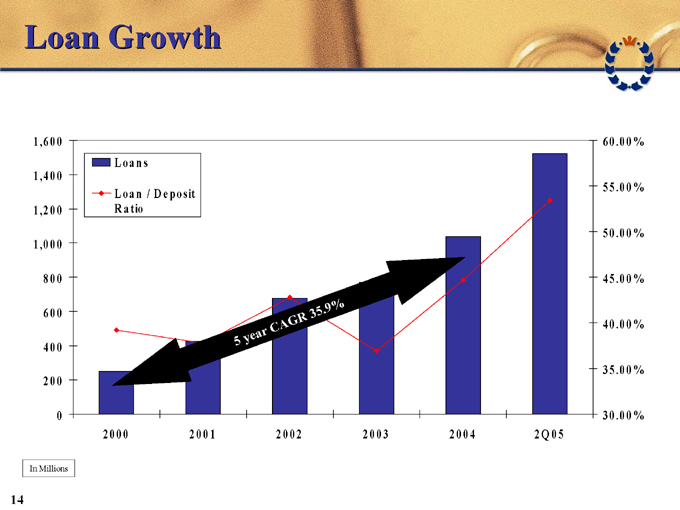
Loan Growth
Loans
Loan/Deposit Ratio
1,6001,400 1,200 1,000 800 600 400 2000
2000 2001 2002 2003 2004 2005
60.00% 55.0
0% 50.00% 45.00% 40.00% 35.00% 30.00 %
In Millions
5year
CAGR 35.9%
14
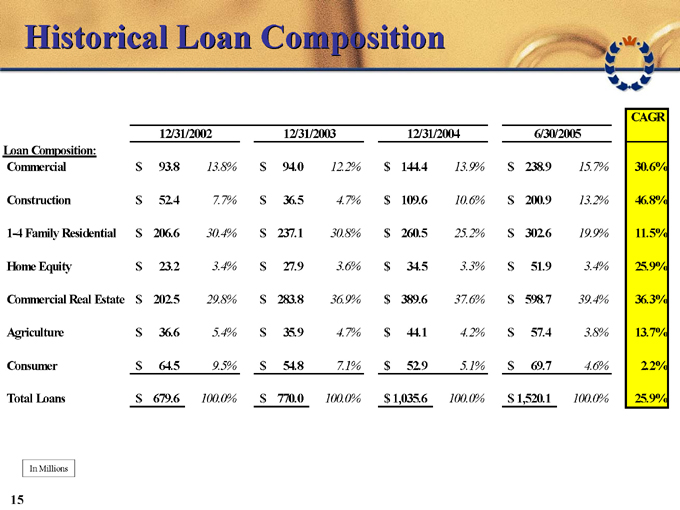
Historical Loan Composition
CAGR
12/31/2002 12/31/2003 12/31/2004 6/30/2005
Loan Composition:
Commercial $93.8 13.8% $94.0 12.2% $144.4 13.9% $238.9 15.7% 30.6%
Construction $52.4 7.7% $36.5 4.7% $109.6 10.6% $200.9 13.2% 46.8%
1-4 Family Residential $206.6 30.4% $237.1 30.8% $260.5 25.2% $302.6 19.9% 11.5%
Home Equity $23.2 3.4% $27.9 3.6% $34.5 3.3% $51.9 3.4% 25.9%
Commercial Real Estate $202.5 29.8% $283.8 36.9% $389.6 37.6% $598.7 39.4% 36.3%
Agriculture $36.6 5.4% $35.9 4.7% $44.1 4.2% $57.4 3.8% 13.7%
Consumer $64.5 9.5% $54.8 7.1% $52.9 5.1% $69.7 4.6% 2.2%
Total Loans $679.6 100.0% $770.0 100.0% $1,035.6 100.0% $1,520.1 100.0% 25.9%
In Millions
15
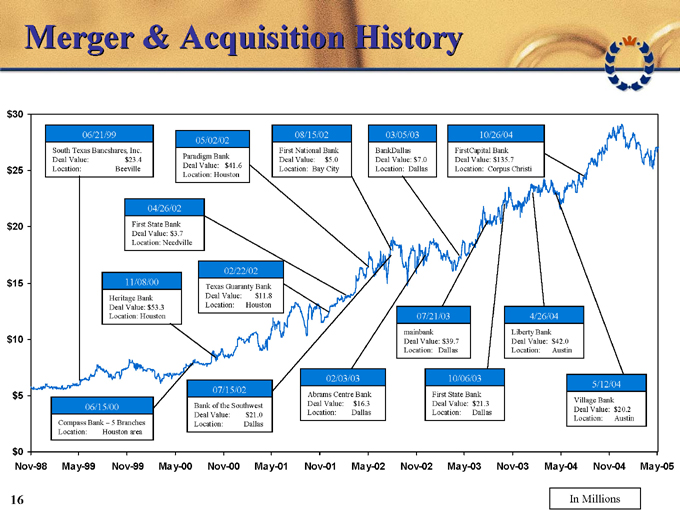
Merger & Acquisition History $30 $25 $20 $15 $10 $5 $0
Nov-98 May-99 Nov-99 May-00 Nov-00 May-01 Nov-01 May-02 Nov-02 May-03 Nov-03 May-04 Nov-04 May-05
In Millions
06/21/99
South Texas Bancshares, Inc. Deal Value: $23.4 Location: Beeville
05/02/02
Paradigm Bank Deal Value: $41.6 Location: Houston
08/15/02
First National Bank Deal Value: $5.0 Location: Bay City
03/05/03
BankDallas Deal Value: $7.0 Location: Dallas
10/26/04
FirstCapital Bank Deal Value: $135.7 Location: Corpus Christi
04/26/02
First State Bank Deal Value: $3.7 Location: Needville
11/08/00
Heritage Bank Deal Value: $53.3 Location: Houston
02/22/02
Texas Guaranty Bank Deal Value: $11.8 Location: Houston
06/15/00
Compass Bank – 5 Branches Location: Houston area
07/15/02
Bank of the Southwest Deal Value: $21.0 Location: Dallas
02/03/03
Abrams Centre Bank Deal Value: $16.3 Location: Dallas
07/21/03
mainbank Deal Value: $39.7 Location: Dallas
10/06/03
First State Bank Deal Value: $21.3 Location: Dallas
4/26/04
Liberty Bank Deal Value: $42.0 Location: Austin
5/12/04
Village Bank Deal Value: $20.2 Location: Austin
16
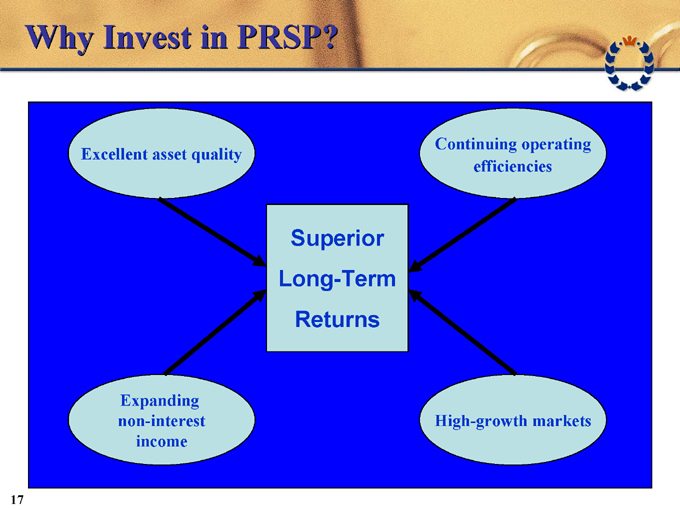
Why Invest in PRSP?
Excellent asset quality
Continuing operating efficiencies
High-growth markets
Expanding non-interest income
Superior Long-Term Returns 17
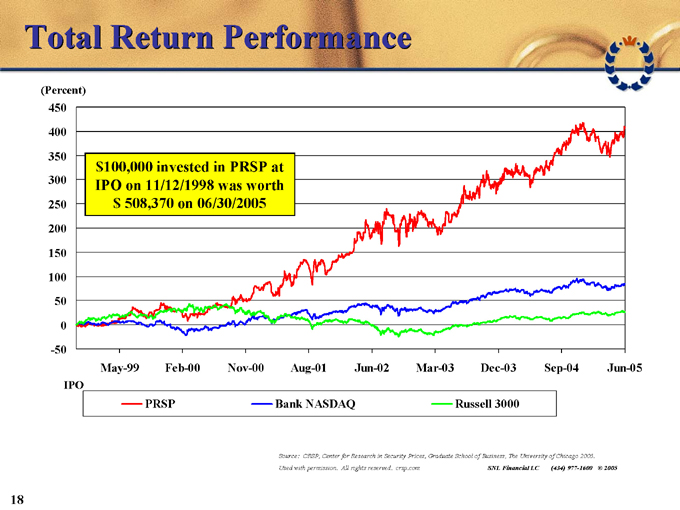
Total Return Performance
(Percent)
450
400
350 300
250 200 150
100 50
0
-50
May-99 Feb-00 Nov-00 Aug-01 Jun-02 Mar-03 Dec-03 Sep-04 Jun-05
IPO
PRSP Bank NASDAQ Russell 3000
$100,000 invested in PRSP at IPO on 11/12/1998 was worth $ 508,370 on 06/30/2005
Source: CRSP, Center for Research in Security Prices, Graduate School of Business, The University of Chicago 2005. Used with permission. All rights reserved. crsp.com SNL Financial LC (434) 977-1600 © 2005
18

Contact Information
Corporate Headquarters Investor Contacts
Prosperity Bank Plaza David Zalman
4295 San Felipe Chief Executive Officer Houston, Texas 77027 979.543.2200 david.zalman@prosperitybanktx.com
713.693.9300 Telephone David Hollaway 713.693.9309 Fax Chief Financial Officer www.prosperitybanktx.com 979.543.2200 david.hollaway@prosperitybanktx.com
Dan Rollins
Senior Vice President 713.693.9300 dan.rollins@prosperitybanktx.com
19

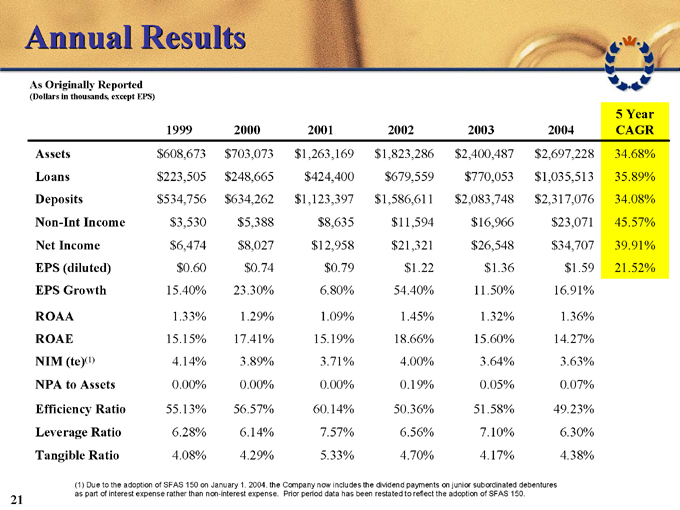
Annual Results
As Originally Reported
(Dollars in thousands, except EPS)
5 Year
1999 2000 2001 2002 2003 2004 CAGR
Assets $608,673 $703,073 $1,263,169 $1,823,286 $2,400,487 $2,697,228 34.68%
Loans $223,505 $248,665 $424,400 $679,559 $770,053 $1,035,513 35.89%
Deposits $534,756 $634,262 $1,123,397 $1,586,611 $2,083,748 $2,317,076 34.08%
Non-Int Income $3,530 $5,388 $8,635 $11,594 $16,966 $23,071 45.57%
Net Income $6,474 $8,027 $12,958 $21,321 $26,548 $34,707 39.91%
EPS (diluted) $0.60 $0.74 $0.79 $1.22 $1.36 $1.59 21.52%
EPS Growth 15.40% 23.30% 6.80% 54.40% 11.50% 16.91%
ROAA 1.33% 1.29% 1.09% 1.45% 1.32% 1.36%
ROAE 15.15% 17.41% 15.19% 18.66% 15.60% 14.27%
NIM (te)(1) 4.14% 3.89% 3.71% 4.00% 3.64% 3.63%
NPA to Assets 0.00% 0.00% 0.00% 0.19% 0.05% 0.07%
Efficiency Ratio 55.13% 56.57% 60.14% 50.36% 51.58% 49.23%
Leverage Ratio 6.28% 6.14% 7.57% 6.56% 7.10% 6.30%
Tangible Ratio 4.08% 4.29% 5.33% 4.70% 4.17% 4.38%
(1) Due to the adoption of SFAS 150 on January 1, 2004, the Company now includes the dividend payments on junior subordinated debentures as part of interest expense rather than non-interest expense. Prior period data has been restated to reflect the adoption of SFAS 150.
21
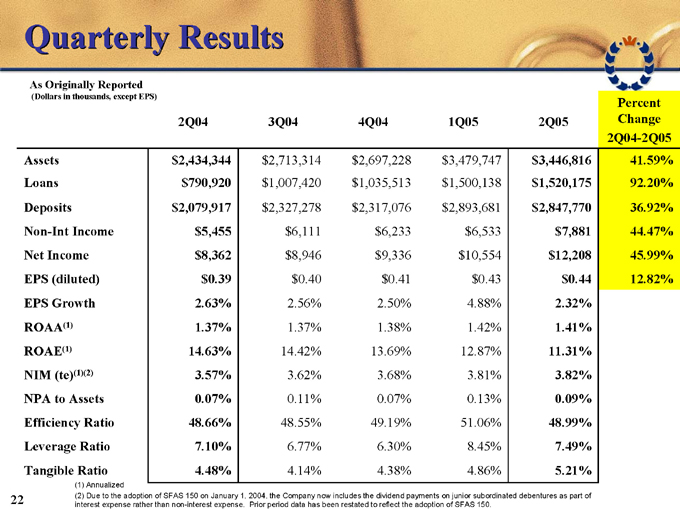
Quarterly Results
As Originally Reported
(Dollars in thousands, except EPS)
Percent
2Q04 3Q04 4Q04 1Q05 2Q05 Change
2Q04-2Q05
Assets $2,434,344 $2,713,314 $2,697,228 $3,479,747 $3,446,816 41.59%
Loans $790,920 $1,007,420 $1,035,513 $1,500,138 $1,520,175 92.20%
Deposits $2,079,917 $2,327,278 $2,317,076 $2,893,681 $2,847,770 36.92%
Non-Int Income $5,455 $6,111 $6,233 $6,533 $7,881 44.47%
Net Income $8,362 $8,946 $9,336 $10,554 $12,208 45.99%
EPS (diluted) $0.39 $0.40 $0.41 $0.43 $0.44 12.82%
EPS Growth 2.63% 2.56% 2.50% 4.88% 2.32%
ROAA(1) 1.37% 1.37% 1.38% 1.42% 1.41%
ROAE(1) 14.63% 14.42% 13.69% 12.87% 11.31%
NIM (te)(1)(2) 3.57% 3.62% 3.68% 3.81% 3.82%
NPA to Assets 0.07% 0.11% 0.07% 0.13% 0.09%
Efficiency Ratio 48.66% 48.55% 49.19% 51.06% 48.99%
Leverage Ratio 7.10% 6.77% 6.30% 8.45% 7.49%
Tangible Ratio 4.48% 4.14% 4.38% 4.86% 5.21%
(1) Annualized
(2) Due to the adoption of SFAS 150 on January 1, 2004, the Company now includes the dividend payments on junior subordinated debentures as part of interest expense rather than non-interest expense. Prior period data has been restated to reflect the adoption of SFAS 150.
22
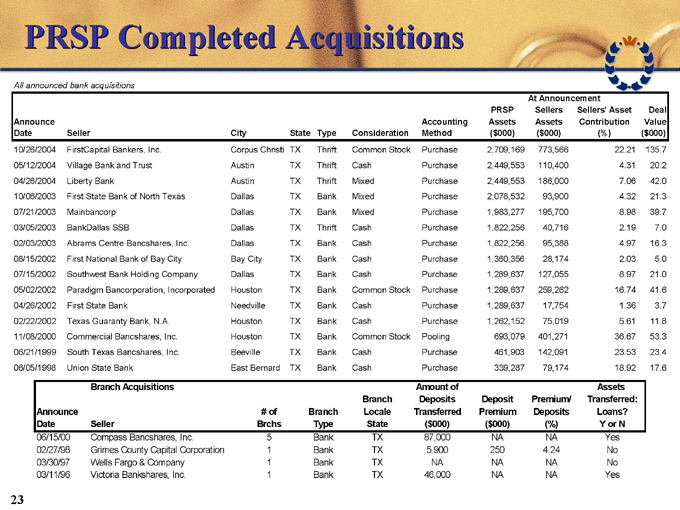
PRSP Completed Acquisitions
All announced bank acquisitions
At Announcement
PRSP Sellers Sellers’ Asset Deal
Announce Accounting Assets Assets Contribution Value
Date Seller City State Type Consideration Method ($000) ($000) (%) ($ 000)
10/26/2004 FirstCapital Bankers, Inc. Corpus Christi TX Thrift Common Stock Purchase 2,709,169 773,566 22.21 135.7
05/12/2004 Village Bank and Trust Austin TX Thrift Cash Purchase 2,449,553 110,400 4.31 20.2
04/26/2004 Liberty Bank Austin TX Thrift Mixed Purchase 2,449,553 186,000 7.06 42.0
10/06/2003 First State Bank of North Texas Dallas TX Bank Mixed Purchase 2,078,532 93,900 4.32 21.3
07/21/2003 Mainbancorp Dallas TX Bank Mixed Purchase 1,983,277 195,700 8.98 39.7
03/05/2003 BankDallas SSB Dallas TX Thrift Cash Purchase 1,822,256 40,716 2.19 7.0
02/03/2003 Abrams Centre Bancshares, Inc. Dallas TX Bank Cash Purchase 1,822,256 95,388 4.97 16.3
08/15/2002 First National Bank of Bay City Bay City TX Bank Cash Purchase 1,360,356 28,174 2.03 5.0
07/15/2002 Southwest Bank Holding Company Dallas TX Bank Cash Purchase 1,289,637 127,055 8.97 21.0
05/02/2002 Paradigm Bancorporation, Incorporated Houston TX Bank Common Stock Purchase 1,289,637 259,262 16.74 41.6
04/26/2002 First State Bank Needville TX Bank Cash Purchase 1,289,637 17,754 1.36 3.7
02/22/2002 Texas Guaranty Bank, N.A. Houston TX Bank Cash Purchase 1,262,152 75,019 5.61 11.8
11/08/2000 Commercial Bancshares, Inc. Houston TX Bank Common Stock Pooling 693,079 401,271 36.67 53.3
06/21/1999 South Texas Bancshares, Inc. Beeville TX Bank Cash Purchase 461,903 142,091 23.53 23.4
06/05/1998 Union State Bank East Bernard TX Bank Cash Purchase 339,287 79,174 18.92 17.6
Branch Acquisitions Amount of Assets
Branch Deposits Deposit Premium/ Transferred:
Announce # of Branch Locale Transferred Premium Deposits Loans?
Date Seller Brchs Type State ($000) ($000) (%) Y or N
06/15/00 Compass Bancshares, Inc. 5 Bank TX 87,000 NA NA Yes
02/27/98 Grimes County Capital Corporation 1 Bank TX 5,900 250 4.24 No
03/30/97 Wells Fargo & Company 1 Bank TX NA NA NA No
03/11/96 Victoria Bankshares, Inc. 1 Bank TX 46,000 NA NA Yes
23
