Exhibit 99.1

Exhibit 99.1
Acquisition of
July 20, 2006
“Safe Harbor” Statement
under the Private Securities Litigation Reform Act of 1995
The statements contained in this presentation which are not historical facts contain forward-looking information with respect to plans, projections, or future performance of Prosperity Bancshares, Inc. and its subsidiaries. Forward-looking statements, within the meaning of Section 21E of the Securities Exchange Act of 1934, may have been made in this document. Prosperity’s results may differ materially from those in the forward-looking statements for a variety of reasons, including actions of competitors; changes in laws and regulations; customer and consumer response to marketing; effectiveness of spending, investment or programs; and economic conditions. These factors, and others, are more fully described in Prosperity Bancshares, Inc.’s filings with the Securities and Exchange Commission.
Copies of Prosperity Bancshares, Inc.’s SEC filings are available over the Internet at no charge from www.sec.gov.
In connection with the proposed merger of Texas United Bancshares, Inc. (“Texas United”) into Prosperity Bancshares, Inc., Prosperity will file with the Securities and Exchange Commission (“SEC”) a Registration Statement on Form S-4 to register the shares of Prosperity’s common stock to be issued to the shareholders of Texas United. The registration statement will include a joint proxy statement/prospectus which will be sent to the shareholders of Prosperity and Texas United seeking their approval of the proposed transaction.
WE URGE INVESTORS AND SECURITY HOLDERS TO READ THE REGISTRATION STATEMENT ON FORM S-4 AND THE JOINT PROXY STATEMENT/PROSPECTUS INCLUDED WITHIN THE REGISTRATION STATEMENT ON FORM S-4 AND ANY OTHER
2
“Safe Harbor” Statement
under the Private Securities Litigation Reform Act of 1995
RELEVANT DOCUMENTS TO BE FILED WITH THE SECURITIES AND EXCHANGE COMMISSION IN CONNECTION WITH THE PROPOSED TRANSACTION, BECAUSE THEY CONTAIN IMPORTANT INFORMATION ABOUT PROSPERITY, TEXAS UNITED AND THE PROPOSED TRANSACTION.
Investors and security holders may obtain free copies of the joint proxy statement/prospectus (when available) and other related documents filed by Prosperity and Texas United with the SEC through the SEC’s website at www.sec.gov. Documents filed with the SEC by Prosperity will be available free of charge by directing a request by telephone or mail to Prosperity Bancshares, Inc., Prosperity Bank Plaza, 4295 San Felipe, Houston, Texas 77027 Attn: Investor Relations. Prosperity’s telephone number is (713) 693-9300. Documents filed with the SEC by Texas United will be available free of charge by directing a request by telephone or mail to Texas United Bancshares, Inc., 109 N. Main Street, La Grange, Texas 78645. Texas United’s telephone number is (979) 968-7294.
Participants in the Prosperity – Texas United Transaction
Prosperity, Texas United and their respective directors, executive officers, and certain other members of management and employees may be soliciting proxies in favor of the merger from Prosperity’s shareholders and Texas United’s shareholders. Information about Prosperity’s directors, executive officers, and members of management is set forth in the proxy statement for Prosperity’s 2006 Annual Meeting of Shareholders filed with the SEC on March 17, 2006. Information about Texas United’s directors, executive officers, and members of management is set forth in the proxy statement for Texas United’s 2006 Annual Meeting of Shareholders filed with the SEC on April 24, 2006.
3
Strengthens the Franchise
• Creates a company with more than $6.0 billion in assets, the third largest independent Texas-based bank
• Increases market capitalization to approximately $1.5 billion
• Accretive to GAAP and cash EPS within 12 months after operational integration with 20% cost savings
• Relatively neutral to tangible book value
• Solidifies Prosperity’s footprint in Dallas and Austin
• Provides market entry to Fort Worth and the Bryan/College Station markets
4
Strengthens the Franchise
• Gives Prosperity the #11 deposit market share in Texas
• Combined franchise will have 131 banking centers in Texas
– #3 position of “brick and mortar” branches among independent Texas banks
• Pricing of the transaction is consistent with other bank deals in metropolitan markets in Texas
• Low execution risk
5
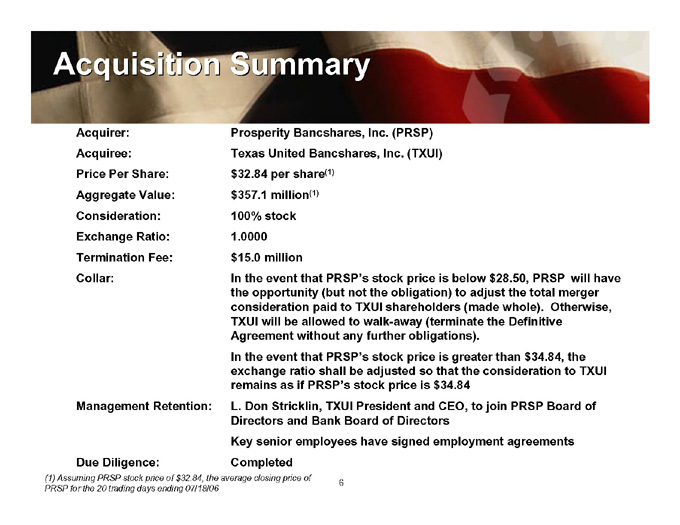
Acquisition Summary
Acquirer: Prosperity Bancshares, Inc. (PRSP)
Acquiree: Texas United Bancshares, Inc. (TXUI)
Price Per Share: $32.84 per share(1)
Aggregate Value: $357.1 million(1)
Consideration: 100% stock
Exchange Ratio: 1.0000
Termination Fee: $15.0 million
Collar: In the event that PRSP’s stock price is below $28.50, PRSP will have the opportunity (but not the obligation) to adjust the total merger consideration paid to TXUI shareholders (made whole). Otherwise, TXUI will be allowed to walk-away (terminate the Definitive Agreement without any further obligations).
In the event that PRSP’s stock price is greater than $34.84, the exchange ratio shall be adjusted so that the consideration to TXUI remains as if PRSP’s stock price is $34.84
Management Retention: L. Don Stricklin, TXUI President and CEO, to join PRSP Board of Directors and Bank Board of Directors Key senior employees have signed employment agreements
Due Diligence: Completed
(1) Assuming PRSP stock price of $32.84, the average closing price of PRSP for the 20 trading days ending 07/18/06
6
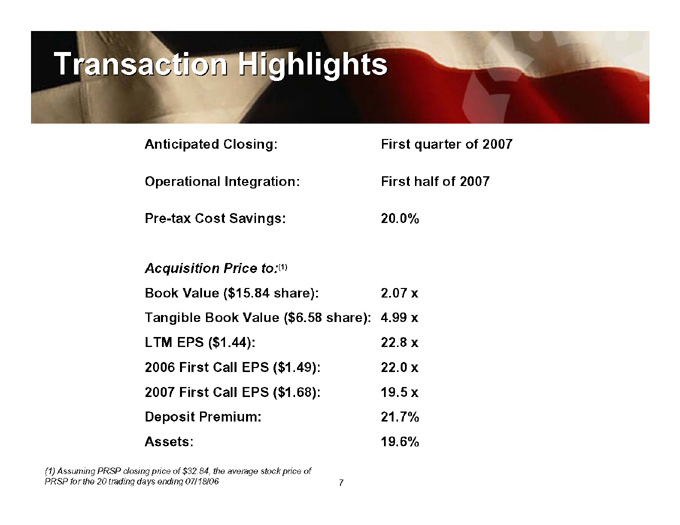
Transaction Highlights
Anticipated Closing: First quarter of 2007
Operational Integration: First half of 2007
Pre-tax Cost Savings: 20.0%
Acquisition Price to:(1)
Book Value ($15.84 share): 2.07 x
Tangible Book Value ($6.58 share): 4.99 x
LTM EPS ($1.44): 22.8 x
2006 First Call EPS ($1.49): 22.0 x
2007 First Call EPS ($1.68): 19.5 x
Deposit Premium: 21.7%
Assets: 19.6%
(1) Assuming PRSP closing price of $32.84, the average stock price of PRSP for the 20 trading days ending 07/18/06
7
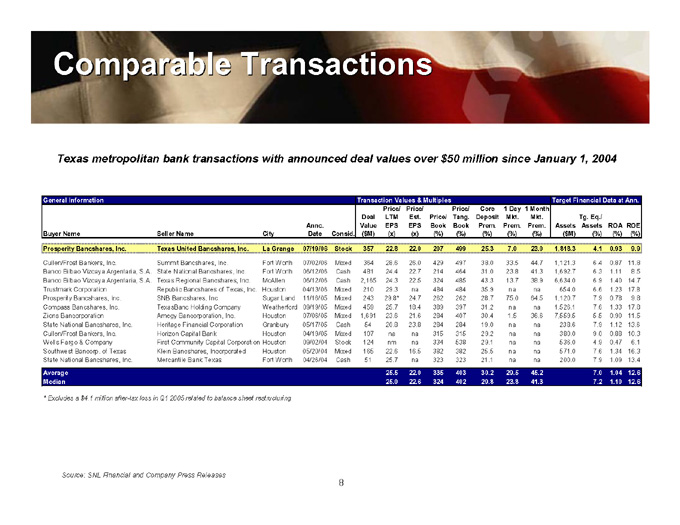
Comparable Transactions
Texas metropolitan bank transactions with announced deal values over $50 million since January 1, 2004
|
General Information Transaction Values & Multiples Target Financial Data at Ann. |
Price/ Price/ Price/ Core 1 Day 1 Month |
Deal LTM Est. Price/ Tang. Deposit Mkt. Mkt. Tg. Eq./ |
Annc. Value EPS EPS Book Book Prem. Prem. Prem. Assets Assets ROA ROE |
Buyer Name Seller Name City Date Consid. ($M) (x) (x) (%) (%) (%) (%) (%) ($M) (%) (%) (%) |
Prosperity Bancshares, Inc. Texas United Bancshares, Inc. La Grange 07/19/06 Stock 357 22.8 22.0 207 499 25.3 7.0 23.0 1,818.3 4.1 0.93 9.9 |
Cullen/Frost Bankers, Inc. Summit Bancshares, Inc. Fort Worth 07/02/06 Mixed 364 28.6 26.0 429 497 38.0 33.5 44.7 1,121.3 6.4 0.87 11.8 |
Banco Bilbao Vizcaya Argentaria, S.A. State National Bancshares, Inc. Fort Worth 06/12/06 Cash 481 24.4 22.7 214 464 31.0 23.8 41.3 1,692.7 6.3 1.11 8.5 |
Banco Bilbao Vizcaya Argentaria, S.A. Texas Regional Bancshares, Inc. McAllen 06/12/06 Cash 2,165 24.3 22.5 324 485 43.3 13.7 38.9 6,634.0 6.9 1.40 14.7 |
Trustmark Corporation Republic Bancshares of Texas, Inc. Houston 04/13/06 Mixed 210 29.3 na 484 484 35.9 na na 654.0 6.6 1.23 17.8 |
Prosperity Bancshares, Inc. SNB Bancshares, Inc. Sugar Land 11/16/05 Mixed 243 29.8* 24.7 262 262 28.7 75.0 64.5 1,120.7 7.9 0.78 9.8 |
Compass Bancshares, Inc. TexasBanc Holding Company Weatherford 09/19/05 Mixed 459 25.7 18.4 389 397 31.2 na na 1,526.1 7.6 1.33 17.8 |
Zions Bancorporation Amegy Bancorporation, Inc. Houston 07/06/05 Mixed 1,691 23.6 21.6 284 407 30.4 1.5 36.6 7,559.5 5.5 0.90 11.5 |
State National Bancshares, Inc. Heritage Financial Corporation Granbury 05/17/05 Cash 54 20.8 23.8 284 284 19.0 na na 238.6 7.9 1.12 13.6 |
Cullen/Frost Bankers, Inc. Horizon Capital Bank Houston 04/19/05 Mixed 107 na na 315 315 29.2 na na 380.0 9.0 0.88 10.3 |
Wells Fargo & Company First Community Capital Corporation Houston 09/02/04 Stock 124 nm na 334 538 29.1 na na 536.0 4.9 0.47 6.1 |
Southwest Bancorp. of Texas Klein Bancshares, Incorporated Houston 05/20/04 Mixed 165 22.6 16.5 382 382 25.5 na na 571.0 7.6 1.34 16.3 |
State National Bancshares, Inc. Mercantile Bank Texas Fort Worth 04/26/04 Cash 51 25.7 na 323 323 21.1 na na 200.0 7.9 1.09 13.4 |
Average 25.5 22.0 335 403 30.2 29.5 45.2 7.0 1.04 12.6 |
Median 25.0 22.6 324 402 29.8 23.8 41.3 7.2 1.10 12.6 |
* Excludes a $4.1 million after-tax loss in Q1 2005 related to balance sheet restructuring
Source: SNL Financial and Company Press Releases
8
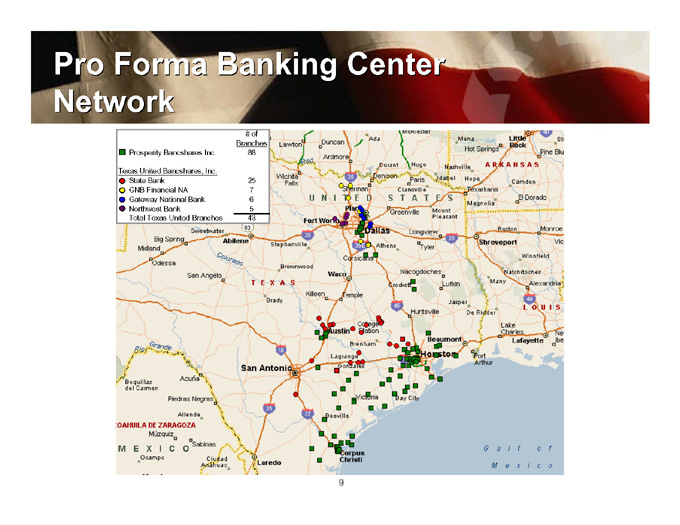
Pro Forma Banking Center Network
| | |
| | | # of |
| | | Branches |
Prosperity Bancshares Inc. | | 88 |
Texas United Bancshares, Inc. | | |
State Bank | | 25 |
GNB Financial NA | | 7 |
Gateway National Bank | | 6 |
Northwest Bank | | 5 |
Total Texas United Branches | | 43 |
9
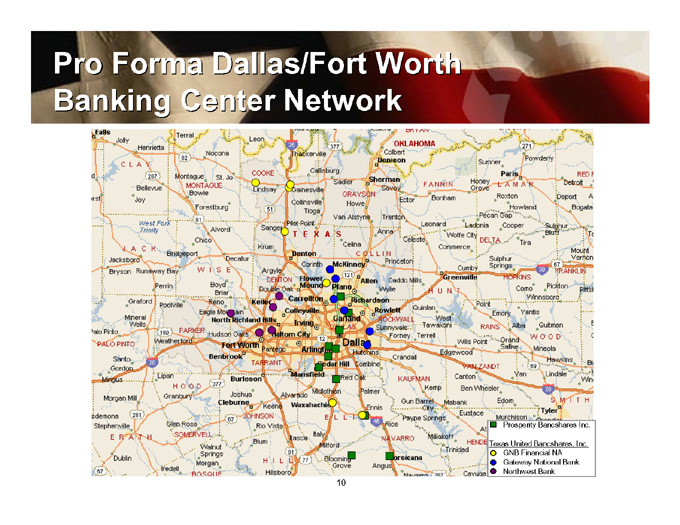
Pro Forma Dallas/Fort Worth
Banking Center Network
Prosperity Bancshares Inc.
Texas United Bancshares, Inc.
GNB Financial NA
Gateway National Bank
Northwest Bank
10
The Dallas/Fort Worth Market
• Fort Worth is Texas’ third largest deposit market
• A metropolitan region of 5.9 million that is projected to grow 13.9% from 2005 to 2010
– Tarrant County will lead the region’s population growth, adding up to 800,000 people by 2030
• New residents and businesses are attracted by favorable cost of living, quality of life and major development projects
• DFW airport is the busiest airport in the world and the nation’s largest inland port
• Service related businesses and the health care and energy industries are significant growth sectors
• The DFW Metroplex has the second largest high-tech sector in the nation
Source: | | SNL Financial and North Central Texas Council of Governments |
The Greater Houston Market
• A metropolitan region of 5.4 million that is projected to grow 15.0% from 2005 to 2010
• Houston is the 4th largest city in the US
• Harris County is Texas’ largest deposit market with $85.8 billion in total deposits
• Home to 24 FORTUNE 500 companies
• Port of Houston contributes $7.7 Billion to the local economy and provides 200,000 direct and related jobs
• Home of NASA’s Johnson Space Center
• Largest medical center in the world; 65,300 employees and an $13.5 billion impact on the Houston economy
• Energy Capital of the World
• Sugar Land (Southwestern region of the Houston MSA) ranked #3 on Money’s Best Places to Live
Source: | | SNL Financial and Greater Houston Partnership |
Other Significant Markets
The Bryan / College Station Market
• Current population of more than 200,000 that is projected to grow 9.6% from 2005 to 2010
• Home to the fourth largest University in the country (Texas A&M University)
• College Station has been rated:
– In the Top 60 of America’s Smaller Cities
– 14th in the Nation for Relocation
– First MSA and First in the US for the Better Living Index
– 12th in the Smaller City Category, Top 25 Cities for doing business in America
– 11th on Money’s 2006 Most Educated
The Austin / Round Rock Market
• A metropolitan region of 1.4 million that is projected to grow 16.2% from 2005 to 2010
• Median household income of $59,000 that is projected to grow 17.8% from 2005 to 2010
• Austin ranked #2 on Money’s Best Places to Live (Best Big Cities for 2006)
• Austin has been called “Best Place for Business and Careers”, “Live Music Capital of the World” and the “Best City for Relocating Families”
• The region is among the top targets for venture capital investment in the United States
Source: SNL Financial, City of College Station, Austin Chamber of Commerce and The Texas Economic Development
13
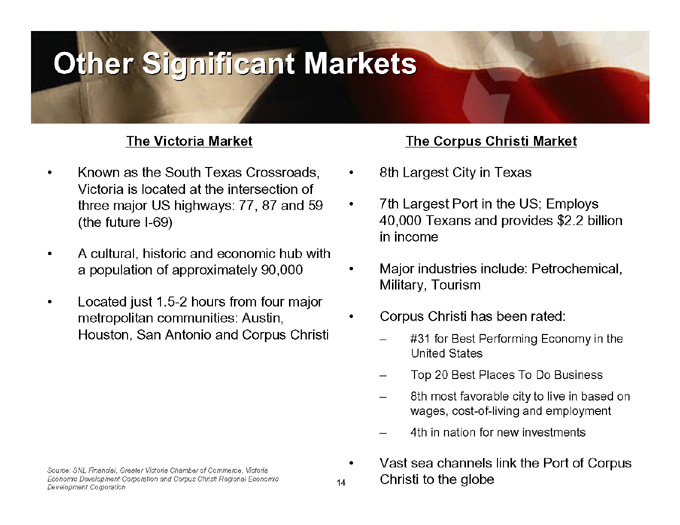
Other Significant Markets
The Victoria Market
• Known as the South Texas Crossroads, Victoria is located at the intersection of three major US highways: 77, 87 and 59 (the future I-69)
• A cultural, historic and economic hub with a population of approximately 90,000
• Located just 1.5-2 hours from four major metropolitan communities: Austin, Houston, San Antonio and Corpus Christi
The Corpus Christi Market
• 8th Largest City in Texas
• 7th Largest Port in the US; Employs 40,000 Texans and provides $2.2 billion in income
• Major industries include: Petrochemical, Military, Tourism
• Corpus Christi has been rated:
– #31 for Best Performing Economy in the United States
– Top 20 Best Places To Do Business
– 8th most favorable city to live in based on wages, cost-of-living and employment
– 4th in nation for new investments
• Vast sea channels link the Port of Corpus Christi to the globe
Source: SNL Financial, Greater Victoria Chamber of Commerce, Victoria Economic Development Corporation and Corpus Christi Regional Economic Development Corporation
14
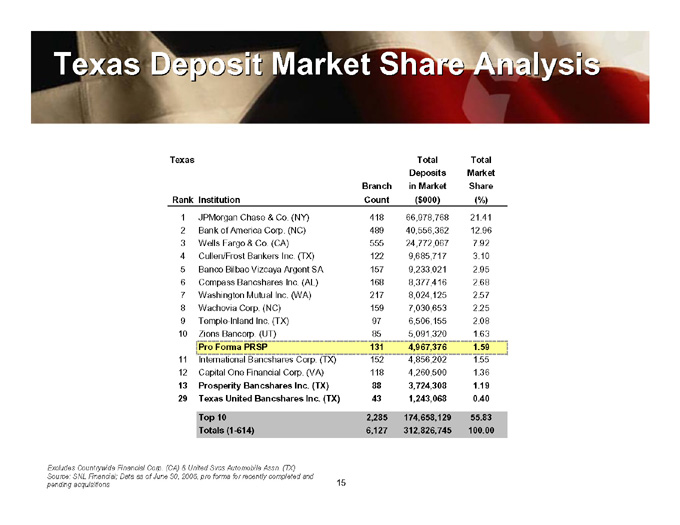
Texas Deposit Market Share Analysis
| | | | | | | | | | |
Texas | | | | | | Total | | | Total | |
| | | | | | | Deposits | | | Market | |
| | | | | Branch | | in Market | | | Share | |
Rank | | Institution | | Count | | ($000 | ) | | ( | %) |
1 | | JPMorgan Chase & Co. (NY) | | 418 | | 66,978,768 | | | 21.41 | |
2 | | Bank of America Corp. (NC) | | 489 | | 40,556,362 | | | 12.96 | |
3 | | Wells Fargo & Co. (CA) | | 555 | | 24,772,067 | | | 7.92 | |
4 | | Cullen/Frost Bankers Inc. (TX) | | 122 | | 9,685,717 | | | 3.10 | |
5 | | Banco Bilbao Vizcaya Argent SA | | 157 | | 9,233,021 | | | 2.95 | |
6 | | Compass Bancshares Inc. (AL) | | 168 | | 8,377,416 | | | 2.68 | |
7 | | Washington Mutual Inc. (WA) | | 217 | | 8,024,125 | | | 2.57 | |
8 | | Wachovia Corp. (NC) | | 159 | | 7,030,653 | | | 2.25 | |
9 | | Temple-Inland Inc. (TX) | | 97 | | 6,506,155 | | | 2.08 | |
10 | | Zions Bancorp. (UT) | | 85 | | 5,091,320 | | | 1.63 | |
| | | Pro Forma PRSP | | 131 | | 4,967,376 | | | 1.59 | |
11 | | International Bancshares Corp. (TX) | | 152 | | 4,856,202 | | | 1.55 | |
12 | | Capital One Financial Corp. (VA) | | 118 | | 4,260,500 | | | 1.36 | |
13 | | Prosperity Bancshares Inc. (TX) | | 88 | | 3,724,308 | | | 1.19 | |
29 | | Texas United Bancshares Inc. (TX) | | 43 | | 1,243,068 | | | 0.40 | |
| | | Top 10 | | 2,285 | | 174,658,129 | | | 55.83 | |
| | | Totals (1-614) | | 6,127 | | 312,826,745 | | | 100.00 | |
Excludes Countrywide Financial Corp. (CA) & United Svcs Automobile Assn. (TX)
Source: SNL Financial; Data as of June 30, 2005, pro forma for recently completed and pending acquisitions
15
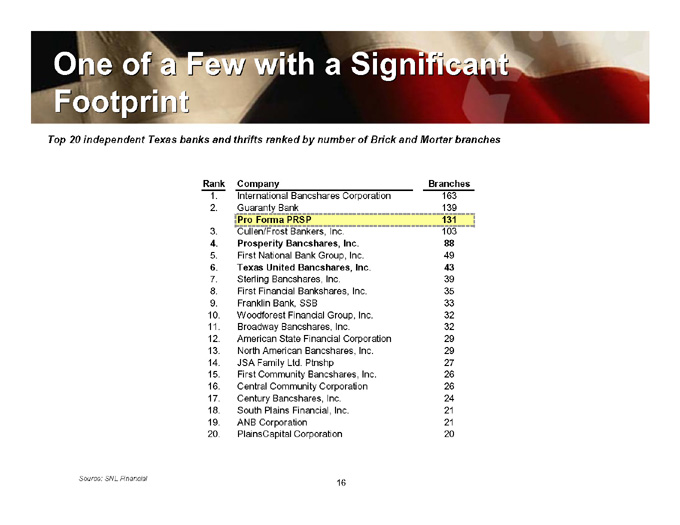
One of a Few with a Significant Footprint
Top 20 independent Texas banks and thrifts ranked by number of Brick and Mortar branches
| | | | |
Rank | | Company | | Branches |
1. | | International Bancshares Corporation | | 163 |
2. | | Guaranty Bank | | 139 |
| | | Pro Forma PRSP | | 131 |
3. | | Cullen/Frost Bankers, Inc. | | 103 |
4. | | Prosperity Bancshares, Inc. | | 88 |
5. | | First National Bank Group, Inc. | | 49 |
6. | | Texas United Bancshares, Inc. | | 43 |
7. | | Sterling Bancshares, Inc. | | 39 |
8. | | First Financial Bankshares, Inc. | | 35 |
9. | | Franklin Bank, SSB | | 33 |
10. | | Woodforest Financial Group, Inc. | | 32 |
11. | | Broadway Bancshares, Inc. | | 32 |
12. | | American State Financial Corporation | | 29 |
13. | | North American Bancshares, Inc. | | 29 |
14. | | JSA Family Ltd. Ptnshp | | 27 |
15. | | First Community Bancshares, Inc. | | 26 |
16. | | Central Community Corporation | | 26 |
17. | | Century Bancshares, Inc. | | 24 |
18. | | South Plains Financial, Inc. | | 21 |
19. | | ANB Corporation | | 21 |
20. | | PlainsCapital Corporation | | 20 |
Source: SNL Financial
16
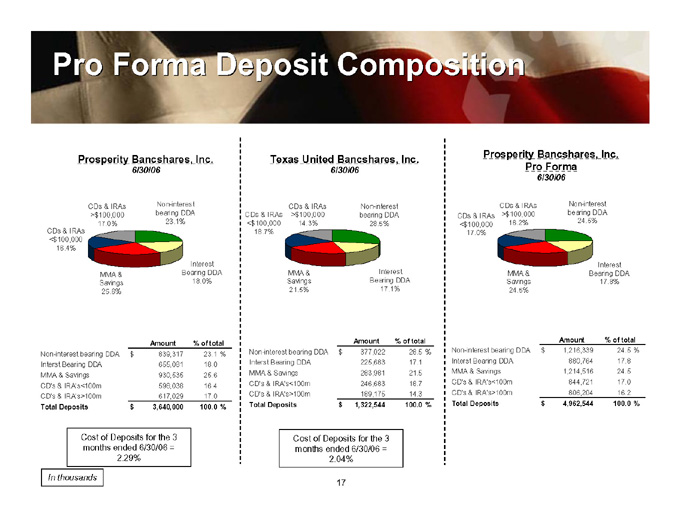
Pro Forma Deposit Composition
Prosperity Bancshares, Inc.
6/30/06
CDs & IRAs >$ 100,000 17.0%
Non-interest bearing DDA 23.1%
CDs & IRAs <$ 100,000 16.4%
MMA & Savings 25.6%
Interest | | Bearing DDA 18.0% |
| | | | | | |
| | | | Amount | | % of
total |
|
Non-interest bearing DDA | | $ | 839,317 | | 23.1 | % |
Interst Bearing DDA | | | 655,081 | | 18.0 | |
MMA & Savings | | | 930,535 | | 25.6 | |
CD’s & IRA’s<100m | | | 598,038 | | 16.4 | |
CD’s & IRA’s>100m | | | 617,029 | | 17.0 | |
Total Deposits | | $ | 3,640,000 | | 100.0 | % |
Cost of Deposits for the 3 months ended 6/30/06 = 2.29%
In thousands
Texas United Bancshares, Inc.
6/30/06
CDs & IRAs <$ 100,000 18.7%
CDs & IRAs >$100,000 14.3%
Non-interest bearing DDA 28.5%
MMA & Savings 21.5%
Interest Bearing DDA 17.1%
| | | | | | |
| | | | Amount | | % of
total |
|
Non-interest bearing DDA | | $ | 377,022 | | 28.5 | % |
Interst Bearing DDA | | | 225,683 | | 17.1 | |
MMA & Savings | | | 283,981 | | 21.5 | |
CD’s & IRA’s<100m | | | 246,683 | | 18.7 | |
CD’s & IRA’s>100m | | | 189,175 | | 14.3 | |
Total Deposits | | $ | 1,322,544 | | 100.0 | % |
Cost of Deposits for the 3 months ended 6/30/06 = 2.04%
Prosperity Bancshares, Inc.
Pro Forma
6/30/06
CDs & IRAs <$ 100,000 17.0%
CDs & IRAs >$ 100,000 16.2%
Non-interest bearing DDA 24.5%
Interest | | Bearing DDA 17.8% |
| | | | | | |
| | | | Amount | | % of
total |
|
Non-interest bearing DDA | | $ | 1,216,339 | | 24.5 | % |
Interst Bearing DDA | | | 880,764 | | 17.8 | |
MMA & Savings | | | 1,214,516 | | 24.5 | |
CD’s & IRA’s<100m | | | 844,721 | | 17.0 | |
CD’s & IRA’s>100m | | | 806,204 | | 16.2 | |
Total Deposits | | $ | 4,962,544 | | 100.0 | % |
17
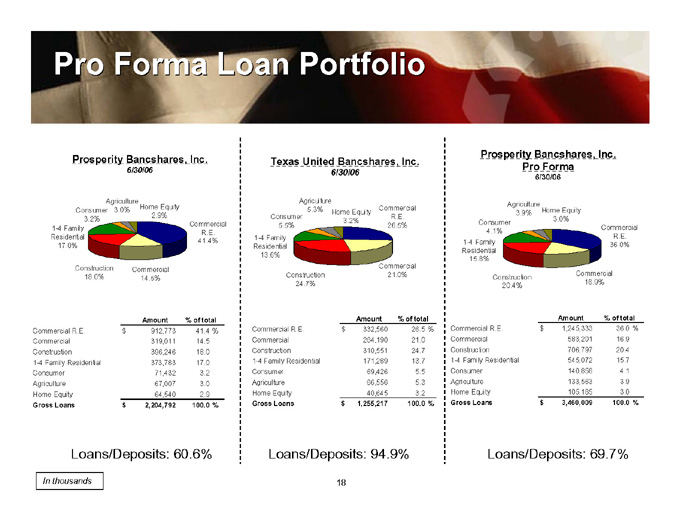
Pro Forma Loan Portfolio
Prosperity Bancshares, Inc.
6/30/06
Agriculture 3.0%
Home Equity 2.9%
Consumer 3.2%
1-4 Family Residential 17.0%
Commercial R.E. 41.4%
Construction 18.0%
Commercial 14.5%
| | | | | | |
| | | | Amount | | % of
total |
|
Commercial R.E. | | $ | 912,773 | | 41.4 | % |
Commercial | | | 319,011 | | 14.5 | |
Construction | | | 396,246 | | 18.0 | |
1-4 Family Residential | | | 373,783 | | 17.0 | |
Consumer | | | 71,432 | | 3.2 | |
Agriculture | | | 67,007 | | 3.0 | |
Home Equity | | | 64,540 | | 2.9 | |
Gross Loans | | $ | 2,204,792 | | 100.0 | % |
Loans/Deposits: 60.6%
In thousands
Texas United Bancshares, Inc.
6/30/06
Agriculture 5.3%
Commercial R.E. 26.5%
Home Equity 3.2%
Consumer 5.5%
1-4 Family Residential 13.6%
Commercial 21.0%
Construction 24.7%
| | | | | | |
| | | | Amount | | % of
total |
|
Commercial R.E. | | $ | 332,560 | | 26.5 | % |
Commercial | | | 264,190 | | 21.0 | |
Construction | | | 310,551 | | 24.7 | |
1-4 Family Residential | | | 171,289 | | 13.7 | |
Consumer | | | 69,426 | | 5.5 | |
Agriculture | | | 66,556 | | 5.3 | |
Home Equity | | | 40,645 | | 3.2 | |
Gross Loans | | $ | 1,255,217 | | 100.0 | % |
Loans/Deposits: 94.9%
Prosperity Bancshares, Inc.
Pro Forma
6/30/06
Agriculture 3.9%
Home Equity 3.0%
Consumer 4.1%
Commercial R.E. 36.0%
1-4 Family Residential 15.8%
Commercial 16.9%
Construction 20.4%
| | | | | | |
| | | | Amount | | % of
total |
|
Commercial R.E. | | $ | 1,245,333 | | 36.0 | % |
Commercial | | | 583,201 | | 16.9 | |
Construction | | | 706,797 | | 20.4 | |
1-4 Family Residential | | | 545,072 | | 15.7 | |
Consumer | | | 140,858 | | 4.1 | |
Agriculture | | | 133,563 | | 3.9 | |
Home Equity | | | 105,185 | | 3.0 | |
Gross Loans | | $ | 3,460,009 | | 100.0 | % |
Loans/Deposits: 69.7%
18

Contact Information
Corporate Headquarters
Prosperity Bank Plaza 4295 San Felipe Houston, Texas 77027
281.269.7199 Telephone 281.269-7222 Fax www.prosperitybanktx.com
Investor Contacts
David Zalman
Chairman & Chief Executive Officer 979.543.2200 david.zalman@prosperitybanktx.com
Dan Rollins
President & Chief Operating Officer 281.269.7199 dan.rollins@prosperitybanktx.com
David Hollaway Chief Financial Officer 979.543.2200 david.hollaway@prosperitybanktx.com
19

TXUI Acquisition Presentation – 7/20/06