Exhibit 99.1 |
2 “Safe Harbor” Statement “Safe Harbor” Statement under the Private Securities Litigation Reform Act of 1995 This presentation may contain forward-looking statements within the meaning of the securities laws that are based on current expectations, assumptions’ estimates and projections about Prosperity Bancshares ® , and its subsidiaries. These forward-looking statements are not guarantees of future performance and are subject to risks and uncertainties, many of which are outside of Prosperity’s control, that may cause actual results to differ materially from those expressed or implied by the forward-looking statements. These risks and uncertainties include but are not limited to whether Prosperity can: successfully identify acquisition targets and integrate the businesses of acquired companies and banks; continue to sustain its current internal growth rate or total growth rate; provide products and services that appeal to its customers; continue to have access to debt and equity capital markets; and achieve its sales objectives. Other risks include the possibility that credit quality could deteriorate; actions of competitors; changes in laws and regulations (including changes in governmental interpretations of regulations and changes in accounting standards); customer and consumer demand, including customer and consumer response to marketing; effectiveness of spending, investments or programs; fluctuations in the cost and availability of supply chain resources; economic conditions, including currency rate fluctuations and interest rate fluctuations; weather; and the stock price volatility associated with “small-cap” companies. These and various other factors are discussed in our most recent Annual Report on Form 10-K and other reports and statements we have filed with the SEC. Copies of the SEC filings for Prosperity Bancshares’s ® may be downloaded from the Internet at no charge from www.prosperitybanktx.com. |
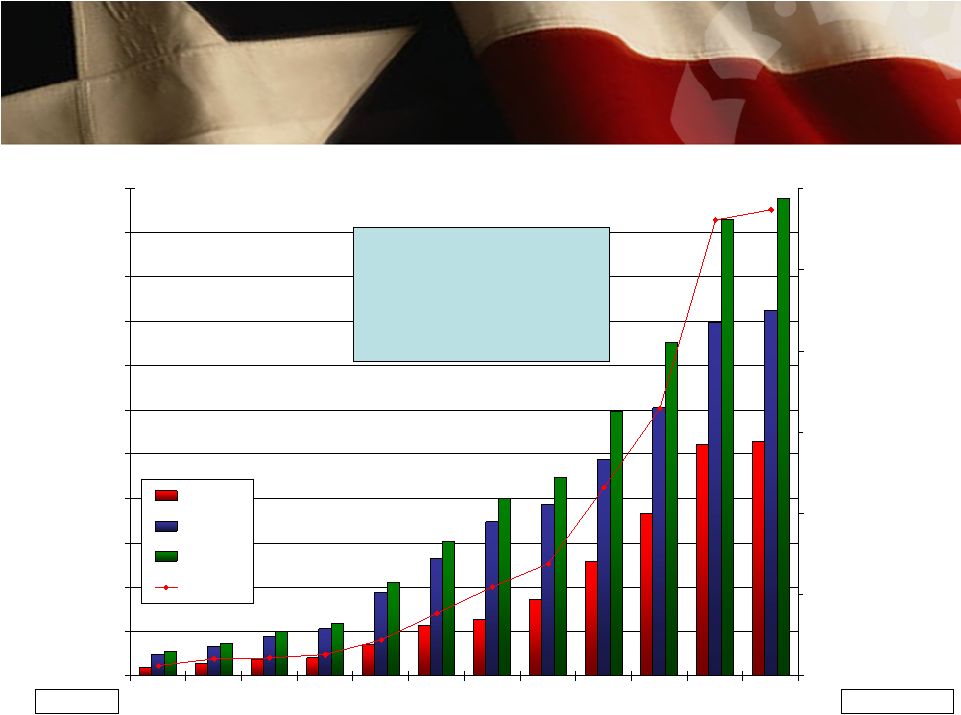
3 Prosperity is . . . . Prosperity is . . . . • A $6.5 billion Texas based Financial Holding Company • 3 rd largest Texas based commercial bank by deposit size • Strong balance sheet growth – 10 year CAGR of 49% loans, 35% deposits, and 38% assets • Strong earnings growth – 10 year CAGR of 11% for EPS (diluted) and 34% for net income • Shareholder driven with a approximately 13% insider ownership • Excellent asset quality – Net Charge Offs / Average Loans of 0.05% for three months ending March 31, 2008 • Excellent cost control – under 50% efficiency ratio • Since 2000, we have successfully integrated 19 accretive transactions. a Track Record of Success |
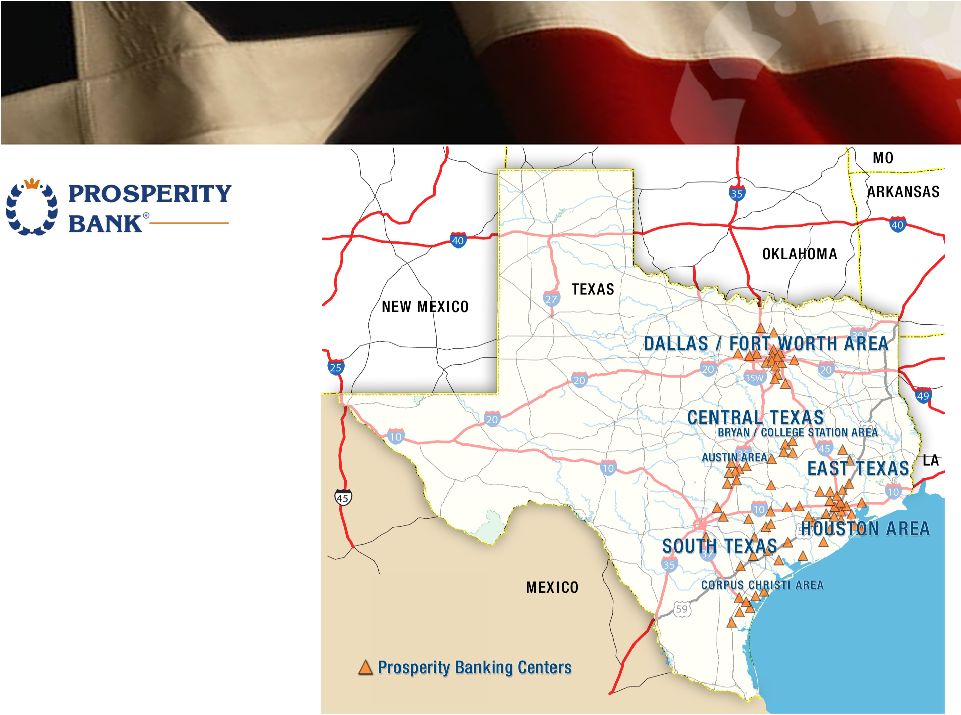
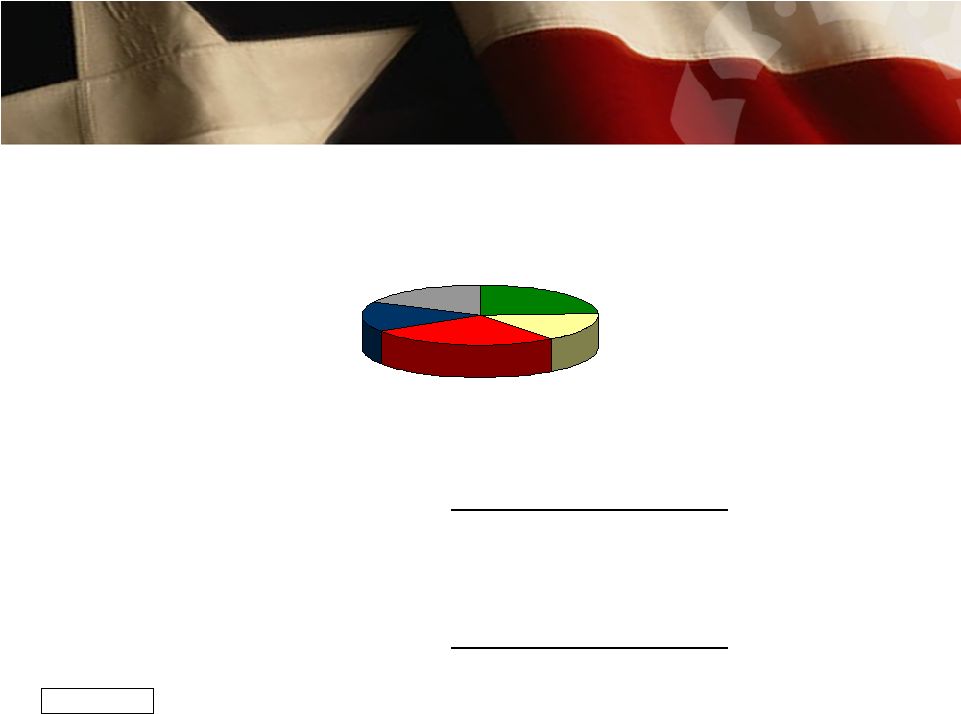
4 Banking Center Network Banking Center Network Franchise – $ 5.0 billion in Deposits $ 3.2 billion in Loans 130 Full Service Locations 23 in Central Texas 26 in Dallas/Fort Worth area 2 in East Texas 46 in Houston CMSA 33 in South Texas |
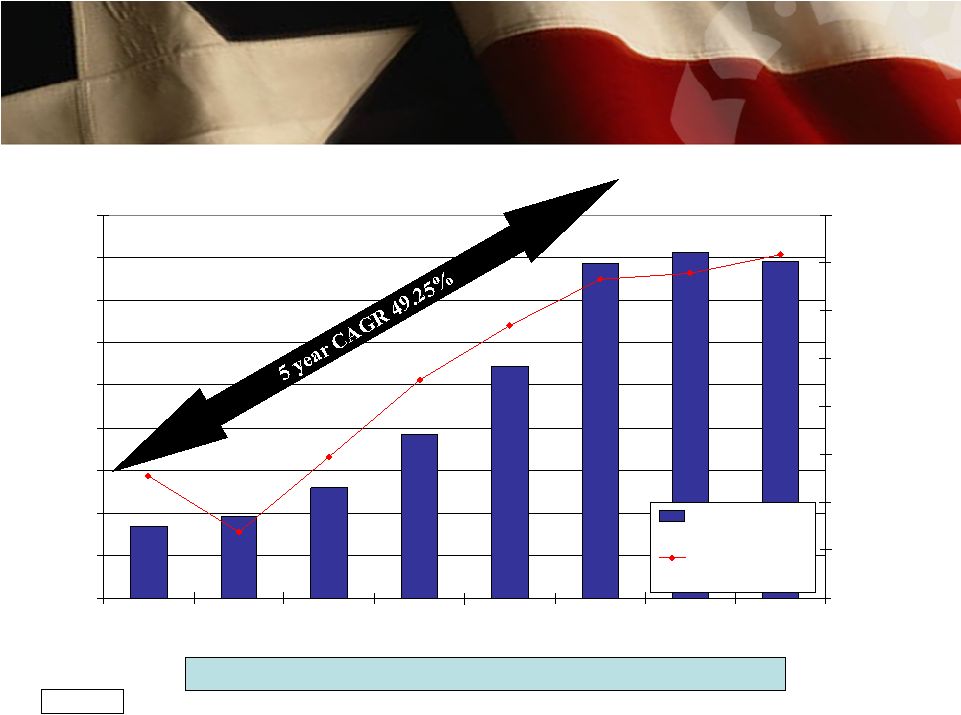
5 Balance Sheet Summary Balance Sheet Summary $0 $600 $1,200 $1,800 $2,400 $3,000 $3,600 $4,200 $4,800 $5,400 $6,000 $6,600 1997 1998 1999 2000 2001 2002 2003 2004 2005 2006 2007 1Q08 $0 $200 $400 $600 $800 $1,000 $1,200 Loans Deposits Assets Equity As Originally Reported $ in millions Equity in millions Total footings as of 3/31/08 Loans = $3.2 billion Deposits = $5.0 billion Assets = $6.5 billion |
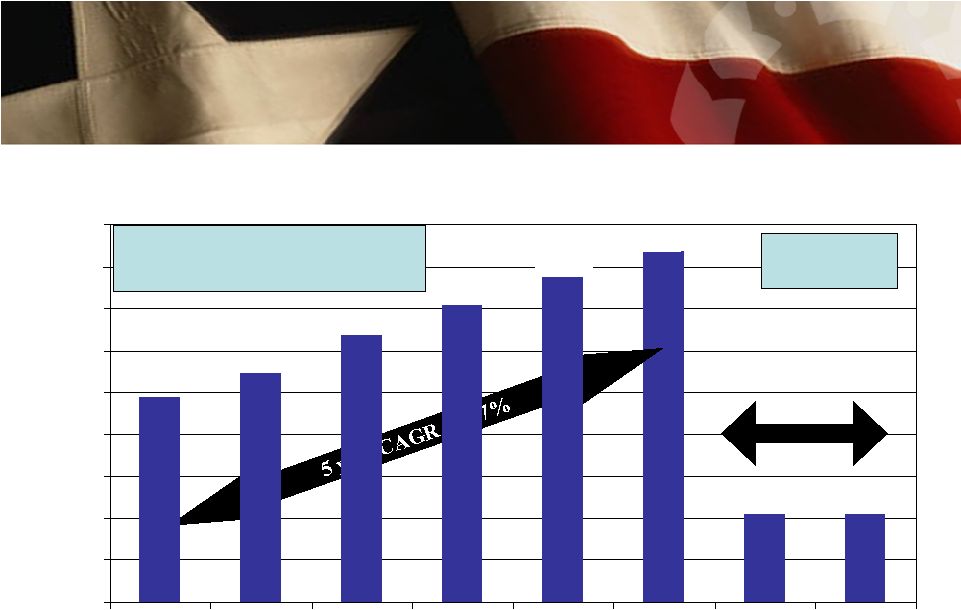
6 EPS Growth Diluted EPS Growth Diluted Net income 5 and 10 year CAGR = 34% and 38% respectively EPS 10 year CAGR = 9% $0.52 $1.22 $1.36 $1.59 $1.77 $1.94 $2.09 $0.52 $0.00 $0.25 $0.50 $0.75 $1.00 $1.25 $1.50 $1.75 $2.00 $2.25 2002 2003 2004 2005 2006 2007 1Q 2007 1Q 2008 |
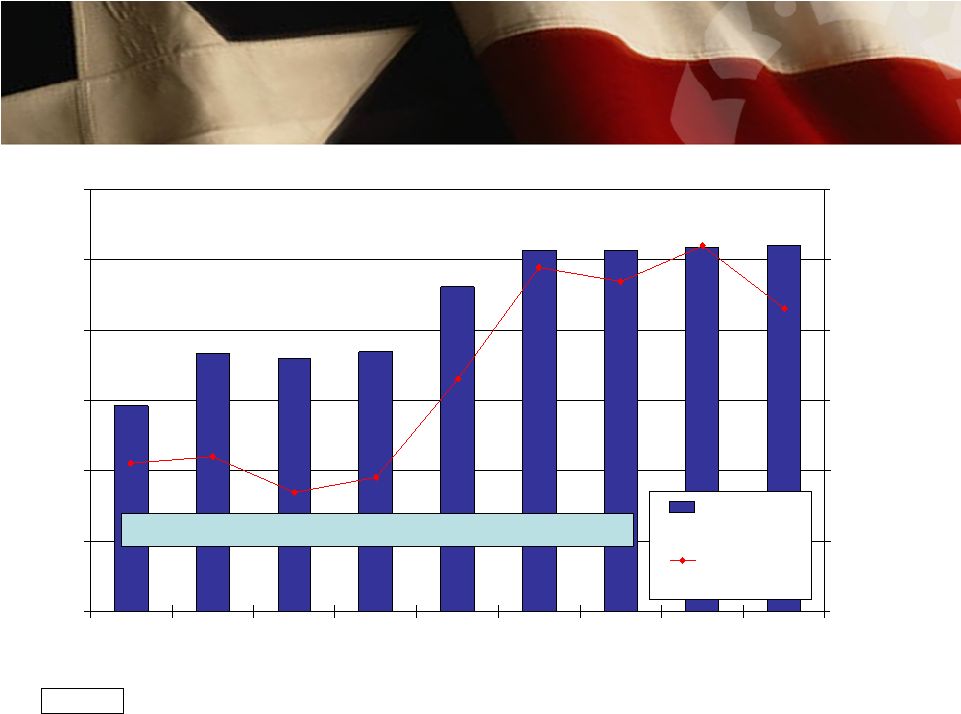
7 Net Interest Income and Margin (fte) Net Interest Income and Margin (fte) 4.03% 4.12% 3.77% 3.82% 3.81% 3.79% 3.93% 4.09% 4.07% $0 $10 $20 $30 $40 $50 $60 1Q06 2Q06 3Q06 4Q06 1Q07 2Q07 3Q07 4Q07 1Q08 3.60% 3.70% 3.80% 3.90% 4.00% 4.10% 4.20% Net Interest Income Net Interest Margin $ in millions Net Interest Margin for 2006 - 3.80% and for 2007 – 4.06% |
8 Efficiency Ratio 45.06% 45.45% 45.29% 48.99% 49.45% 51.82% 50.39% 40.00% 42.50% 45.00% 47.50% 50.00% 52.50% 55.00% 2002 2003 2004 2005 2006 2007 1Q2008 5 acquisitions $507 million assets acquired 4 acquisitions $426 million assets acquired 2 acquisitions $846 million assets acquired 2 acquisitions $296 million assets acquired 1 acquisition $1.1 billion assets acquired Calculated by dividing total non-interest expense (excluding credit loss provisions) by net interest income plus non-interest income (excluding gains and losses on the sale of securities and assets) Additionally, taxes are not part of this calculation. 2 acquisitions $1.9 billion assets acquired |
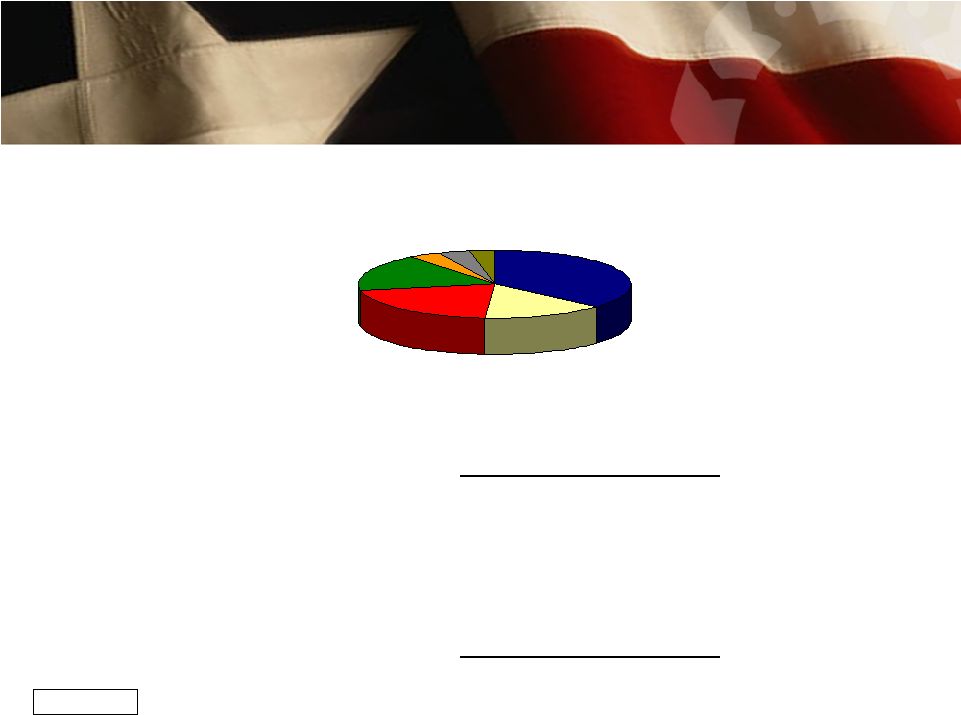
9 Deposit Composition Deposit Composition Non-interest bearing DDA 24.3% MMA & Savings 25.9% Interest Bearing DDA 15.5% CDs & IRAs <$100,000 16.6% CDs & IRAs >$100,000 17.7% $ in thousands 1Q08 Cost of Deposits- 2.35% March 31, 2008 Amount Non-interest bearing DDA $ 1,202,622 24.3 % Interst Bearing DDA 769,440 15.5 MMA & Savings 1,282,377 25.9 CD's & IRA's<100m 819,671 16.6 CD's & IRA's>100m 874,608 17.7 Total Deposits $ 4,948,718 100.0 % % of total |
10 Loan Growth Loan Growth $0 $400 $800 $1,200 $1,600 $2,000 $2,400 $2,800 $3,200 $3,600 2002 2003 2004 2005 2006 2007 1Q07 1Q08 30.00% 35.00% 40.00% 45.00% 50.00% 55.00% 60.00% 65.00% 70.00% Loans Loan / Deposit Ratio $ in millions Loan/deposit ratio increased from 37% at 12/31/03 to 63% at 12/31/07 |
11 Loan Portfolio Loan Portfolio Home Equity 3.0% Agriculture 3.8% Consumer 3.9% 1-4 Family Residential 17.3% Commercial 14.3% Construction 21.0% Commercial R.E. 36.7% $ in thousands Loans/Deposits: 63.9% March 31, 2008 Amount Commercial R.E. $ 1,161,668 36.7 % Commercial 452,635 14.3 Construction 664,679 21.0 1-4 Family Residential 546,765 17.3 Consumer 121,975 3.9 Agriculture 119,346 3.8 Home Equity 94,559 3.0 Gross Loans $ 3,161,627 100.0 % % of total |
12 Historical Loan Composition Historical Loan Composition $ in millions CAGR Loan Composition Commercial $ 93.8 13.8% $ 94.0 12.2% $ 144.4 13.9% $ 222.8 14.4% $ 297.7 13.7% $ 453.6 14.5% 37.0% Construction $ 52.4 7.7% $ 36.5 4.7% $ 109.6 10.6% $ 206.7 13.4% $ 433.2 19.9% $ 683.2 21.7% 67.1% 1-4 Family Residential $ 206.6 30.4% $ 237.1 30.8% $ 260.5 25.2% $ 313.2 20.3% $ 377.0 17.3% $ 526.3 16.7% 20.6% Home Equity $ 23.2 3.4% $ 27.9 3.6% $ 34.5 3.3% $ 58.7 3.8% $ 63.4 2.9% $ 93.9 3.0% 32.3% Commercial Real Estate $ 202.5 29.8% $ 283.8 36.9% $ 389.6 37.7% $ 619.3 40.3% $ 881.1 40.5% $ 1,148.7 36.6% 41.5% Agriculture $ 36.6 5.4% $ 35.9 4.7% $ 44.1 4.2% $ 56.3 3.6% $ 57.4 2.6% $ 114.0 3.6% 25.5% Consumer $ 64.5 9.5% $ 54.8 7.1% $ 52.9 5.1% $ 65.1 4.2% $ 66.7 3.1% $ 123.2 3.9% 13.8% Total Loans $ 679.6 100.0% $ 770.0 100.0% $ 1,035.6 100.0% $ 1,542.1 100.0% $ 2,176.5 100.0% $ 3,142.9 100.0% 35.8% 12/31/2002 12/31/2007 12/31/2006 12/31/2003 12/31/2004 12/31/2005 |
13 Asset Quality – NPA*/Loans + OREO * Includes loans past due 90 days and still accruing Asset Quality – NPA*/Loans + OREO * Includes loans past due 90 days and still accruing 0.13% 0.55% 0.49% 0.05% 0.09% 0.17% 0.13% 0.38% 0.00% 1.18% 0.83% 1.02% 0.97% 0.83% 0.65% 1.00% 0.00% 0.20% 0.40% 0.60% 0.80% 1.00% 1.20% 2001 2002 2003 2004 2005 2006* 2007 1Q07 1Q08 PRSP NPA*/Loans + OREO Peer NPA*/Loans + OREO Source: SNL Financial Texas Peer Group Includes: CFR, EBTX, FFIN, FBTX, IBOC, MCBI, SBSI, SNBI, SBIB, SBIT, TCBI, TRBS & TXUI * SNBI, SBIT, TRBS & TXUI have been acquired and were excluded from 2006 & 2007 |
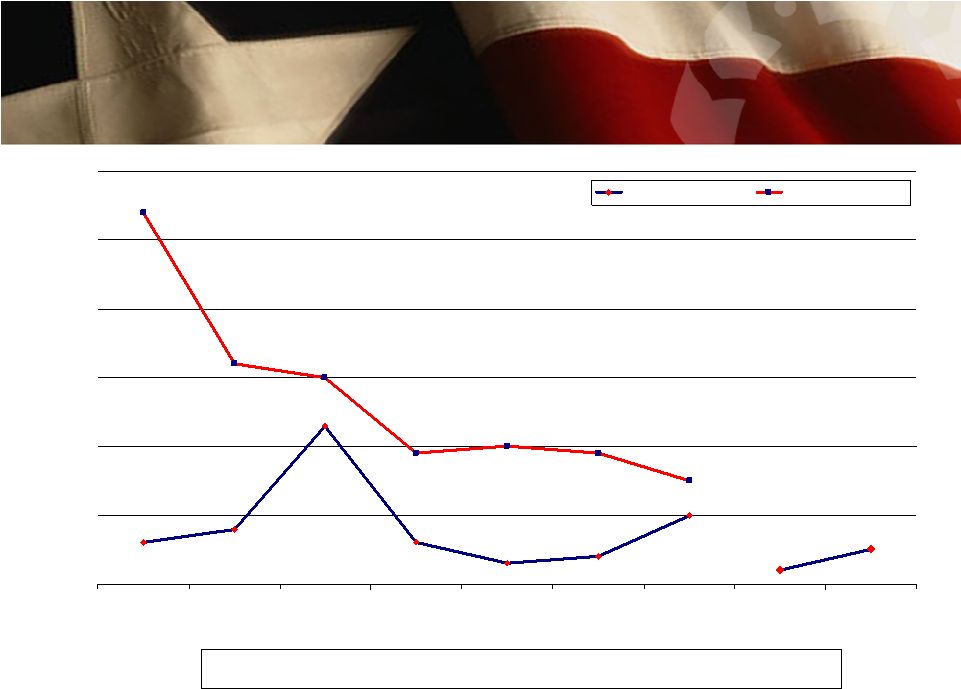
14 Asset Quality - NCO/Average Loans Asset Quality - NCO/Average Loans 0.23% 0.05% 0.54% 0.15% 0.10% 0.04% 0.03% 0.06% 0.08% 0.06% 0.02% 0.19% 0.20% 0.19% 0.30% 0.32% 0.00% 0.10% 0.20% 0.30% 0.40% 0.50% 0.60% 2001 2002 2003 2004 2005 2006* 2007* 1Q07 1Q08 PRSP NCO / Loans Peer NCO / Loans Source: SNL Financial Texas Peer Group Includes: CFR, EBTX, FFIN, FBTX, IBOC, MCBI, SBSI, SNBI, SBIB, SBIT, TCBI, TRBS & TXUI * SNBI, SBIT, TRBS & TXUI have been acquired and were excluded from 2006 & 2007 |
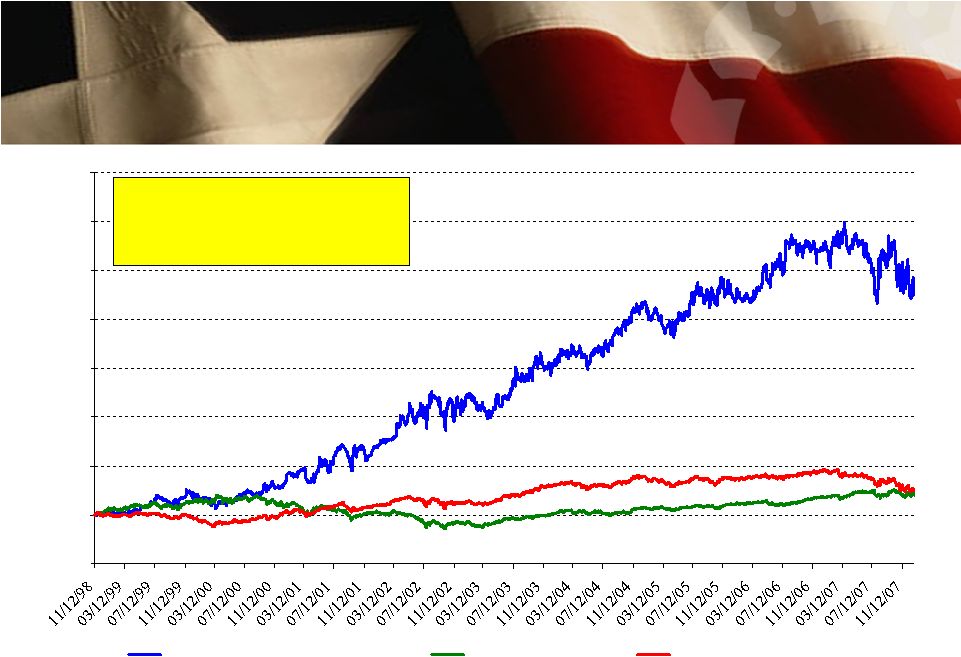
15 0 100 200 300 400 500 600 700 800 Prosperity Bancshares Inc. (+458.0%) Russell 3000 (+41.0%) NASDAQ Bank Index (+48.4%) Total Return Performance Total Return Performance $100,000 invested in PRSP at IPO on 11/12/1998 was worth $558,000 on 12/31/2007 Source: FactSet Research Systems |
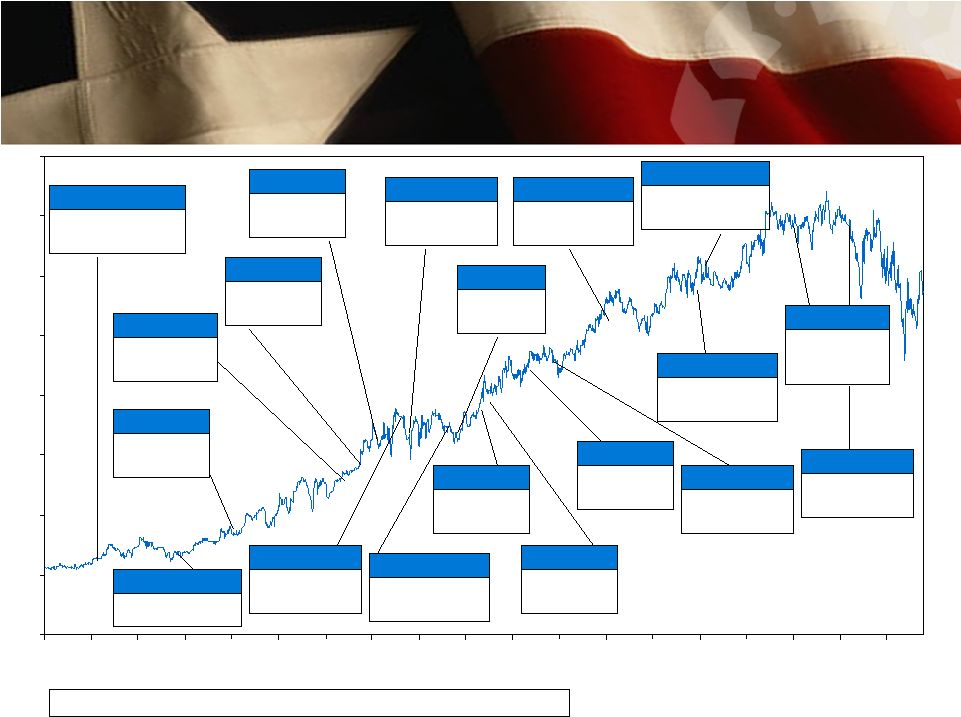
16 Merger & Acquisition History* Merger & Acquisition History* $0 $5 $10 $15 $20 $25 $30 $35 $40 Nov- 98 May- 99 Nov- 99 May- 00 Nov- 00 May- 01 Nov- 01 May- 02 Nov- 02 May- 03 Nov- 03 May- 04 Nov- 04 May- 05 Nov- 05 May- 06 Nov- 06 May- 07 Nov- 07 06/21/99 South Texas Bancshares, Inc. Deal Value: $23.4 Location: Beeville 11/08/00 Heritage Bank Deal Value: $53.3 Location: Houston 02/22/02 Texas Guaranty Bank Deal Value: $11.8 Location: Houston 04/26/02 First State Bank Deal Value: $3.7 Location: Needville 05/02/02 Paradigm Bank Deal Value: $41.6 Location: Houston 08/15/02 First National Bank Deal Value: $5.0 Location: Bay City 03/05/03 BankDallas Deal Value: $7.0 Location: Dallas 10/26/04 FirstCapital Bank Deal Value: $135.7 Location: Corpus Christi 06/15/00 Compass Bank – 5 Branches Location: Houston area 07/15/02 Bank of the Southwest Deal Value: $21.0 Location: Dallas 02/03/03 Abrams Centre Bank Deal Value: $16.3 Location: Dallas 07/21/03 Mainbank Deal Value: $39.7 Location: Dallas 10/06/03 First State Bank Deal Value: $21.3 Location: Dallas 4/26/04 First State Bank Deal Value: $7.3 Location: Grapeland 05/12/04 Village Bank Deal Value: $20.2 Location: Austin 09/12/05 Liberty Bank Deal Value: $42.0 Location: Austin 11/16/05 Southern National Bank Deal Value: $242.7 Location: Houston 07/19/06 Texas United Bancshares Deal Value: $383.2 Location: Texas *- Merger and Acquisition dates are the dates the transaction was announced to the public. 05/01/07 The Bank of Navasota Deal Value: $383.2 Location: Navasota |
17 Contact Information Contact Information 979.543.2200 david.hollaway@prosperitybanktx.com Chief Financial Officer David Hollaway 281.269.7199 dan.rollins@prosperitybanktx.com www.prosperitybanktx.com President & Chief Operating Officer 281.269-7222 Fax Dan Rollins 281.269.7199 Telephone 979.543.2200 david.zalman@prosperitybanktx.com Houston, Texas 77027 Chairman & Chief Executive Officer 4295 San Felipe David Zalman Prosperity Bank Plaza Investor Contacts Corporate Headquarters |
1Q08 Presentation |
19 Supplemental Data |
20 Financial Highlights Financial Highlights As Originally Reported (Dollars in thousands, except EPS) 5.87% 14.10% 13.12% 8.09% $7.42 $25.54 32.34% 8.72% 1.49% $2.09 $90,635 $199,675 $52,923 $4,966,407 $3,142,971 $6,372,343 2007 5.94% 14.04% 13.09% 7.84% $7.58 $25.93 27.28% 8.02% 1.43% $0.52 $22,938 $51,995 $12,679 $4,928,240 $3,247,708 $6,464,733 1Q08 4.97% 13.13% 12.08% 8.31% $6.29 $24.37 31.24% 8.71% 1.40% $0.52 $20,229 $46,088 $11,671 $4,48,718 $3,161,627 $6,326,699 1Q07 4.17% 16.90% 15.82% 7.10% $4.53 $10.49 29.94% 15.60% 1.32% $1.36 $26,548 $64,499 $16,966 $2,083,748 $770,053 $2,400,487 2003 5.24% 14.58% 13.55% 7.76% $6.62 $20.26 31.53% 10.24% 1.44% $1.94 $61,725 $138,145 $33,982 $3,725,678 $2,176,507 $4,586,769 2006 4.38% 14.67% 13.56% 6.30% $4.96 $12.32 33.41% 14.27% 1.36% $1.59 $34,707 $81,967 $23,071 $2,317,076 $1,035,513 $2,697,228 2004 5.46% 16.37% 15.34% 7.83% $6.48 $16.69 29.88% 11.56% 1.42% $1.77 $47,860 $110,897 $30,021 $2,920,318 $1,542,125 $3,585,982 2005 Tier I Risk Capital Total Risk Capital Net- Int Income Book value per share Tangible Ratio Leverage Ratio Non-Int Income Tangible book value per share ROAE – tangible ROAE ROAA EPS (diluted) Net Income Deposits Loans Assets (1) Due to the adoption of SFAS 150 on January 1, 2004, the Company now includes the dividend payments on junior subordinated debentures as part of interest expense rather than non-interest expense. Prior period data has been restated to reflect the adoption of SFAS 150. |
21 PRSP Acquisitions PRSP Acquisitions Branch Acquisitions Date of Announcement Seller # of Branches Branch Type Branch Locale State Amount of Deposits Transferred ($000) Deposit Premium ($000) Premium/ Deposits (%) Assets Transferred: Loan? Yor N 10/22/2007 Banco Popular North America 6 Bank TX 140,000 NA 10.1 Yes 6/15/2000 Compass Bancshares, Inc. 5 Bank TX 87,000 NA NA Yes 2/27/1998 Grimes County Capital Corporation 1 Bank TX 5,900 250 4.24 No 3/30/1997 Wells Fargo & Company 1 Bank TX NA NA NA No 3/11/1996 Victoria Bankshares, Inc. 1 Bank TX 46,000 NA NA Yes At Announcement Date of Announcement Seller City State Type Consideration Accounting Method PRSP Assets ($000) Sellers' Assets ($000) Sellers' Assets Contribution (%) Deal Value ($000) 2/7/2008 1st Choice Bancorp, Inc. Houston TX Bank Mixed Purchase 6,372,343 313,900 4.69 66.2 05/01/07 The Bank of Navasota Navasota TX Bank Common Stock Purchase 6,247,926 72,300 1.14 17.1 07/19/06 Texas United Bancshares, Inc. La Grange TX Bank Common Stock Purchase 4,547,220 1,818,000 27.82 357.1 11/16/05 SNB Bancshares, Inc. Houston TX Bank Mixed Purchase 3,493,972 1,121,747 24.30 242.7 09/12/05 Grapeland Bancshares, Inc. Grapeland TX Bank Common Stock Purchase 3,479,747 73,000 2.15 7.3 10/26/04 FirstCapital Bankers, Inc. Corpus Christi TX Thrift Common Stock Purchase 2,709,169 773,566 22.21 135.7 05/12/04 Village Bank and Trust Austin TX Thrift Cash Purchase 2,449,553 110,400 4.31 20.2 04/26/04 Liberty Bank Austin TX Thrift Mixed Purchase 2,449,553 186,000 7.06 42 10/06/03 First State Bank of North Texas Dallas TX Bank Mixed Purchase 2,078,532 93,900 4.32 21.3 07/21/03 Mainbancorp Dallas TX Bank Mixed Purchase 1,983,277 195,700 8.98 39.7 03/05/03 BankDallas SSB Dallas TX Thrift Cash Purchase 1,822,256 40,716 2.19 7 02/03/03 Abrams Centre Bancshares, Inc. Dallas TX Bank Cash Purchase 1,822,256 95,388 4.97 16.3 08/15/02 First National Bank of Bay City Bay City TX Bank Cash Purchase 1,360,356 28,174 2.03 5 07/15/02 Southwest Bank Holding Company Dallas TX Bank Cash Purchase 1,289,637 127,055 8.97 21 05/02/02 Paradigm Bancorporation, Incorporated Houston TX Bank Common Stock Purchase 1,289,637 259,262 16.74 41.6 04/26/02 First State Bank Needville TX Bank Cash Purchase 1,289,637 17,539 1.36 3.7 02/22/02 Texas Guaranty Bank, N.A. Houston TX Bank Cash Purchase 1,262,152 75,019 5.61 11.8 11/08/00 Commercial Bancshares, Inc. Houston TX Bank Common Stock Pooling 693,079 401,271 36.67 53.3 06/21/99 South Texas Bancshares, Inc. Beeville TX Bank Cash Purchase 461,903 142,091 23.53 23.4 6/5/1998 Union State Bank East Bernard TX Bank Cash Purchase 339,287 79,174 18.92 17.6 |
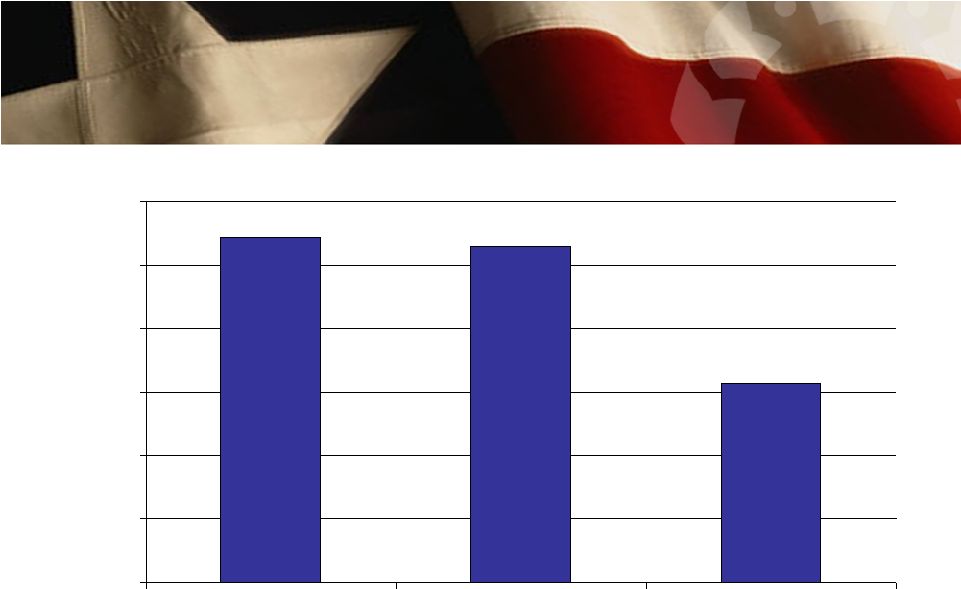
22 Projected Population Change 2005-2010 (%) 10.86% 10.58% 6.26% 0.00% 2.00% 4.00% 6.00% 8.00% 10.00% 12.00% PRSP Pro Forma Texas Average National Average Growth Rates are deposits rated by County Source: SNL Financial * Pro Forma includes the acquisition of TXUI * |
23 The Greater Houston Market The Greater Houston Market • A metropolitan region of 5.4 million that is projected to grow 15.0% from 2005 to 2010 • Houston is the 4th largest city in the US • Harris County is Texas’ largest deposit market with $85.8 billion in total deposits • Home to 24 FORTUNE 500 companies • Port of Houston contributes $7.7 Billion to the local economy and provides 200,000 direct and related jobs • Home of NASA’s Johnson Space Center • Largest medical center in the world; 65,300 employees and an $13.5 billion impact on the Houston economy • Energy Capitol of the World • Sugar Land (Southwestern region of the Houston MSA) ranked #3 on Money’s Best Places to Live Source: SNL Financial and Greater Houston Partnership |
24 Fort Bend County Fort Bend County Sources: ESRI, ACCRA The Council for Community and Economic Research and the Greater Fort Bend Economic Development Council • Fast-growing county with an attractive customer base – 26.6% historical population growth for 2000 – 2005 Versus 10.8% for Texas and 6.2% for the U.S. – 27.6% projected population growth for 2005 – 2010 Versus 10.6% for Texas and 6.3% for the U.S. • Ranks second in the nation for median household income (adjusted for cost of living) • Median household income of approximately $76,300 well above the median for the state of Texas of approximately $47,800 • Leads the nation in its rate of homeownership (81%) and employment growth |
25 The Dallas/Fort Worth Market The Dallas/Fort Worth Market • Fort Worth is Texas’ third largest deposit market • A metropolitan region of 5.9 million that is projected to grow 13.9% from 2005 to 2010 – Tarrant County will lead the region’s population growth, adding up to 800,000 people by 2030 • New residents and businesses are attracted by favorable cost of living, quality of life and major development projects • DFW airport is the busiest airport in the world and the nation’s largest inland port • Service related businesses and the health care and energy industries are significant growth sectors • The DFW Metroplex has the second largest high-tech sector in the nation Source: SNL Financial and North Central Texas Council of Governments |
26 Other Significant Markets Other Significant Markets The Victoria Market • Known as the South Texas Crossroads, Victoria is located at the intersection of three major US highways: 77, 87 and 59 (the future I-69) • A cultural, historic and economic hub with a population of approximately 90,000 • Located just 1.5-2 hours from four major metropolitan communities: Austin, Houston, San Antonio and Corpus Christi Source: SNL Financial, Greater Victoria Chamber of Commerce, Victoria Economic Development Corporation and Corpus Christi Regional Economic Development Corporation The Corpus Christi Market • 8th Largest City in Texas • 7th Largest Port in the US; Employs 40,000 Texans and provides $2.2 billion in income • Major industries include: Petrochemical, Military, Tourism • Corpus Christi has been rated: – #31 for Best Performing Economy in the United States – Top 20 Best Places To Do Business – 8th most favorable city to live in based on wages, cost-of-living and employment – 4th in nation for new investments • Vast sea channels link the Port of Corpus Christi to the globe |
27 Other Significant Markets Other Significant Markets The Bryan / College Station Market • Current population of more than 200,000 that is projected to grow 9.6% from 2005 to 2010 • Home to the fourth largest University in the country (Texas A&M University) • College Station has been rated: – In the Top 60 of America's Smaller Cities – 14th in the Nation for Relocation – First MSA and First in the US for the Better Living Index – 12th in the Smaller City Category, Top 25 Cities for doing business in America – 11th on Money’s 2006 Most Educated Source: SNL Financial, City of College Station, Austin Chamber of Commerce and The Texas Economic Development The Austin / Round Rock Market • A metropolitan region of 1.4 million that is projected to grow 16.2% from 2005 to 2010 • Median household income of $59,000 that is projected to grow 17.8% from 2005 to 2010 • Austin ranked #2 on Money’s Best Places to Live (Best Big Cities for 2006) • Austin has been called “Best Place for Business and Careers”, “Live Music Capital of the World” and the “Best City for Relocating Families” • The region is among the top targets for venture capital investment in the United States |
1 st Quarter Earnings |