
—PROSPERITY—
BANCSHARES, INC.®
Real bankers… not just a bank.
“Safe Harbor” Statement
under the Private Securities Litigation Reform Act of 1995
Statements contained in this presentation which are not historical facts and which pertain to future operating results of Prosperity Bank and its subsidiaries constitute “forward-looking statements” within the meaning of the Private Securities Litigation reform Act of 1995. These forward-looking statements involve significant risks and uncertainties. Actual results may differ materially from the results discussed in these forward-looking statements. Factors that might cause such a difference include, but are not limited to, those discussed in the company’s periodic filings with the SEC. Copies of the SEC filings for Prosperity Bancshares’s® may be downloaded from the Internet at no charge from www.prosperitybanktx.com.
2

Corporate Profile
a Track Record of Success
A Texas based Financial Holding Company with approximately $9 billion in assets
2nd largest Texas based commercial bank by Texas deposits
Strong balance sheet growth – 10 year CAGR of 36% loans, 34% deposits and 36% assets
Strong earnings growth – 10 year CAGR of 14% for EPS (diluted) and 34% for net income
Shareholder driven with approximately 11% inside ownership
Excellent asset quality – Net Charge Offs / Average Loans of 0.10% for three months ending June 30, 2009
Excellent cost control – under 50% efficiency ratio
Since 2000, integrated over 20 successful acquisitions
3
2Q09 Highlights
Net Interest Margin was 4.04% for the three months ended June 30, 2009
Non- Performing Assets to Average Earning Assets equal 0.26% or $19.587 million
Strong Earnings of $26.510 million or $0.57 per share (diluted) and 1.20% Return on Assets for the three months ended June 30, 2009
Recorded additional FDIC assessment of approximately $4.2 million or $0.06 per diluted share
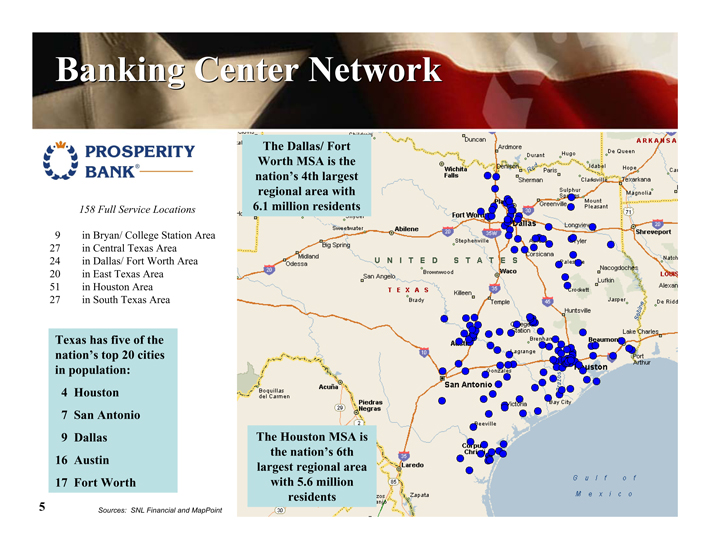
Banking Center Network
PROSPERITY
BANK®
158 Full Service Locations
9 in Bryan/ College Station Area
27 in Central Texas Area
24 in Dallas/ Fort Worth Area
20 in East Texas Area
51 in Houston Area
27 in South Texas Area
Texas has five of the nation’s top 20 cities in population:
4 Houston
7 San Antonio
9 Dallas
16 Austin
17 Fort Worth
The Dallas/ Fort Worth MSA is the nation’s 4th largest regional area with 6.1 million residents
The Houston MSA is the nation’s 6th largest regional area with 5.6 million residents
20
Odessa
Midland
Big Spring
Abilene Wichita Falls
Duncan
Ardmore
Denison
Durant
Sherman
Paris
Hugo
Idabel
Clarksville
De Queen
Hope
Texarkana
Arkansa
Magnolia
Mount Pleasant
30
Greenville
Sulphur Springs
Fort Worth
Dallas
20
Stephenville
35W
Corsicana
Waco
San Angelo
Brownwood
Texas
Brady
Killeen
Temple
Tyler
Nacogdoches
Lufkin
Crockett
Jasper
Huntsville
Station
Brenham
20
Shreveport
Natch
LOUIS
Alexan
De Ridd
Sabine
Lake Charles
Beaumont
Port Arthur
Houston
Lagrange
Gonzales
San Antonio
Victoria
Bay City
Beeville
Corpus
Boquillas del Carmen
Acuña
29
Piedras Negras
2
35
Laredo
85
Zapata
Gulf of Mexico
Sources: SNL Financial and MapPoint
5
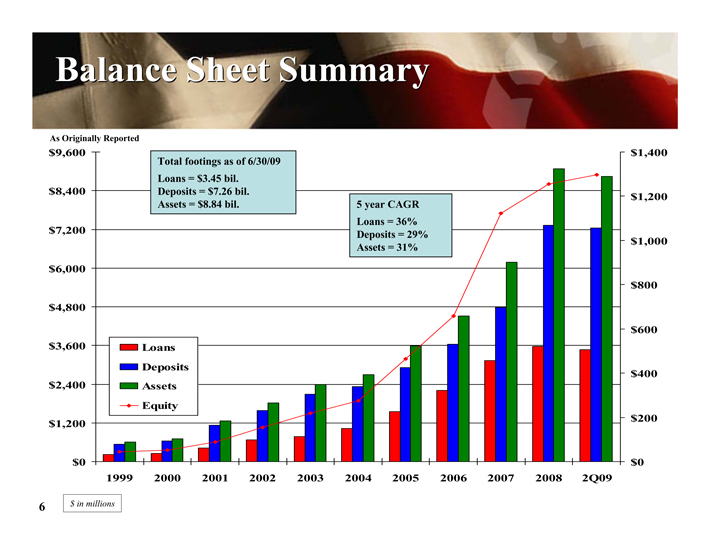
Balance Sheet Summary
As Originally Reported
$9,600 $8,400 $7,200 $6,000 $4,800 $3,600 $2,400 $1,200 $0
1999 2000 2001 2002 2003 2004 2005 2006 2007 2008 2Q09
$1,400 $1,200 $1,000 $800 $600 $400 $200 $0
Total footings as of 6/30/09 Loans = $3.45 bil.
Deposits = $7.26 bil. Assets = $8.84 bil.
5 year CAGR Loans = 36% Deposits = 29% Assets = 31%
Loans Deposits Assets Equity
$ in millions
6
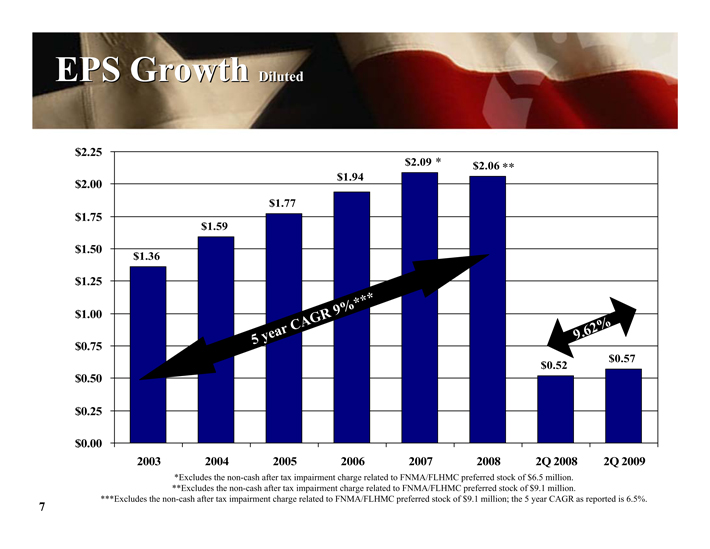
EPS Growth Diluted
$2.25 $2.00 $1.75 $1.50 $1.25 $1.00 $0.75 $0.50 $0.25 $0.00
2003 2004 2005 2006 2007 2008 2Q 2008 2Q 2009
$1.36
$1.59
$1.77
$1.94
$2.09 *
$2.06 **
5 year CAGR 9% ***
9.62 %
$0.52
$0.57
*Excludes the non-cash after tax impairment charge related to FNMA/FLHMC preferred stock of $6.5 million. **Excludes the non-cash after tax impairment charge related to FNMA/FLHMC preferred stock of $9.1 million.
***Excludes the non-cash after tax impairment charge related to FNMA/FLHMC preferred stock of $9.1 million; the 5 year CAGR as reported is 6.5%.
7
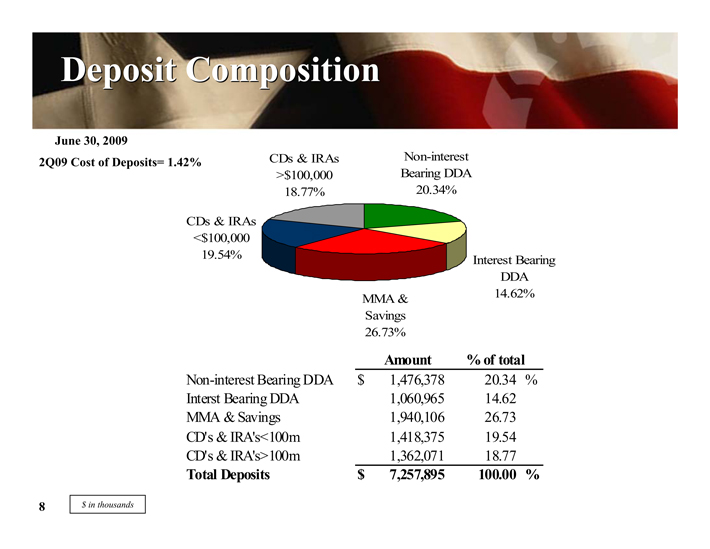
Deposit Composition
June 30, 2009
2Q09 Cost of Deposits= 1.42%
CDs & IRAs
>$100,000 18.77%
Non-interest Bearing DDA
20.34%
CDs & IRAs
<$100,000 19.54%
MMA & Savings 26.73%
Interest Bearing DDA
14.62%
Amount % of total
Non-interest Bearing DDA $ 1,476,378 20.34%
Interst Bearing DDA 1,060,965 14.62
MMA & Savings 1,940,106 26.73
CD’s & IRA’s<100m 1,418,375 19.54
CD’s & IRA’s>100m 1,362,071 18.77
Total Deposits $ 7,257,895 100.00%
$ in thousands
8
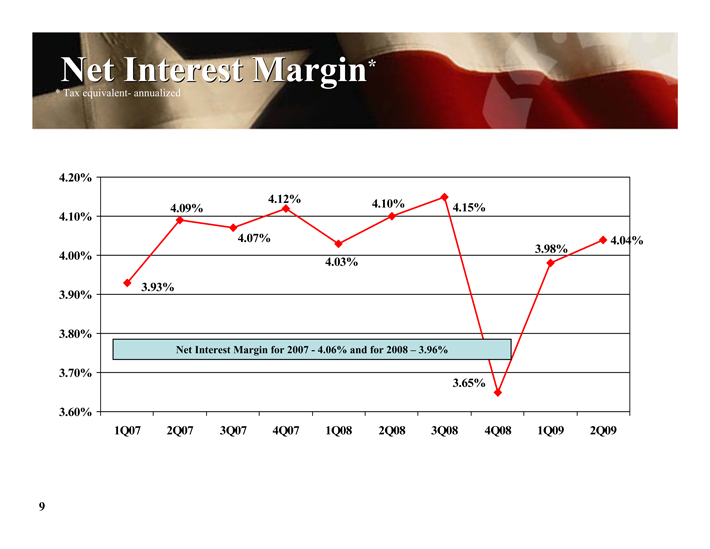
Net Interest Margin*
* Tax equivalent- annualized
4.20% 4.10% 4.00% 3.90% 3.80% 3.70% 3.60%
1Q07 2Q07 3Q07 4Q07 1Q08 2Q08 3Q08 4Q08 1Q09 2Q09
4.12% 4.10%
4.09% 4.15%
4.07% 3.98% 4.04% 4.03%
3.93%
3.65%
Net Interest Margin for 2007 - 4.06% and for 2008 – 3.96%
9
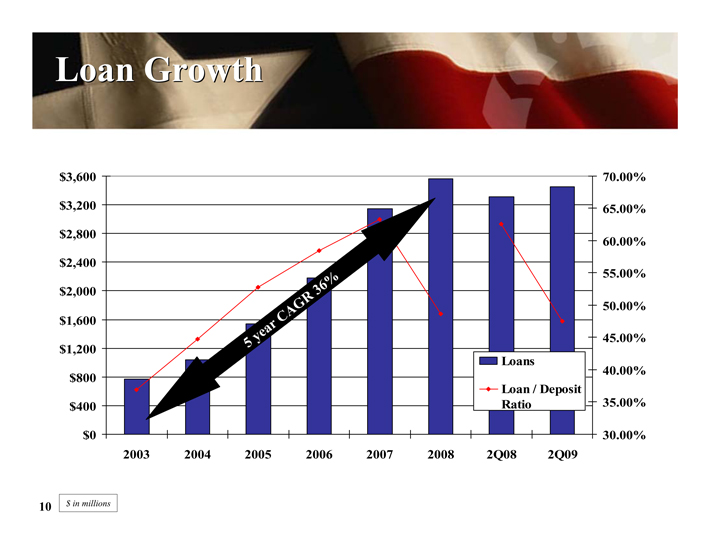
Loan Growth
$3,600 $3,200 $2,800 $2,400 $2,000 $1,600 $1,200 $800 $400 $0
70.00% 65.00% 60.00% 55.00% 50.00% 45.00% 40.00% 35.00% 30.00%
2003 2004 2005 2006 2007 2008 2Q08 2Q09
5 year CAGR 36%
Loans
Loan / Deposit Ratio
$ in millions
10
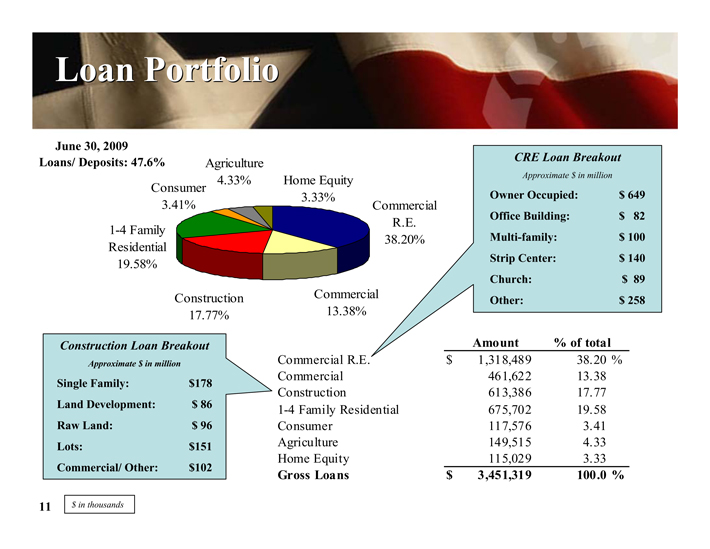
Loan Portfolio
June 30, 2009 Loans/ Deposits: 47.6%
Agriculture 4.33%
Consumer 3.41%
1-4 Family Residential 19.58%
Home Equity 3.33%
Commercial R.E. 38.20%
Construction 17.77%
Commercial 13.38%
Construction Loan Breakout
Approximate $ in million
Single Family: $178
Land Development: $ 86
Raw Land: $ 96
Lots: $151
Commercial/ Other: $102
Commercial R.E.
Commercial
Construction
1-4 Family Residential
Consumer
Agriculture
Home Equity
Gross Loans
CRE Loan Breakout
Approximate $ in million
Owner Occupied: $ 649
Office Building: $ 82
Multi-family: $ 100
Strip Center: $ 140
Church: $ 89
Other: $ 258
Amount % of total
$ 1,318,489 38.20%
461,622 13.38
613,386 17.77
675,702 19.58
117,576 3.41
149,515 4.33
115,029 3.33
$ 3,451,319 100.0 %
$ in thousands
11
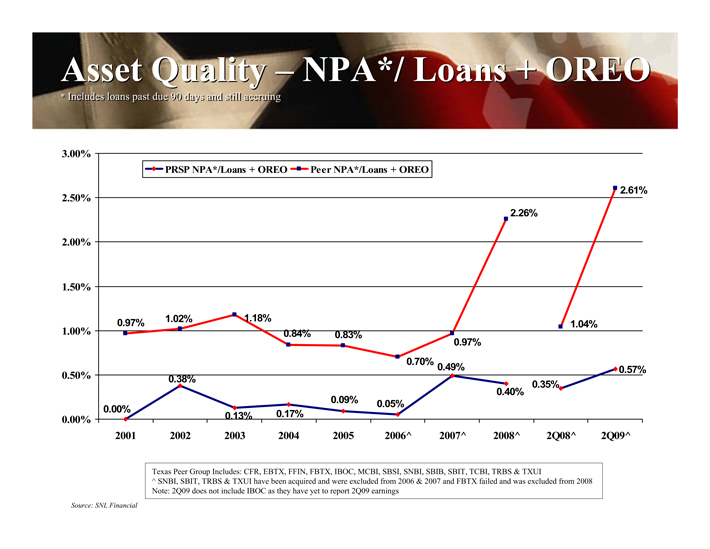
Asset Quality – NPA*/ Loans + OREO
* Includes loans past due 90 days and still accruing
3.00% 2.50% 2.00% 1.50% 1.00% 0.50% 0.00%
2001 2002 2003 2004 2005 2006^ 2007^ 2008^ 2Q08^ 2Q09^
PRSP NPA*/Loans + OREO Peer NPA*/Loans + OREO
2.61%
2.26%
1.02% 1.18%
0.97% 1.04% 0.84% 0.83% 0.97% 0.70%
0.49% 0.57% 0.38% 0.35% 0.40% 0.00% 0.09% 0.05% 0.13% 0.17%
Texas Peer Group Includes: CFR, EBTX, FFIN, FBTX, IBOC, MCBI, SBSI, SNBI, SBIB, SBIT, TCBI, TRBS & TXUI
^ SNBI, SBIT, TRBS & TXUI have been acquired and were excluded from 2006 & 2007 and FBTX failed and was excluded from 2008 Note: 2Q09 does not include IBOC as they have yet to report 2Q09 earnings
Source: SNL Financial
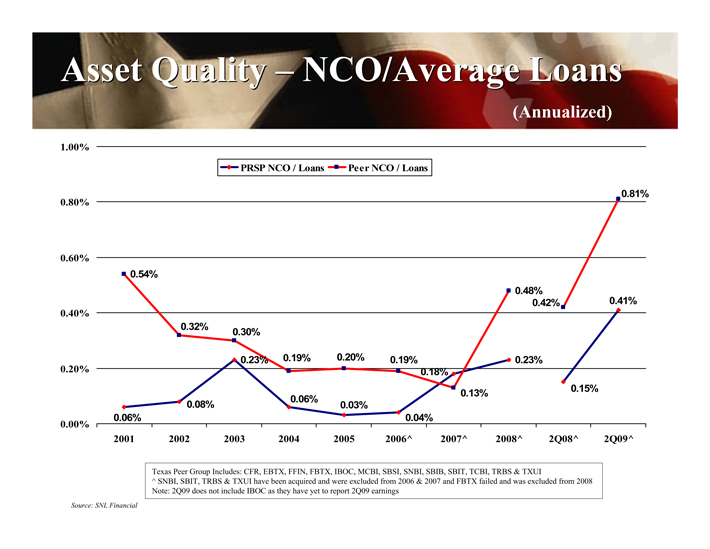
Asset Quality – NCO/Average Loans
(Annualized)
1.00%
PRSP NCO / Loans Peer NCO / Loans
0.80% 0.81%
0.60%
0.54%
0.48%
0.42% 0.41%
0.40%
0.32%
0.30%
0.23% 0.19% 0.20% 0.19% 0.23%
0.20% 0.18%
0.15% 0.13% 0.06% 0.08% 0.03% 0.06% 0.04%
0.00%
2001 2002 2003 2004 2005 2006^ 2007^ 2008^ 2Q08^ 2Q09^
Texas Peer Group Includes: CFR, EBTX, FFIN, FBTX, IBOC, MCBI, SBSI, SNBI, SBIB, SBIT, TCBI, TRBS & TXUI
^ SNBI, SBIT, TRBS & TXUI have been acquired and were excluded from 2006 & 2007 and FBTX failed and was excluded from 2008 Note: 2Q09 does not include IBOC as they have yet to report 2Q09 earnings
Source: SNL Financial
Contact Information
Corporate Headquarters Investor Contacts
Prosperity Bank Plaza David Zalman
4295 San Felipe Chairman & Chief Executive Officer
Houston, Texas 77027 979.543.2200
david.zalman@prosperitybanktx.com
281.269.7199 Telephone Dan Rollins
281.269-7222 Fax President & Chief Operating Officer
www.prosperitybanktx.com 281.269.7199
dan.rollins@prosperitybanktx.com
David Hollaway
Chief Financial Officer
979.543.2200
david.hollaway@prosperitybanktx.com
14

2nd Quarter 2009 Earnings
Supplemental
Data
16
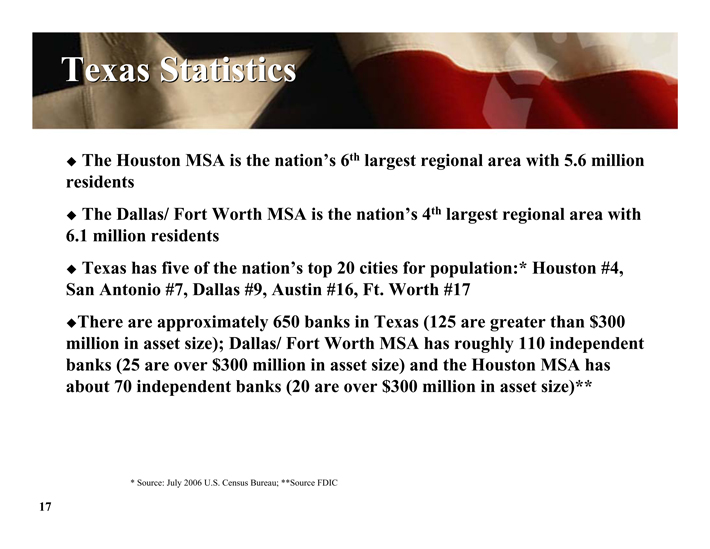
Texas Statistics
The Houston MSA is the nation’s 6th largest regional area with 5.6 million residents
The Dallas/ Fort Worth MSA is the nation’s 4th largest regional area with 6.1 million residents
Texas has five of the nation’s top 20 cities for population:* Houston #4, San Antonio #7, Dallas #9, Austin #16, Ft. Worth #17
There are approximately 650 banks in Texas (125 are greater than $300 million in asset size); Dallas/ Fort Worth MSA has roughly 110 independent banks (25 are over $300 million in asset size) and the Houston MSA has about 70 independent banks (20 are over $300 million in asset size)**
* Source: July 2006 U.S. Census Bureau; **Source FDIC
17
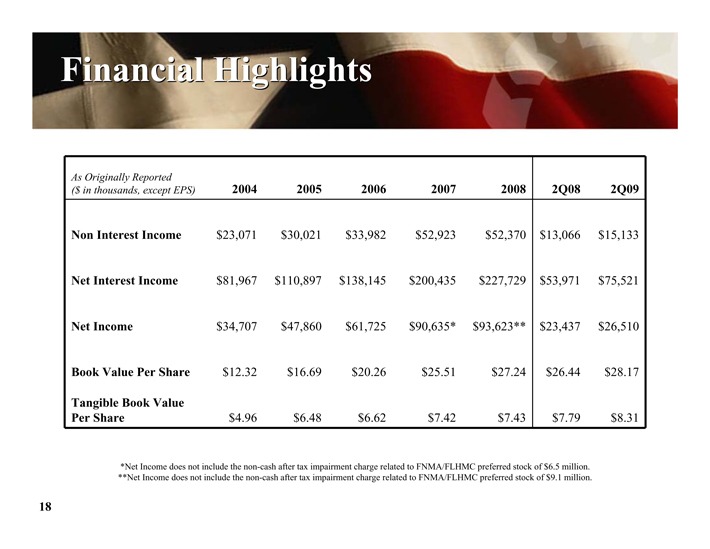
Financial Highlights
As Originally Reported
($ in thousands, except EPS) 2004 2005 2006 2007 2008 2Q08 2Q09
Non Interest Income $23,071 $30,021 $33,982 $52,923 $52,370 $13,066 $15,133
Net Interest Income $81,967 $110,897 $138,145 $200,435 $227,729 $53,971 $75,521
Net Income $34,707 $47,860 $61,725 $90,635* $93,623** $23,437 $26,510
Book Value Per Share $12.32 $16.69 $20.26 $25.51 $27.24 $26.44 $28.17
Tangible Book Value
Per Share $4.96 $6.48 $6.62 $7.42 $7.43 $7.79 $8.31
*Net Income does not include the non-cash after tax impairment charge related to FNMA/FLHMC preferred stock of $6.5 million. **Net Income does not include the non-cash after tax impairment charge related to FNMA/FLHMC preferred stock of $9.1 million.
18
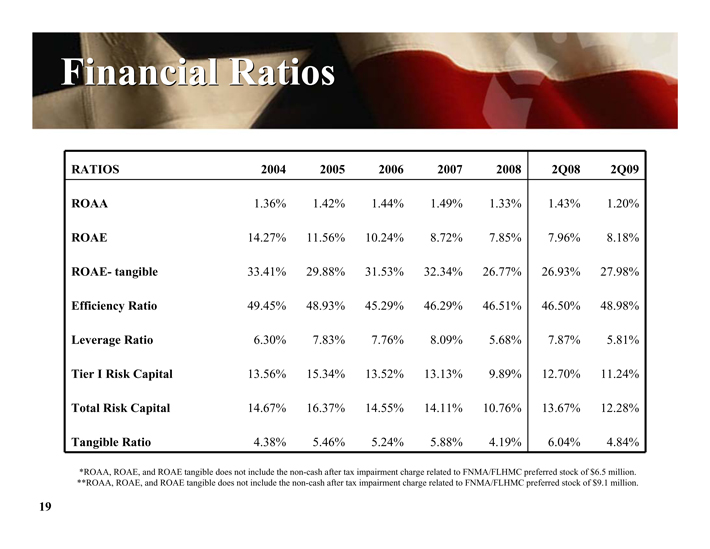
Financial Ratios
RATIOS 2004 2005 2006 2007 2008 2Q08 2Q09
ROAA 1.36% 1.42% 1.44% 1.49% 1.33% 1.43% 1.20%
ROAE 14.27% 11.56% 10.24% 8.72% 7.85% 7.96% 8.18%
ROAE- tangible 33.41% 29.88% 31.53% 32.34% 26.77% 26.93% 27.98%
Efficiency Ratio 49.45% 48.93% 45.29% 46.29% 46.51% 46.50% 48.98%
Leverage Ratio 6.30% 7.83% 7.76% 8.09% 5.68% 7.87% 5.81%
Tier I Risk Capital 13.56% 15.34% 13.52% 13.13% 9.89% 12.70% 11.24%
Total Risk Capital 14.67% 16.37% 14.55% 14.11% 10.76% 13.67% 12.28%
Tangible Ratio 4.38% 5.46% 5.24% 5.88% 4.19% 6.04% 4.84%
*ROAA, ROAE, and ROAE tangible does not include the non-cash after tax impairment charge related to FNMA/FLHMC preferred stock of $6.5 million.
**ROAA, ROAE, and ROAE tangible does not include the non-cash after tax impairment charge related to FNMA/FLHMC preferred stock of $9.1 million.
19
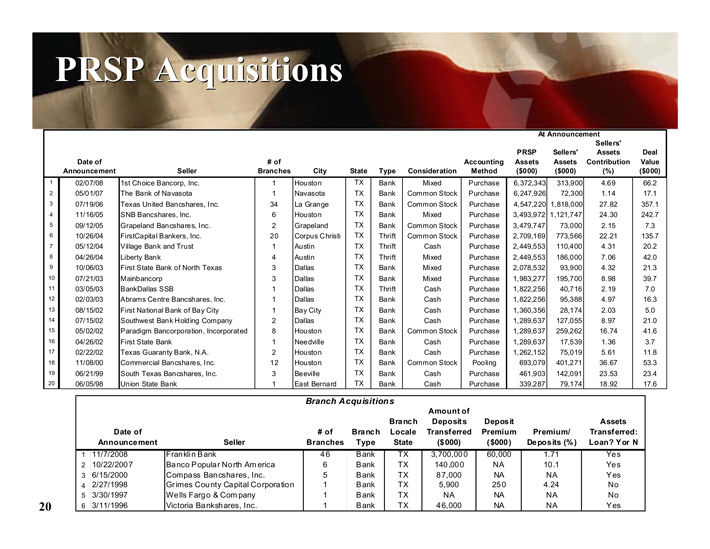
PRSP Acquisitions
At Announcement
Sellers’
PRSP Sellers’ Assets Deal
Date of # of Accounting Assets Assets Contribution Value
Announcement Seller Branches City State Type Consideration Method ($000) ($000) (%) ($000)
1 02/07/08 1st Choice Bancorp, Inc. 1 Houston TX Bank Mixed Purchase 6,372,343 313,900 4.69 66.2
2 05/01/07 The Bank of Navasota 1 Navasota TX Bank Common Stock Purchase 6,247,926 72,300 1.14 17.1
3 07/19/06 Texas United Bancshares, Inc. 34 La Grange TX Bank Common Stock Purchase 4,547,220 1,818,000 27.82 357.1
4 11/16/05 SNB Bancshares, Inc. 6 Houston TX Bank Mixed Purchase 3,493,972 1,121,747 24.30 242.7
5 09/12/05 Grapeland Bancshares, Inc. 2 Grapeland TX Bank Common Stock Purchase 3,479,747 73,000 2.15 7.3
6 10/26/04 FirstCapital Bankers, Inc. 20 Corpus Christi TX Thrift Common Stock Purchase 2,709,169 773,566 22.21 135.7
7 05/12/04 Village Bank and Trust 1 Austin TX Thrift Cash Purchase 2,449,553 110,400 4.31 20.2
8 04/26/04 Liberty Bank 4 Austin TX Thrift Mixed Purchase 2,449,553 186,000 7.06 42.0
9 10/06/03 First State Bank of North Texas 3 Dallas TX Bank Mixed Purchase 2,078,532 93,900 4.32 21.3
10 07/21/03 Mainbancorp 3 Dallas TX Bank Mixed Purchase 1,983,277 195,700 8.98 39.7
11 03/05/03 BankDallas SSB 1 Dallas TX Thrift Cash Purchase 1,822,256 40,716 2.19 7.0
12 02/03/03 Abrams Centre Bancshares, Inc. 1 Dallas TX Bank Cash Purchase 1,822,256 95,388 4.97 16.3
13 08/15/02 First National Bank of Bay City 1 Bay City TX Bank Cash Purchase 1,360,356 28,174 2.03 5.0
14 07/15/02 Southwest Bank Holding Company 2 Dallas TX Bank Cash Purchase 1,289,637 127,055 8.97 21.0
15 05/02/02 Paradigm Bancorporation, Incorporated 8 Houston TX Bank Common Stock Purchase 1,289,637 259,262 16.74 41.6
16 04/26/02 First State Bank 1 Needville TX Bank Cash Purchase 1,289,637 17,539 1.36 3.7
17 02/22/02 Texas Guaranty Bank, N.A. 2 Houston TX Bank Cash Purchase 1,262,152 75,019 5.61 11.8
18 11/08/00 Commercial Bancshares, Inc. 12 Houston TX Bank Common Stock Pooling 693,079 401,271 36.67 53.3
19 06/21/99 South Texas Bancshares, Inc. 3 Beeville TX Bank Cash Purchase 461,903 142,091 23.53 23.4
20 06/05/98 Union State Bank 1 East Bernard TX Bank Cash Purchase 339,287 79,174 18.92 17.6
Branch Acquisitions
Amount of
Branch Deposits Deposit Assets
Date of # of Branch Locale Transferred Premium Premium/ Transferred:
Announcement Seller Branches Type State ($000) ($000) Deposits (%) Loan? Y or N
1 11/7/2008 Franklin Bank 46 Bank TX 3,700,000 60,000 1.71 Yes
2 10/22/2007 Banco Popular North America 6 Bank TX 140,000 NA 10.1 Yes
3 6/15/2000 Compass Bancshares, Inc. 5 Bank TX 87,000 NA NA Yes
4 2/27/1998 Grimes County Capital Corporation 1 Bank TX 5,900 250 4.24 No
5 3/30/1997 Wells Fargo & Company 1 Bank TX NA NA NA No
6 3/11/1996 Victoria Bankshares, Inc. 1 Bank TX 46,000 NA NA Yes
20
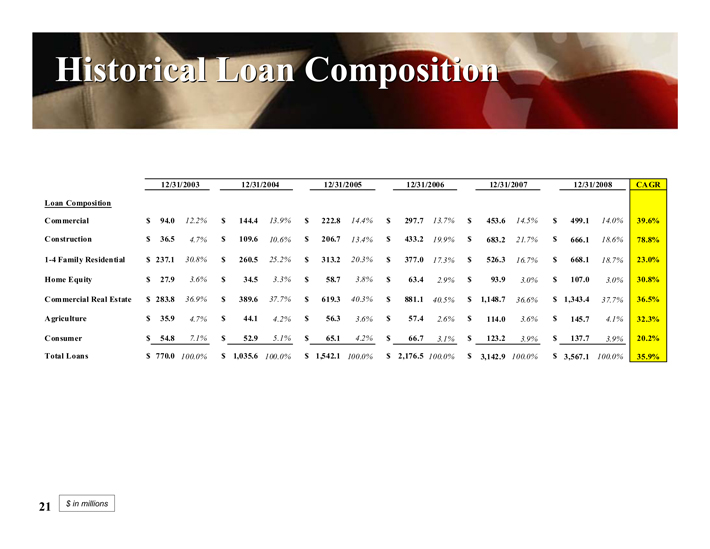
Historical Loan Composition
12/31/2003 12/31/2004 12/31/2005 12/31/2006 12/31/2007 12/31/2008 CAGR
Loan Composition
Commercial $ 94.0 12.2% $ 144.4 13.9% $ 222.8 14.4% $ 297.7 13.7% $ 453.6 14.5% $ 499.1 14.0% 39.6%
Construction $ 36.5 4.7% $ 109.6 10.6% $ 206.7 13.4% $ 433.2 19.9% $ 683.2 21.7% $ 666.1 18.6% 78.8%
1-4 Family Residential $ 237.1 30.8% $ 260.5 25.2% $ 313.2 20.3% $ 377.0 17.3% $ 526.3 16.7% $ 668.1 18.7% 23.0%
Home Equity $ 27.9 3.6% $ 34.5 3.3% $ 58.7 3.8% $ 63.4 2.9% $ 93.9 3.0% $ 107.0 3.0% 30.8%
Commercial Real Estate $ 283.8 36.9% $ 389.6 37.7% $ 619.3 40.3% $ 881.1 40.5% $ 1,148.7 36.6% $ 1,343.4 37.7% 36.5%
Agriculture $ 35.9 4.7% $ 44.1 4.2% $ 56.3 3.6% $ 57.4 2.6% $ 114.0 3.6% $ 145.7 4.1% 32.3%
Consumer $ 54.8 7.1% $ 52.9 5.1% $ 65.1 4.2% $ 66.7 3.1% $ 123.2 3.9% $ 137.7 3.9% 20.2%
Total Loans $ 770.0 100.0% $ 1,035.6 100.0% $ 1,542.1 100.0% $ 2,176.5 100.0% $ 3,142.9 100.0% $ 3,567.1 100.0% 35.9%
$ in millions
21

2nd Quarter 2009 Earnings