EXHIBIT 99.1 |
2 “Safe Harbor” Statement “Safe Harbor” Statement under the Private Securities Litigation Reform Act of 1995 Statements contained in this presentation which are not historical facts and which pertain to future operating results of Prosperity Bank and its subsidiaries constitute “forward-looking statements” within the meaning of the Private Securities Litigation reform Act of 1995. These forward-looking statements involve significant risks and uncertainties. Actual results may differ materially from the results discussed in these forward-looking statements. Factors that might cause such a difference include, but are not limited to, those discussed in the company’s periodic filings with the SEC. Copies of the SEC filings for Prosperity Bancshares ® may be downloaded from the Internet at no charge from www.prosperitybanktx.com. |
3 Corporate Profile Corporate Profile A Texas based Financial Holding Company with approximately $9 billion in assets 2 largest Texas based commercial bank by Texas deposits Strong balance sheet growth – 10 year CAGR of 36% loans, 34% deposits and 36% assets Strong earnings growth – 10 year CAGR of 14% for EPS (diluted) and 34% for net income Shareholder driven with approximately 11% inside ownership Excellent asset quality – Net Charge Offs / Average Loans of 0.07% for three months ending September 30, 2009 Excellent cost control – under 50% efficiency ratio Since 2000, integrated over 20 successful acquisitions a Track Record of Success nd |
4 3Q09 Highlights 3Q09 Highlights Net Interest Margin was 4.08% for the three months ended September 30, 2009 Non- Performing Assets to Average Earning Assets remain low at 0.29% or $21.920 million Strong Earnings of $29.322 million or $0.63 per share (diluted) and 1.32% Return on Assets for the three months ended September 30, 2009 Tangible Common Equity Ratio increases 29 basis points to 5.13% |
5 Banking Center Network Banking Center Network Sources: SNL Financial and MapPoint Texas has five of the nation’s top 20 cities in population: 4 Houston 7 San Antonio 9 Dallas 16 Austin 17 Fort Worth 158 Full Service Locations 9 in Bryan/ College Station Area 27 in Central Texas Area 24 in Dallas/ Fort Worth Area 20 in East Texas Area 51 in Houston Area 27 in South Texas Area The Houston MSA is the nation’s 6th largest regional area with 5.6 million residents The Dallas/ Fort Worth MSA is the nation’s 4th largest regional area with 6.1 million residents |
6 Balance Sheet Summary Balance Sheet Summary $0 $1,200 $2,400 $3,600 $4,800 $6,000 $7,200 $8,400 $9,600 1999 2000 2001 2002 2003 2004 2005 2006 2007 2008 3Q09 $0 $200 $400 $600 $800 $1,000 $1,200 $1,400 Loans Deposits Assets Equity As Originally Reported $ in millions Total footings as of 9/30/09 Loans = $3.41 bil. Deposits = $7.12 bil. Assets = $8.96 bil. 5 year CAGR Loans = 36% Deposits = 29% Assets = 31% |
7 $1.36 $1.59 $1.77 $2.09 $2.06 $0.53 $0.63 $1.94 $0.00 $0.25 $0.50 $0.75 $1.00 $1.25 $1.50 $1.75 $2.00 $2.25 2003 2004 2005 2006 2007 2008 3Q 2008 3Q 2009 EPS Growth Diluted EPS Growth Diluted *Excludes the non-cash after tax impairment charge related to FNMA/FLHMC preferred stock of $6.5 million. **Excludes the non-cash after tax impairment charge related to FNMA/FLHMC preferred stock of $9.1 million. ***Excludes the non-cash after tax impairment charge related to FNMA/FLHMC preferred stock of $9.1 million; the 5 year CAGR as reported is 6.5%. * ** ** |
8 Deposit Composition Deposit Composition Non-interest Bearing DDA 20.70% MMA & Savings 28.13% Interest Bearing DDA 14.99% CDs & IRAs <$100,000 18.11% CDs & IRAs >$100,000 18.07% $ in thousands 3Q09 Cost of Deposits= 1.26% September 30, 2009 Amount Non-interest Bearing DDA $ 1,473,189 20.70 % Interst Bearing DDA 1,066,778 14.99 MMA & Savings 2,002,423 28.13 CD's & IRA's<100m 1,289,362 18.11 CD's & IRA's>100m 1,286,241 18.07 Total Deposits $ 7,117,993 100.00 % % of total |
9 Net Interest Margin * Net Interest Margin * 4.04% 4.08% 3.98% 3.65% 4.15% 4.10% 4.12% 4.07% 4.09% 4.03% 3.93% 3.60% 3.70% 3.80% 3.90% 4.00% 4.10% 4.20% 1Q07 2Q07 3Q07 4Q07 1Q08 2Q08 3Q08 4Q08 1Q09 2Q09 3Q09 Net Interest Margin for 2007 - 4.06% and for 2008 – 3.96% * Tax equivalent - annualized |
$0 $400 $800 $1,200 $1,600 $2,000 $2,400 $2,800 $3,200 $3,600 2003 2004 2005 2006 2007 2008 3Q08 3Q09 30.00% 35.00% 40.00% 45.00% 50.00% 55.00% 60.00% 65.00% 70.00% Loans Loan / Deposit Ratio 10 Loan Growth Loan Growth $ in millions |
11 Loan Portfolio Loan Portfolio Home Equity 3% Agriculture 4% Consumer 3% 1-4 Family Residential 20% Commercial 13% Construction 17% Commercial R.E. 39.25% $ in thousands Loans/ Deposits: 47.6% September 30, 2009 Construction Loan Breakout Approximate $ in million Single Family: Land Development: Raw Land: Lots: Commercial/ Other: CRE Loan Breakout Approximate $ in million Owner Occupied: $616 Office Building: $82 Multi-family: $74 Strip Center: $152 Church: $87 Other: $325 Amount Commercial R.E. $ 1,336,454 39.25 % Commercial 439,848 12.91 Construction 564,106 16.56 1-4 Family Residential 692,885 20.34 Consumer 110,795 3.25 Agriculture 145,176 4.26 Home Equity 116,873 3.43 Gross Loans $ 3,406,137 100.0 % % of total $152 $77 $84 $151 $99 |
Asset Quality – NPA*/ Loans + OREO * Includes loans past due 90 days and still accruing Asset Quality – NPA*/ Loans + OREO * Includes loans past due 90 days and still accruing Source: SNL Financial Texas Peer Group Includes: CFR, EBTX, FFIN, FBTX, IBOC, MCBI, SBSI, SNBI, SBIB, SBIT, TCBI, TRBS & TXUI ^ SNBI, SBIT, TRBS & TXUI have been acquired and were excluded from 2006 & 2007 and FBTX failed and was excluded from 2008 Note: 3Q09 does not include IBOC as they have yet to report 3Q09 earnings 12 0.40% 0.49% 0.05% 0.09% 0.17% 0.13% 0.38% 0.00% 0.64% 0.45% 2.26% 1.18% 0.84% 1.02% 0.97% 0.83% 0.70% 0.97% 1.46% 3.22% 0.00% 0.50% 1.00% 1.50% 2.00% 2.50% 3.00% 3.50% 2001 2002 2003 2004 2005 2006^ 2007^ 2008^ 3Q08^ 3Q09^ PRSP NPA*/Loans + OREO Peer NPA*/Loans + OREO |
Asset Quality – NCO/Average Loans Asset Quality – NCO/Average Loans 0.23% 0.54% 0.06% 0.08% 0.06% 0.03% 0.04% 0.18% 0.23% 0.22% 0.30% 0.32% 0.30% 0.19% 0.20% 0.19% 0.13% 0.48% 0.44% 1.13% 0.00% 0.20% 0.40% 0.60% 0.80% 1.00% 1.20% 2001 2002 2003 2004 2005 2006^ 2007^ 2008^ 3Q08^ 3Q09^ PRSP NCO / Loans Peer NCO / Loans Source: SNL Financial Texas Peer Group Includes: CFR, EBTX, FFIN, FBTX, IBOC, MCBI, SBSI, SNBI, SBIB, SBIT, TCBI, TRBS & TXUI ^ SNBI, SBIT, TRBS & TXUI have been acquired and were excluded from 2006 & 2007 and FBTX failed and was excluded from 2008 Note: 3Q09 does not include IBOC as they have yet to report 3Q09 earnings (Annualized) 13 |
14 Contact Information Contact Information Corporate Headquarters Investor Contacts Prosperity Bank Plaza David Zalman 4295 San Felipe Chairman & Chief Executive Officer Houston, Texas 77027 979.543.2200 281.269.7199 Telephone Dan Rollins 281.269-7222 Fax President & Chief Operating Officer 281.269.7199 David Hollaway Chief Financial Officer 979.543.2200 david.zalman@prosperitybanktx.com www.prosperitybanktx.com dan.rollins@prosperitybanktx.com david.hollaway@prosperitybanktx.com |
3rd Quarter 2009 Earnings |
16 Financial Highlights Financial Highlights *ROAA, ROAE, and ROAE tangible does not include the non-cash after tax impairment charge related to FNMA/FLHMC preferred stock of $6.5 million. **ROAA, ROAE, and ROAE tangible does not include the non-cash after tax impairment charge related to FNMA/FLHMC preferred stock of $9.1 million. As Originally Reported ($ in thousands, except EPS) 2004 2005 2006 2007 2008 3Q08 3Q09 Non Interest Income $23,071 $30,021 $33,982 $52,923 $52,370 $13,117 $15,236 Net Interest Income $81,967 $110,897 $138,145 $200,435 $227,729 $57,806 $77,413 Net Income $34,707 $47,860 $61,725 $90,635* $93,623** $24,563** $29,322 Book Value Per Share $12.32 $16.69 $20.26 $25.54 $27.24 $26.68 $28.75 Tangible Book Value Per Share $4.96 $6.48 $6.62 $7.42 $7.43 $8.08 $8.93 ROAA 1.36% 1.42% 1.49% 1.49% 1.33% 1.44%** 1.32% ROAE 14.27% 11.56% 10.24% 8.72% 7.85% 8.02%** 8.93% ROAE- tangible 33.41% 29.88% 31.53% 32.34% 26.77% 26.76%** 29.34% Efficiency Ratio 49.45% 48.93% 45.29% 46.29% 46.51% 45.43% 44.46% Leverage Ratio 6.30% 7.83% 7.76% 8.09% 5.68% 7.75% 6.09% Tier I Risk Capital 13.56% 15.34% 13.52% 13.13% 9.89% 12.71% 11.85% Total Risk Capital 14.67% 16.37% 14.55% 14.11% 10.76% 13.65% 13.01% Tangible Ratio 4.38% 5.46% 5.24% 5.88% 4.19% 6.28% 5.13% |
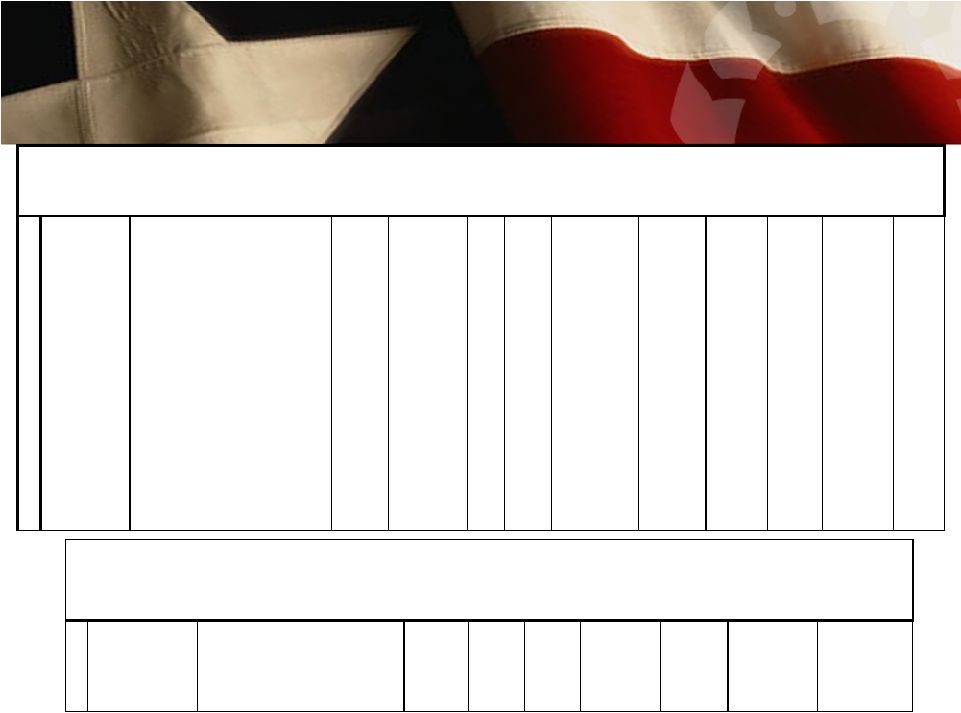
17 PRSP Acquisitions PRSP Acquisitions Branch Acquisitions Date of Announcement Seller # of Branches Branch Type Branch Locale State Amount of Deposits Transferred ($000) Deposit Premium ($000) Premium/ Deposits (%) Assets Transferred: Loan? Yor N 1 11/7/2008 Franklin Bank 46 Bank TX 3,700,000 60,000 1.71 Yes 2 10/22/2007 Banco Popular North America 6 Bank TX 140,000 NA 10.1 Yes 3 6/15/2000 Compass Bancshares, Inc. 5 Bank TX 87,000 NA NA Yes 4 2/27/1998 Grimes County Capital Corporation 1 Bank TX 5,900 250 4.24 No 5 3/30/1997 Wells Fargo & Company 1 Bank TX NA NA NA No 6 3/11/1996 Victoria Bankshares, Inc. 1 Bank TX 46,000 NA NA Yes Date of Announcement Seller # of Branches City State Type Consideration Accounting Method PRSP Assets ($000) Sellers' Assets ($000) Sellers' Assets Contribution (%) Deal Value ($000) 1 02/07/08 1st Choice Bancorp, Inc. 1 Houston TX Bank Mixed Purchase 6,372,343 313,900 4.69 66.2 2 05/01/07 The Bank of Navasota 1 Navasota TX Bank Common Stock Purchase 6,247,926 72,300 1.14 17.1 3 07/19/06 Texas United Bancshares, Inc. 34 La Grange TX Bank Common Stock Purchase 4,547,220 1,818,000 27.82 357.1 4 11/16/05 SNB Bancshares, Inc. 6 Houston TX Bank Mixed Purchase 3,493,972 1,121,747 24.30 242.7 5 09/12/05 Grapeland Bancshares, Inc. 2 Grapeland TX Bank Common Stock Purchase 3,479,747 73,000 2.15 7.3 6 10/26/04 FirstCapital Bankers, Inc. 20 Corpus Christi TX Thrift Common Stock Purchase 2,709,169 773,566 22.21 135.7 7 05/12/04 Village Bank and Trust 1 Austin TX Thrift Cash Purchase 2,449,553 110,400 4.31 20.2 8 04/26/04 Liberty Bank 4 Austin TX Thrift Mixed Purchase 2,449,553 186,000 7.06 42.0 9 10/06/03 First State Bank of North Texas 3 Dallas TX Bank Mixed Purchase 2,078,532 93,900 4.32 21.3 10 07/21/03 Mainbancorp 3 Dallas TX Bank Mixed Purchase 1,983,277 195,700 8.98 39.7 11 03/05/03 BankDallas SSB 1 Dallas TX Thrift Cash Purchase 1,822,256 40,716 2.19 7.0 12 02/03/03 Abrams Centre Bancshares, Inc. 1 Dallas TX Bank Cash Purchase 1,822,256 95,388 4.97 16.3 13 08/15/02 First National Bank of Bay City 1 Bay City TX Bank Cash Purchase 1,360,356 28,174 2.03 5.0 14 07/15/02 Southwest Bank Holding Company 2 Dallas TX Bank Cash Purchase 1,289,637 127,055 8.97 21.0 15 05/02/02 Paradigm Bancorporation, Incorporated 8 Houston TX Bank Common Stock Purchase 1,289,637 259,262 16.74 41.6 16 04/26/02 First State Bank 1 Needville TX Bank Cash Purchase 1,289,637 17,539 1.36 3.7 17 02/22/02 Texas Guaranty Bank, N.A. 2 Houston TX Bank Cash Purchase 1,262,152 75,019 5.61 11.8 18 11/08/00 Commercial Bancshares, Inc. 12 Houston TX Bank Common Stock Pooling 693,079 401,271 36.67 53.3 19 06/21/99 South Texas Bancshares, Inc. 3 Beeville TX Bank Cash Purchase 461,903 142,091 23.53 23.4 20 06/05/98 Union State Bank 1 East Bernard TX Bank Cash Purchase 339,287 79,174 18.92 17.6 At Announcement |
18 Historical Loan Composition Historical Loan Composition $ in millions CAGR Loan Composition Commercial $ 94.0 12.2% $ 144.4 13.9% $ 222.8 14.4% $ 297.7 13.7% $ 453.6 14.5% $ 499.1 14.0% 39.6% Construction $ 36.5 4.7% $ 109.6 10.6% $ 206.7 13.4% $ 433.2 19.9% $ 683.2 21.7% $ 666.1 18.6% 78.8% 1-4 Family Residential $ 237.1 30.8% $ 260.5 25.2% $ 313.2 20.3% $ 377.0 17.3% $ 526.3 16.7% $ 668.1 18.7% 23.0% Home Equity $ 27.9 3.6% $ 34.5 3.3% $ 58.7 3.8% $ 63.4 2.9% $ 93.9 3.0% $ 107.0 3.0% 30.8% Commercial Real Estate $ 283.8 36.9% $ 389.6 37.7% $ 619.3 40.3% $ 881.1 40.5% $ 1,148.7 36.6% $ 1,343.4 37.7% 36.5% Agriculture $ 35.9 4.7% $ 44.1 4.2% $ 56.3 3.6% $ 57.4 2.6% $ 114.0 3.6% $ 145.7 4.1% 32.3% Consumer $ 54.8 7.1% $ 52.9 5.1% $ 65.1 4.2% $ 66.7 3.1% $ 123.2 3.9% $ 137.7 3.9% 20.2% Total Loans $ 770.0 100.0% $ 1,035.6 100.0% $ 1,542.1 100.0% $ 2,176.5 100.0% $ 3,142.9 100.0% $ 3,567.1 100.0% 35.9% 12/31/2008 12/31/2007 12/31/2006 12/31/2003 12/31/2004 12/31/2005 |
3rd Quarter 2009 Earnings |