Exhibit 99.1
Statements contained in this presentation which are not historical facts and which pertain to future operating results of Prosperity Bank and its subsidiaries constitute “forward-looking statements” within the meaning of the Private Securities Litigation reform Act of 1995. These forward-looking statements involve significant risks and uncertainties. Actual results may differ materially from the results discussed in these forward-looking statements. Factors that might cause such a difference include, but are not limited to, those discussed in the company’s periodic filings with the SEC. Copies of the SEC filings for Prosperity Bancshares® may be downloaded from the Internet at no charge from www.prosperitybanktx.com.
2
a Track Record of Success
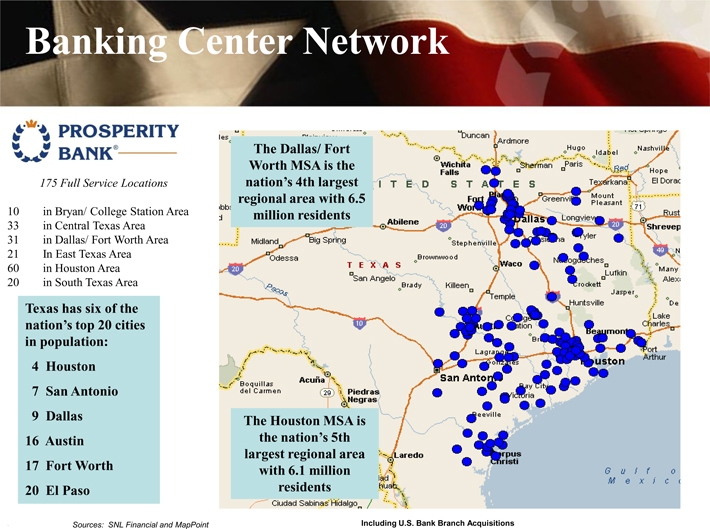
| • | | A Texas based Financial Holding Company with approximately $10 billion in assets |
| • | | 3rd largest Texas based commercial bank by Texas deposits |
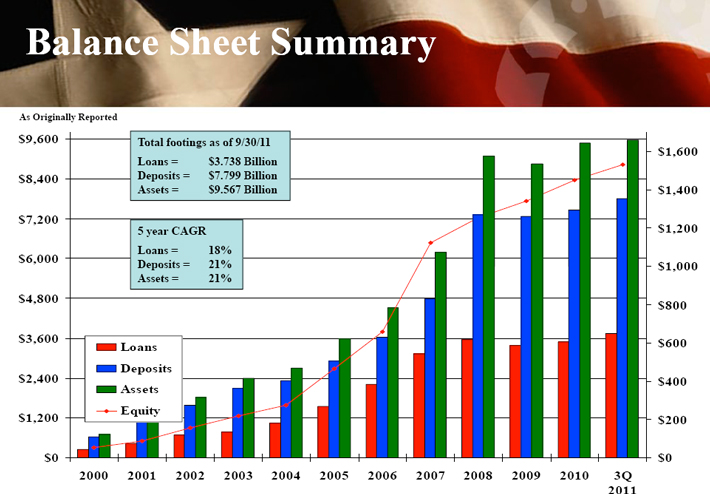
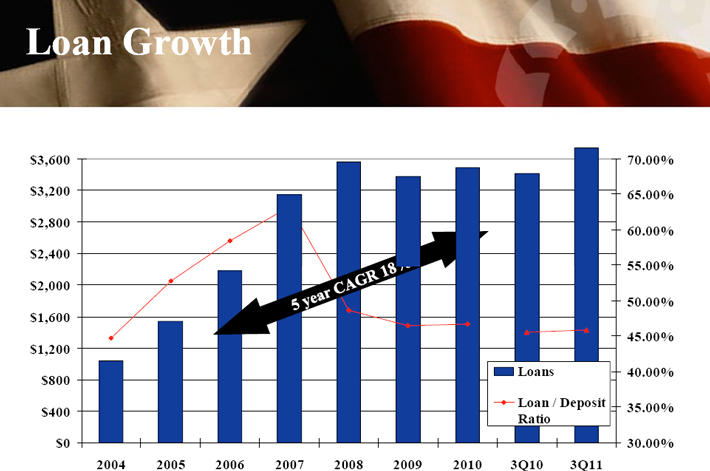
| • | | Strong balance sheet growth – 10 year CAGR of 30% loans, 28% deposits and 30% assets |
| • | | Strong earnings growth – 10 year CAGR of 14% for EPS (diluted) and 32% for net income |
| • | | Shareholder driven with approximately 9% inside ownership |
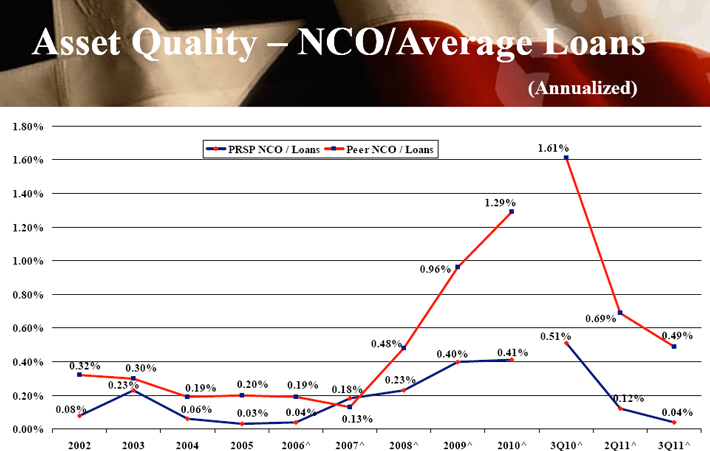
| • | | Excellent asset quality – Net Charge Offs / Average Loans of 0.01% for three months ending September 30, 2011 |
| • | | Excellent cost control – under 50% efficiency ratio |
| • | | Since 2000, integrated over 20 successful acquisitions |
3
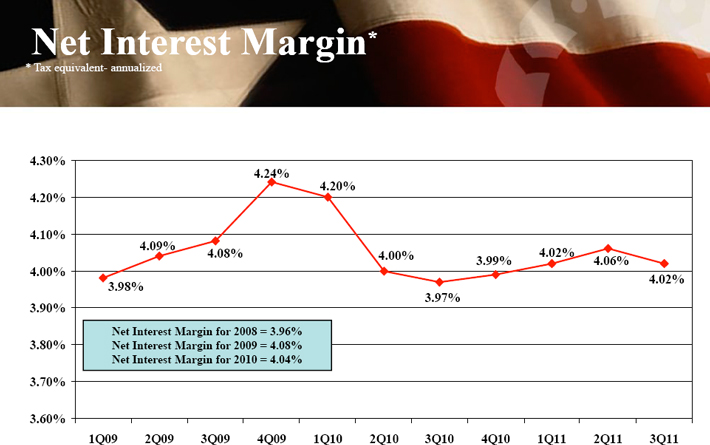
| • | | Net Interest Margin was 4.02% for the third quarter 2011 |
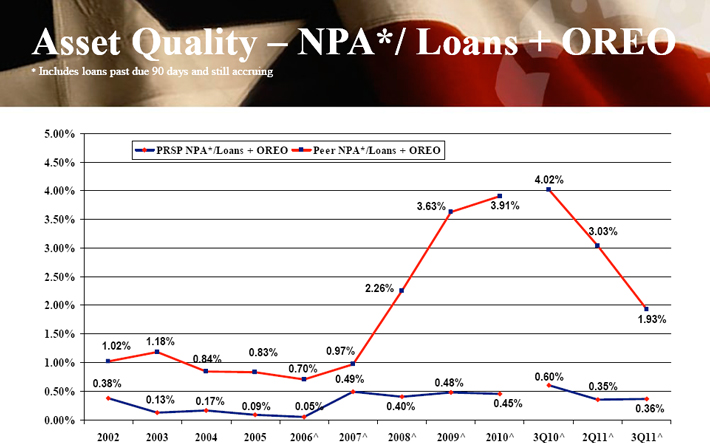
| • | | Non- Performing Assets to Average Earning Assets remain low at 0.16% or $13.363 million |
| • | | Strong Earnings of $36.373 million or $0.77 per share (diluted) and 1.52% Return on Assets for the third quarter 2011 |
| • | | Tangible Common Equity Ratio improved to 6.89% at September 30, 2011 |
4
5
| | | | |
| U.S. Bureau of Labor Statistics | | | | |
| | |
| www.texaswideopenforbusiness.com | | | | |
6
| | | | |
| U.S. Bureau of Labor Statistics | | | | |
| | |
| www.texaswideopenforbusiness.com | | | | |
7
| | | | |
| U.S. Bureau of Labor Statistics | | | | |
| | |
| www.texaswideopenforbusiness.com | | | | |
8
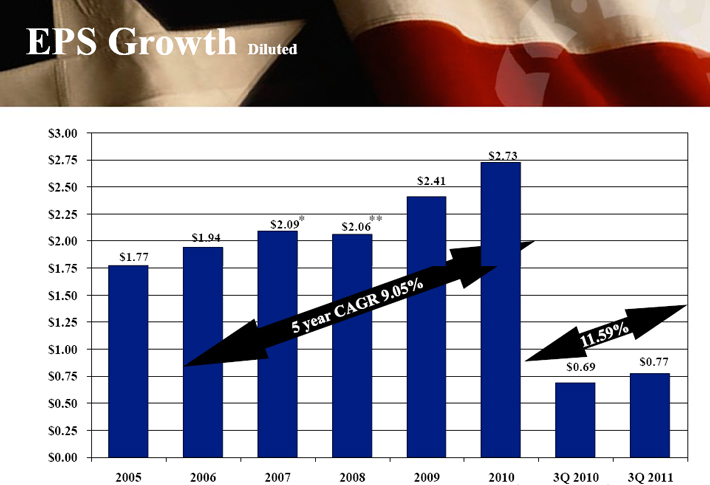
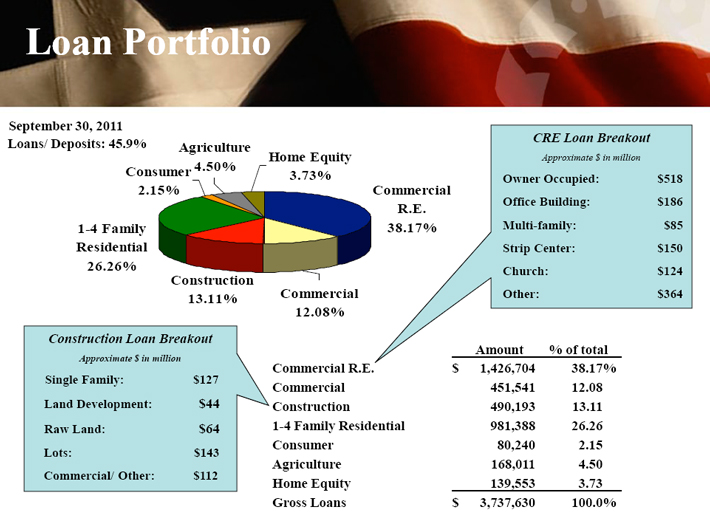
$ in millions
9
| * | Excluding the non-cash after tax impairment charge related to FNMA/FLHMC preferred stock of $6.5 million, EPS was $1.94 |
| ** | Excluding the non-cash after tax impairment charge related to FNMA/FLHMC preferred stock of $9.1 million, EPS was $1.86 |
10
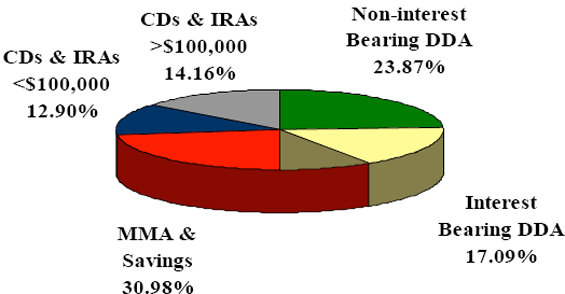
September 30, 2011
3Q11 Cost of Deposits= 0.50%
| | | | | | | | |
| | | Amount | | | % of total | |
| | |
Non-interest Bearing DDA | | $ | 1,861,907 | | | | 23.87 | % |
| | |
Interest Bearing DDA | | | 1,332,914 | | | | 17.09 | |
| | |
MMA & Savings | | | 2,493,699 | | | | 31.98 | |
| | |
CD’s & IRA’s<100m | | | 1,005,672 | | | | 12.90 | |
| | |
CD’s & IRA’s>100m | | | 1,104,547 | | | | 14.16 | |
| | | | | | | | |
| | |
Total Deposits | | $ | 7,798,739 | | | | 100.00 | % |
$ in thousands
11
12
$ in millions
13
$ in thousands
14
Texas Peer Group Includes: CFR, EBTX, FFIN, FBTX, IBOC, MCBI, SBSI, SNBI, SBIB, SBIT, TCBI, TRBS & TXUI
^ SNBI, SBIT, TRBS & TXUI have been acquired and were excluded from 2006 & 2007 and FBTX failed and was excluded from 2008
NOTE: 3Q11 does not include IBOC or TCBI as required data was not reported
Source: SNL Financial
15
Texas Peer Group Includes: CFR, EBTX, FFIN, FBTX, IBOC, MCBI, SBSI, SNBI, SBIB, SBIT, TCBI, TRBS & TXUI
^ SNBI, SBIT, TRBS & TXUI have been acquired and were excluded from 2006 & 2007 and FBTX failed and was excluded from 2008
Source: SNL Financial
16
| | |
| Corporate Headquarters | | Investor Contacts |
| |
| Prosperity Bank Plaza | | David Zalman |
| |
| 4295 San Felipe | | Chairman & Chief Executive Officer |
| |
| Houston, Texas 77027 | | 979.543.2200 |
| |
| | david.zalman@prosperitybanktx.com |
| |
| 281.269.7199 Telephone | | Dan Rollins |
| |
| 281.269-7222 Fax | | President & Chief Operating Officer |
| |
| www.prosperitybanktx.com | | 281.269.7199 |
| |
| | dan.rollins@prosperitybanktx.com |
| |
| | David Hollaway |
| |
| | Chief Financial Officer |
| |
| | 979.543.2200 |
| |
| | david.hollaway@prosperitybanktx.com |
17
| | | | | | | | | | | | | | | | | | | | | | | | | | | | |
As Originally Reported ($ in thousands, except EPS) | | 2005 | | | 2006 | | | 2007 | | | 2008 | | | 2009 | | | 2010 | | | 3Q 2011 | |
| | | | | | | |
Non Interest Income | | $ | 30,021 | | | $ | 33,982 | | | $ | 52,923 | | | $ | 52,370 | | | $ | 60,097 | | | $ | 53,833 | | | $ | 14,581 | |
| | | | | | | |
Net Interest Income | | $ | 110,897 | | | $ | 138,145 | | | $ | 200,435 | | | $ | 227,729 | | | $ | 307,101 | | | $ | 318,148 | | | $ | 82,538 | |
| | | | | | | |
Net Income | | $ | 47,860 | | | $ | 61,725 | | | $ | 90,635 | * | | $ | 93,623 | ** | | $ | 111,879 | | | $ | 127,708 | | | $ | 36,373 | |
| | | | | | | |
Book Value Per Share | | $ | 16.69 | | | $ | 20.26 | | | $ | 25.51 | | | $ | 27.24 | | | $ | 29.03 | | | $ | 31.11 | | | $ | 32.87 | |
| | | | | | | |
Tangible Book Value Per Share | | $ | 6.48 | | | $ | 6.62 | | | $ | 7.42 | | | $ | 7.43 | | | $ | 9.43 | | | $ | 10.70 | | | $ | 12.67 | |
| | | | | | | |
ROAA | | | 1.42 | % | | | 1.44 | % | | | 1.49 | %* | | | 1.33 | %** | | | 1.26 | % | | | 1.38 | % | | | 1.52 | % |
| | | | | | | |
ROAE | | | 11.56 | % | | | 10.24 | % | | | 8.72 | %* | | | 7.85 | %** | | | 8.57 | % | | | 9.08 | % | | | 9.51 | % |
| | | | | | | |
ROAE- tangible | | | 29.88 | % | | | 31.53 | % | | | 32.34 | %* | | | 26.77 | %** | | | 28.66 | % | | | 27.40 | % | | | 25.03 | % |
| | | | | | | |
Efficiency Ratio | | | 48.91 | % | | | 45.27 | % | | | 46.19 | % | | | 46.51 | % | | | 46.27 | % | | | 44.83 | % | | | 42.38 | % |
| | | | | | | |
Leverage Ratio | | | 7.83 | % | | | 7.76 | % | | | 8.09 | % | | | 5.68 | % | | | 6.47 | % | | | 6.87 | % | | | 7.70 | % |
| | | | | | | |
Tier I Risk Capital | | | 15.34 | % | | | 13.52 | % | | | 13.13 | % | | | 10.27 | % | | | 12.61 | % | | | 13.64 | % | | | 15.47 | % |
| | | | | | | |
Total Risk Capital | | | 16.37 | % | | | 14.55 | % | | | 14.11 | % | | | 11.17 | % | | | 13.86 | % | | | 14.87 | % | | | 16.69 | % |
| | | | | | | |
Tangible Ratio | | | 5.46 | % | | | 5.24 | % | | | 5.88 | % | | | 4.19 | % | | | 5.53 | % | | | 5.86 | % | | | 6.89 | % |
| * | Does not include the non-cash after tax impairment charge related to FNMA/FLHMC preferred stock of $6.5 million. |
| ** | Does not include the non-cash after tax impairment charge related to FNMA/FLHMC preferred stock of $9.1 million. |
19
|
 |
| | | | | | | | | | | | | | | | | | | | | | | | | | | | | | | | |
| | | | | | | | | | | | | | | | | | | At Announcement | | | | |
| | | Date of
Announcement | | Seller | | # of
Branches | | City | | State | | Type | | Consideration | | Accounting
Method | | PRSP
Assets
($000) | | | Sellers’
Assets
($000) | | | Sellers’
Assets
Contribution
(%) | | | Deal
Value
($ In MM | |
| 1 | | 02/07/08 | | 1st Choice Bancorp, Inc. | | 1 | | Houston | | TX | | Bank | | Mixed | | Purchase | | | 6,372,343 | | | | 313,900 | | | | 4.69 | | | | 66.2 | |
| 2 | | 05/01/07 | | The Bank of Navasota | | 1 | | Navasota | | TX | | Bank | | Common Stock | | Purchase | | | 6,247,926 | | | | 72,300 | | | | 1.14 | | | | 17.1 | |
| 3 | | 07/19/06 | | Texas United Bancshares, Inc. | | 34 | | La Grange | | TX | | Bank | | Common Stock | | Purchase | | | 4,547,220 | | | | 1,818,000 | | | | 27.82 | | | | 357.1 | |
| 4 | | 11/16/05 | | SNB Bancshares, Inc. | | 6 | | Houston | | TX | | Bank | | Mixed | | Purchase | | | 3,493,972 | | | | 1,121,747 | | | | 24.30 | | | | 242.7 | |
| 5 | | 09/12/05 | | Grapeland Bancshares, Inc. | | 2 | | Grapeland | | TX | | Bank | | Common Stock | | Purchase | | | 3,479,747 | | | | 73,000 | | | | 2.15 | | | | 7.3 | |
| 6 | | 10/26/04 | | FirstCapital Bankers, Inc. | | 20 | | Corpus Christi | | TX | | Thrift | | Common Stock | | Purchase | | | 2,709,169 | | | | 773,566 | | | | 22.21 | | | | 135.7 | |
| 7 | | 05/12/04 | | Village Bank and Trust | | 1 | | Austin | | TX | | Thrift | | Cash | | Purchase | | | 2,449,553 | | | | 110,400 | | | | 4.31 | | | | 20.2 | |
| 8 | | 04/26/04 | | Liberty Bank | | 4 | | Austin | | TX | | Thrift | | Mixed | | Purchase | | | 2,449,553 | | | | 186,000 | | | | 7.06 | | | | 42.0 | |
| 9 | | 10/06/03 | | First State Bank of North Texas | | 3 | | Dallas | | TX | | Bank | | Mixed | | Purchase | | | 2,078,532 | | | | 93,900 | | | | 4.32 | | | | 21.3 | |
| 10 | | 07/21/03 | | Mainbancorp | | 3 | | Dallas | | TX | | Bank | | Mixed | | Purchase | | | 1,983,277 | | | | 195,700 | | | | 8.98 | | | | 39.7 | |
| 11 | | 03/05/03 | | BankDallas SSB | | 1 | | Dallas | | TX | | Thrift | | Cash | | Purchase | | | 1,822,256 | | | | 40,716 | | | | 2.19 | | | | 7.0 | |
| 12 | | 02/03/03 | | Abrams Centre Bancshares, Inc. | | 1 | | Dallas | | TX | | Bank | | Cash | | Purchase | | | 1,822,256 | | | | 95,388 | | | | 4.97 | | | | 16.3 | |
| 13 | | 08/15/02 | | First National Bank of Bay City | | 1 | | Bay City | | TX | | Bank | | Cash | | Purchase | | | 1,360,356 | | | | 28,174 | | | | 2.03 | | | | 5.0 | |
| 14 | | 07/15/02 | | Southwest Bank Holding Company | | 2 | | Dallas | | TX | | Bank | | Cash | | Purchase | | | 1,289,637 | | | | 127,055 | | | | 8.97 | | | | 21.0 | |
| 15 | | 05/02/02 | | Paradigm Bancorporation, Incorporated | | 8 | | Houston | | TX | | Bank | | Common Stock | | Purchase | | | 1,289,637 | | | | 259,262 | | | | 16.74 | | | | 41.6 | |
| 16 | | 04/26/02 | | First State Bank | | 1 | | Needville | | TX | | Bank | | Cash | | Purchase | | | 1,289,637 | | | | 17,539 | | | | 1.36 | | | | 3.7 | |
| 17 | | 02/22/02 | | Texas Guaranty Bank, N.A. | | 2 | | Houston | | TX | | Bank | | Cash | | Purchase | | | 1,262,152 | | | | 75,019 | | | | 5.61 | | | | 11.8 | |
| 18 | | 11/08/00 | | Commercial Bancshares, Inc. | | 12 | | Houston | | TX | | Bank | | Common Stock | | Pooling | | | 693,079 | | | | 401,271 | | | | 36.67 | | | | 53.3 | |
| 19 | | 06/21/99 | | South Texas Bancshares, Inc. | | 3 | | Beeville | | TX | | Bank | | Cash | | Purchase | | | 461,903 | | | | 142,091 | | | | 23.53 | | | | 23.4 | |
| 20 | | 06/05/98 | | Union State Bank | | 1 | | East Bernard | | TX | | Bank | | Cash | | Purchase | | | 339,287 | | | | 79,174 | | | | 18.92 | | | | 17.6 | |
Branch Acquisitions
| | | | | | | | | | | | | | | | | | |
| | | Date of Announcement | | Seller | | # of Branches | | Branch Type | | Branch Locale
State | | Amount of Deposits
Transferred ($000) | | | Deposit Premium
($000) | |
| 1 | | 2/8/2010 | | First Bank | | 19 | | Bank | | TX | | | 500,000 | | | | 36,000 | |
| 2 | | 1/19/2010 | | U.S. Bank | | 3 | | Bank | | TX | | | 420,000 | | | | 13,000 | |
| 3 | | 11/7/2008 | | Franklin Bank | | 46 | | Bank | | TX | | | 3,700,000 | | | | 60,000 | |
| 4 | | 10/22/2007 | | Banco Popular North America | | 6 | | Bank | | TX | | | 140,000 | | | | NA | |
| 5 | | 6/15/2000 | | Compass Bancshares, Inc. | | 5 | | Bank | | TX | | | 87,000 | | | | NA | |
| 6 | | 2/27/1998 | | Grimes County Capital Corporation | | 1 | | Bank | | TX | | | 5,900 | | | | 250 | |
| 7 | | 3/30/1997 | | Wells Fargo & Company | | 1 | | Bank | | TX | | | NA | | | | NA | |
| 8 | | 3/11/1996 | | Victoria Bankshares, Inc. | | 1 | | Bank | | TX | | | 46,000 | | | | NA | |
20
| | | | | | | | | | | | | | | | | | | | | | | | | | | | | | | | | | | | | | | | | | | | | | | | | | | | |
| | | 12/31/2005 | | | 12/31/2006 | | | 12/31/2007 | | | 12/31/2008 | | | 12/31/2009 | | | 12/31/2010 | | | CAGR | |
Loan Composition | | | | | | | | | | | | | | | | | | | | | | | | | | | | | | | | | | | | | | | | | | | | | | | | | | | | |
| | | | | | | | | | | | | |
Commercial | | $ | 222.8 | | | | 14.4 | % | | $ | 297.7 | | | | 13.7 | % | | $ | 453.6 | | | | 14.5 | % | | $ | 499.1 | | | | 14.0 | % | | $ | 415.5 | | | | 12.3 | % | | $ | 440.5 | | | | 12.6 | % | | | 14.6 | % |
| | | | | | | | | | | | | |
Construction | | $ | 206.7 | | | | 13.4 | % | | $ | 433.2 | | | | 19.9 | % | | $ | 683.2 | | | | 21.7 | % | | $ | 666.1 | | | | 18.6 | % | | $ | 557.2 | | | | 16.5 | % | | $ | 502.3 | | | | 14.4 | % | | | 19.4 | % |
| | | | | | | | | | | | | |
1-4 Family Residential | | $ | 313.2 | | | | 20.3 | % | | $ | 377.0 | | | | 17.3 | % | | $ | 526.3 | | | | 16.7 | % | | $ | 668.1 | | | | 18.7 | % | | $ | 709.1 | | | | 21.0 | % | | $ | 824.1 | | | | 23.6 | % | | | 21.3 | % |
| | | | | | | | | | | | | |
Home Equity | | $ | 58.7 | | | | 3.8 | % | | $ | 63.4 | | | | 2.9 | % | | $ | 93.9 | | | | 3.0 | % | | $ | 107.0 | | | | 3.0 | % | | $ | 117.7 | | | | 3.5 | % | | $ | 118.8 | | | | 3.4 | % | | | 15.1 | % |
| | | | | | | | | | | | | |
Commercial Real Estate | | $ | 619.3 | | | | 40.3 | % | | $ | 881.1 | | | | 40.5 | % | | $ | 1,148.7 | | | | 36.6 | % | | $ | 1,343.4 | | | | 37.7 | % | | $ | 1,339.2 | | | | 39.7 | % | | $ | 1,370.6 | | | | 39.3 | % | | | 17.2 | % |
| | | | | | | | | | | | | |
Agriculture | | $ | 56.3 | | | | 3.6 | % | | $ | 57.4 | | | | 2.6 | % | | $ | 114.0 | | | | 3.6 | % | | $ | 145.7 | | | | 4.1 | % | | $ | 135.5 | | | | 4.0 | % | | $ | 140.8 | | | | 4.0 | % | | | 20.1 | % |
| | | | | | | | | | | | | |
Consumer | | $ | 65.1 | | | | 4.2 | % | | $ | 66.7 | | | | 3.1 | % | | $ | 123.2 | | | | 3.9 | % | | $ | 137.7 | | | | 3.9 | % | | $ | 102.4 | | | | 3.0 | % | | $ | 88.0 | | | | 2.5 | % | | | 6.2 | % |
| | | | | | | | | | | | | | | | | | | | | | | | | | | | | | | | | | | | | | | | | | | | | | | | | | | | |
| | | | | | | | | | | | | |
Total Loans | | $ | 1,542.1 | | | | 100.0 | % | | $ | 2,176.5 | | | | 100.0 | % | | $ | 3,142.9 | | | | 100.0 | % | | $ | 3,567.1 | | | | 100.0 | % | | $ | 3,376.7 | | | | 100.0 | % | | $ | 3,485.0 | | | | 100.0 | % | | | 17.7 | % |
| | | | | | | | | | | | | | | | | | | | | | | | | | | | | | | | | | | | | | | | | | | | | | | | | | | | |
$ in millions
21