 Exhibit 99.1 |
 2 “Safe Harbor” Statement “Safe Harbor” Statement under the Private Securities Litigation Reform Act of 1995 Statements contained in this presentation which are not historical facts and which pertain to future operating results of Prosperity Bancshares ® , Inc. and its subsidiaries constitute “forward-looking statements” within the meaning of the Private Securities Litigation Reform Act of 1995. These forward-looking statements involve significant risks and uncertainties. Actual results may differ materially from the results discussed in these forward-looking statements. Factors that might cause such a difference include, but are not limited to, those discussed in the company’s periodic reports and filings with the SEC. Copies of the SEC filings for Prosperity Bancshares ® may be downloaded from the Internet at no charge from www.prosperitybanktx.com. |
 3 Corporate Profile Corporate Profile • A Texas based financial holding company with approximately $14 billion in assets • 3 rd largest Texas based commercial bank by Texas deposits • Strong balance sheet growth – 10 year CAGR of 23% for loans, 22% for deposits and 23% for assets • Strong earnings growth – 10 year CAGR of 10% for EPS (diluted) and 23% for net income • Shareholder value driven with large inside ownership • Excellent asset quality – Annualized Net Charge Offs / Average Loans of 0.15% for three months ending December 31, 2012 • Excellent cost control – under 44% efficiency ratio • Integrated over 30 acquisitions over the past 16 years a Track Record of Success |
 4 4Q12 Highlights 4Q12 Highlights • Net Interest Income before allowance for credit losses increased 35.2% to $108.30 million when compared to same period in 2011 • Non-Performing Assets to Average Earning Assets remain low at 0.10% or $13.02 million • Strong Earnings of $48.27 million or $0.85 per share (diluted) and 1.36% Return on Assets for the fourth quarter 2012 • Tangible Common Equity Ratio was 6.34% at December 31, 2012 • Completed acquisitions of: • Bank of Texas, Austin (assets: $77.0 million; loans: $27.6 million; deposits: $70.4 million) • The Bank Arlington, Arlington (assets: $37.3 million; loans: $22.8 million; deposits: $33.2 million) • American State Bank, Lubbock (assets: $3.16 billion; loans $1.24 billion; deposits: $2.51 billion) • Community National Bank, Bellaire (assets: $183.0 million, loans: $68.0 million; deposits: $164.6 million) • First Bank Texas, Tyler (assets : $191.1 million; loans: $139.2 million; deposits: $116.0 million) • Announced pending acquisition of: • Coppermark Bank, Oklahoma City (assets: $1.3 billion; loans : $874.2 million; deposits: $1.2 billion) |
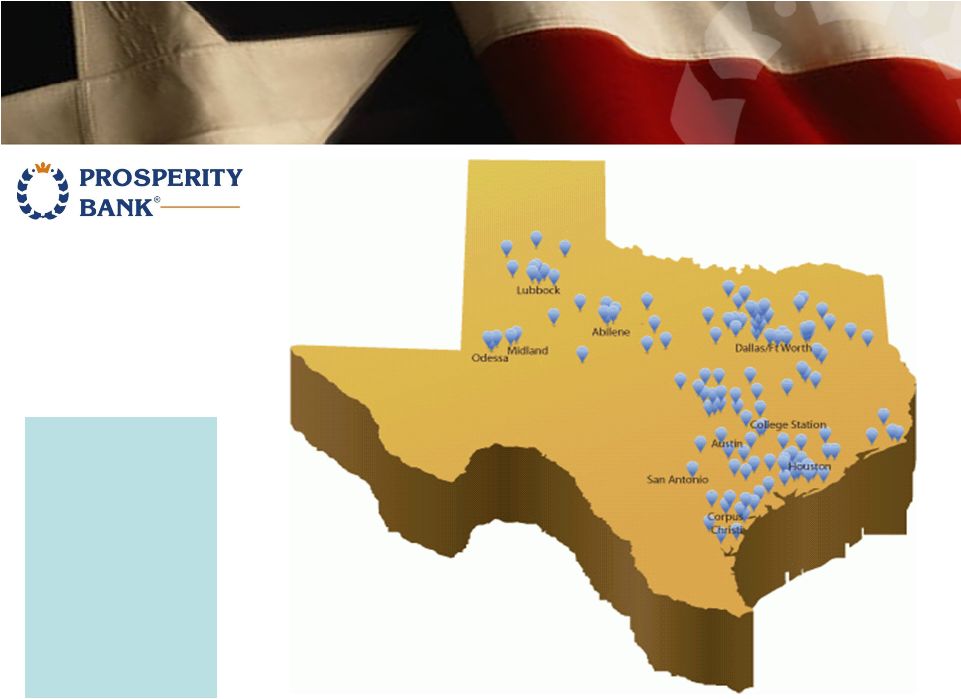 Banking Center Network Banking Center Network Sources: SNL Financial and MapPoint Texas has six of the nation’s top 20 cities in population: 4 Houston 7 San Antonio 9 Dallas 16 Austin 17 Fort Worth 20 El Paso 215 Full Service Locations 10 in Bryan/ College Station Area 34 in Central Texas Area 35 in Dallas/ Fort Worth Area 23 in East Texas Area 59 in Houston Area 20 in South Texas Area 34 in West Texas Area 5 |
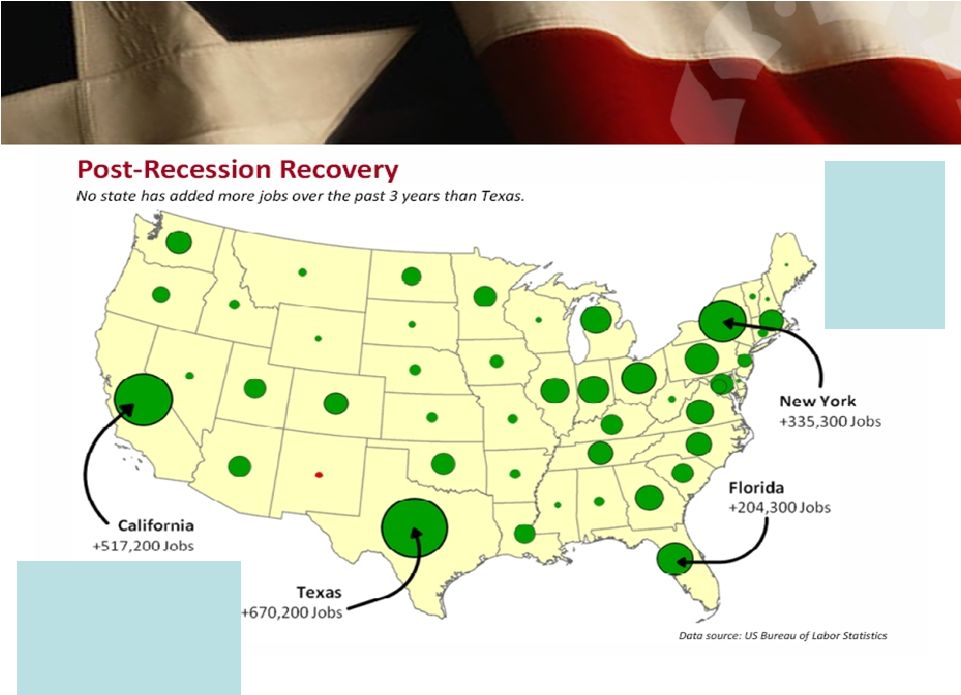 Strong Texas Economy 6 www.texaswideopenforbusiness.com Fastest Growing Metropolitan Areas Texas is Adding Jobs Per Capita At Almost Twice The Pace of The Entire U.S. 1 . Dallas / Ft Worth MSA- 345.3 people per day 2 . Houston MSA-301.6 people per day |
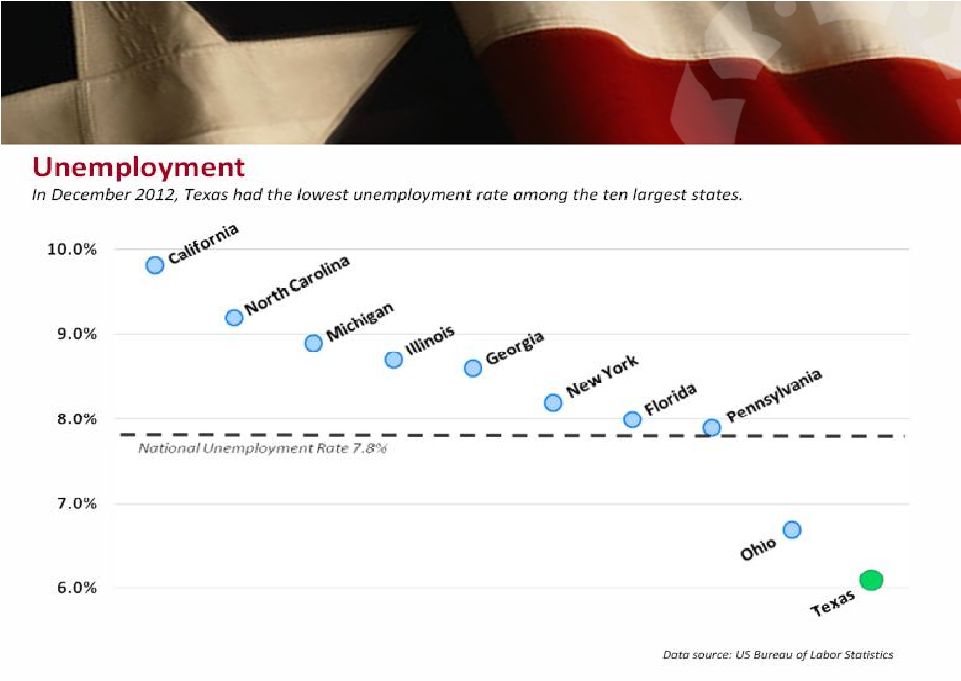 Strong Texas Economy 7 www.texaswideopenforbusiness.com |
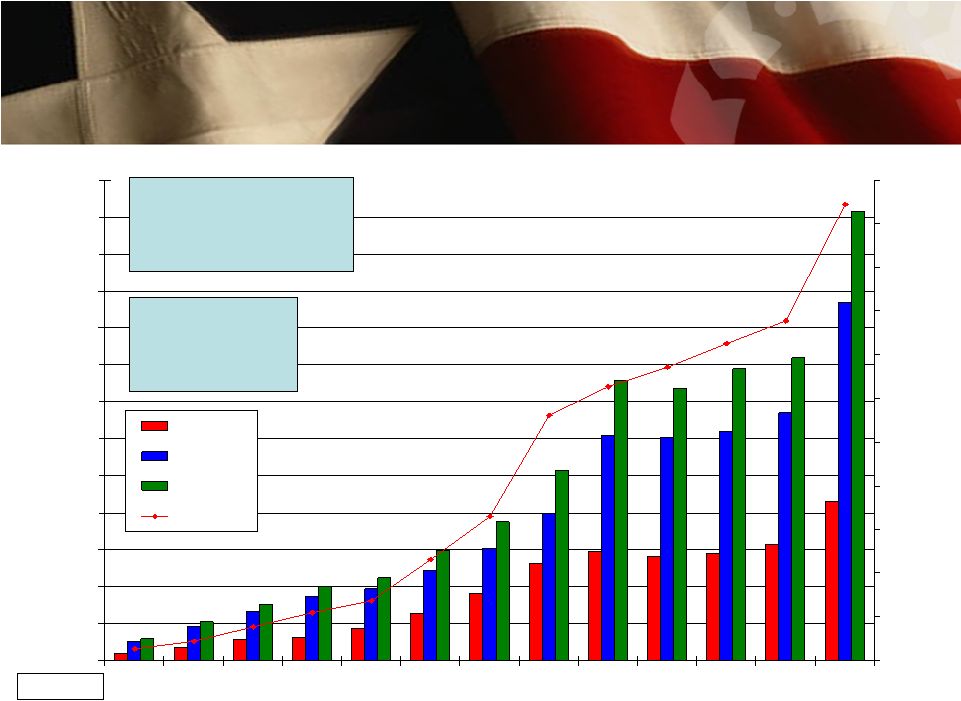 8 Balance Sheet Summary Balance Sheet Summary $0 $1,200 $2,400 $3,600 $4,800 $6,000 $7,200 $8,400 $9,600 $10,800 $12,000 $13,200 $14,400 $15,600 2000 2001 2002 2003 2004 2005 2006 2007 2008 2009 2010 2011 2012 $0 $200 $400 $600 $800 $1,000 $1,200 $1,400 $1,600 $1,800 $2,000 $2,200 Loans Deposits Assets Equity $ in millions Totals as of 12/31/12 Loans = $5.18 Billion Deposits = $11.64 Billion Assets = $14.58 Billion 10 year CAGR Loans = 23% Deposits = 22% Assets = 23% |
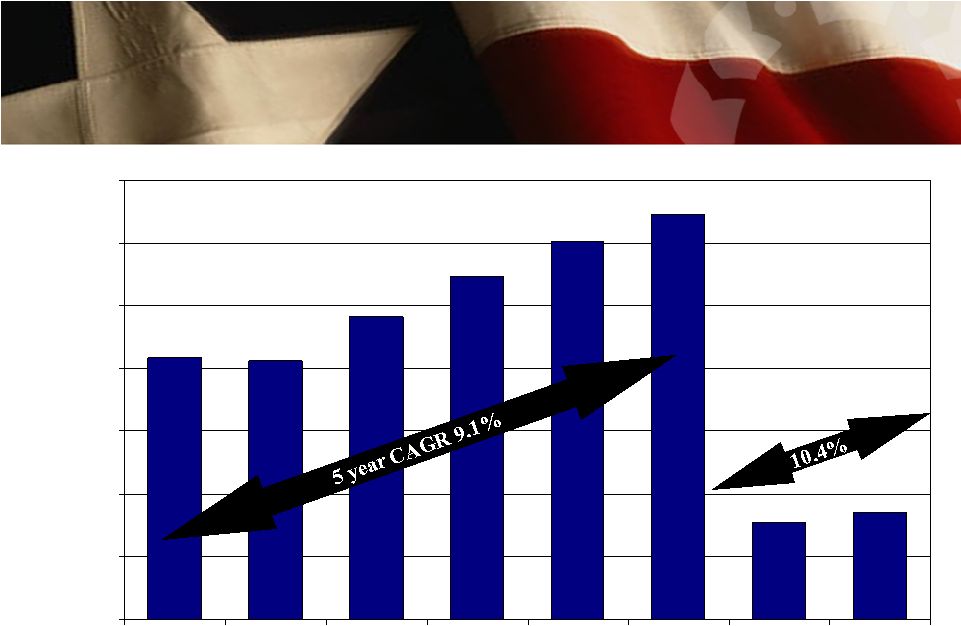 9 $0.85 $0.77 $3.23 $2.09 $2.06 $2.41 $3.01 $2.73 $0.00 $0.50 $1.00 $1.50 $2.00 $2.50 $3.00 $3.50 2007 2008 2009 2010 2011 2012 4Q 2011 4Q 2012 EPS Growth Diluted EPS Growth Diluted *Excluding the non-cash after tax impairment charge related to FNMA/FLHMC preferred stock of $6.5 million, EPS was $1.94 **Excluding the non-cash after tax impairment charge related to FNMA/FLHMC preferred stock of $9.1 million, EPS was $1.86 * ** |
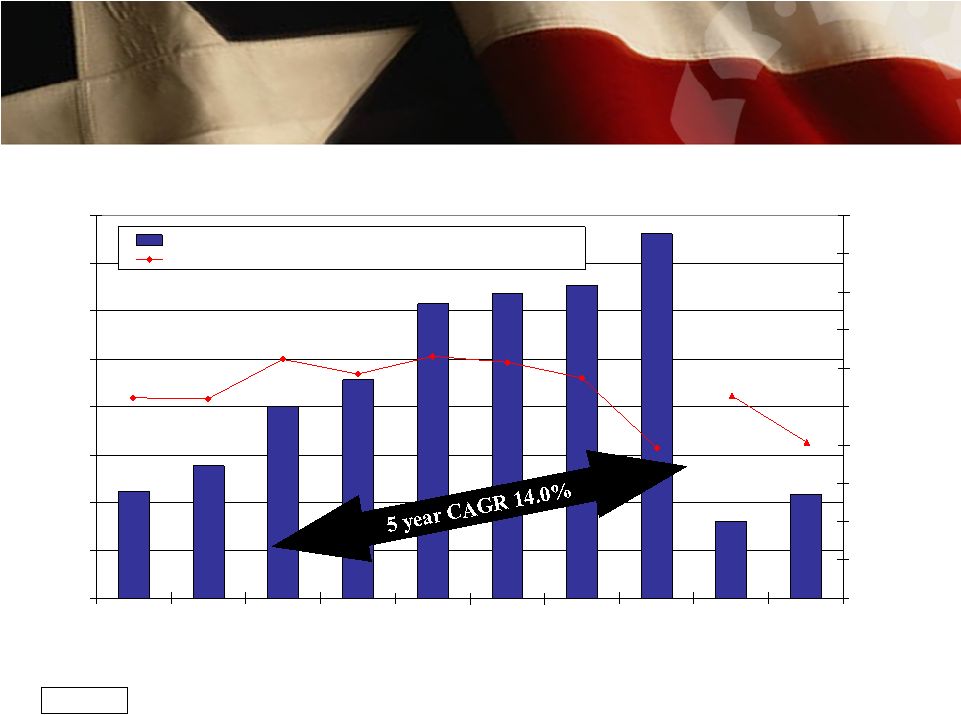 $0 $50 $100 $150 $200 $250 $300 $350 $400 2005 2006 2007 2008 2009 2010 2011 2012 4Q11 4Q12 2.50% 2.75% 3.00% 3.25% 3.50% 3.75% 4.00% 4.25% 4.50% 4.75% 5.00% Net Interest Income before provision for loan loss Net Interest Margin 10 Net Interest Income Net Interest Income $ in millions |
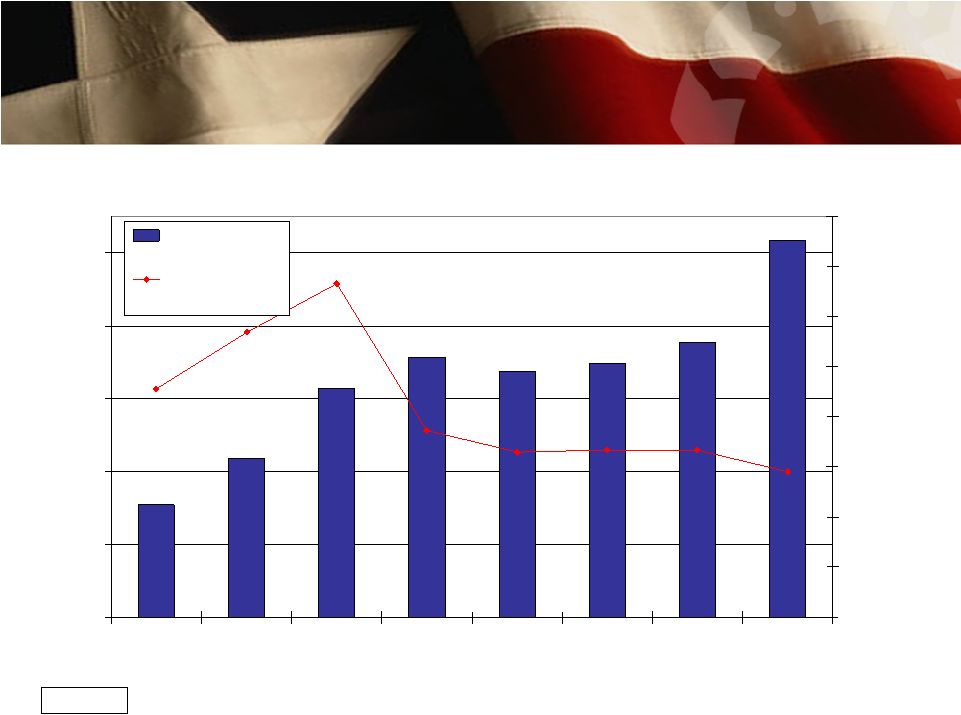 $0 $1,000 $2,000 $3,000 $4,000 $5,000 2005 2006 2007 2008 2009 2010 2011 2012 30.00% 35.00% 40.00% 45.00% 50.00% 55.00% 60.00% 65.00% 70.00% Loans Loan / Deposit Ratio 11 Loan Growth Loan Growth $ in millions |
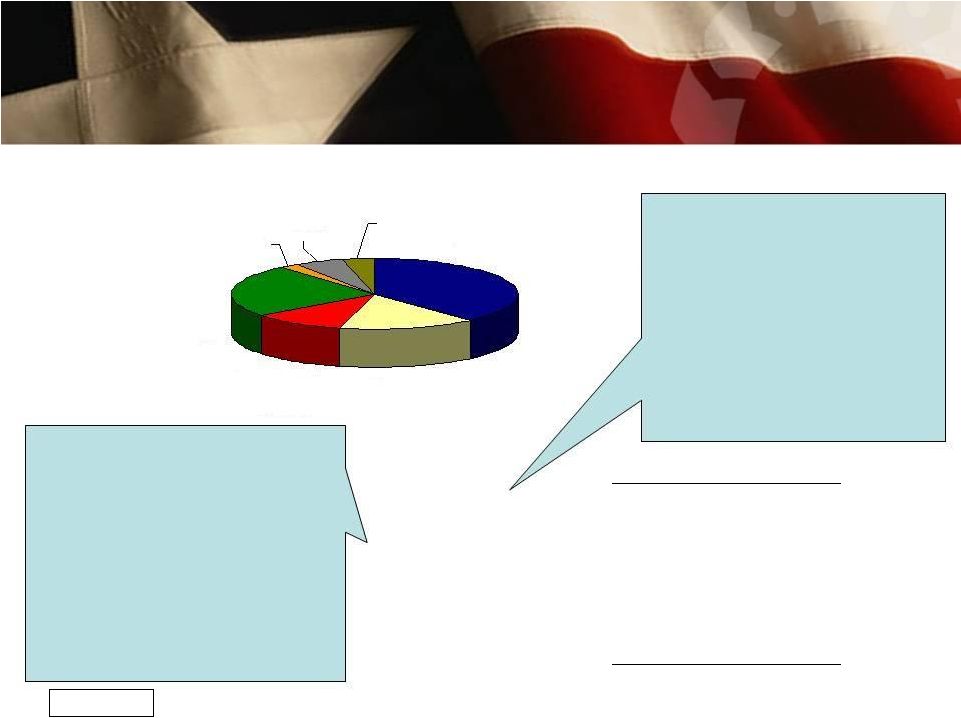 12 Loan Portfolio Loan Portfolio $ in thousands Loans/ Deposits: 44.5% December 31, 2012 Construction Loan Breakout Approximate $ in millions Single Family: Land Development: Raw Land: Lots: Commercial/ Other: Purchase Accounting Discount CRE Loan Breakout Approximate $ in millions Owner Occupied: $725 Office Building: $212 Multi-family: $141 Strip Center: $228 Other: $738 Purchase Accounting Discount ($53) Amount % of total Commercial R.E. $ 1,990,642 38.4% Commercial 798,882 15.4 Construction 550,768 10.6 1-4 Family Residential 1,255,765 24.3 Consumer 111,445 2.2 Agriculture 285,637 5.5 Home Equity 186,801 3.6 Gross Loans $ 5,179,940 100.0% Home Equity 3.6% Agriculture 5.5% Consumer 2.2% 1-4 Family Residential 24.3% Commercial 15.4% Construction 10.6% Commercial R.E. 38.4% $161 ($2) $134 $156 $59 $42 |
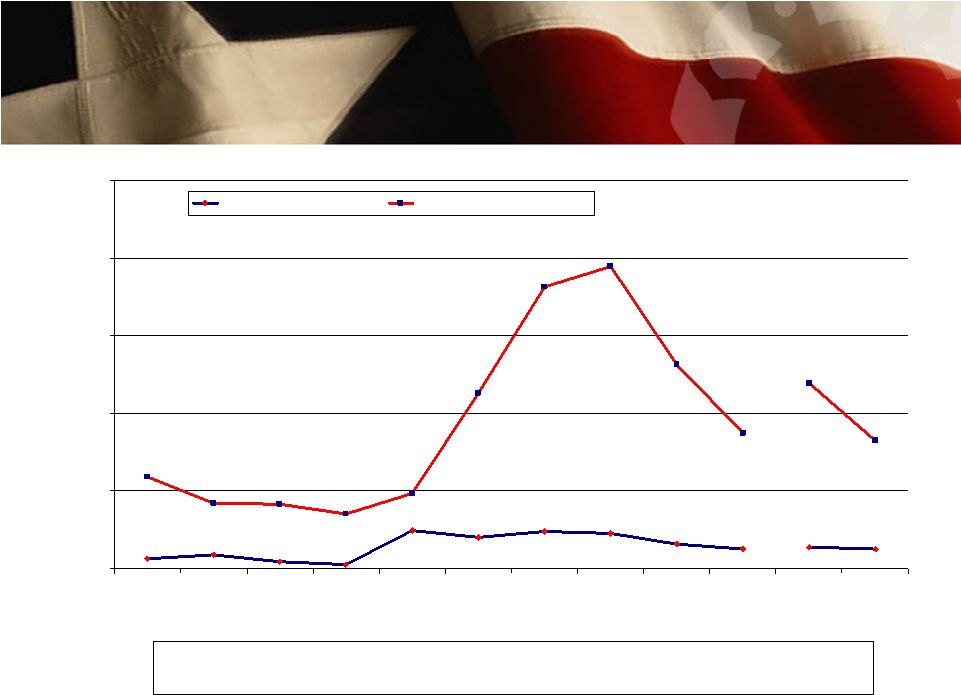 Asset Quality – NPA*/ Loans + OREO * Includes loans past due 90 days and still accruing Asset Quality – NPA*/ Loans + OREO * Includes loans past due 90 days and still accruing 1.74% 0.25% 0.32% 0.45% 0.48% 0.40% 0.49% 0.05% 0.09% 0.17% 0.13% 0.25% 0.28% 2.62% 3.90% 0.83% 0.70% 0.84% 1.18% 0.97% 2.26% 3.63% 1.64% 2.39% 0.00% 1.00% 2.00% 3.00% 4.00% 5.00% 2003 2004 2005 2006^ 2007^ 2008^ 2009^ 2010^ 2011^ 2012^ 3Q12^ 4Q12^ PB NPA*/Loans + OREO Peer NPA*/Loans + OREO Source: SNL Financial Texas Peer Group Includes: CFR, EBTX, FFIN, FBTX, IBOC, MCBI, SBSI, SNBI, SBIB, SBIT, TCBI, TRBS & TXUI ^ SNBI, SBIT, TRBS & TXUI have been acquired and were excluded from 2006 & 2007 and FBTX failed and was excluded from 2008, SBIB was acquired and excluded from 2011, EBTX was acquired and excluded from 2012, and IBOC has not reported 4Q12 data 13 |
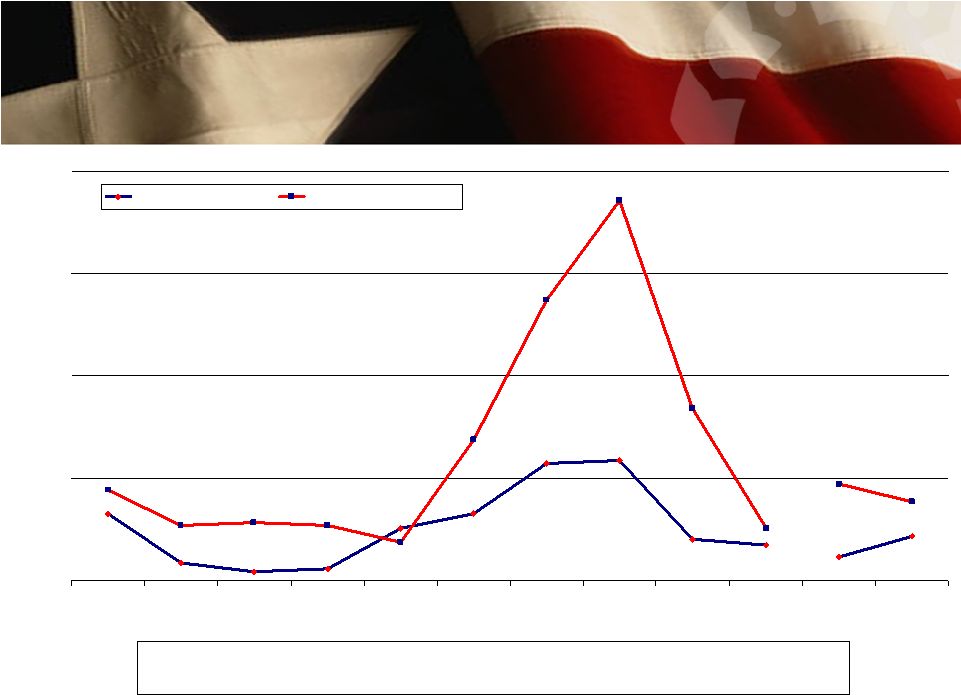 Asset Quality – NCO/ Average Loans Asset Quality – NCO/ Average Loans 0.12% 0.41% 0.40% 0.23% 0.18% 0.04% 0.06% 0.23% 0.14% 0.03% 0.15% 0.08% 0.18% 0.31% 1.30% 0.96% 0.48% 0.13% 0.19% 0.20% 0.19% 0.59% 0.27% 0.33% 0.00% 0.35% 0.70% 1.05% 1.40% 2003 2004 2005 2006^ 2007^ 2008^ 2009^ 2010^ 2011 2012^ 3Q12^ 4Q12^ PB NCO / Avg Loans Peer NCO / Avg Loans Source: SNL Financial Texas Peer Group Includes: CFR, EBTX, FFIN, FBTX, IBOC, MCBI, SBSI, SNBI, SBIB, SBIT, TCBI, TRBS & TXUI ^ SNBI, SBIT, TRBS & TXUI have been acquired and were excluded from 2006 & 2007 and FBTX failed and was excluded from 2008, SBIB was acquired and excluded from 2011, EBTX was acquired and excluded from 2012, and IBOC has not reported 4Q12 data 14 |
 15 Contact Information Contact Information Corporate Headquarters Investor Contacts Prosperity Bank Plaza David Zalman 4295 San Felipe Chairman & Chief Executive Officer Houston, Texas 77027 979.543.2200 david.zalman@prosperitybanktx.com 281.269.7199 Telephone David Hollaway 281.269-7222 Fax Chief Financial Officer www.prosperitybanktx.com 281.269.7199 david.hollaway@prosperitybanktx.com |
 4th Quarter Earnings 2012 |
 17 PRSP Acquisitions PRSP Acquisitions At Announcement Date of Announcement Seller # of Branches Consideration Accounting Method PRSP Assets ($000) Sellers' Assets ($000) Sellers' Assets Contribution (%) Deal Value ($000) 1 12/10/2012 Coppermark Bancshares (Oklahoma City)* 9 Mixed Purchase 13,712,119 1,325,000 8.8 194.3 2 6/27/2012 Community National Bank 1 Mixed Purchase 10,889,955 182,900 1.7 26.6 3 2/27/2012 American State Financial Corp. 37 Mixed Purchase 9,822,671 3,081,689 31.4 529.2 4 1/19/2012 The Bank Arlington (Dallas) 1 Common Stock Purchase 9,822,671 37,300 0.38 5.8 5 12/9/2011 East Texas Financial Services, Inc. (Tyler) 3 Common Stock Purchase 9,822,671 210,600 2.14 21.1 6 9/13/2011 Texas Bankers, Inc. (Austin) 1 Common Stock Purchase 9,567,087 72,500 0.76 12.7 7 02/07/08 1st Choice Bancorp, Inc. (Houston) 1 Mixed Purchase 6,372,343 313,900 4.69 66.2 8 05/01/07 The Bank of Navasota (Navasota) 1 Common Stock Purchase 6,247,926 72,300 1.14 17.1 9 07/19/06 Texas United Bancshares, Inc.(La Grange) 34 Common Stock Purchase 4,547,220 1,818,000 27.82 357.1 10 11/16/05 SNB Bancshares, Inc. (Houston) 6 Mixed Purchase 3,493,972 1,121,747 24.30 242.7 11 09/12/05 Grapeland Bancshares, Inc.(Grapeland) 2 Common Stock Purchase 3,479,747 73,000 2.15 7.3 12 10/26/04 FirstCapital Bankers, Inc. (Corpus Chrisit) 20 Common Stock Purchase 2,709,169 773,566 22.21 135.7 13 05/12/04 Village Bank and Trust (Austin) 1 Cash Purchase 2,449,553 110,400 4.31 20.2 14 04/26/04 Liberty Bank (Austin) 4 Mixed Purchase 2,449,553 186,000 7.06 42.0 15 10/06/03 First State Bank of North Texas (Dallas) 3 Mixed Purchase 2,078,532 93,900 4.32 21.3 16 07/21/03 Mainbancorp (Dallas) 3 Mixed Purchase 1,983,277 195,700 8.98 39.7 17 03/05/03 BankDallas SSB (Dallas) 1 Cash Purchase 1,822,256 40,716 2.19 7.0 18 02/03/03 Abrams Centre Bancshares, Inc. (Dallas) 1 Cash Purchase 1,822,256 95,388 4.97 16.3 19 08/15/02 First National Bank of Bay City (Bay City) 1 Cash Purchase 1,360,356 28,174 2.03 5.0 20 07/15/02 Southwest Bank Holding Company (Dallas) 2 Cash Purchase 1,289,637 127,055 8.97 21.0 21 05/02/02 Paradigm Bancorporation, Inc. (Houston) 8 Common Stock Purchase 1,289,637 259,262 16.74 41.6 22 04/26/02 First State Bank (Needville) 1 Cash Purchase 1,289,637 17,539 1.36 3.7 23 02/22/02 Texas Guaranty Bank, N.A. (Houston) 2 Cash Purchase 1,262,152 75,019 5.61 11.8 24 11/08/00 Commercial Bancshares, Inc.(Houston) 12 Common Stock Pooling 693,079 401,271 36.67 53.3 25 06/21/99 South Texas Bancshares, Inc. (Beeville) 3 Cash Purchase 461,903 142,091 23.53 23.4 26 06/05/98 Union State Bank (East Bernard) 1 Cash Purchase 339,287 79,174 18.92 17.6 *Pending Acquisition |
 18 PRSP Branch Acquisitions PRSP Branch Acquisitions Branch Acquisitions Date of Announcement Seller # of Branches Branch Type Branch Locale State Amount of Deposits Transferred ($000) Deposit Premium ($000) 1 2/8/2010 First Bank 19 Bank TX 500,000 36,000 2 1/19/2010 U.S. Bank 3 Bank TX 420,000 13,000 3 11/7/2008 Franklin Bank 46 Bank TX 3,700,000 60,000 4 10/22/2007 Banco Popular North America 6 Bank TX 140,000 NA 5 6/15/2000 Compass Bancshares, Inc. 5 Bank TX 87,000 NA 6 2/27/1998 Grimes County Capital Corporation 1 Bank TX 5,900 250 7 3/30/1997 Wells Fargo & Company 1 Bank TX NA NA 8 3/11/1996 Victoria Bankshares, Inc. 1 Bank TX 46,000 NA |
 19 Additional Information for Shareholders In connection with the proposed merger of Coppermark Bancshares, Inc. into Prosperity Bancshares, Prosperity Bancshares has filed with the Securities and Exchange Commission a registration statement on Form S-4 to register the shares of Prosperity’s common stock to be issued to the shareholders of Coppermark Bancshares, Inc. The registration statement includes a proxy statement/prospectus which will be sent to the shareholders of Coppermark Bancshares, Inc. seeking their approval of the proposed transaction. WE URGE INVESTORS AND SECURITY HOLDERS TO READ THE REGISTRATION STATEMENT ON FORM S-4, THE PROXY STATEMENT/PROSPECTUS INCLUDED WITHIN THE REGISTRATION STATEMENT ON FORM S-4 AND ANY OTHER RELEVANT DOCUMENTS FILED WITH THE SECURITIES AND EXCHANGE COMMISSION IN CONNECTION WITH THE PROPOSED TRANSACTION BECAUSE THEY CONTAIN IMPORTANT INFORMATION ABOUT PROSPERITY, COPPERMARK BANCSHARES AND THE PROPOSED TRANSACTION. Investors and security holders may obtain free copies of these documents through the website maintained by the Securities and Exchange Commission at http://www.sec.gov. Documents filed with the SEC by Prosperity will be available free of charge by directing a request by telephone or mail to Prosperity Bancshares, Inc., Prosperity Bank Plaza, 4295 San Felipe, Houston, Texas 77027 Attn: Investor Relations. Prosperity’s telephone number is (281) 269- 7199. |
 4th Quarter Earnings 2012 |