 Acquisition of FVNB Corp. July 1, 2013 Exhibit 99.1 |
 2 “Safe Harbor” Statement “Safe Harbor” Statement under the Private Securities Litigation Reform Act of 1995 Statements contained in this presentation which are not historical facts and which pertain to future operating results of Prosperity Bancshares ® and its subsidiaries constitute “forward-looking statements” within the meaning of the Private Securities Litigation reform Act of 1995. These forward-looking statements involve significant risks and uncertainties. Actual results may differ materially from the results discussed in these forward-looking statements. Factors that might cause such a difference include, but are not limited to, those discussed in the company’s periodic filings with the SEC. Copies of the SEC filings for Prosperity Bancshares ® may be downloaded from the Internet at no charge from www.prosperitybankusa.com. |
 3 Strategic Rationale Strategic Rationale • Strengthens Prosperity’s position in the economically attractive Gulf Coast and Central regions of Texas: – Complimentary franchises and markets – Similar cultures and operating philosophies – Enhances market share in existing Victoria and Bryan/College Station markets – Adds to the North Houston footprint near The Woodlands, where Exxon Mobil is building their 400 acre headquarters to house 10,000+ employees – – $540 million trust assets under management at year end 2012, significantly enhancing current trust business (1) Per Cetera Financial Institutions rankings • Diversifies Prosperity’s revenue stream with FVNB’s brokerage and trust businesses • Meaningful accretion to earnings per share • Prosperity will remain well-capitalized • Following the merger, Prosperity will be the 39th largest U.S. headquartered banking institution FVNB ranks #1 against peers, #5 overall in brokerage commissions (1) |
 4 Strengthens Texas Franchise Strengthens Texas Franchise Source: SNL Financial * Branch count excludes duplicative drive-thru locations and includes one FVNB loan production office in Sugar Land (2) PB (222)* FVNB (34)* Pro Forma Branch Footprint Victoria Midland Odessa |
 5 Enhances Market Share Enhances Market Share Source: SNL Financial Note: Deposit data as of June 30, 2012; Pro forma for pending and completed transactions * Branch count excludes duplicative drive-thru locations and includes one FVNB loan production office in Sugar Land Texas Deposit Market Share Number Deposits in Market of Market Share Rank Institution (ST) Branches ($mm) (%) 1 JPMorgan Chase & Co. (NY) 681 106,289 20.6 2 Bank of America Corp. (NC) 437 79,784 15.5 3 Wells Fargo & Co. (CA) 689 56,269 10.9 4 BBVA 374 28,035 5.4 5 Cullen/Frost Bankers Inc. (TX) 131 17,365 3.4 Pro Forma 250 13,219 2.6 6 Prosperity Bancshares Inc. (TX)* 216 11,243 2.2 7 Capital One Financial Corp. (VA) 174 9,972 1.9 8 Comerica Inc. (TX) 139 9,563 1.9 9 Zions Bancorp. (UT) 97 9,424 1.8 10 International Bancshares Corp. (TX) 169 6,921 1.3 11 Texas Capital Bancshares Inc. (TX) 13 6,264 1.2 12 BOK Financial Corp. (OK) 47 4,604 0.9 13 Citigroup Inc. (NY) 100 4,177 0.8 14 Regions Financial Corp. (AL) 84 3,985 0.8 15 Hilltop Holdings Inc. (TX) 33 3,963 0.8 23 FVNB Corp. (TX)* 34 1,976 0.4 Top 15 3,384 357,858 69.3 Total 6,858 516,072 100.0 |
 6 Growing Markets of Operation Growing Markets of Operation (1) (2) Victoria & Coastal Cities Bryan / College Station & San Antonio / Austin Corridor Houston and Surrounding Area • Expected capital investment of $28 billion in the Eagle Ford Shale play in 2013 • • $1 billion TPCO Pipe plant is under construction and is estimated to create 400 to 600 jobs • Cheniere Energy is set to begin construction of a liquefied natural gas plant on the La Quinta ship channel, which will have production capacity of 13.5 million tons per year • Home to Texas A&M University and Blinn College which enroll approximately 50,000 and 15,000 students every year, respectively • G-Con Biopharmaceutical Manufacturing facility is open and projected to add 150 six figure salary jobs to the Bryan / College Station community • Construction of a 3,500 acre bio medical complex is underway along Highway 47 • 600,000 square foot Sysco Foods distribution center completed and will house 600+ employees • Exxon Mobil is expected to complete a 400 acre facility by 2015 which will house over 10,000 relocated employees in The Woodlands market • Ben E. King, Noble Drilling, Team Industrial Services, BP America, Shell, Transwestern and Worley Parsons added over 5,000 new jobs to the South / West Houston market • The Walker County market is home to Sam Houston State University, the fastest growing four-year institution in Texas, which enrolls approximately 18,500 every semester Construction of the 1.1 million square foot Caterpillar plant in Victoria |
 7 • Founded in 1867, First Victoria National Bank is the oldest independent bank in Texas • Operates 34 locations across the Gulf Coast and Central regions of Texas • Consistent growth and profitability through the cycle • Established presence in economically and demographically attractive markets Source: SNL Financial and FVNB company documents Financial Highlights – FVNB Corp. Financial Highlights – FVNB Corp. Year ended, Quarter ended, Dollars in thousands 12/31/10 12/31/11 12/31/12 03/31/13 Balance Sheet Total Assets 1,732,919 $ 1,912,657 $ 2,390,445 $ 2,410,497 $ Gross Loans HFI 1,295,322 1,327,800 1,615,819 1,607,681 Securities 246,343 270,103 372,644 379,451 Deposits 1,527,680 1,698,404 2,132,369 2,147,212 Total Equity 123,701 159,689 205,777 212,387 Tangible Common Equity 94,619 113,244 140,388 147,153 Balance Sheet Ratio Loans / Deposits (%) 84.8 78.2 75.8 74.9 Tangible Common Equity / Tangible Assets (%) 5.55 6.01 5.99 6.23 Leverage Ratio (%) 7.85 8.95 8.33 8.73 Tier 1 Capital Ratio (%) 10.10 12.18 11.92 12.48 Total Capital Ratio (%) 11.36 13.44 13.18 13.74 Income Statement Net Interest Income 62,882 $ 66,265 $ 75,608 $ 21,350 $ Provision Expense 11,750 7,100 6,150 1,000 Noninterest Income 23,886 24,718 26,493 6,582 Noninterest Expense 59,035 62,816 67,123 17,494 Net Income Available to Common 11,312 14,636 19,058 6,380 Profitability Return on Average Assets (%) 0.69 0.83 0.93 1.10 Return on Average Tangible Common Equity (%) 12.9 14.4 15.9 17.9 Net Interest Margin - FTE (%) 4.27 4.07 4.09 4.01 Efficiency Ratio (%) 68.0 69.0 65.7 62.6 Fee Income / Operating Revenue (%) 27.5 27.2 25.9 23.6 Ratios |
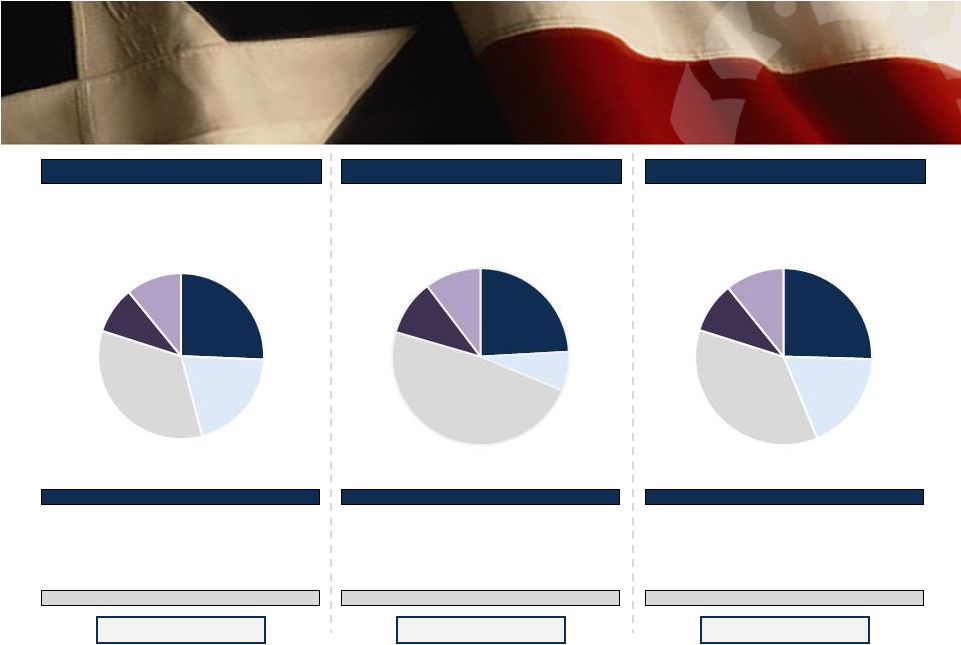
 8 Pro Forma Loan Composition Pro Forma Loan Composition Prosperity Bancshares, Inc. FVNB Corp. Pro Forma Loan Portfolio ($000) Amount % Residential R.E. $1,409,967 23.1% Commercial R.E. 2,633,869 43.1% Construction 728,639 11.9% Commercial & Industrial 965,505 15.8% Consumer & Other 372,602 6.1% Total Loans & Leases $6,110,582 100.0% Loan Portfolio ($000) Amount % Residential R.E. $362,477 22.5% Commercial R.E. 583,850 36.3% Construction 174,641 10.9% Commercial & Industrial 299,509 18.6% Consumer & Other 187,204 11.6% Total Loans & Leases $1,607,681 100.0% Loan Portfolio ($000) Amount % Residential R.E. $1,772,444 23.0% Commercial R.E. 3,217,719 41.7% Construction 903,280 11.7% Commercial & Industrial 1,265,014 16.4% Consumer & Other 559,806 7.3% Total Loans & Leases $7,718,263 100.0% Yield on Loans: 6.08% Loans / Deposits: 47.6% Yield on Loans: 5.34% Loans / Deposits: 74.9% Yield on Loans: 5.93% Loans / Deposits: 51.5% Sources: SNL Financial and FVNB company documents; Data as of March 31, 2013 Note: Pro forma loan composition excludes fair value purchase accounting adjustments; Loan to deposit ratio excludes purchase accounting adjustments Prosperity loan composition pro forma for Coppermark Bancshares, Inc. acquisition and excludes fair value purchase accounting adjustments; Loan to deposit ratio excludes purchase accounting adjustments Residential R.E. 23.1% Commercial R.E. 43.1% Construction 11.9% Commercial & Industrial 15.8% Consumer & Other 6.1% Residential R.E. 22.5% Commercial R.E. 36.3% Construction 10.9% Commercial & Industrial 18.6% Consumer & Other 11.6% Residential R.E. 23.0% Commercial R.E. 41.7% Construction 11.7% Commercial & Industrial 16.4% Consumer & Other 7.3% |
 9 Pro Forma Deposit Composition Pro Forma Deposit Composition Prosperity Bancshares, Inc. FVNB Corp. Pro Forma Deposit Portfolio ($000) Amount % Demand Deposits $3,292,545 25.7% NOW & Other 2,597,300 20.2% MMDA & Savings 4,368,729 34.0% Retail Time Deposits 1,175,772 9.2% Jumbo Time Deposits 1,396,901 10.9% Total Deposits $12,831,247 100.0% Deposit Portfolio ($000) Amount % Demand Deposits $517,839 24.1% NOW & Other 153,297 7.1% MMDA & Savings 1,035,746 48.2% Retail Time Deposits 219,045 10.2% Jumbo Time Deposits 221,285 10.3% Total Deposits $2,147,212 100.0% Deposit Portfolio ($000) Amount % Demand Deposits $3,810,384 25.4% NOW & Other 2,750,597 18.4% MMDA & Savings 5,404,475 36.1% Retail Time Deposits 1,394,817 9.3% Jumbo Time Deposits 1,618,186 10.8% Total Deposits $14,978,459 100.0% Cost of Deposits: 0.30% Cost of Deposits: 0.35% Cost of Deposits: 0.30% Demand Deposits 25.7% NOW & Other 20.2% MMDA & Savings 34.0% Retail Time Deposits 9.2% Jumbo Time Deposits 10.9% Demand Deposits 24.1% NOW & Other 7.1% MMDA & Savings 48.2% Retail Time Deposits 10.2% Jumbo Time Deposits 10.3% Demand Deposits 25.4% NOW & Other 18.4% MMDA & Savings 36.1% Retail Time Deposits 9.3% Jumbo Time Deposits 10.8% Source: SNL Financial and FVNB company documents; Data as of March 31, 2013 Note: Pro forma deposit composition excludes fair value purchase accounting adjustments Prosperity deposit composition pro forma for Coppermark Bancshares, Inc. acquisition and excludes purchase accounting adjustments FVNB deposit data per regulatory filings; Sweep accounts data supplemented by company documents |
 10 Transaction Terms Transaction Terms Merger Partner: FVNB Corp. (“FVNB”) Aggregate Deal Value: $374.2 million (1) Consideration Structure: 5,570,818 shares of Prosperity and $91.25 million of cash Consideration Mix: 76% stock / 24% cash (1) Termination Fee: $15.0 million plus expenses incurred by Prosperity up to $750,000 Required Approvals: Customary regulatory approval; FVNB shareholder approval Due Diligence: Completed Anticipated Closing: Fourth quarter of 2013 (1) Based on Prosperity’s closing stock price on June 26, 2013 |
 Aggregate Deal Value ($mm) $374.2 Transaction Multiples LTM Earnings ($21.1mm) 17.7x 2013 Annualized Earnings ($25.5mm) 14.7x Book Value ($194.4mm) 1.92x Tangible Book Value ($147.2mm) 2.54x Core Deposit Premium ($1,925.9mm) 11.8% 11 Transaction Summary Transaction Summary Source: FVNB company documents; Balance sheet data as of March 31, 2013 (1) Based on Prosperity’s closing stock price on June 26, 2013 (2) Equal to aggregate deal value less FVNB’s tangible common equity as a percentage of core deposits; Core deposits defined as total deposits less jumbo time deposits (greater than $100,000) (1) (2) |
 12 Management Retention Management Retention Prosperity Bank has placed a very high value on the existing FVNB leadership team and has extended numerous individual employment offer agreements to members of FVNB. Among them, the following executive leaders will join Prosperity Bank in the following capacity: FVNB Member Current Role Prosperity Bank Position Chairman & CEO M. Russell Marshall Kenneth Vickers John Zacek Chief Lending Officer Executive Vice President of the Victoria Region Chairman – Wealth Management/Private Banking Senior Executive Vice President Executive Loan Committee President – South Texas Area |
 13 Financial Impact Financial Impact Source: SNL Financial and FVNB company documents Note: Prosperity Bancshares, Inc. pro forma for Coppermark Bancshares, Inc. acquisition and subsequent $300 million borrowings pay down (1) Includes estimated purchase accounting adjustments; Includes impact of $18.0 million SBLF redemption Prosperity Bancshares, Inc. FVNB Corp. Pro Forma (1) Financial Impact 03/31/13 03/31/13 12/31/13 Balance Sheet ($mm) Total Assets $16,107.7 $2,410.5 $18,574.1 Gross Loans HFI 6,094.7 1,607.7 7,677.5 Total Deposits 12,879.4 2,147.2 15,007.9 Tangible Common Equity 944.0 147.2 1,132.9 Regulatory Capital (%) TCE / TA (%) 6.39% 6.23% 6.65% Leverage Ratio (%) 7.02% 8.73% 7.47% Tier 1 Capital Ratio (%) 13.64% 12.48% 13.76% Total Capital Ratio (%) 14.38% 13.74% 14.37% |
 |