 Merger with F&M Bancorporation Inc. August 29, 2013 Exhibit 99.1 |
 2 “Safe Harbor” Statement “Safe Harbor” Statement under the Private Securities Litigation Reform Act of 1995 Statements contained in this presentation which are not historical facts and which pertain to future operating results of Prosperity Bancshares ® and its subsidiaries constitute “forward-looking statements” within the meaning of the Private Securities Litigation Reform Act of 1995. These forward-looking statements involve significant risks and uncertainties. Actual results may differ materially from the results discussed in these forward-looking statements. Factors that might cause such a difference include, but are not limited to, those discussed in the company’s periodic filings with the SEC. Copies of the SEC filings for Prosperity Bancshares ® may be downloaded from the Internet at no charge from www.prosperitybankusa.com. |
 3 Strategic Rationale Strategic Rationale • Expands Prosperity’s presence to the economically attractive Tulsa market: • Bolsters commercial lending efforts: • Adds the well-established F&M Private Bank • Accretive to earnings per share: • Prosperity will remain well-capitalized • Combined company will surpass $20 billion in total assets (1) (1) Based on 6/30/13 financial data; pro forma for pending acquisition of FVNB Corp. – F&M is currently the 2nd largest bank in Tulsa (by deposits) – Combined franchise would be the 7th largest bank in Oklahoma (by deposits) – Adds significant C&I lending focus, including expertise in energy lending – Commercial clients in both Oklahoma and Texas – Complementary to existing Prosperity trust and wealth management businesses – Consistent with recently announced acquisition of FVNB Corp. – F&M’s 2013 year-to-date efficiency ratio was 76.4% – Estimated cost savings of 25% - 30% |
 4 Continued Oklahoma Expansion Continued Oklahoma Expansion Source: SNL Financial * Branch count excludes duplicative drive-thru locations PB* (219) FVNB* (34) FMBC (13) |
 5 Enhances Oklahoma Market Share Enhances Oklahoma Market Share (1) (2) Source: SNL Financial Note: Deposit data as of 6/30/12 Rank Institution (ST) Number of Branches Deposits in Market ($mm) Market Share (%) 1 BOK Financial Corp. (OK) 82 10,313 13.9 2 BancFirst Corp. (OK) 100 5,120 6.9 3 Midland Financial Co. (OK) 55 5,007 6.7 4 Arvest Bank Group Inc. (AR) 101 4,096 5.5 5 JPMorgan Chase & Co. (NY) 33 3,638 4.9 6 Bank of America Corp. (NC) 33 3,202 4.3 Pro Forma 19 2,889 3.9 7 F & M Bancorp. Inc. (OK) 10 1,811 2.4 8 RCB Holding Co. (OK) 30 1,615 2.2 9 Durant Bancorp Inc. (OK) 24 1,546 2.1 10 Southwest Bancorp Inc. (OK) 13 1,381 1.9 11 International Bancshares Corp. (TX) 52 1,313 1.8 12 Prosperity Bancshares Inc. (TX) 9 1,078 1.5 13 Olney Bancshares of Texas Inc. (TX) 19 972 1.3 14 Spirit BankCorp Inc. (OK) 14 879 1.2 15 Ironhorse Financial Group Inc. (OK) 22 877 1.2 Top 15 597 42,848 57.7 Total 1,391 74,258 100.0 Oklahoma Deposit Market Share |
 6 Growing Markets of Operation Growing Markets of Operation (1) (2) Tulsa Dallas • With a population of over one million in the Tulsa MSA, it ranks as the 2nd largest city, and most densely populated county in Oklahoma • Diversified economy inclusive of Energy, Finance, Aviation, Telecommunications and Technology • Tulsa Port of Catoosa and Tulsa International Airport are home to extensive industrial parks • Consistently rated among the best cities in the country to do business with by Forbes magazine • Tulsa manufacturing accounts for 60% of Oklahoma’s exports and GDP growth ranks in the top third nationally • The Dallas/Ft. Worth MSA is the largest MSA in the state of Texas and the 4th largest in the United States • The metropolitan area is a major economic hub for the North Texas region, is the home to 19 Fortune 500 companies and has the third busiest airport in the world • 2011 GDP of nearly $400 billion, with a population of 6.5 million and growing • Home to AT&T, American Airlines, Texas Instruments and Lockheed Martin, Dallas/Ft. Worth represents one of the most attractive economies in the United States |
 7 Source: F&M internal documents • Founded in 1946, F&M Bank is the 4th largest bank headquartered in Oklahoma • Operates 13 total locations in the Tulsa (10) and Dallas (3) areas • Consistent balance sheet growth through the cycle • Markets of operation are both economically and demographically attractive Financial Highlights: F&M Bancorporation Inc. Financial Highlights: F&M Bancorporation Inc. Year ended, Year to Date Dollars in Thousands 12/31/2010 12/31/2011 12/31/2012 6/30/2013 Balance Sheet Total Assets 1,560,876 2,021,290 2,309,714 2,436,656 Net Loans (Including HFS) 1,122,138 1,473,187 1,859,216 1,876,423 Securities 45,488 31,882 69,034 112,364 Deposits 1,409,602 1,798,170 2,073,762 2,208,371 Borrowings 57,390 49,497 57,386 45,340 Total Equity (Including Minority Interest) 93,884 156,919 161,535 169,766 Tangible Common Equity 91,470 118,697 123,313 131,544 Balance Sheet Ratios Loans / Deposits (%) 80.5 83.0 90.9 86.0 TCE / TA (%) 5.9 5.9 5.3 5.4 Leverage Ratio (%) 8.4 10.1 9.3 9.1 Tier 1 Capital Ratio (%) 9.9 12.0 10.0 10.2 Total Capital Ratio (%) 11.5 13.2 11.3 11.3 Income Statement Net Interest Income 49,892 59,219 78,946 42,284 Provision Expense 7,781 29,954 10,939 350 Noninterest Income (Including Securities Gains) 16,358 10,695 15,280 6,791 Noninterest Expense 49,576 55,747 62,769 37,514 Gain / Loss on Securities 358 (63) 376 0 Pre-tax Income 8,893 (15,787) 20,518 11,211 Net Income Available to Common Shareholders 5,704 (8,131) 12,179 6,869 Profitability Ratios ROAA (%) 0.46 (0.41) 0.61 0.60 ROAE (%) 7.20 (6.34) 8.39 8.45 Net Interest Margin (%) 3.58 3.54 3.96 3.78 Efficiency Ratio (%) 75.2 79.7 66.9 76.4 Fee Income / Operating Revenue (%) 24.3 15.4 15.9 13.8 Per Share Information Weighted Average Common Shares Outstanding 2,094 2,455 3,337 3,348 Tangible Book Value per Share ($) 43.68 34.94 33.90 34.69 Dividends ($) 1.00 1.20 2.50 0.26 Earnings Per Share ($) 2.72 (3.31) 3.65 1.84 |
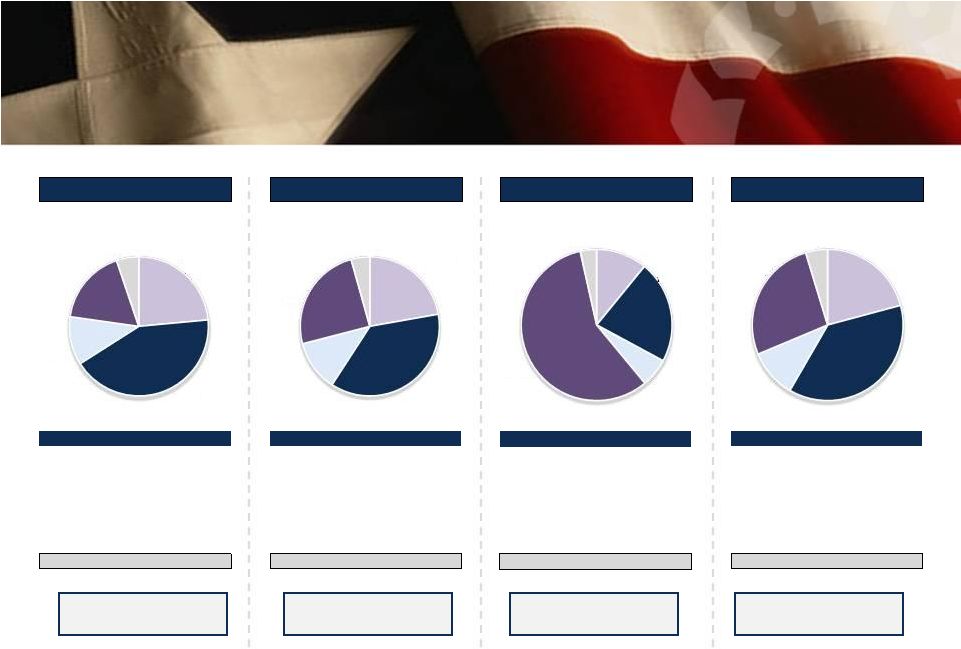 8 Pro Forma Loan Composition Pro Forma Loan Composition Source: SNL Financial; data as of or for the quarter ended 6/30/13 Note: Pro forma loan composition excludes purchase accounting adjustments Loan composition per GAAP and regulatory filings Prosperity Bancshares, Inc. Pro Forma Yield on Loans: 5.89% Loans / Deposits: 49.4% Yield on Loans: 5.25% Loans / Deposits: 76.7% Yield on Loans: 5.61% Loans / Deposits: 57.6% FVNB Corp. F&M Bancorporation Inc. Yield on Loans: 5.01% Loans / Deposits: 86.0% Residential R.E. 23.5% Commercial R.E. 42.5% Construction 11.3% Commercial & Industrial 17.6% Consumer & Other 5.2% Residential R.E. 22.2% Commercial R.E. 37.0% Construction 11.8% Commercial & Industrial 24.7% Consumer & Other 4.3% Residential R.E., 10.9% Commercial R.E., 21.9% Construction 6.1% Commercial & Industrial, 57.5% Consumer & Other, 3.5% Residential R.E., 20.8% Commercial R.E., 37.5% Construction, 10.3% Commercial & Industrial, 26.6% Consumer & Other, 4.7% Loan Portfolio ($000) Amount % Residential R.E. 1,452,268 23.5% Commercial R.E. 2,621,209 42.5% Construction 694,585 11.3% Commercial & Industrial 1,084,233 17.6% Consumer & Other 320,188 5.2% Total Loans & Leases $6,172,483 100% Loan Portfolio ($000) Amount % Residential R.E. 366,066 22.2% Commercial R.E. 609,124 37.0% Construction 194,510 11.8% Commercial & Industrial 407,073 24.7% Consumer & Other 71,499 4.3% Total Loans & Leases $1,648,272 100.0% Loan Portfolio ($000) Amount % Residential R.E. 207,400 10.9% Commercial R.E. 417,060 21.9% Construction 116,309 6.1% Commercial & Industrial 1,092,694 57.5% Consumer & Other 66,672 3.5% Total Loans & Leases $1,900,135 100.0% Loan Portfolio ($000) Amount % Residential R.E. $2,025,734 20.8% Commercial R.E. $3,647,393 37.5% Construction $1,005,404 10.3% Commercial & Industrial $2,584,000 26.6% Consumer & Other $458,359 4.7% Total Loans & Leases $9,720,890 100.0% |
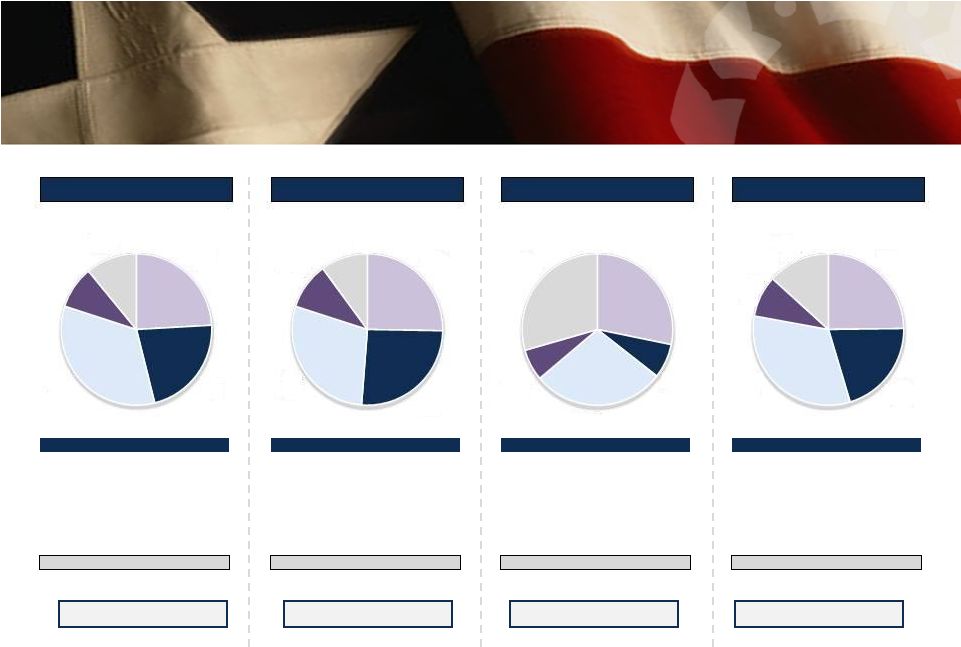 9 Pro Forma Deposit Composition Pro Forma Deposit Composition Cost of Deposits: 0.30% Cost of Deposits: 0.32% Cost of Deposits: 0.32% Cost of Deposits: 0.42% Deposit Portfolio ($000) Amount % Demand Deposits 3,016,205 24.1% NOW & Other 2,750,305 22.0% MMDA & Savings 4,240,094 33.9% Retail Time Deposits 1,133,753 9.1% Jumbo Time Deposits 1,368,293 10.9% Total Deposits $12,508,650 100% Deposit Portfolio ($000) Amount % Demand Deposits 543,526 25.3% NOW & Other 557,891 25.9% MMDA & Savings 617,807 28.7% Retail Time Deposits 214,234 10.0% Jumbo Time Deposits 216,421 10.1% Total Deposits $2,149,879 100.0% Deposit Portfolio ($000) Amount % Demand Deposits 623,374 28.2% NOW & Other 162,491 7.4% MMDA & Savings 623,468 28.2% Retail Time Deposits 148,587 6.7% Jumbo Time Deposits 650,451 29.5% Total Deposits $2,208,371 100.0% Deposit Portfolio ($000) Amount % Demand Deposits $4,183,105 24.8% NOW & Other $3,470,687 20.6% MMDA & Savings $5,481,369 32.5% Retail Time Deposits $1,496,574 8.9% Jumbo Time Deposits $2,235,165 13.3% Total Deposits $16,866,900 100.0% Prosperity Bancshares, Inc. Pro Forma FVNB Corp. F&M Bancorporation Inc. Demand Deposits, 24.1% NOW & Other, 22.0% MMDA & Savings, 33.9% Retail Time Deposits, 9.1% Jumbo Time Deposits, 10.9% Demand Deposits, 25.3% NOW & Other, 25.9% MMDA & Savings, 28.7% Retail Time Deposits, 10.0% Jumbo Time Deposits, 10.1% Demand Deposits, 28.2% NOW & Other, 7.4% MMDA & Savings, 28.2% Retail Time Deposits, 6.7% Jumbo Time Deposits, 29.5% Demand Deposits, 24.8% NOW & Other, 20.6% MMDA & Savings, 32.5% Retail Time Deposits, 8.9% Jumbo Time Deposits, 13.3% Source: SNL Financial; data as of or for the quarter ended 6/30/13 Note: Pro forma deposit composition excludes purchase accounting adjustments Deposit composition per GAAP and regulatory filings |
 10 Transaction Terms Transaction Terms Merger Partner: F&M Bancorporation Inc. (OTC: FMBC) Aggregate Deal Value: $243.9 million (1) Consideration Structure: 3,298,246 shares of Prosperity and $47.0 million of cash Consideration Mix: 81% stock / 19% cash (1) Termination Fee: $10.0 million plus expenses incurred by Prosperity up to $750,000 Required Approvals: Customary regulatory approval; F&M shareholder approval Due Diligence: Completed Anticipated Closing: First quarter of 2014 (1) Based on a per share price of Prosperity Bancshares, Inc. common stock of $59.69, which represents the closing price as of 8/28/13 |
 11 Transaction Summary Transaction Summary Aggregate Deal Value ($mm) (1) $243.9 Transaction Multiples LTM Earnings ($15.3mm) 16.0x Book Value ($131.5mm) 1.85x Tangible Book Value ($131.5mm) 1.85x Most Recent Quarter Annualized Earnings ($13.7mm) 17.8x Core Deposit Premium ($1,558mm) (2) 7.2% Source: SNL Financial F&M’s financials are as of and for the period ended 6/30/13 (1) Based on a per share price of Prosperity Bancshares, Inc. common stock of $59.69, which represents the closing price as of 8/28/13 (2) Equal to aggregate deal value less F&M’s tangible common equity as a percentage of core deposits; core deposits defined as total deposits less jumbo time deposits (greater than $100,000) |
 12 Management Retention Management Retention Prosperity has placed a very high value on the existing F&M leadership team and has extended numerous individual employment agreements to members of the production staff, including existing loan officers and several managers and supervisory personnel. In addition, the executive leaders listed below will join Prosperity in the following capacity: F&M Member Current Role Prosperity Bank Position Anthony Davis Chairman and CEO Chairman – Tulsa Area / Turtle Creek Banking Center Eric Davis President Vice Chairman – Tulsa Area / Turtle Creek Banking Center Jeff Pickryl President of F&M Bank President – Tulsa Area / Turtle Creek Banking Center |
 13 Financial Impact Financial Impact Source: SNL Financial Note: Includes impact of the redemption of FVNB’s $18.0 million SBLF preferred and F&M’s $38.2 million SBLF preferred (1) Pro Forma includes both the pending merger with FVNB Corp. and the proposed merger with F&M Bancorporation Inc.; estimated closing for the FVNB Corp. merger is the 4th quarter of 2013; estimated closing for the F&M merger is the 1st quarter of 2014 Includes estimated purchase accounting adjustments Assumes no asset growth from 6/30/13 through 3/31/14 PB Prosperity Bancshares, Inc. FVNB Corp. F&M Bancorporation Inc. Pro Forma (1) Financial Impact 6/30/13 6/30/13 6/30/13 3/31/14 Balance Sheet ($mm) Total Assets $16,270.7 $2,417.1 $2,436.7 $21,272.4 Gross Loans 6,172.5 1,648.3 1,900.1 9,671.0 Total Deposits 12,508.7 2,149.9 2,208.4 16,866.9 Tangible Common Equity 967.8 151.6 131.5 1,214.7 Capital (%) TCE / TA (%) 6.50% 6.40% 5.40% 6.23% Leverage Ratio (%) 7.07% 8.72% 9.13% 7.09% Tier 1 Capital Ratio (%) 14.15% 12.58% 10.15% 12.34% Total Capital Ratio (%) 14.91% 13.83% 11.28% 12.85% |
 |