
Investor Day Presentation June 15, 2021 Exhibit 99.2

A Repositioned Company: Executing a Clear Strategy to Deliver Sustained Growth Chris Walters President & CEO
Forward-Looking Statements and Non-GAAP Financial Measures Forward-Looking Statements This presentation contains forward-looking statements within the meaning of Section 27A of the Securities Act of 1933 and Section 21E of the Securities Exchange Act of 1934. These forward-looking statements generally are identified by the words “anticipate,” “believe,” “plan,” “project,” “expect,” “future,” “going to,” “guidance,” “intend,” “may,” “will,” “should,” “could,” “would,” “estimate,” “predict,” “opportunity,” “potential,” “continue,” “target,” and similar expressions and include topics such as our outlook and expectations concerning future performance. Actual results may differ significantly from management’s expectations due to various risks and uncertainties including, but not limited to: the impact of the COVID-19 pandemic on our results of operations and our business, including the impact of the resulting economic and market disruption, the extension of tax filing deadlines, and other related government actions; our ability to effectively implement our future business plans and growth strategy; our ability to effectively compete within our industry; our ability to attract and retain financial professionals, qualified employees, clients, and customers, as well as our ability to provide strong customer/client service; our ability to close, finance, and realize all of the anticipated benefits of acquisitions, as well as our ability to integrate the operations of recently acquired businesses, and the potential impact of such acquisitions on our existing indebtedness and leverage; our future capital requirements and the availability of financing and our ability to meet our current and future debt service obligations and maintain compliance with our debt covenants; any downgrade of our credit ratings; our ability to generate strong investment performance for our clients and the impact of the financial markets on our clients’ portfolios; the impact of new or changing legislation and regulations (or interpretations thereof) on our business, including our ability to successfully address and comply with such legislation and regulations (or interpretations thereof) and increased costs, reductions of revenue, and potential fines, penalties, or disgorgement to which we may be subject as a result thereof; risks, burdens, and costs, including fines, penalties, or disgorgement, associated with our business being subjected to regulatory inquiries, investigations, or initiatives, including those of the Financial Industry Regulatory Authority, Inc. and the U.S. Securities and Exchange Commission (“SEC”); risks associated with legal proceedings, including litigation and regulatory proceedings; our ability to manage leadership and employee transitions, including costs and time burdens on management and our board of directors related thereto; political and economic conditions and events that directly or indirectly impact the wealth management and tax preparation software industries; our ability to respond to rapid technological changes, including our ability to successfully release new products and services or improve upon existing products and services; the compromising of confidentiality, availability or integrity of information, including cyberattacks; our expectations concerning the revenues we generate from fees associated with the financial products that we distribute; risks related to goodwill and other intangible asset impairment; our ability to develop, establish, and maintain strong brands; risks associated with the use and implementation of information technology and the effect of security breaches, computer viruses, and computer hacking attacks; our ability to comply with laws and regulations regarding privacy and protection of user data; our ability to maintain our relationships with third party partners, providers, suppliers, vendors, distributors, contractors, financial institutions, industry associations, and licensing partners, and our expectations regarding and reliance on the products, tools, platforms, systems, and services provided by these third parties; our beliefs and expectations regarding the seasonality of our business; our assessments and estimates that determine our effective tax rate; our ability to protect our intellectual property and the impact of any claim that we have infringed on the intellectual property rights of others. A more detailed description of these and certain other factors that could affect actual results is included in in Blucora’s most recent Annual Report on Form 10-K for the year ended December 31, 2020 filed with the SEC on February 26, 2021 and subsequent reports filed with or furnished to the SEC. Readers are cautioned not to place undue reliance on these forward-looking statements, which speak only as of the date of this presentation and reflect our good faith beliefs, assumptions and expectations, but they are not guarantees of future performance or events. We disclaim any obligation to update or revise any forward-looking statements to reflect changes in underlying assumptions, factors, or expectations, new information, data or methods, future events or other changes after the date of this presentation, except as may be required by law. Third-Party Information and Market and Industry Data We have neither sought nor obtained consent from any third party for the use of previously published information. Any such statements or information should not be viewed as indicating the support of such third party for the views expressed herein. We shall not be responsible or have any liability for any misinformation contained in any third-party report, SEC or other regulatory filing. All registered or unregistered service marks, trademarks and trade names referred to in this presentation are the property of their respective owners, and our use herein does not imply an affiliation with, or endorsement by, the owners of these service marks, trademarks and trade names. The data included in this presentation regarding our industries, including trends in the market and the Company’s position and the position of its competitors within our industries, are based on the Company’s estimates, which have been derived from management’s knowledge and experience in our industries, and information obtained from customers, trade and business organizations, internal research, publicly available information, industry publications and surveys and other contacts in our industries. The Company has also cited information compiled by industry publications, governmental agencies and publicly available sources. Although the Company believes these third-party sources to be reliable, it has not independently verified the data obtained from these sources and we cannot assure you of the accuracy or completeness of the data. Estimates of market size and relative positions in a market are difficult to develop and inherently uncertain and the Company cannot assure you that it is accurate. Accordingly, you should not place undue weight on the industry and market share data presented in this presentation. Non-GAAP Financial Information This presentation contains non-GAAP financial measures relating to our performance. You can find the reconciliation of these measures to the most directly comparable GAAP financial measure in the Appendix at the end of this presentation. The non-GAAP financial measures disclosed by the Company should not be considered a substitute for, or superior to, the financial measures prepared in accordance with GAAP.
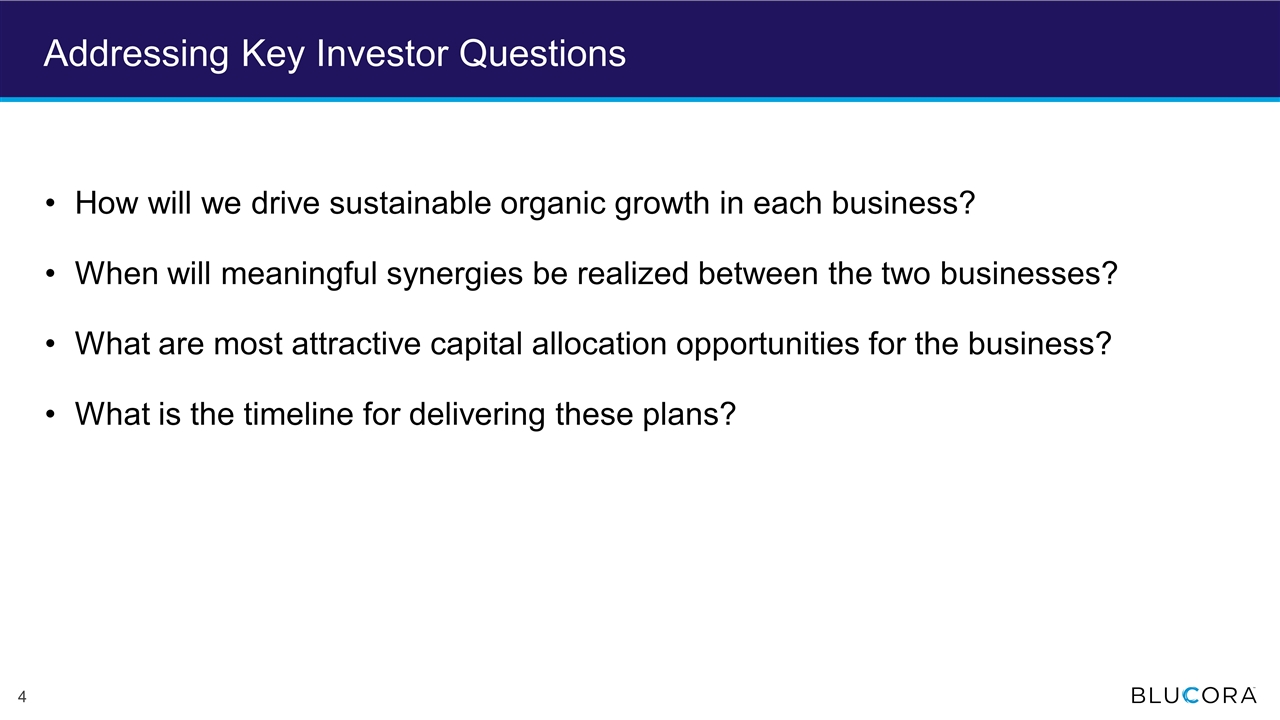
Addressing Key Investor Questions How will we drive sustainable organic growth in each business? When will meaningful synergies be realized between the two businesses? What are most attractive capital allocation opportunities for the business? What is the timeline for delivering these plans?
Blucora – Repositioned to Deliver Sustainable Growth Solid progress repositioning Blucora Building on two strong businesses Executing clear, sustainable growth strategy Delivering strong results
Blucora – Repositioned to Deliver Sustainable Growth Solid progress repositioning Blucora Building on two strong businesses Executing clear, sustainable growth strategy Delivering strong results
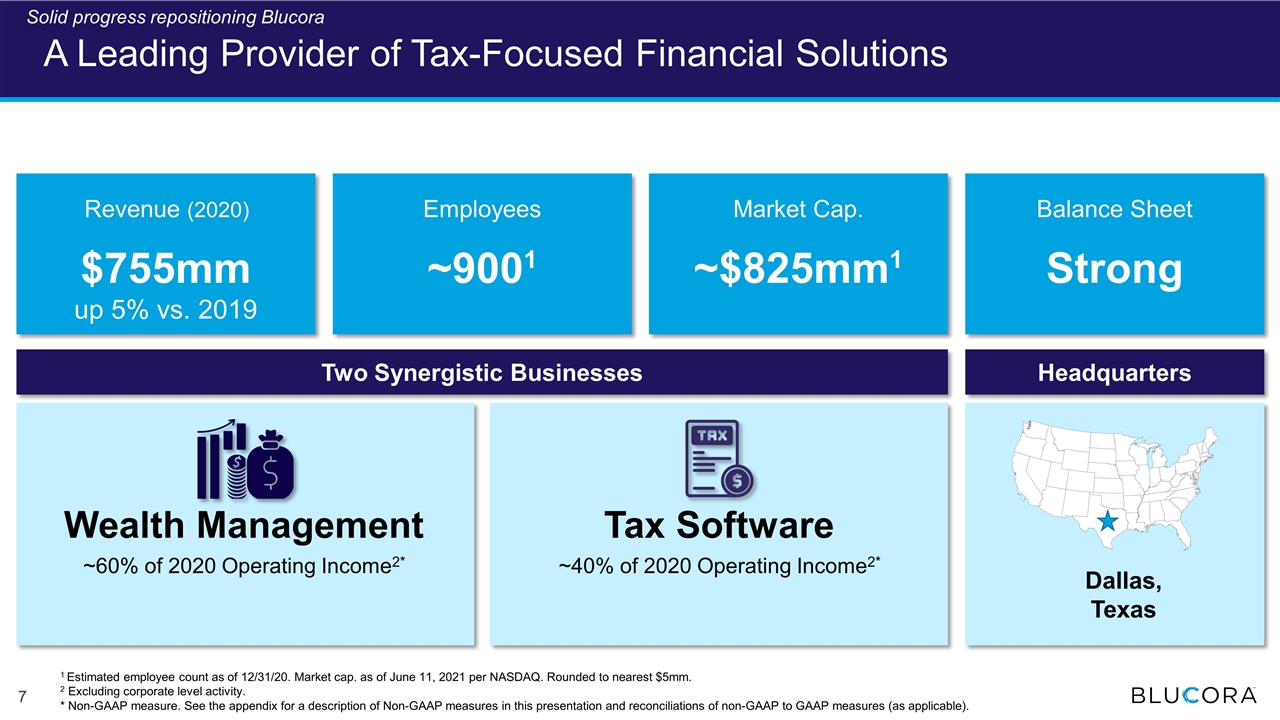
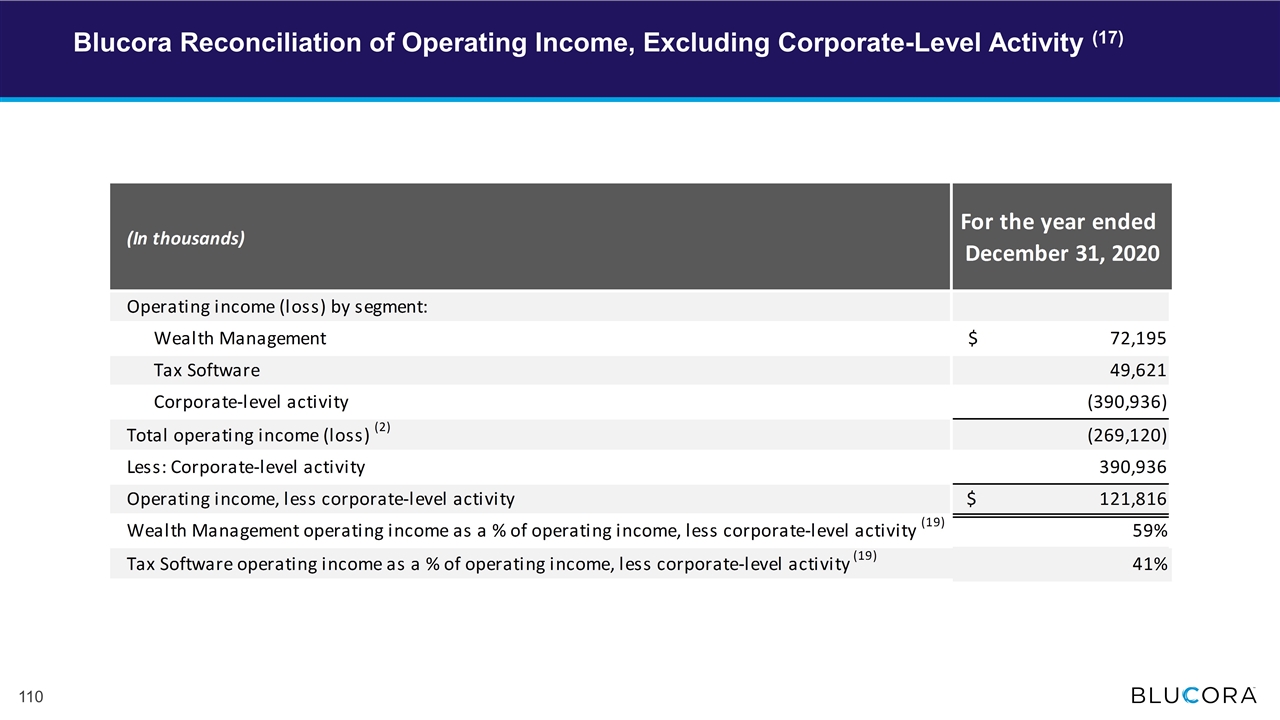
A Leading Provider of Tax-Focused Financial Solutions Revenue (2020) $755mm up 5% vs. 2019 Employees ~9001 Market Cap. ~$825mm1 Balance Sheet Strong Two Synergistic Businesses Dallas, Texas Wealth Management ~60% of 2020 Operating Income2* Tax Software ~40% of 2020 Operating Income2* Headquarters 1 Estimated employee count as of 12/31/20. Market cap. as of June 11, 2021 per NASDAQ. Rounded to nearest $5mm. 2 Excluding corporate level activity. * Non-GAAP measure. See the appendix for a description of Non-GAAP measures in this presentation and reconciliations of non-GAAP to GAAP measures (as applicable). Solid progress repositioning Blucora
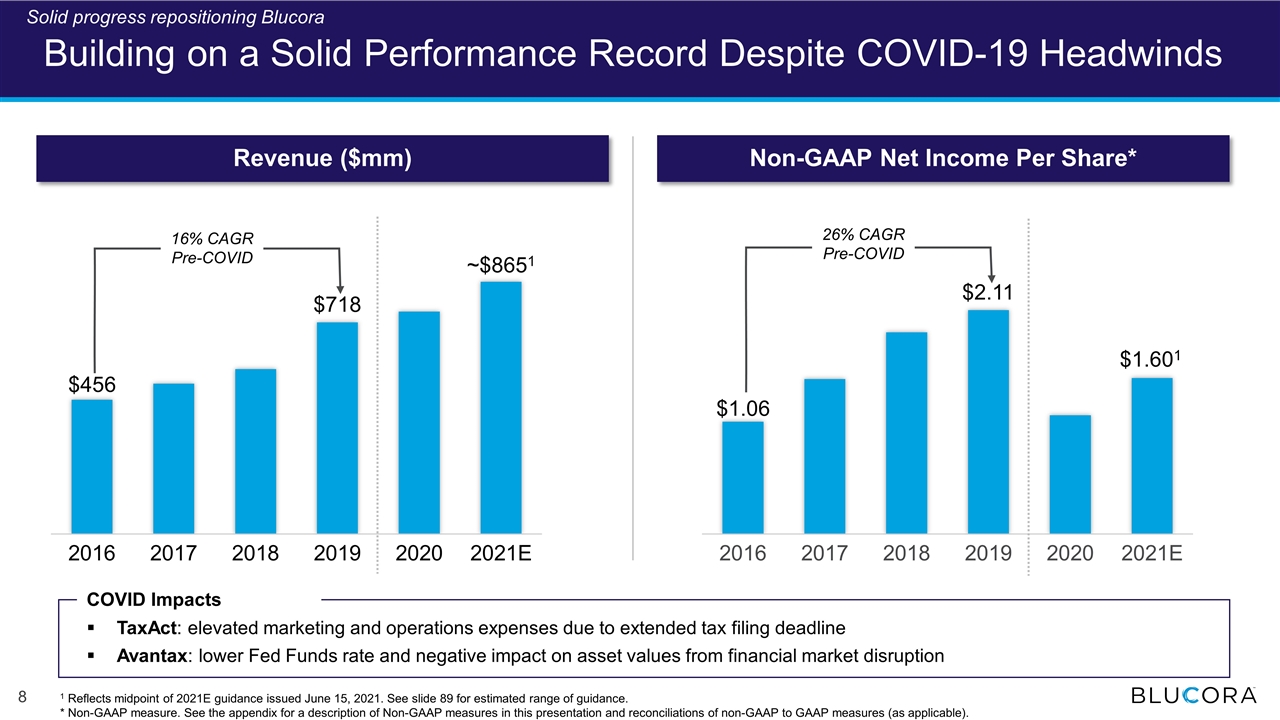
Building on a Solid Performance Record Despite COVID-19 Headwinds ~$8651 $1.601 $456 $1.06 Revenue ($mm) Non-GAAP Net Income Per Share* 16% CAGR Pre-COVID 26% CAGR Pre-COVID 1 Reflects midpoint of 2021E guidance issued June 15, 2021. See slide 89 for estimated range of guidance. * Non-GAAP measure. See the appendix for a description of Non-GAAP measures in this presentation and reconciliations of non-GAAP to GAAP measures (as applicable). COVID Impacts TaxAct: elevated marketing and operations expenses due to extended tax filing deadline Avantax: lower Fed Funds rate and negative impact on asset values from financial market disruption Solid progress repositioning Blucora

Our Repositioning is Well Underway Built scale in two segments – tax-focused software and wealth management Divested unrelated businesses New leadership team Refined sustainable growth strategy Managed through pandemic Executing new strategy with both organic and inorganic growth Build Platform Repositioning Sustainable Growth Blucora Share Price 2015 to 2019 2020 2021+ Solid progress repositioning Blucora
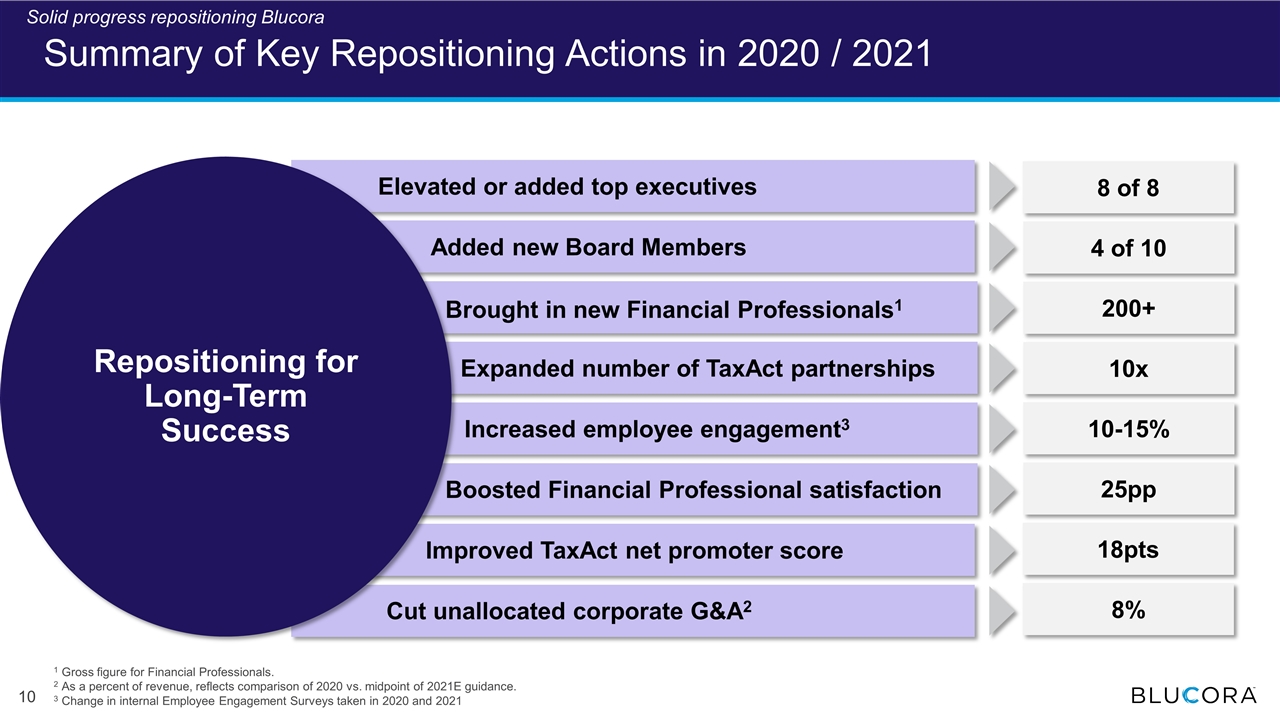
Summary of Key Repositioning Actions in 2020 / 2021 1 Gross figure for Financial Professionals. 2 As a percent of revenue, reflects comparison of 2020 vs. midpoint of 2021E guidance. 3 Change in internal Employee Engagement Surveys taken in 2020 and 2021 Repositioning for Long-Term Success Elevated or added top executives Added new Board Members Boosted Financial Professional satisfaction Expanded number of TaxAct partnerships Increased employee engagement3 Brought in new Financial Professionals1 Improved TaxAct net promoter score Cut unallocated corporate G&A2 18pts 200+ 8 of 8 4 of 10 25pp 10x 10-15% 8% Solid progress repositioning Blucora

Our Leadership: 8 Updates Since 2020 Jody Diaz Chief Human Resources Officer Raj Doshi Chief Growth and Marketing Officer Ann Bruder Chief Legal & Administration Officer Curtis Campbell President of TaxAct and Software Chris Walters* President & Chief Executive Officer Erin Gajdalo SVP of Operational Performance Todd Mackay President of Wealth Management Marc Mehlman Chief Financial Officer * On Board since 2014 and transitioned to current role. New Additions Solid progress repositioning Blucora Expanded Roles
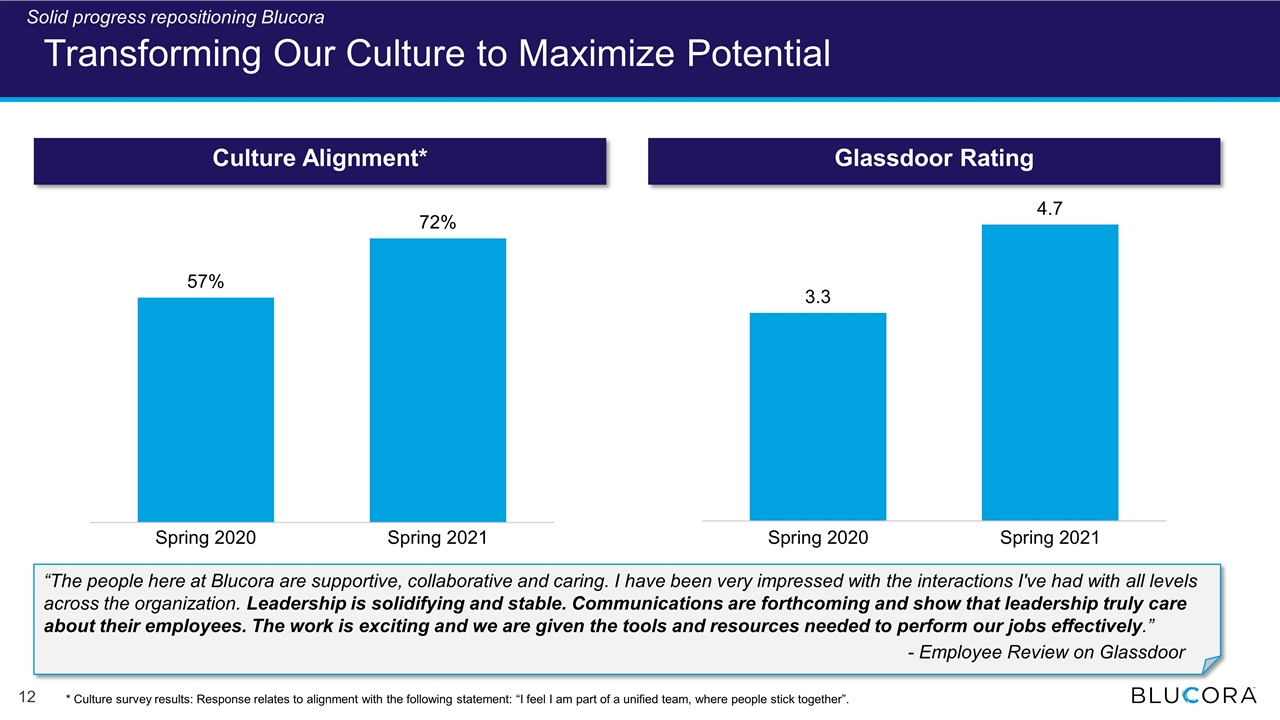
Transforming Our Culture to Maximize Potential Glassdoor Rating Culture Alignment* “The people here at Blucora are supportive, collaborative and caring. I have been very impressed with the interactions I've had with all levels across the organization. Leadership is solidifying and stable. Communications are forthcoming and show that leadership truly care about their employees. The work is exciting and we are given the tools and resources needed to perform our jobs effectively.” - Employee Review on Glassdoor * Culture survey results: Response relates to alignment with the following statement: “I feel I am part of a unified team, where people stick together”. Solid progress repositioning Blucora
Blucora – Repositioned to Deliver Sustainable Growth Solid progress repositioning Blucora Building on two strong businesses Executing clear, sustainable growth strategy Delivering strong results
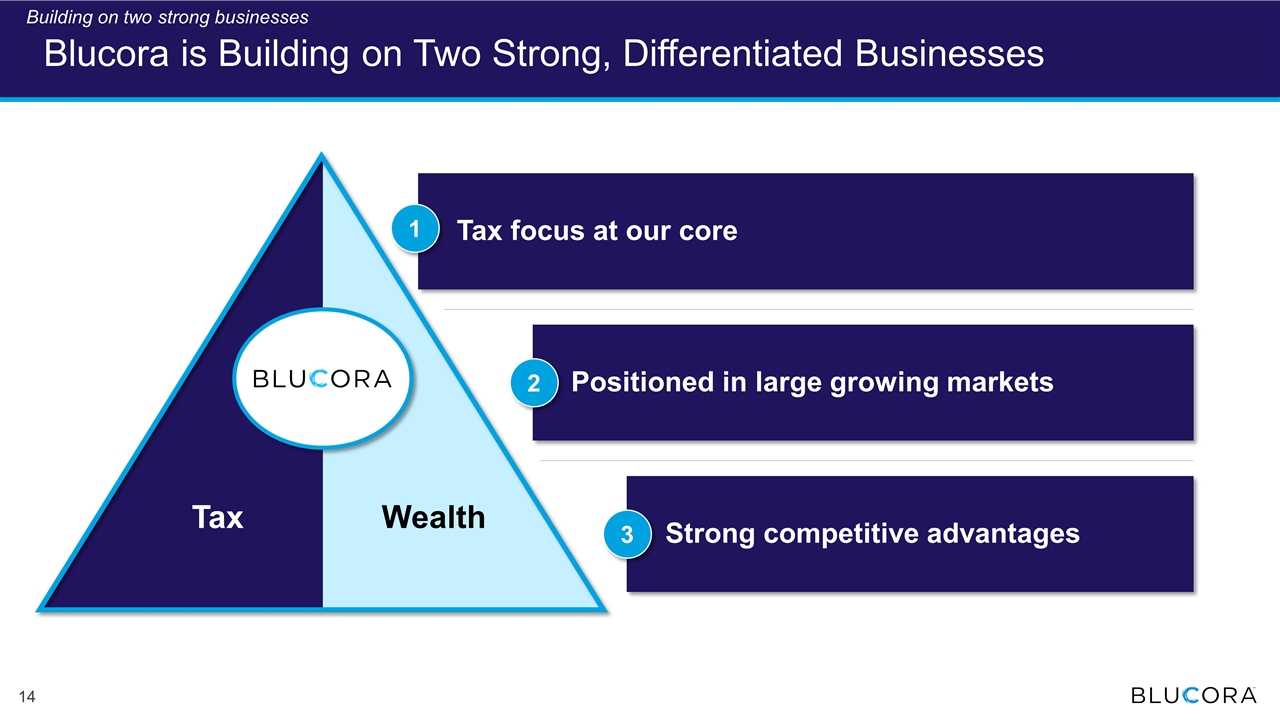
Tax focus at our core Positioned in large growing markets Strong competitive advantages 1 2 3 Blucora is Building on Two Strong, Differentiated Businesses Wealth Strong position in both segments Tax Building on two strong businesses
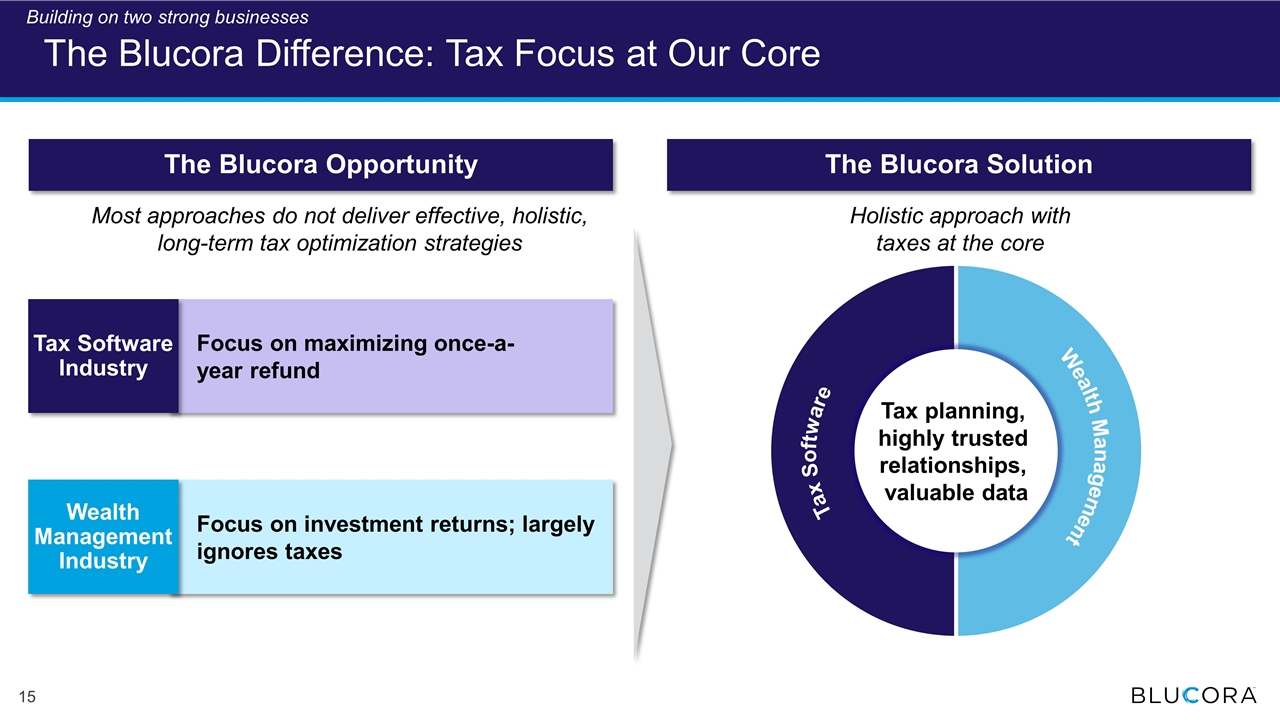
The Blucora Difference: Tax Focus at Our Core Most approaches do not deliver effective, holistic, long-term tax optimization strategies Holistic approach with taxes at the core Focus on maximizing once-a- year refund Tax Software Industry Focus on investment returns; largely ignores taxes Wealth Management Industry Tax planning, highly trusted relationships, valuable data Wealth Management Tax Software The Blucora Opportunity The Blucora Solution Building on two strong businesses
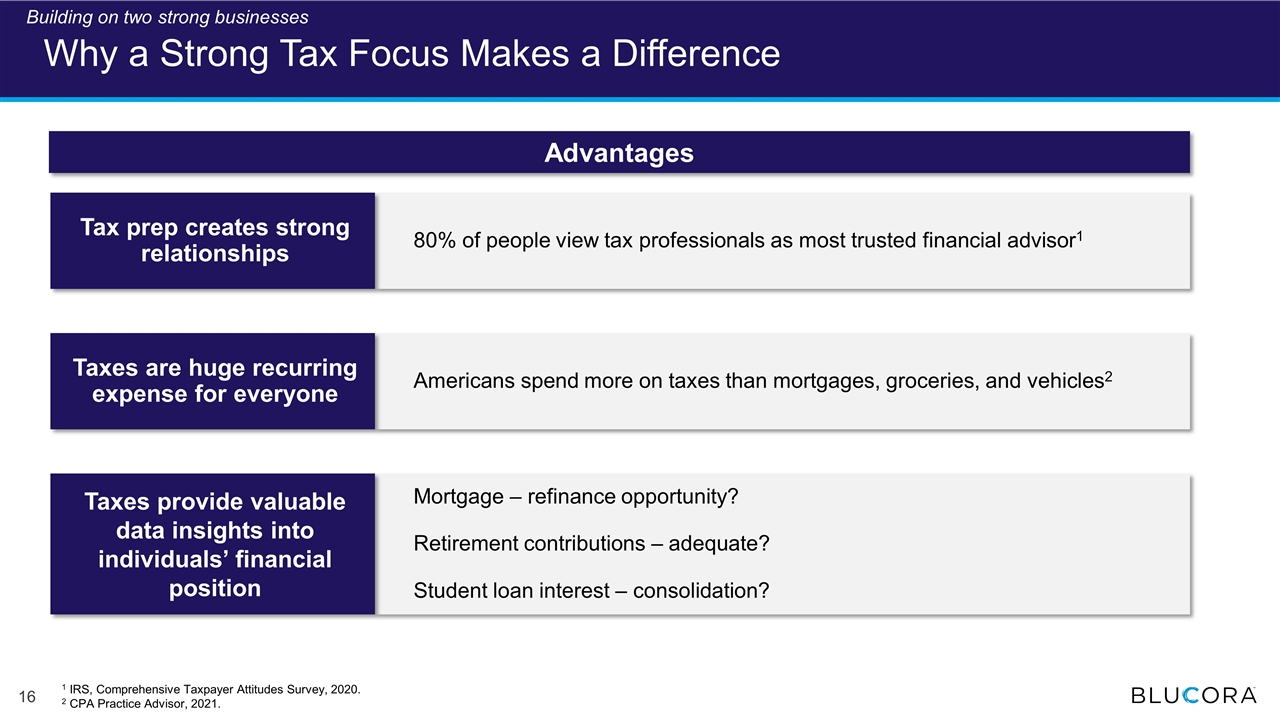
Americans spend more on taxes than mortgages, groceries, and vehicles2 Mortgage – refinance opportunity? Retirement contributions – adequate? Student loan interest – consolidation? Why a Strong Tax Focus Makes a Difference 80% of people view tax professionals as most trusted financial advisor1 Tax prep creates strong relationships Taxes are huge recurring expense for everyone Taxes provide valuable data insights into individuals’ financial position 1 IRS, Comprehensive Taxpayer Attitudes Survey, 2020. 2 CPA Practice Advisor, 2021. Advantages Building on two strong businesses
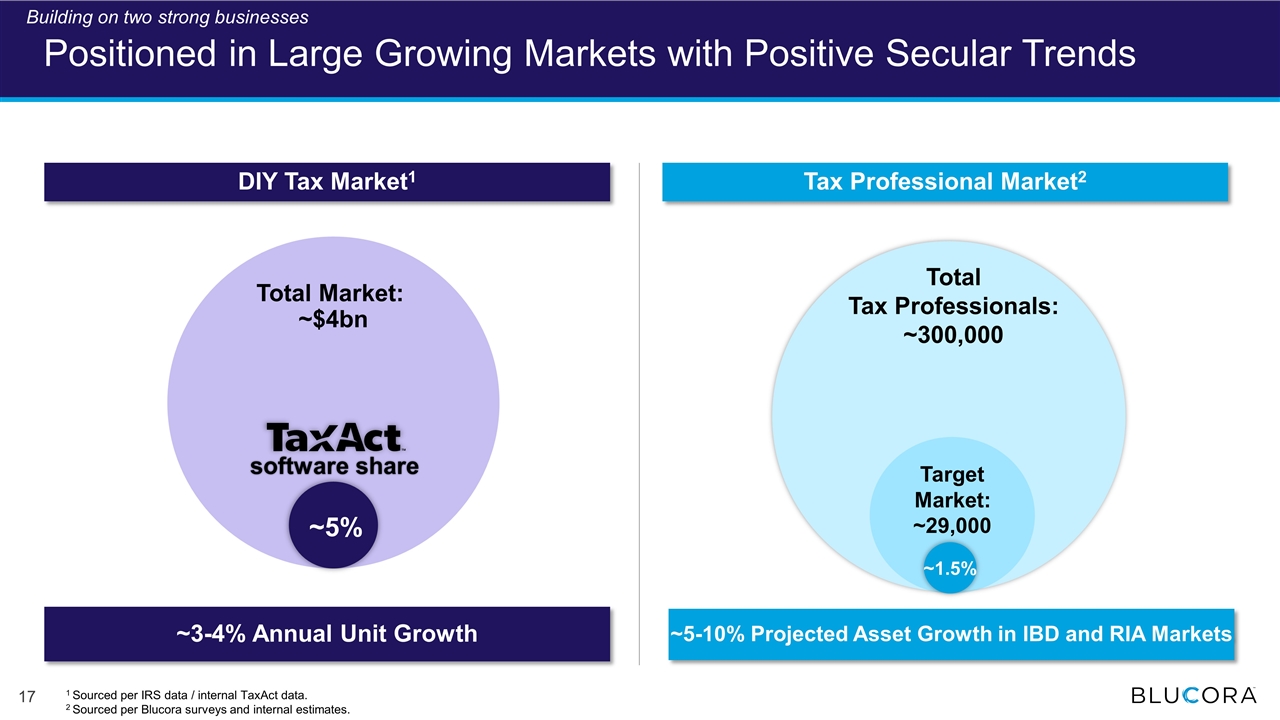
Positioned in Large Growing Markets with Positive Secular Trends DIY Tax Market1 Tax Professional Market2 ~3-4% Annual Unit Growth Total Market: ~$4bn ~5% software share 1 Sourced per IRS data / internal TaxAct data. 2 Sourced per Blucora surveys and internal estimates. Total Tax Professionals: ~300,000 Target Market: ~29,000 ~1.5% Building on two strong businesses ~5-10% Projected Asset Growth in IBD and RIA Markets
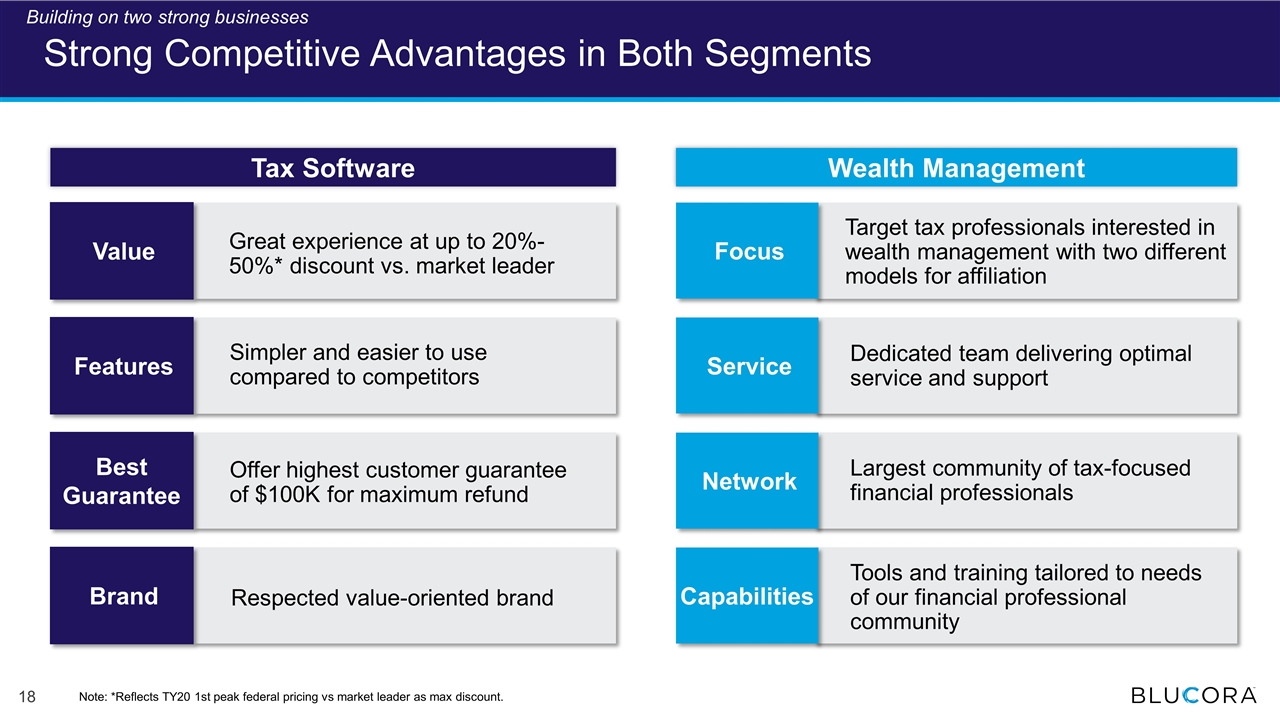
Strong Competitive Advantages in Both Segments Tax Software Value Features Best Guarantee Brand Great experience at up to 20%-50%* discount vs. market leader Simpler and easier to use compared to competitors Offer highest customer guarantee of $100K for maximum refund Respected value-oriented brand Wealth Management Focus Service Network Capabilities Target tax professionals interested in wealth management with two different models for affiliation Dedicated team delivering optimal service and support Largest community of tax-focused financial professionals Tools and training tailored to needs of our financial professional community Building on two strong businesses Note: *Reflects TY20 1st peak federal pricing vs market leader as max discount.
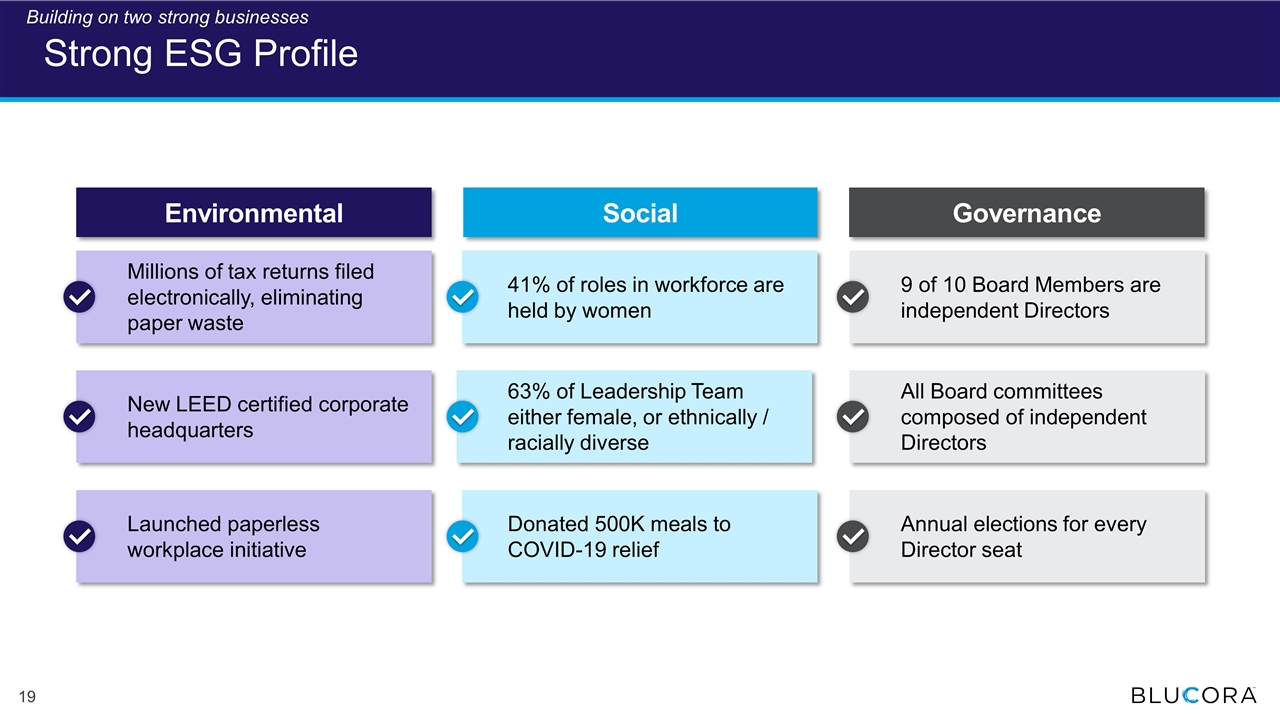
Strong ESG Profile Launched paperless workplace initiative Environmental Social Governance Millions of tax returns filed electronically, eliminating paper waste New LEED certified corporate headquarters Donated 500K meals to COVID-19 relief 41% of roles in workforce are held by women 63% of Leadership Team either female, or ethnically / racially diverse Annual elections for every Director seat 9 of 10 Board Members are independent Directors All Board committees composed of independent Directors Building on two strong businesses
Blucora – Repositioned to Deliver Sustainable Growth Solid progress repositioning Blucora Building on two strong businesses Executing clear, sustainable growth strategy Delivering strong results

Our Focused Strategy to Drive Sustainable Growth Propel conversion and retention through focus on customer experience Execute on Synergies Drive Net New Asset growth Enhance customer satisfaction with tech / tools Maximize operating leverage by reducing costs as a % of revenue Drive Customer Acquisition Investment in marketing, product enhancements and partnerships Maximize Customer Retention & Value Tax Software Wealth Management Surpass financial professionals’ expectations with improved service Investment in relationship management teams and technology enhancements Executing clear, sustainable growth strategy
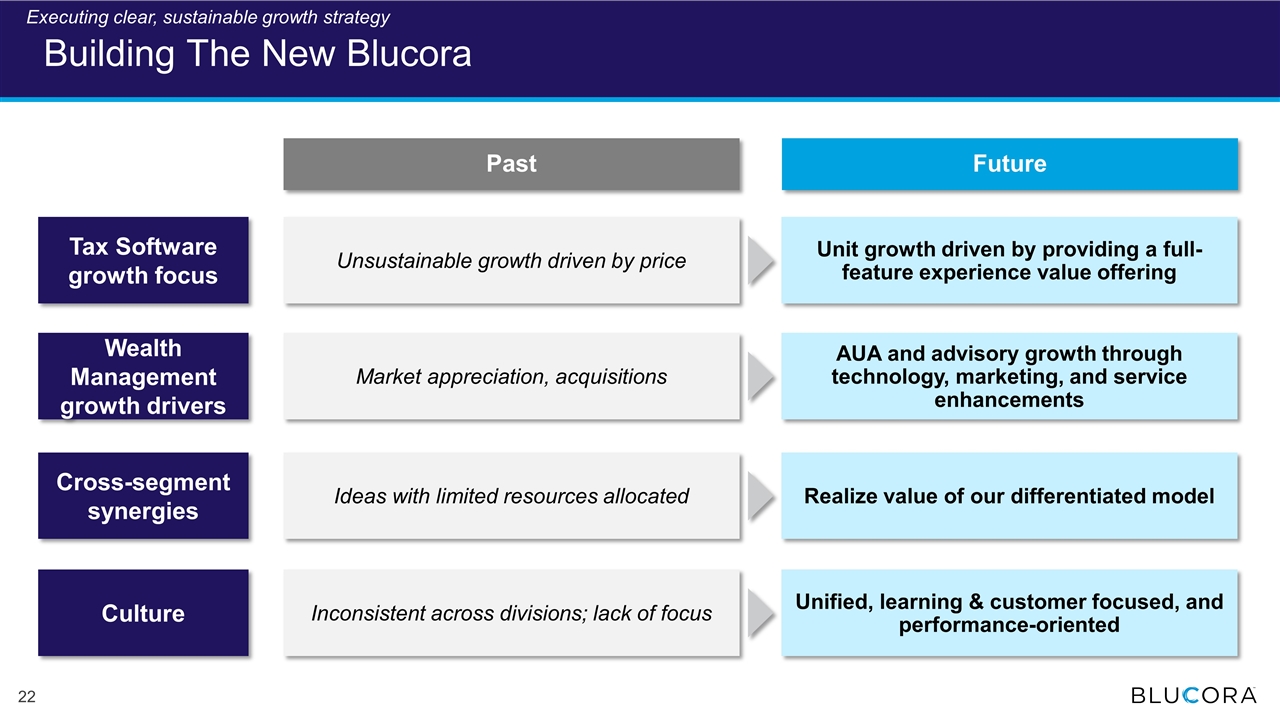
Building The New Blucora Culture Market appreciation, acquisitions Cross-segment synergies Ideas with limited resources allocated Inconsistent across divisions; lack of focus Tax Software growth focus Unsustainable growth driven by price Wealth Management growth drivers Past Future Realize value of our differentiated model AUA and advisory growth through technology, marketing, and service enhancements Unit growth driven by providing a full-feature experience value offering Unified, learning & customer focused, and performance-oriented Executing clear, sustainable growth strategy
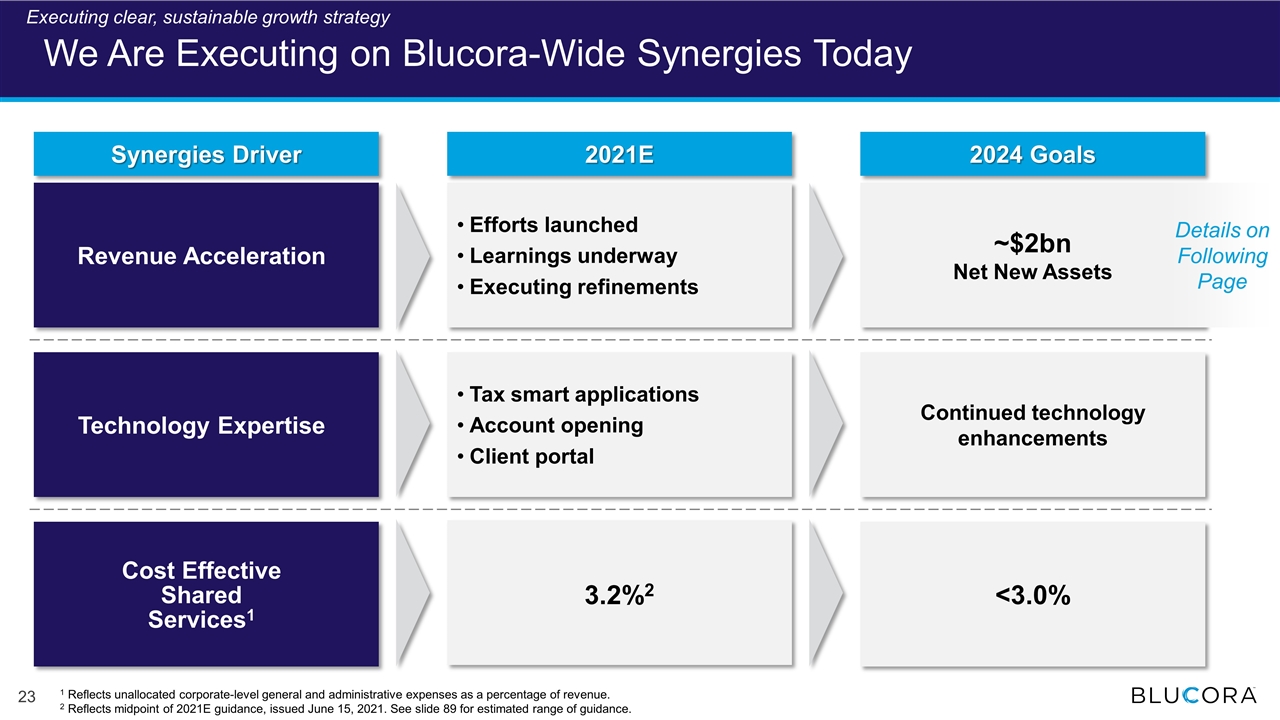
We Are Executing on Blucora-Wide Synergies Today 2024 Goals 2021E Revenue Acceleration Technology Expertise Cost Effective Shared Services1 3.2%2 <3.0% Efforts launched Learnings underway Executing refinements Tax smart applications Account opening Client portal Continued technology enhancements 1 Reflects unallocated corporate-level general and administrative expenses as a percentage of revenue. 2 Reflects midpoint of 2021E guidance, issued June 15, 2021. See slide 89 for estimated range of guidance. Synergies Driver Details on Following Page Executing clear, sustainable growth strategy ~$2bn Net New Assets
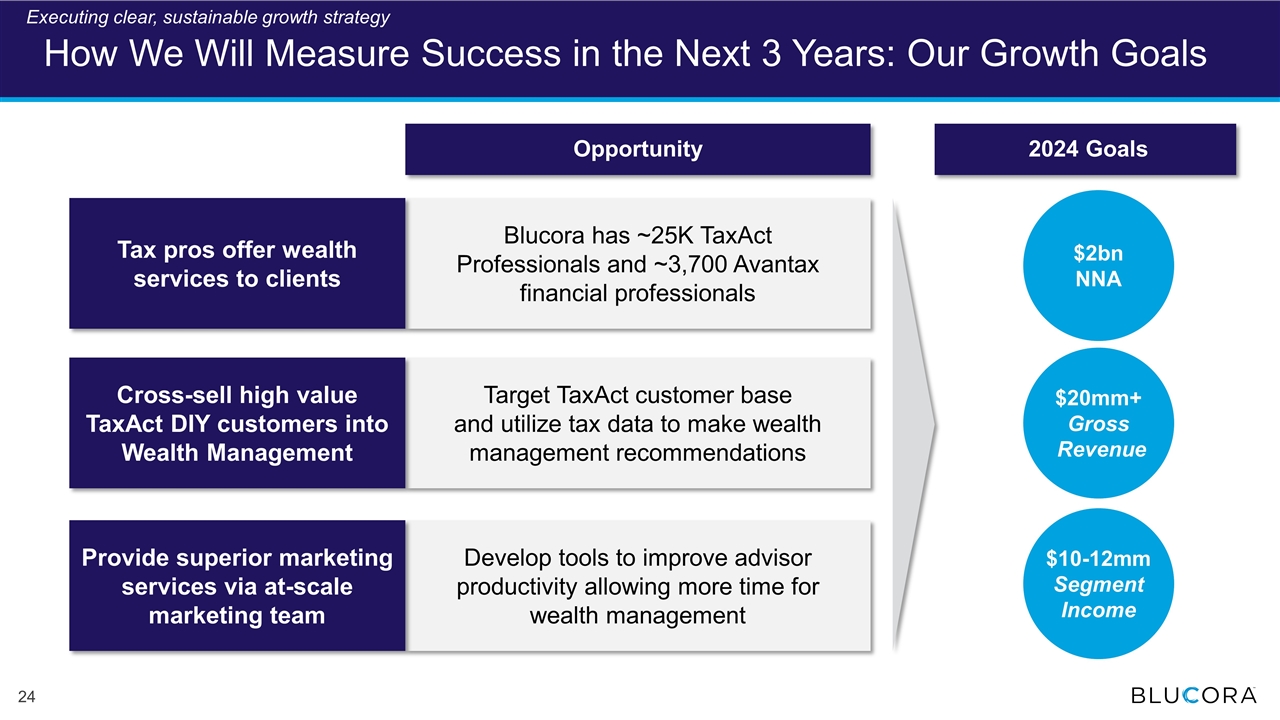
Blucora has ~25K TaxAct Professionals and ~3,700 Avantax financial professionals Target TaxAct customer base and utilize tax data to make wealth management recommendations Develop tools to improve advisor productivity allowing more time for wealth management How We Will Measure Success in the Next 3 Years: Our Growth Goals 2024 Goals Opportunity Tax pros offer wealth services to clients Cross-sell high value TaxAct DIY customers into Wealth Management Provide superior marketing services via at-scale marketing team $10-12mm Segment Income $20mm+ Gross Revenue $2bn NNA Executing clear, sustainable growth strategy
Blucora – Repositioned to Deliver Sustainable Growth Solid progress repositioning Blucora Building on two strong businesses Executing clear, sustainable growth strategy Delivering strong results
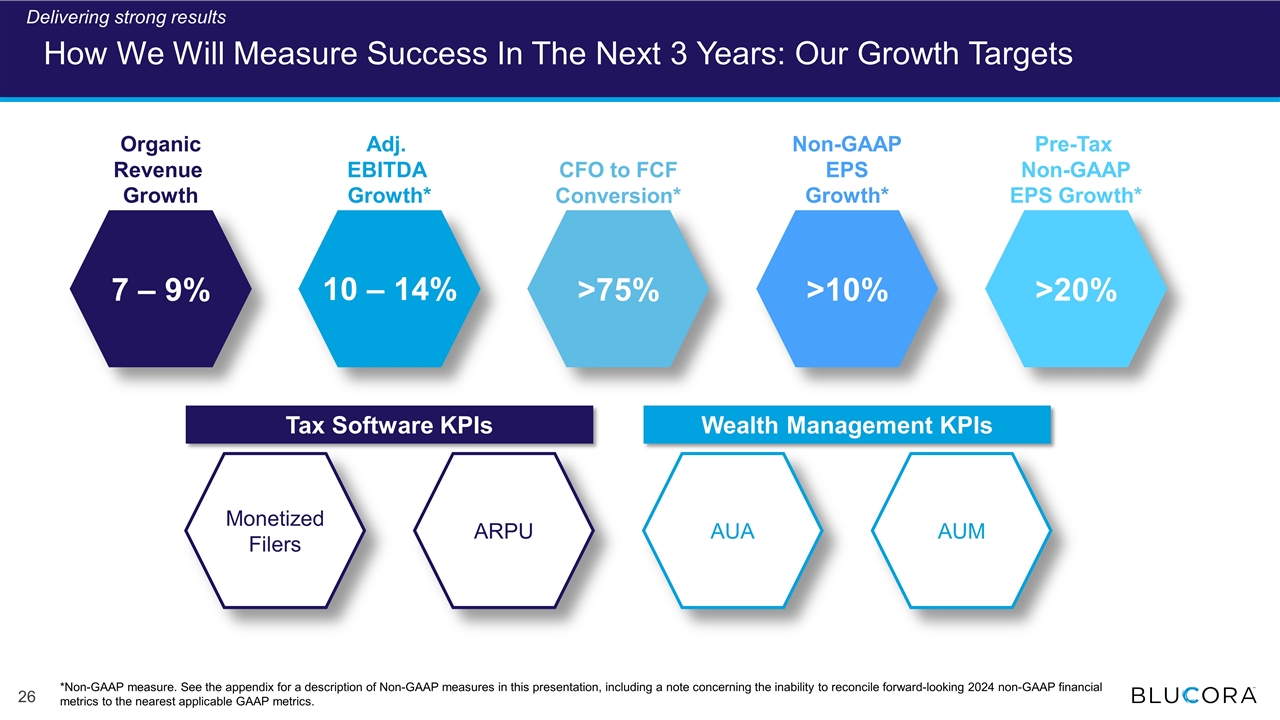
How We Will Measure Success In The Next 3 Years: Our Growth Targets >20% >10% >75% 7 – 9% Organic Revenue Growth Adj. EBITDA Growth* CFO to FCF Conversion* Non-GAAP EPS Growth* Pre-Tax Non-GAAP EPS Growth* *Non-GAAP measure. See the appendix for a description of Non-GAAP measures in this presentation, including a note concerning the inability to reconcile forward-looking 2024 non-GAAP financial metrics to the nearest applicable GAAP metrics. 10 – 14% Monetized Filers AUM AUA ARPU Tax Software KPIs Wealth Management KPIs Delivering strong results
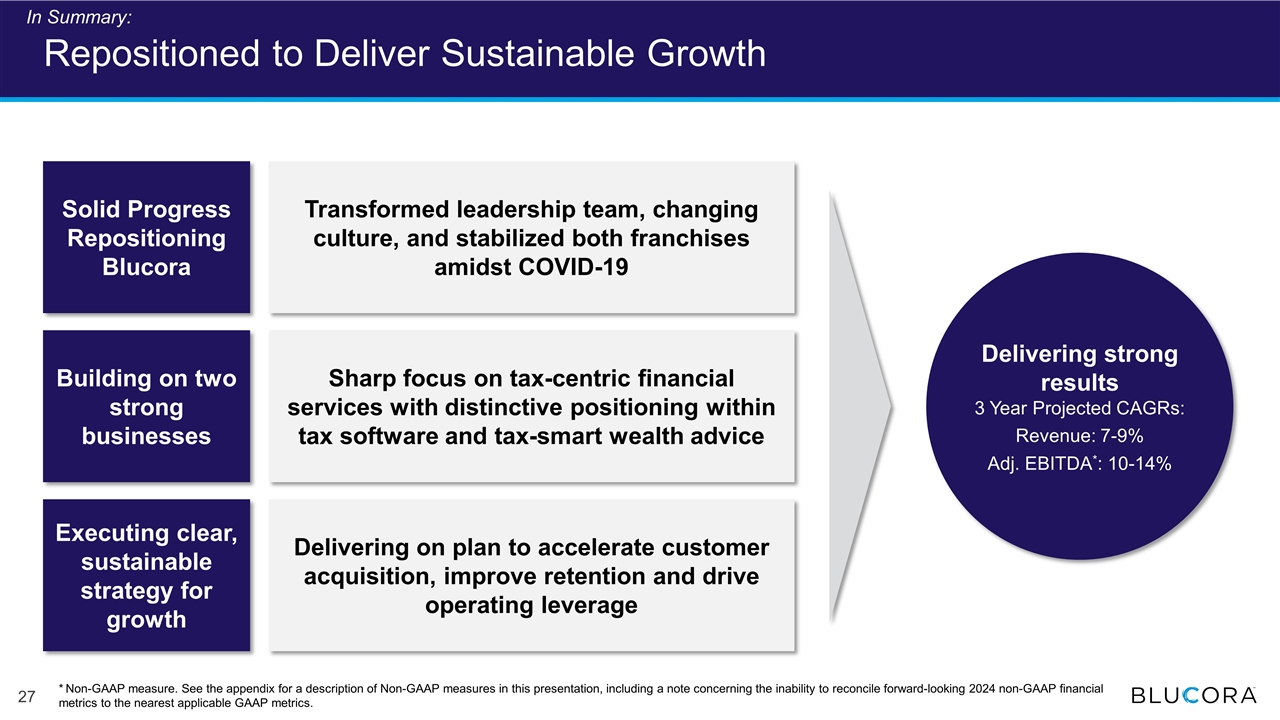
Solid Progress Repositioning Blucora Building on two strong businesses Executing clear, sustainable strategy for growth Transformed leadership team, changing culture, and stabilized both franchises amidst COVID-19 Sharp focus on tax-centric financial services with distinctive positioning within tax software and tax-smart wealth advice Delivering on plan to accelerate customer acquisition, improve retention and drive operating leverage Delivering strong results 3 Year Projected CAGRs: Revenue: 7-9% Adj. EBITDA*: 10-14% In Summary: Repositioned to Deliver Sustainable Growth * Non-GAAP measure. See the appendix for a description of Non-GAAP measures in this presentation, including a note concerning the inability to reconcile forward-looking 2024 non-GAAP financial metrics to the nearest applicable GAAP metrics.

Driving Growth by Delighting Our Customers Curtis Campbell President of TaxAct and Software
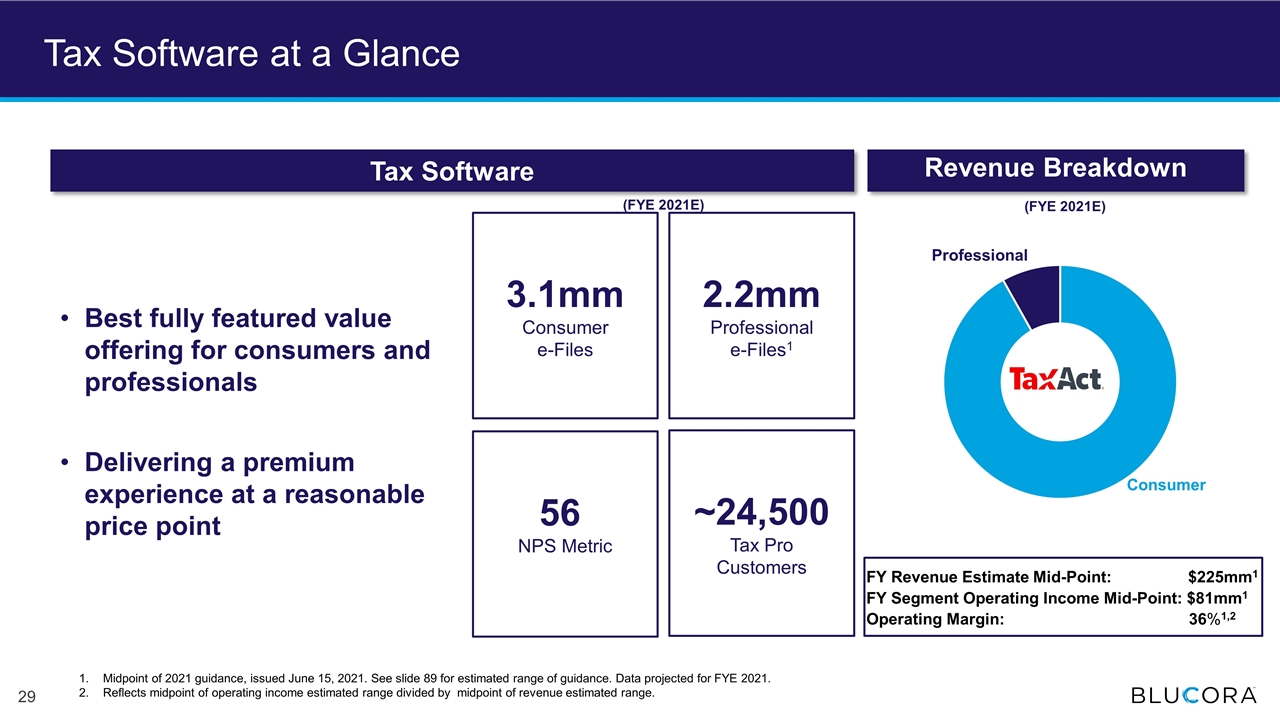
Tax Software at a Glance Tax Software Best fully featured value offering for consumers and professionals Delivering a premium experience at a reasonable price point Consumer Professional Revenue Breakdown 2.2mm Professional e-Files1 56 NPS Metric ~24,500 Tax Pro Customers (FYE 2021E) FY Revenue Estimate Mid-Point: $225mm1 FY Segment Operating Income Mid-Point: $81mm1 Operating Margin: 36%1,2 (FYE 2021E) 3.1mm Consumer e-Files Midpoint of 2021 guidance, issued June 15, 2021. See slide 89 for estimated range of guidance. Data projected for FYE 2021. Reflects midpoint of operating income estimated range divided by midpoint of revenue estimated range.
TaxAct – Repositioned to Deliver Sustainable Growth Solid progress repositioning Tax Software Building on a strong platform Executing clear, sustainable growth strategy Delivering strong results
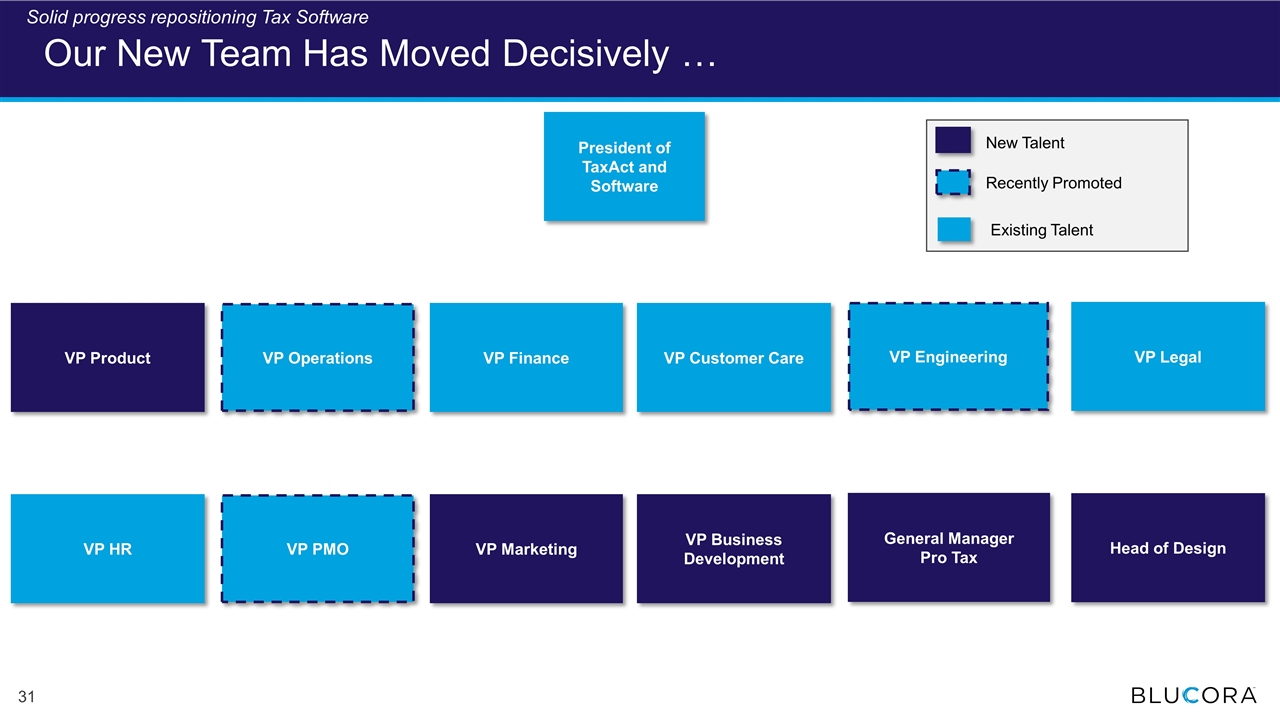
Our New Team Has Moved Decisively … VP PMO VP HR VP Business Development VP Marketing VP Product VP Finance VP Engineering President of TaxAct and Software VP Operations VP Customer Care General Manager Pro Tax Recently Promoted New Talent VP Legal Head of Design Existing Talent Solid progress repositioning Tax Software
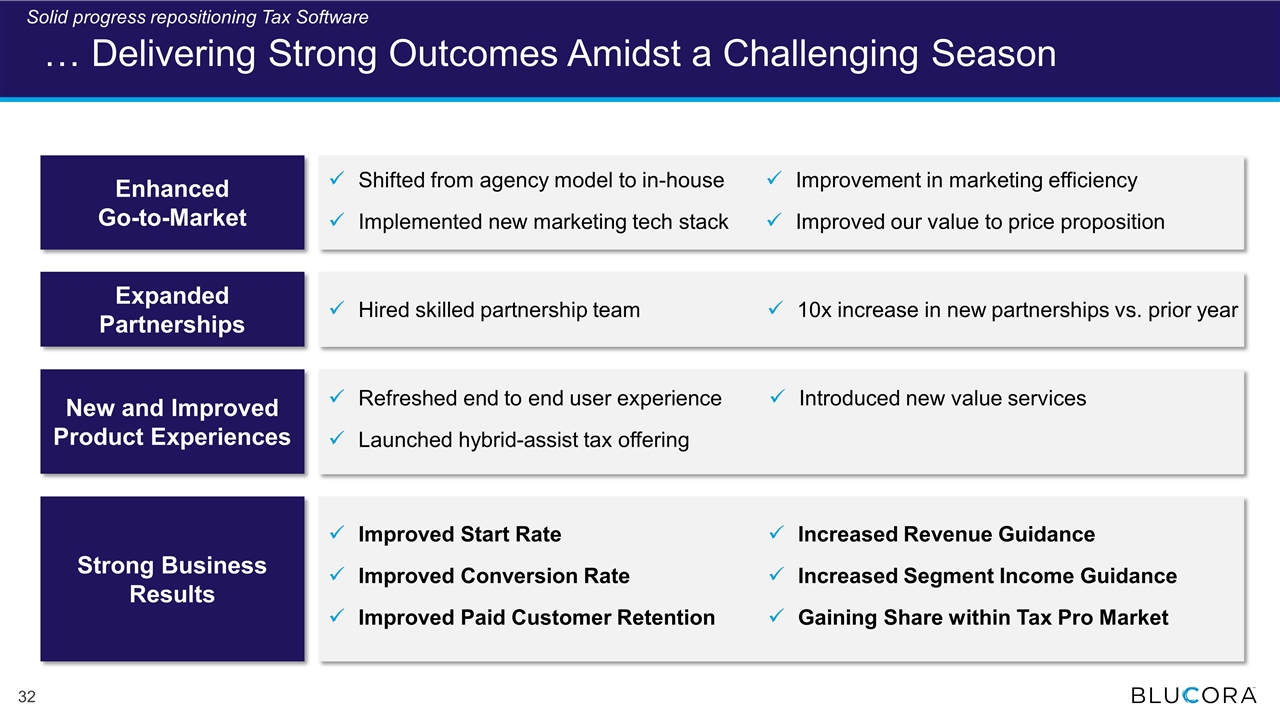
… Delivering Strong Outcomes Amidst a Challenging Season Strong Business Results Improved Start Rate Improved Conversion Rate Improved Paid Customer Retention Increased Revenue Guidance Increased Segment Income Guidance Gaining Share within Tax Pro Market Expanded Partnerships Hired skilled partnership team 10x increase in new partnerships vs. prior year New and Improved Product Experiences Introduced new value services Refreshed end to end user experience Launched hybrid-assist tax offering Enhanced Go-to-Market Shifted from agency model to in-house Implemented new marketing tech stack Improvement in marketing efficiency Improved our value to price proposition Solid progress repositioning Tax Software
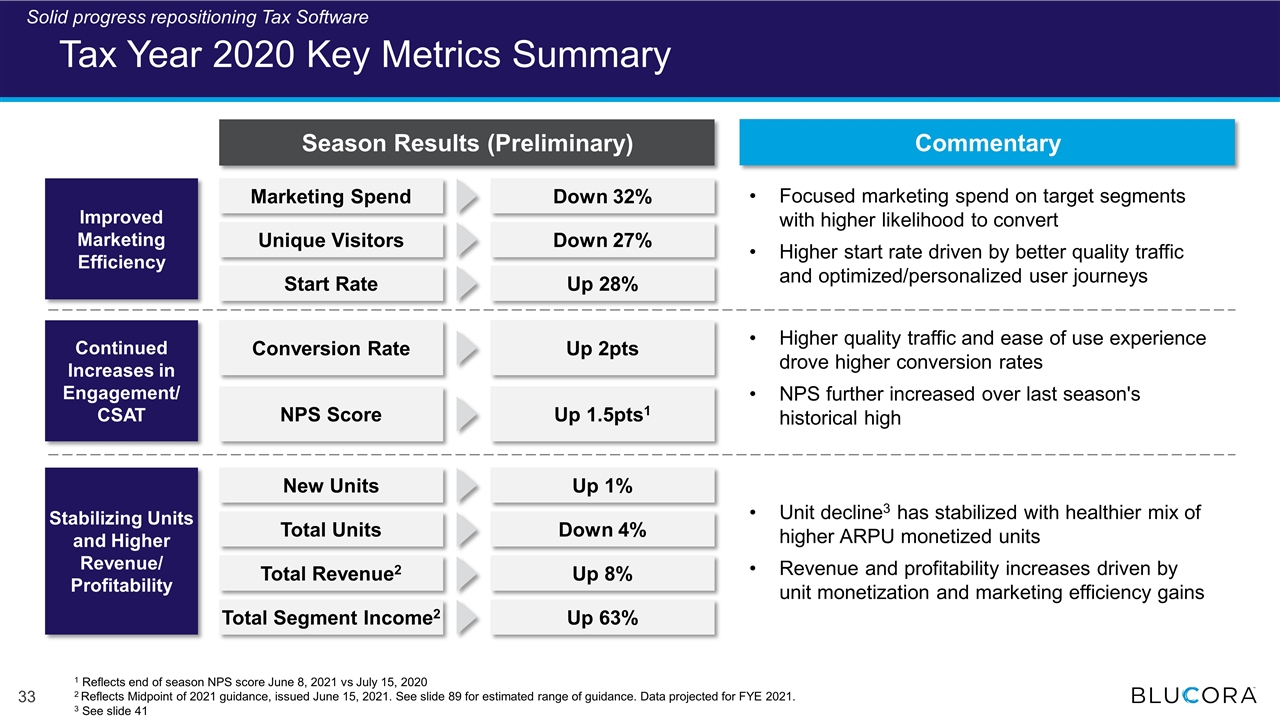
Continued Increases in Engagement/ CSAT Marketing Spend Improved Marketing Efficiency Focused marketing spend on target segments with higher likelihood to convert Higher start rate driven by better quality traffic and optimized/personalized user journeys Tax Year 2020 Key Metrics Summary Season Results (Preliminary) Commentary Higher quality traffic and ease of use experience drove higher conversion rates NPS further increased over last season's historical high Stabilizing Units and Higher Revenue/ Profitability Unit decline3 has stabilized with healthier mix of higher ARPU monetized units Revenue and profitability increases driven by unit monetization and marketing efficiency gains Unique Visitors Start Rate Down 32% Down 27% Up 28% Conversion Rate NPS Score Up 2pts Up 1.5pts1 New Units Up 1% Total Units Down 4% Total Revenue2 Up 8% Total Segment Income2 Up 63% Solid progress repositioning Tax Software 1 Reflects end of season NPS score June 8, 2021 vs July 15, 2020 2 Reflects Midpoint of 2021 guidance, issued June 15, 2021. See slide 89 for estimated range of guidance. Data projected for FYE 2021. 3 See slide 41 .
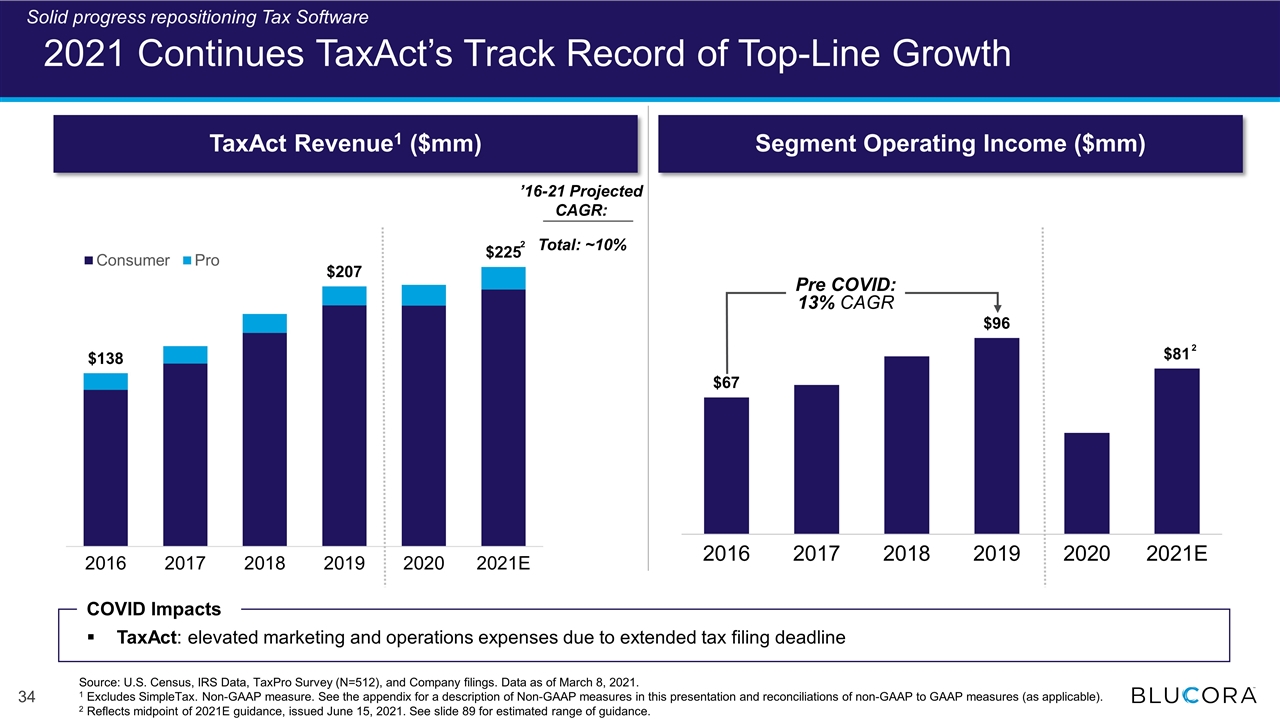
2021 Continues TaxAct’s Track Record of Top-Line Growth TaxAct Revenue1 ($mm) Segment Operating Income ($mm) ’16-21 Projected CAGR: Total: ~10% Pre COVID: 13% CAGR 2 2 Source: U.S. Census, IRS Data, TaxPro Survey (N=512), and Company filings. Data as of March 8, 2021. 1 Excludes SimpleTax. Non-GAAP measure. See the appendix for a description of Non-GAAP measures in this presentation and reconciliations of non-GAAP to GAAP measures (as applicable). 2 Reflects midpoint of 2021E guidance, issued June 15, 2021. See slide 89 for estimated range of guidance. COVID Impacts TaxAct: elevated marketing and operations expenses due to extended tax filing deadline Solid progress repositioning Tax Software
TaxAct – Repositioned to Deliver Sustainable Growth Solid progress repositioning Tax Software Building on a strong platform Executing clear, sustainable growth strategy Delivering strong results
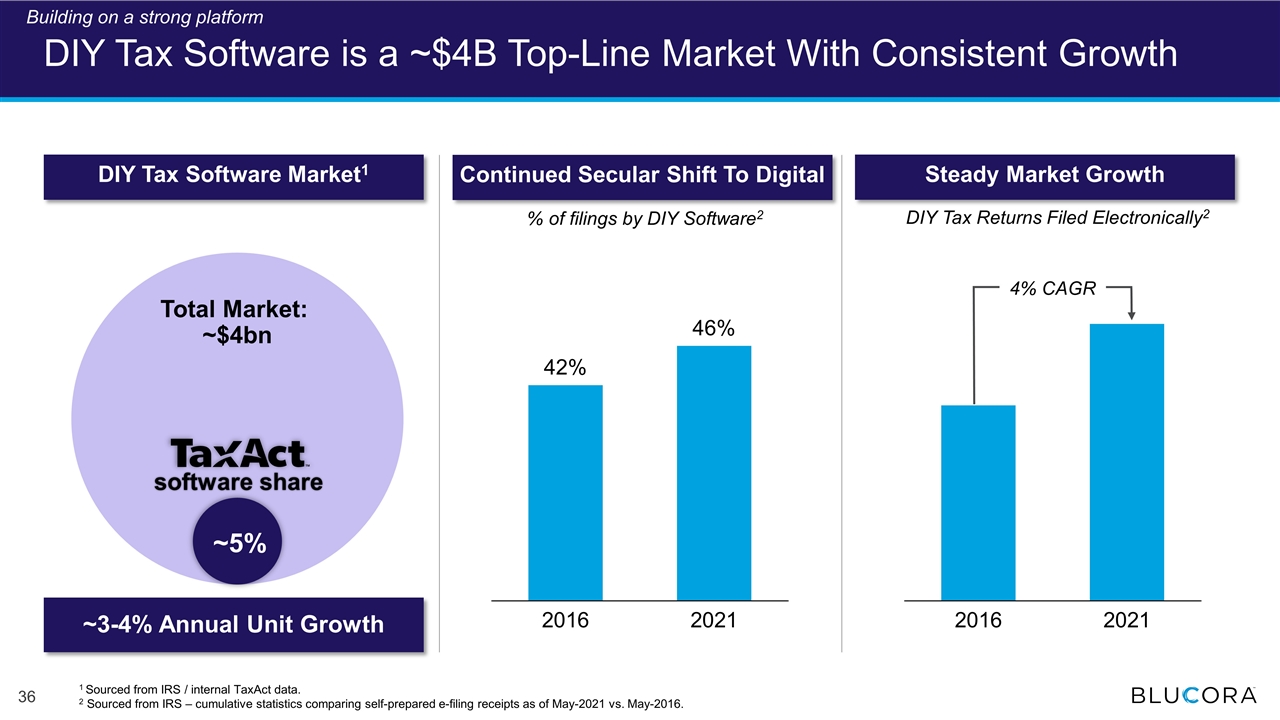
DIY Tax Software is a ~$4B Top-Line Market With Consistent Growth Continued Secular Shift To Digital Steady Market Growth % of filings by DIY Software2 DIY Tax Software Market1 4% CAGR DIY Tax Returns Filed Electronically2 1 Sourced from IRS / internal TaxAct data. 2 Sourced from IRS – cumulative statistics comparing self-prepared e-filing receipts as of May-2021 vs. May-2016. Building on a strong platform Total Market: ~$4bn ~5% software share ~3-4% Annual Unit Growth
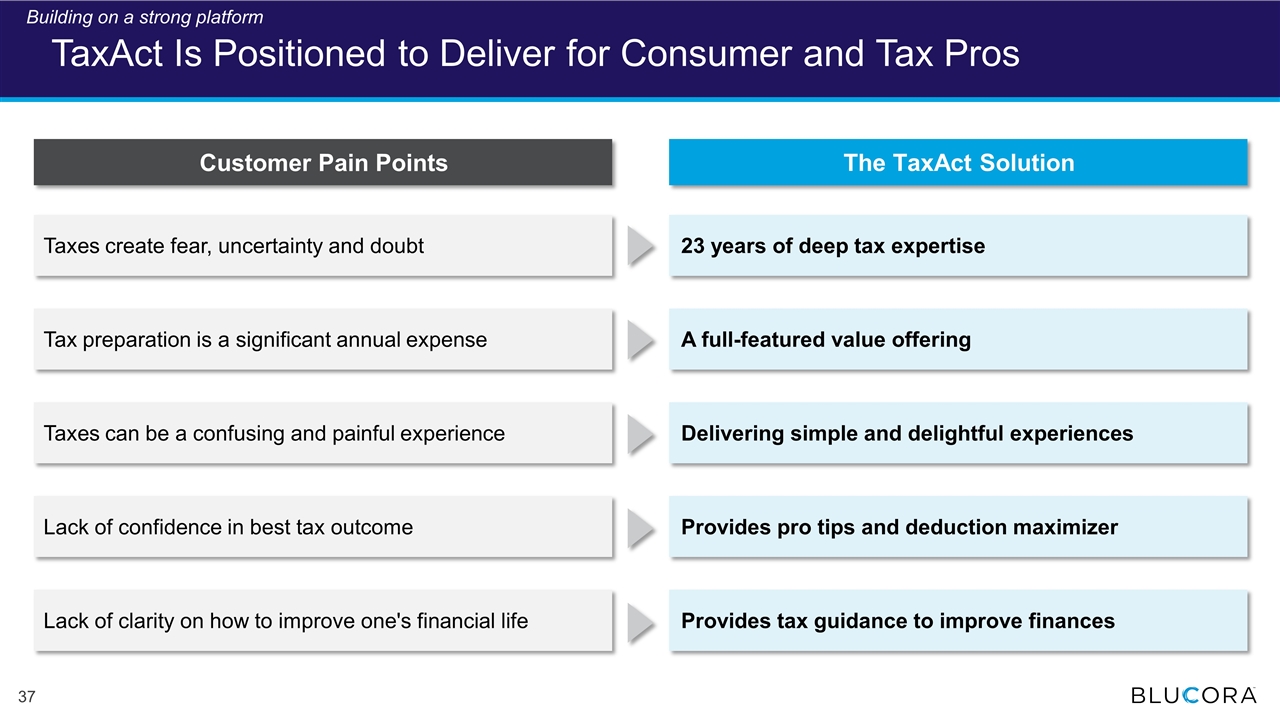
TaxAct Is Positioned to Deliver for Consumer and Tax Pros 23 years of deep tax expertise Taxes create fear, uncertainty and doubt Customer Pain Points The TaxAct Solution A full-featured value offering Tax preparation is a significant annual expense Delivering simple and delightful experiences Taxes can be a confusing and painful experience Provides tax guidance to improve finances Lack of clarity on how to improve one's financial life Uncertainty at the end…. Curtis Provides pro tips and deduction maximizer Lack of confidence in best tax outcome Building on a strong platform

Meet Our Customers Video Building on a strong platform
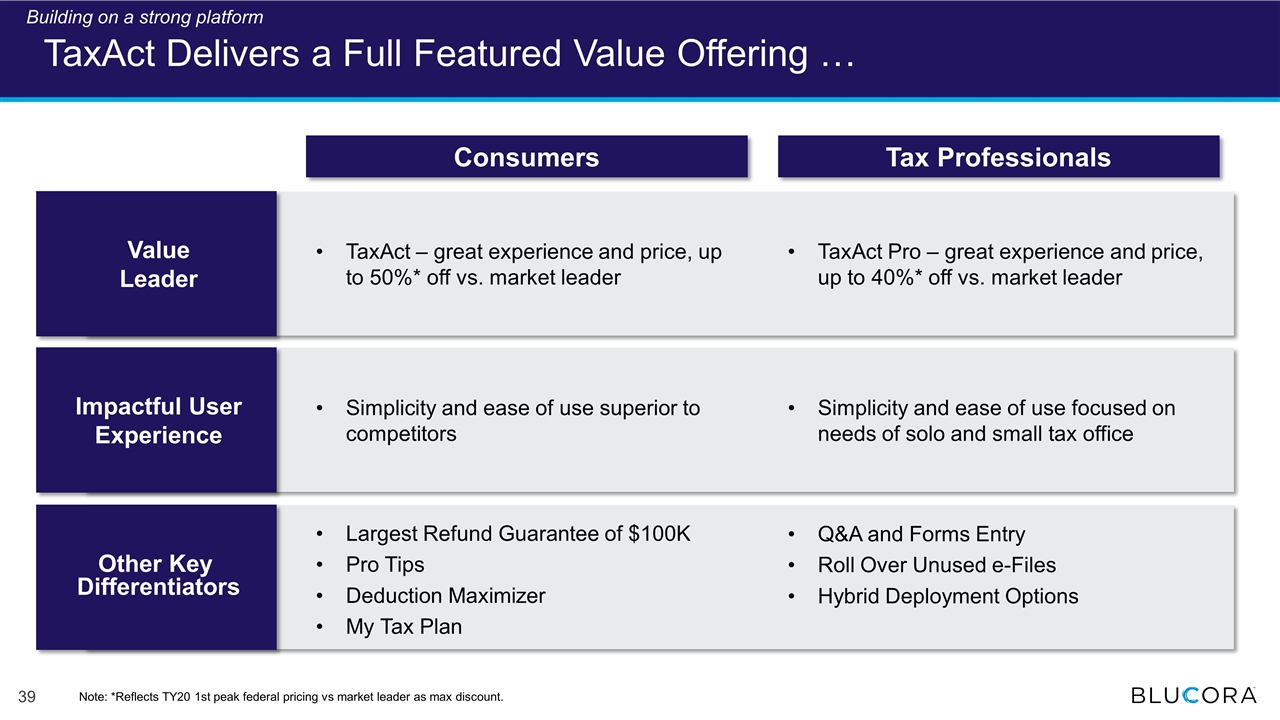
TaxAct Delivers a Full Featured Value Offering … Tax Professionals Simplicity and ease of use focused on needs of solo and small tax office Q&A and Forms Entry Roll Over Unused e-Files Hybrid Deployment Options Consumers TaxAct – great experience and price, up to 50%* off vs. market leader Value Leader Simplicity and ease of use superior to competitors Largest Refund Guarantee of $100K Pro Tips Deduction Maximizer My Tax Plan TaxAct Pro – great experience and price, up to 40%* off vs. market leader Impactful User Experience Other Key Differentiators Note: *Reflects TY20 1st peak federal pricing vs market leader as max discount. Building on a strong platform
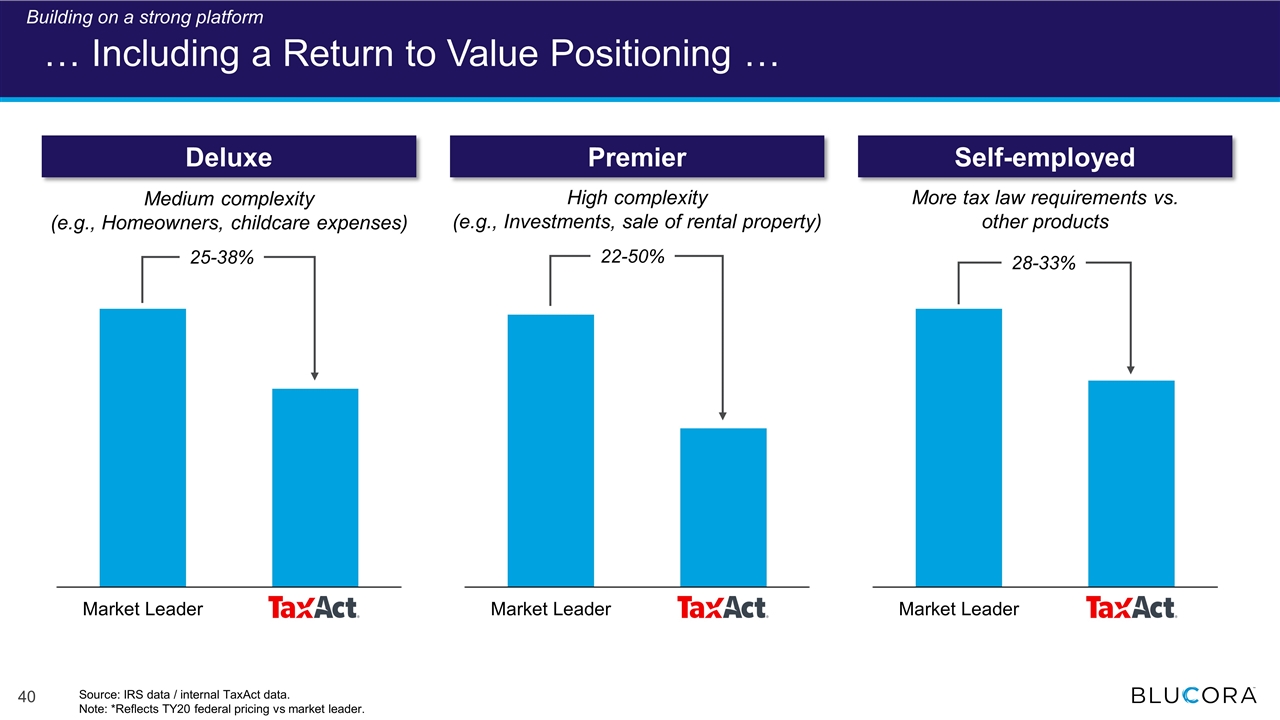
… Including a Return to Value Positioning … Deluxe Premier Self-employed Medium complexity (e.g., Homeowners, childcare expenses) High complexity (e.g., Investments, sale of rental property) More tax law requirements vs. other products 25-38% 22-50% 28-33% Source: IRS data / internal TaxAct data. Note: *Reflects TY20 federal pricing vs market leader. Building on a strong platform
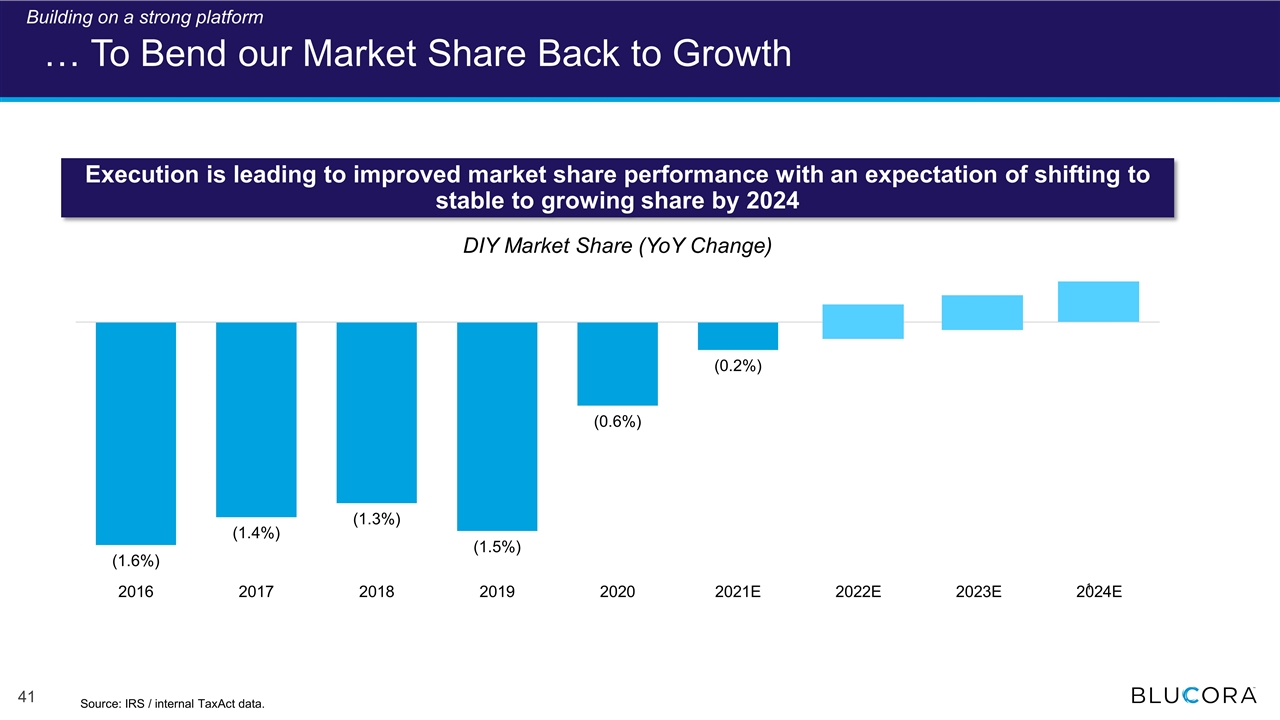
… To Bend our Market Share Back to Growth Execution is leading to improved market share performance with an expectation of shifting to stable to growing share by 2024 1 Source: IRS / internal TaxAct data. Building on a strong platform
TaxAct – Repositioned to Deliver Sustainable Growth Solid progress repositioning Tax Software Building on a strong platform Executing clear, sustainable growth strategy Delivering strong results
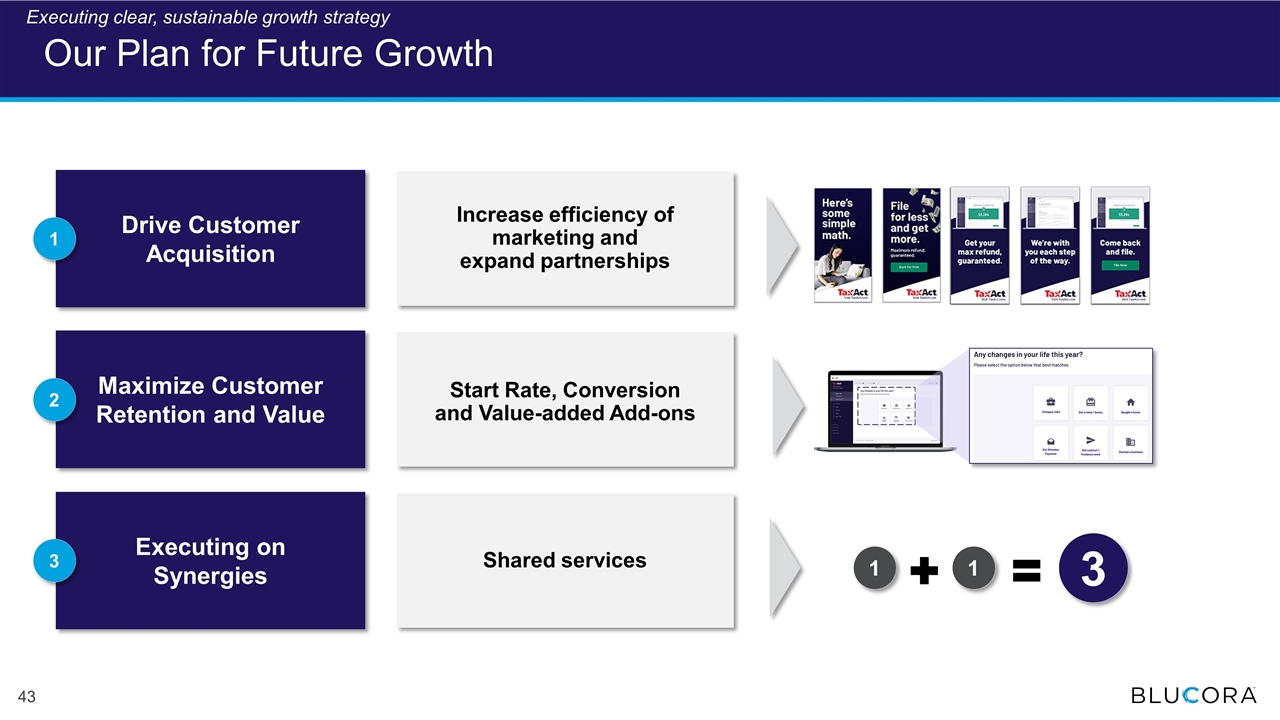
Maximize Customer Retention and Value Drive Customer Acquisition Executing on Synergies Our Plan for Future Growth Shared services Start Rate, Conversion and Value-added Add-ons Increase efficiency of marketing and expand partnerships 1 2 3 1 1 3 Executing clear, sustainable growth strategy
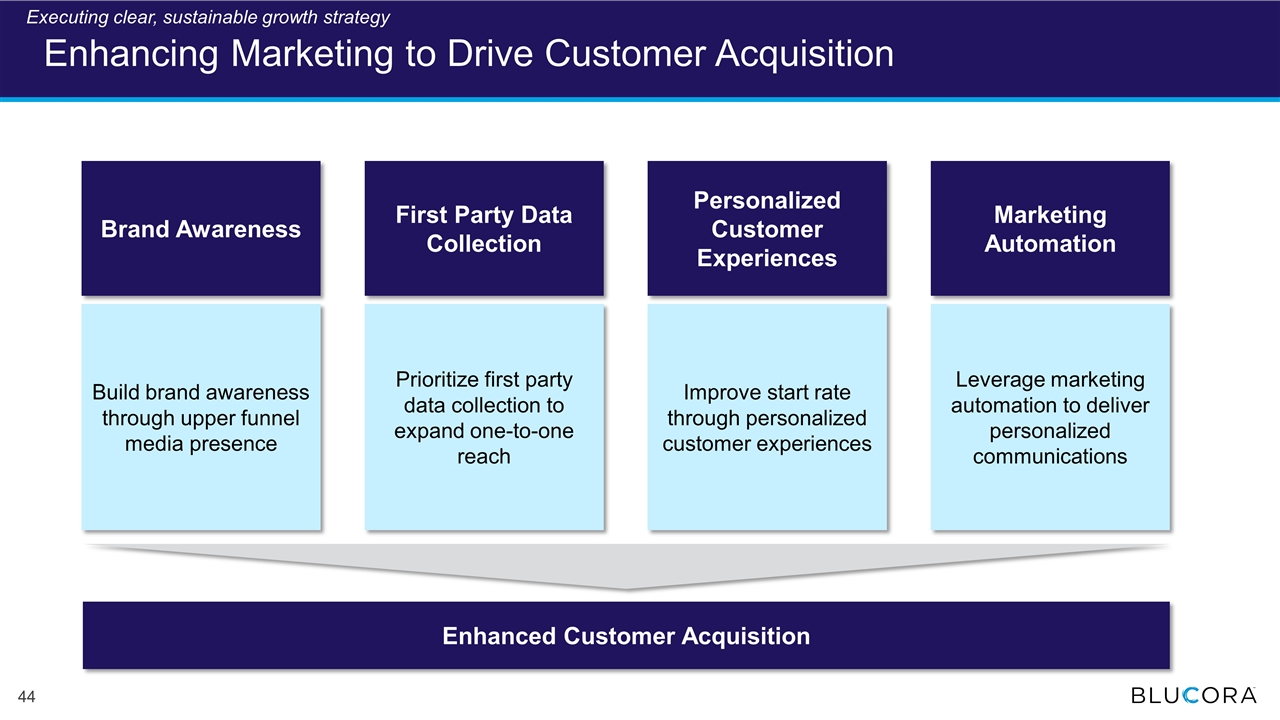
Enhancing Marketing to Drive Customer Acquisition Brand Awareness First Party Data Collection Personalized Customer Experiences Marketing Automation Build brand awareness through upper funnel media presence Prioritize first party data collection to expand one-to-one reach Improve start rate through personalized customer experiences Leverage marketing automation to deliver personalized communications Enhanced Customer Acquisition Executing clear, sustainable growth strategy
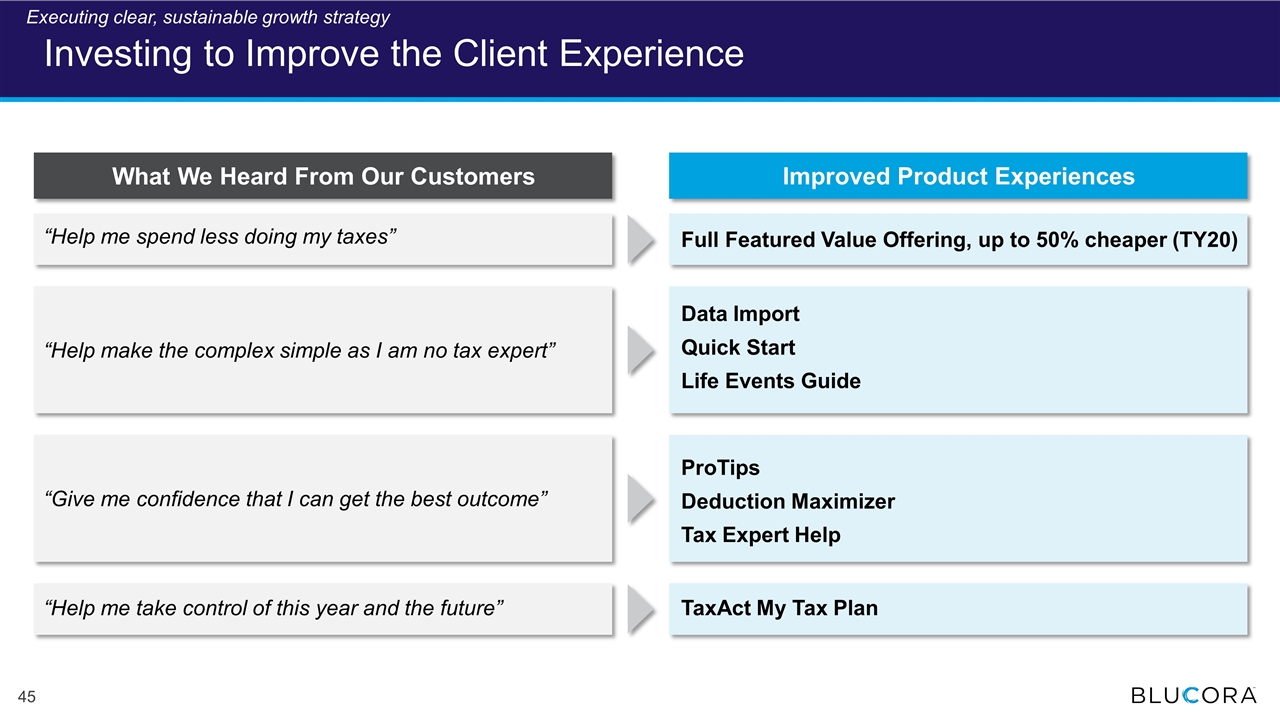
“Help me spend less doing my taxes” What We Heard From Our Customers Improved Product Experiences Data Import Quick Start Life Events Guide “Help make the complex simple as I am no tax expert” ProTips Deduction Maximizer Tax Expert Help “Give me confidence that I can get the best outcome” TaxAct My Tax Plan “Help me take control of this year and the future” Investing to Improve the Client Experience Full Featured Value Offering, up to 50% cheaper (TY20) Executing clear, sustainable growth strategy
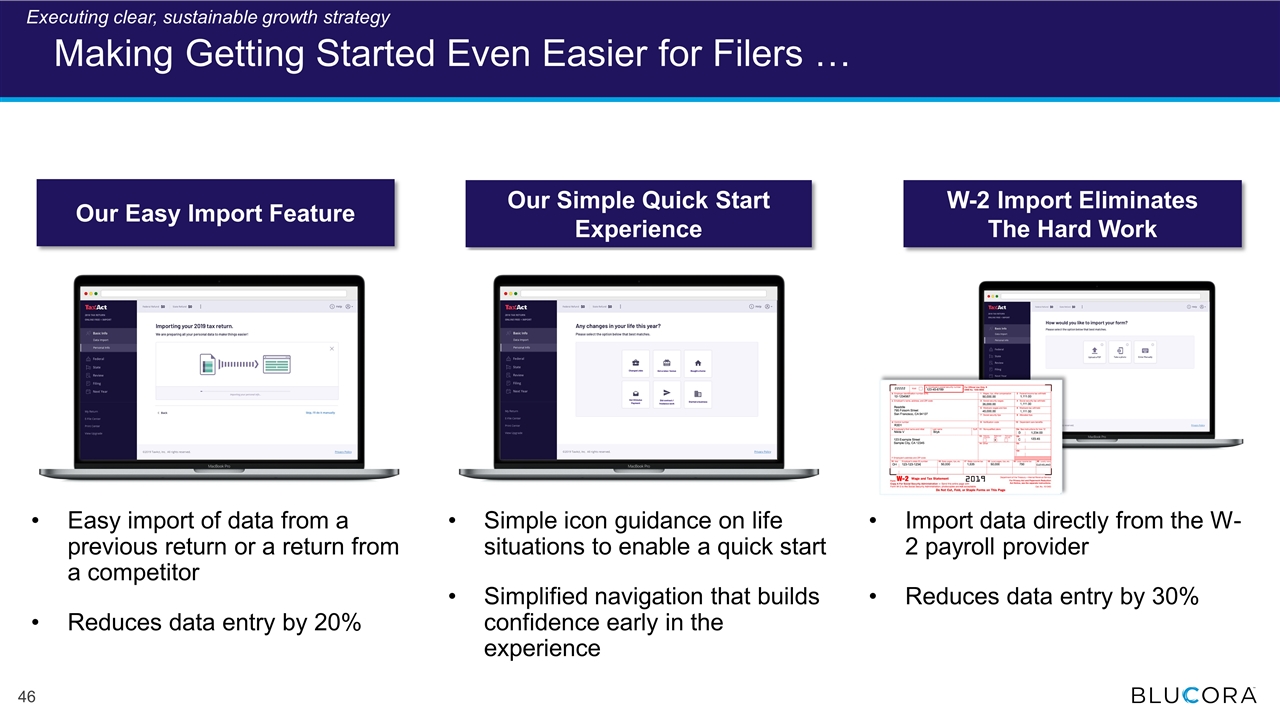
W-2 Import Eliminates The Hard Work Our Easy Import Feature Our Simple Quick Start Experience Making Getting Started Even Easier for Filers … Import data directly from the W-2 payroll provider Reduces data entry by 30% Easy import of data from a previous return or a return from a competitor Reduces data entry by 20% Simple icon guidance on life situations to enable a quick start Simplified navigation that builds confidence early in the experience Executing clear, sustainable growth strategy
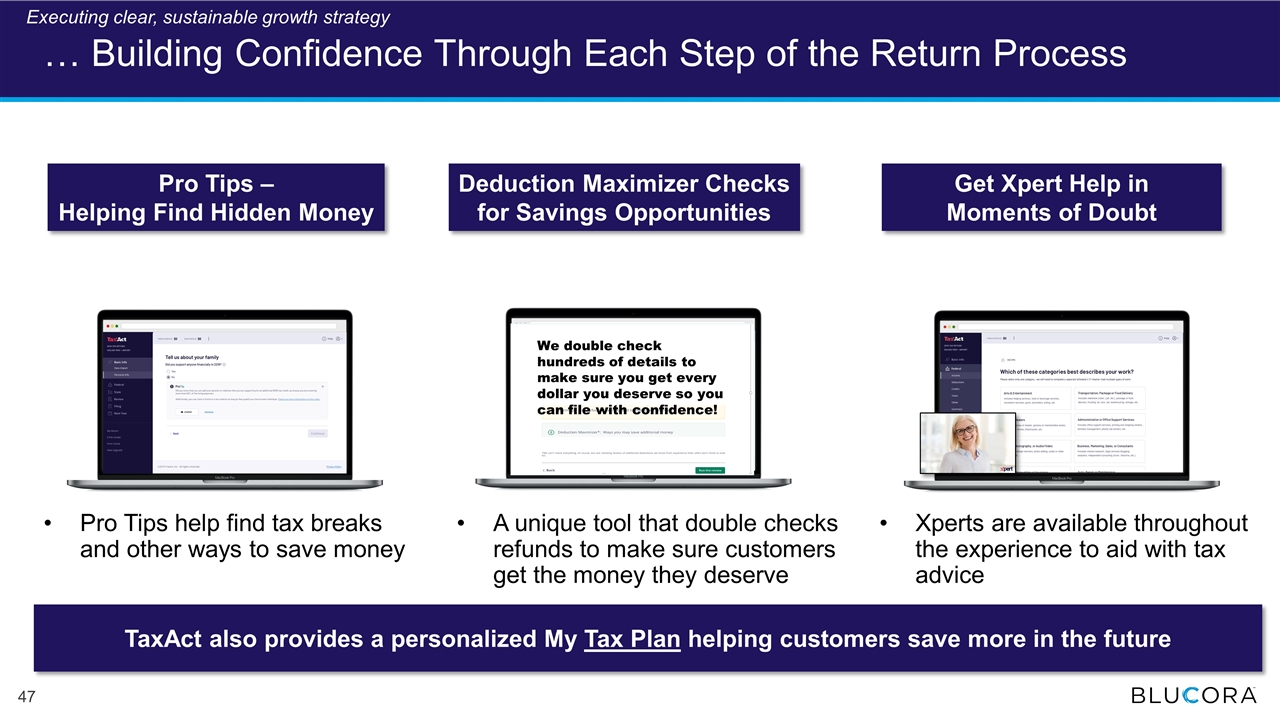
… Building Confidence Through Each Step of the Return Process Pro Tips – Helping Find Hidden Money Get Xpert Help in Moments of Doubt Deduction Maximizer Checks for Savings Opportunities We double check hundreds of details to make sure you get every dollar you deserve so you can file with confidence! TaxAct also provides a personalized My Tax Plan helping customers save more in the future Pro Tips help find tax breaks and other ways to save money Xperts are available throughout the experience to aid with tax advice A unique tool that double checks refunds to make sure customers get the money they deserve Executing clear, sustainable growth strategy
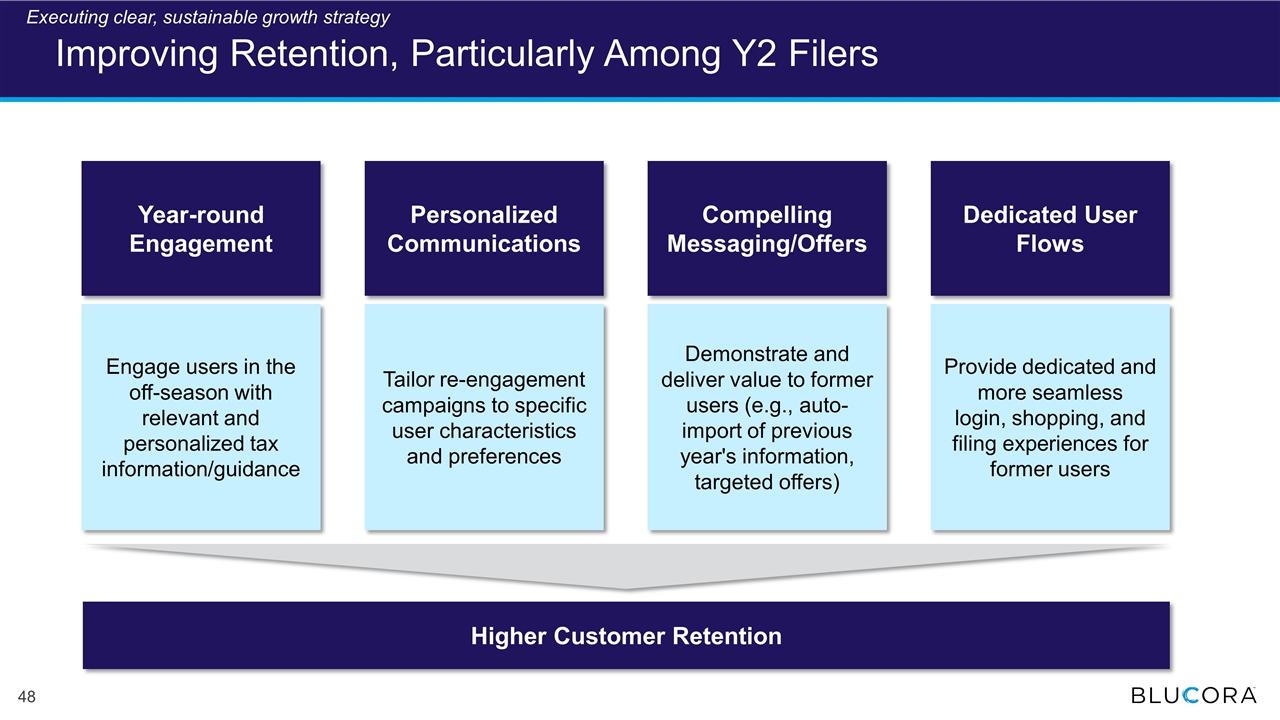
Improving Retention, Particularly Among Y2 Filers Year-round Engagement Personalized Communications Compelling Messaging/Offers Dedicated User Flows Engage users in the off-season with relevant and personalized tax information/guidance Tailor re-engagement campaigns to specific user characteristics and preferences Demonstrate and deliver value to former users (e.g., auto-import of previous year's information, targeted offers) Provide dedicated and more seamless login, shopping, and filing experiences for former users Higher Customer Retention Executing clear, sustainable growth strategy
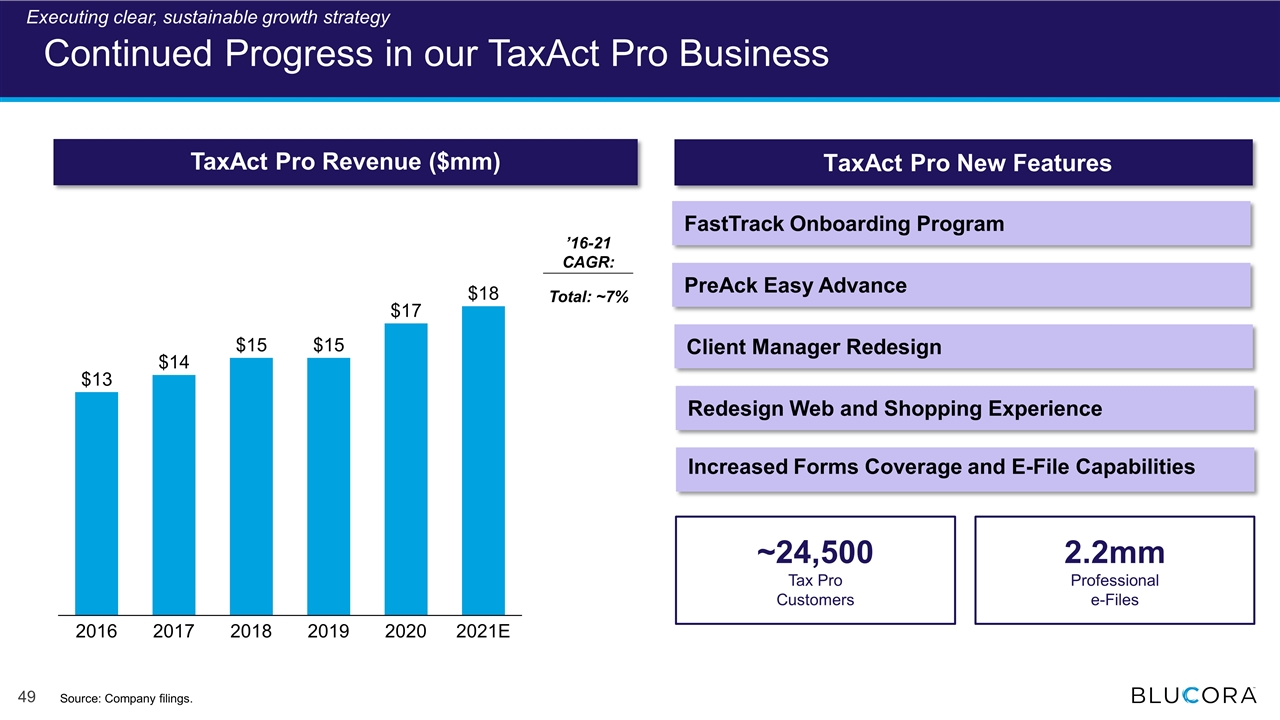
Continued Progress in our TaxAct Pro Business TaxAct Pro Revenue ($mm) ’16-21 CAGR: FastTrack Onboarding Program TaxAct Pro New Features PreAck Easy Advance Client Manager Redesign Increased Forms Coverage and E-File Capabilities Redesign Web and Shopping Experience E Total: ~7% Executing clear, sustainable growth strategy 2.2mm Professional e-Files ~24,500 Tax Pro Customers Source: Company filings.
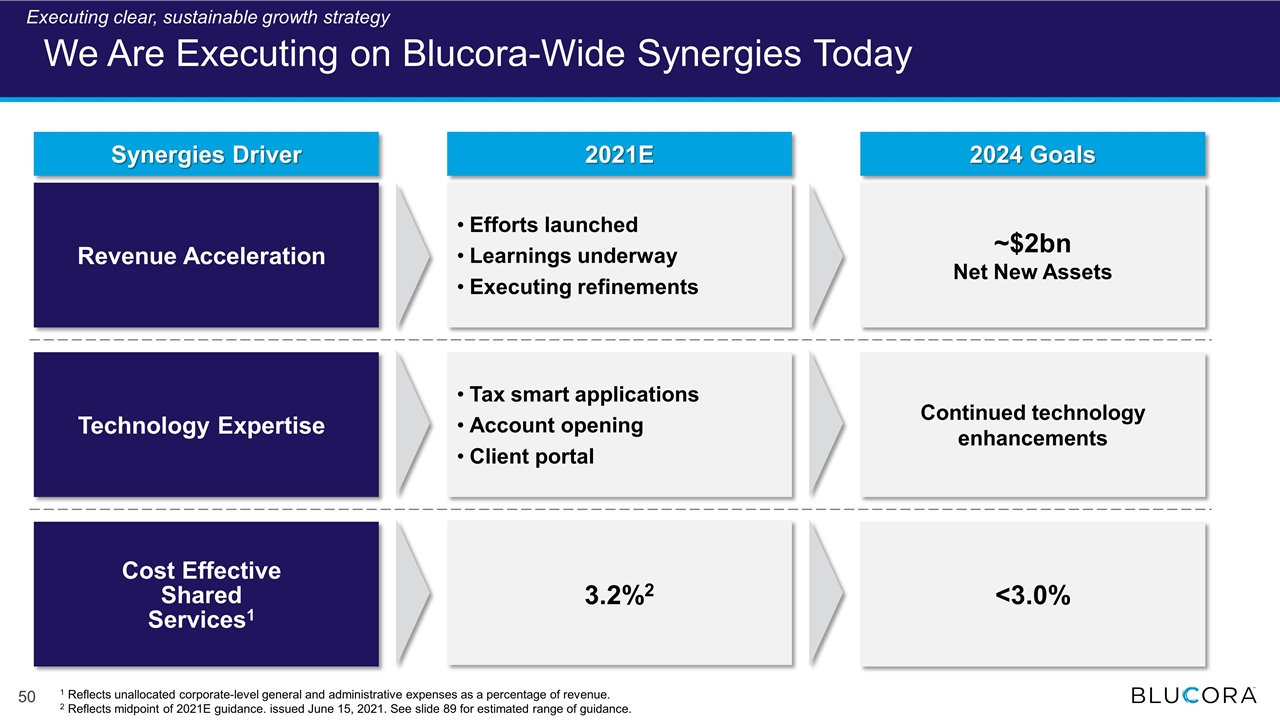
We Are Executing on Blucora-Wide Synergies Today Executing clear, sustainable growth strategy 2024 Goals 2021E Revenue Acceleration Technology Expertise Cost Effective Shared Services1 3.2%2 <3.0% Efforts launched Learnings underway Executing refinements Tax smart applications Account opening Client portal Continued technology enhancements 1 Reflects unallocated corporate-level general and administrative expenses as a percentage of revenue. 2 Reflects midpoint of 2021E guidance. issued June 15, 2021. See slide 89 for estimated range of guidance. Synergies Driver ~$2bn Net New Assets
TaxAct – Repositioned to Deliver Sustainable Growth Solid progress repositioning Tax Software Building on a strong platform Executing clear, sustainable growth strategy Delivering strong results
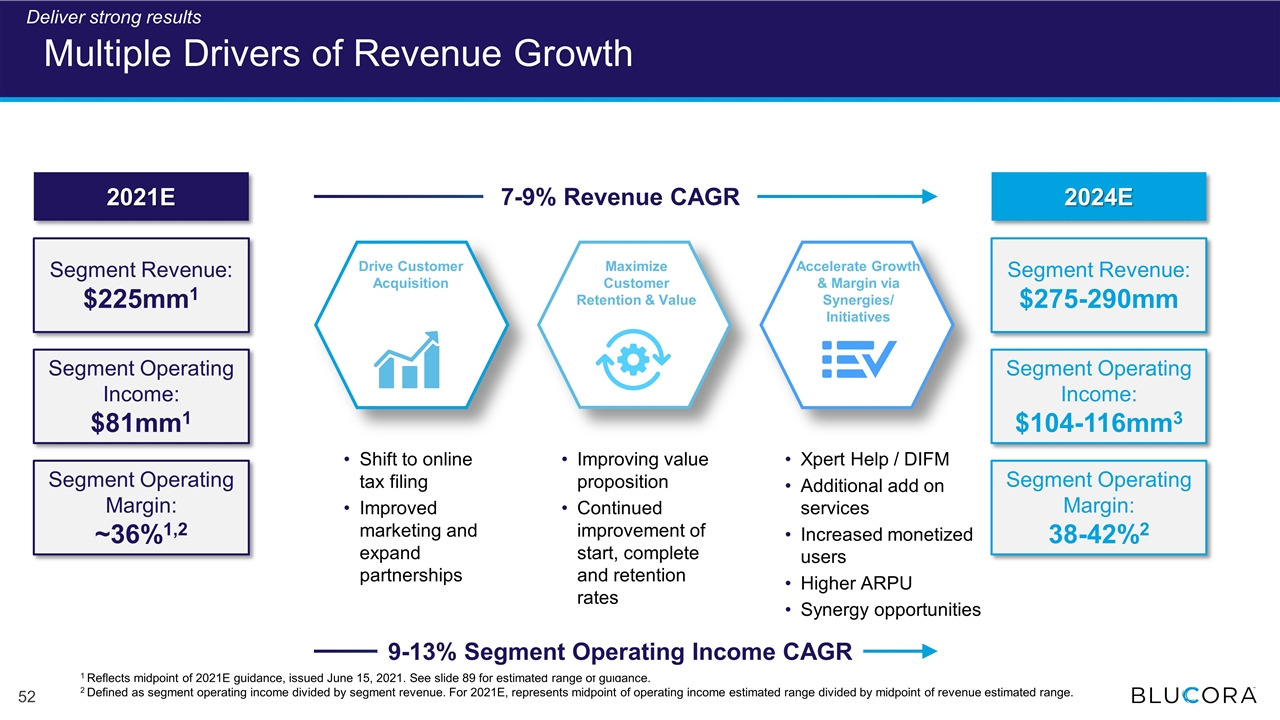
Multiple Drivers of Revenue Growth Maximize Customer Retention & Value Accelerate Growth & Margin via Synergies/ Initiatives Shift to online tax filing Improved marketing and expand partnerships Improving value proposition Continued improvement of start, complete and retention rates Xpert Help / DIFM Additional add on services Increased monetized users Higher ARPU Synergy opportunities 1 Reflects midpoint of 2021E guidance, issued June 15, 2021. See slide 89 for estimated range of guidance. 2 Defined as segment operating income divided by segment revenue. For 2021E, represents midpoint of operating income estimated range divided by midpoint of revenue estimated range. 2021E 2024E Drive Customer Acquisition 2021E Segment Revenue: $225mm1 Segment Operating Income: $81mm1 Segment Operating Margin: ~36%1,2 2024E Segment Revenue: $275-290mm Segment Operating Income: $104-116mm3 Segment Operating Margin: 38-42%2 7-9% Revenue CAGR Deliver strong results 9-13% Segment Operating Income CAGR
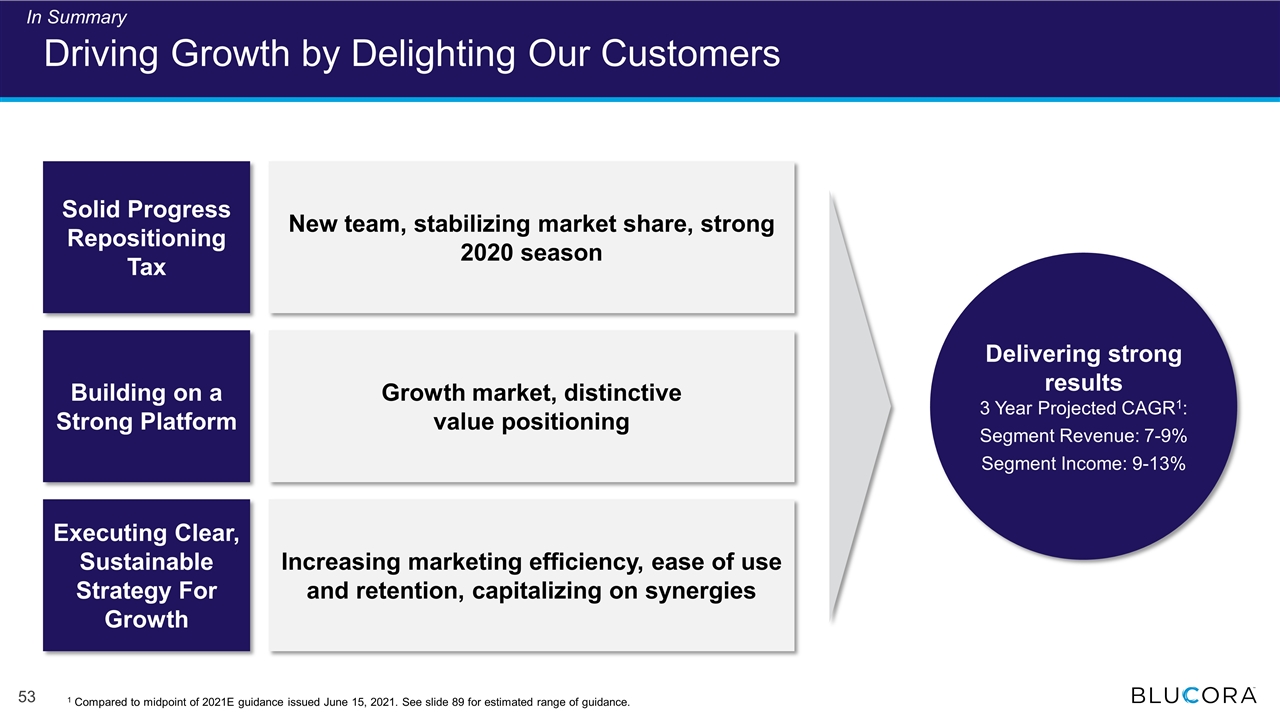
Solid Progress Repositioning Tax Building on a Strong Platform Executing Clear, Sustainable Strategy For Growth New team, stabilizing market share, strong 2020 season Growth market, distinctive value positioning Increasing marketing efficiency, ease of use and retention, capitalizing on synergies Driving Growth by Delighting Our Customers Delivering strong results 3 Year Projected CAGR1: Segment Revenue: 7-9% Segment Income: 9-13% In Summary 1 Compared to midpoint of 2021E guidance issued June 15, 2021. See slide 89 for estimated range of guidance.

Profitably Scaling Tax-Focused Advice Todd Mackay President, Wealth Management
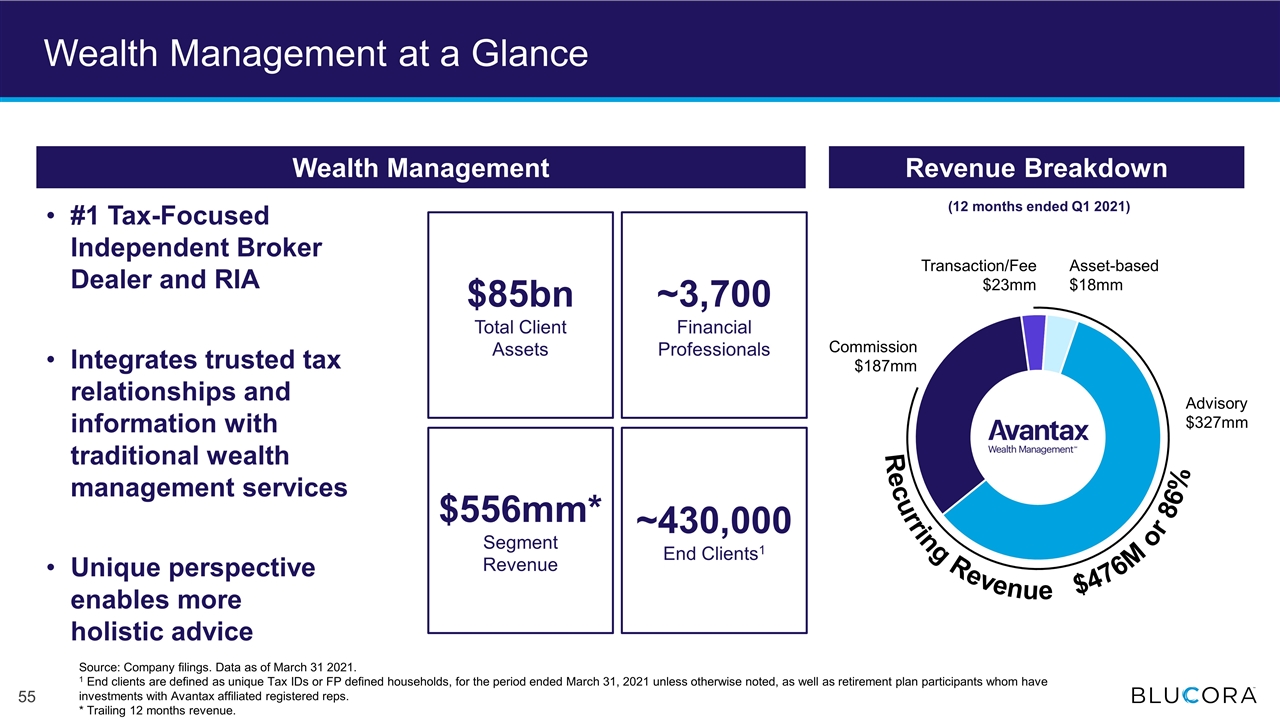
Wealth Management at a Glance Wealth Management $85bn Total Client Assets ~3,700 Financial Professionals $556mm* Segment Revenue ~430,000 End Clients1 Recurring Revenue $476M or 86% Commission $187mm Advisory $327mm Asset-based $18mm Transaction/Fee $23mm (12 months ended Q1 2021) Revenue Breakdown #1 Tax-Focused Independent Broker Dealer and RIA Integrates trusted tax relationships and information with traditional wealth management services Unique perspective enables more holistic advice Source: Company filings. Data as of March 31 2021. 1 End clients are defined as unique Tax IDs or FP defined households, for the period ended March 31, 2021 unless otherwise noted, as well as retirement plan participants whom have investments with Avantax affiliated registered reps. * Trailing 12 months revenue.
Avantax – Repositioned to Deliver Sustainable Growth Solid progress improving Wealth Management Building on a strong franchise Executing clear, sustainable growth strategy Delivering strong results
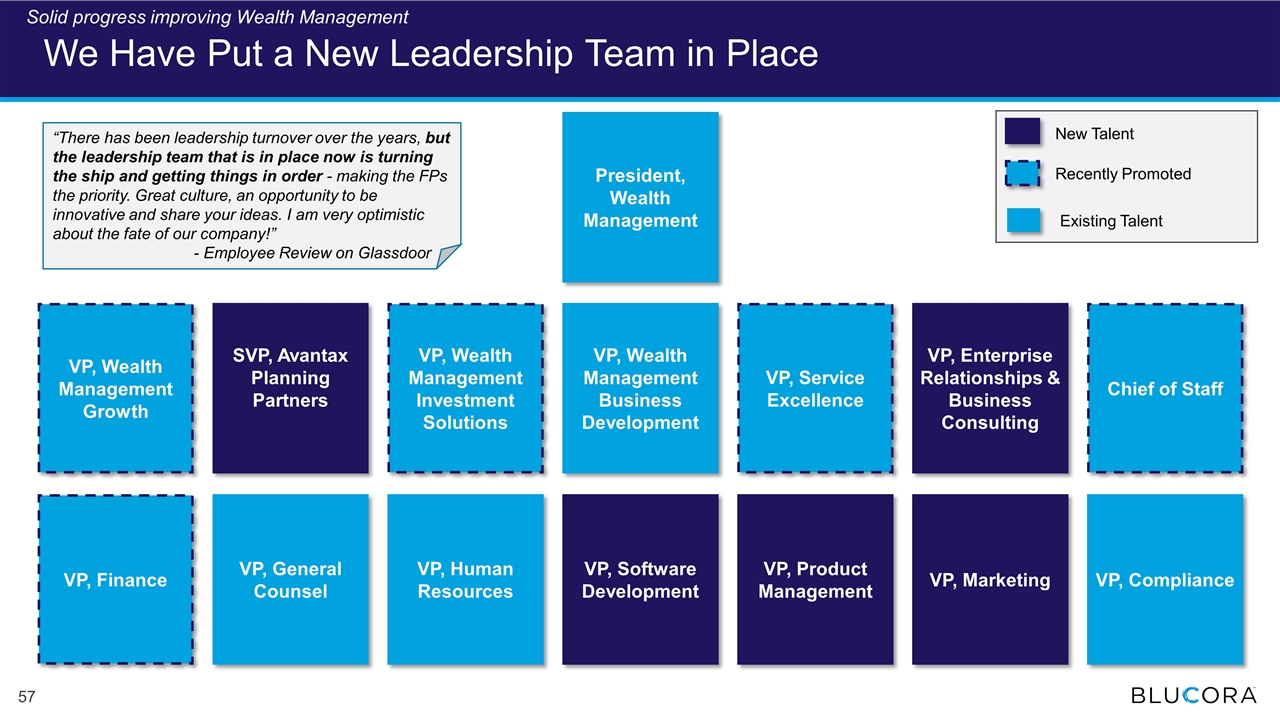
We Have Put a New Leadership Team in Place VP, General Counsel VP, Finance VP, Software Development VP, Marketing VP, Human Resources VP, Wealth Management Growth VP, Wealth Management Investment Solutions Chief of Staff VP, Enterprise Relationships & Business Consulting President, Wealth Management SVP, Avantax Planning Partners VP, Wealth Management Business Development VP, Service Excellence VP, Product Management VP, Compliance “There has been leadership turnover over the years, but the leadership team that is in place now is turning the ship and getting things in order - making the FPs the priority. Great culture, an opportunity to be innovative and share your ideas. I am very optimistic about the fate of our company!” - Employee Review on Glassdoor Recently Promoted New Talent Existing Talent Solid progress improving Wealth Management
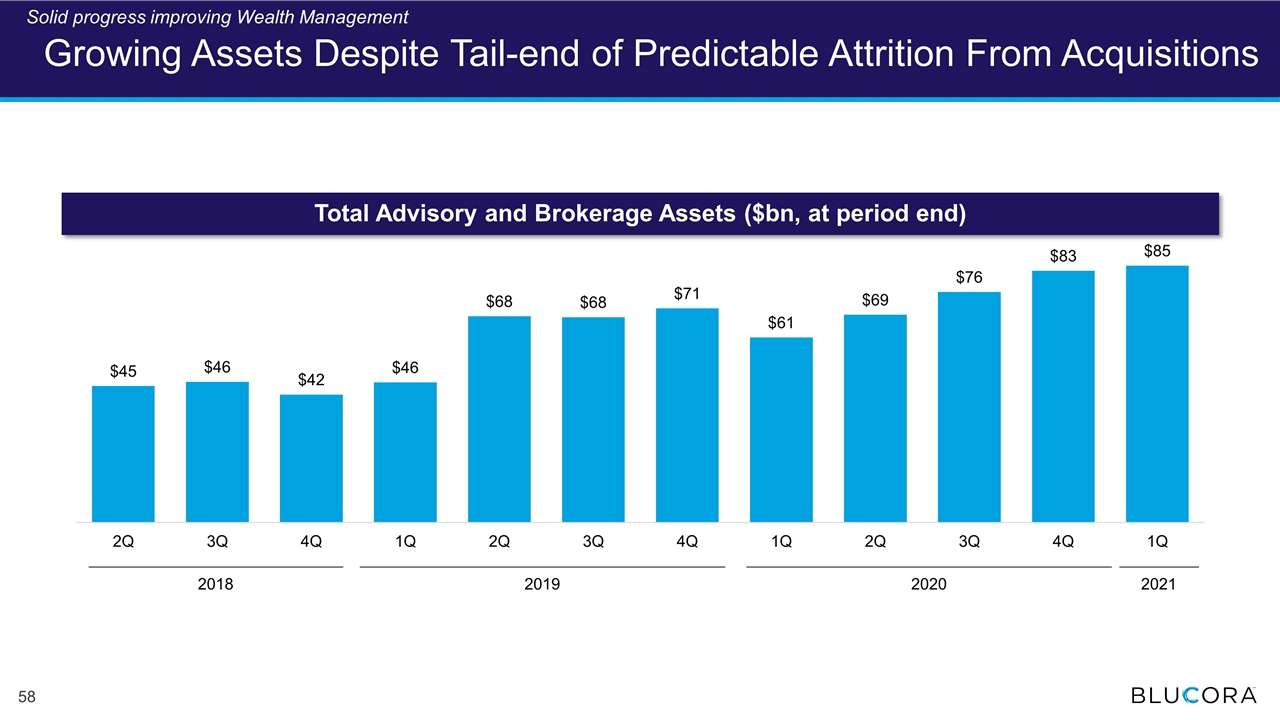
Growing Assets Despite Tail-end of Predictable Attrition From Acquisitions Total Advisory and Brokerage Assets ($bn, at period end) 2018 2019 2020 2021 Solid progress improving Wealth Management
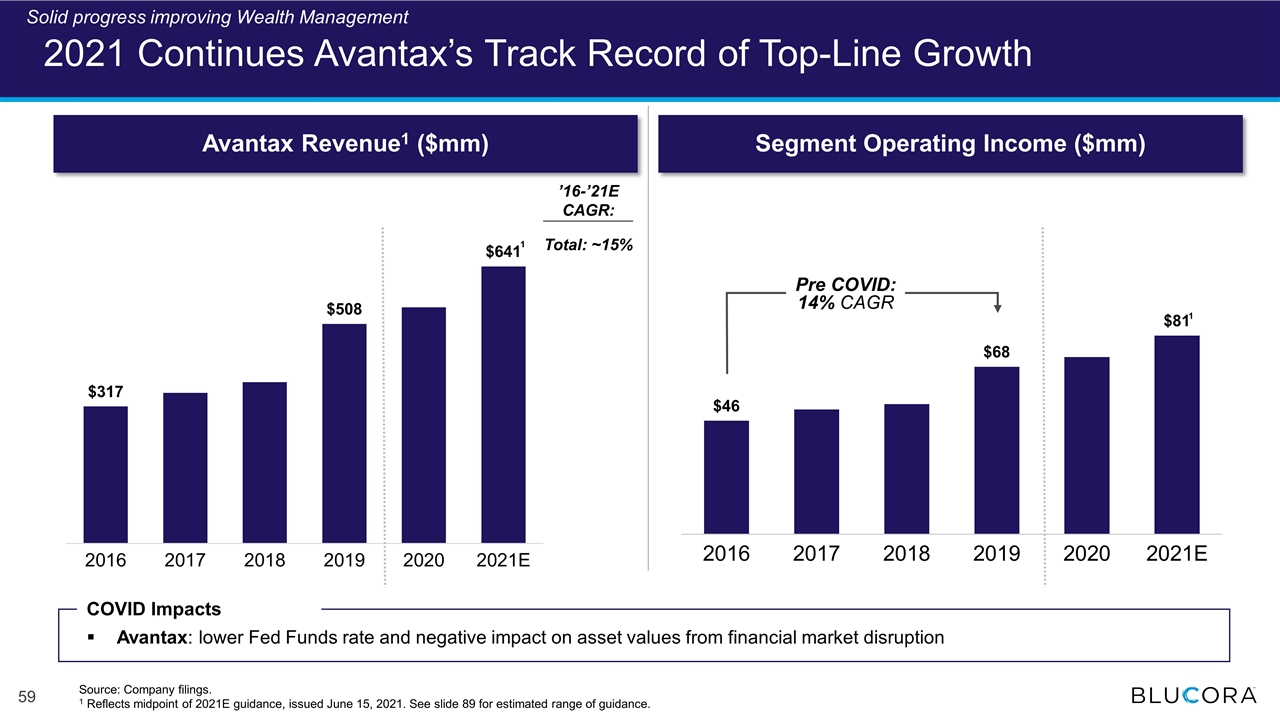
2021 Continues Avantax’s Track Record of Top-Line Growth Avantax Revenue1 ($mm) Segment Operating Income ($mm) 2021 - $205.0M 2021 - $84M ’16-’21E CAGR: Total: ~15% Pre COVID: 14% CAGR 1 Source: Company filings. 1 Reflects midpoint of 2021E guidance, issued June 15, 2021. See slide 89 for estimated range of guidance. COVID Impacts Avantax: lower Fed Funds rate and negative impact on asset values from financial market disruption Solid progress improving Wealth Management 1
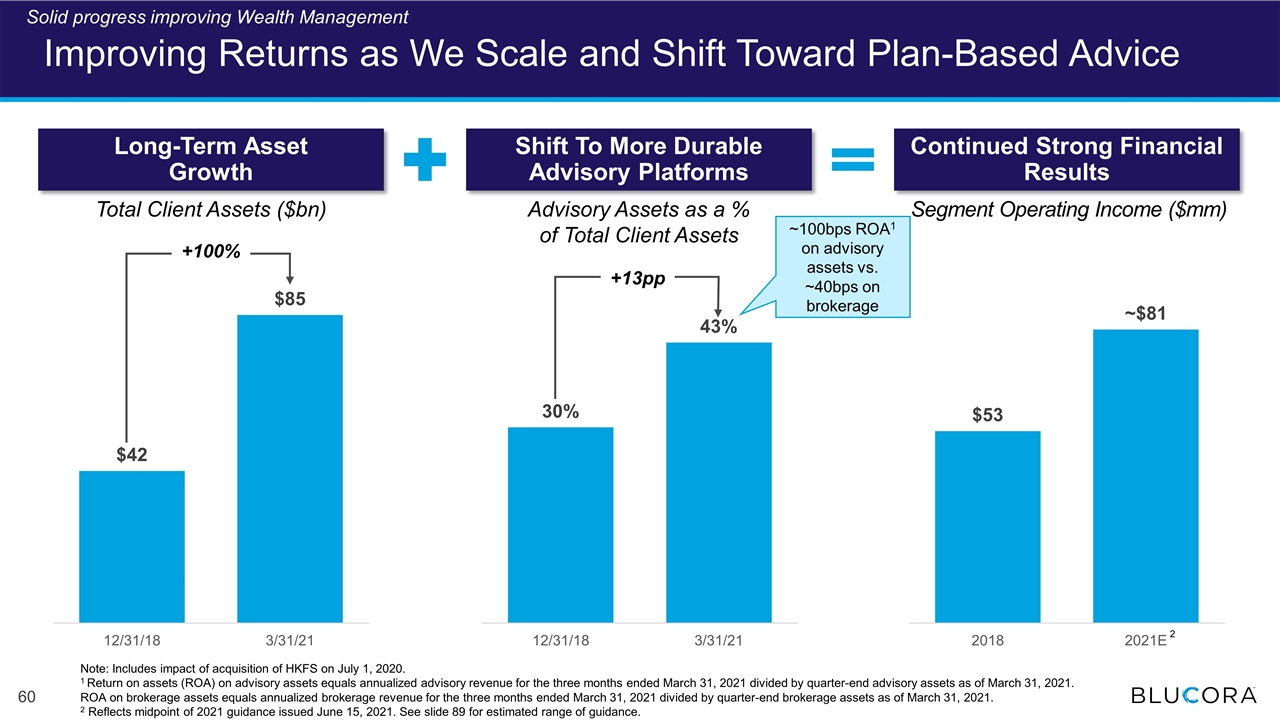
Long-Term Asset Growth Continued Strong Financial Results Shift To More Durable Advisory Platforms Improving Returns as We Scale and Shift Toward Plan-Based Advice +100% +13pp Total Client Assets ($bn) Advisory Assets as a % of Total Client Assets Segment Operating Income ($mm) ~100bps ROA1 on advisory assets vs. ~40bps on brokerage Note: Includes impact of acquisition of HKFS on July 1, 2020. 1 Return on assets (ROA) on advisory assets equals annualized advisory revenue for the three months ended March 31, 2021 divided by quarter-end advisory assets as of March 31, 2021. ROA on brokerage assets equals annualized brokerage revenue for the three months ended March 31, 2021 divided by quarter-end brokerage assets as of March 31, 2021. 2 Reflects midpoint of 2021 guidance issued June 15, 2021. See slide 89 for estimated range of guidance. Solid progress improving Wealth Management 2
Avantax – Repositioned to Deliver Sustainable Growth Solid progress improving Wealth Management Building on a strong franchise Executing clear, sustainable growth strategy Delivering strong results
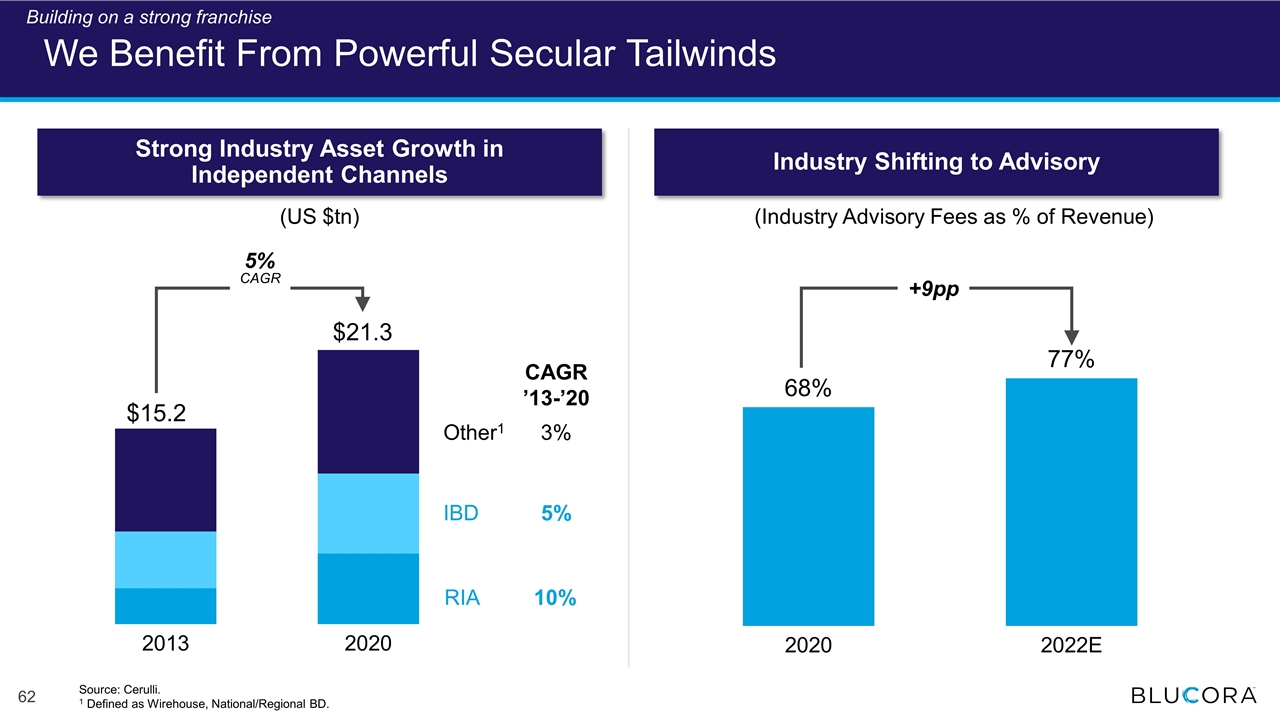
We Benefit From Powerful Secular Tailwinds $15.2 $21.3 IBD RIA Other1 5% 10% 3% CAGR ’13-’20 5% CAGR Strong Industry Asset Growth in Independent Channels Industry Shifting to Advisory (US $tn) +9pp (Industry Advisory Fees as % of Revenue) Source: Cerulli. 1 Defined as Wirehouse, National/Regional BD. Building on a strong franchise
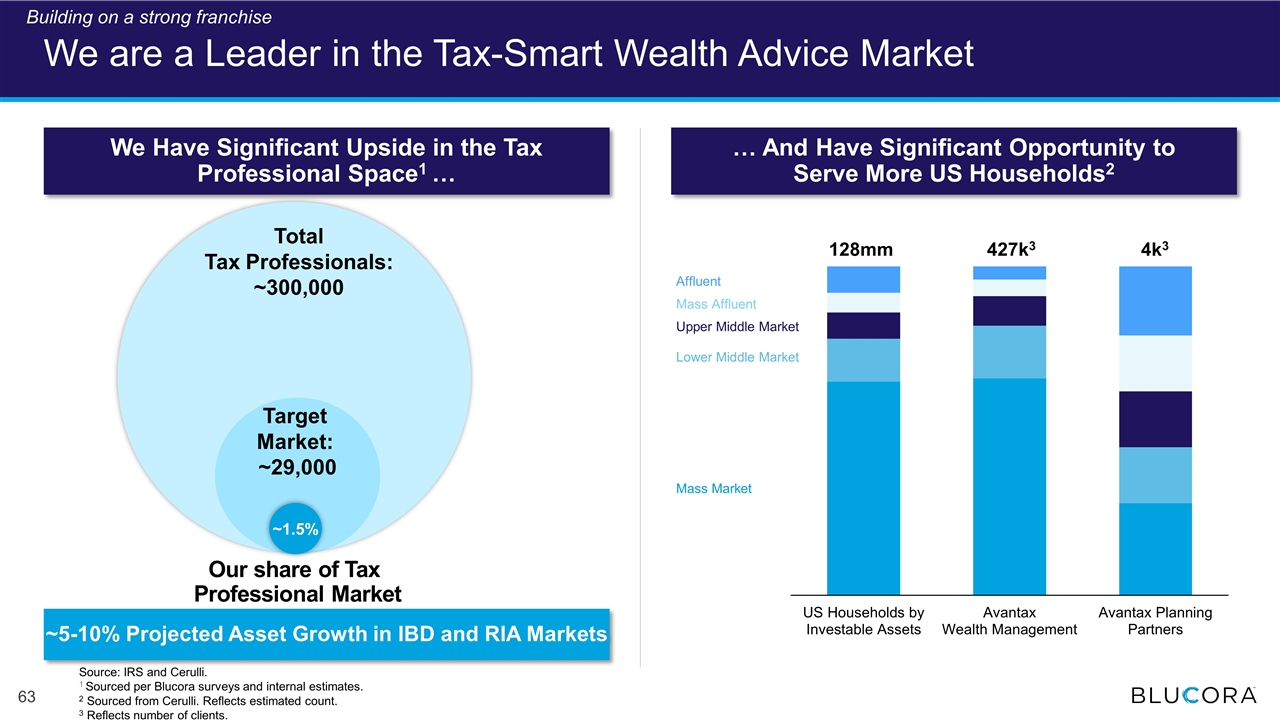
We are a Leader in the Tax-Smart Wealth Advice Market We Have Significant Upside in the Tax Professional Space1 … … And Have Significant Opportunity to Serve More US Households2 Our share of Tax Professional Market Source: IRS and Cerulli. 1 Sourced per Blucora surveys and internal estimates. 2 Sourced from Cerulli. Reflects estimated count. 3 Reflects number of clients. Total Tax Professionals: ~300,000 Target Market: ~29,000 ~1.5% 128mm 427k3 4k3 Mass Market Lower Middle Market Upper Middle Market Mass Affluent Affluent Building on a strong franchise ~5-10% Projected Asset Growth in IBD and RIA Markets
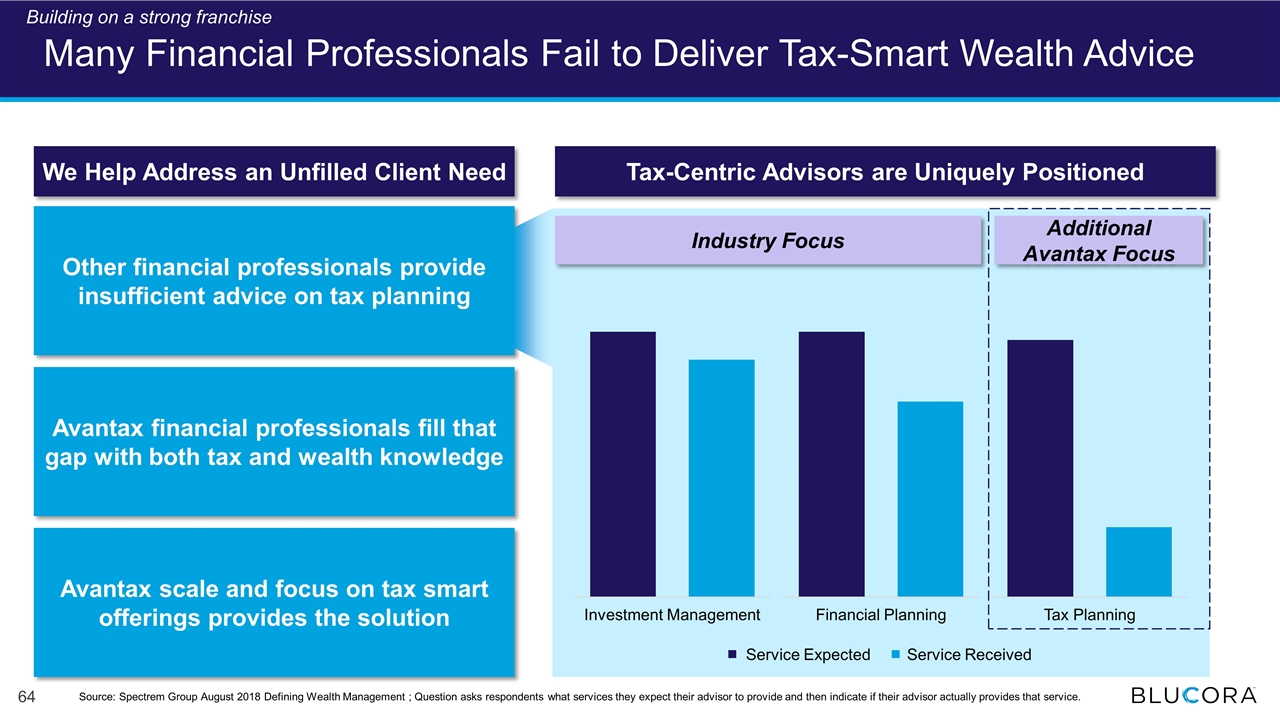
Many Financial Professionals Fail to Deliver Tax-Smart Wealth Advice We Help Address an Unfilled Client Need Tax-Centric Advisors are Uniquely Positioned Other financial professionals provide insufficient advice on tax planning Avantax financial professionals fill that gap with both tax and wealth knowledge Avantax scale and focus on tax smart offerings provides the solution Investment Management Financial Planning Tax Planning Industry Focus Additional Avantax Focus Service Expected Service Received Source: Spectrem Group August 2018 Defining Wealth Management ; Question asks respondents what services they expect their advisor to provide and then indicate if their advisor actually provides that service. Building on a strong franchise
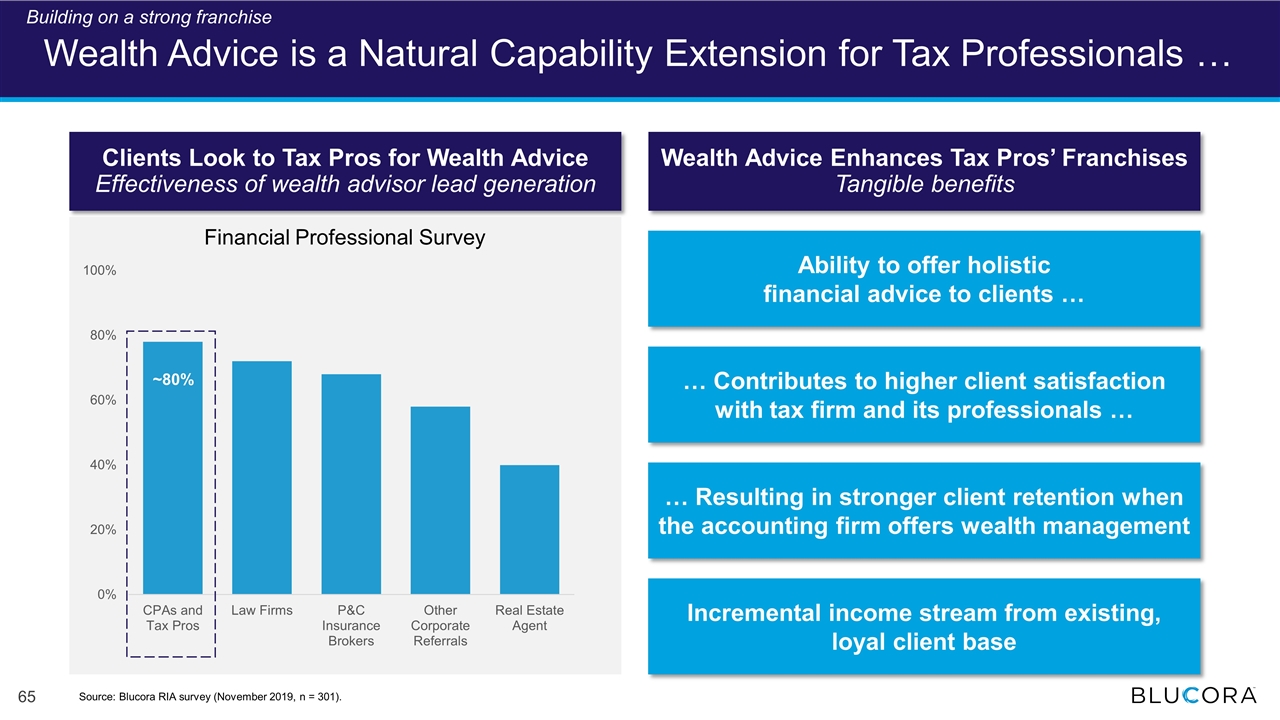
Wealth Advice is a Natural Capability Extension for Tax Professionals … Clients Look to Tax Pros for Wealth Advice Effectiveness of wealth advisor lead generation ~80% Financial Professional Survey Wealth Advice Enhances Tax Pros’ Franchises Tangible benefits Ability to offer holistic financial advice to clients … … Contributes to higher client satisfaction with tax firm and its professionals … … Resulting in stronger client retention when the accounting firm offers wealth management Incremental income stream from existing, loyal client base Source: Blucora RIA survey (November 2019, n = 301). Building on a strong franchise
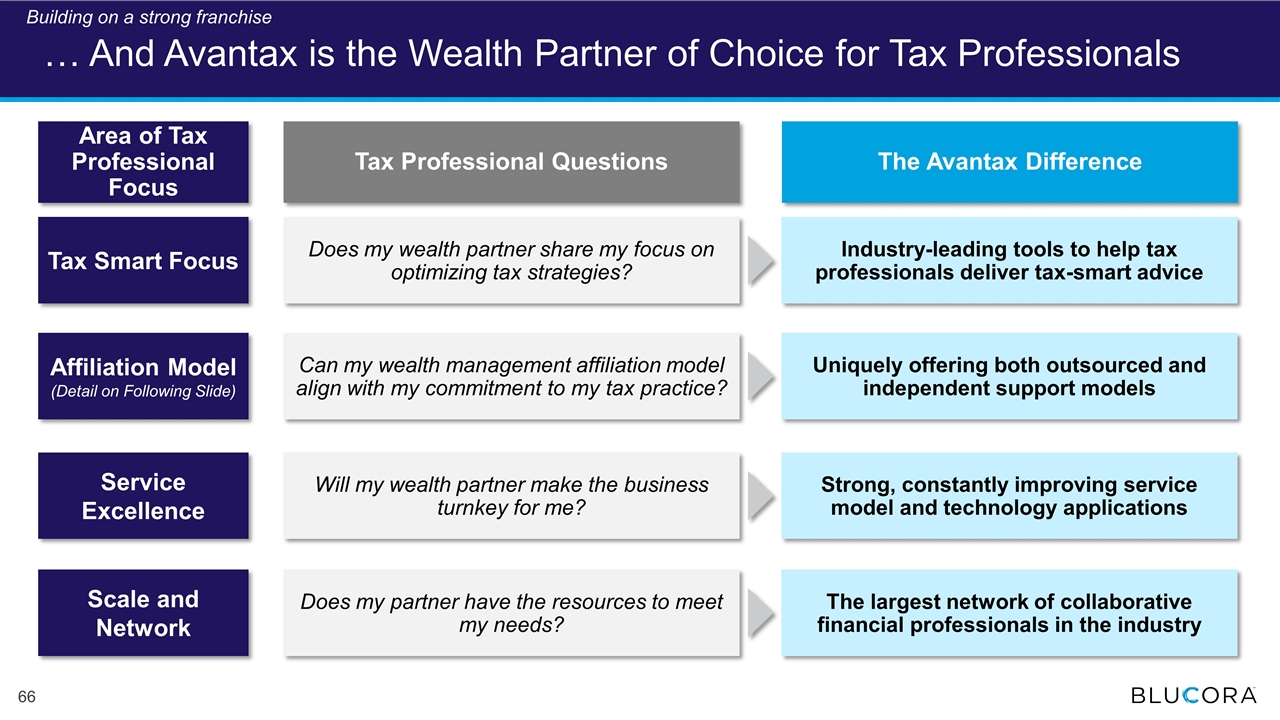
Scale and Network Can my wealth management affiliation model align with my commitment to my tax practice? … And Avantax is the Wealth Partner of Choice for Tax Professionals Service Excellence Will my wealth partner make the business turnkey for me? Does my partner have the resources to meet my needs? Tax Smart Focus Does my wealth partner share my focus on optimizing tax strategies? Affiliation Model (Detail on Following Slide) Area of Tax Professional Focus Tax Professional Questions The Avantax Difference Strong, constantly improving service model and technology applications Uniquely offering both outsourced and independent support models Industry-leading tools to help tax professionals deliver tax-smart advice The largest network of collaborative financial professionals in the industry Building on a strong franchise
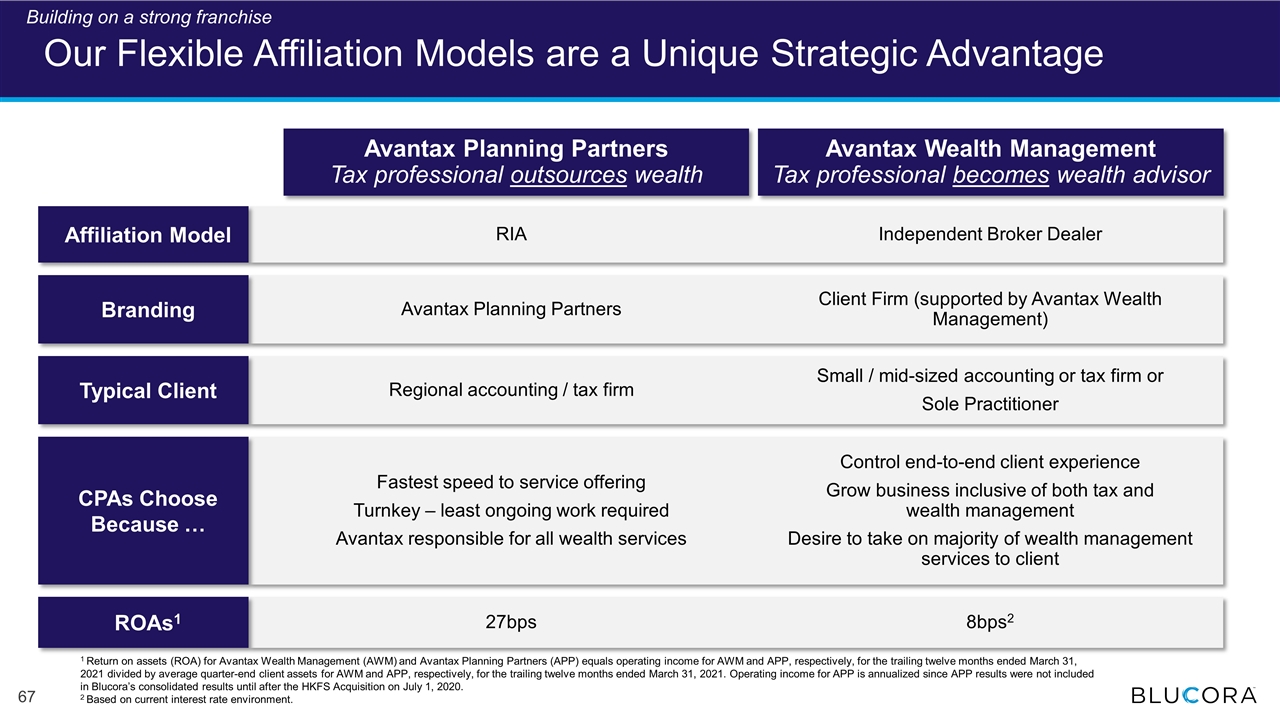
Our Flexible Affiliation Models are a Unique Strategic Advantage CPAs Choose Because … Fastest speed to service offering Turnkey – least ongoing work required Avantax responsible for all wealth services ROAs1 27bps Affiliation Model RIA Branding Avantax Planning Partners Avantax Planning Partners Tax professional outsources wealth Avantax Wealth Management Tax professional becomes wealth advisor Control end-to-end client experience Grow business inclusive of both tax and wealth management Desire to take on majority of wealth management services to client Client Firm (supported by Avantax Wealth Management) Independent Broker Dealer 8bps2 Typical Client Regional accounting / tax firm Small / mid-sized accounting or tax firm or Sole Practitioner 1 Return on assets (ROA) for Avantax Wealth Management (AWM) and Avantax Planning Partners (APP) equals operating income for AWM and APP, respectively, for the trailing twelve months ended March 31, 2021 divided by average quarter-end client assets for AWM and APP, respectively, for the trailing twelve months ended March 31, 2021. Operating income for APP is annualized since APP results were not included in Blucora’s consolidated results until after the HKFS Acquisition on July 1, 2020. 2 Based on current interest rate environment. Building on a strong franchise

Our Wealth Advisors and CPA Affiliates Are Our Best Brand Ambassadors Video Building on a strong franchise
Avantax – Repositioned to Deliver Sustainable Growth Solid progress improving Wealth Management Building on a strong franchise Executing clear, sustainable growth strategy Delivering strong results
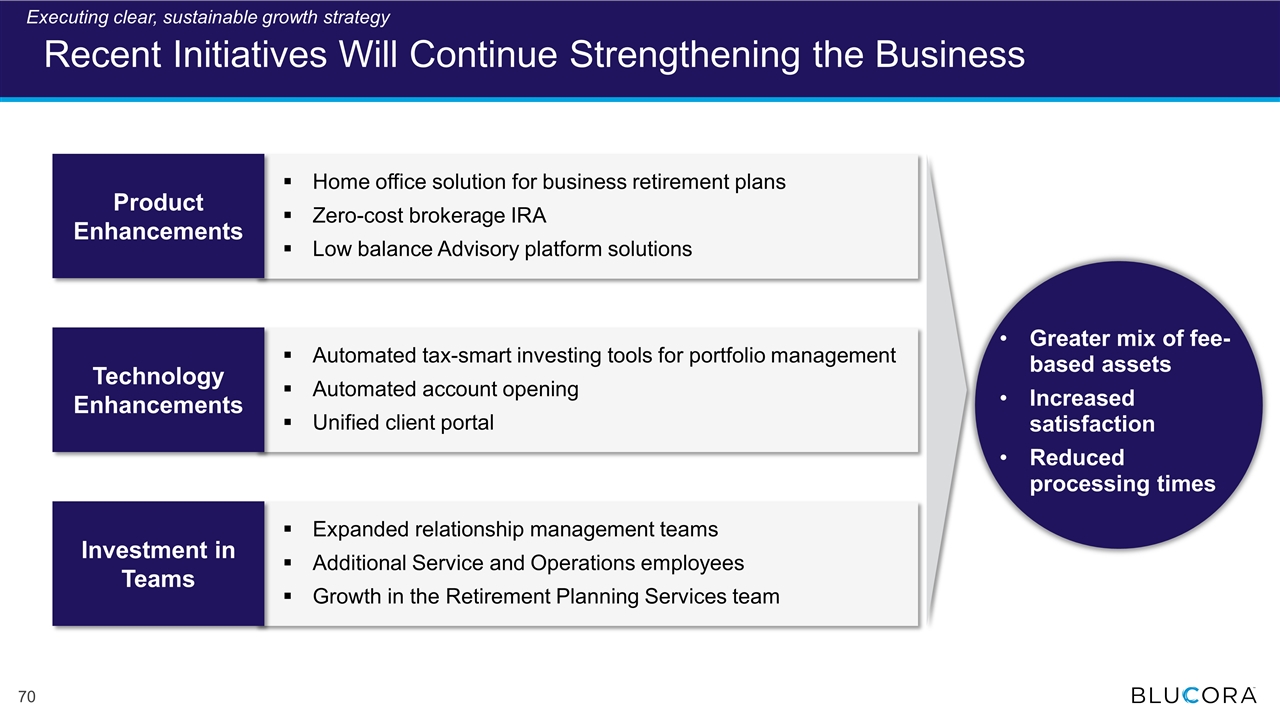
Recent Initiatives Will Continue Strengthening the Business Greater mix of fee-based assets Increased satisfaction Reduced processing times Expanded relationship management teams Additional Service and Operations employees Growth in the Retirement Planning Services team Investment in Teams Home office solution for business retirement plans Zero-cost brokerage IRA Low balance Advisory platform solutions Product Enhancements Automated tax-smart investing tools for portfolio management Automated account opening Unified client portal Technology Enhancements Executing clear, sustainable growth strategy
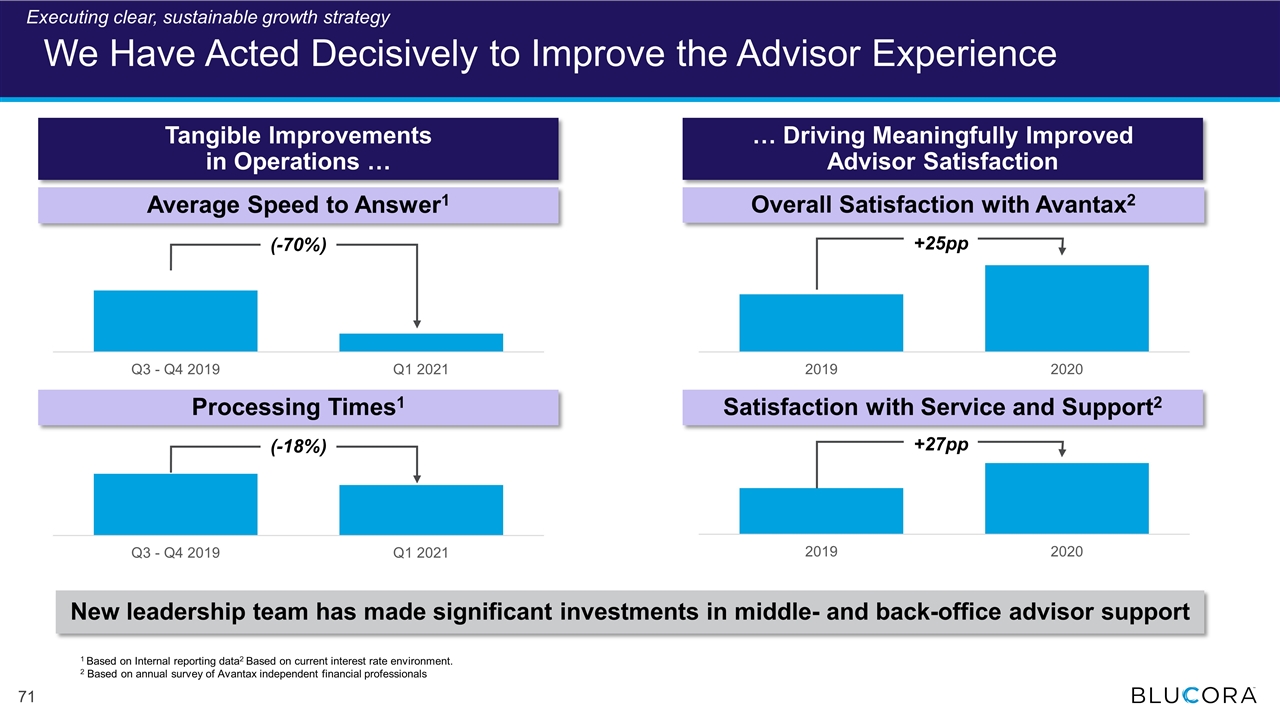
We Have Acted Decisively to Improve the Advisor Experience Tangible Improvements in Operations … … Driving Meaningfully Improved Advisor Satisfaction (-70%) +25pp Average Speed to Answer1 Overall Satisfaction with Avantax2 +27pp New leadership team has made significant investments in middle- and back-office advisor support (-18%) Satisfaction with Service and Support2 Processing Times1 Executing clear, sustainable growth strategy 1 Based on Internal reporting data2 Based on current interest rate environment. 2 Based on annual survey of Avantax independent financial professionals
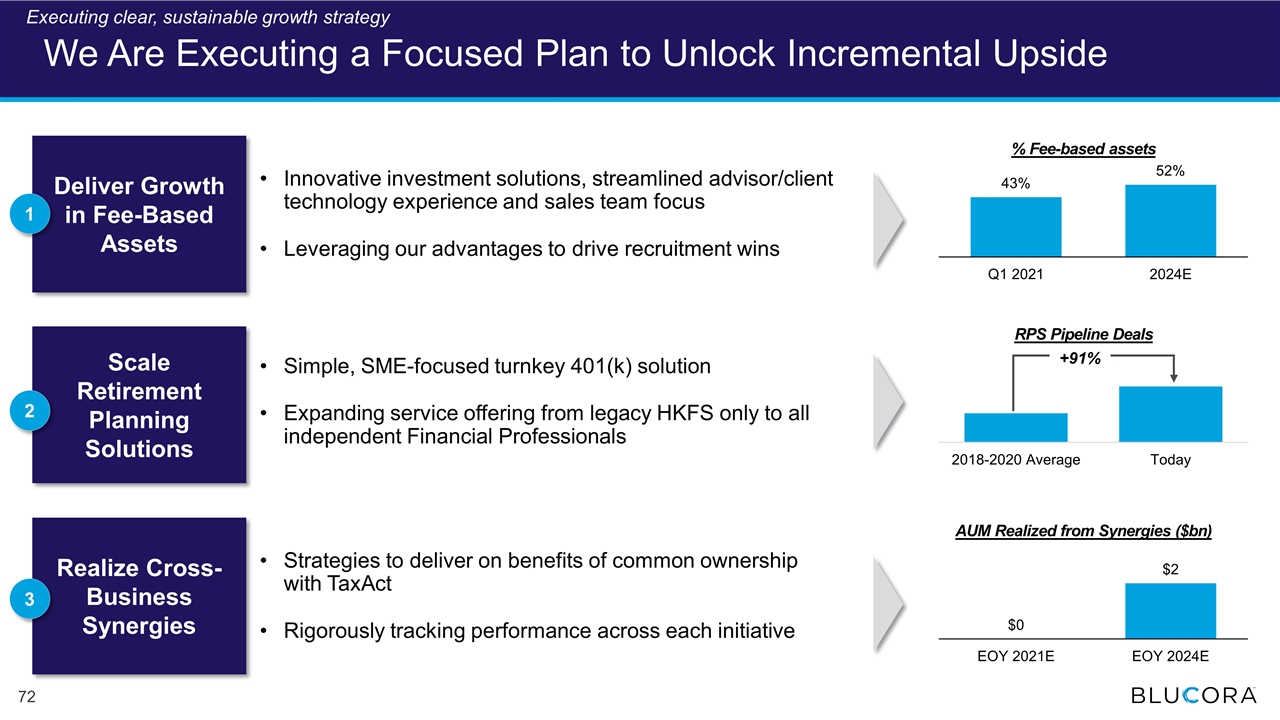
We Are Executing a Focused Plan to Unlock Incremental Upside Realize Cross-Business Synergies Strategies to deliver on benefits of common ownership with TaxAct Rigorously tracking performance across each initiative Scale Retirement Planning Solutions Simple, SME-focused turnkey 401(k) solution Expanding service offering from legacy HKFS only to all independent Financial Professionals Deliver Growth in Fee-Based Assets Innovative investment solutions, streamlined advisor/client technology experience and sales team focus Leveraging our advantages to drive recruitment wins 1 2 3 % Fee-based assets AUM Realized from Synergies ($bn) +91% RPS Pipeline Deals Executing clear, sustainable growth strategy
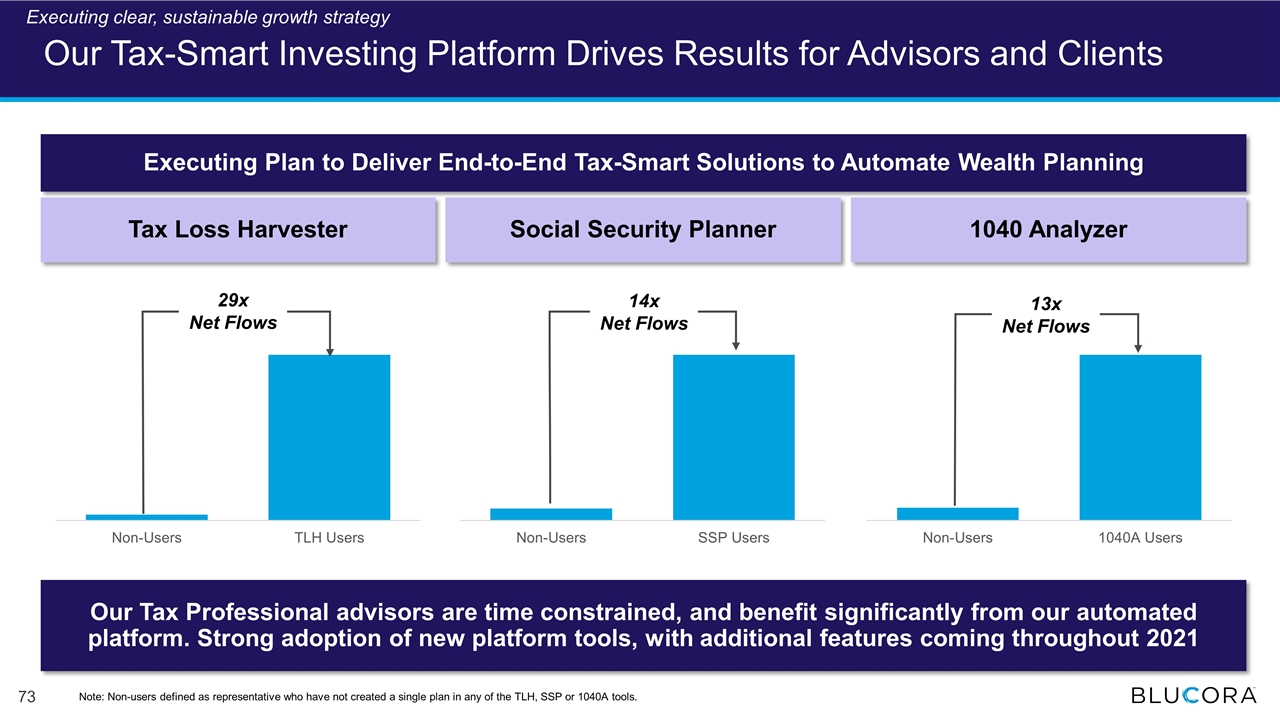
Our Tax-Smart Investing Platform Drives Results for Advisors and Clients Our Tax Professional advisors are time constrained, and benefit significantly from our automated platform. Strong adoption of new platform tools, with additional features coming throughout 2021 Executing Plan to Deliver End-to-End Tax-Smart Solutions to Automate Wealth Planning Tax Loss Harvester Social Security Planner 29x Net Flows 14x Net Flows 1040 Analyzer 13x Net Flows Note: Non-users defined as representative who have not created a single plan in any of the TLH, SSP or 1040A tools. Executing clear, sustainable growth strategy
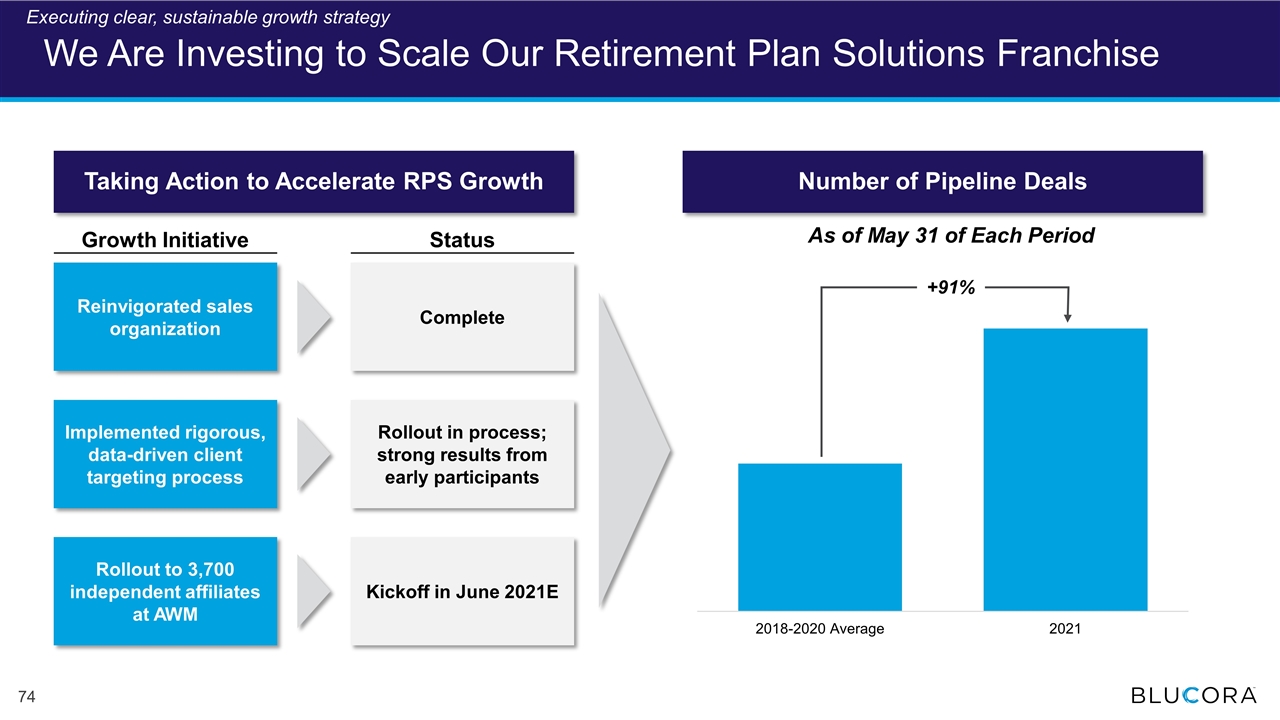
+91% Number of Pipeline Deals Taking Action to Accelerate RPS Growth Growth Initiative Status Reinvigorated sales organization Implemented rigorous, data-driven client targeting process Rollout to 3,700 independent affiliates at AWM Complete Rollout in process; strong results from early participants Kickoff in June 2021E We Are Investing to Scale Our Retirement Plan Solutions Franchise As of May 31 of Each Period Executing clear, sustainable growth strategy
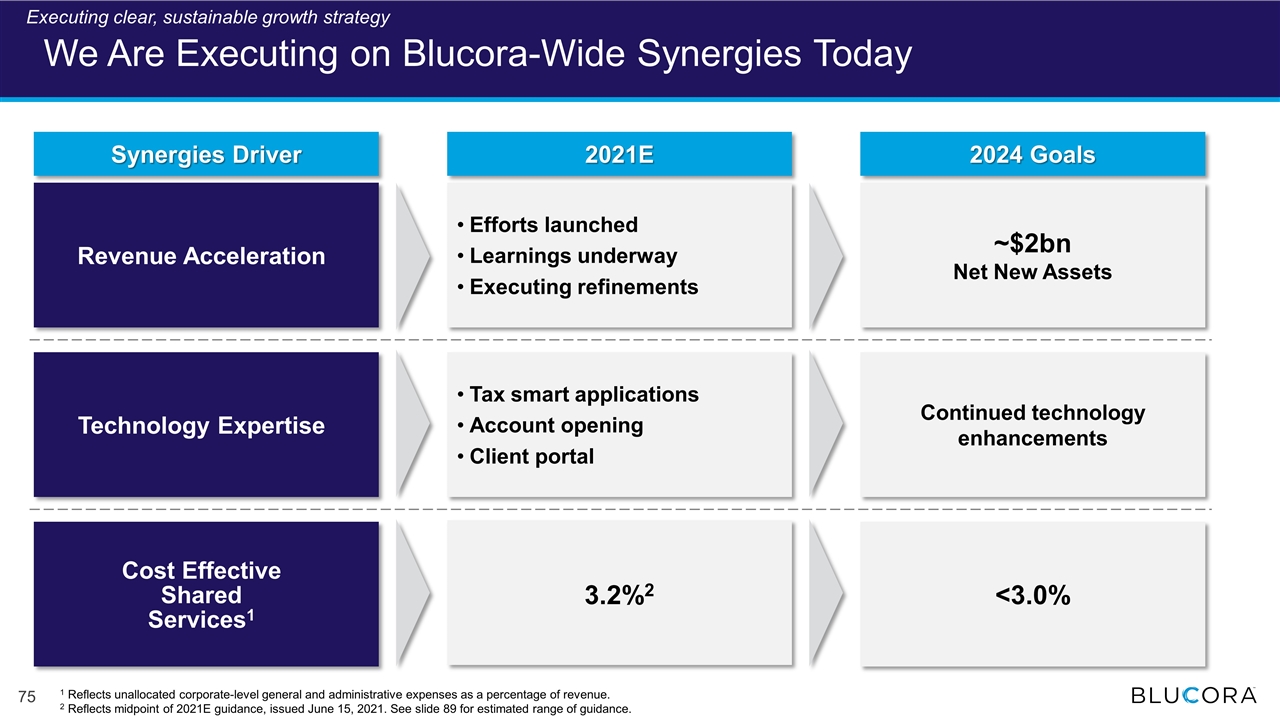
We Are Executing on Blucora-Wide Synergies Today Executing clear, sustainable growth strategy 2024 Goals 2021E Revenue Acceleration Technology Expertise Cost Effective Shared Services1 3.2%2 ~$2bn Net New Assets <3.0% Efforts launched Learnings underway Executing refinements Tax smart applications Account opening Client portal Continued technology enhancements 1 Reflects unallocated corporate-level general and administrative expenses as a percentage of revenue. 2 Reflects midpoint of 2021E guidance, issued June 15, 2021. See slide 89 for estimated range of guidance. Synergies Driver
Avantax – Repositioned to Deliver Sustainable Growth Solid progress improving Wealth Management Building on a strong franchise Executing clear, sustainable growth strategy Delivering strong results
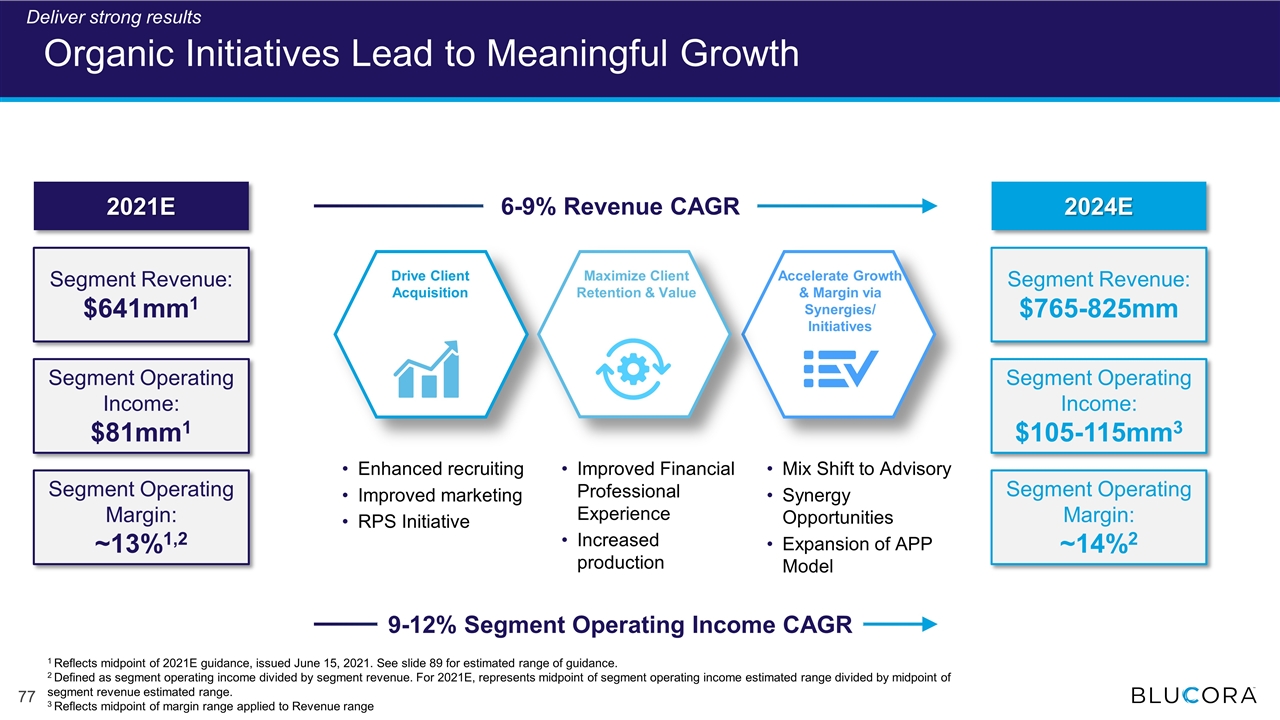
Organic Initiatives Lead to Meaningful Growth Maximize Client Retention & Value Accelerate Growth & Margin via Synergies/ Initiatives Enhanced recruiting Improved marketing RPS Initiative Improved Financial Professional Experience Increased production Mix Shift to Advisory Synergy Opportunities Expansion of APP Model 2021E 2024E Drive Client Acquisition 2021E Segment Revenue: $641mm1 Segment Operating Income: $81mm1 Segment Operating Margin: ~13%1,2 2024E Segment Revenue: $765-825mm Segment Operating Income: $105-115mm3 Segment Operating Margin: ~14%2 6-9% Revenue CAGR 1 Reflects midpoint of 2021E guidance, issued June 15, 2021. See slide 89 for estimated range of guidance. 2 Defined as segment operating income divided by segment revenue. For 2021E, represents midpoint of segment operating income estimated range divided by midpoint of segment revenue estimated range. 3 Reflects midpoint of margin range applied to Revenue range Deliver strong results 9-12% Segment Operating Income CAGR
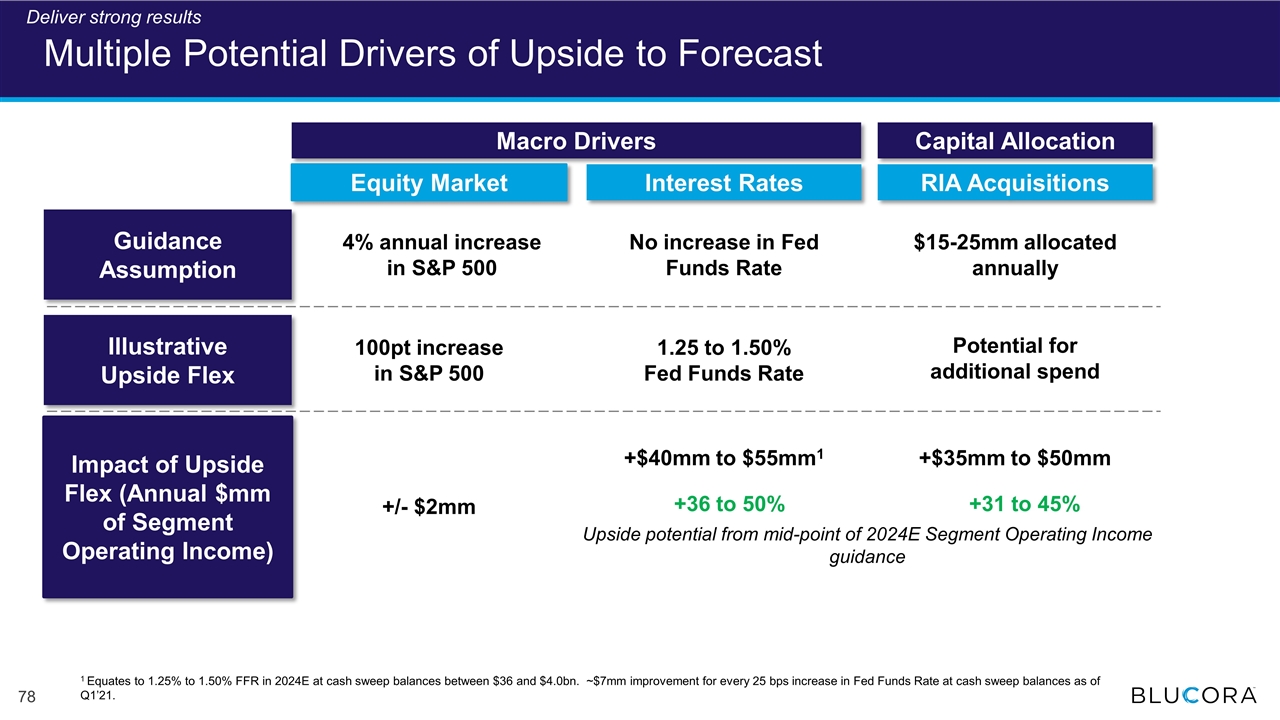
Multiple Potential Drivers of Upside to Forecast Equity Market Interest Rates 4% annual increase in S&P 500 No increase in Fed Funds Rate RIA Acquisitions $15-25mm allocated annually Guidance Assumption Impact of Upside Flex (Annual $mm of Segment Operating Income) +/- $2mm +$40mm to $55mm1 +$35mm to $50mm Illustrative Upside Flex 100pt increase in S&P 500 Macro Drivers Capital Allocation 1.25 to 1.50% Fed Funds Rate Potential for additional spend +36 to 50% +31 to 45% 1 Equates to 1.25% to 1.50% FFR in 2024E at cash sweep balances between $36 and $4.0bn. ~$7mm improvement for every 25 bps increase in Fed Funds Rate at cash sweep balances as of Q1’21. Deliver strong results Upside potential from mid-point of 2024E Segment Operating Income guidance
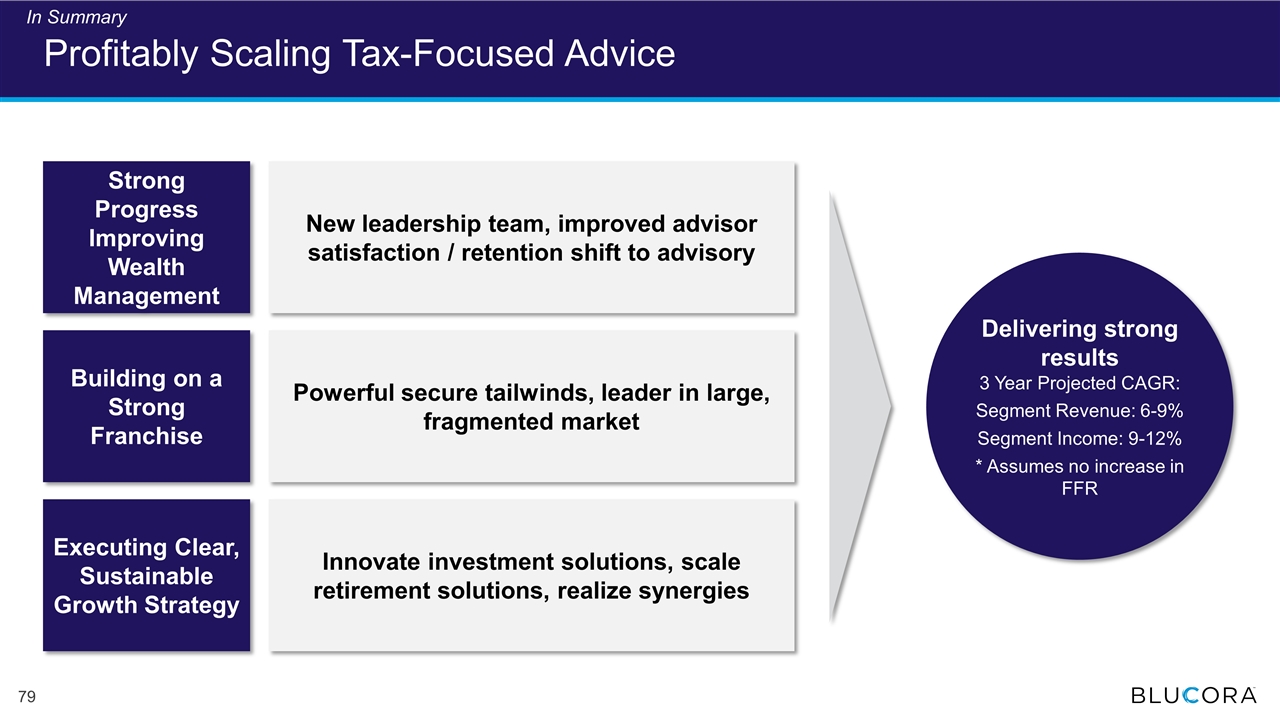
New leadership team, improved advisor satisfaction / retention shift to advisory Powerful secure tailwinds, leader in large, fragmented market Innovate investment solutions, scale retirement solutions, realize synergies Profitably Scaling Tax-Focused Advice Strong Progress Improving Wealth Management Building on a Strong Franchise Executing Clear, Sustainable Growth Strategy Delivering strong results 3 Year Projected CAGR: Segment Revenue: 6-9% Segment Income: 9-12% * Assumes no increase in FFR In Summary

Creating Value Through Disciplined Execution and Capital Allocation Marc Mehlman Chief Financial Officer
Blucora – Repositioned to Deliver Sustainable Growth Solid progress repositioning Blucora Building on two strong businesses Executing clear, sustainable growth strategy Delivering strong results
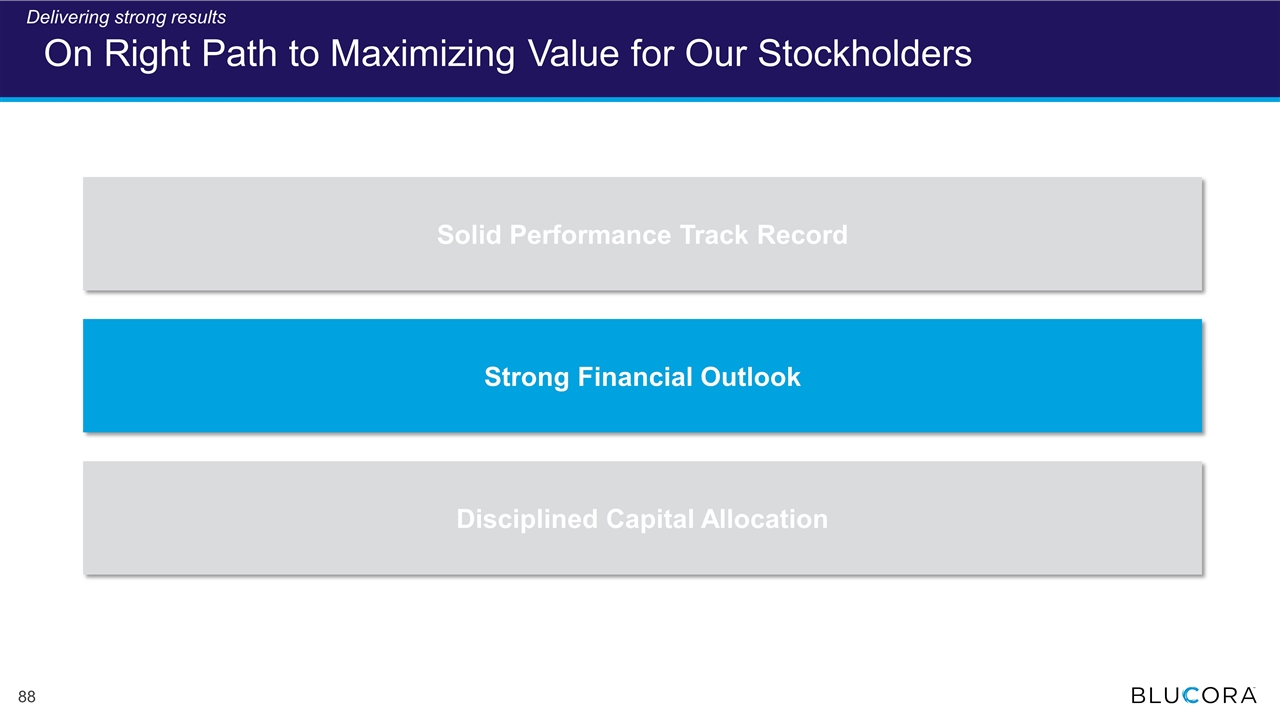
On Right Path to Maximizing Value for Our Stockholders Solid Performance Track Record Strong Financial Outlook Disciplined Capital Allocation Delivering strong results
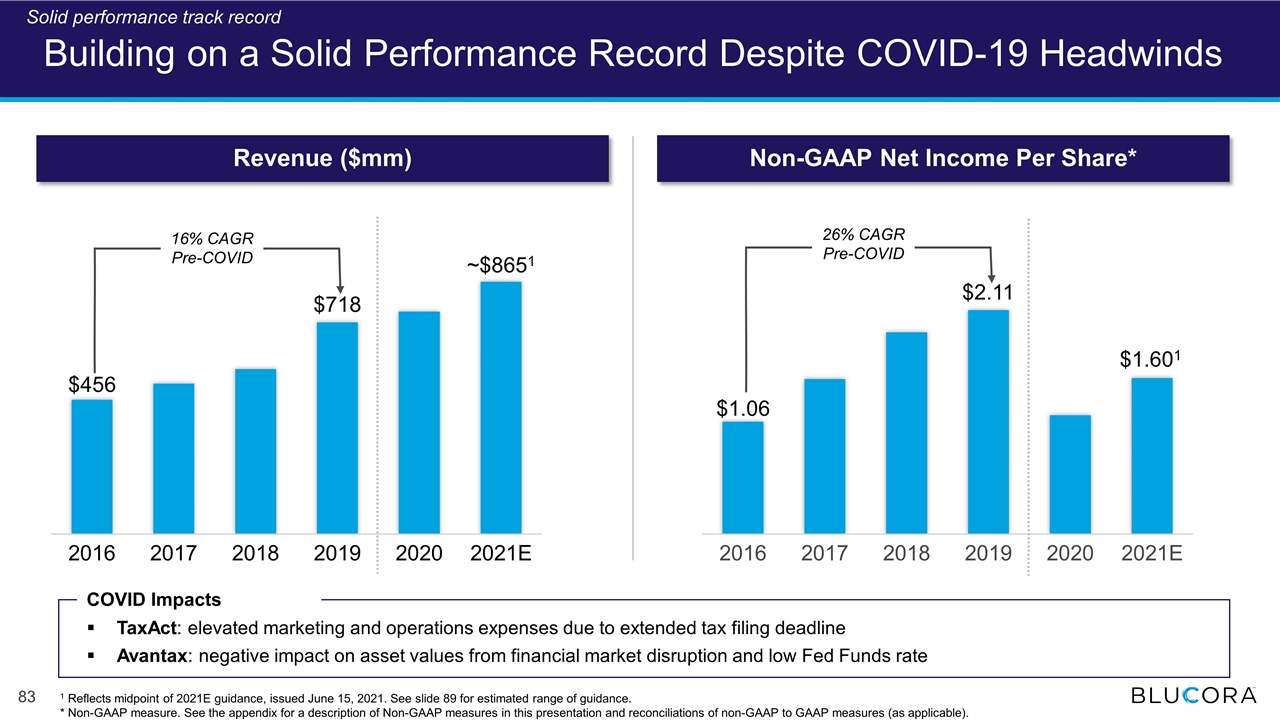
Building on a Solid Performance Record Despite COVID-19 Headwinds ~$8651 $1.601 $456 $1.06 Revenue ($mm) Non-GAAP Net Income Per Share* 16% CAGR Pre-COVID 26% CAGR Pre-COVID 1 Reflects midpoint of 2021E guidance, issued June 15, 2021. See slide 89 for estimated range of guidance. * Non-GAAP measure. See the appendix for a description of Non-GAAP measures in this presentation and reconciliations of non-GAAP to GAAP measures (as applicable). Solid performance track record COVID Impacts TaxAct: elevated marketing and operations expenses due to extended tax filing deadline Avantax: negative impact on asset values from financial market disruption and low Fed Funds rate
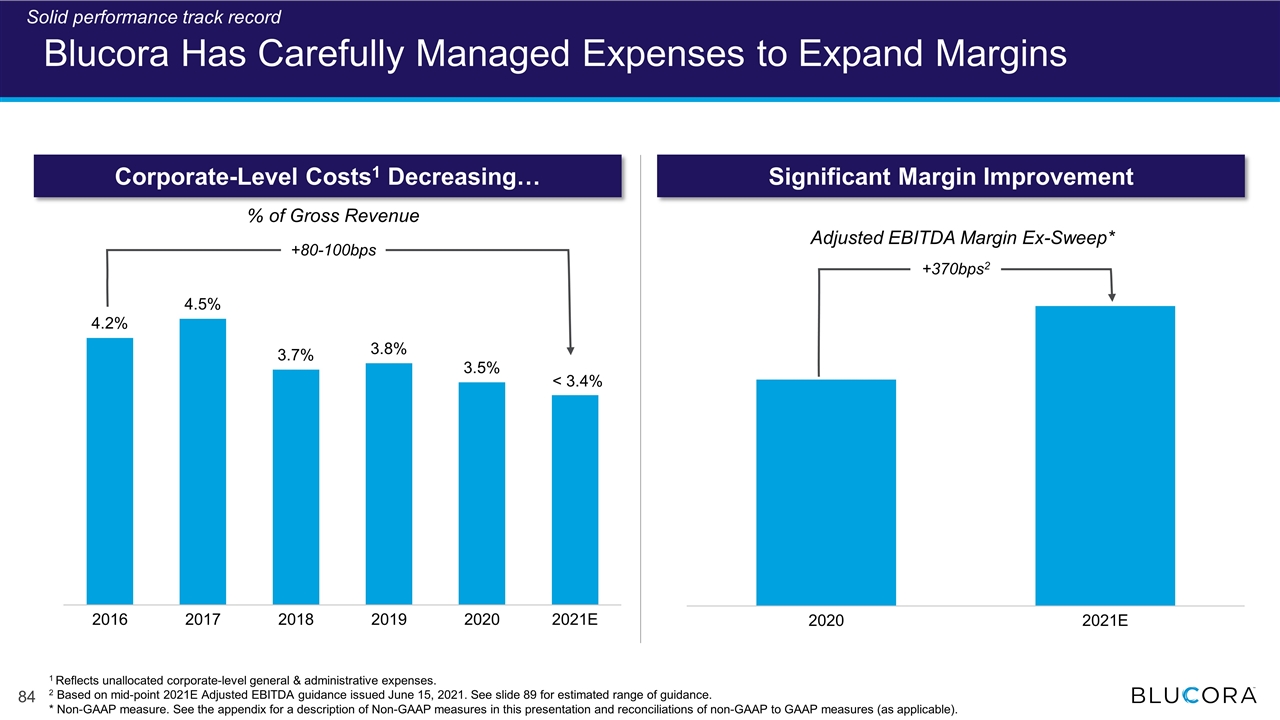
Blucora Has Carefully Managed Expenses to Expand Margins < 3.4% % of Gross Revenue +80-100bps +370bps2 Adjusted EBITDA Margin Ex-Sweep* 1 Reflects unallocated corporate-level general & administrative expenses. 2 Based on mid-point 2021E Adjusted EBITDA guidance issued June 15, 2021. See slide 89 for estimated range of guidance. * Non-GAAP measure. See the appendix for a description of Non-GAAP measures in this presentation and reconciliations of non-GAAP to GAAP measures (as applicable). Corporate-Level Costs1 Decreasing… Significant Margin Improvement Solid performance track record
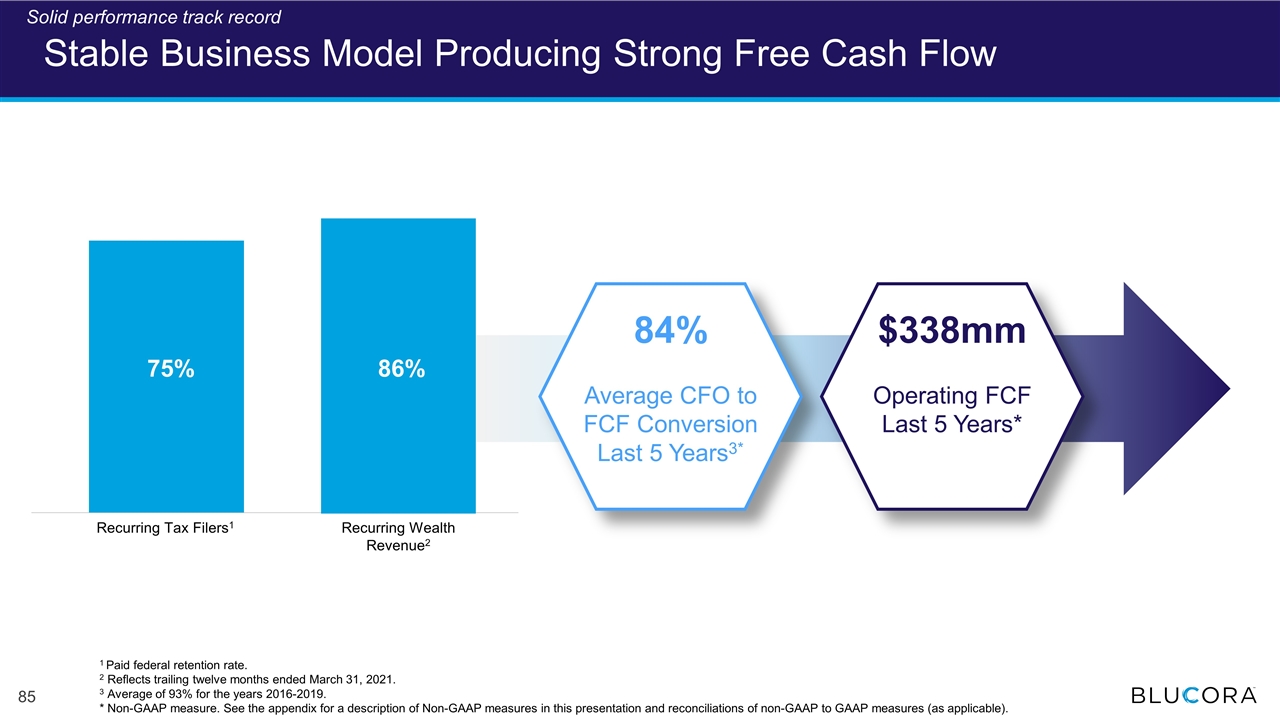
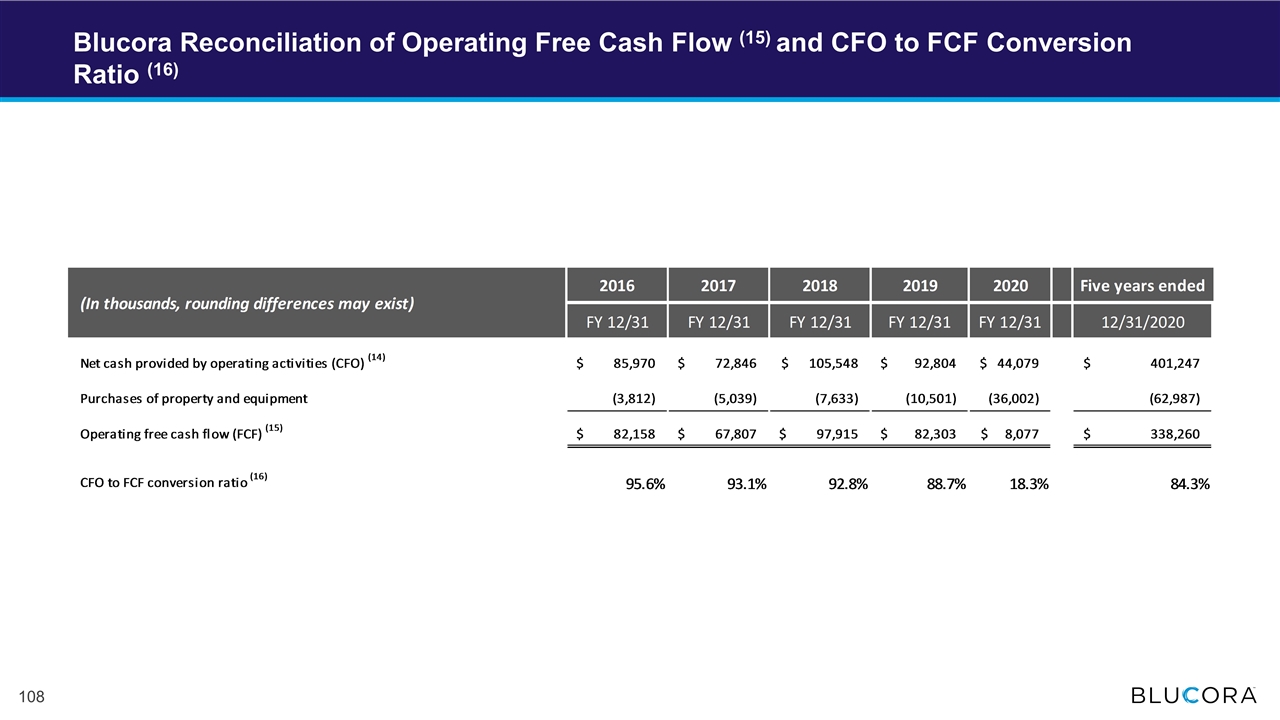
Stable Business Model Producing Strong Free Cash Flow 84% Average CFO to FCF Conversion Last 5 Years3* $338mm Operating FCF Last 5 Years* 1 Paid federal retention rate. 2 Reflects trailing twelve months ended March 31, 2021. 3 Average of 93% for the years 2016-2019. * Non-GAAP measure. See the appendix for a description of Non-GAAP measures in this presentation and reconciliations of non-GAAP to GAAP measures (as applicable). Recurring Tax Filers1 Recurring Wealth Revenue2 75% 86% Solid performance track record
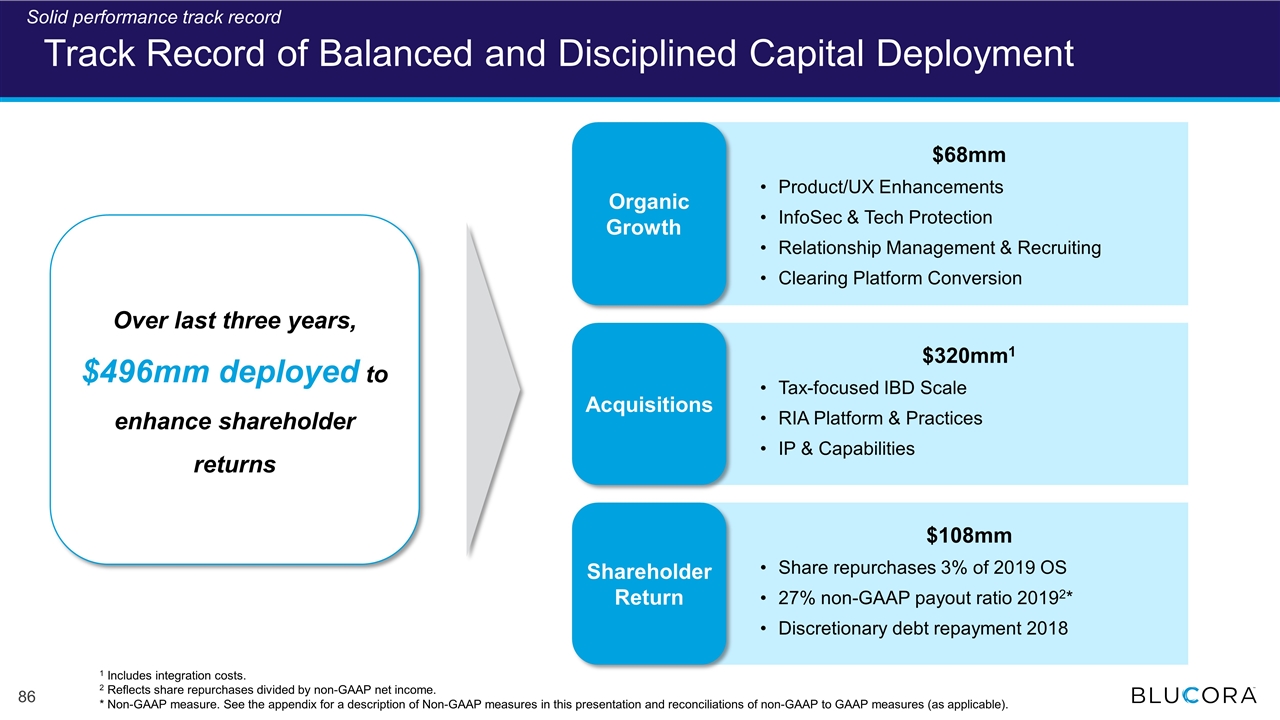
$68mm Product/UX Enhancements InfoSec & Tech Protection Relationship Management & Recruiting Clearing Platform Conversion $320mm1 Tax-focused IBD Scale RIA Platform & Practices IP & Capabilities $108mm Share repurchases 3% of 2019 OS 27% non-GAAP payout ratio 20192* Discretionary debt repayment 2018 Track Record of Balanced and Disciplined Capital Deployment Organic Growth Acquisitions Shareholder Return Over last three years, $496mm deployed to enhance shareholder returns 1 Includes integration costs. 2 Reflects share repurchases divided by non-GAAP net income. * Non-GAAP measure. See the appendix for a description of Non-GAAP measures in this presentation and reconciliations of non-GAAP to GAAP measures (as applicable). Solid performance track record
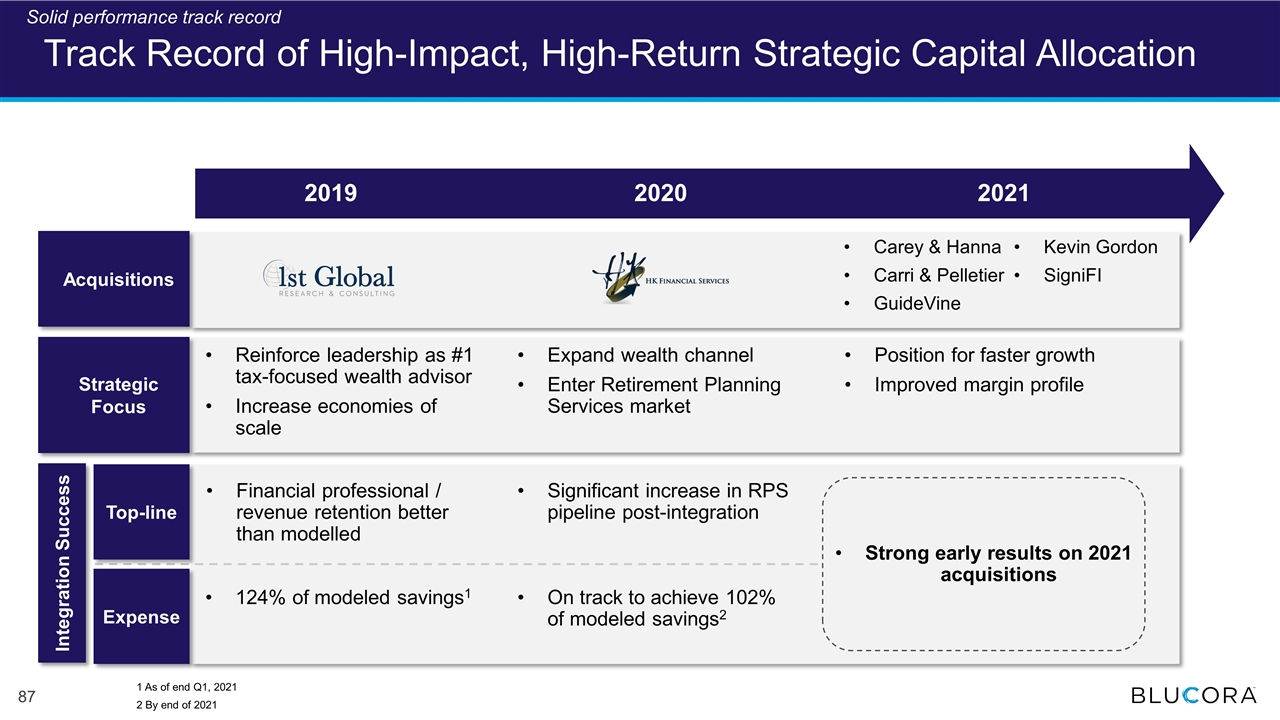
Track Record of High-Impact, High-Return Strategic Capital Allocation 2019 2020 2021 Acquisitions Strategic Focus Reinforce leadership as #1 tax-focused wealth advisor Increase economies of scale Expand wealth channel Enter Retirement Planning Services market Position for faster growth Improved margin profile Top-line Significant increase in RPS pipeline post-integration Expense 124% of modeled savings1 On track to achieve 102% of modeled savings2 Integration Success Carey & Hanna Carri & Pelletier GuideVine Kevin Gordon SigniFI Strong early results on 2021 acquisitions Financial professional / revenue retention better than modelled Solid performance track record 1 As of end Q1, 2021 2 By end of 2021
On Right Path to Maximizing Value for Our Stockholders Solid Performance Track Record Strong Financial Outlook Disciplined Capital Allocation Delivering strong results
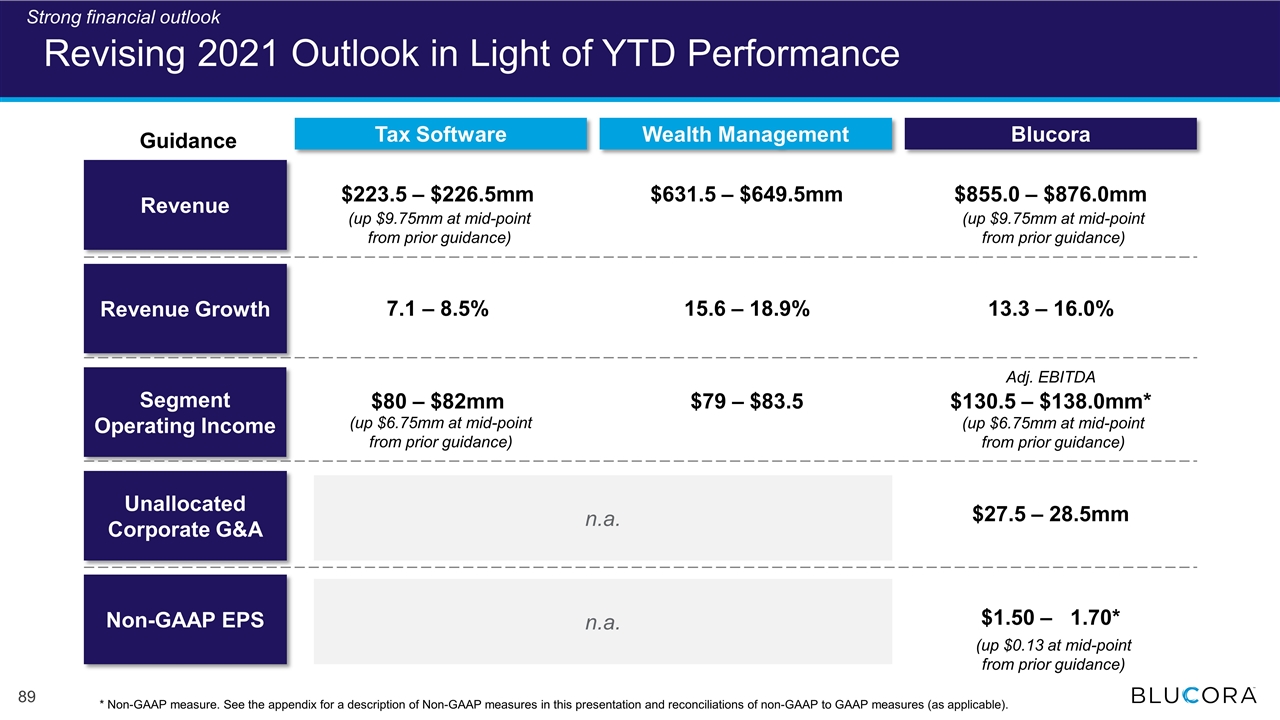
Revising 2021 Outlook in Light of YTD Performance * Non-GAAP measure. See the appendix for a description of Non-GAAP measures in this presentation and reconciliations of non-GAAP to GAAP measures (as applicable). Wealth Management Revenue Growth Segment Operating Income Non-GAAP EPS Unallocated Corporate G&A Revenue $223.5 – $226.5mm 7.1 – 8.5% $80 – $82mm – – $631.5 – $649.5mm 15.6 – 18.9% $79 – $83.5 – – $855.0 – $876.0mm 13.3 – 16.0% $130.5 – $138.0mm* $27.5 – 28.5mm $1.50 – 1.70* n.a. Tax Software Blucora n.a. (up $6.75mm at mid-point from prior guidance) Adj. EBITDA Strong financial outlook (up $6.75mm at mid-point from prior guidance) (up $9.75mm at mid-point from prior guidance) (up $9.75mm at mid-point from prior guidance) (up $0.13 at mid-point from prior guidance) Guidance
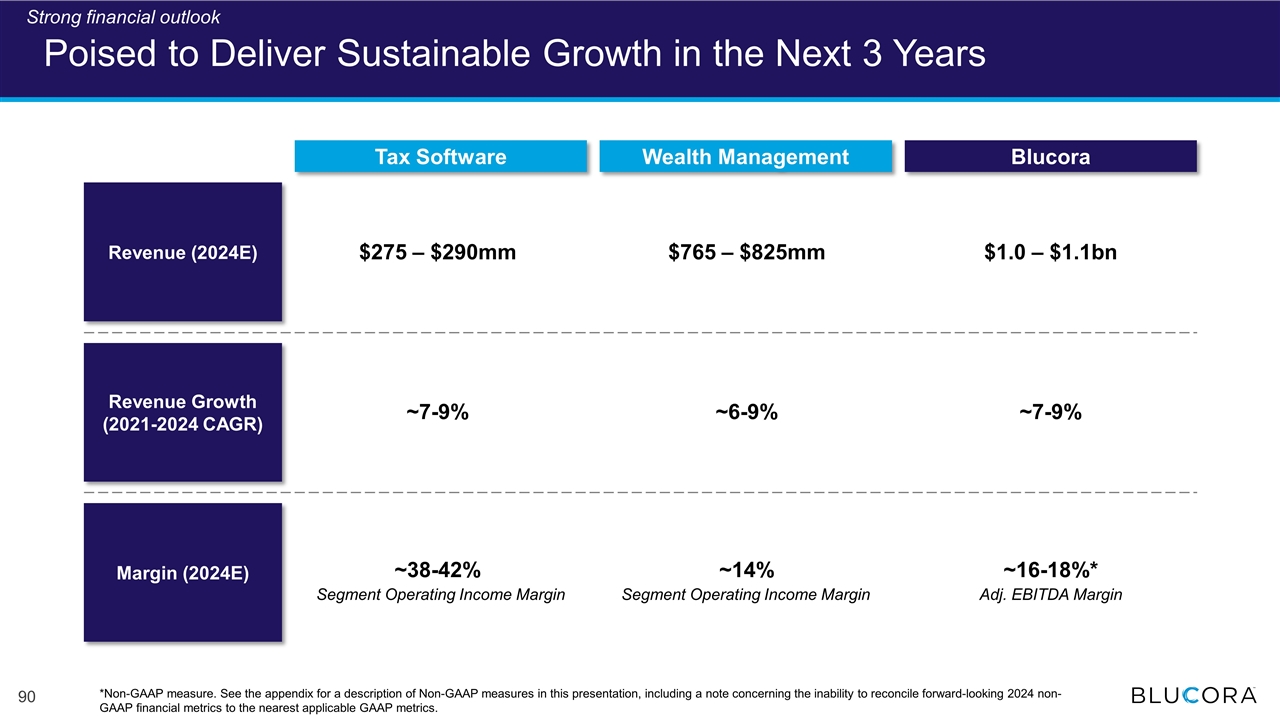
Poised to Deliver Sustainable Growth in the Next 3 Years *Non-GAAP measure. See the appendix for a description of Non-GAAP measures in this presentation, including a note concerning the inability to reconcile forward-looking 2024 non-GAAP financial metrics to the nearest applicable GAAP metrics. Revenue Growth (2021-2024 CAGR) Margin (2024E) Revenue (2024E) $275 – $290mm ~7-9% ~38-42% $765 – $825mm ~6-9% ~14% $1.0 – $1.1bn ~7-9% ~16-18%* Wealth Management Tax Software Blucora Segment Operating Income Margin Segment Operating Income Margin Adj. EBITDA Margin Strong financial outlook
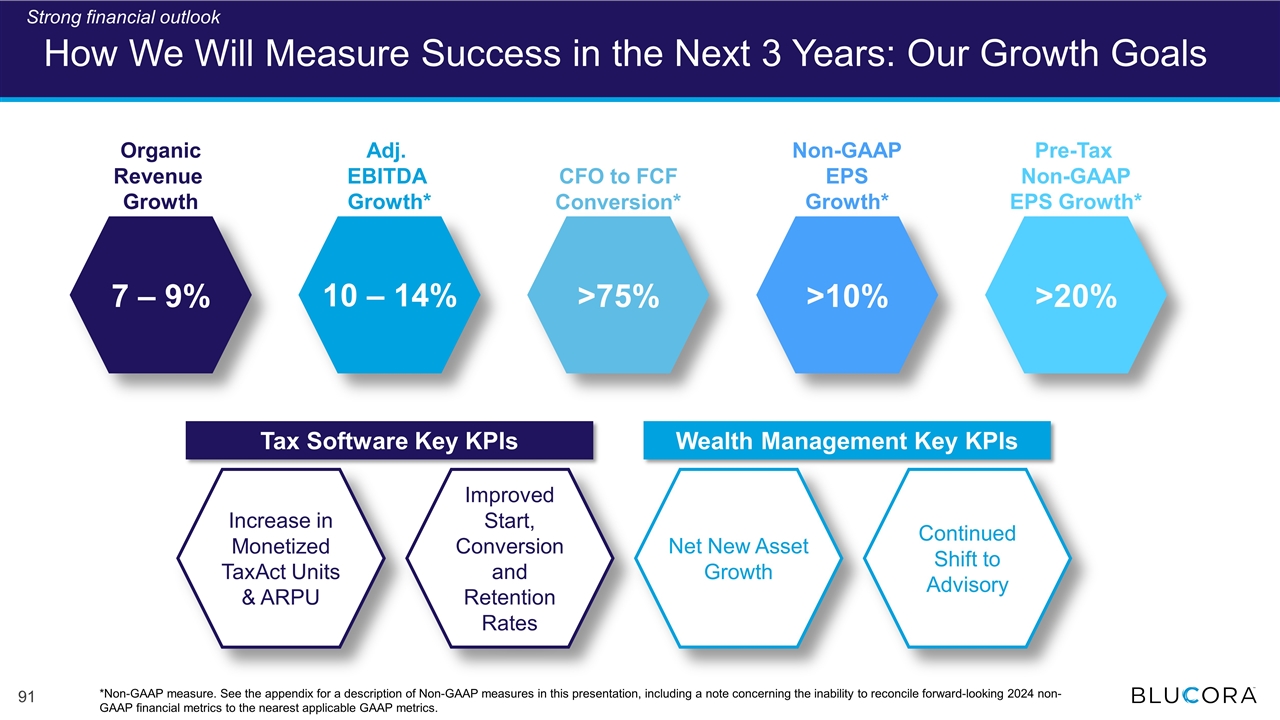
How We Will Measure Success in the Next 3 Years: Our Growth Goals >20% >10% >75% 7 – 9% Organic Revenue Growth Adj. EBITDA Growth* CFO to FCF Conversion* Non-GAAP EPS Growth* Pre-Tax Non-GAAP EPS Growth* 10 – 14% Strong financial outlook Increase in Monetized TaxAct Units & ARPU Continued Shift to Advisory Net New Asset Growth Improved Start, Conversion and Retention Rates Tax Software Key KPIs Wealth Management Key KPIs *Non-GAAP measure. See the appendix for a description of Non-GAAP measures in this presentation, including a note concerning the inability to reconcile forward-looking 2024 non-GAAP financial metrics to the nearest applicable GAAP metrics.
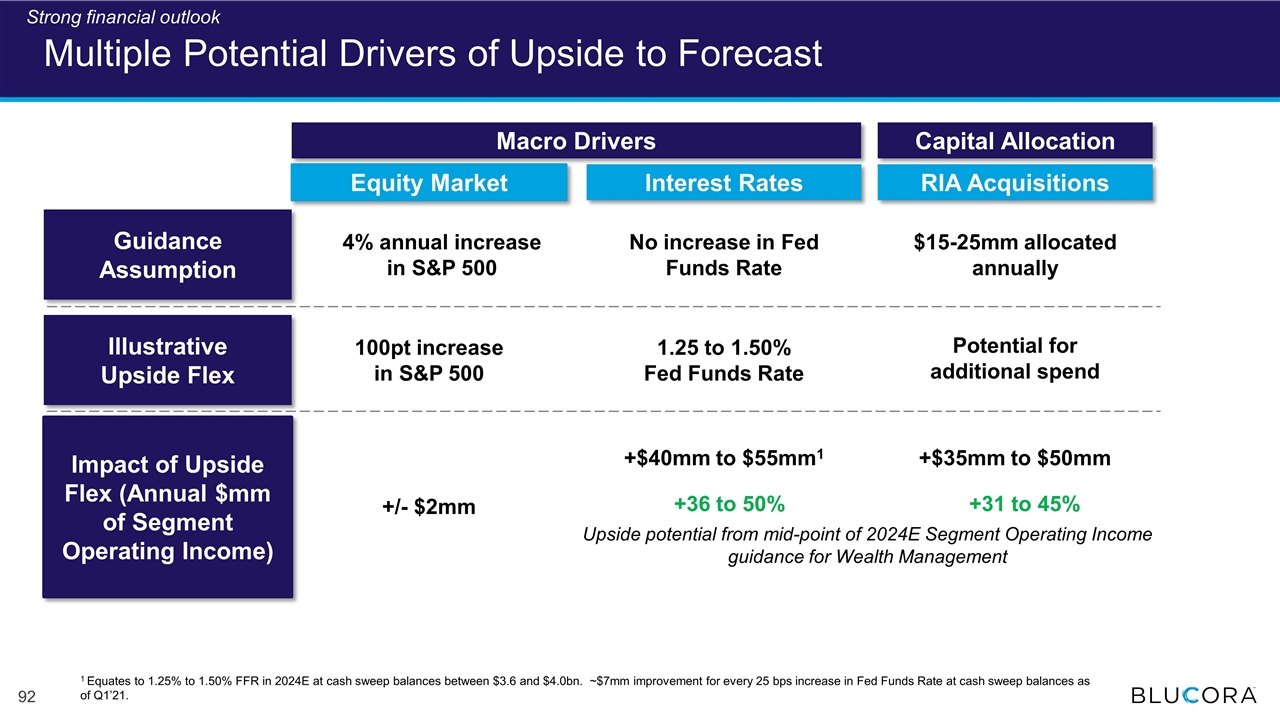
Multiple Potential Drivers of Upside to Forecast Equity Market Interest Rates 4% annual increase in S&P 500 No increase in Fed Funds Rate RIA Acquisitions $15-25mm allocated annually Guidance Assumption Impact of Upside Flex (Annual $mm of Segment Operating Income) +/- $2mm +$40mm to $55mm1 +$35mm to $50mm Illustrative Upside Flex 100pt increase in S&P 500 Macro Drivers Capital Allocation 1.25 to 1.50% Fed Funds Rate Potential for additional spend +36 to 50% +31 to 45% 1 Equates to 1.25% to 1.50% FFR in 2024E at cash sweep balances between $3.6 and $4.0bn. ~$7mm improvement for every 25 bps increase in Fed Funds Rate at cash sweep balances as of Q1’21. Strong financial outlook Upside potential from mid-point of 2024E Segment Operating Income guidance for Wealth Management
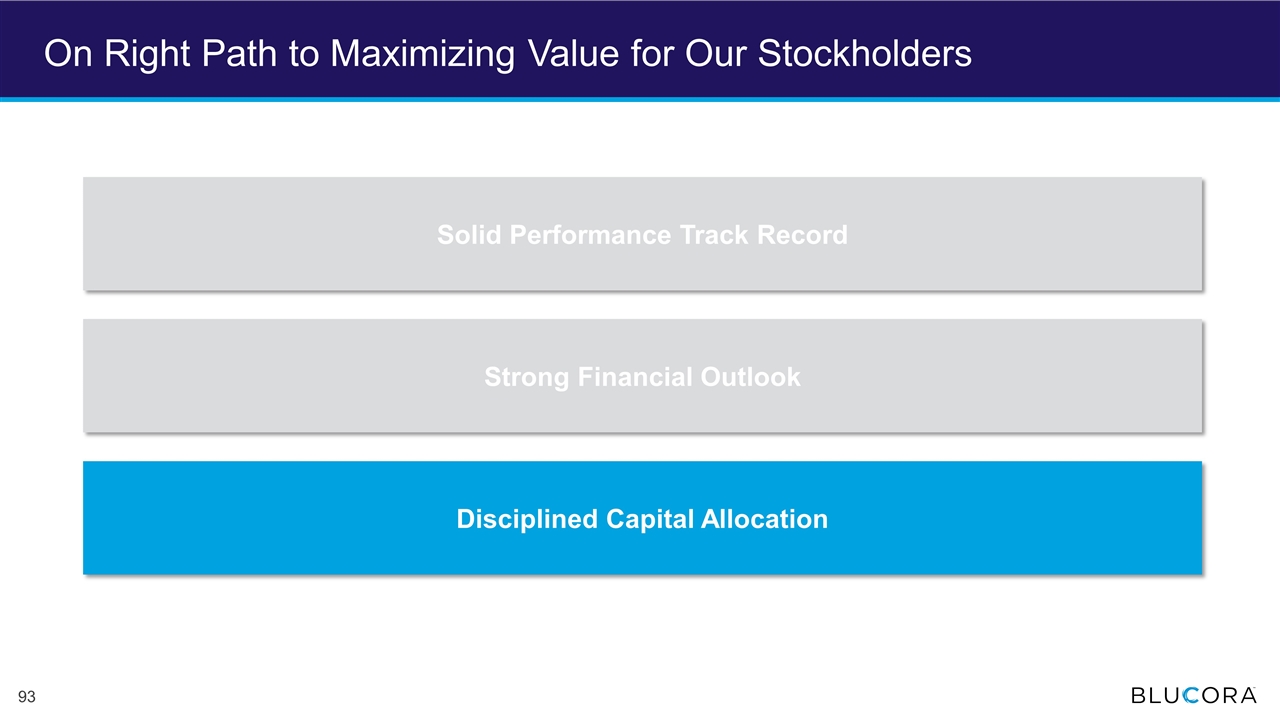
On Right Path to Maximizing Value for Our Stockholders Solid Performance Track Record Strong Financial Outlook Disciplined Capital Allocation
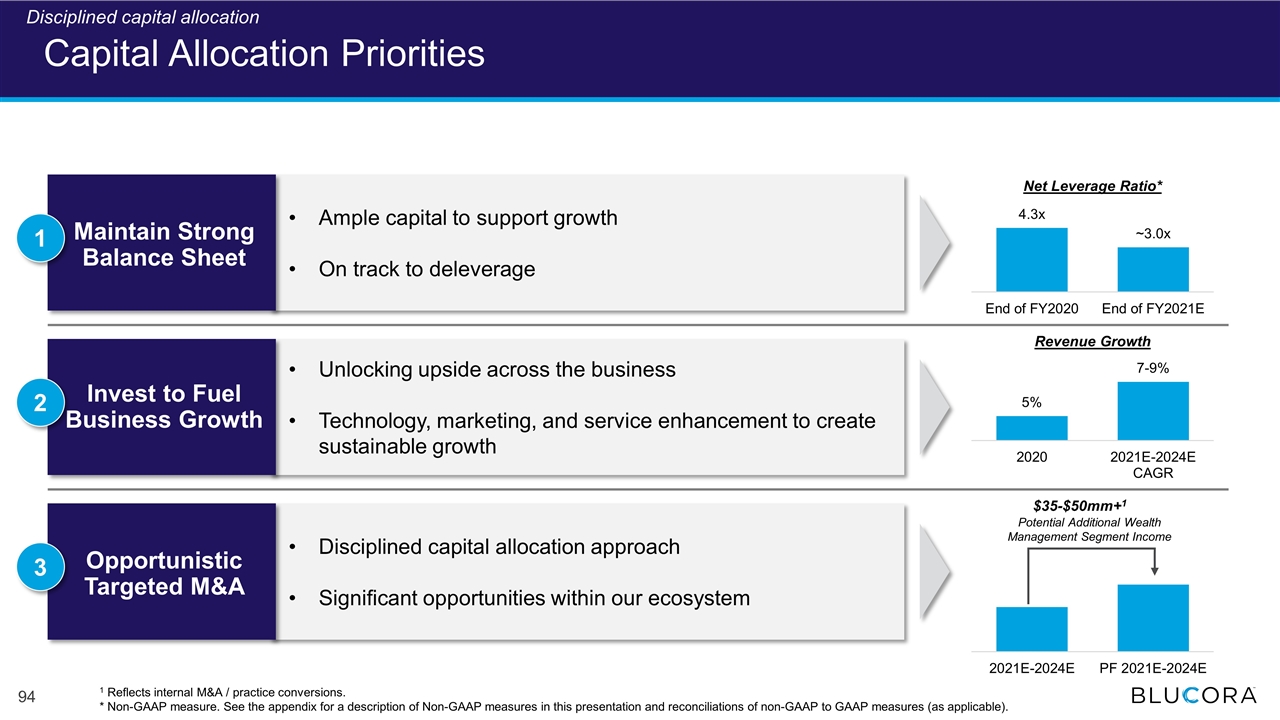
Unlocking upside across the business Technology, marketing, and service enhancement to create sustainable growth Invest to Fuel Business Growth Ample capital to support growth On track to deleverage Disciplined capital allocation approach Significant opportunities within our ecosystem Capital Allocation Priorities Maintain Strong Balance Sheet 1 Opportunistic Targeted M&A 2 3 Net Leverage Ratio* Revenue Growth $35-$50mm+1 Potential Additional Wealth Management Segment Income 1 Reflects internal M&A / practice conversions. * Non-GAAP measure. See the appendix for a description of Non-GAAP measures in this presentation and reconciliations of non-GAAP to GAAP measures (as applicable). Disciplined capital allocation
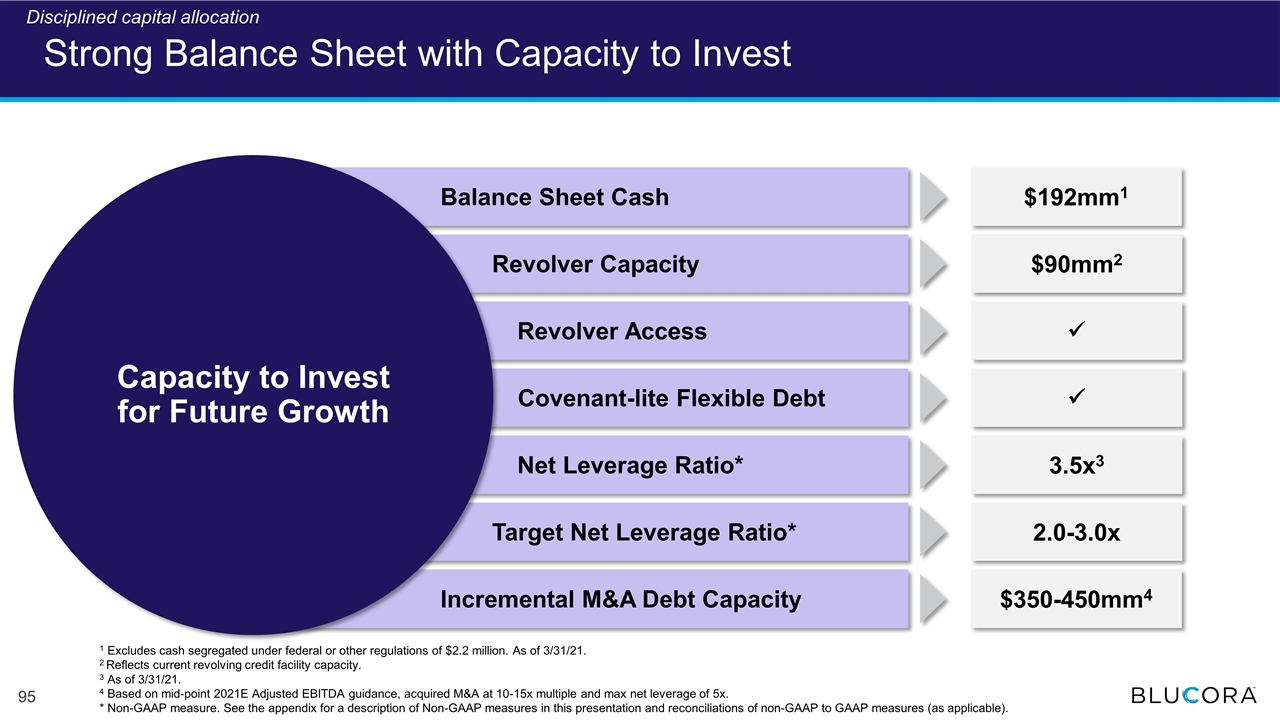
Strong Balance Sheet with Capacity to Invest Capacity to Invest for Future Growth Balance Sheet Cash Revolver Capacity Revolver Access Covenant-lite Flexible Debt Net Leverage Ratio* Target Net Leverage Ratio* Incremental M&A Debt Capacity $350-450mm4 2.0-3.0x $192mm1 $90mm2 ü ü 3.5x3 1 Excludes cash segregated under federal or other regulations of $2.2 million. As of 3/31/21. 2 Reflects current revolving credit facility capacity. 3 As of 3/31/21. 4 Based on mid-point 2021E Adjusted EBITDA guidance, acquired M&A at 10-15x multiple and max net leverage of 5x. * Non-GAAP measure. See the appendix for a description of Non-GAAP measures in this presentation and reconciliations of non-GAAP to GAAP measures (as applicable). Disciplined capital allocation
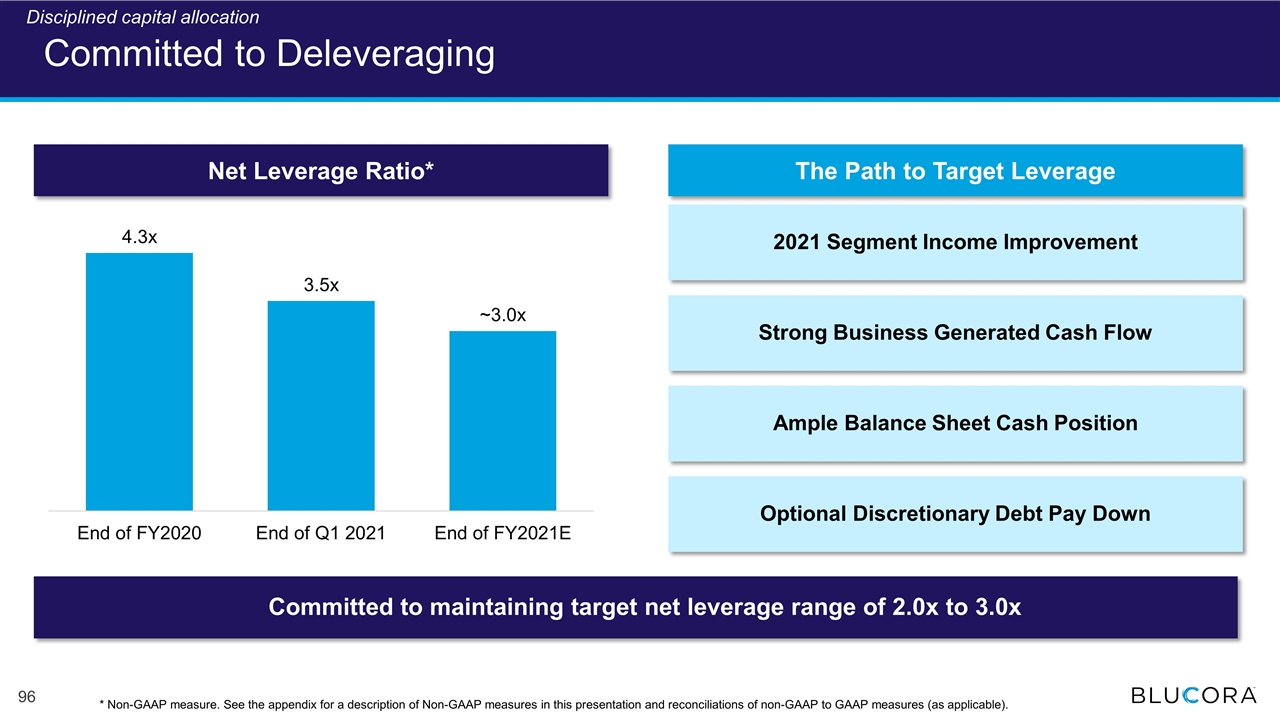
Net Leverage Ratio* The Path to Target Leverage Committed to Deleveraging Committed to maintaining target net leverage range of 2.0x to 3.0x 2021 Segment Income Improvement Strong Business Generated Cash Flow Ample Balance Sheet Cash Position Optional Discretionary Debt Pay Down * Non-GAAP measure. See the appendix for a description of Non-GAAP measures in this presentation and reconciliations of non-GAAP to GAAP measures (as applicable). Disciplined capital allocation
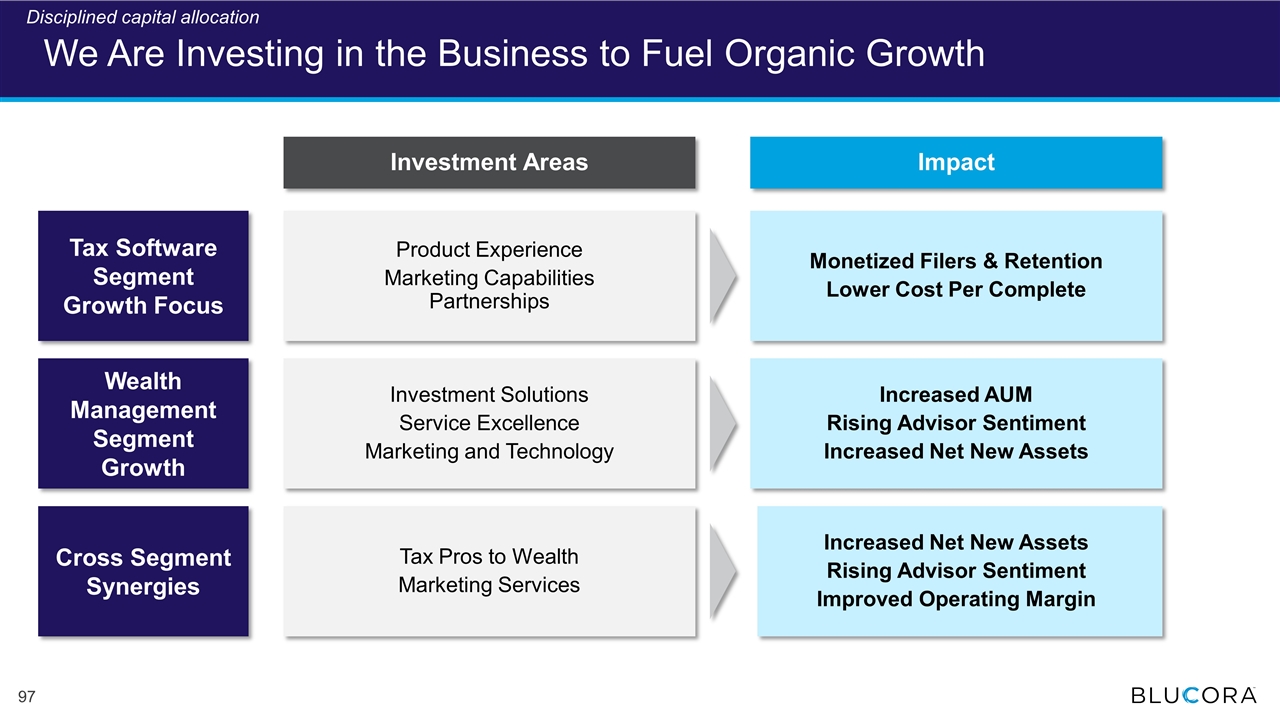
We Are Investing in the Business to Fuel Organic Growth Investment Areas Impact Tax Software Segment Growth Focus Product Experience Marketing Capabilities Partnerships Monetized Filers & Retention Lower Cost Per Complete Wealth Management Segment Growth Investment Solutions Service Excellence Marketing and Technology Increased AUM Rising Advisor Sentiment Increased Net New Assets Cross Segment Synergies Tax Pros to Wealth Marketing Services Increased Net New Assets Rising Advisor Sentiment Improved Operating Margin Disciplined capital allocation
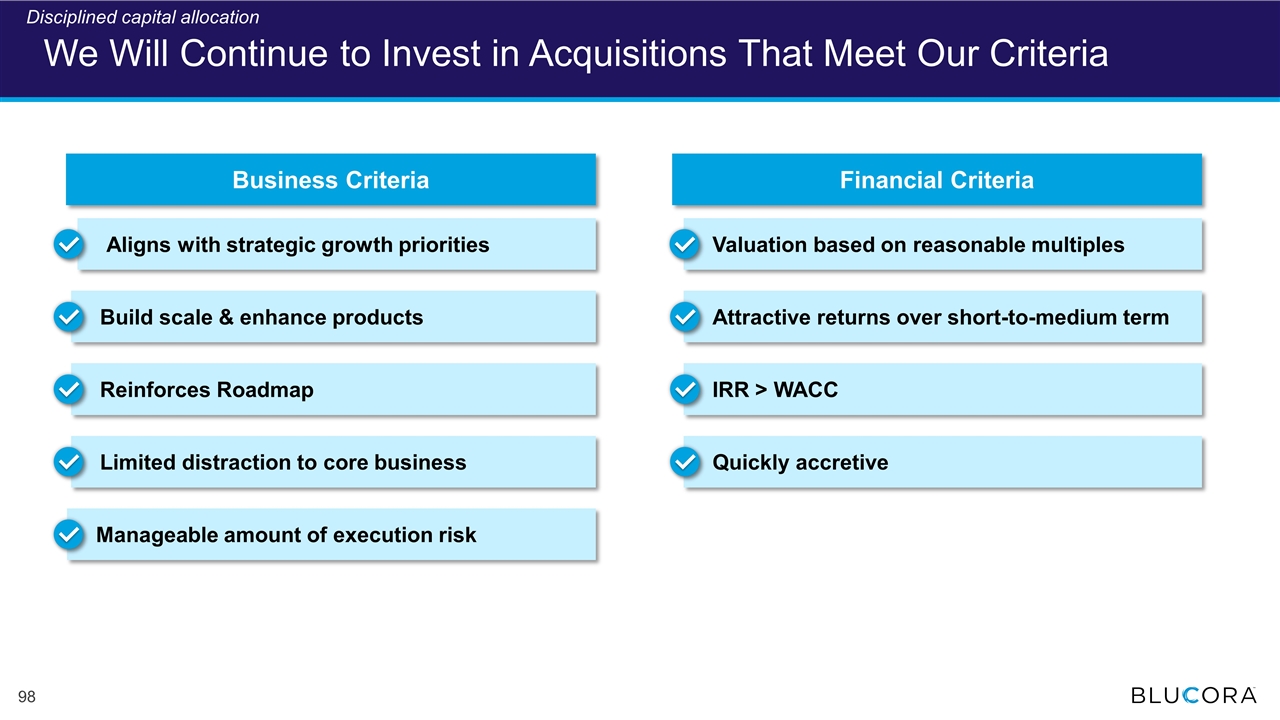
Attractive returns over short-to-medium term Valuation based on reasonable multiples IRR > WACC Quickly accretive Aligns with strategic growth priorities Build scale & enhance products Reinforces Roadmap Limited distraction to core business Manageable amount of execution risk We Will Continue to Invest in Acquisitions That Meet Our Criteria Business Criteria Financial Criteria Disciplined capital allocation
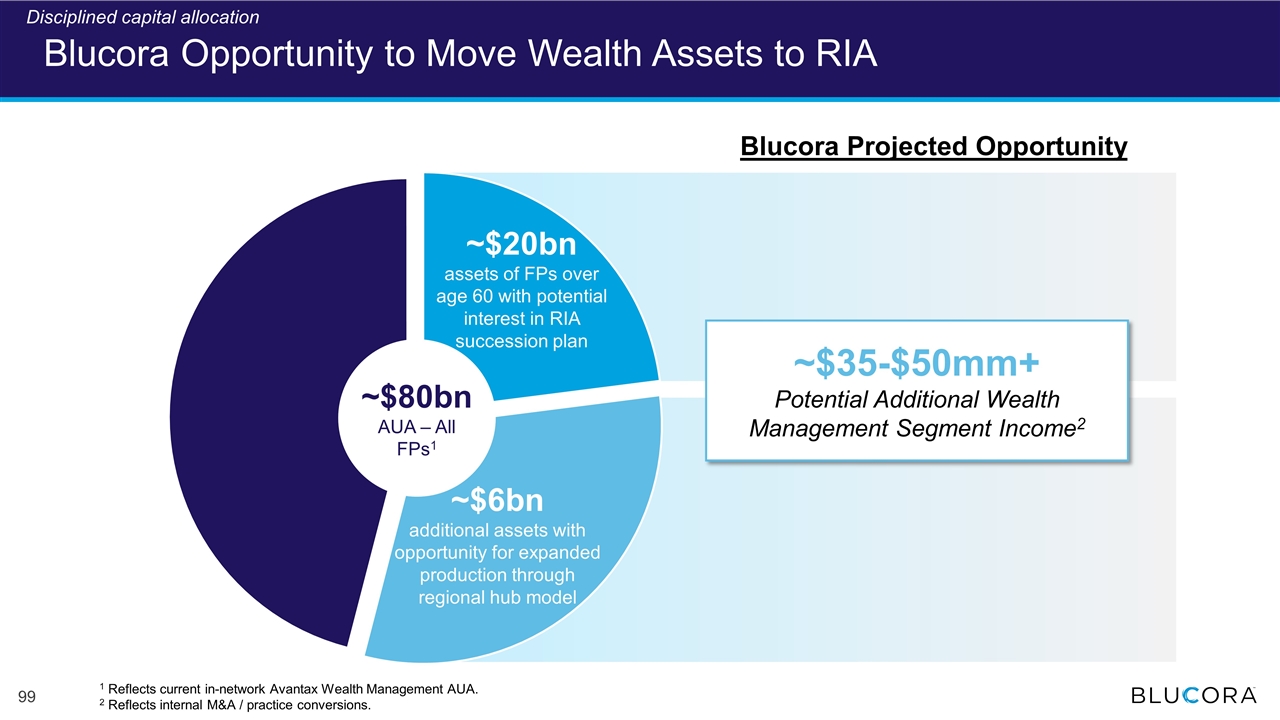
Blucora Opportunity to Move Wealth Assets to RIA ~$6bn additional assets with opportunity for expanded production through regional hub model ~$20bn assets of FPs over age 60 with potential interest in RIA succession plan ~$80bn AUA – All FPs1 ~$35-$50mm+ Potential Additional Wealth Management Segment Income2 Blucora Projected Opportunity 1 Reflects current in-network Avantax Wealth Management AUA. 2 Reflects internal M&A / practice conversions. Disciplined capital allocation
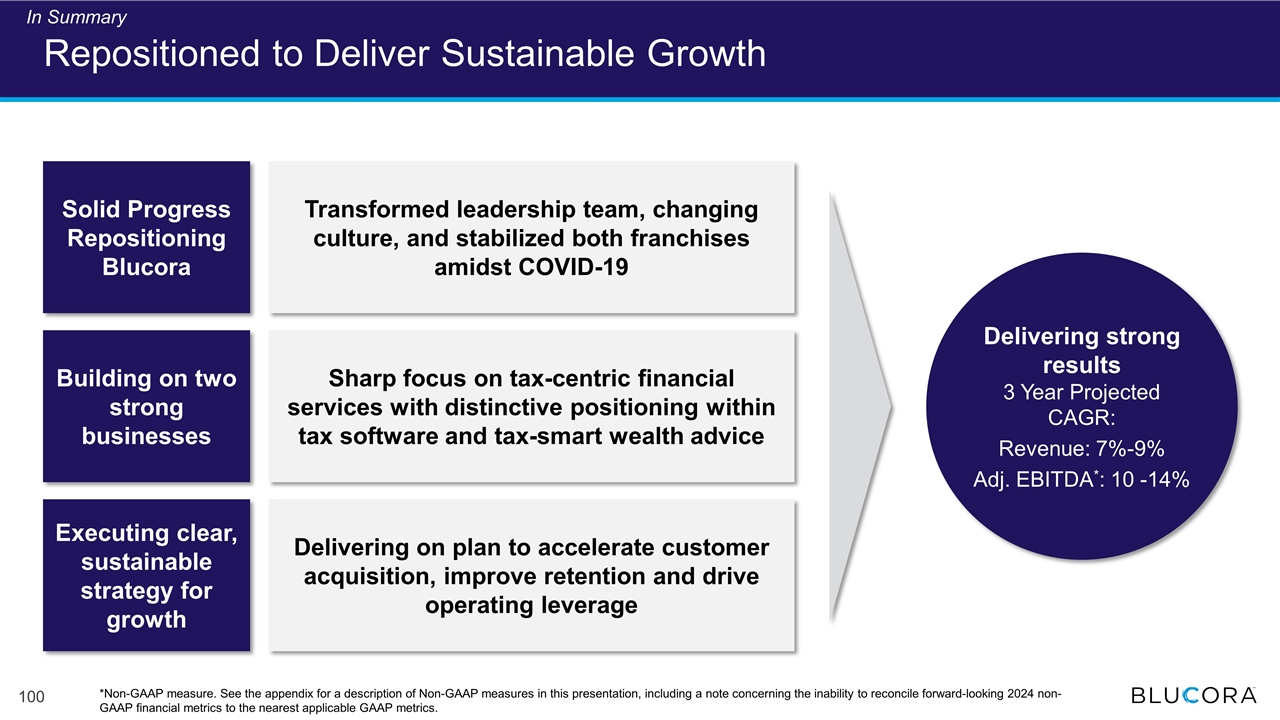
Repositioned to Deliver Sustainable Growth Solid Progress Repositioning Blucora Building on two strong businesses Executing clear, sustainable strategy for growth Transformed leadership team, changing culture, and stabilized both franchises amidst COVID-19 Sharp focus on tax-centric financial services with distinctive positioning within tax software and tax-smart wealth advice Delivering on plan to accelerate customer acquisition, improve retention and drive operating leverage Delivering strong results 3 Year Projected CAGR: Revenue: 7%-9% Adj. EBITDA*: 10 -14% In Summary *Non-GAAP measure. See the appendix for a description of Non-GAAP measures in this presentation, including a note concerning the inability to reconcile forward-looking 2024 non-GAAP financial metrics to the nearest applicable GAAP metrics.

Appendix
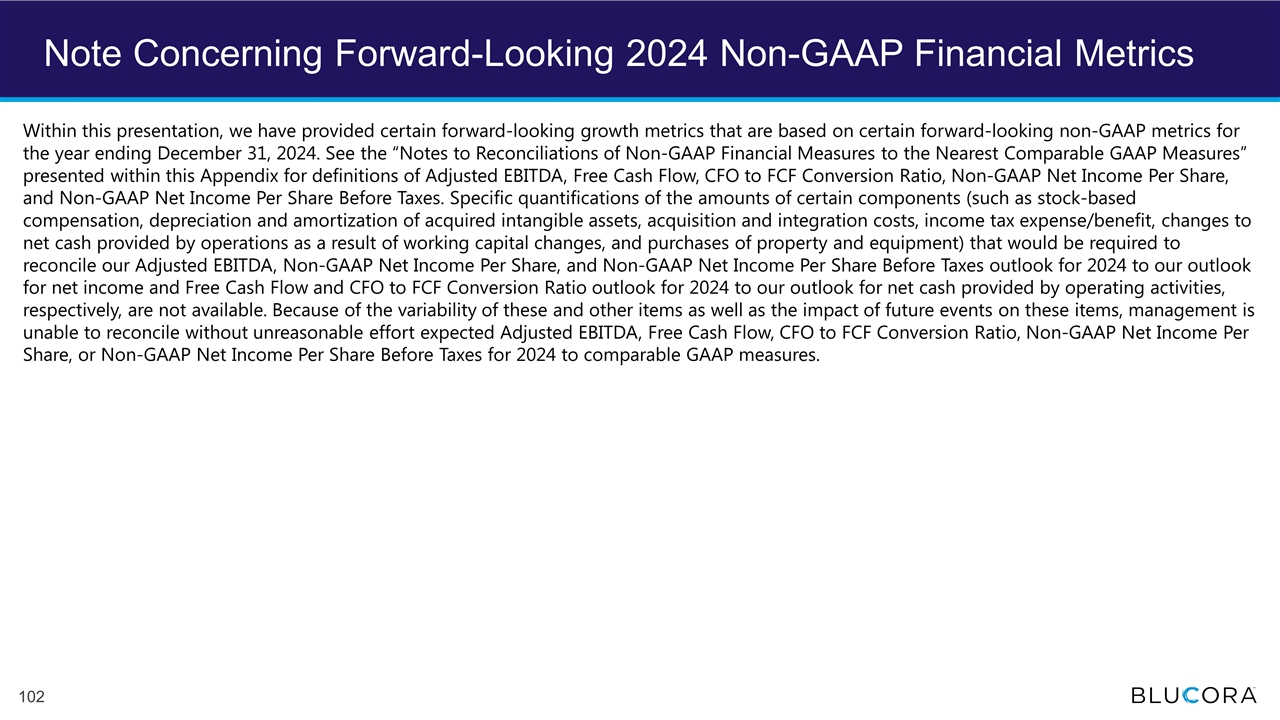
Note Concerning Forward-Looking 2024 Non-GAAP Financial Metrics Within this presentation, we have provided certain forward-looking growth metrics that are based on certain forward-looking non-GAAP metrics for the year ending December 31, 2024. See the “Notes to Reconciliations of Non-GAAP Financial Measures to the Nearest Comparable GAAP Measures” presented within this Appendix for definitions of Adjusted EBITDA, Free Cash Flow, CFO to FCF Conversion Ratio, Non-GAAP Net Income Per Share, and Non-GAAP Net Income Per Share Before Taxes. Specific quantifications of the amounts of certain components (such as stock-based compensation, depreciation and amortization of acquired intangible assets, acquisition and integration costs, income tax expense/benefit, changes to net cash provided by operations as a result of working capital changes, and purchases of property and equipment) that would be required to reconcile our Adjusted EBITDA, Non-GAAP Net Income Per Share, and Non-GAAP Net Income Per Share Before Taxes outlook for 2024 to our outlook for net income and Free Cash Flow and CFO to FCF Conversion Ratio outlook for 2024 to our outlook for net cash provided by operating activities, respectively, are not available. Because of the variability of these and other items as well as the impact of future events on these items, management is unable to reconcile without unreasonable effort expected Adjusted EBITDA, Free Cash Flow, CFO to FCF Conversion Ratio, Non-GAAP Net Income Per Share, or Non-GAAP Net Income Per Share Before Taxes for 2024 to comparable GAAP measures.
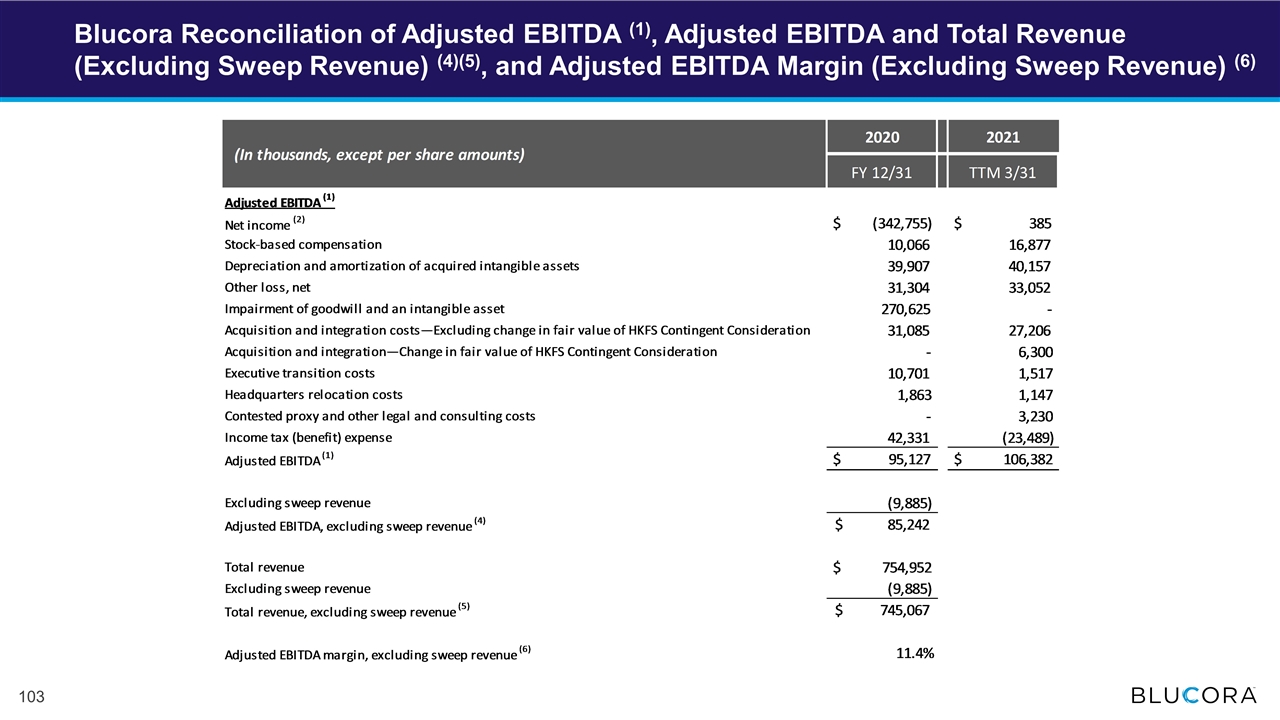
Blucora Reconciliation of Adjusted EBITDA (1), Adjusted EBITDA and Total Revenue (Excluding Sweep Revenue) (4)(5), and Adjusted EBITDA Margin (Excluding Sweep Revenue) (6)
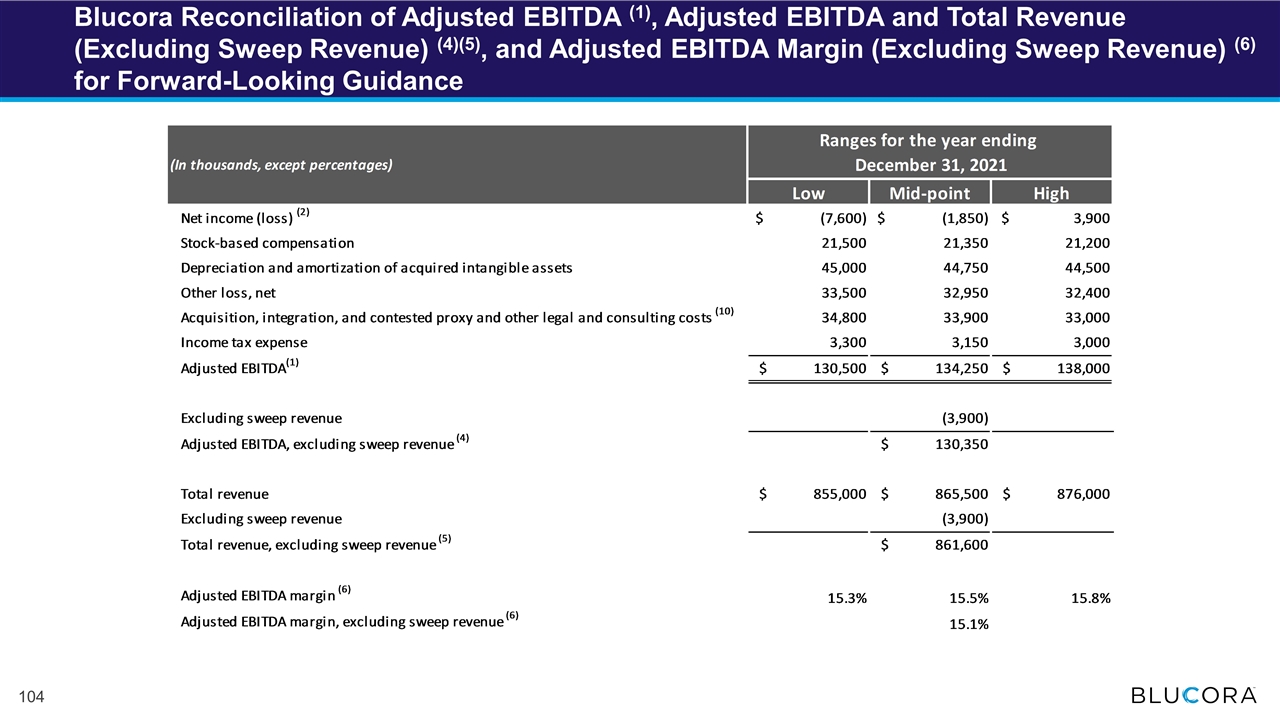
Blucora Reconciliation of Adjusted EBITDA (1), Adjusted EBITDA and Total Revenue (Excluding Sweep Revenue) (4)(5), and Adjusted EBITDA Margin (Excluding Sweep Revenue) (6) for Forward-Looking Guidance
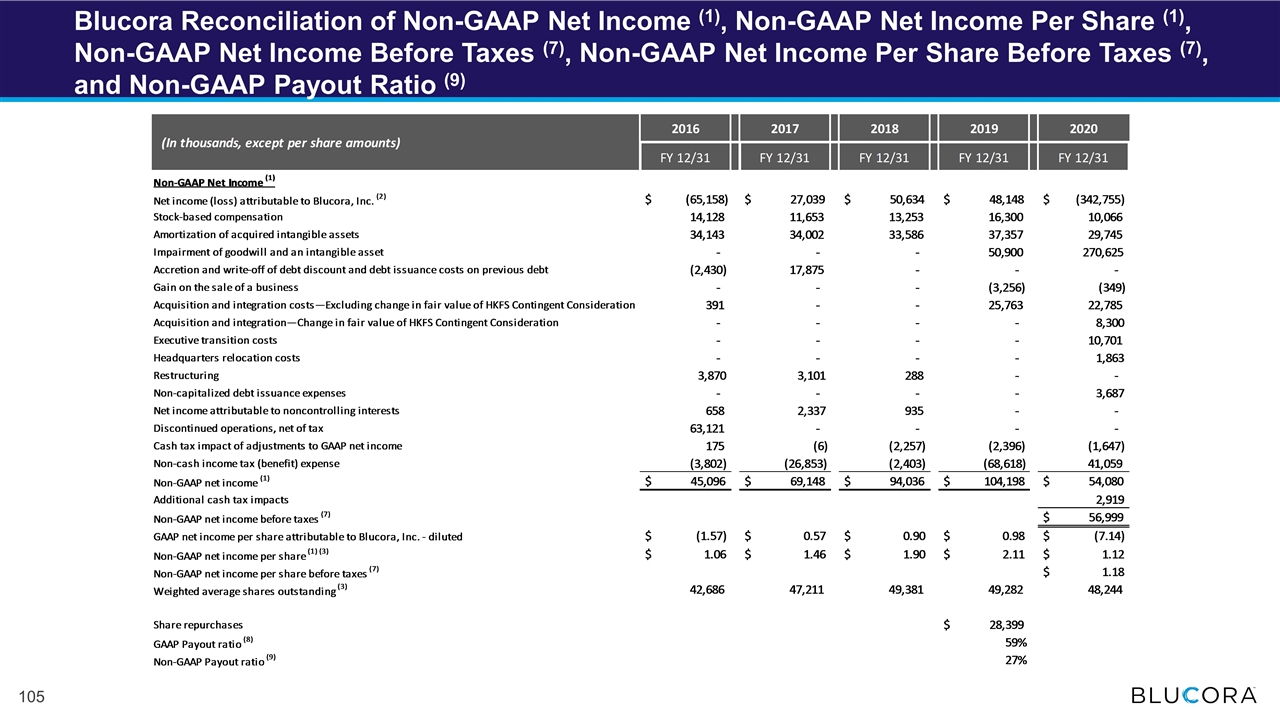
Blucora Reconciliation of Non-GAAP Net Income (1), Non-GAAP Net Income Per Share (1), Non-GAAP Net Income Before Taxes (7), Non-GAAP Net Income Per Share Before Taxes (7), and Non-GAAP Payout Ratio (9)
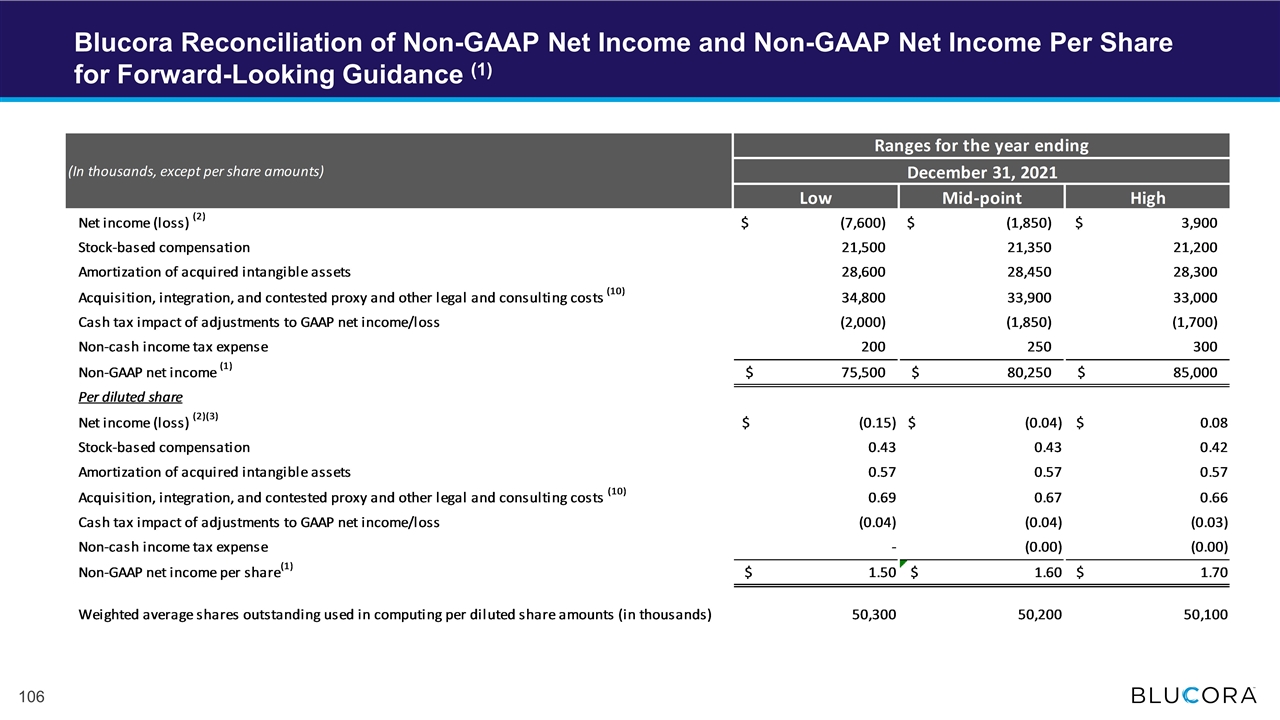
Blucora Reconciliation of Non-GAAP Net Income and Non-GAAP Net Income Per Share for Forward-Looking Guidance (1)
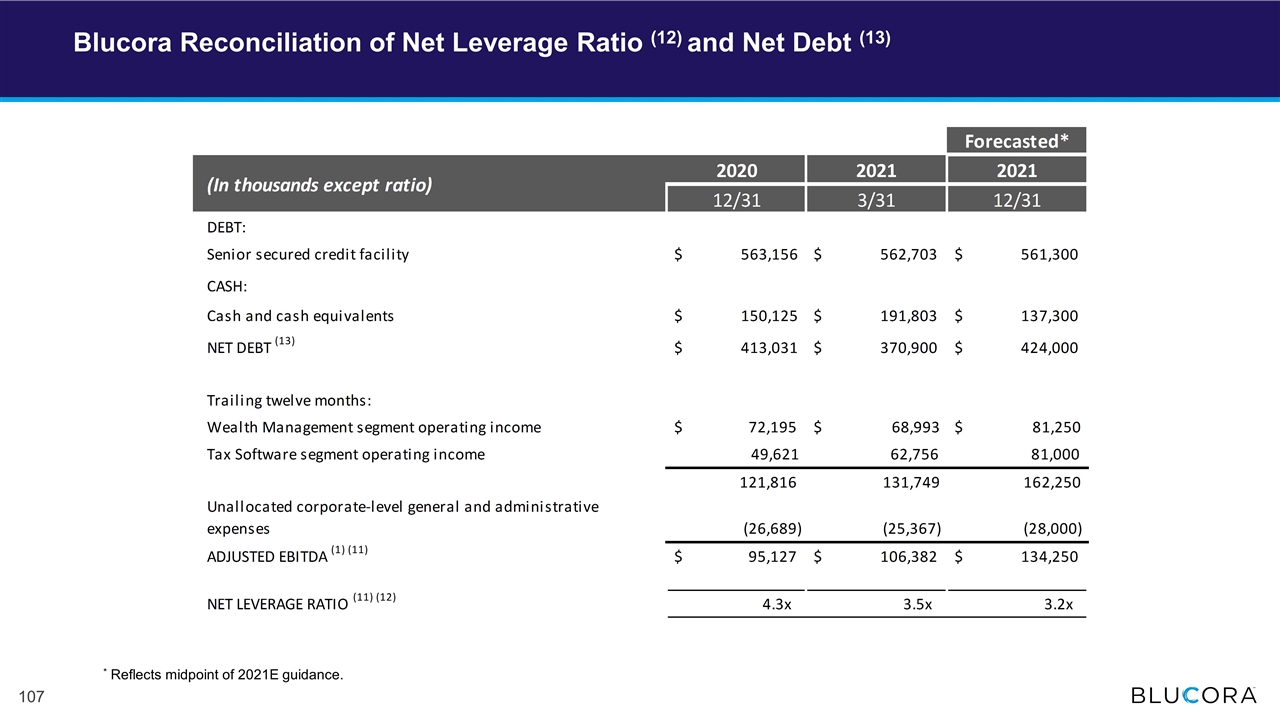
Blucora Reconciliation of Net Leverage Ratio (12) and Net Debt (13) * Reflects midpoint of 2021E guidance.
Blucora Reconciliation of Operating Free Cash Flow (15) and CFO to FCF Conversion Ratio (16)
Blucora Reconciliation of Tax Software Revenue, Excluding SimpleTax (18)
Blucora Reconciliation of Operating Income, Excluding Corporate-Level Activity (17)
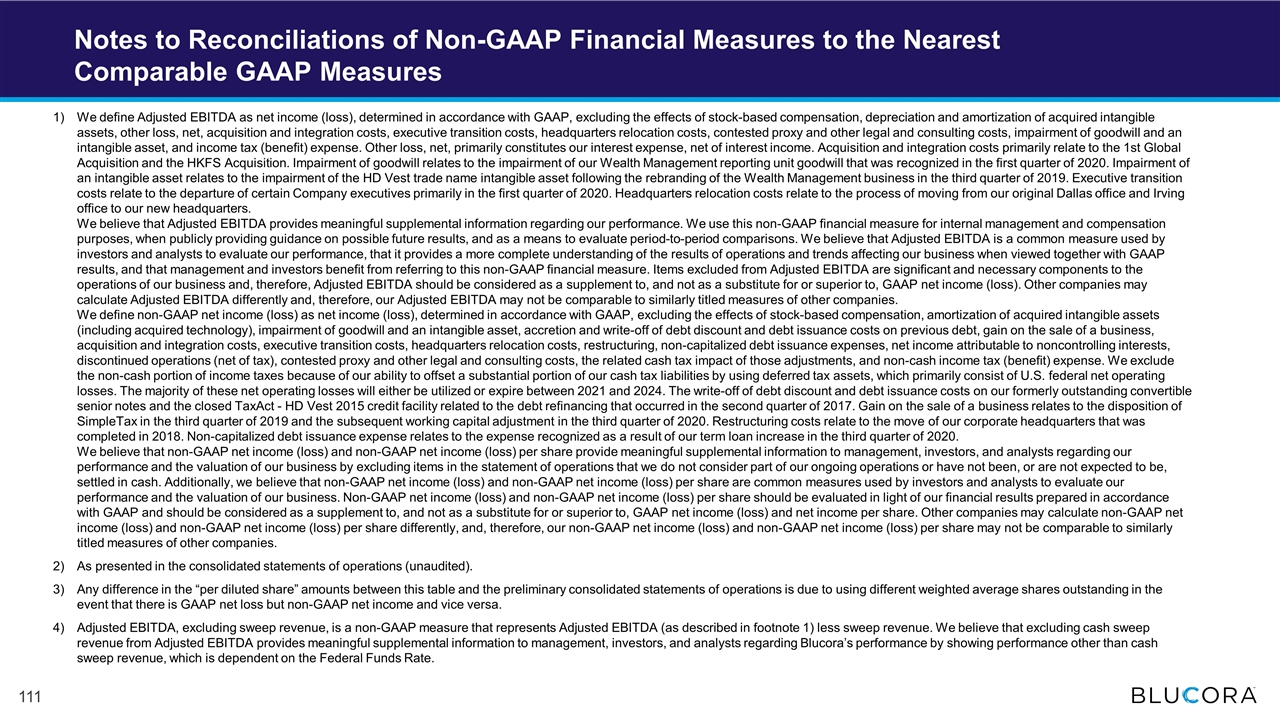
We define Adjusted EBITDA as net income (loss), determined in accordance with GAAP, excluding the effects of stock-based compensation, depreciation and amortization of acquired intangible assets, other loss, net, acquisition and integration costs, executive transition costs, headquarters relocation costs, contested proxy and other legal and consulting costs, impairment of goodwill and an intangible asset, and income tax (benefit) expense. Other loss, net, primarily constitutes our interest expense, net of interest income. Acquisition and integration costs primarily relate to the 1st Global Acquisition and the HKFS Acquisition. Impairment of goodwill relates to the impairment of our Wealth Management reporting unit goodwill that was recognized in the first quarter of 2020. Impairment of an intangible asset relates to the impairment of the HD Vest trade name intangible asset following the rebranding of the Wealth Management business in the third quarter of 2019. Executive transition costs relate to the departure of certain Company executives primarily in the first quarter of 2020. Headquarters relocation costs relate to the process of moving from our original Dallas office and Irving office to our new headquarters. We believe that Adjusted EBITDA provides meaningful supplemental information regarding our performance. We use this non-GAAP financial measure for internal management and compensation purposes, when publicly providing guidance on possible future results, and as a means to evaluate period-to-period comparisons. We believe that Adjusted EBITDA is a common measure used by investors and analysts to evaluate our performance, that it provides a more complete understanding of the results of operations and trends affecting our business when viewed together with GAAP results, and that management and investors benefit from referring to this non-GAAP financial measure. Items excluded from Adjusted EBITDA are significant and necessary components to the operations of our business and, therefore, Adjusted EBITDA should be considered as a supplement to, and not as a substitute for or superior to, GAAP net income (loss). Other companies may calculate Adjusted EBITDA differently and, therefore, our Adjusted EBITDA may not be comparable to similarly titled measures of other companies. We define non-GAAP net income (loss) as net income (loss), determined in accordance with GAAP, excluding the effects of stock-based compensation, amortization of acquired intangible assets (including acquired technology), impairment of goodwill and an intangible asset, accretion and write-off of debt discount and debt issuance costs on previous debt, gain on the sale of a business, acquisition and integration costs, executive transition costs, headquarters relocation costs, restructuring, non-capitalized debt issuance expenses, net income attributable to noncontrolling interests, discontinued operations (net of tax), contested proxy and other legal and consulting costs, the related cash tax impact of those adjustments, and non-cash income tax (benefit) expense. We exclude the non-cash portion of income taxes because of our ability to offset a substantial portion of our cash tax liabilities by using deferred tax assets, which primarily consist of U.S. federal net operating losses. The majority of these net operating losses will either be utilized or expire between 2021 and 2024. The write-off of debt discount and debt issuance costs on our formerly outstanding convertible senior notes and the closed TaxAct - HD Vest 2015 credit facility related to the debt refinancing that occurred in the second quarter of 2017. Gain on the sale of a business relates to the disposition of SimpleTax in the third quarter of 2019 and the subsequent working capital adjustment in the third quarter of 2020. Restructuring costs relate to the move of our corporate headquarters that was completed in 2018. Non-capitalized debt issuance expense relates to the expense recognized as a result of our term loan increase in the third quarter of 2020. We believe that non-GAAP net income (loss) and non-GAAP net income (loss) per share provide meaningful supplemental information to management, investors, and analysts regarding our performance and the valuation of our business by excluding items in the statement of operations that we do not consider part of our ongoing operations or have not been, or are not expected to be, settled in cash. Additionally, we believe that non-GAAP net income (loss) and non-GAAP net income (loss) per share are common measures used by investors and analysts to evaluate our performance and the valuation of our business. Non-GAAP net income (loss) and non-GAAP net income (loss) per share should be evaluated in light of our financial results prepared in accordance with GAAP and should be considered as a supplement to, and not as a substitute for or superior to, GAAP net income (loss) and net income per share. Other companies may calculate non-GAAP net income (loss) and non-GAAP net income (loss) per share differently, and, therefore, our non-GAAP net income (loss) and non-GAAP net income (loss) per share may not be comparable to similarly titled measures of other companies. As presented in the consolidated statements of operations (unaudited). Any difference in the “per diluted share” amounts between this table and the preliminary consolidated statements of operations is due to using different weighted average shares outstanding in the event that there is GAAP net loss but non-GAAP net income and vice versa. Adjusted EBITDA, excluding sweep revenue, is a non-GAAP measure that represents Adjusted EBITDA (as described in footnote 1) less sweep revenue. We believe that excluding cash sweep revenue from Adjusted EBITDA provides meaningful supplemental information to management, investors, and analysts regarding Blucora’s performance by showing performance other than cash sweep revenue, which is dependent on the Federal Funds Rate. Notes to Reconciliations of Non-GAAP Financial Measures to the Nearest Comparable GAAP Measures
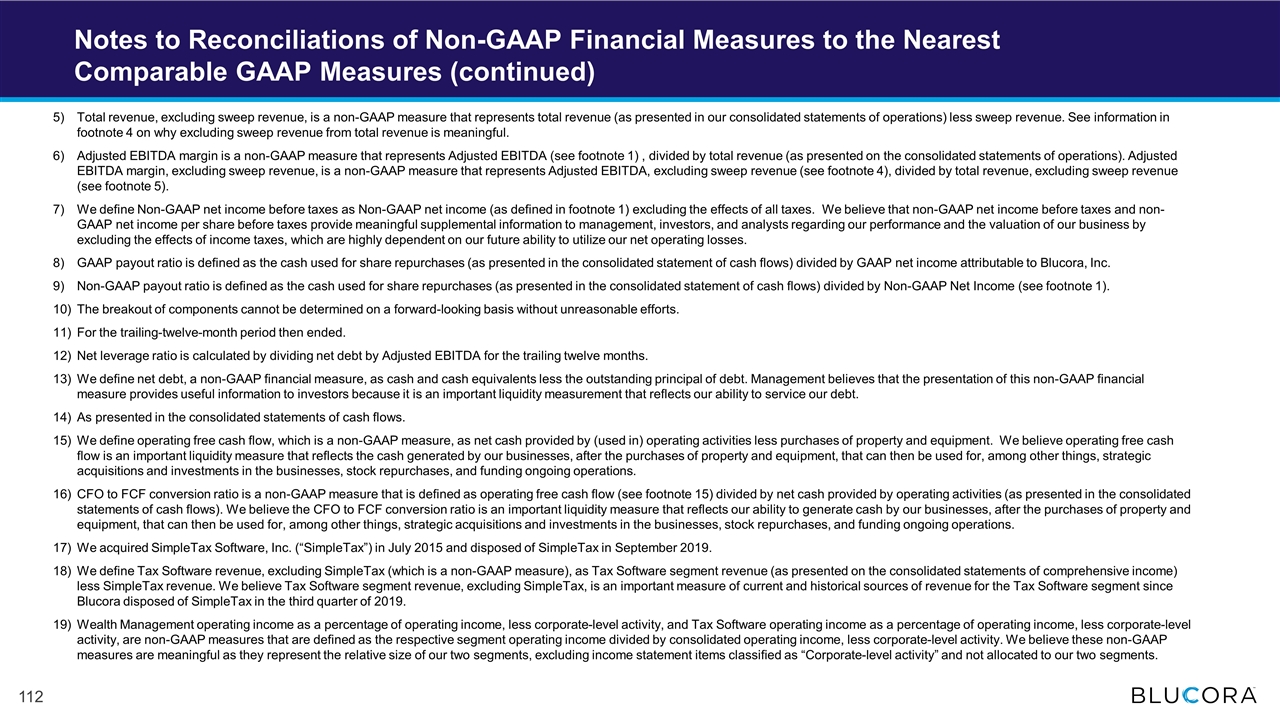
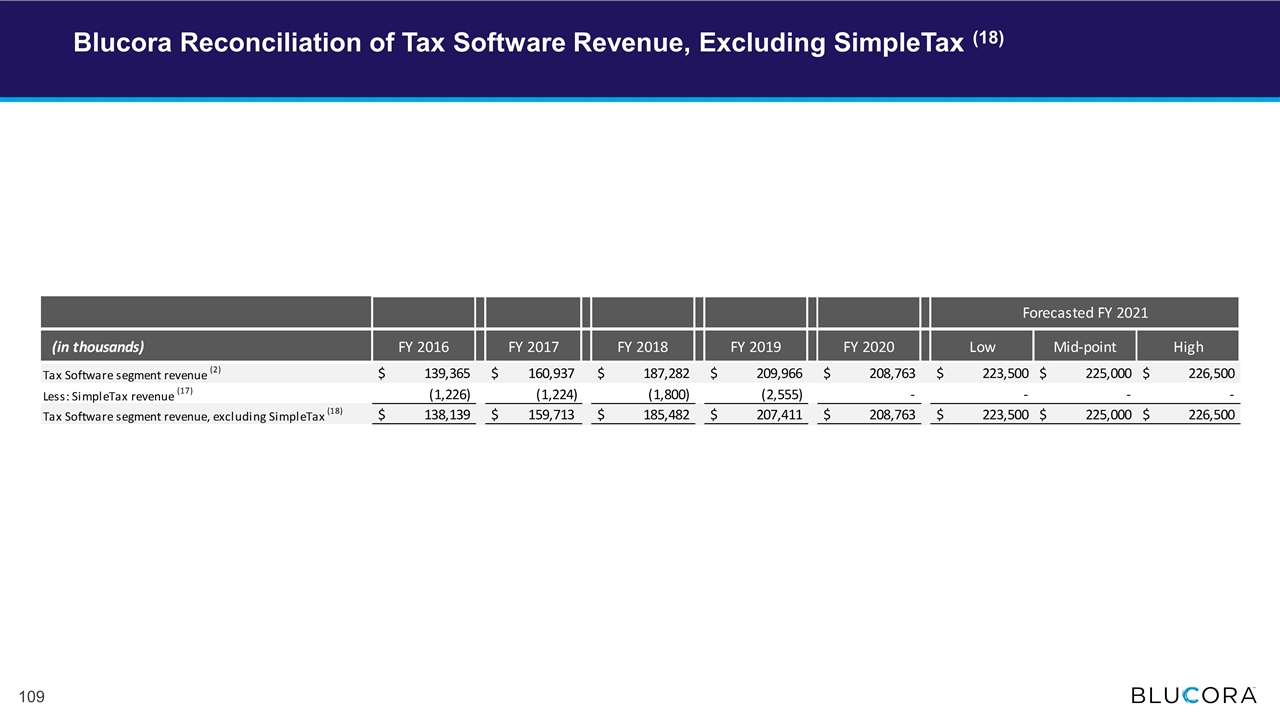
Total revenue, excluding sweep revenue, is a non-GAAP measure that represents total revenue (as presented in our consolidated statements of operations) less sweep revenue. See information in footnote 4 on why excluding sweep revenue from total revenue is meaningful. Adjusted EBITDA margin is a non-GAAP measure that represents Adjusted EBITDA (see footnote 1) , divided by total revenue (as presented on the consolidated statements of operations). Adjusted EBITDA margin, excluding sweep revenue, is a non-GAAP measure that represents Adjusted EBITDA, excluding sweep revenue (see footnote 4), divided by total revenue, excluding sweep revenue (see footnote 5). We define Non-GAAP net income before taxes as Non-GAAP net income (as defined in footnote 1) excluding the effects of all taxes. We believe that non-GAAP net income before taxes and non-GAAP net income per share before taxes provide meaningful supplemental information to management, investors, and analysts regarding our performance and the valuation of our business by excluding the effects of income taxes, which are highly dependent on our future ability to utilize our net operating losses. GAAP payout ratio is defined as the cash used for share repurchases (as presented in the consolidated statement of cash flows) divided by GAAP net income attributable to Blucora, Inc. Non-GAAP payout ratio is defined as the cash used for share repurchases (as presented in the consolidated statement of cash flows) divided by Non-GAAP Net Income (see footnote 1). The breakout of components cannot be determined on a forward-looking basis without unreasonable efforts. For the trailing-twelve-month period then ended. Net leverage ratio is calculated by dividing net debt by Adjusted EBITDA for the trailing twelve months. We define net debt, a non-GAAP financial measure, as cash and cash equivalents less the outstanding principal of debt. Management believes that the presentation of this non-GAAP financial measure provides useful information to investors because it is an important liquidity measurement that reflects our ability to service our debt. As presented in the consolidated statements of cash flows. We define operating free cash flow, which is a non-GAAP measure, as net cash provided by (used in) operating activities less purchases of property and equipment. We believe operating free cash flow is an important liquidity measure that reflects the cash generated by our businesses, after the purchases of property and equipment, that can then be used for, among other things, strategic acquisitions and investments in the businesses, stock repurchases, and funding ongoing operations. CFO to FCF conversion ratio is a non-GAAP measure that is defined as operating free cash flow (see footnote 15) divided by net cash provided by operating activities (as presented in the consolidated statements of cash flows). We believe the CFO to FCF conversion ratio is an important liquidity measure that reflects our ability to generate cash by our businesses, after the purchases of property and equipment, that can then be used for, among other things, strategic acquisitions and investments in the businesses, stock repurchases, and funding ongoing operations. We acquired SimpleTax Software, Inc. (“SimpleTax”) in July 2015 and disposed of SimpleTax in September 2019. We define Tax Software revenue, excluding SimpleTax (which is a non-GAAP measure), as Tax Software segment revenue (as presented on the consolidated statements of comprehensive income) less SimpleTax revenue. We believe Tax Software segment revenue, excluding SimpleTax, is an important measure of current and historical sources of revenue for the Tax Software segment since Blucora disposed of SimpleTax in the third quarter of 2019. Wealth Management operating income as a percentage of operating income, less corporate-level activity, and Tax Software operating income as a percentage of operating income, less corporate-level activity, are non-GAAP measures that are defined as the respective segment operating income divided by consolidated operating income, less corporate-level activity. We believe these non-GAAP measures are meaningful as they represent the relative size of our two segments, excluding income statement items classified as “Corporate-level activity” and not allocated to our two segments. Notes to Reconciliations of Non-GAAP Financial Measures to the Nearest Comparable GAAP Measures (continued)


