
Exhibit 99.1 Investor Presentation – NASDAQ: BCOR March 2022
Forward-Looking Statements and Non-GAAP Financial Measures Forward-Looking Statements This presentation contains forward-looking statements within the meaning of Section 27A of the Securities Act of 1933, as amended and Section 21E of the Securities Exchange Act of 1934, as amended, including without limitation, statements regarding the outlook of Blucora, Inc. (the “Company”) and its segments, expectations regarding net flows for its wealth business, and expectations with respect to the current tax season. Forward-looking statements provide current expectations of future events based on certain assumptions and include any statement that does not directly relate to any historical or current fact. Forward-looking statements can also be identified by words such as “believes,” “estimates,” “should,” “could,” “would,” “plans,” “expects,” “intends,” “anticipates,” “may,” “forecasts,” “future,” “will,” “projects,” “predicts,” “potential,” “continues,” “target,” “outlook”, “guidance,” and similar expressions and variations. Actual results may differ significantly from management’s expectations due to various risks and uncertainties including, but not limited to: our ability to effectively compete within our industries; our ability to attract and retain financial professionals, qualified employees, clients, and customers, as well as our ability to provide strong customer/client service; the impact of the COVID-19 pandemic on our results of operations and our business, including the impact of the resulting economic and market disruption, the extension of tax filing deadlines, and other related government actions; our future capital requirements and the availability of financing, if necessary; our ability to meet our current and future debt service obligations, including our ability to maintain compliance with our debt covenants; any downgrade of the Company’s credit ratings; our ability to generate strong performance for our clients and the impact of the financial markets on our clients’ portfolios; the impact of new or changing legislation and regulations (or interpretations thereof) on our business, including our ability to successfully address and comply with such legislation and regulations (or interpretations thereof) and increased costs, reductions of revenue, and potential fines, penalties or disgorgement to which we may be subject as a result thereof; risks, burdens, and costs, including fines, penalties, or disgorgement, associated with our business being subjected to regulatory inquiries, investigations, or initiatives, including those of the Financial Industry Regulatory Authority, Inc. and the Securities and Exchange Commission (“SEC”); risks associated with legal proceedings, including litigation and regulatory proceedings; our ability to close, finance, and realize all of the anticipated benefits of acquisitions, as well as our ability to integrate the operations of recently acquired businesses, and the potential impact of such acquisitions on our existing indebtedness and leverage; our ability to retain employees and acquired client assets following acquisitions; any compromise of confidentiality, availability or integrity of information, including cyberattacks; our ability to manage leadership and employee transitions, including costs and time burdens on management and our board of directors related thereto; political and economic conditions and events that directly or indirectly impact the wealth management and tax preparation software industries; our ability to respond to rapid technological changes, including our ability to successfully release new products and services or improve upon existing products and services; our expectations concerning the revenues we generate from fees associated with the financial products that we distribute; risks related to goodwill and acquired intangible asset impairment; our ability to develop, establish, and maintain strong brands; risks associated with the use and implementation of information technology and the effect of security breaches, computer viruses, and computer hacking attacks; our ability to comply with laws and regulations regarding privacy and protection of user data; our ability to maintain our relationships with third-party partners, providers, suppliers, vendors, distributors, contractors, financial institutions, industry associations, and licensing partners, and our expectations regarding and reliance on the products, tools, platforms, systems, and services provided by these third parties; our beliefs and expectations regarding the seasonality of our business; our assessments and estimates that determine our effective tax rate; our ability to protect our intellectual property and the impact of any claim that we infringed on the intellectual property rights of others; and the effects on our business of actions of activist stockholders. A more detailed description of these and certain other factors that could affect actual results is included in the Company’s most recent Annual Report on Form 10-K and most recent Quarterly Report on Form 10-Q filed with the SEC. Readers are cautioned not to place undue reliance on these forward-looking statements, which speak only as of the date hereof. The Company undertakes no obligation to update any forward-looking statements to reflect events or circumstances after the date hereof, except as may be required by law. Third-Party Information and Market and Industry Data We have neither sought nor obtained consent from any third party for the use of previously published information. Any such statements or information should not be viewed as indicating the support of such third party for the views expressed herein. We shall not be responsible or have any liability for any misinformation contained in any third-party report, SEC or other regulatory filing. All registered or unregistered service marks, trademarks and trade names referred to in this presentation are the property of their respective owners, and our use herein does not imply an affiliation with, or endorsement by, the owners of these service marks, trademarks and trade names. The data included in this presentation regarding our industries, including trends in the market and the Company’s position and the position of its competitors within our industries, are based on the Company’s estimates, which have been derived from management’s knowledge and experience in our industries, and information obtained from customers, trade and business organizations, internal research, publicly available information, industry publications and surveys and other contacts in our industries. The Company has also cited information compiled by industry publications, governmental agencies and publicly available sources. Although the Company believes these third-party sources to be reliable, it has not independently verified the data obtained from these sources, and we cannot assure you of the accuracy or completeness of the data. Estimates of market size and relative positions in a market are difficult to develop and inherently uncertain, and the Company cannot assure you that it is accurate. Accordingly, you should not place undue weight on the industry and market share data presented in this presentation. Non-GAAP Financial Information This presentation contains non-GAAP financial measures that should not be considered a substitute for, or superior to, the financial measures prepared in accordance with GAAP. You can find the reconciliation of these measures to the most directly comparable GAAP financial measure in the Appendix at the end of this presentation 2

Blucora’s Purpose, Delivered by the Missions of Its Two Businesses Blucora Purpose: Avantax Mission: TaxAct Mission: To be the leader serving a To be the preferred tax To enable financial success community of CPAs, tax software solution, enabling by changing the way professionals, and tax-focused customers to maximize tax financial professionals by individuals and families plan outcomes by providing providing clients tax-advantaged delightful customer and achieve their goals investment solutions, innovative experiences with our fully through tax-advantaged technologies, and tax-inclusive featured value offering financial planning solutions 3
Blucora – Repositioned to Deliver Sustainable Growth Building on two strong businesses Solid progress repositioning Blucora Delivering strong results 4

Blucora is Building on Two Strong, Differentiated Businesses 1 Tax focus at our core 2 Positioned in large growing markets Tax Wealth 3 Strong competitive advantages Strong position in both segments 5
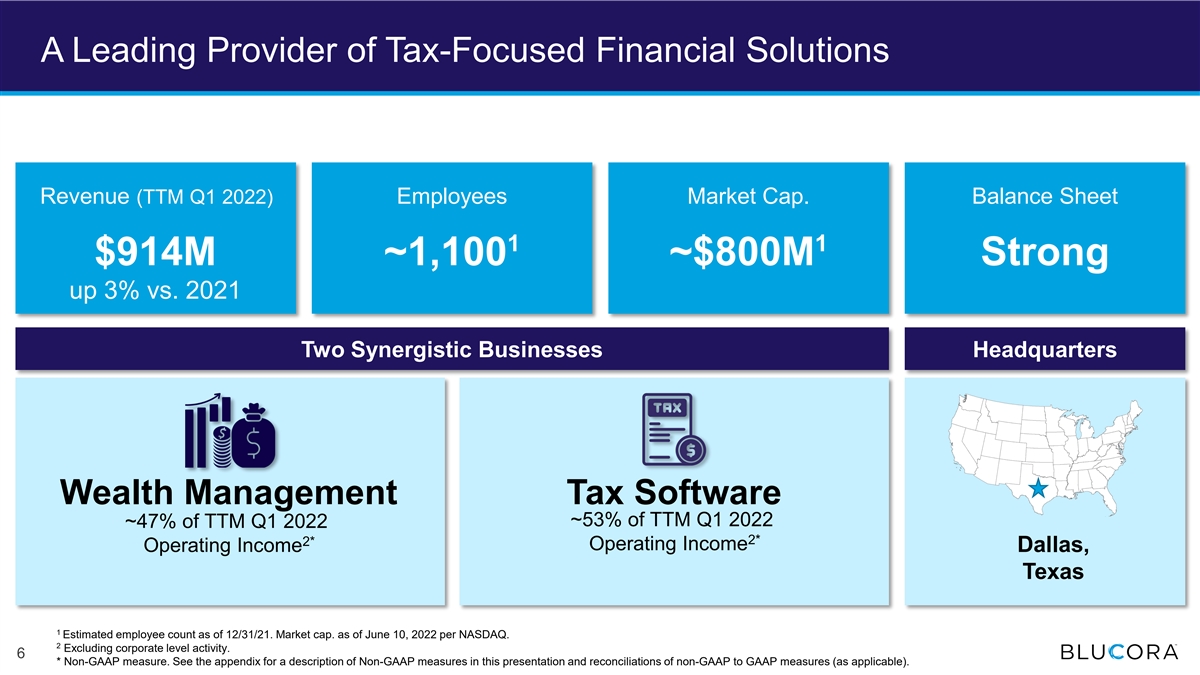
A Leading Provider of Tax-Focused Financial Solutions Revenue (TTM Q1 2022) Employees Market Cap. Balance Sheet 1 1 $914M ~1,100 ~$800M Strong up 3% vs. 2021 Two Synergistic Businesses Headquarters Wealth Management Tax Software ~53% of TTM Q1 2022 ~47% of TTM Q1 2022 2* 2* Operating Income Operating Income Dallas, Texas 1 Estimated employee count as of 12/31/21. Market cap. as of June 10, 2022 per NASDAQ. 2 Excluding corporate level activity. 6 * Non-GAAP measure. See the appendix for a description of Non-GAAP measures in this presentation and reconciliations of non-GAAP to GAAP measures (as applicable).

Why a Strong Tax Focus Makes a Difference Advantages Tax prep creates strong 1 80% of people view tax professionals as their most trusted financial advisor relationships Taxes are huge recurring Americans spend more on taxes than mortgages, groceries, and vehicles 2 combined expense Mortgage – refinance opportunity? Taxes provide valuable data insights into Wealth opportunities – retirement contributions? individuals’ financial position Student loan interest – consolidation? 1 IRS, Comprehensive Taxpayer Attitudes Survey, 2020. 7 2 CPA Practice Advisor, 2021.
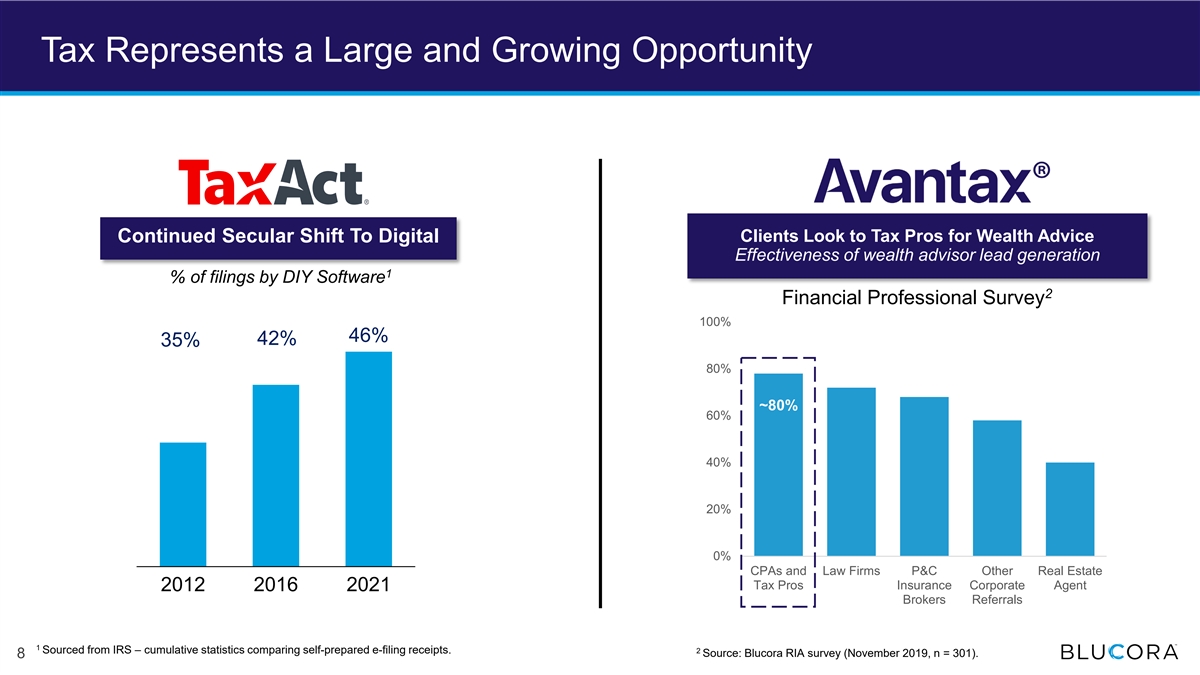
Tax Represents a Large and Growing Opportunity Continued Secular Shift To Digital Clients Look to Tax Pros for Wealth Advice Effectiveness of wealth advisor lead generation 1 % of filings by DIY Software 2 Financial Professional Survey 100% 46% 42% 35% 80% ~80% 60% 40% 20% 0% CPAs and Law Firms P&C Other Real Estate Tax Pros Insurance Corporate Agent 2012 2016 2021 Brokers Referrals 1 Sourced from IRS – cumulative statistics comparing self-prepared e-filing receipts. 2 Source: Blucora RIA survey (November 2019, n = 301). 8
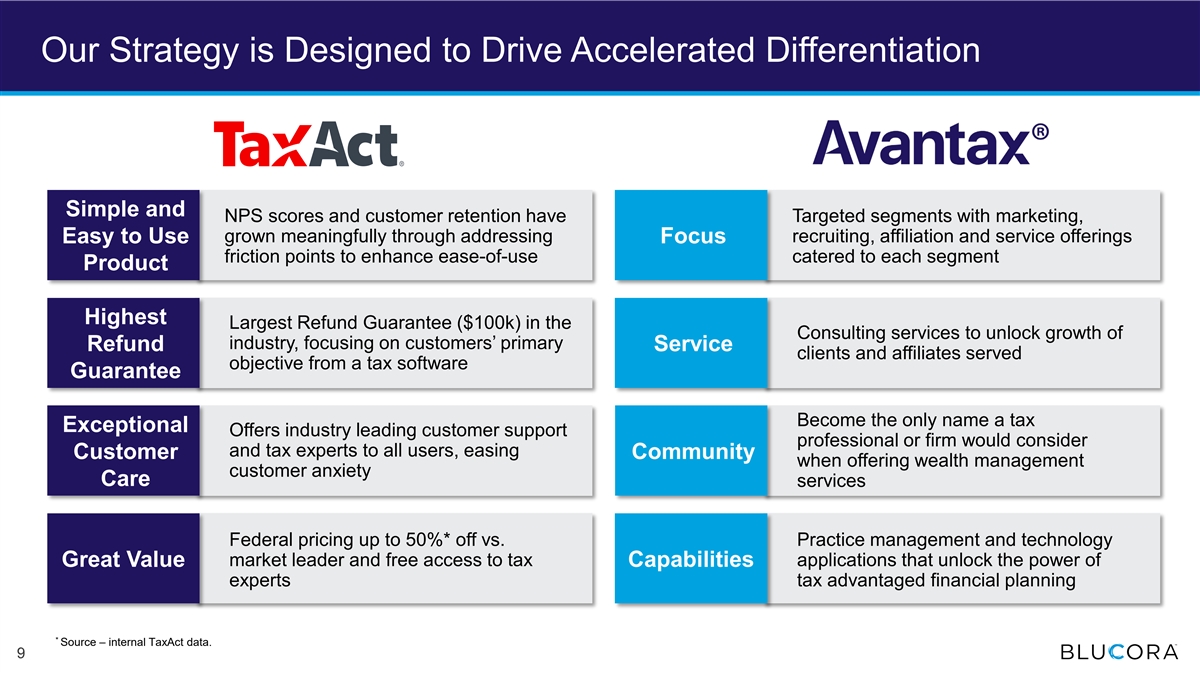
Our Strategy is Designed to Drive Accelerated Differentiation Simple and NPS scores and customer retention have Targeted segments with marketing, grown meaningfully through addressing recruiting, affiliation and service offerings Easy to Use Focus friction points to enhance ease-of-use catered to each segment Product Highest Largest Refund Guarantee ($100k) in the Consulting services to unlock growth of industry, focusing on customers’ primary Refund Service clients and affiliates served objective from a tax software Guarantee Become the only name a tax Exceptional Offers industry leading customer support professional or firm would consider and tax experts to all users, easing Customer Community when offering wealth management customer anxiety Care services Federal pricing up to 50%* off vs. Practice management and technology market leader and free access to tax applications that unlock the power of Great Value Capabilities experts tax advantaged financial planning * Source – internal TaxAct data. 9 9
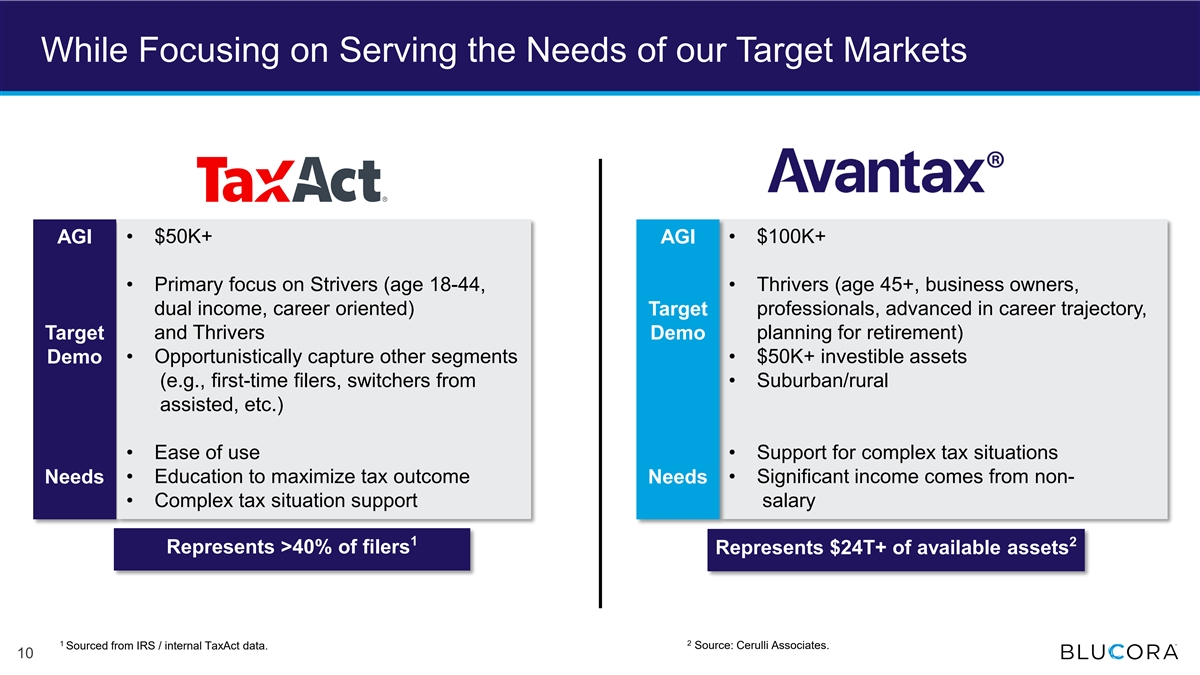
While Focusing on Serving the Needs of our Target Markets AGI • $50K+ AGI • $100K+ • Primary focus on Strivers (age 18-44, • Thrivers (age 45+, business owners, dual income, career oriented) professionals, advanced in career trajectory, Target and Thrivers planning for retirement) Target Demo Demo • Opportunistically capture other segments • $50K+ investible assets (e.g., first-time filers, switchers from • Suburban/rural assisted, etc.) • Ease of use • Support for complex tax situations Needs • Education to maximize tax outcome Needs • Significant income comes from non- • Complex tax situation support salary 1 2 Represents >40% of filers Represents $24T+ of available assets 1 2 Source: Cerulli Associates. Sourced from IRS / internal TaxAct data. 10

With a Strong Base of Recurring Revenue Growth Significant Recurring Revenue 75% 85% 1 Recurring Tax Filers Recurring Wealth Management 2 Revenue 1 Paid federal retention rate/returning customers 12/31/2021. 2 11 Reflects full year December 31, 2021.

DIY Tax Software is a ~$4B Top-Line Market With Consistent Long-Term Growth 1 DIY Tax Software Market Continued Secular Shift To Digital Steady Market Growth 2 2 DIY Tax Returns Filed Electronically % of filings by DIY Software 6% CAGR Total Market: ~$4B Revenue 44% 40% software share ~5% 2017 2021 2017 2021 ~3-4% Annual Unit Growth 1 Sourced from IRS / internal TaxAct data. 12 2 Sourced from IRS – cumulative statistics comparing self-prepared e-filing receipts as of May-2021 vs. May-2016.
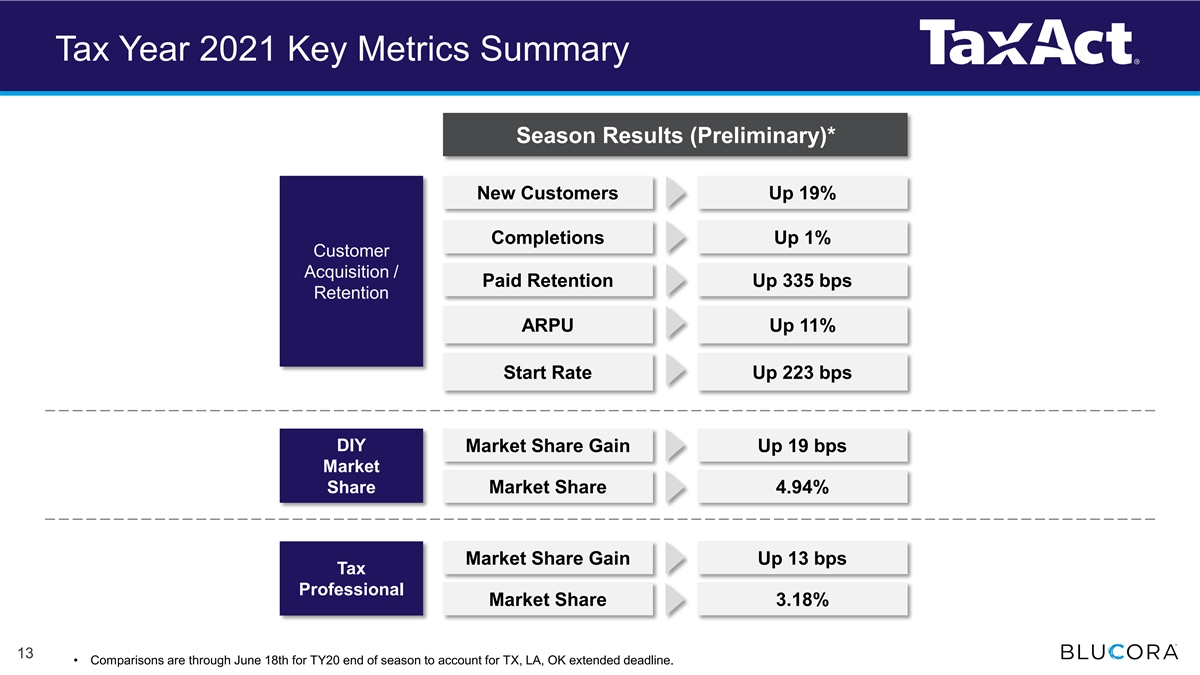
Tax Year 2021 Key Metrics Summary Season Results (Preliminary)* New Customers Up 19% Completions Up 1% Customer Acquisition / Paid Retention Up 335 bps Retention ARPU Up 11% Start Rate Up 223 bps DIY Market Share Gain Up 19 bps Market Share Market Share 4.94% Market Share Gain Up 13 bps Tax Professional Market Share 3.18% 13 13 • Comparisons are through June 18th for TY20 end of season to account for TX, LA, OK extended deadline.
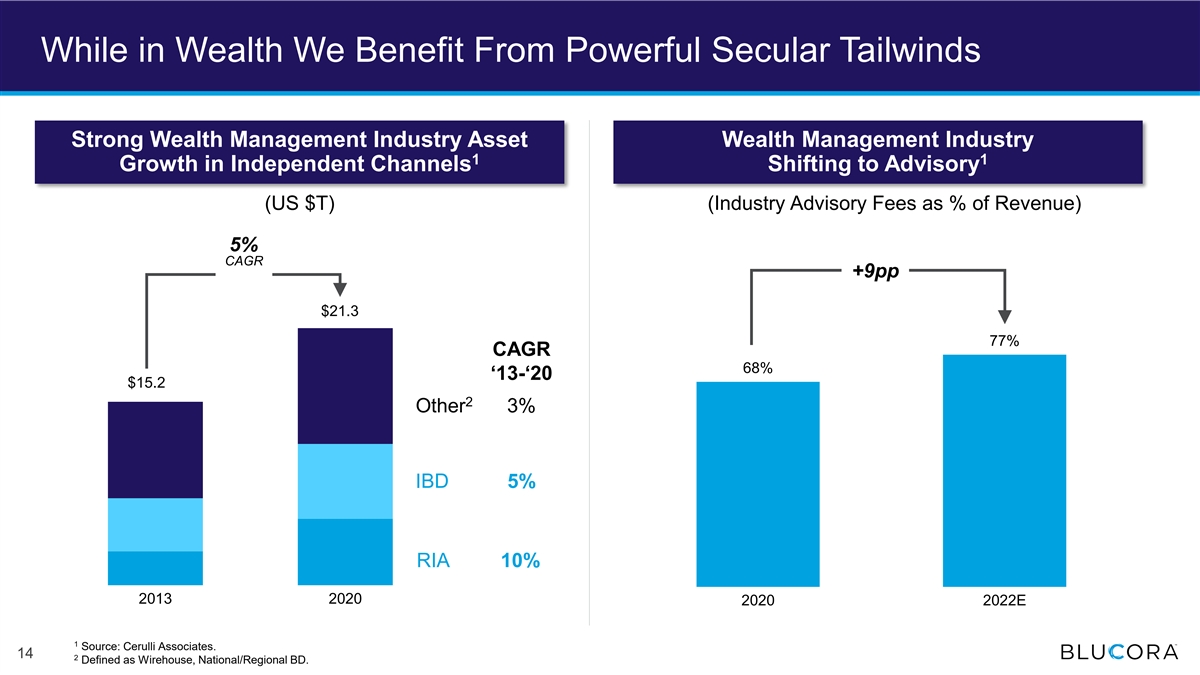
While in Wealth We Benefit From Powerful Secular Tailwinds Strong Wealth Management Industry Asset Wealth Management Industry 1 1 Growth in Independent Channels Shifting to Advisory (US $T) (Industry Advisory Fees as % of Revenue) 5% CAGR +9pp $21.3 77% CAGR 68% ‘13-‘20 $15.2 2 Other 3% IBD 5% RIA 10% 2013 2020 2020 2022E 1 Source: Cerulli Associates. 14 2 Defined as Wirehouse, National/Regional BD.

Many Financial Professionals Fail to Deliver Tax-Smart Wealth Advice We Help Address an Unfilled Client Need Tax-Centric Advisors are Uniquely Positioned Additional Industry Focus Avantax Focus Other financial professionals provide insufficient advice on tax planning Avantax financial professionals fill that gap with both tax and wealth knowledge Avantax scale and focus on tax smart Investment Management Financial Planning Tax Planning offerings provides the solution Service Expected Service Received Source: Spectrem Group August 2018 Defining Wealth Management ; Question asks respondents what services they expect their advisor to provide and then indicate if their advisor actually provides that service. 15
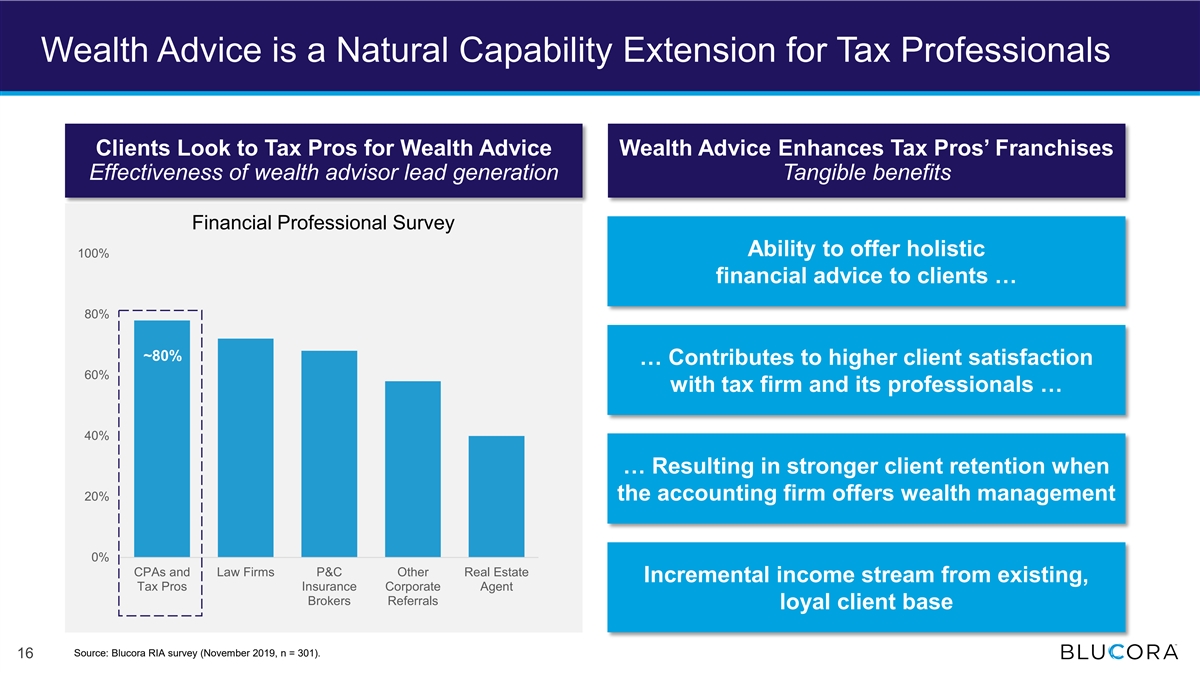
Wealth Advice is a Natural Capability Extension for Tax Professionals Clients Look to Tax Pros for Wealth Advice Wealth Advice Enhances Tax Pros’ Franchises Effectiveness of wealth advisor lead generation Tangible benefits Financial Professional Survey Ability to offer holistic 100% financial advice to clients … 80% ~80% … Contributes to higher client satisfaction 60% with tax firm and its professionals … 40% … Resulting in stronger client retention when 20% the accounting firm offers wealth management 0% CPAs and Law Firms P&C Other Real Estate Incremental income stream from existing, Tax Pros Insurance Corporate Agent Brokers Referrals loyal client base Source: Blucora RIA survey (November 2019, n = 301). 16

Wealth Management Q1 ‘22 Key Metrics Summary Q1 ‘22 Results* Qtrly. Production 99.6% Retention Rate** Attrition of FPs with over $500k in rolling Financial -0- 12-month gross Professional Retention revenue Exceeded $500M for Recruited Assets Q1 2022 Net Positive In-Flows >$245M Assets Advisory In-Flows $1.2B Acquisitions RIA Pipeline >$6B * Source: Company documents. ** Non-GAAP measure. See the appendix for a description of Non-GAAP measures in this presentation and reconciliations of non-GAAP to GAAP measures (as applicable). 17 17

Wealth Management Annual Sweep Revenue Wealth Management Segment Annual Sweep Revenue* ($ in millions) 1 1 * Source: Company documents. 18 18 1 Based on Company estimates, assuming that rates end the year in 2022 at 225bp to 250bp, with no additional hikes in 2023.
Blucora – Repositioned to Deliver Sustainable Growth Building on two strong businesses Solid progress repositioning Blucora Delivering strong results 19
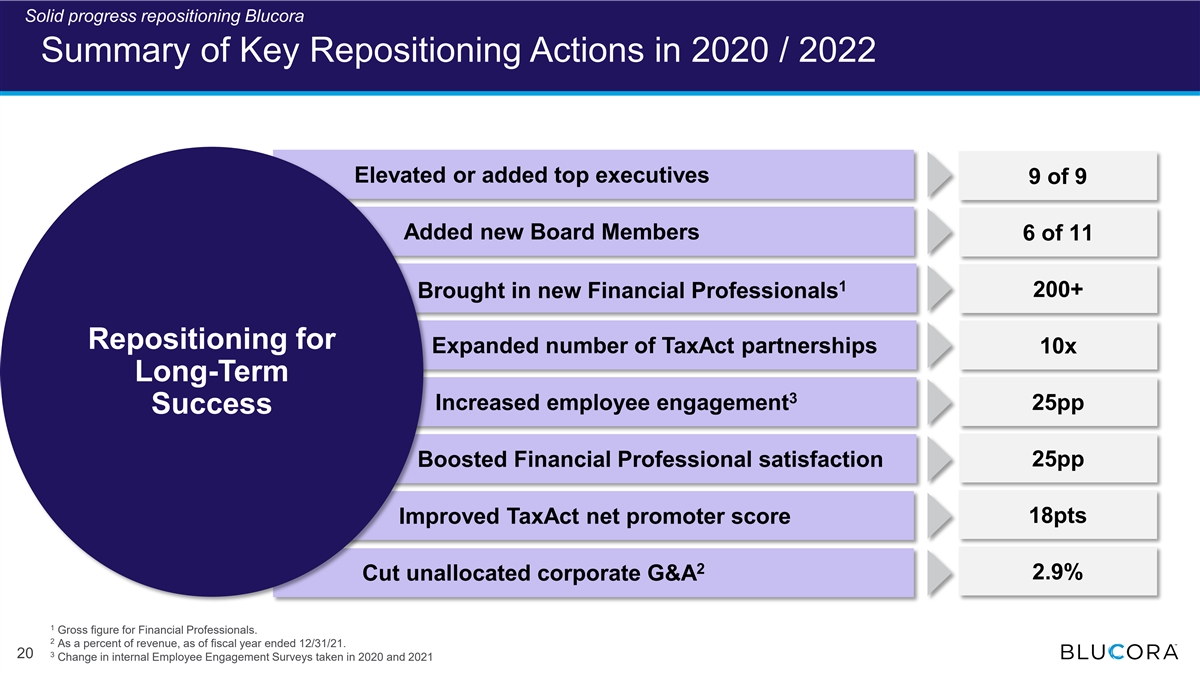
Solid progress repositioning Blucora Summary of Key Repositioning Actions in 2020 / 2022 Elevated or added top executives 9 of 9 Added new Board Members 6 of 11 1 200+ Brought in new Financial Professionals Repositioning for Expanded number of TaxAct partnerships 10x Long-Term 3 Increased employee engagement 25pp Success 25pp Boosted Financial Professional satisfaction Improved TaxAct net promoter score 18pts 2 2.9% Cut unallocated corporate G&A 1 Gross figure for Financial Professionals. 2 As a percent of revenue, as of fiscal year ended 12/31/21. 3 20 Change in internal Employee Engagement Surveys taken in 2020 and 2021
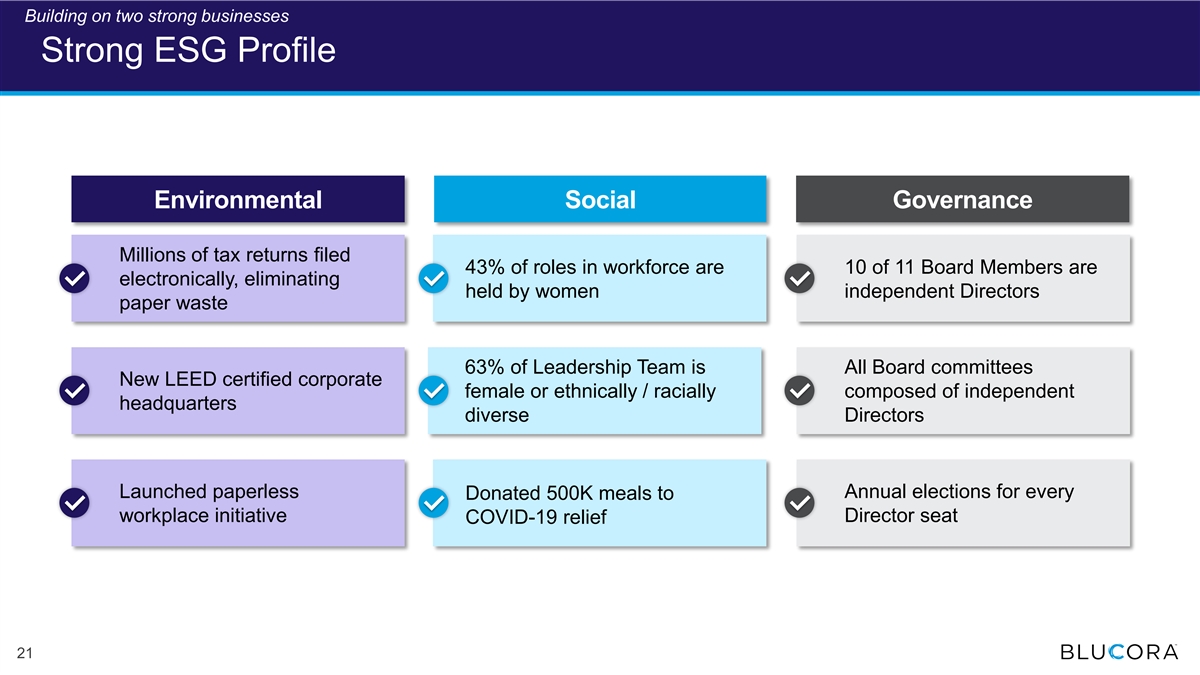
Building on two strong businesses Strong ESG Profile Environmental Social Governance Millions of tax returns filed 43% of roles in workforce are 10 of 11 Board Members are electronically, eliminating held by women independent Directors paper waste 63% of Leadership Team is All Board committees New LEED certified corporate female or ethnically / racially composed of independent headquarters diverse Directors Launched paperless Annual elections for every Donated 500K meals to workplace initiative Director seat COVID-19 relief 21

Blucora – Repositioned to Deliver Sustainable Growth Solid progress repositioning Blucora Building on two strong businesses Delivering strong results 22
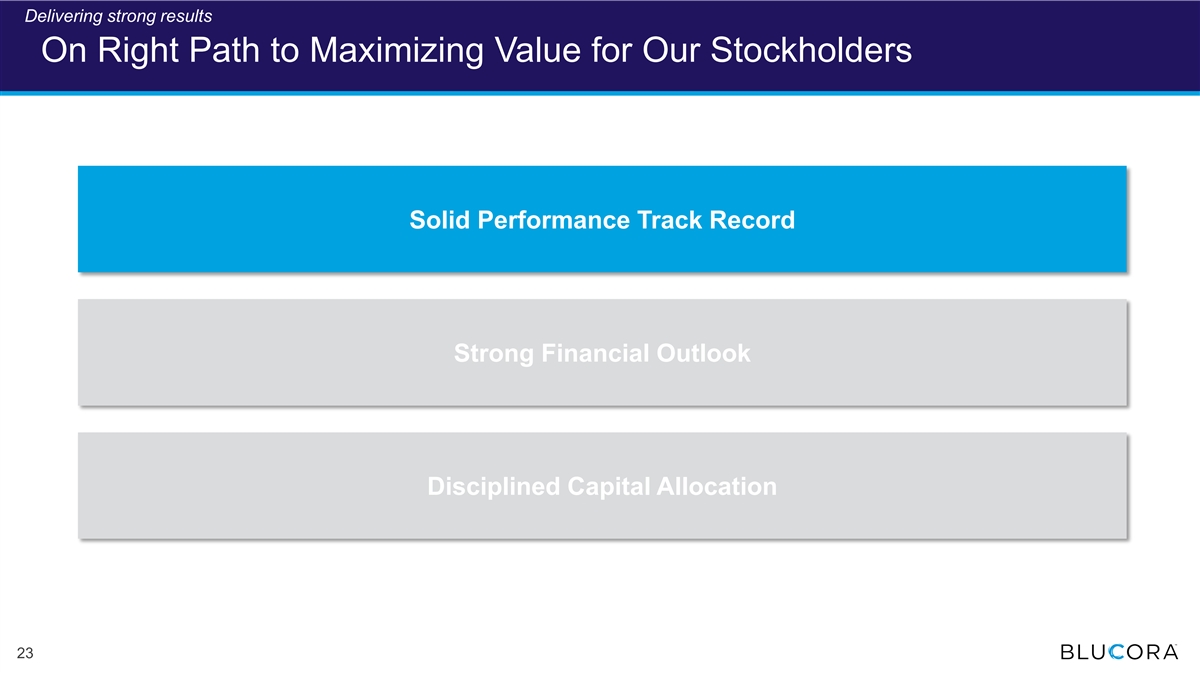
Delivering strong results On Right Path to Maximizing Value for Our Stockholders Solid Performance Track Record Strong Financial Outlook Disciplined Capital Allocation 23
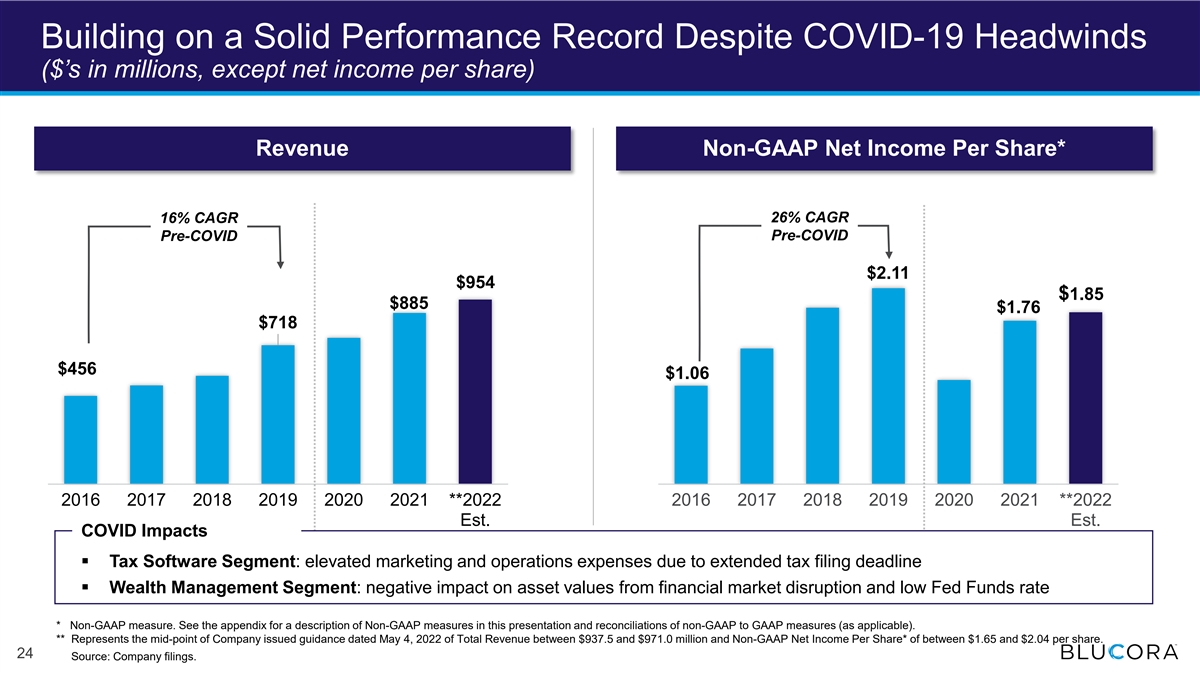
Building on a Solid Performance Record Despite COVID-19 Headwinds ($’s in millions, except net income per share) Revenue Non-GAAP Net Income Per Share* 26% CAGR 16% CAGR Pre-COVID Pre-COVID $2.11 $954 $1.85 $885 $1.76 $718 $456 $1.06 2016 2017 2018 2019 2020 2021 **2022 2016 2017 2018 2019 2020 2021 **2022 Est. Est. COVID Impacts § Tax Software Segment: elevated marketing and operations expenses due to extended tax filing deadline § Wealth Management Segment: negative impact on asset values from financial market disruption and low Fed Funds rate * Non-GAAP measure. See the appendix for a description of Non-GAAP measures in this presentation and reconciliations of non-GAAP to GAAP measures (as applicable). ** Represents the mid-point of Company issued guidance dated May 4, 2022 of Total Revenue between $937.5 and $971.0 million and Non-GAAP Net Income Per Share* of between $1.65 and $2.04 per share. 24 Source: Company filings.

Continued Avantax’s Track Record of Top-Line Growth ($’s in millions) Wealth Management Segment Revenue Segment Operating Income ’16-FYE ‘22 Est. Mid Point $705 CAGR: Total: ~14% $658 Pre COVID: 14% CAGR $93 $82 $508 $68 $317 $46 2016 2017 2018 2019 2020 2021 *2022 Est. 2016 2017 2018 2019 2020 2021 *2022 Est. COVID Impacts § Wealth Management Segment: lower Fed Funds rate and negative impact on asset values from financial market disruption * Represents the mid-point of Company issued guidance dated May 4, 2022 of Segment Revenue between $690.0 and $720.0 million and Segment Operating Income between $85.0 and $100.0 million. Source: Company filings. 25
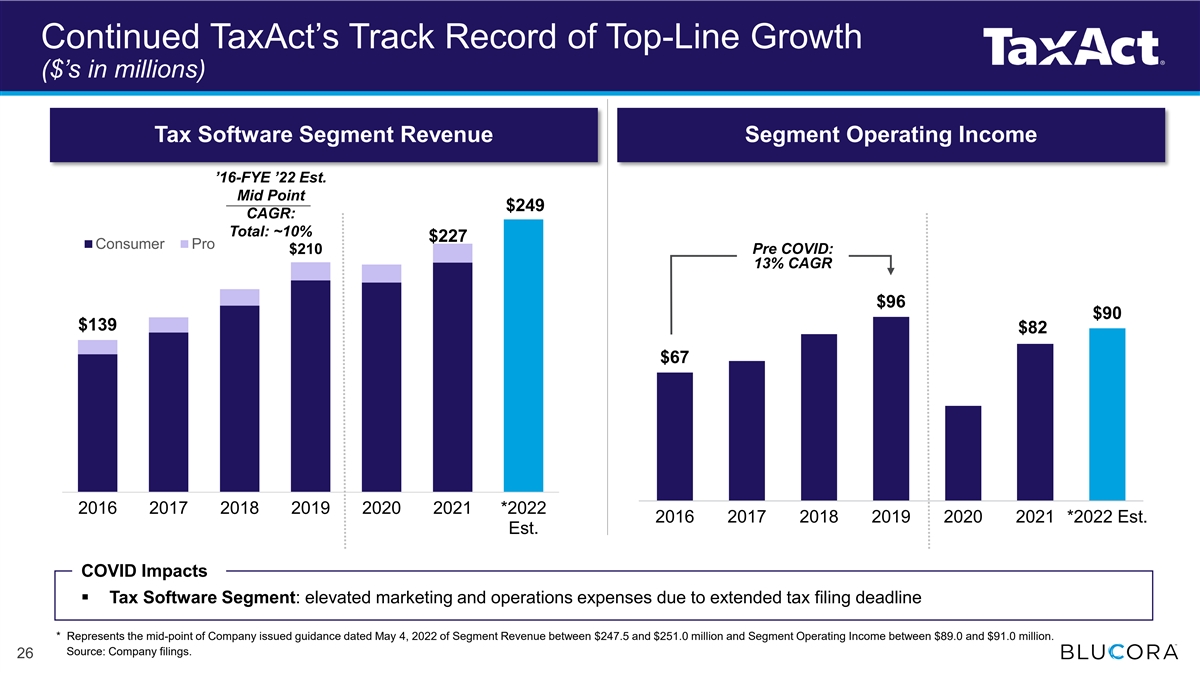
Continued TaxAct’s Track Record of Top-Line Growth ($’s in millions) Tax Software Segment Revenue Segment Operating Income ’16-FYE ’22 Est. Mid Point $249 CAGR: Total: ~10% $227 Consumer Pro $210 Pre COVID: 13% CAGR $96 $90 $139 $82 $67 2016 2017 2018 2019 2020 2021 *2022 2016 2017 2018 2019 2020 2021 *2022 Est. Est. COVID Impacts § Tax Software Segment: elevated marketing and operations expenses due to extended tax filing deadline * Represents the mid-point of Company issued guidance dated May 4, 2022 of Segment Revenue between $247.5 and $251.0 million and Segment Operating Income between $89.0 and $91.0 million. Source: Company filings. 26
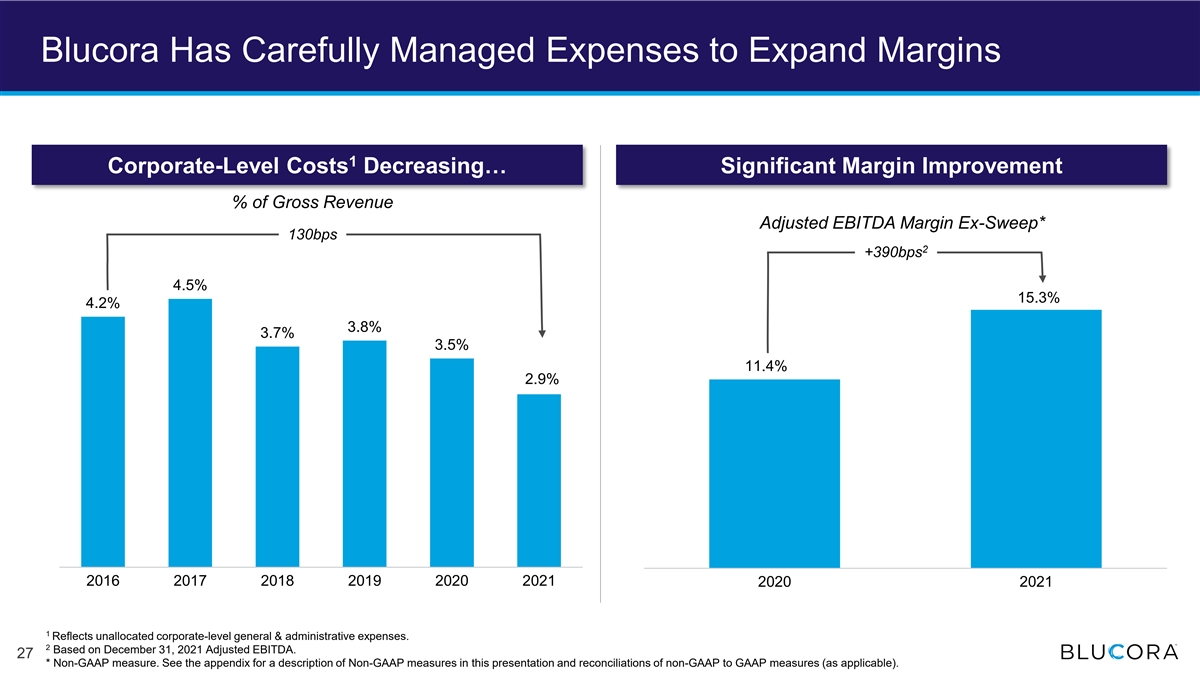
Blucora Has Carefully Managed Expenses to Expand Margins 1 Corporate-Level Costs Decreasing… Significant Margin Improvement % of Gross Revenue Adjusted EBITDA Margin Ex-Sweep* 130bps 2 +390bps 4.5% 15.3% 4.2% 3.8% 3.7% 3.5% 11.4% 2.9% 2016 2017 2018 2019 2020 2021 2020 2021 1 Reflects unallocated corporate-level general & administrative expenses. 2 Based on December 31, 2021 Adjusted EBITDA. 27 27 * Non-GAAP measure. See the appendix for a description of Non-GAAP measures in this presentation and reconciliations of non-GAAP to GAAP measures (as applicable).
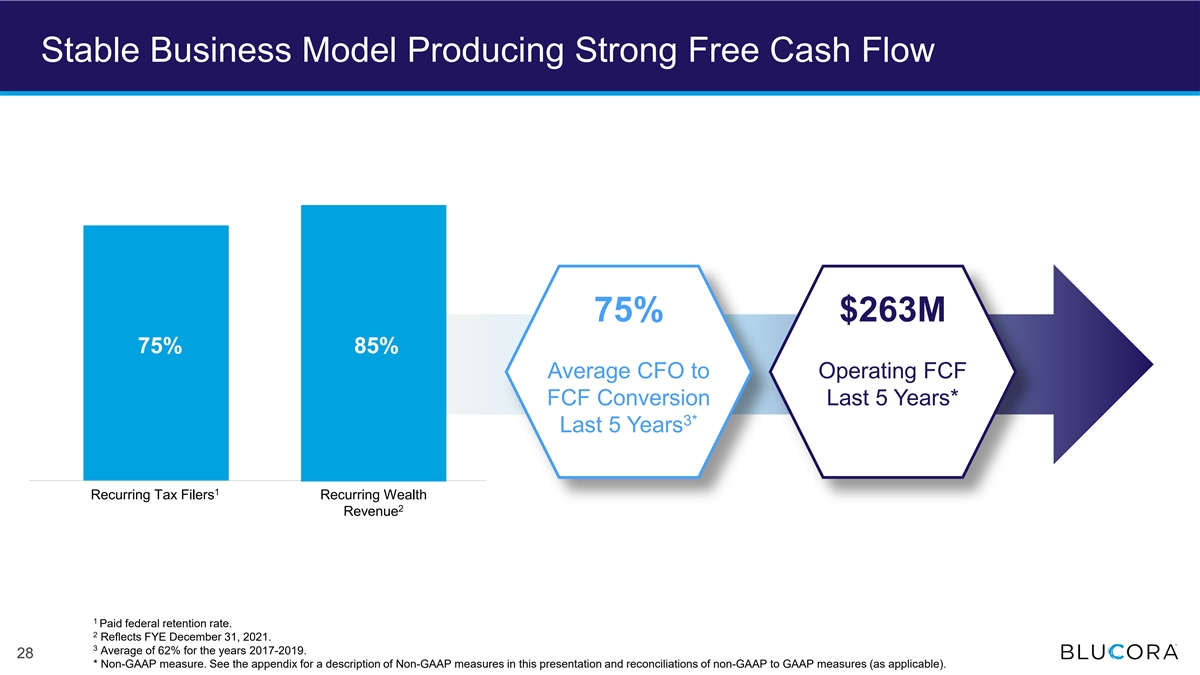
Stable Business Model Producing Strong Free Cash Flow 75% $263M 75% 85% Average CFO to Operating FCF FCF Conversion Last 5 Years* 3* Last 5 Years 1 Recurring Tax Filers Recurring Wealth 2 Revenue 1 Paid federal retention rate. 2 Reflects FYE December 31, 2021. 3 Average of 62% for the years 2017-2019. 28 * Non-GAAP measure. See the appendix for a description of Non-GAAP measures in this presentation and reconciliations of non-GAAP to GAAP measures (as applicable).
Delivering strong results On Right Path to Maximizing Value for Our Stockholders Solid Performance Track Record Strong Financial Outlook Disciplined Capital Allocation 29
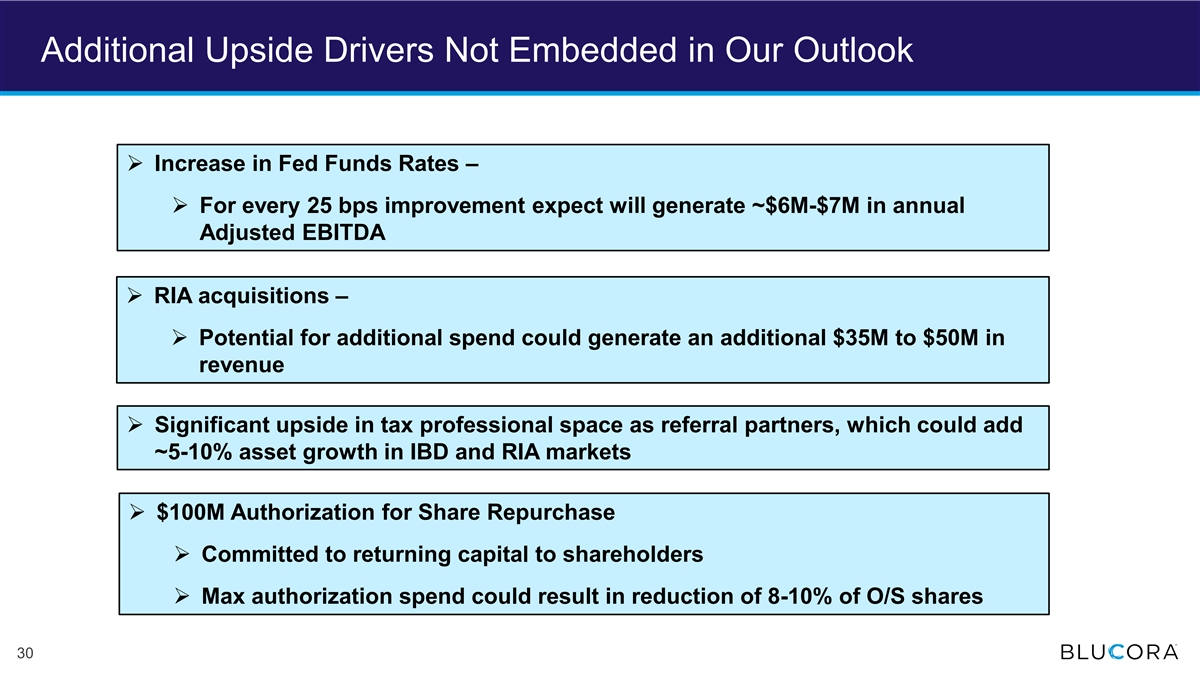
Additional Upside Drivers Not Embedded in Our Outlook Ø Increase in Fed Funds Rates – Ø For every 25 bps improvement expect will generate ~$6M-$7M in annual Adjusted EBITDA Ø RIA acquisitions – Ø Potential for additional spend could generate an additional $35M to $50M in revenue Ø Significant upside in tax professional space as referral partners, which could add ~5-10% asset growth in IBD and RIA markets Ø $100M Authorization for Share Repurchase Ø Committed to returning capital to shareholders Ø Max authorization spend could result in reduction of 8-10% of O/S shares 30
On Right Path to Maximizing Value for Our Stockholders Solid Performance Track Record Strong Financial Outlook Disciplined Capital Allocation 31

Disciplined capital allocation Capital Allocation Priorities • Ample capital to support growth Maintain Strong 1 • On track to achieve target Net Leverage Ratio* of 2x to 3x Balance Sheet • Return capital to shareholders • Unlocking upside across our businesses Invest to Fuel 2 Business Growth • Technology, marketing, and service enhancements to create sustainable growth • Disciplined capital allocation approach Opportunistic 3 Targeted M&A • Significant opportunities within our ecosystem * Non-GAAP measure. See the appendix for a description of Non-GAAP measures in this presentation and reconciliations of non-GAAP to GAAP measures (as applicable). 32

Disciplined capital allocation Strong Balance Sheet with Capacity to Invest 2 Cash and Cash Equivalents $144M 1 Revolver Capacity $90M Revolver Accessü Capacity to Invest Covenant-lite Flexible Debtü for Future Growth 2 Net Leverage Ratio* 3.0x Target Net Leverage Ratio* 2.0-3.0x 3 Incremental M&A Debt Capacity $350-450M 1 Reflects current revolving credit facility capacity. 2 As of 03/31/22. 3 Based on mid-point 2021 EBITDA guidance, acquired M&A at 10-15x multiple and max net leverage of 5x. * Non-GAAP measure. See the appendix for a description of Non-GAAP measures in this presentation and reconciliations of non-GAAP to GAAP measures (as applicable). 33
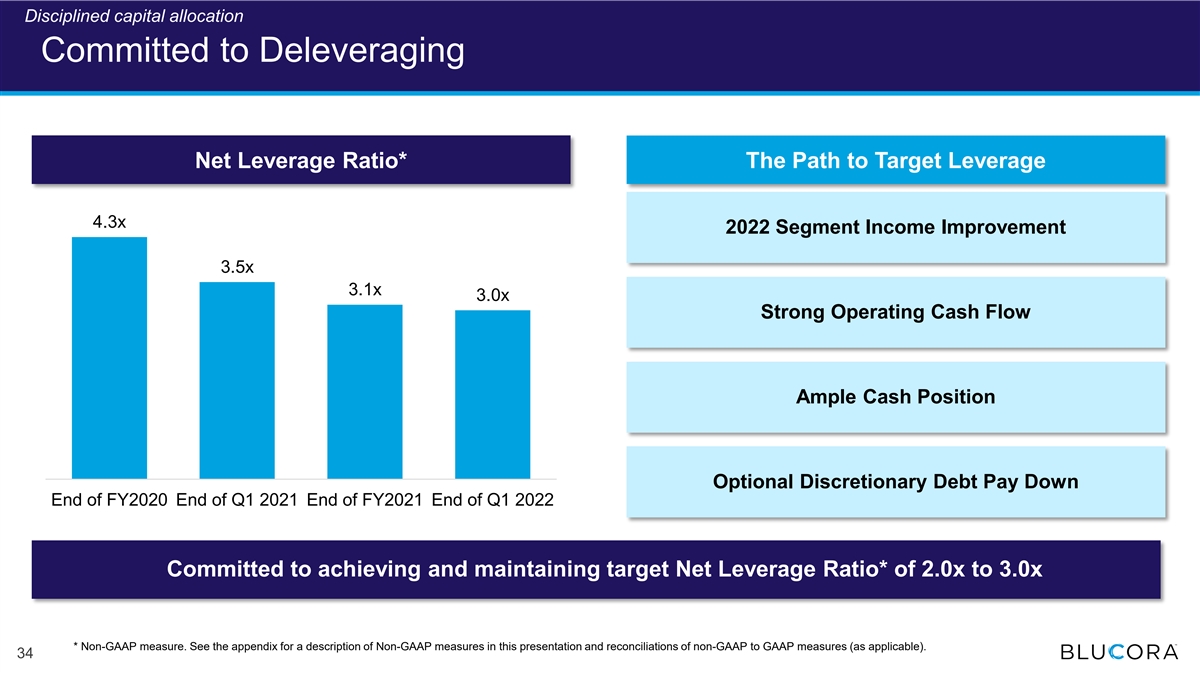
Disciplined capital allocation Committed to Deleveraging Net Leverage Ratio* The Path to Target Leverage 4.3x 2022 Segment Income Improvement 3.5x 3.1x 3.0x Strong Operating Cash Flow Ample Cash Position Optional Discretionary Debt Pay Down End of FY2020 End of Q1 2021 End of FY2021 End of Q1 2022 Committed to achieving and maintaining target Net Leverage Ratio* of 2.0x to 3.0x * Non-GAAP measure. See the appendix for a description of Non-GAAP measures in this presentation and reconciliations of non-GAAP to GAAP measures (as applicable). 34
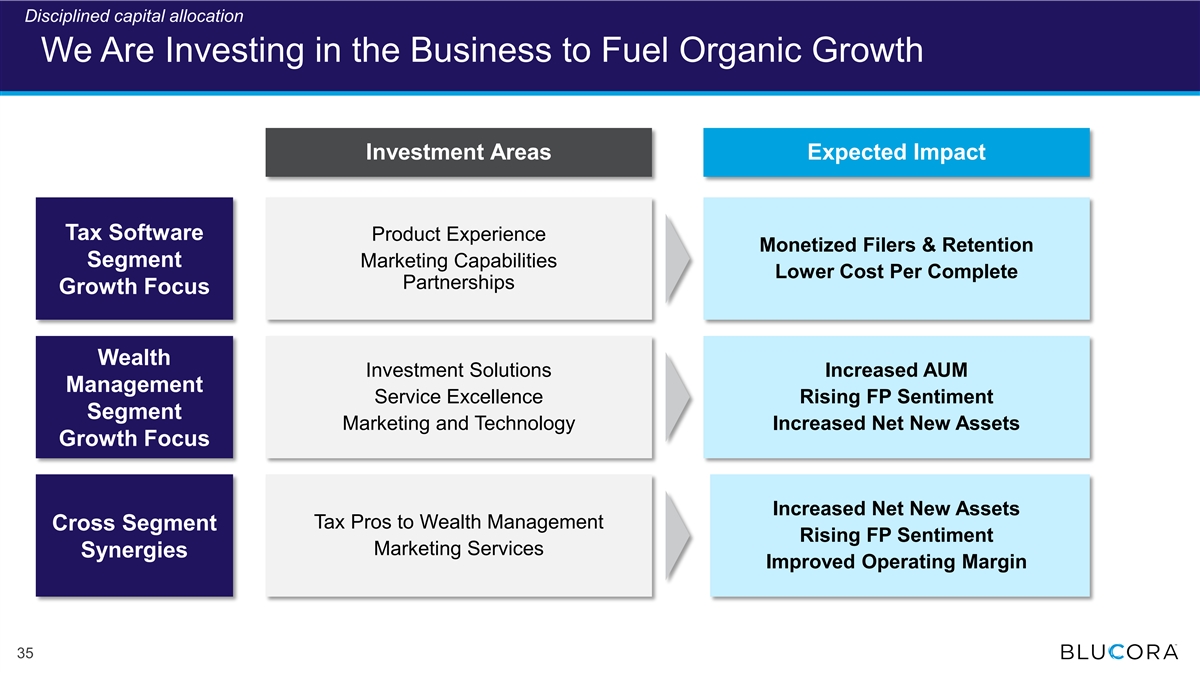
Disciplined capital allocation We Are Investing in the Business to Fuel Organic Growth Investment Areas Expected Impact Tax Software Product Experience Monetized Filers & Retention Segment Marketing Capabilities Lower Cost Per Complete Partnerships Growth Focus Wealth Investment Solutions Increased AUM Management Service Excellence Rising FP Sentiment Segment Marketing and Technology Increased Net New Assets Growth Focus Increased Net New Assets Tax Pros to Wealth Management Cross Segment Rising FP Sentiment Marketing Services Synergies Improved Operating Margin 35
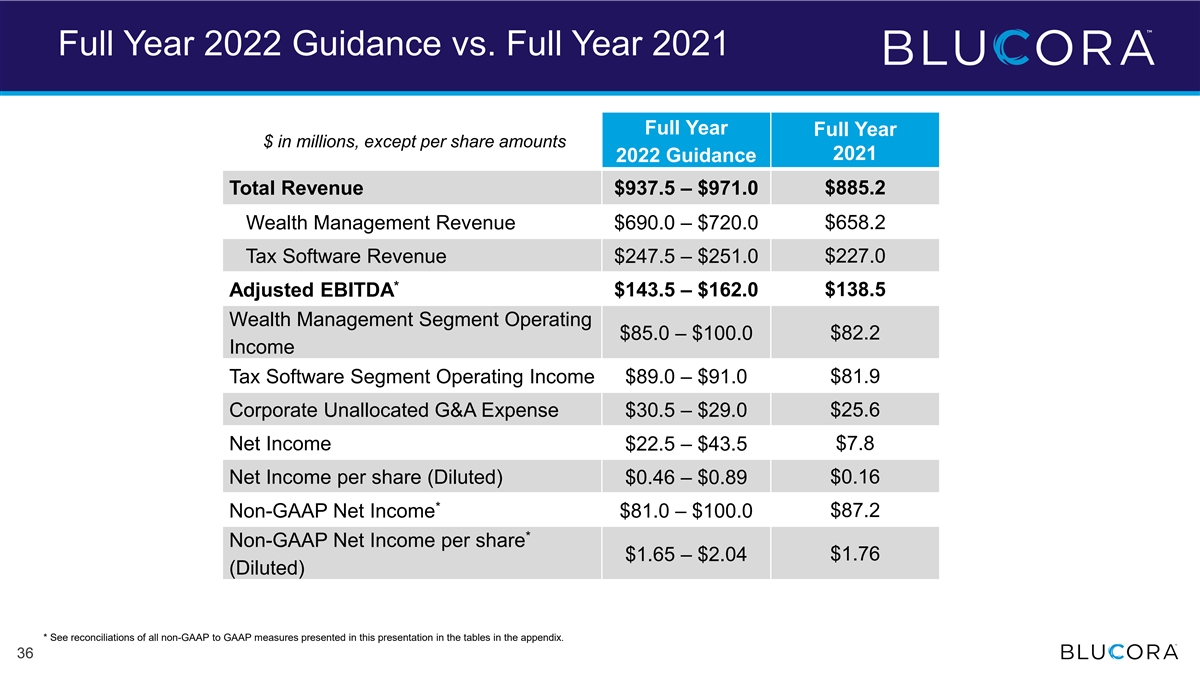
Full Year 2022 Guidance vs. Full Year 2021 Full Year Full Year $ in millions, except per share amounts 2021 2022 Guidance Total Revenue $937.5 – $971.0 $885.2 $658.2 Wealth Management Revenue $690.0 – $720.0 $227.0 Tax Software Revenue $247.5 – $251.0 * $143.5 – $162.0 $138.5 Adjusted EBITDA Wealth Management Segment Operating $85.0 – $100.0$82.2 Income Tax Software Segment Operating Income $89.0 – $91.0$81.9 $25.6 Corporate Unallocated G&A Expense $30.5 – $29.0 Net Income$7.8 $22.5 – $43.5 Net Income per share (Diluted) $0.46 – $0.89$0.16 * Non-GAAP Net Income $81.0 – $100.0$87.2 * Non-GAAP Net Income per share $1.65 – $2.04$1.76 (Diluted) * See reconciliations of all non-GAAP to GAAP measures presented in this presentation in the tables in the appendix. 36 36

Investor Presentation – NASDAQ: BCOR Investor Contact Dee Littrell – Director Investor Relations (972) 870-6463 Dee.Littrell@blucora.com

Reconciliations of Non-GAAP Financial Measures to the Nearest Comparable GAAP Measures 38
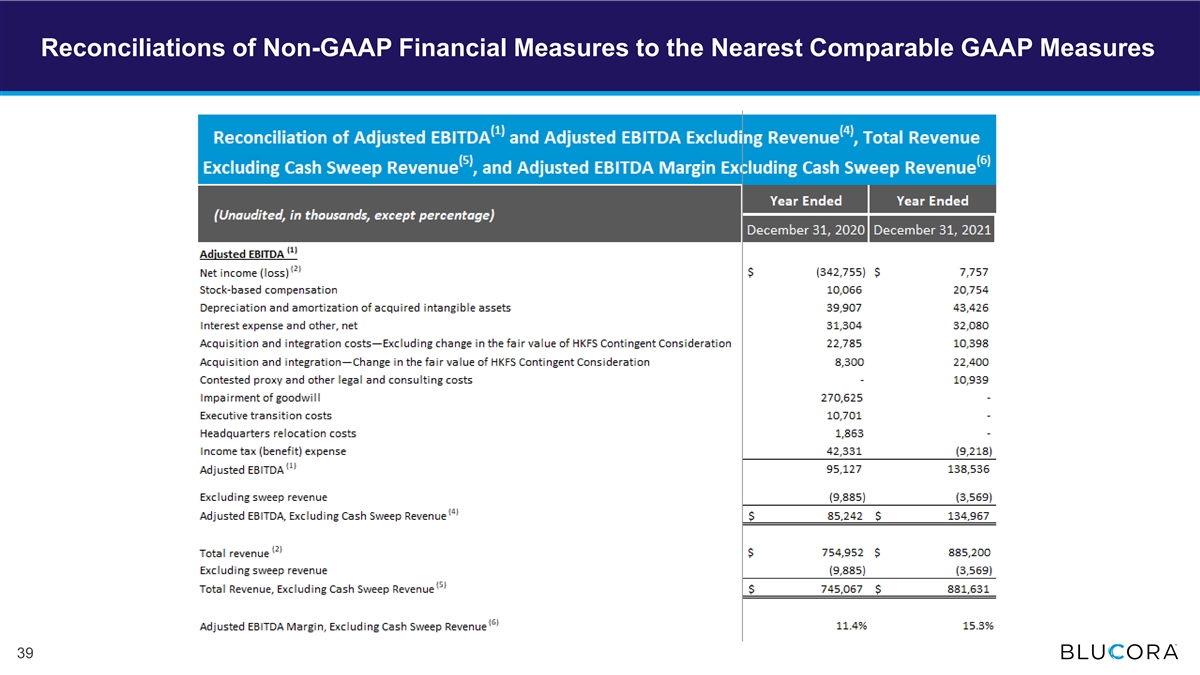
Reconciliations of Non-GAAP Financial Measures to the Nearest Comparable GAAP Measures 39

Reconciliations of Non-GAAP Financial Measures to the Nearest Comparable GAAP Measures 40
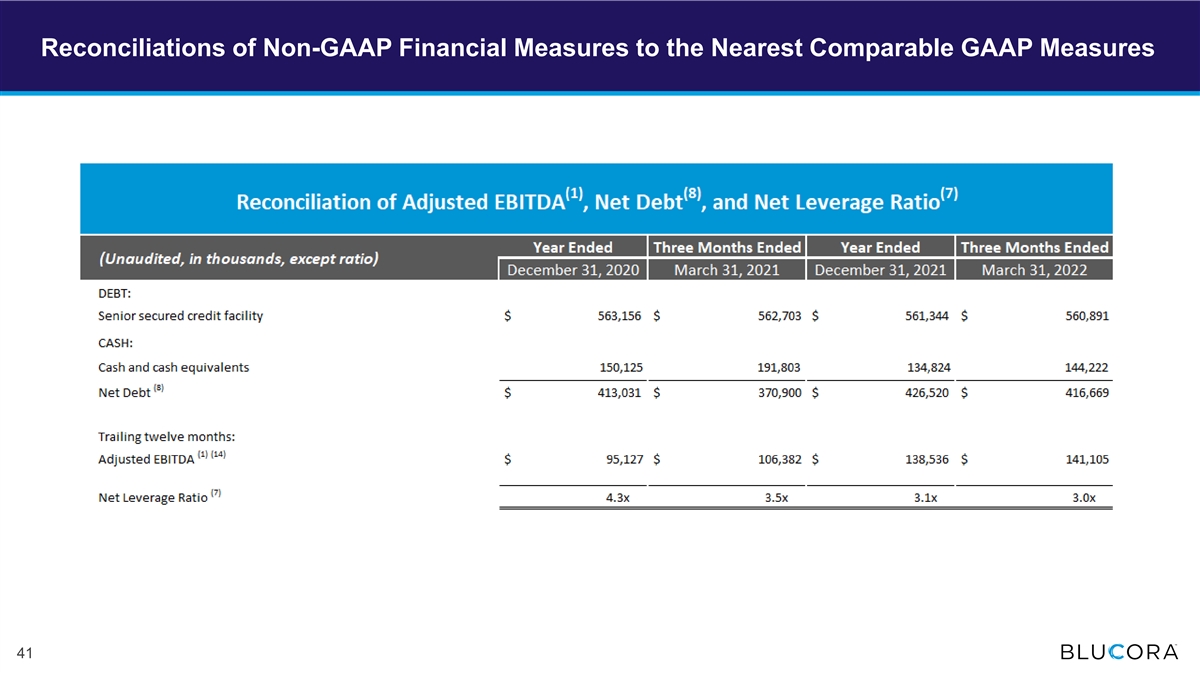
Reconciliations of Non-GAAP Financial Measures to the Nearest Comparable GAAP Measures 41
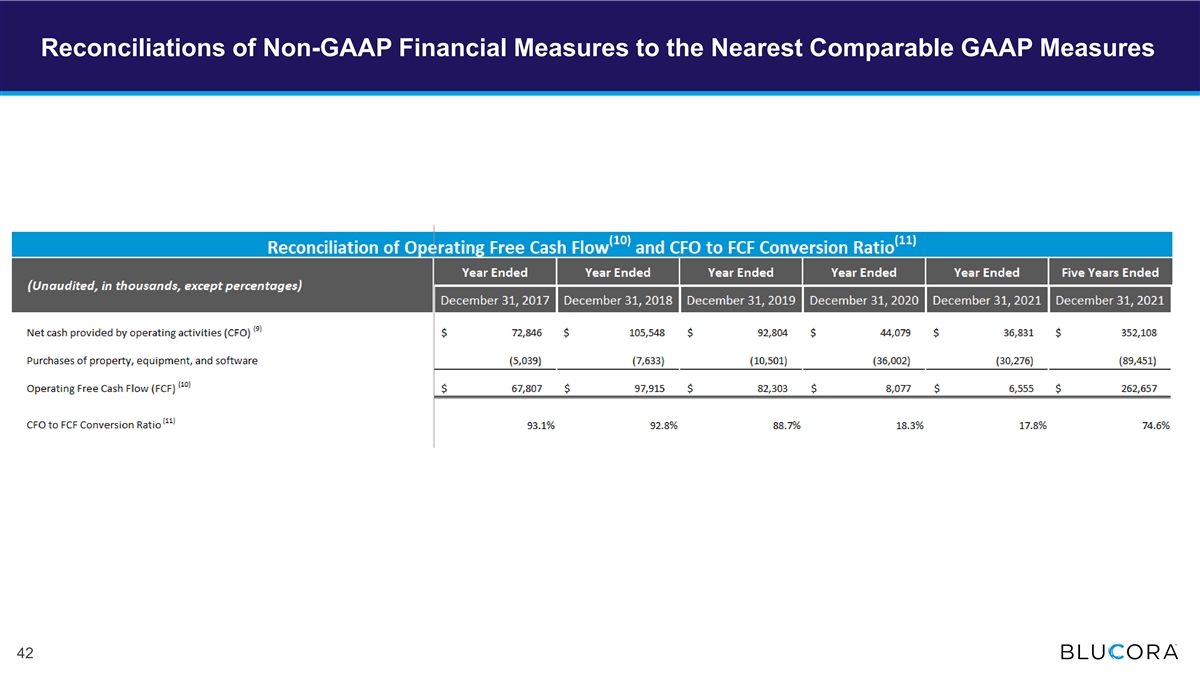
Reconciliations of Non-GAAP Financial Measures to the Nearest Comparable GAAP Measures 42
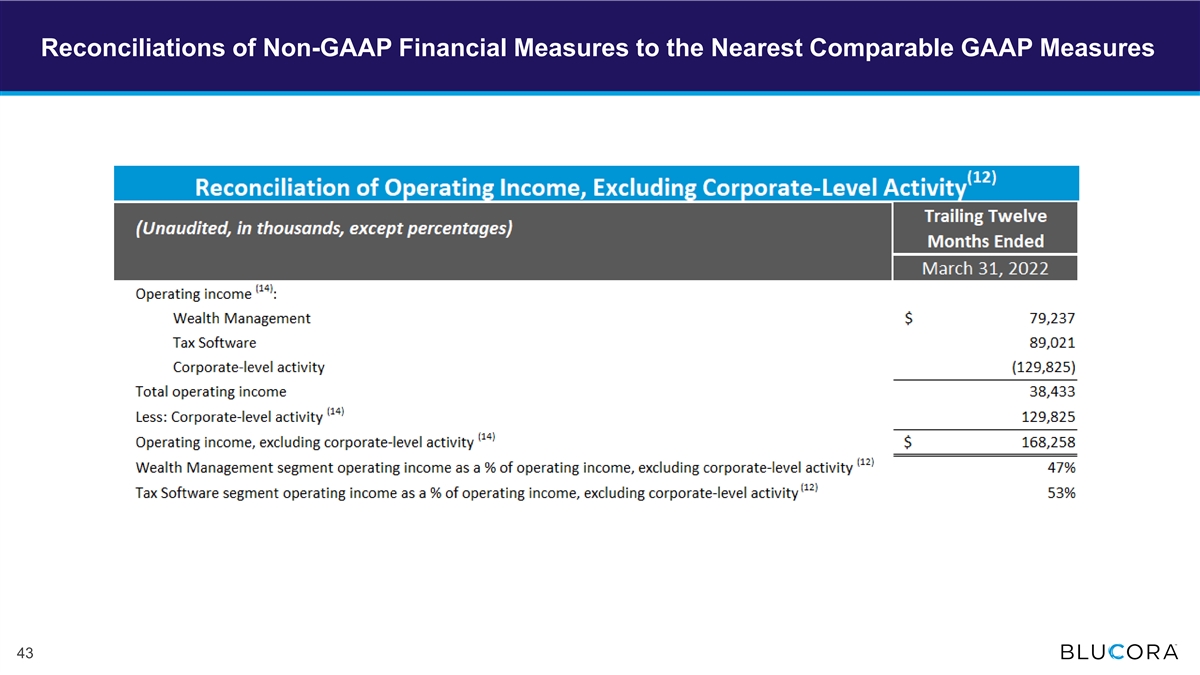
Reconciliations of Non-GAAP Financial Measures to the Nearest Comparable GAAP Measures 43
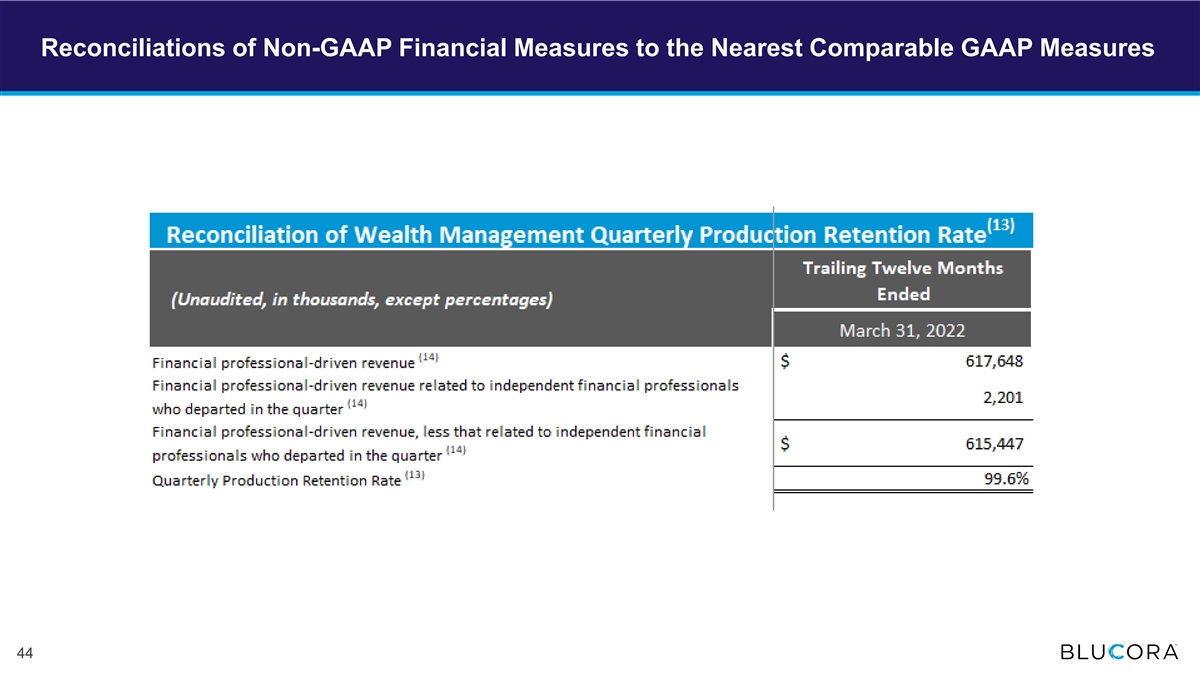
Reconciliations of Non-GAAP Financial Measures to the Nearest Comparable GAAP Measures 44

Reconciliations of Non-GAAP Financial Measures to the Nearest Comparable GAAP Measures 45
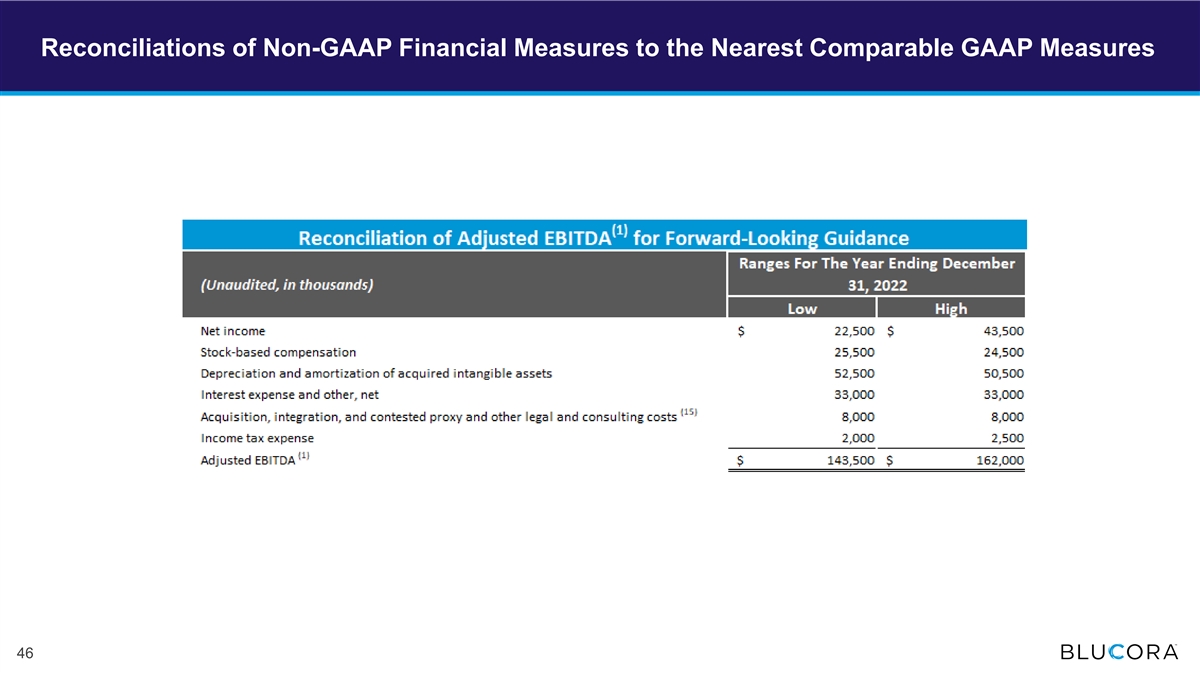
Reconciliations of Non-GAAP Financial Measures to the Nearest Comparable GAAP Measures 46
Notes to Reconciliations of Non-GAAP Financial Measures to the Nearest Comparable GAAP Measures 47

Notes to Reconciliations of Non-GAAP Financial Measures to the Nearest Comparable GAAP Measures (continued) 48
Notes to Reconciliations of Non-GAAP Financial Measures to the Nearest Comparable GAAP Measures (continued) 49