EXHIBIT 99.1

EXHIBIT 99.1
Fourth Quarter 2004 Investor Presentation

Forward-Looking Statements
This presentation contains forward-looking statements relating to the financial condition, results of operations and business of First Place Financial Corp. Actual results could differ materially from those indicated. Among the important factors that could cause actual results to differ materially are interest rates, the success of the integration of acquisitions, changes in the mix of the company’s business, competitive pressures, general economic conditions and the risk factors detailed in the Company’s periodic reports and registration statements filed with the Securities and Exchange Commission. First Place Financial Corp undertakes no obligation to release revisions to these forward-looking statements or reflect events or circumstances after the date of this presentation.
This presentation contains financial information adjusted to exclude the results of certain significant transactions or events not representative of ongoing operations (“non-operating items”). A reconciliation of these non-GAAP disclosures will be filed in a form 8-K.
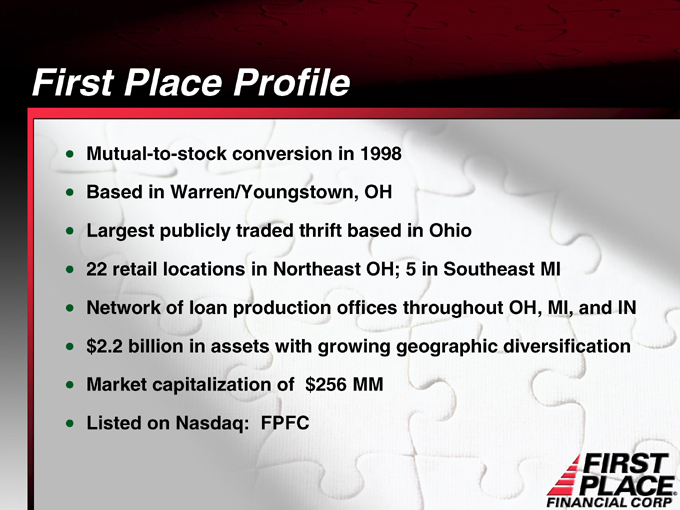
First Place Profile
Mutual-to-stock conversion in 1998
Based in Warren/Youngstown, OH
Largest publicly traded thrift based in Ohio
22 retail locations in Northeast OH; 5 in Southeast MI
Network of loan production offices throughout OH, MI, and IN
$2.2 billion in assets with growing geographic diversification
Market capitalization of $256 MM
Listed on Nasdaq: FPFC
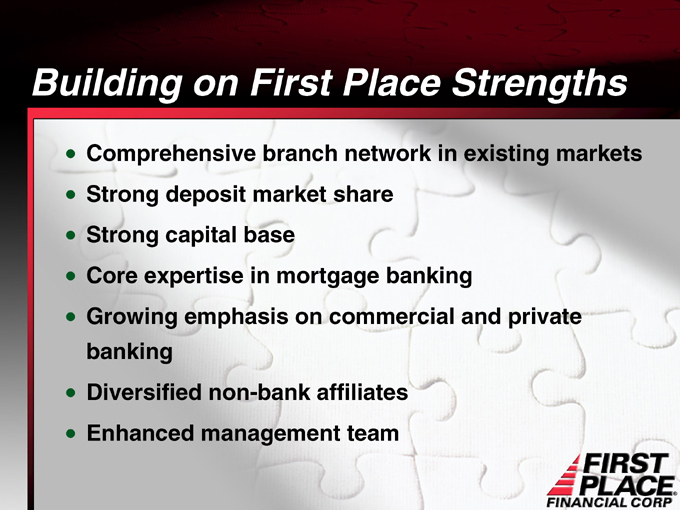
Building on First Place Strengths
Comprehensive branch network in existing markets
Strong deposit market share
Strong capital base
Core expertise in mortgage banking
Growing emphasis on commercial and private
banking
Diversified non-bank affiliates
Enhanced management team
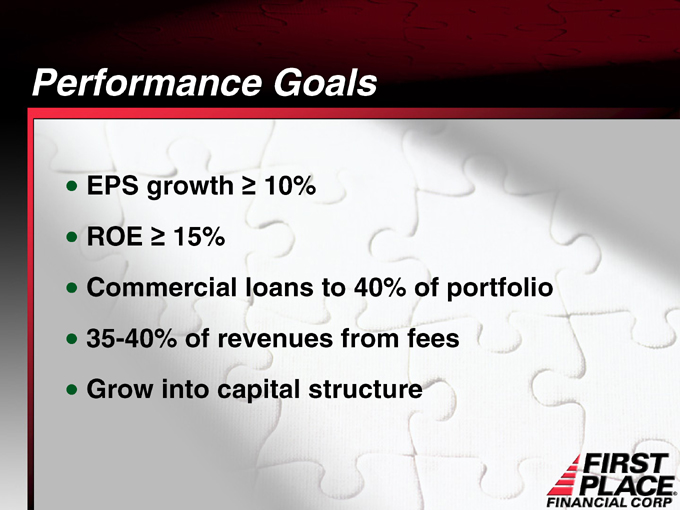
Performance Goals
EPS growth ³ 10%
ROE ³ 15%
Commercial loans to 40% of portfolio
35-40% of revenues from fees
Grow into capital structure

Strategic Plan for:
Growth, Diversification and Balance
~ Complete Transformation to Commercial Bank Profile ~
Strengthen relationship banking
Increase income from fee-based services
Expand geographically through unique bank-within-a-bank concept and strategic acquisitions
Expand commercial loan and deposit customer base to diversify assets and increase funding alternatives
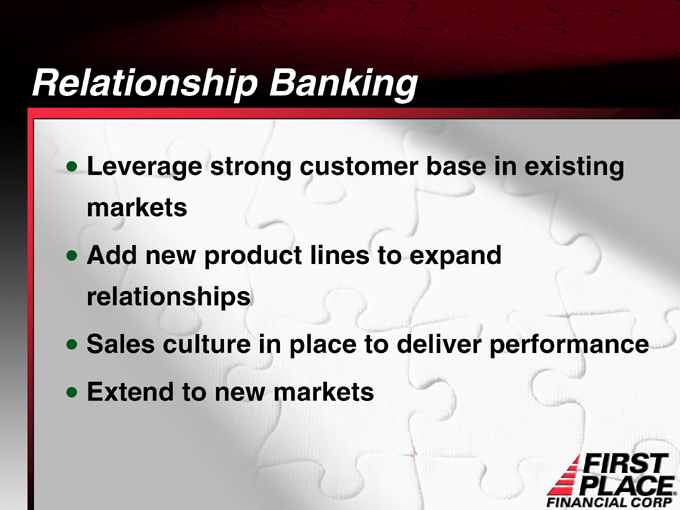
Relationship Banking
Leverage strong customer base in existing markets
Add new product lines to expand relationships
Sales culture in place to deliver performance
Extend to new markets

Strategic Acquisitions
Criteria:
Midwest growth markets
Composition of the balance sheet
Accretion
Human capital
Three acquisitions in five years:
FPFC + Ravenna Savings in May 2000; FFY in Dec. 2000; Franklin in May 2004
Building a financial services company
APB Financial Group, Ltd.
Coldwell Banker First Place Real Estate
Title Works Agency, LLC
First Place Insurance Agency
Building a commercial bank:
Product and services infrastructure established
Franklin Bank acquired in May 2004
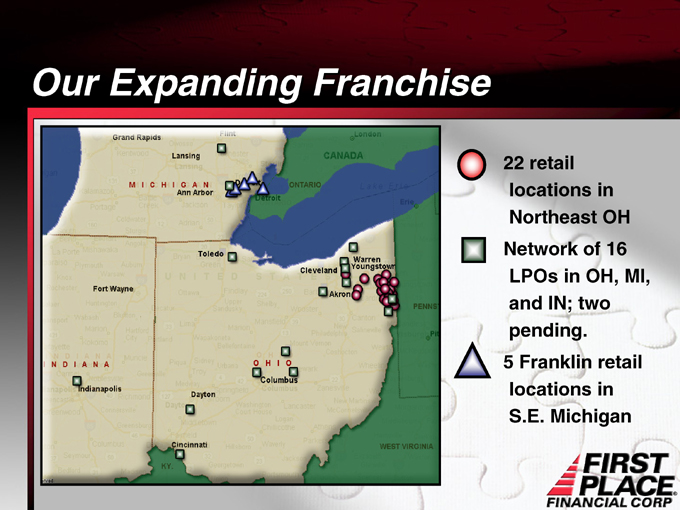
Our Expanding Franchise
22 retail locations in Northeast OH
Network of 16 LPOs in OH, MI, and IN; two pending.
5 Franklin retail locations in S.E. Michigan
Franklin Acquisition: A Value-Added Transaction
Provides geographic diversification
Substantial shift to a more commercial loan and deposit mix
Opportunity to cross-sell FPFC’s non-bank financial products
Estimated cost savings of $4.3 million
EPS accretive in first year
Franklin Acquisition:
Entrance Into a Growth Market
Access to one of the premier markets for high net worth
customers, demographic growth and business starts
Located in Oakland County, with highest per capita income in Michigan
#1 job producing area in Michigan
38% of Fortune 500 companies do business in Oakland County
Industry mix favors service (39%) and non-manufacturing (42%)
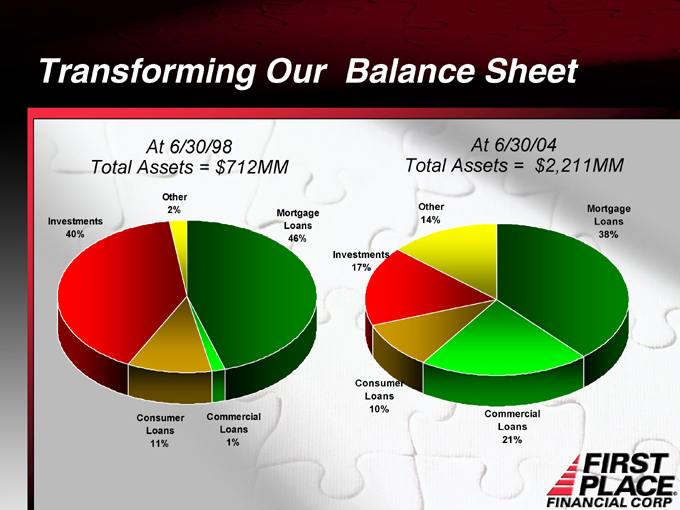
Transforming Our Balance Sheet
At 6/30/98 Total Assets = $712MM
Other 2%
Mortgage Loans 46%
Commercial Loans 1%
Consumer Loans 11%
Investments 40%
At 6/30/04 Total Assets = $2,211MM
Other 14%
Mortgage Loans 38%
Commercial Loans 21%
Consumer Loans 10%
Investments 17%
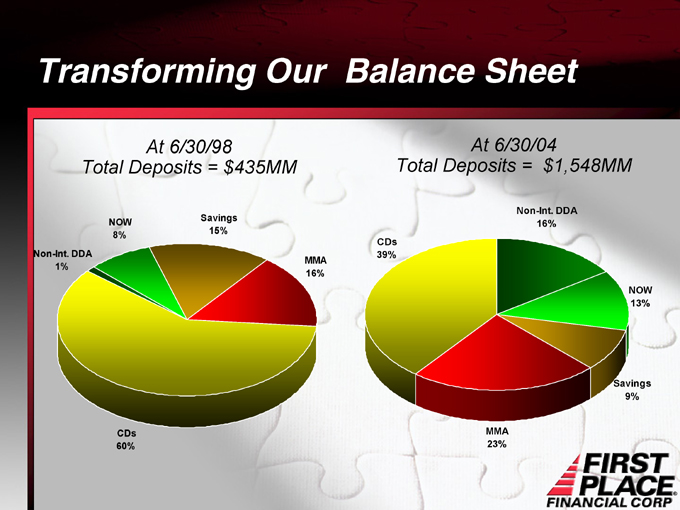
Transforming Our Balance Sheet
At 6/30/98 Total Deposits = $435MM
Savings 15%
MMA 16%
CDs 60%
Non-Int. DDA
1%
NOW 8%
At 6/30/04
Total Deposits = $1,548MM
Non-Int. DDA
16%
NOW 13%
Savings 9%
MMA 23%
CDs 39%
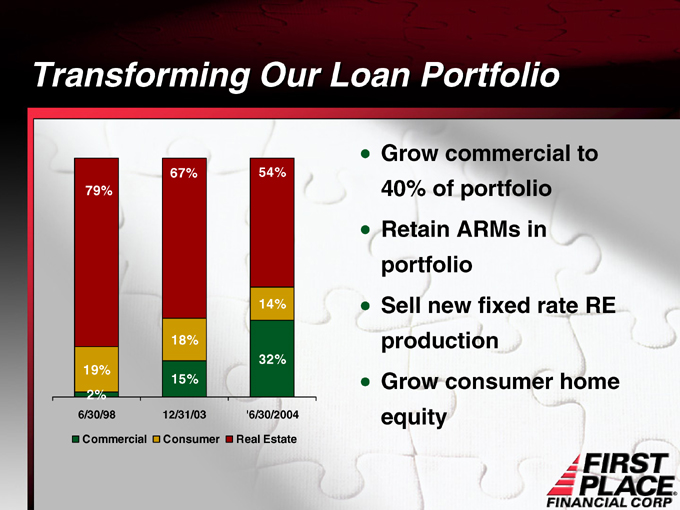
Transforming Our Loan Portfolio
Commercial Consumer Real Estate
79%
19% 2%
6/30/98
67%
18%
15%
12/31/03
54%
14%
32%
’6/30/2004
Grow commercial to 40% of portfolio
Retain ARMs in portfolio
Sell new fixed rate RE production
Grow consumer home equity
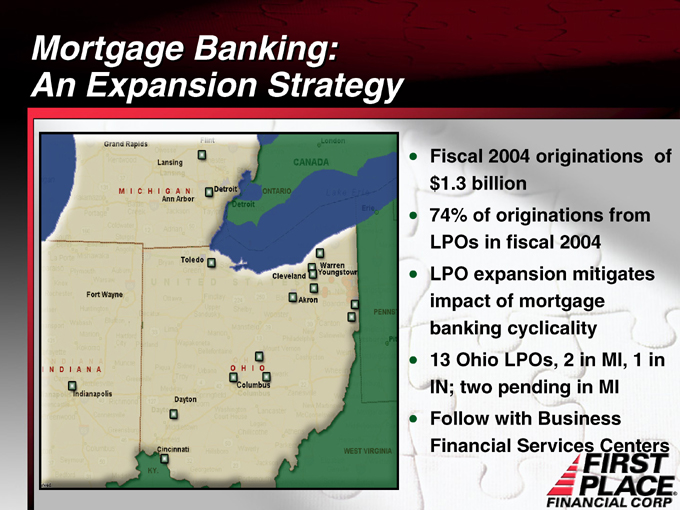
Mortgage Banking: An Expansion Strategy
Fiscal 2004 originations of $1.3 billion
74% of originations from LPOs in fiscal 2004
LPO expansion mitigates impact of mortgage banking cyclicality
13 Ohio LPOs, 2 in MI, 1 in IN; two pending in MI
Follow with Business Financial Services Centers
Business Financial Centers
Identify strong MSAs
Solon office opened in November, 2003
Bank-within-a-bank concept
Focuses on high net worth individuals, business owners, professionals
Team approach to meeting complex banking needs

Financial Performance
Delivering Strong Performance
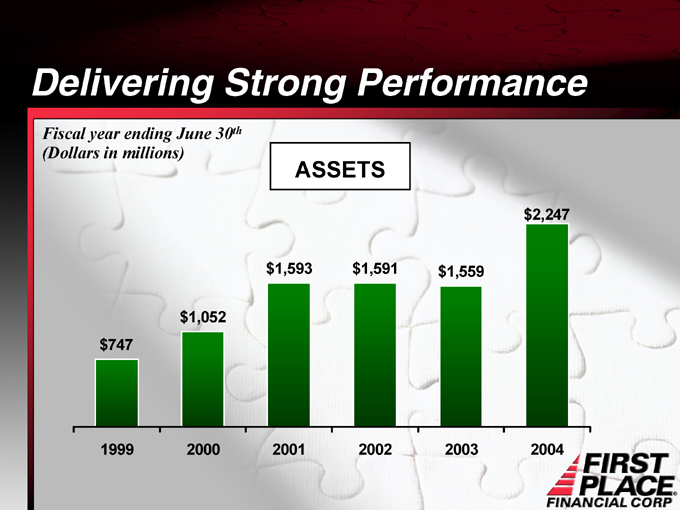
Fiscal year ending June 30th (Dollars in millions)
ASSETS
1999 $747
2000 $1,052
2001 $1,593
2002 $1,591
2003 $1,559
2004 $2,247
Delivering Strong Performance
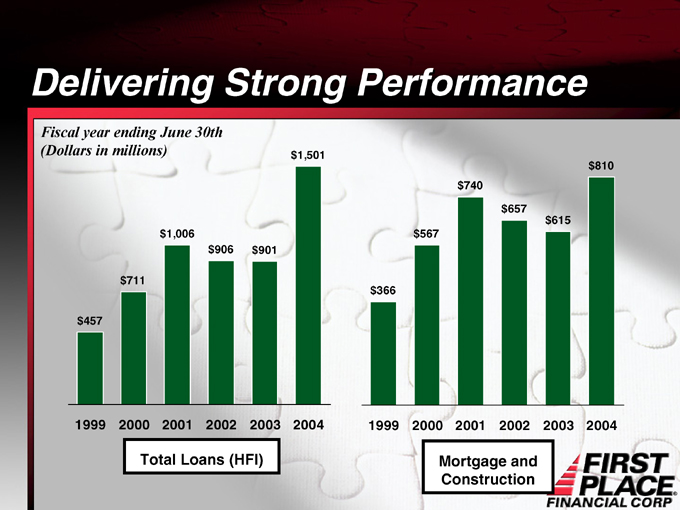
Fiscal year ending June 30th (Dollars in millions)
$457
$711
$1,006
$906
$901
$1,501
1999 2000 2001 2002 2003 2004
Total Loans (HFI)
$366
$567
$740
$657
$615
$810
1999 2000 2001 2002 2003 2004
Mortgage and Construction
Delivering Strong Performance
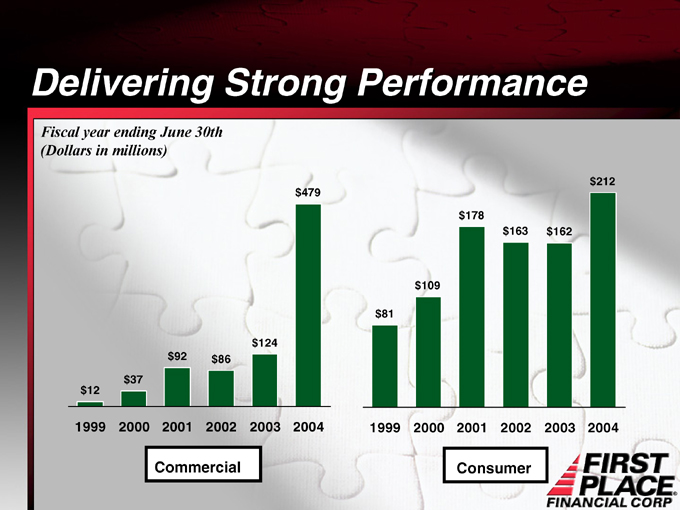
Fiscal year ending June 30th (Dollars in millions)
$479
$124
$92
$86
$37
$12
Commercial
1999 2000 2001 2002 2003 2004
$212
$178
$163
$162
$109
$81
1999 2000 2001 2002 2003 2004
Consumer
Delivering Strong Performance
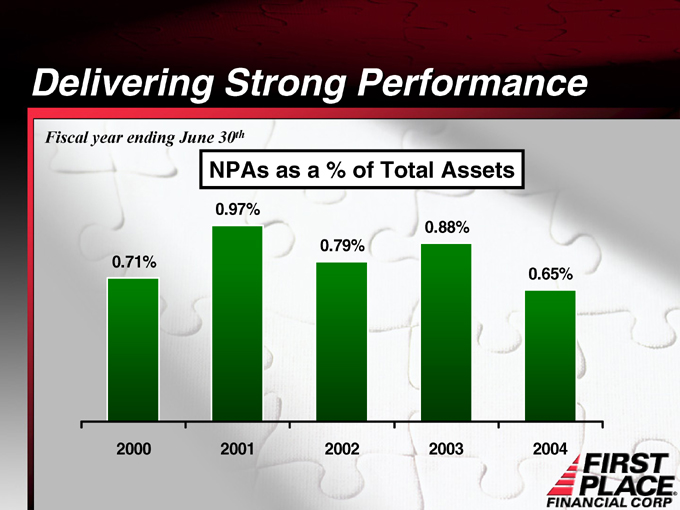
Fiscal year ending June 30th
NPAs as a % of Total Assets
0.97%
0.88%
0.79%
0.71%
0.65%
2000 2001 2002 2003 2004
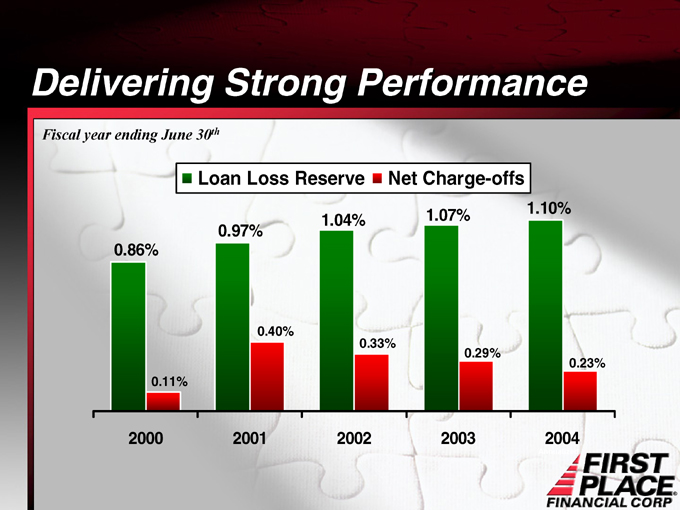
Delivering Strong Performance
Fiscal year ending June 30th
Loan Loss Reserve Net Charge-offs
1.07% 1.10%
1.04%
0.97%
0.86%
0.40%
0.33%
0.29%
0.23%
0.11%
2000 2001 2002 2003 2004
Annualized
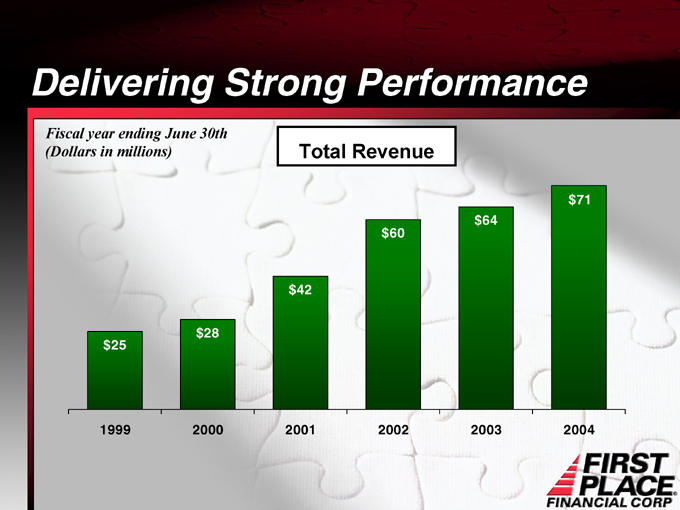
Delivering Strong Performance
Fiscal year ending June 30th (Dollars in millions)
Total Revenue
$71
$64
$60
$42
$28
$25
1999 2000 2001 2002 2003 2004
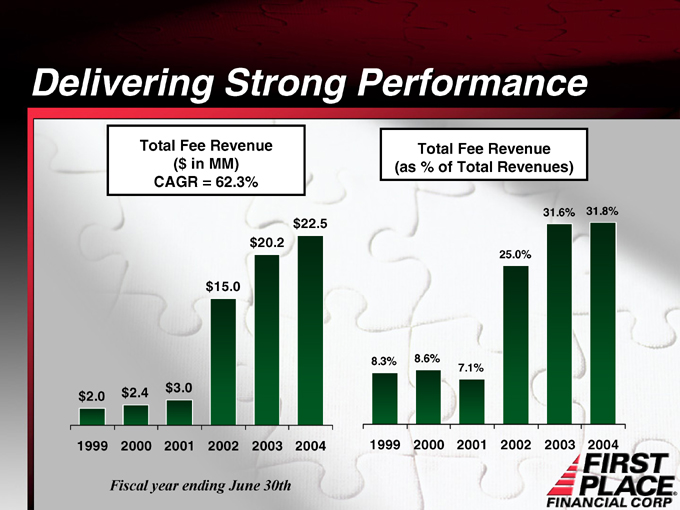
Delivering Strong Performance
Total Fee Revenue ($ in MM) CAGR = 62.3%
$22.5
$20.2
$15.0
$2.4 $3.0
$2.0
1999 2000 2001 2002 2003 2004
Fiscal year ending June 30th
Total Fee Revenue (as % of Total Revenues)
31.6% 31.8%
25.0%
8.3% 8.6%
7.1%
1999 2000 2001 2002 2003 2004
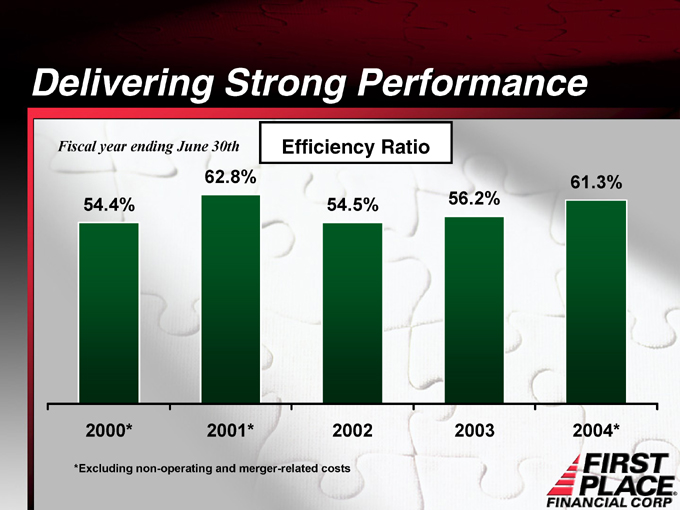
Delivering Strong Performance
Fiscal year ending June 30th
Efficiency Ratio
62.8% 61.3%
54.4% 54.5% 56.2%
2000* 2001* 2002 2003 2004*
*Excluding non-operating and merger-related costs
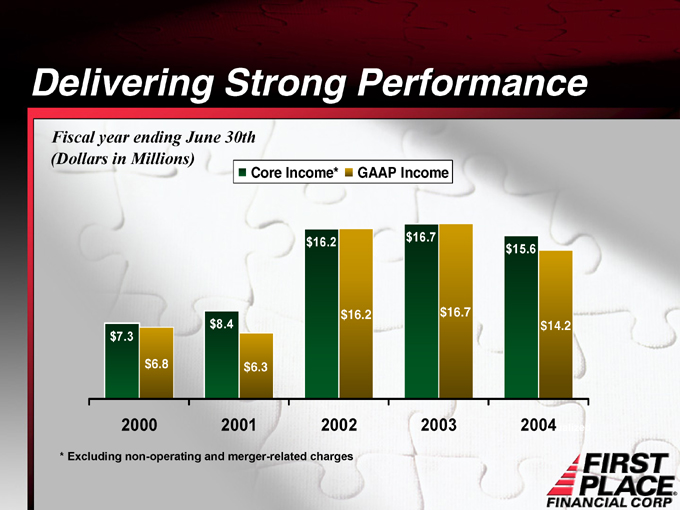
Delivering Strong Performance
Fiscal year ending June 30th (Dollars in Millions)
Core Income* GAAP Income
$16.2 $16.7
$15.6
$16.2 $16.7
$8.4 $14.2
$7.3
$6.8 $6.3
2000 2001 2002 2003 2004
Annualized
* Excluding non-operating and merger-related charges
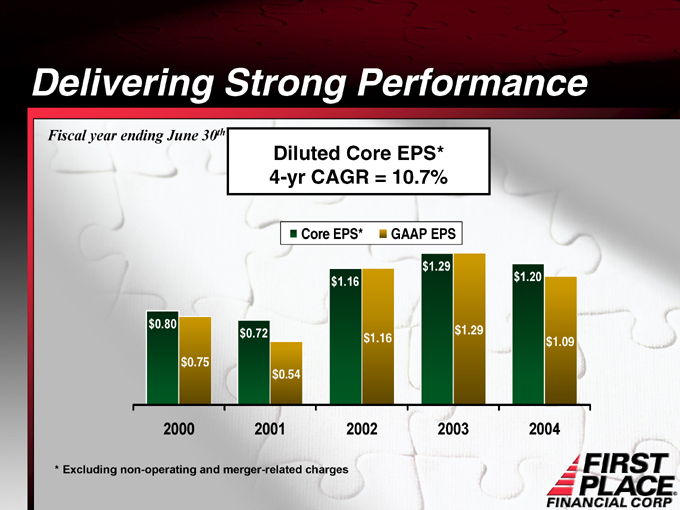
Delivering Strong Performance
Fiscal year ending June 30th
Diluted Core EPS* 4-yr CAGR = 10.7%
Core EPS* GAAP EPS
$1.29
$1.16 $1.20
$0.80 $1.29
$0.72 $1.16
$1.09
$0.75
$0.54
2000 2001 2002 2003 2004
* Excluding non-operating and merger-related charges
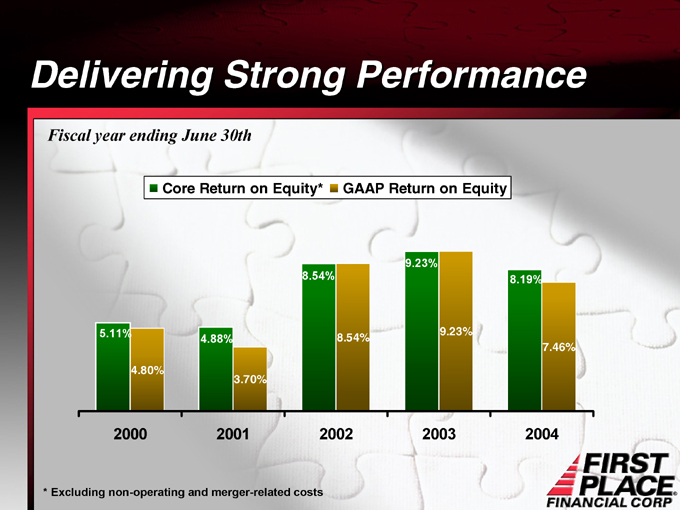
Delivering Strong Performance
Fiscal year ending June 30th
Core Return on Equity* GAAP Return on Equity
9.23%
8.54% 8.19%
5.11% 9.23%
4.88% 8.54%
7.46%
4.80%
3.70%
2000 2001 2002 2003 2004
* Excluding non-operating and merger-related costs
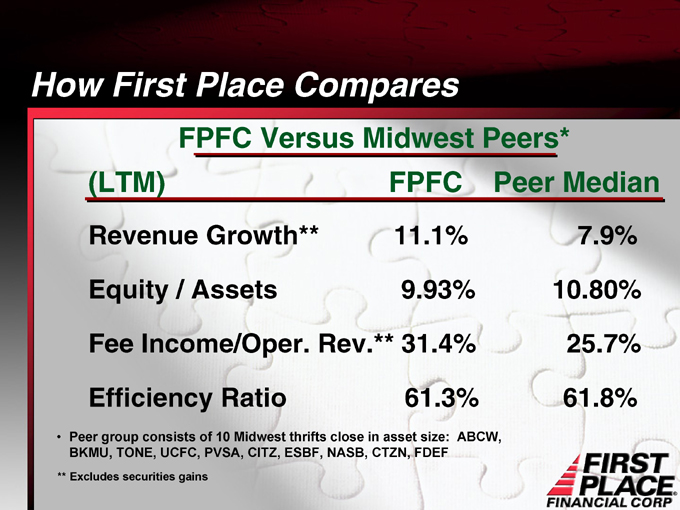
How First Place Compares
FPFC Versus Midwest Peers*
(LTM) FPFC Peer Median
Revenue Growth** 11.1% 7.9%
Equity / Assets 9.93% 10.80%
Fee Income/Oper. Rev.** 31.4% 25.7%
Efficiency Ratio 61.3% 61.8%
• Peer group consists of 10 Midwest thrifts close in asset size: ABCW, BKMU, TONE, UCFC, PVSA, CITZ, ESBF, NASB, CTZN, FDEF
** Excludes securities gains
Key Investment Appeals
Transitioning to commercial bank portfolio
Expanding into new markets and business lines
Strong mortgage banking expertise with
significant market share
Capital base to support diversification and growth
Proven merger experience
Unique organic growth model (Bank within a Bank)
Achieve Our Objectives