Exhibit 99.1

Welcome

First Place Finishes
Welcome:

Hello Columbus!
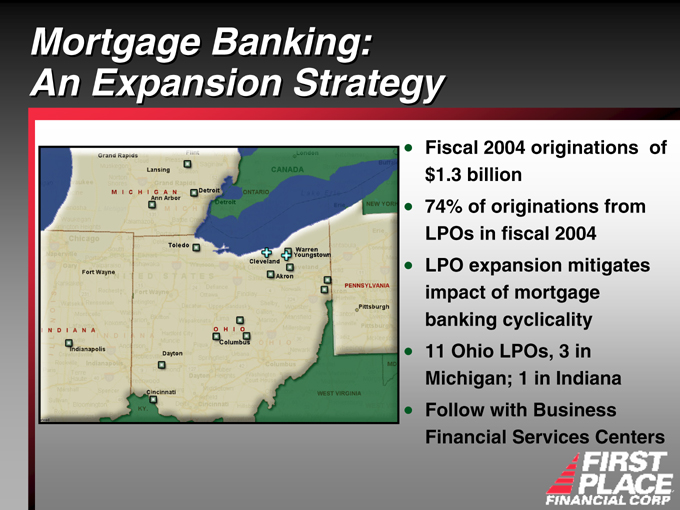
Mortgage Banking: An Expansion Strategy
Fiscal 2004 originations of $1.3 billion
74% of originations from LPOs in fiscal 2004
LPO expansion mitigates impact of mortgage banking cyclicality
11 Ohio LPOs, 3 in Michigan; 1 in Indiana
Follow with Business Financial Services Centers

A New Brand of Banking
Solon Financial Center

Building on a Successful Concept
North Olmsted Financial Center

North Olmsted Financial Center
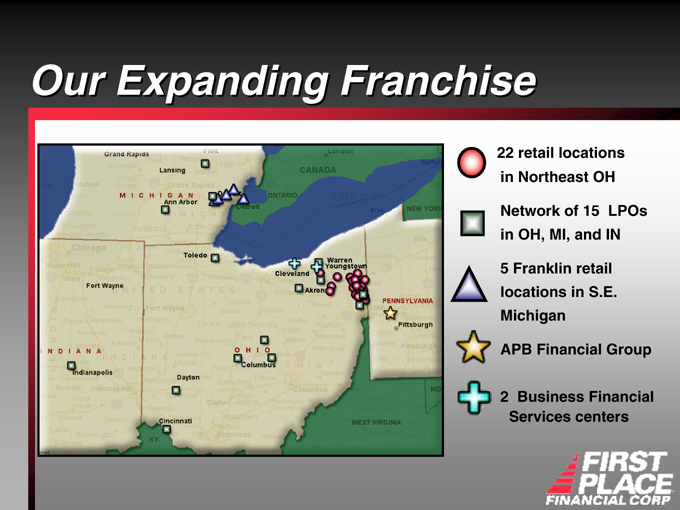
Our Expanding Franchise
22 retail locations in Northeast OH
Network of 15 LPOs in OH, MI, and IN
5 Franklin retail locations in S.E. Michigan
APB Financial Group
2 Business Financial Services centers

Private Client Services
The customized deposit & credit solutions
Individual asset management
Personal trust services
Insurance solutions
Financial planning

Welcome
Weigel Lackey and Ross Insurance Agency

First Place is our Community’s Bank

Financial Performance
Forward-Looking Statements
This presentation contains forward-looking statements relating to the financial condition, results of operations and business of First Place Financial Corp. Actual results could differ materially from those indicated. Among the important factors that could cause actual results to differ materially are interest rates, the success of the integration of acquisitions, changes in the mix of the company’s business, competitive pressures, general economic conditions and the risk factors detailed in the Company’s periodic reports and registration statements filed with the Securities and Exchange Commission. First Place Financial Corp undertakes no obligation to release revisions to these forward-looking statements or reflect events or circumstances after the date of this presentation.
This presentation contains financial information adjusted to exclude the results of certain significant transactions or events not representative of ongoing operations (“non-operating items”). A reconciliation of these non-GAAP disclosures will be filed in a form 8-K.
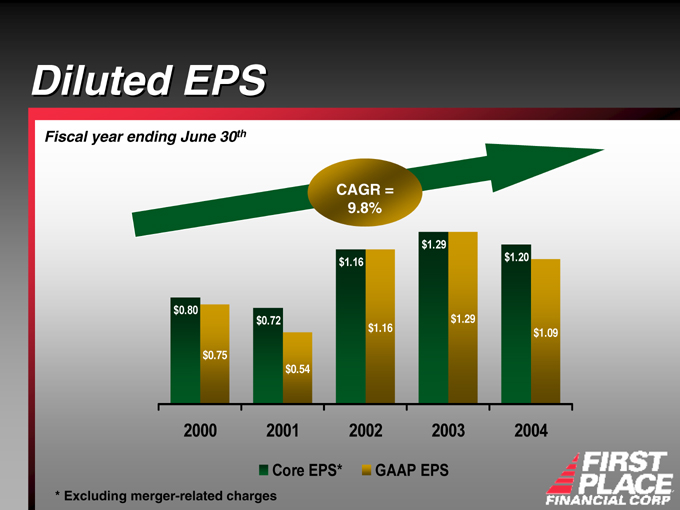
Diluted EPS
Fiscal year ending June 30th
CAGR = 9.8%
2000 2001 2002 2003 2004
Core EPS* GAAP EPS $0.80 $0.75 $0.72 $0.54 $1.16 $1.16 $1.29 $1.29 $1.20 $1.09
* Excluding merger-related charges
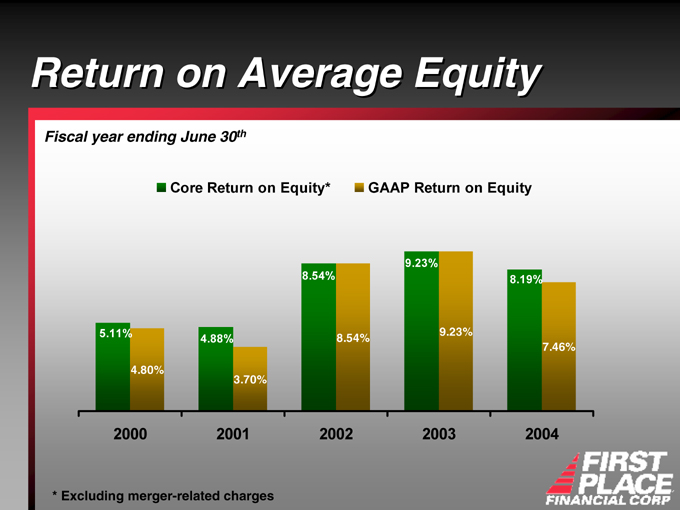
Return on Average Equity
Fiscal year ending June 30th
Core Return on Equity* GAAP Return on Equity
2000 2001 2002 2003 2004
* Excluding merger-related charges
5.11%
4.80%
4.88%
3.70%
8.54%
8.54%
9.23%
9.23%
8.19%
7.46%
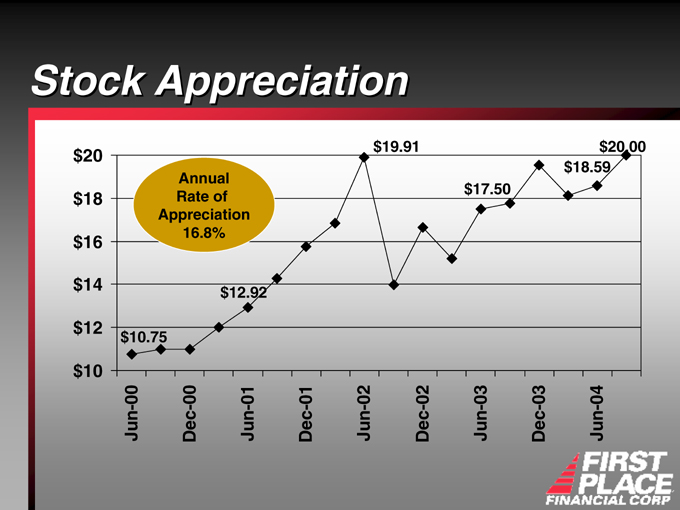
Stock Appreciation
$20 $18 $16 $14 $12 $10
Jun-00
Dec-00
Jun-01
Dec-01
Jun-02
Dec-02
Jun-03
Dec-03
Jun-04
$10.75 $12.92 $19.91 $17.50 $18.59 $20.00
Annual Rate of Appreciation 16.8%
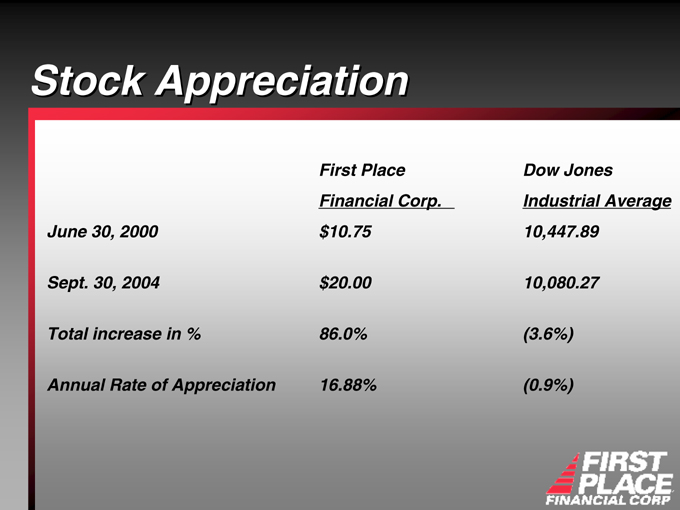
Stock Appreciation
First Place Financial Corp. Dow Jones Industrial Average
June 30, 2000 $ 10.75 10,447.89
Sept. 30, 2004 $ 20.00 10,080.27
Total increase in % 86.0% (3.6%)
Annual Rate of Appreciation 16.88% (0.9%)
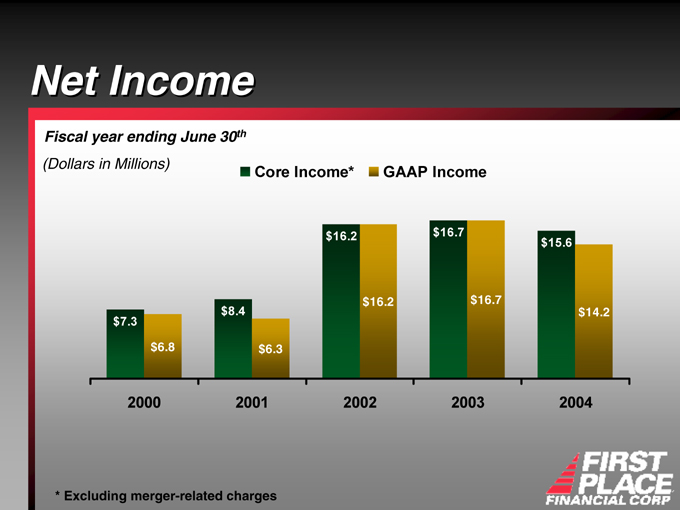
Net Income
Fiscal year ending June 30th
(Dollars in Millions)
Core Income* GAAP Income
$7.3 $6.8 $8.4 $6.3 $16.2 $16.2 $16.7 $16.7 $15.6 $14.2
2000 2001 2002 2003 2004
* Excluding merger-related charges
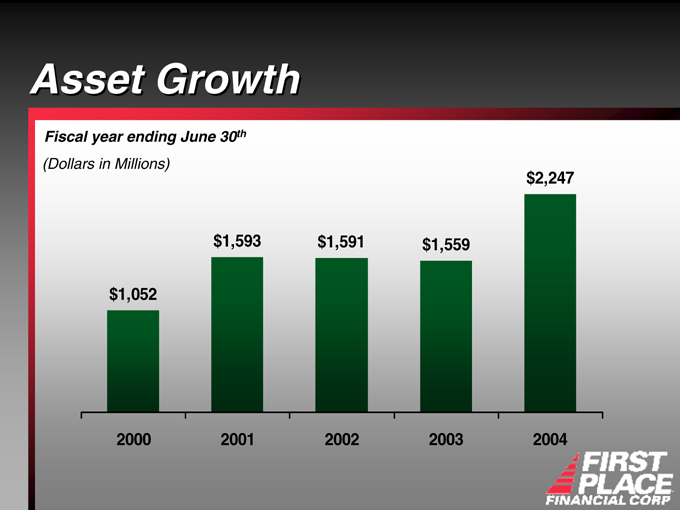
Asset Growth
Fiscal year ending June 30th
(Dollars in Millions)
$1,052 $1,593 $1,591 $1,559 $2,247
2000 2001 2002 2003 2004
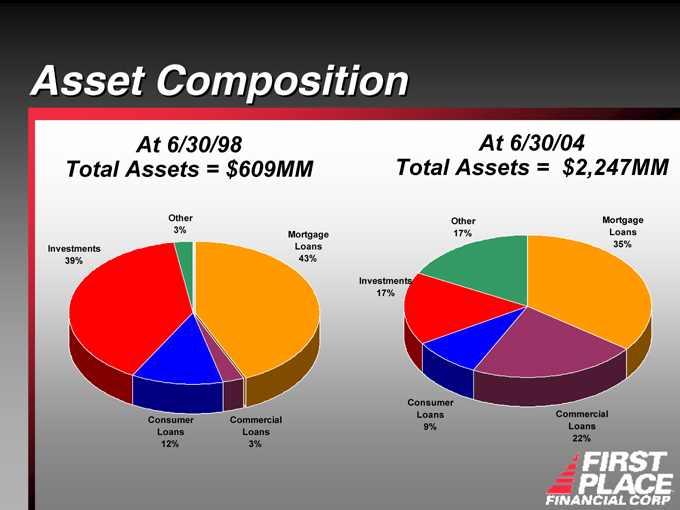
Asset Composition
At 6/30/98 Total Assets = $609MM
At 6/30/04 Total Assets = $2,247MM
Investments 39%
Other 3%
Mortgage Loans 43%
Commercial Loans 3%
Consumer Loans 12%
Investments 17%
Other 17%
Mortgage Loans 35%
Consumer Loans 9%
Commercial Loans 22%
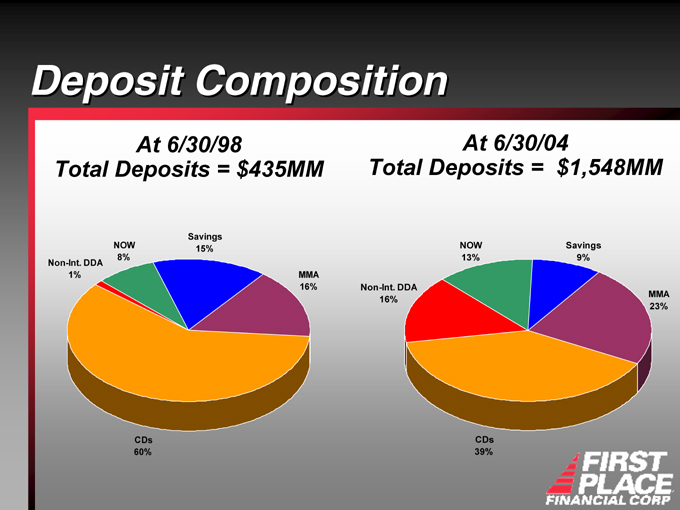
Deposit Composition
At 6/30/98 Total Deposits = $435MM
At 6/30/04
Total Deposits = $1,548MM
Non-Int. DDA 1%
NOW 8%
Savings 15%
MMA 16%
CDs 60%
Non-Int. DDA 16%
NOW 13%
Savings 9%
MMA 23%
CDs 39%
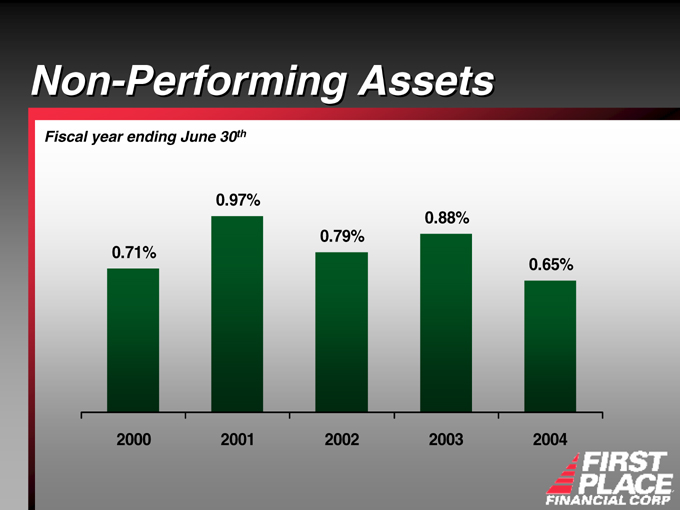
Non-Performing Assets
Fiscal year ending June 30th
2000 2001 2002 2003 2004
0.71%
0.97%
0.79%
0.88%
0.65%
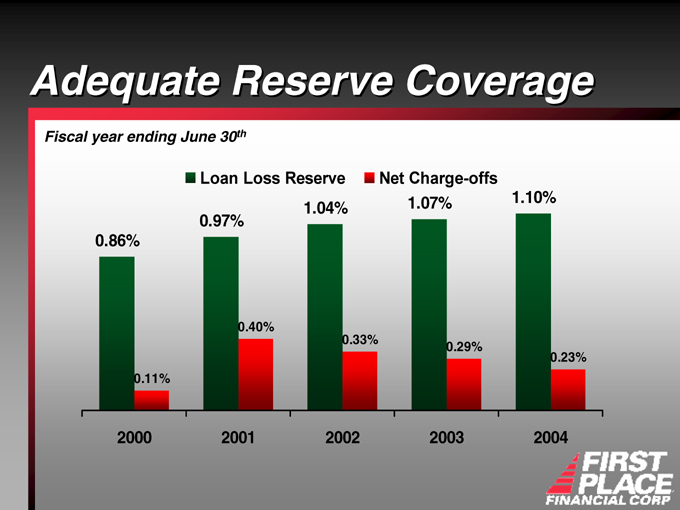
Adequate Reserve Coverage
Fiscal year ending June 30th
Loan Loss Reserve Net Charge-offs
0.86%
0.11%
0.97%
0.40%
1.04%
0.33%
1.07%
0.29%
1.10%
0.23%
2000
2001
2002
2003
2004
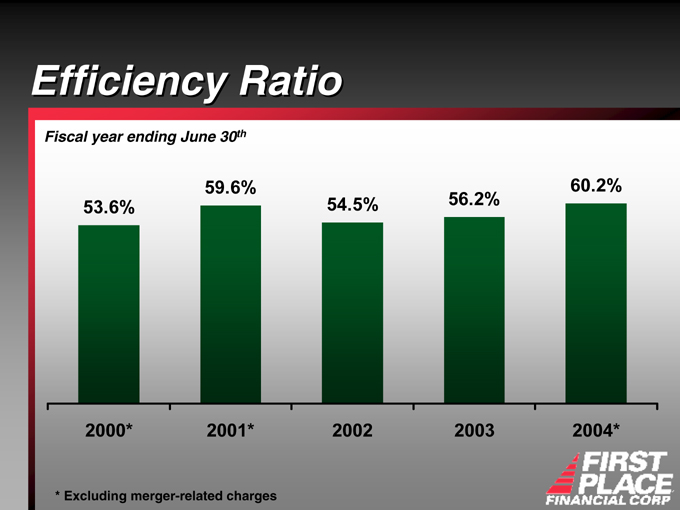
Efficiency Ratio
Fiscal year ending June 30th
2000* 2001* 2002 2003 2004*
* Excluding merger-related charges
53.6%
59.6%
54.5%
56.2%
60.2%
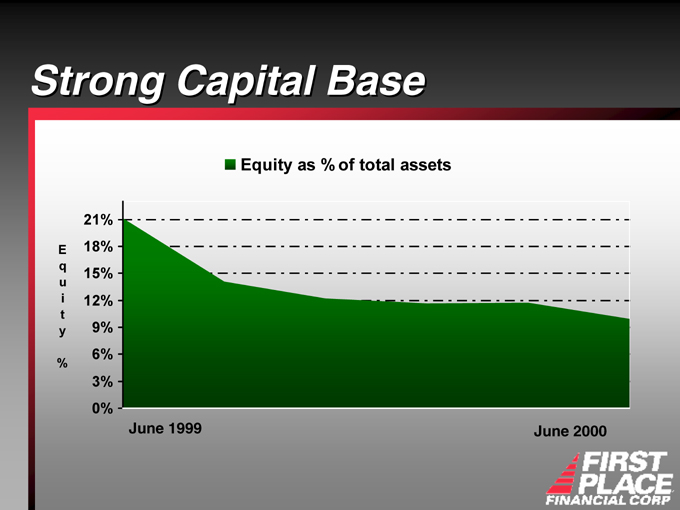
Strong Capital Base
Equity as % of total assets
Equity %
21% 18% 15% 12% 9% 6% 3% 0%
June 1999
June 2000

Fiscal 2005 First Quarter Results
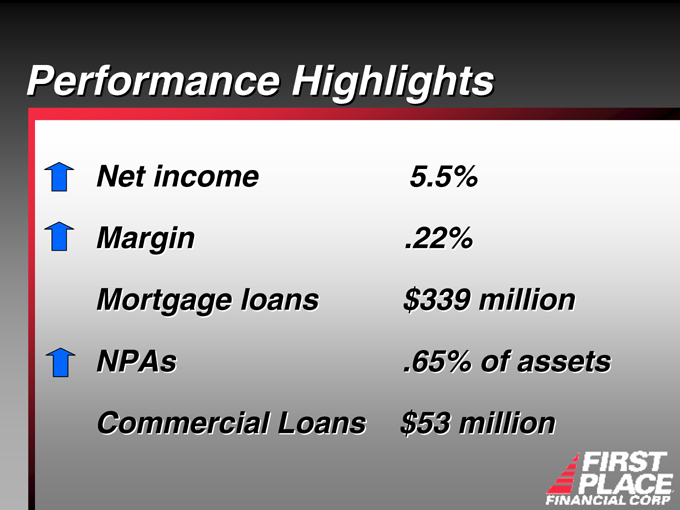
Performance Highlights
Net income 5.5%
Margin .22%
Mortgage loans $339 million
NPAs .65% of assets
Commercial Loans $53 million
Challenges & Strategies
Demographic Shifts
Efficiency
Sarbanes Oxley
Funding

Key Investment Appeals
Transitioning to commercial bank portfolio Expanding into new markets and business lines Strong mortgage banking expertise Capital base to support diversification and growth Proven merger experience Management Team
Achieve Our Objectives

Thank you!
George Gentithes and Jeff Francis

Thank You