Exhibit 99.2

KBW 6th Annual Community Bank Investors Conference July 25-27, 2005
Steven R. Lewis – Chief Executive Officer Paul S. Musgrove – Chief Financial Officer
Forward-looking Statements
When used in this presentation, or future presentations or other public or shareholder communications, in filings by First Place Financial Corp. (the Company) with the Securities and Exchange Commission, or in oral statements made with the approval of an authorized executive officer, the words or phrases “will likely result,” “are expected to,” “will continue,” “is anticipated,” “estimate,” “project” or similar expressions are intended to identify “forward-looking statements” within the meaning of the Private Securities Litigation Reform Act of 1995. Such forward-looking statements involve known and unknown risks, uncertainties and other factors, which may cause the Company’s actual results to be materially different from those indicated. Such statements are subject to certain risks and uncertainties including changes in economic conditions in the market areas the Company conducts business, which could materially impact credit quality trends, changes in laws, regulations or policies of regulatory agencies, fluctuations in interest rates, demand for loans in the market areas the Company conducts business, and competition, that could cause actual results to differ materially from historical earnings and those presently anticipated or projected. The Company wishes to caution readers not to place undue reliance on any such forward-looking statements, which speak only as of the date made. The Company undertakes no obligation to publicly release the result of any revisions that may be made to any forward-looking statements to reflect events or circumstances after the date of such statements or to reflect the occurrence of anticipated or unanticipated events.
Explanation Of Certain Non-GAAP Measures
This presentation contains certain financial information determined by methods other than with Generally Accepted Accounting Principles (GAAP). Specifically, we have provided financial measures which are based on core earnings rather than net income. Ratios and other financial measures with the word “core” in their title were computed using core earnings rather than net income. Core earnings excludes merger, integration and restructuring expense; extraordinary income or expense; income or expense from discontinued operations; and income, expense, gains and losses that are not reflective of ongoing operations or that we do not expect to reoccur. We believe that this information is useful to both investors and to management and can aid them in understanding the Company’s current performance, performance trends and financial condition. While core earnings can be useful in evaluating current performance and projecting current trends into the future, we do not believe that core earnings are a substitute for GAAP net income. We encourage investors and others to use core earnings as a supplemental tool for analysis and not as a substitute for GAAP net income. Our non-GAAP measures may not be comparable to the non-GAAP measures of other companies. In addition, future results of operations may include nonrecurring items that would not be included in core earnings. A reconciliation from GAAP net income to the non-GAAP measure of core earnings is shown in the Appendix to this presentation.
First Place Corporate Profile $2.5 billion in assets $300 million market cap
Four state market: Ohio, Michigan, Pennsylvania & Indiana with:
26 branches 15 loan offices
2 business financial centers
Market share leader in primary markets
Diversified bank: commercial, retail, consumer, insurance, wealth management, and real estate
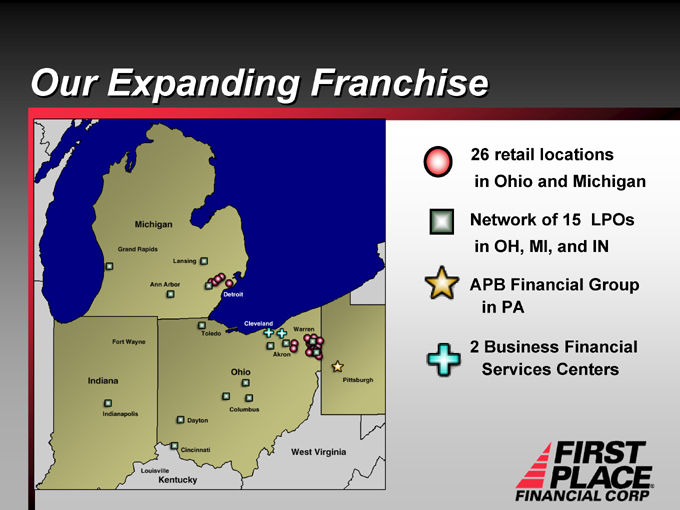
Our Expanding Franchise
26 retail locations in Ohio and Michigan
Network of 15 LPOs in OH, MI, and IN
APB Financial Group in PA
2 Business Financial Services Centers
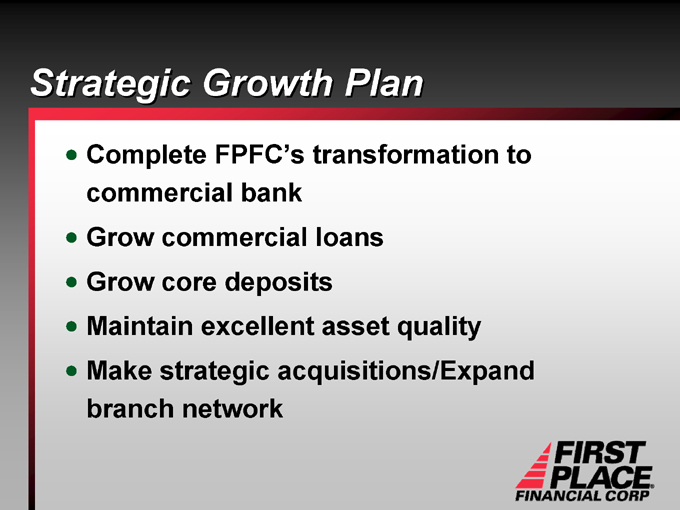
Strategic Growth Plan
Complete FPFC’s transformation to commercial bank Grow commercial loans Grow core deposits Maintain excellent asset quality Make strategic acquisitions/Expand branch network
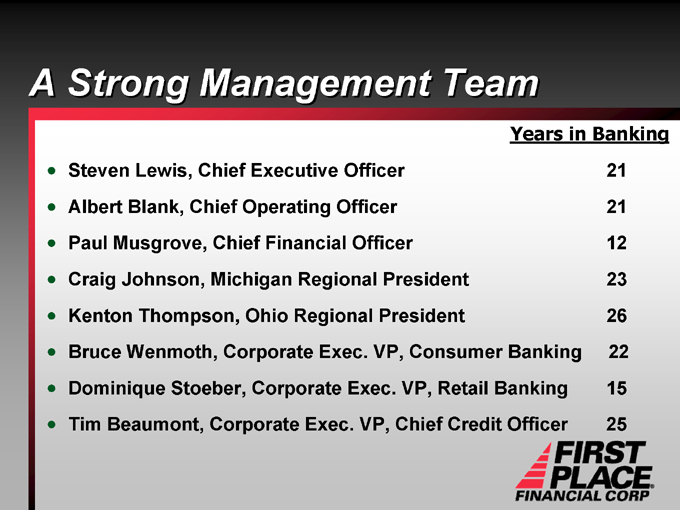
A Strong Management Team
Years in Banking
Steven Lewis, Chief Executive Officer 21
Albert Blank, Chief Operating Officer 21
Paul Musgrove, Chief Financial Officer 12
Craig Johnson, Michigan Regional President 23
Kenton Thompson, Ohio Regional President 26
Bruce Wenmoth, Corporate Exec. VP, Consumer Banking 22
Dominique Stoeber, Corporate Exec. VP, Retail Banking 15
Tim Beaumont, Corporate Exec. VP, Chief Credit Officer 25
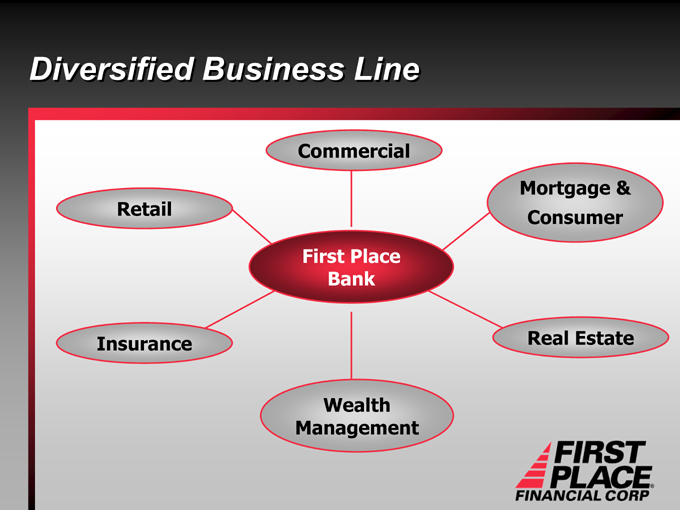
Diversified Business Line
Commercial
Mortgage & Consumer
Real Estate
Wealth Management
Insurance
Retail
First Place Bank
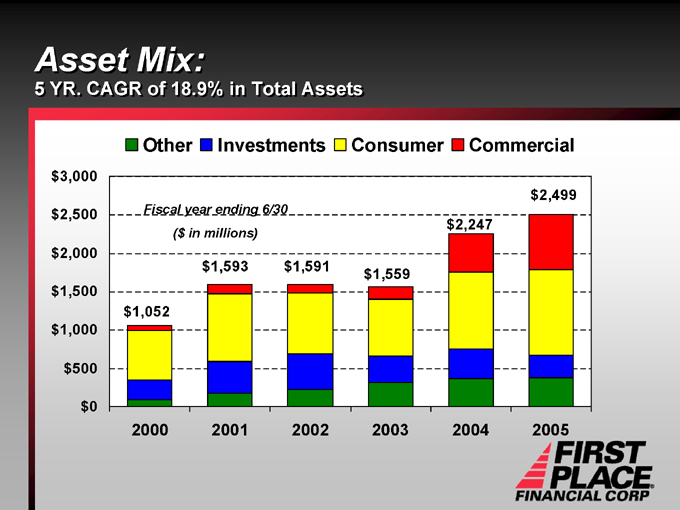
Asset Mix:
5 YR. CAGR of 18.9% in Total Assets . .
Other
Investments
Consumer
Commercial $3,000 $2,500 $2,000 $1,500 $1,000 $500 $0
Fiscal year ending 6/30
($ in millions) $1,052 $1,593 $1,591 $1,559 $2,247 $2,499
2000 2001 2002 2003 2004 2005
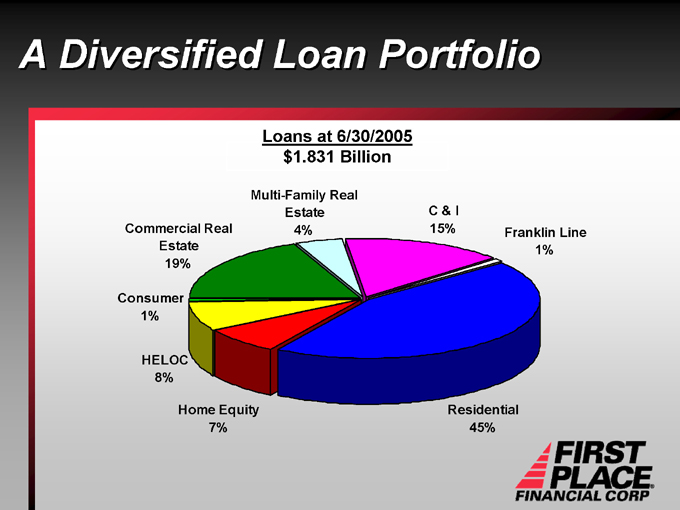
A Diversified Loan Portfolio
Loans at 6/30/2005 $1.831 Billion
Franklin Line 1%
C & I 15%
Multi-Family Real Estate 4%
Commercial Real Estate 19%
Consumer 1%
HELOC
8%
Home Equity 7%
Residential 45%
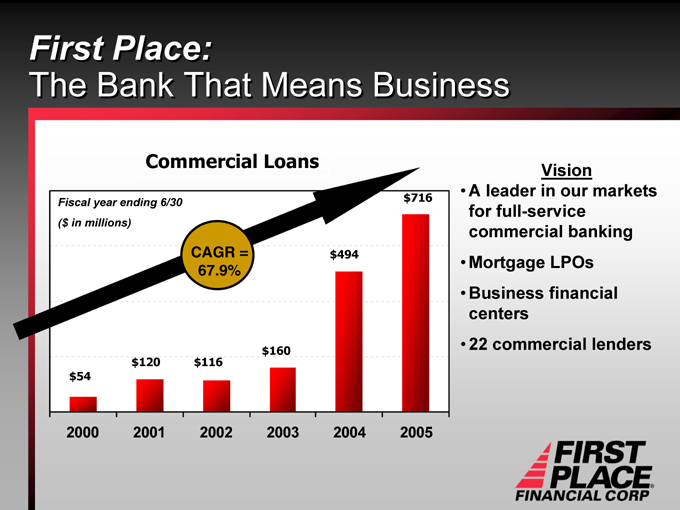
First Place:
The Bank That Means Business
Commercial Loans
Fiscal year ending 6/30 ($ in millions)
CAGR = 67.9% $716 $494 $508 $160 $116 $120 $54
2000 2001 2002 2003 2004 2005
Vision A leader in our markets for full-service commercial banking Mortgage LPOs Business financial centers 22 commercial lenders
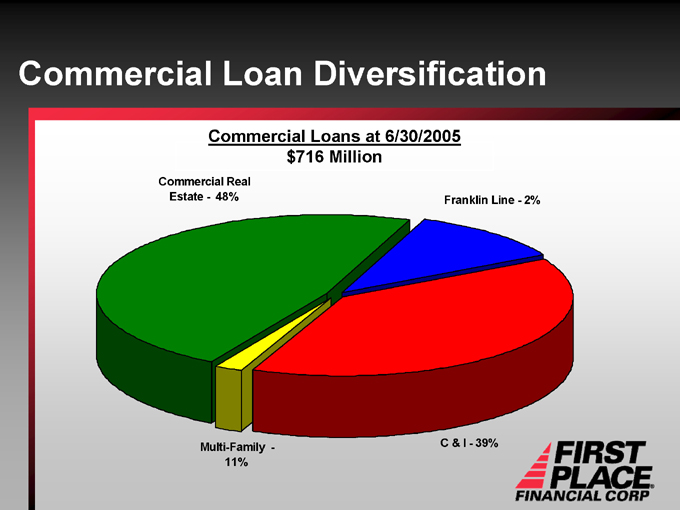
Commercial Loan Diversification
Commercial Loans at 6/30/2005 $716 Million
Commercial Real Estate—48%
Franklin Line—2%
Multi-Family—11%
C & I—39%
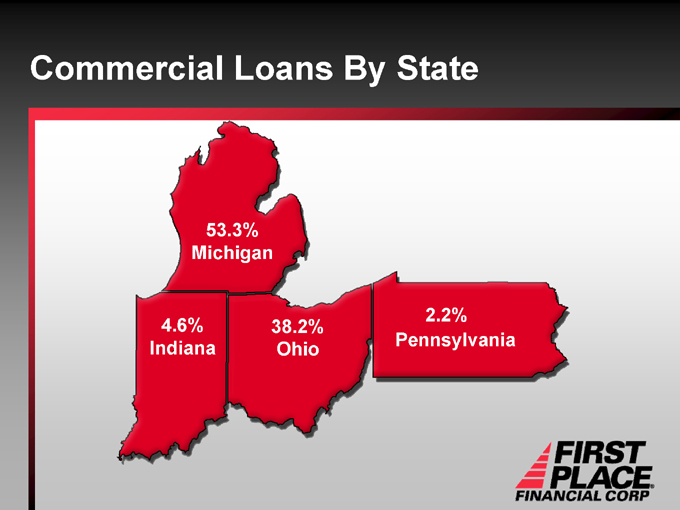
Commercial Loans By State
53.3% Michigan
4.6% Indiana
38.2% Ohio
2.2% Pennsylvania
Mortgage Banking
Vision
Stable revenue growth across economic cycles A leader in our selected higher-growth markets Contribution of 10-15% to net income Currently, 15 loan production offices in Midwest, 3 opened in fiscal 2005
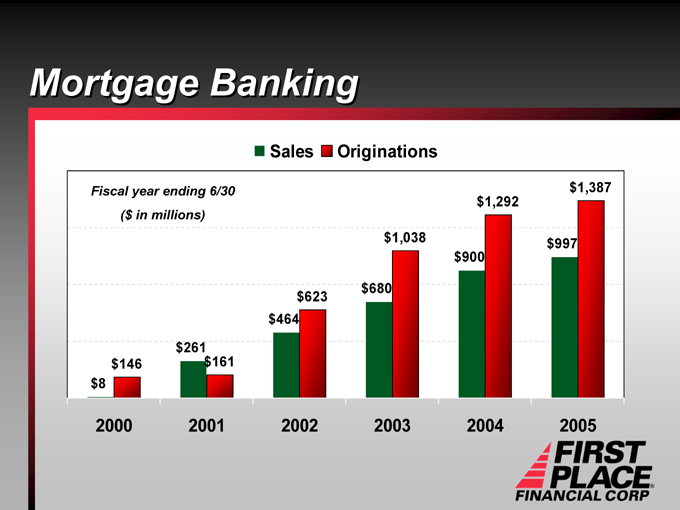
Mortgage Banking
Sales
Originations
Fiscal year ending 6/30 ($ in millions) $8 $146 $261 $161 $464 $623 $680 $1,038 $900 $1,292 $997 $1,387
2000 2001 2002 2003 2004 2005
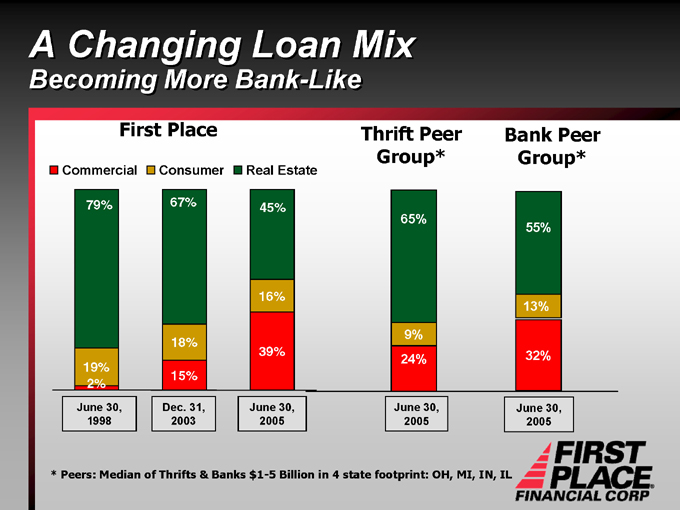
A Changing Loan Mix
Becoming More Bank-Like
First Place
Thrift Peer Group*
Bank Peer Group*
Commercial
Consumer
Real Estate
79%
19% 2%
67%
18%
15%
45%
16%
39%
65%
9% 24%
55%
13%
32%
June 30, 1998
Dec. 31, 2003
June 30, 2005
June 30, 2005
June 30, 2005
* Peers: Median of Thrifts & Banks $1-5 Billion in 4 state footprint: OH, MI, IN, IL
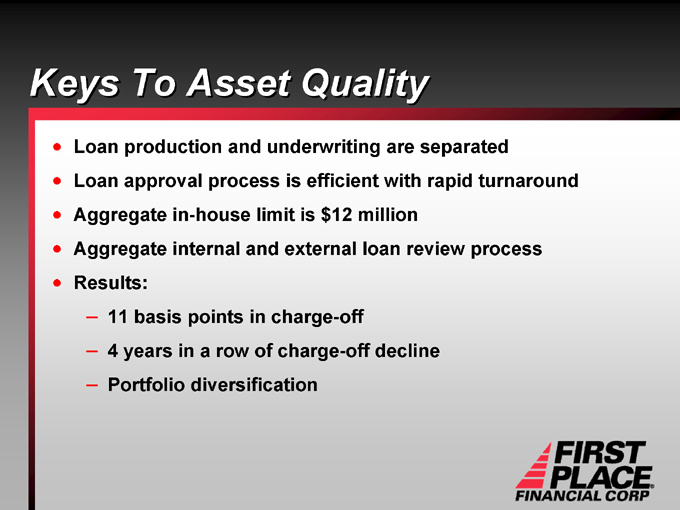
Keys To Asset Quality
Loan production and underwriting are separated Loan approval process is efficient with rapid turnaround Aggregate in-house limit is $12 million Aggregate internal and external loan review process Results:
11 basis points in charge-off
4 years in a row of charge-off decline Portfolio diversification
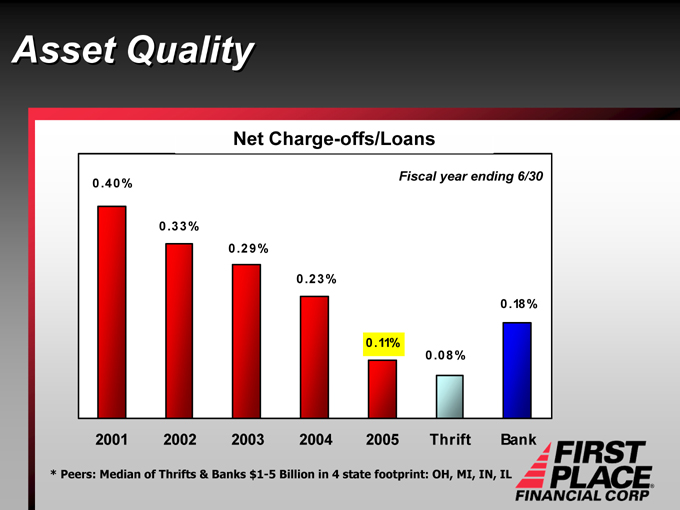
Asset Quality
Net Charge-offs/Loans
Fiscal year ending 6/30
0.40%
0.33%
0.29%
0.23%
0.11%
0.08%
0.18%
2001 2002 2003 2004 2005 Thrift Bank
* Peers: Median of Thrifts & Banks $1-5 Billion in 4 state footprint: OH, MI, IN, IL
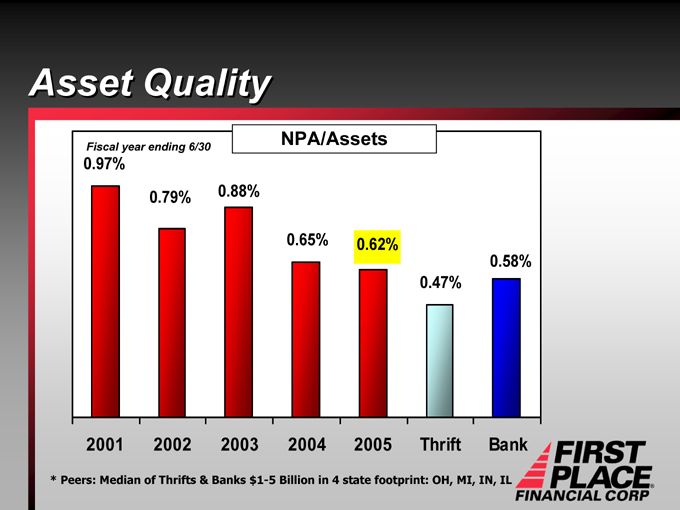
Asset Quality
NPA/Assets
Fiscal year ending 6/30
0.97%
0.79%
0.88%
0.65% 0.62%
0.47%
0.58%
2001 2002 2003 2004 2005 Thrift Bank
* Peers: Median of Thrifts & Banks $1-5 Billion in 4 state footprint: OH, MI, IN, IL
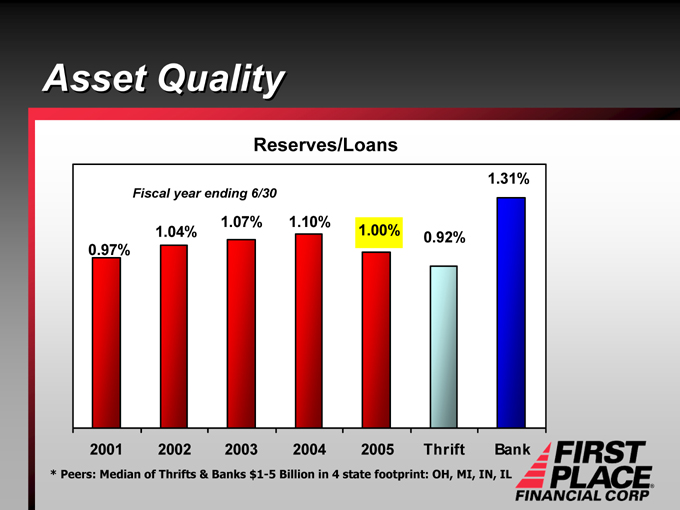
Asset Quality
Reserves/Loans
Fiscal year ending 6/30
0.97%
1.04%
1.07%
1.10%
1.00%
0.92%
1.31%
2001 2002 2003 2004 2005 Thrift Bank
* Peers: Median of Thrifts & Banks $1-5 Billion in 4 state footprint: OH, MI, IN, IL
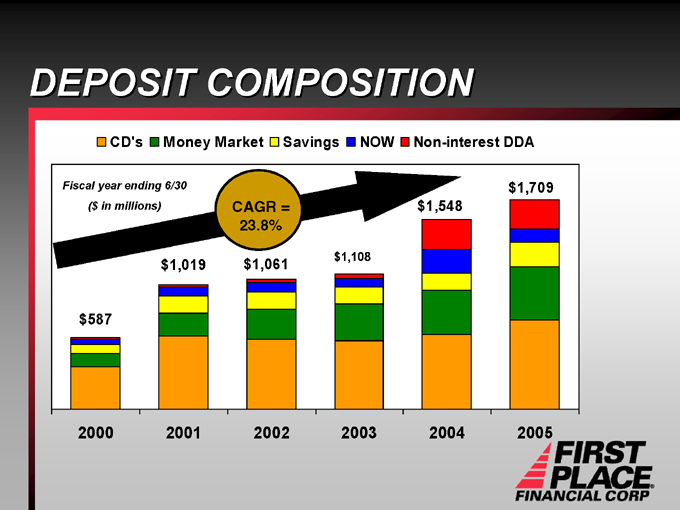
DEPOSIT COMPOSITION
CD’s
Money Market
Savings
NOW
Non-interest DDA
Fiscal year ending 6/30 ($in millions)
CAGR = 23.8% $587 $1,019 $1,061 $1,108 $1,548 $1,709
2000 2001 2002 2003 2004 2005
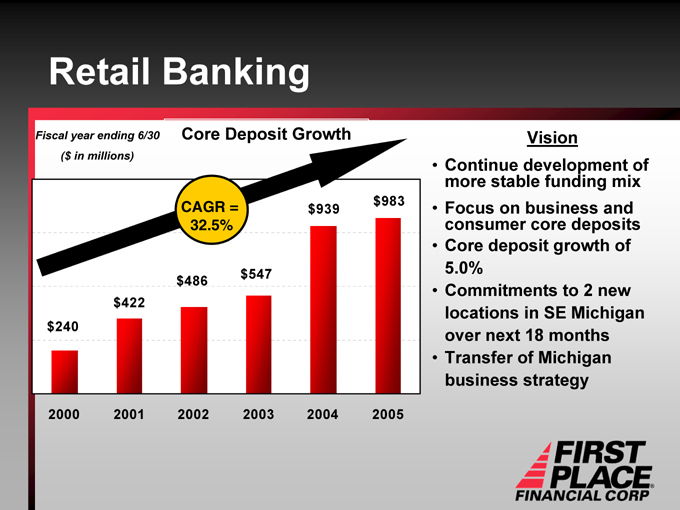
Retail Banking
Fiscal year ending 6/30 ($in millions)
Core Deposit Growth
CAGR = 32.5% $240 $422 $486 $547 $939 $983
2000 2001 2002 2003 2004 2005
Vision
Continue development of more stable funding mix Focus on business and consumer core deposits Core deposit growth of 5.0% Commitments to 2 new locations in SE Michigan over next 18 months Transfer of Michigan business strategy
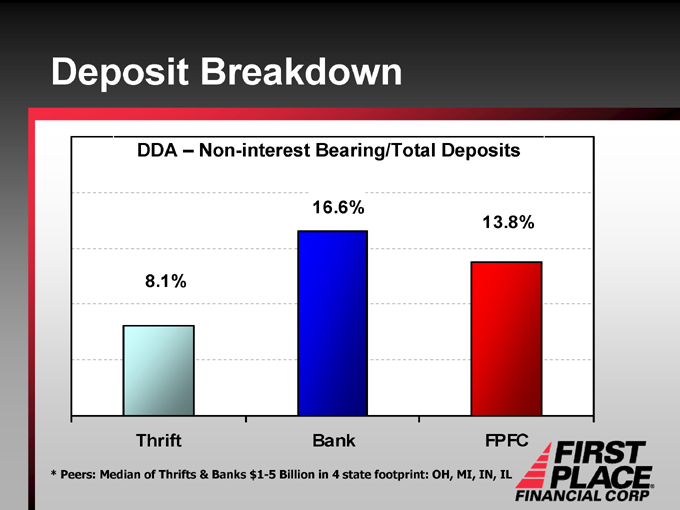
Deposit Breakdown
DDA – Non-interest Bearing/Total Deposits
8.1%
16.6%
13.8%
Thrift Bank FPFC
* Peers: Median of Thrifts & Banks $1-5 Billion in 4 state footprint: OH, MI, IN, IL
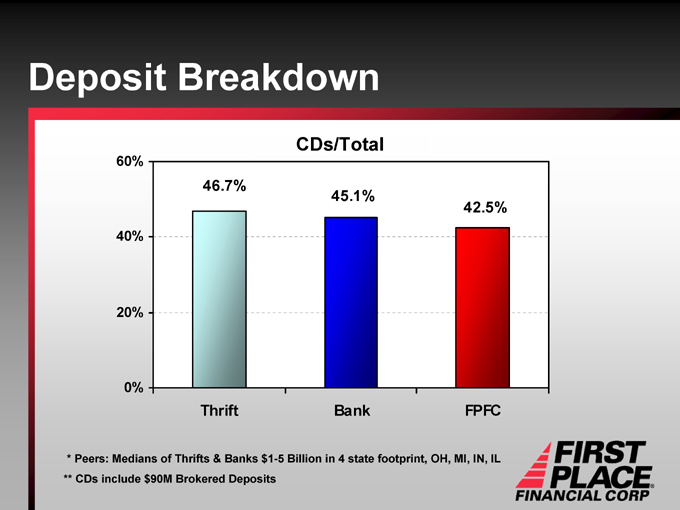
Deposit Breakdown
CDs/Total
60% 40% 20% 0%
46.7%
45.1%
42.5%
Thrift Bank FPFC
* Peers: Medians of Thrifts & Banks $1-5 Billion in 4 state footprint, OH, MI, IN, IL ** CDs include $90M Brokered Deposits
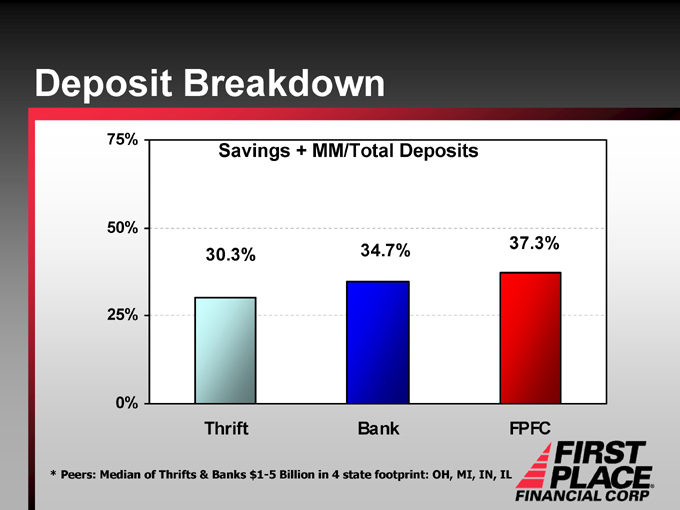
Deposit Breakdown
75% 50% 25% 0%
Savings + MM/Total Deposits
30.3%
34.7%
37.3%
Thrift
Bank
FPFC
* Peers: Median of Thrifts & Banks $1-5 Billion in 4 state footprint: OH, MI, IN, IL
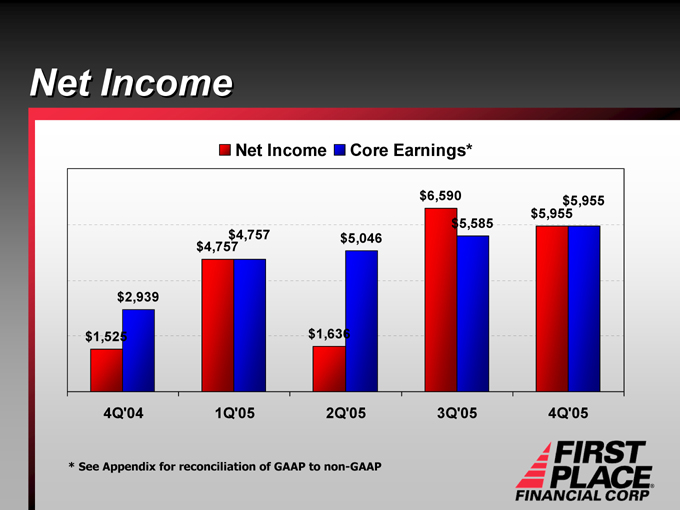
Net Income
Net Income
Core Earnings* $1,525 $2,939 $4,757 $4,757 $1,636 $5,046 $6,590 $5,585 $5,955 $5,955
4Q’04 1Q’05 2Q’05 3Q’05 4Q’05
* See Appendix for reconciliation of GAAP to non-GAAP
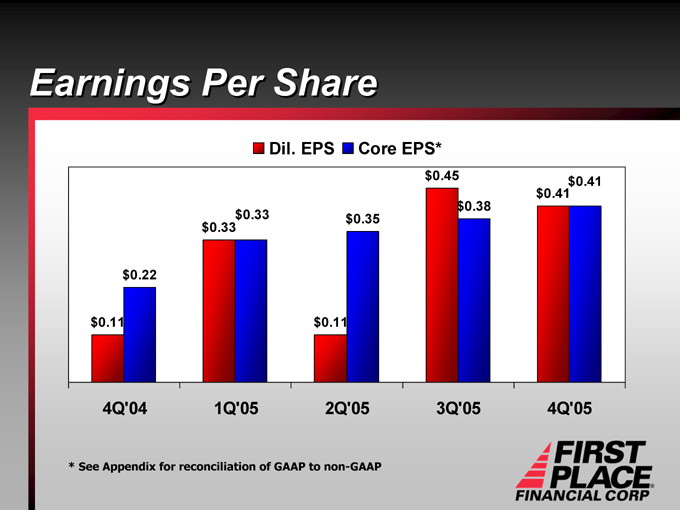
Earnings Per Share
Dil. EPS
Core EPS* $0.11 $0.22 $0.33 $0.33 $0.11 $0.35 $0.45 $0.38 $0.41 $0.41
4Q’04 1Q’05 2Q’05 3Q’05 4Q’05
* See Appendix for reconciliation of GAAP to non-GAAP
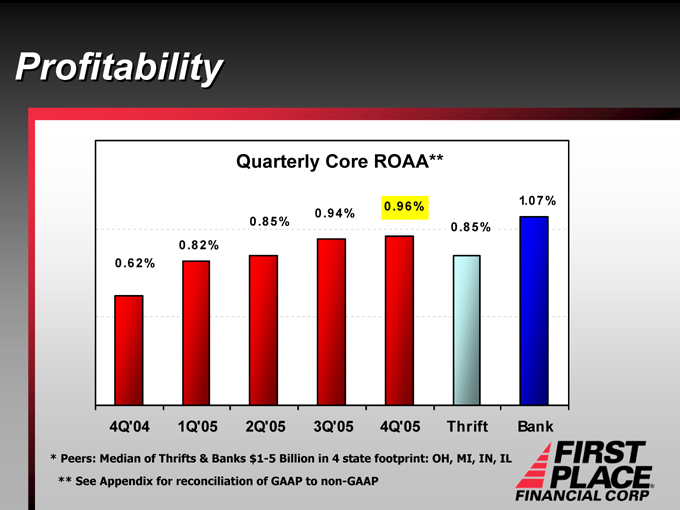
Profitability
Quarterly Core ROAA**
0.62%
0.82%
0.85%
0.94%
0.96%
0.85%
1.07%
4Q’04 1Q’05 2Q’05 3Q’05 4Q’05 Thrift Bank
* Peers: Median of Thrifts & Banks $1-5 Billion in 4 state footprint: OH, MI, IN, IL
** See Appendix for reconciliation of GAAP to non-GAAP
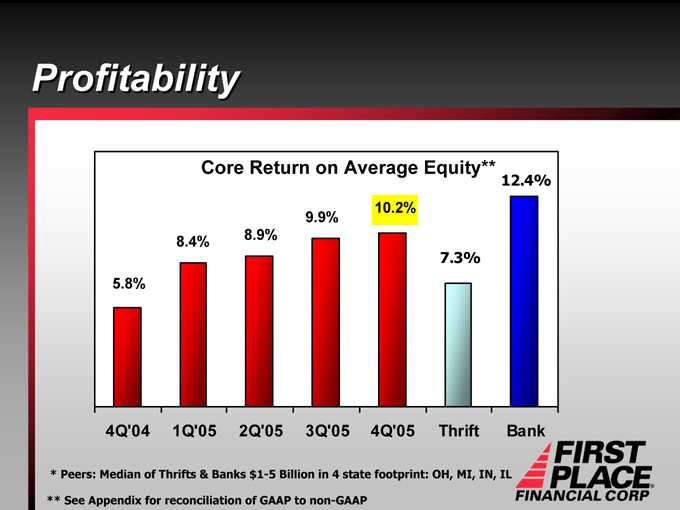
Profitability
Core Return on Average Equity**
5.8%
8.4%
8.9%
9.9%
10.2%
7.3%
12.4%
4Q’04 1Q’05 2Q’05 3Q’05 4Q’05 Thrift Bank
* Peers: Median of Thrifts & Banks $1-5 Billion in 4 state footprint: OH, MI, IN, IL
** See Appendix for reconciliation of GAAP to non-GAAP

Profitability
Quarterly Core Tangible ROAE*
7.3%
12.6%
13.1%
14.4%
14.6%
4Q’04 1Q’05 2Q’05 3Q’05 4Q’05
* See Appendix for reconciliation of GAAP to non-GAAP
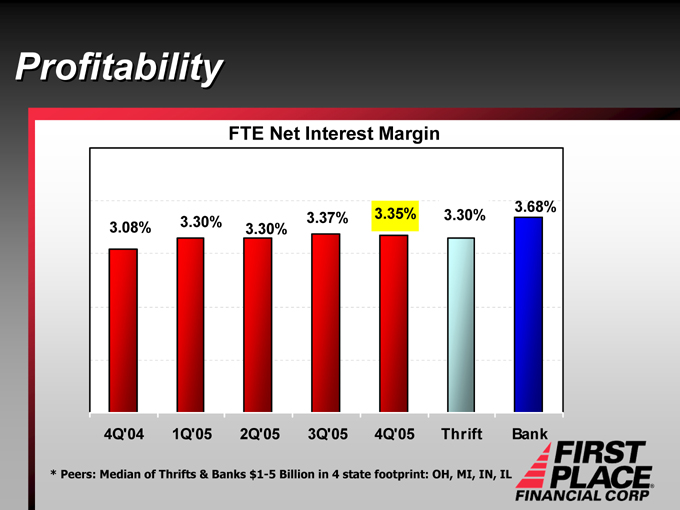
Profitability
FTE Net Interest Margin
3.08%
3.30%
3.30%
3.37%
3.35%
3.30%
3.68%
4Q’04 1Q’05 2Q’05 3Q’05 4Q’05 Thrift Bank
* Peers: Median of Thrifts & Banks $1-5 Billion in 4 state footprint: OH, MI, IN, IL
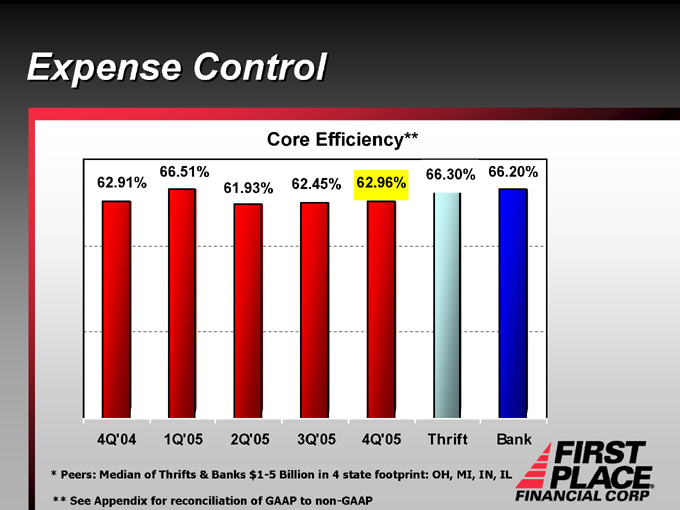
Expense Control
Core Efficiency**
62.91%
66.51%
61.93%
62.45%
62.96%
66.30%
66.20%
4Q’04 1Q’05 2Q’05 3Q’05 4Q’05 Thrift Bank
* Peers: Median of Thrifts & Banks $1-5 Billion in 4 state footprint: OH, MI, IN, IL
** See Appendix for reconciliation of GAAP to non-GAAP
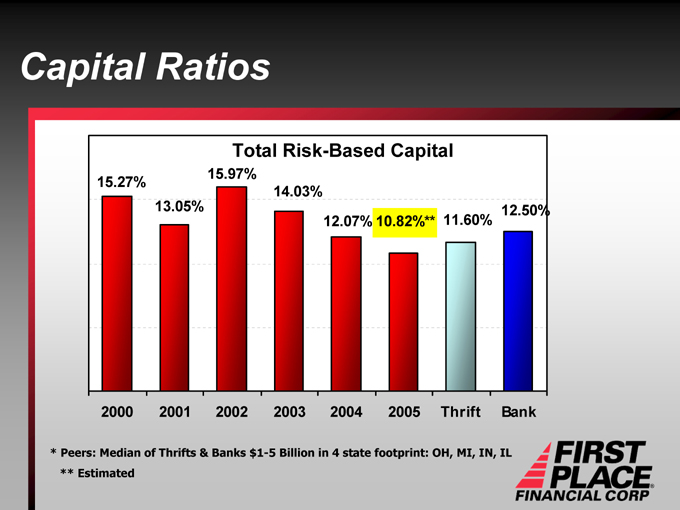
Capital Ratios
Total Risk-Based Capital
15.27%
13.05%
15.97%
14.03%
12.07%
10.82%**
11.60%
12.50%
2000 2001 2002 2003 2004 2005 Thrift Bank
* Peers: Median of Thrifts & Banks $1-5 Billion in 4 state footprint: OH, MI, IN, IL
** Estimated
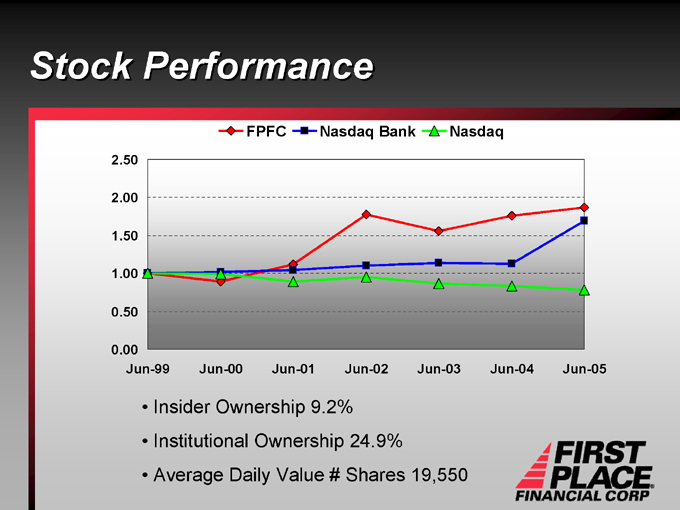
Stock Performance
FPFC
Nasdaq Bank
Nasdaq
2.50 2.00 1.50 1.00 0.50 0.00
Jun-99 Jun-00 Jun-01 Jun-02 Jun-03 Jun-04 Jun-05
Insider Ownership 9.2% Institutional Ownership 24.9% Average Daily Value # Shares 19,550
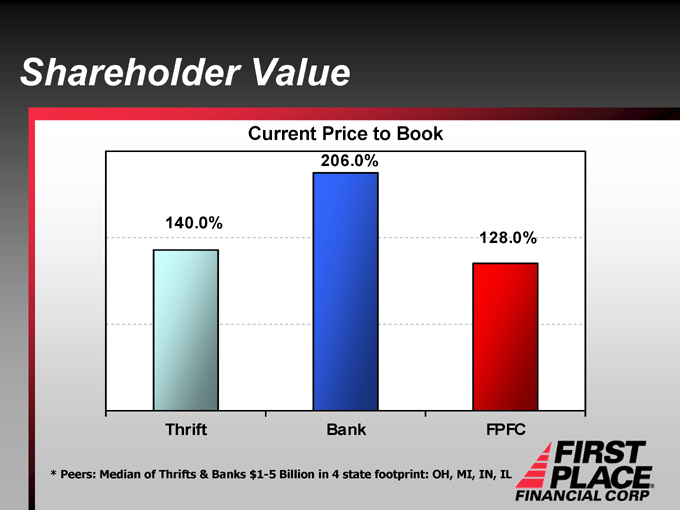
Shareholder Value
Current Price to Book
140.0%
206.0%
128.0%
Thrift Bank FPFC
* Peers: Median of Thrifts & Banks $1-5 Billion in 4 state footprint: OH, MI, IN, IL
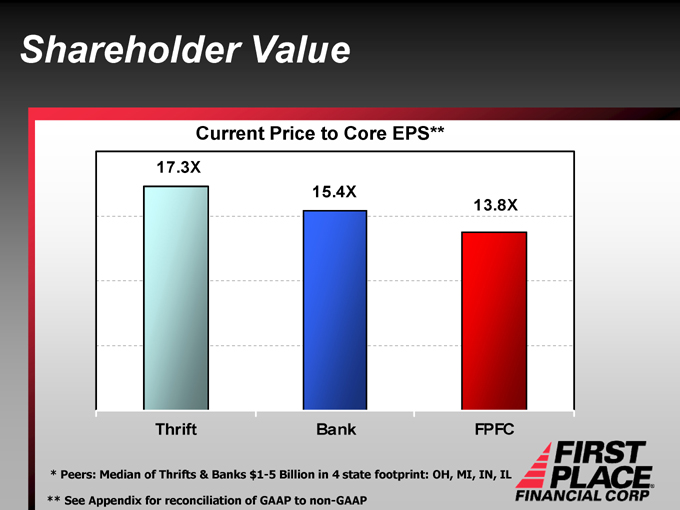
Shareholder Value
Current Price to Core EPS**
17.3X
15.4X
13.8X
Thrift Bank FPFC
* Peers: Median of Thrifts & Banks $1-5 Billion in 4 state footprint: OH, MI, IN, IL
** See Appendix for reconciliation of GAAP to non-GAAP
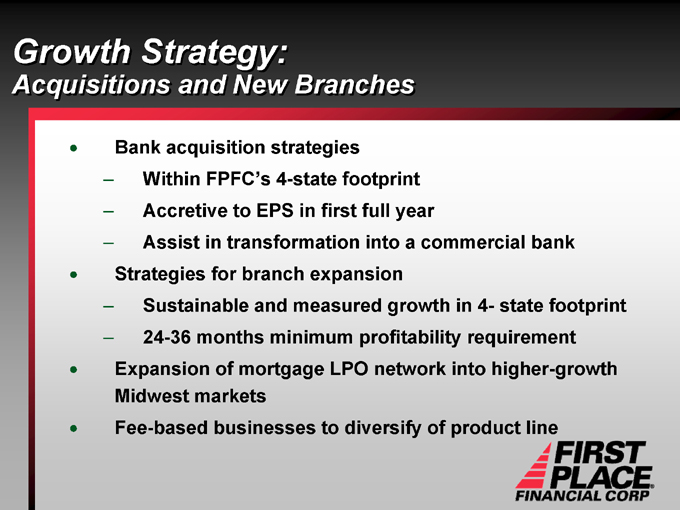
Growth Strategy:
Acquisitions and New Branches
Bank acquisition strategies
Within FPFC’s 4-state footprint Accretive to EPS in first full year
Assist in transformation into a commercial bank
Strategies for branch expansion
Sustainable and measured growth in 4- state footprint 24-36 months minimum profitability requirement
Expansion of mortgage LPO network into higher-growth Midwest markets Fee-based businesses to diversify of product line
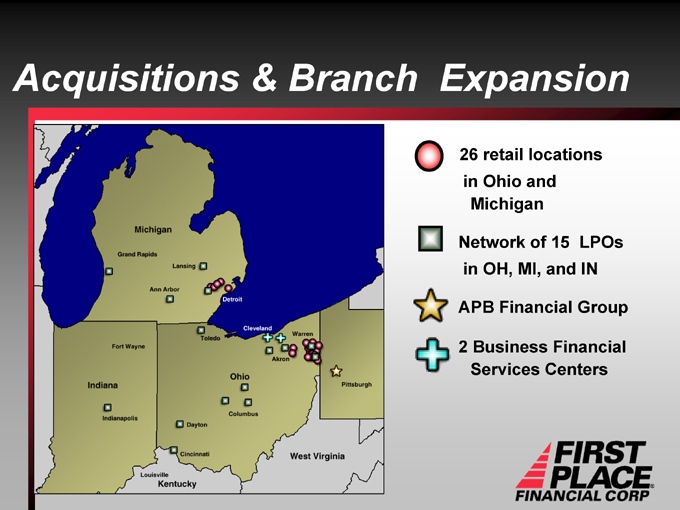
Acquisitions & Branch Expansion
26 retail locations in Ohio and Michigan
Network of 15 LPOs in OH, MI, and IN
APB Financial Group
2 Business Financial Services Centers
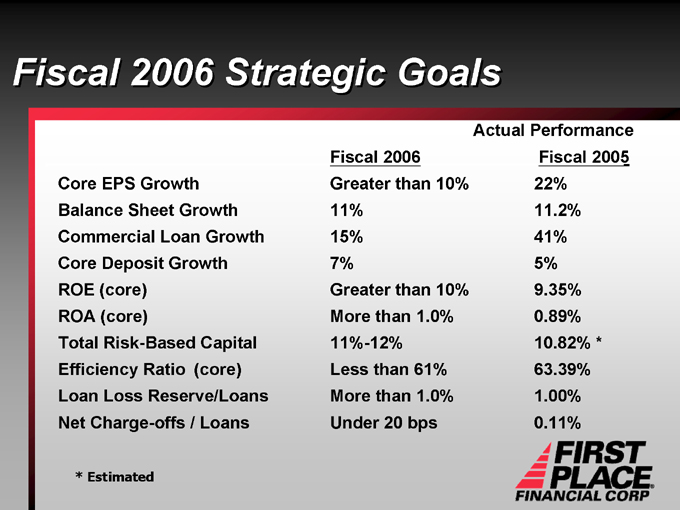
Fiscal 2006 Strategic Goals
Actual Performance
Fiscal 2006 Fiscal 2005
Core EPS Growth Greater than 10% 22%
Balance Sheet Growth 11% 11.2%
Commercial Loan Growth 15% 41%
Core Deposit Growth 7% 5%
ROE (core) Greater than 10% 9.35%
ROA (core) More than 1.0% 0.89%
Total Risk-Based Capital 11%-12% 10.82% *
Efficiency Ratio (core) Less than 61% 63.39%
Loan Loss Reserve/Loans More than 1.0% 1.00%
Net Charge-offs / Loans Under 20 bps 0.11%
* Estimated
Investment Appeals
Proven management team Diversified balance sheet
Asset-sensitive to interest-rate risk Positive earning trends Strong asset quality Strong quality of earnings Diversified markets Commercial loan growth Core deposit growth

The Bank That Means Business
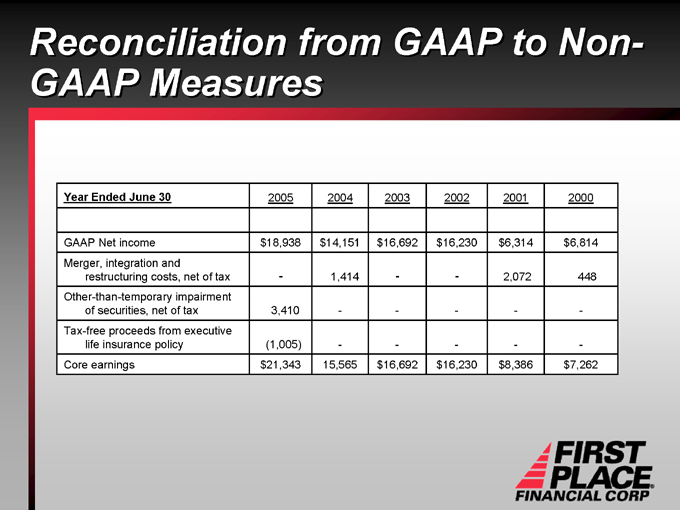
Reconciliation from GAAP to Non-GAAP Measures
Year Ended June 30 2005 2004 2003 2002 2001 2000
GAAP Net income $18,938 $14,151 $16,692 $16,230 $6,314 $6,814
Merger, integration and
restructuring costs, net of tax - 1,414 - - 2,072 448
Other-than-temporary impairment
of securities, net of tax 3,410 - - - - -
Tax-free proceeds from executive
life insurance policy (1,005) - - - - -
Core earnings $21,343 15,565 $16,692 $16,230 $8,386 $7,262
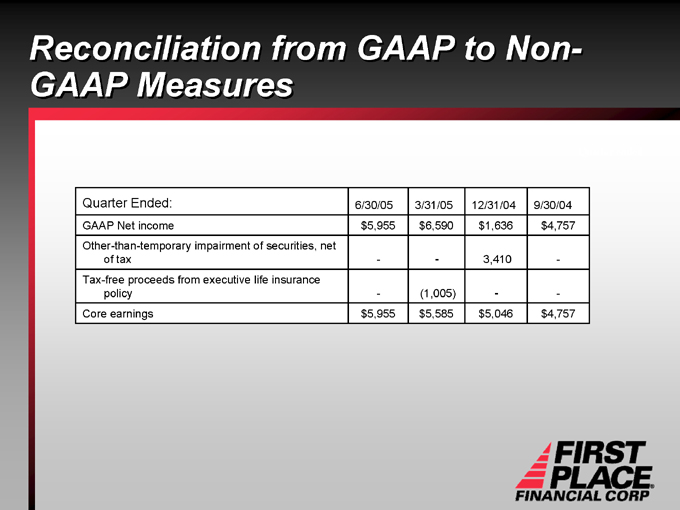
Reconciliation from GAAP to Non-GAAP Measures
Quarter Ended: 6/30/05 3/31/05 12/31/04 9/30/04
GAAP Net income $5,955 $6,590 $1,636 $4,757
Other-than-temporary impairment of securities, net
of tax - - 3,410 -
Tax-free proceeds from executive life insurance
policy - (1,005) - -
Core earnings $5,955 $5,585 $5,046 $4,757