February 28, 2006 Midwest Super-Community Bank Conference Exhibit 99.1 |
Forward-looking Statements When used in this presentation, or future presentations or other public or shareholder communications, in filings by First Place Financial Corp. (the Company) with the Securities and Exchange Commission, or in oral statements made with the approval of an authorized executive officer, the words or phrases “will likely result,” “are expected to,” “will continue,” “is anticipated,” “estimate,” “project” or similar expressions are intended to identify “forward- looking statements” within the meaning of the Private Securities Litigation Reform Act of 1995. Such forward-looking statements involve known and unknown risks, uncertainties and other factors, which may cause the Company’s actual results to be materially different from those indicated. Such statements are subject to certain risks and uncertainties including changes in economic conditions in the market areas the Company conducts business, which could materially impact credit quality trends, changes in laws, regulations or policies of regulatory agencies, fluctuations in interest rates, demand for loans in the market areas the Company conducts business, and competition, that could cause actual results to differ materially from historical earnings and those presently anticipated or projected. The Company wishes to caution readers not to place undue reliance on any such forward-looking statements, which speak only as of the date made. The Company undertakes no obligation to publicly release the result of any revisions that may be made to any forward-looking statements to reflect events or circumstances after the date of such statements or to reflect the occurrence of anticipated or unanticipated events. 2 |
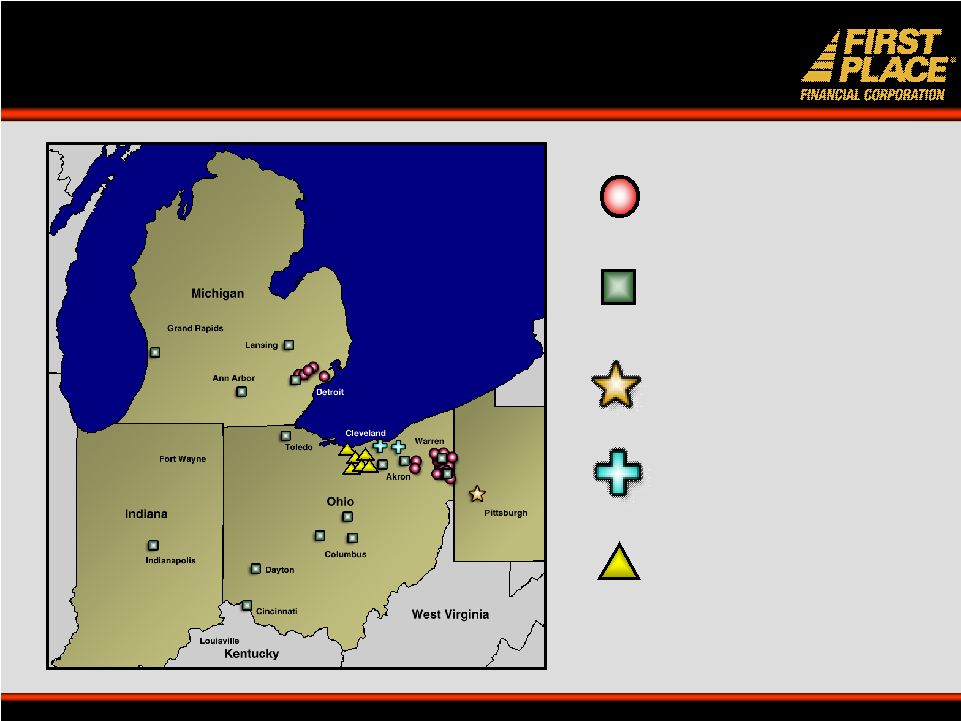
• $2.6 billion in assets • $363 million market cap at 12/31/05 • Four-state market: Ohio, Michigan, Pennsylvania, Indiana • 26 branches • 15 loan offices • 2 business financial centers • Market share leader in primary markets • Diversified bank: commercial, retail, consumer, insurance, wealth management, and real estate • Ticker Symbol: FPFC First Place Corporate Profile 3 |
• Leverage existing strengths • Transition balance sheet for greater profitability • Expand into higher-growth markets • Build infrastructure for excellence • Enhance revenue opportunities • Improve operating efficiencies • Maintain excellent asset quality First Place Core Strategy 4 Transition to a High-Performing Commercial Bank |
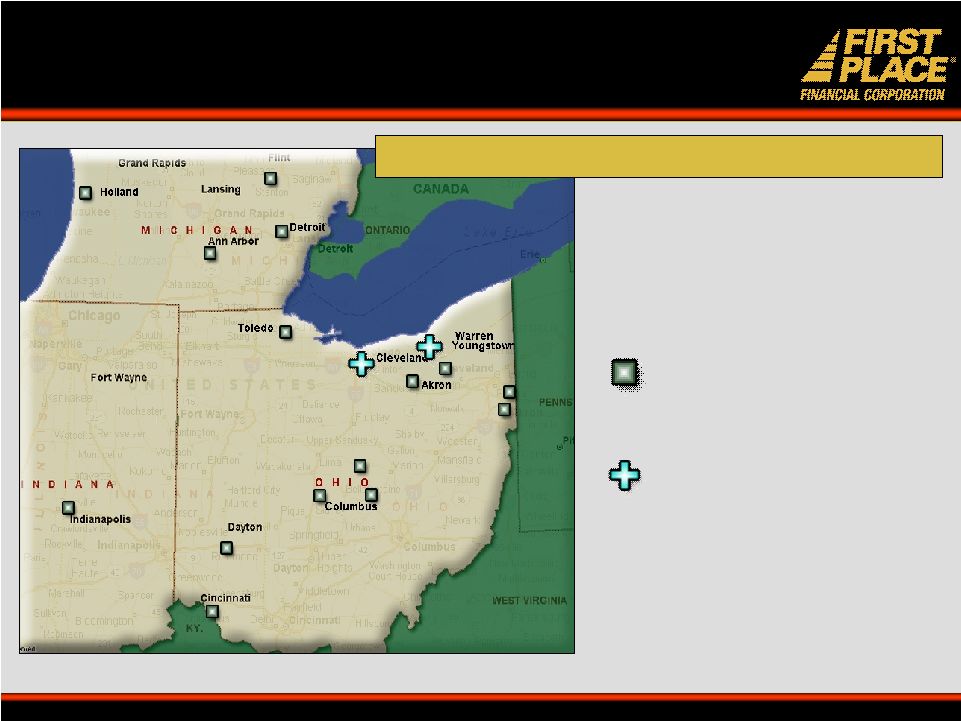
Expand the Franchise 26 retail locations in Ohio and Michigan Network of 15 LPOs in OH, MI, and IN APB Financial Group in PA 2 Business Financial Services Centers 6 banking locations of Northern Savings (pending acquisition) 5 |
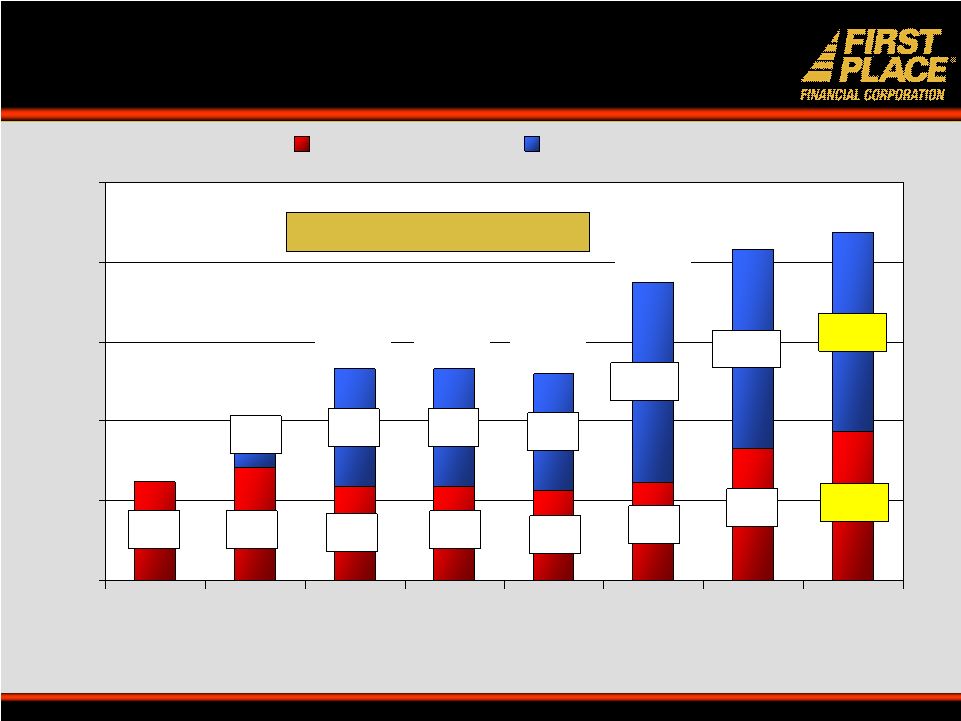
Asset Growth: CAGR* = 21.3% $883 $883 $883 $1,117 $747 $851 $710 $708 $676 $737 $989 $1,510 $1,510 $1,510 $201 $0 $600 $1,200 $1,800 $2,400 $3,000 1999 2000 2001 2002 2003 2004 2005 1H'06 Organic Acquisitions $2,627 $2,499 Organic Growth* = 6.4% Organic Growth* = 6.4% ($millions) FYE 6/30: $747 $1,052 $1,593 $1,591 $1,559 $2,247 * CAGR = 6.5 years * CAGR = 6.5 years 6 |
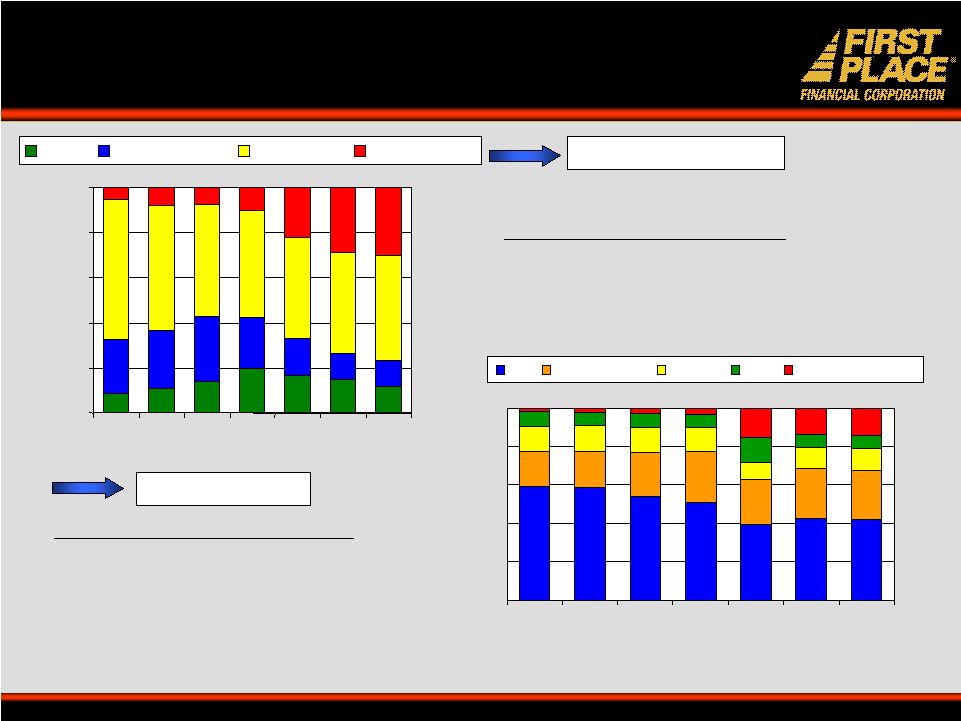
Transitioning the Balance Sheet 7 Change in Asset Mix from 2000: • Consumer loans declined from 62.5% to 46.8% • Commercial loans grew from 5.1% to 29.5% Change in Deposit Mix from 2000: • CDs declined from 59.0% to 42.1% • Non-interest DDAs grew from 1.8% to 14.3% • Core deposits = 58% of total deposits To Higher Yield Loans To Core Deposits 0% 20% 40% 60% 80% 100% 2000 2001 2002 2003 2004 2005 1H'06 Other Investments Consumer Commercial 2000 2001 2002 2003 2004 2005 1H'06 CD's Money Market Savings NOW Non-interest DDA |
The Transition Process: Phase 1 • 1999: Listed on Nasdaq: FPFC • 2000: Doubled in asset size Acquisitions: Date Assets Ravenna Savings Bank May 2000 $194.4 MM FFY Financial Corp. (MOE) December 2000 $667.7 MM • 2002 & 2003: Restructured balance sheet – Reduced fixed rate real estate loans – Increased core deposits – Shifted investments into higher-yielding assets – Grew commercial portfolio • 2004: Acquisition: Date Assets Franklin Bancorp May 2004 $536.2 MM 8 |
The Transition Process: Phase 2 LPO Network • Expansion of mortgage LPO network into higher-growth Midwest markets Bank Acquisitions • Within FPFC’s 4-state footprint • Accretive to EPS in first full year • Assist in transformation into a commercial bank Branch Expansion • Sustainable and measured growth in 4-state footprint • 24-36 months minimum profitability requirement Diversification • Fee-based businesses 9 |
Mortgage Banking: An Expansion Strategy • LPO expansion mitigates impact of mortgage banking cyclicality • 10 Ohio LPOs, 4 in MI, 1 in Indiana • Follow with Business Financial Services Centers (2 in greater Cleveland) 10 A leader in selected higher-growth markets |
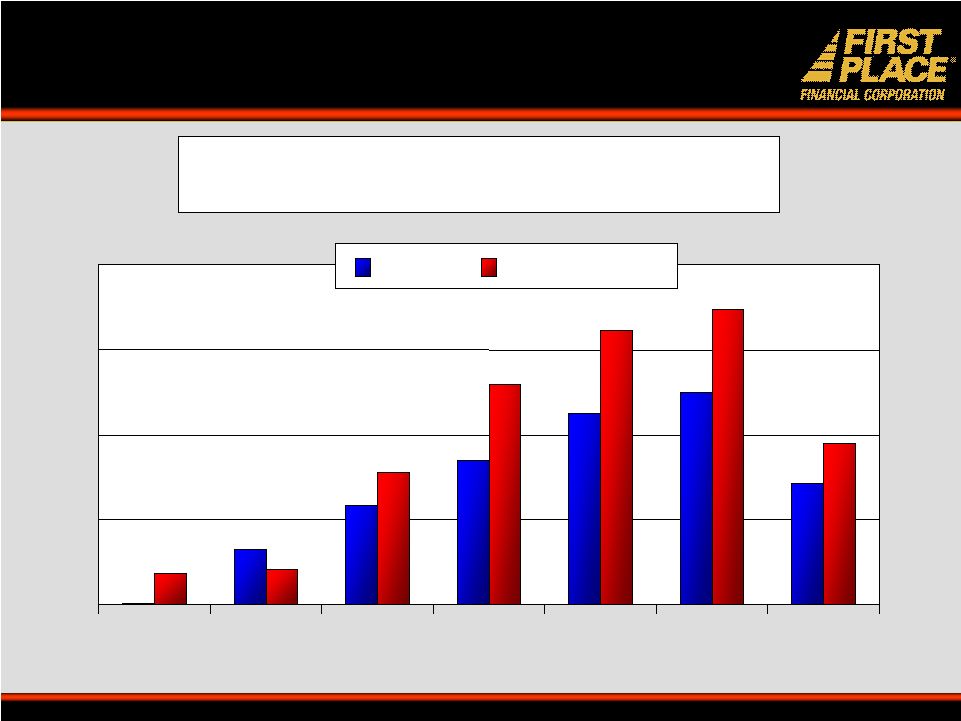
Mortgage Banking Fiscal year ending 6/30 ($ in millions) 73% of 2005 Originations from LPOs 11 $8 $261 $146 $623 $1,038 $1,292 $1,387 $759 $997 $900 $680 $464 $571 $161 2000 2001 2002 2003 2004 2005 1H'06 Sales Originations |
Bank Acquisitions: Franklin • Assets of $536.2 MM • Closed in May, 2004 • Accretive to EPS in first full year –Price/Tangible book of 183.3% –Core deposit premium of 9.1% –Documented cost savings of $4.3 million 12 |
Franklin: A Value-Added Transaction • Entry into a growth market: Oakland County – Highest per capita income in Michigan – Access to high net worth customers and business starts – 38% of Fortune 500 companies conduct business – Industry mix favors service (39%) and non-manufacturing (42%) • Provides geographic diversification • Substantial shift to a more commercial loan and deposit mix • Opportunity to cross-sell FPFC’s non-bank financial products 13 |
Bank Acquisitions: Northern Savings & Loan Company • $341 million Ohio-chartered savings and loan with 6 locations in Lorain County, Ohio • Accretive to EPS in first full year –Price/Tangible book of 164% –Core deposit premium of 11.9% –Price/ LTM earnings of 25.2X • Closing planned for second calendar quarter of 2006, pending required regulatory and shareholder approvals 14 |
Northern Savings: Strategic Rationale • Natural branch fill-in between Ohio and Michigan • Access to $265 million of low-cost deposits (wt. avg. cost = 2.13%) • Strengthens capital position • Estimated cost savings and revenue enhancements of $3.1 million • Expansion of retail platforms and commercial lending opportunities 15 |
Branch Expansion 16 Goal: Core deposit growth • Sustainable growth in 4- state footprint • 24-36 months minimum profitability requirement Regional banking center — Livonia, Michigan Shelby, Michigan Howland, Ohio |
First Place First Place Bank Bank Commercial Commercial Retail Retail Insurance Insurance Real Estate Real Estate Mortgage & Mortgage & Consumer Consumer Wealth Wealth Management Management Diversified Business Line 17 |
Where We Are Today Where We Are Today 18 |
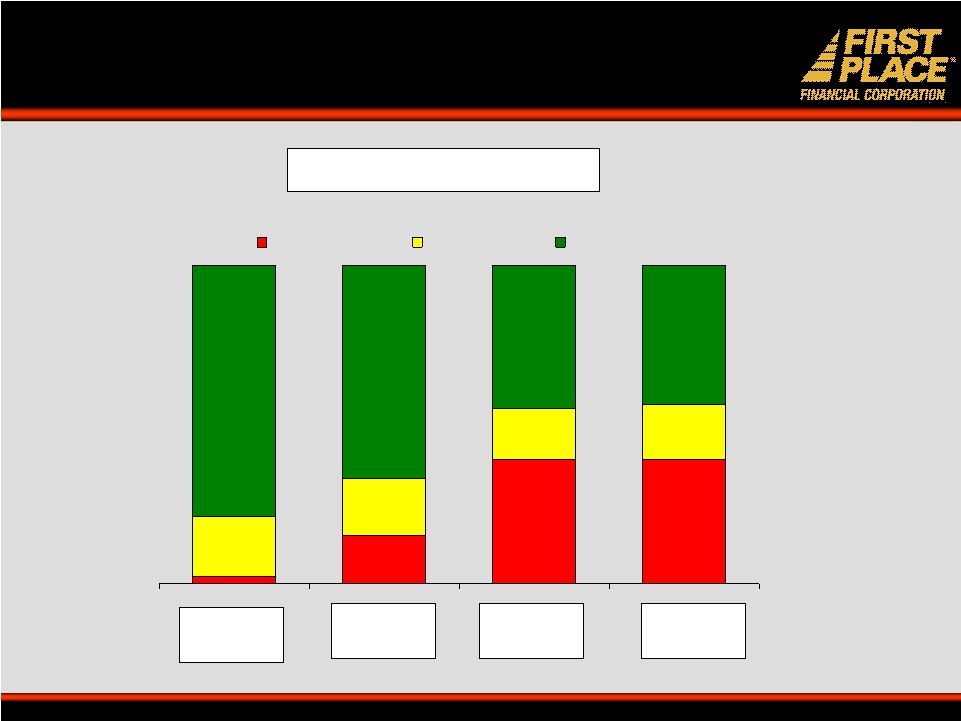
2% 15% 39% 39% 19% 18% 16% 17% 79% 67% 45% 44% Commercial Consumer Real Estate A Changing Loan Mix Becoming More Bank-Like First Place June 30, 1998 Dec. 31, 2003 June 30, 2005 19 Dec. 31, 2005 |
Residential 44% Franklin Line 1% C & I 16% Multi-Family Real Estate 4% Home Equity 8% HELOC 8% Consumer 1% Commercial Real Estate 18% A Diversified Loan Portfolio Loans at 12/31/2005 $2.006 Billion 20 |
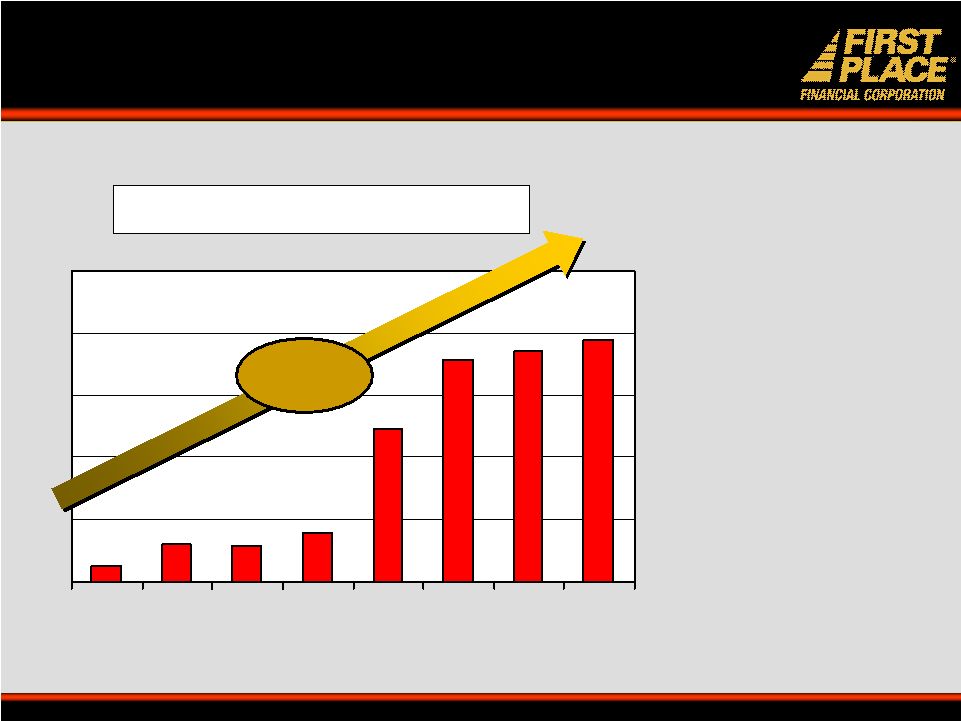
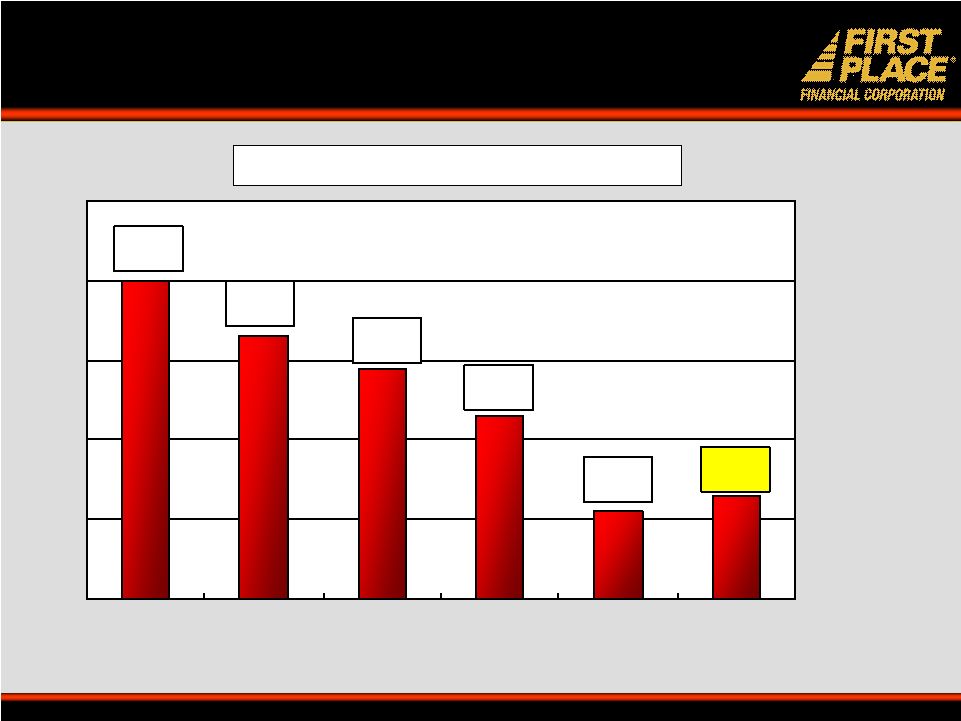
First Place: The Bank That Means Business $776 $743 $716 $494 $160 $116 $120 $54 2000 2001 2002 2003 2004 2005 Q1'06 Q2'06 Fiscal year ending 6/30 ($ in millions) Commercial Loans • Mortgage and Commercial LPOs • Bank-within-a-bank • Business financial centers • 17 commercial lenders 21 A leader in our markets for full-service commercial banking CAGR* = 61.6% * CAGR = 5.5 years |
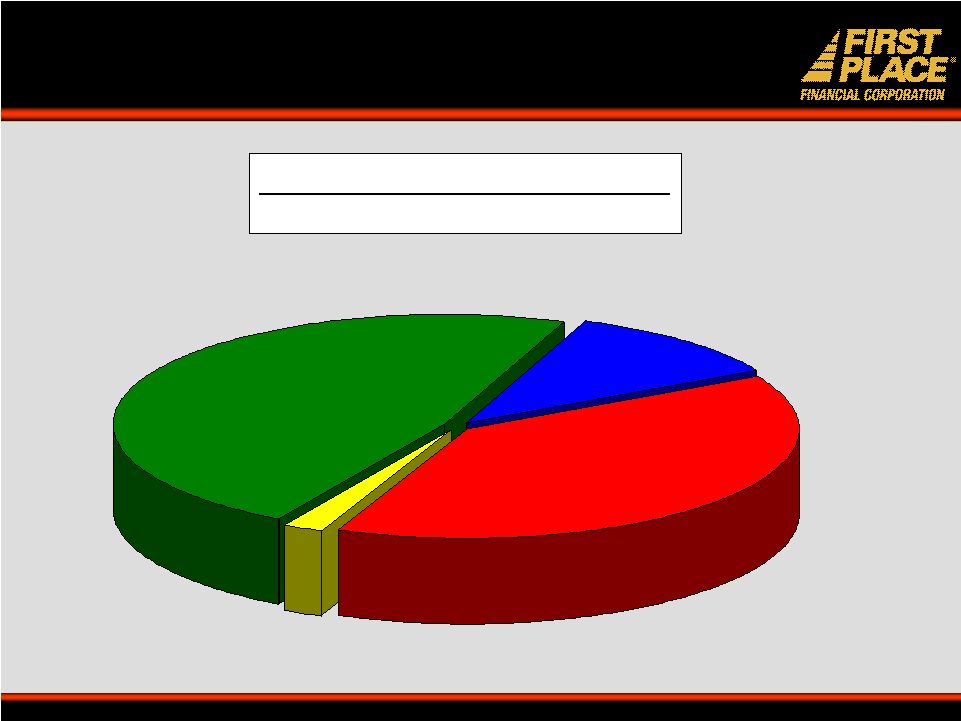
C & I - 41% Multi-Family - 11% Franklin Line - 2% Commercial Real Estate - 46% Commercial Loans at 12/31/2005 $776 Million Commercial Loan Diversification 22 |
Commercial Loans By State 51.9% Michigan 3.7% Indiana 40.6% Ohio Pennsylvania 1.6% 23 |
Core Deposit Growth Core deposit growth strategies: • Business core deposits: • Transfer of Michigan business strategy • Consumer core deposits: • 2 new branches in SE Michigan over next 12 months • Core deposits exclude all CD products $1,021 $993 $983 $939 $547 $486 $422 $240 2000 2001 2002 2003 2004 2005 Q1'06 Q2'06 Fiscal year ending 6/30 ($ in millions) 24 CAGR* = 29.9% * CAGR = 5.5 years |
Building an Infrastructure for Excellence • Strong management team • Flexible and effective organizational structure • Effective incentives • Development of sales culture 25 |
Infrastructure: A Strong Management Team • Steven Lewis, Chief Executive Officer 21 • Albert Blank, Chief Operating Officer 21 • Paul Musgrove, Chief Financial Officer 13 • Craig Johnson, Michigan Regional President 23 • Kenton Thompson, Ohio Regional President 26 • Bruce Wenmoth, Corporate EVP, Consumer Banking 22 • Dominique Stoeber, Corporate EVP, Retail Banking 15 • Tim Beaumont, Corporate EVP, Chief Credit Officer 25 Years in Banking 26 |
Infrastructure: Building A Sales Culture • Driven from bottom up • All Encompassing (sales staff, back office, and affiliates) • Corporate Service Promises • Measurement Process (daily, weekly, monthly, quarterly, annually) • Creative Recognition of Service/Sales Excellence 27 |
Incentive Compensation Drives Performance • Every employee included in plan • All have goals in four categories: – Profitability – Growth – Asset quality – Client service • All receive monthly scorecards on performance • Variable pay comprised 30% of total 2005 compensation • 17 Commercial Lenders with an average of 17.3 years of experience 28 |
Maintain Excellent Asset Quality • Loan production and underwriting are separated • Commercial loan officers have rapid access to decision- makers • Approval process is compressed yet efficient • Aggregate in-house limit is $12 million • Aggregate internal and external loan review process • Results: – 11 basis points in charge-offs in ’05 / 13 basis points in 1st half of FY 2006 – 4 years in a row of declining net charge-offs 29 |
Asset Quality 0.13% 0.11% 0.23% 0.40% 0.33% 0.29% 2001 2002 2003 2004 2005 2006 Net Charge-offs/Average Loans 30 YTD 12/05 |
Financial Results Paul Musgrove, CFO |
First Place Strategic Goal: 32 Complete transformation to commercial bank < 0.65% < 0.20% > 6.50% > 1.00% > 10.00% > 13.50% < 58% > 11% >10% >15%/ 14% >11%/8% 2006 Strategic Plan 10% (A) 14% (A) 19%/ 17% (A) 7%/ 6% (A) Growth: Assets Core EPS Loans / Commercial Loans Deposits/ Core Deposits 14.85x 205.6% Shareholder value: Price/Core Earnings Price/ Tangible Book 0.62% 0.13% 6.90% Asset quality: NPAs/Assets NCOs Tang Equity/Tang Assets 0.95% 10.05% 14.11% 58% Performance: Core ROA Core ROE Core ROTE Core Efficiency FY 2006 Year-to-Date (A) FY 2006 growth rates are annualized |
Year-To-Date Performance: 6 Mos. +10.1% 2,627 2,385 Assets +11 bp 0.95 0.84 Core ROA (%) -226 bp 57.73 59.99 Core Efficiency Ratio (%) +4 bp 3.34 3.30 NIM (%) +6.9% 1,021,343 955,091 Core Deposits ($M) +12.8% 759,000 672,800 Mortgage Originations ($M) +28.4% 775,782 604,092 Commercial Loans ($M) +24.6% 12,213 9,803 Core Net Income ($M) FY’06 % FY’05 33 |
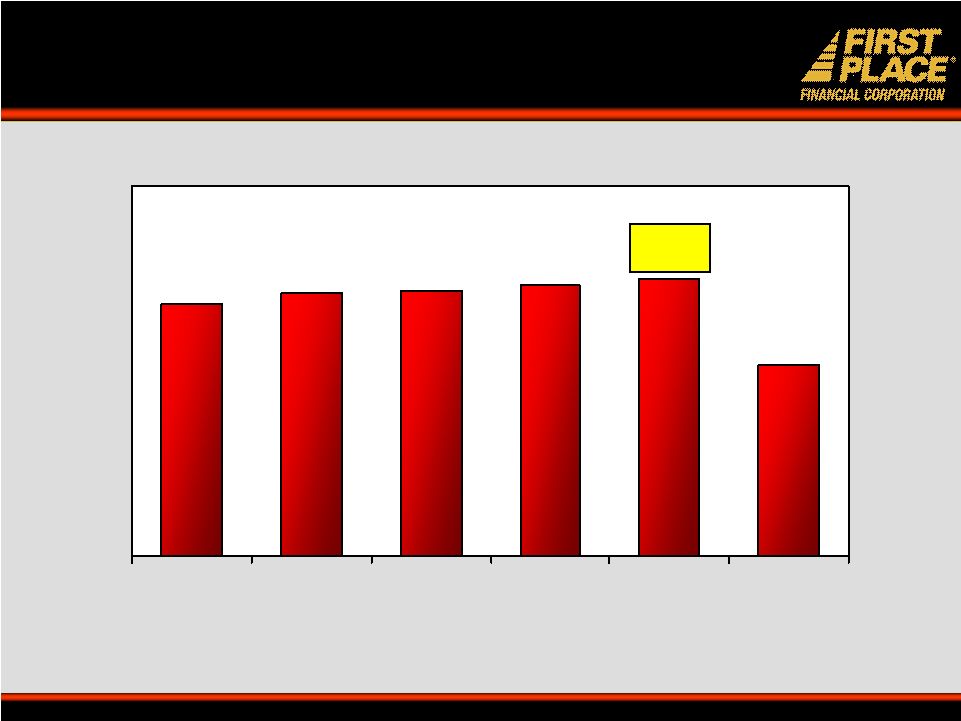
Asset Growth $2,560 $2,499 $2,480 $2,385 $2,627 10% 2Q'05 3Q'05 4Q'05 1Q'06 2Q'06 Growth LTM 34 |
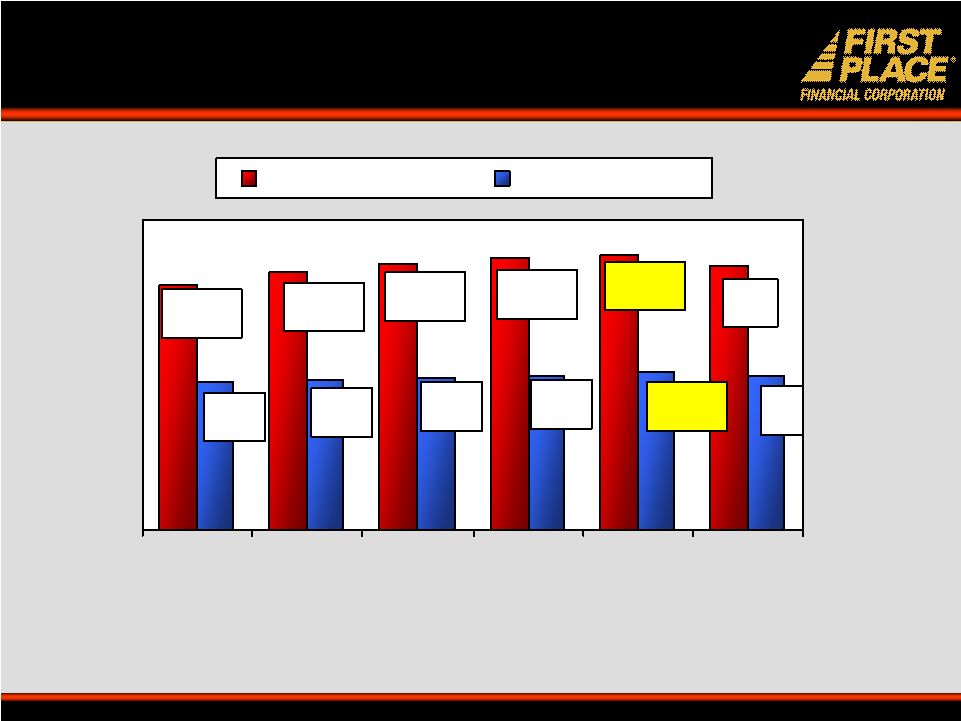
Loan Growth 16% $2,006 $1,732 $1,737 $1,831 $1,880 28% $776 $743 $716 $645 $604 2Q'05 3Q'05 4Q'05 1Q'06 2Q'06 Growth LTM Loans Commercial Loans 35 |
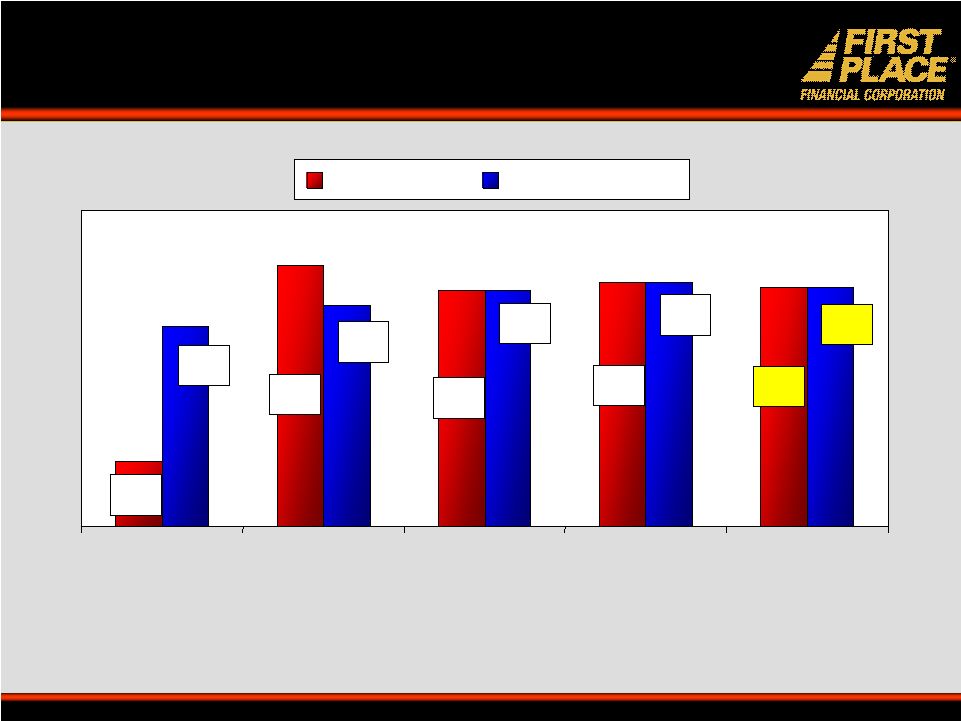
Deposit Growth 12% $1,765 $1,578 $1,658 $1,709 $1,755 7% $955 $965 $983 $993 $1,021 2Q'05 3Q'05 4Q'05 1Q'06 2Q'06 Growth LTM Total Deposits Core Deposits 36 |
Reconciliation of Net Income to Core Earnings 2Q’06 1Q’06 4Q’05 3Q’05 2Q’05 $6,046 $6,167 $5,955 $5,585 $5,046 Core Earnings $(1,005) Proceeds from Life Insurance $3,410 Securities Impairment, after-tax $6,046 $6,167 $5,955 $6,590 $1,636 GAAP Net Income 37 |
Net Income 38 $6.0 $6.2 $6.6 $1.6 $6.0 $5.0 $6.0 $6.2 $6.0 $5.6 2Q'05 3Q'05 4Q'05 1Q'06 2Q'06 Net Income Core Earnings |
Diluted Earnings Per Share 39 14,625 14,629 14,639 14,710 14,780 Average Diluted Shares Outstanding (thousands): $0.41 $0.42 $0.11 $0.45 $0.41 $0.41 $0.35 $0.42 $0.41 $0.38 2Q'05 3Q'05 4Q'05 1Q'06 2Q'06 GAAP Diluted EPS Core Diluted EPS |
Performance: Core ROAA 0.96% 0.96% 0.94% 0.85% 0.93% 1.09% 2Q'05 3Q'05 4Q'05 1Q'06 2Q'06 Peers* 40 * Peers: Median of Thrifts & Banks $1.5–$5 Billion in 4- state FPFC market, OH, MI, IN, PA. |
9.86% 10.23% 10.18% 9.86% 8.89% 10.77% 14.91% 13.77% 14.46% 14.63% 14.37% 13.14% 2Q'05 3Q'05 4Q'05 1Q'06 2Q'06 Peers* Core ROE Core ROTE Performance: Return on Equity 41 * Peers: Median of Thrifts & Banks $1.5–$5 Billion in 4- state FPFC market, OH, MI, IN, PA. |
Performance: FTE Net Interest Margin 3.81% 3.33% 3.30% 3.37% 3.35% 3.35% 2Q'05 3Q'05 4Q'05 1Q'06 2Q'06 Peers* 42 * Peers: Median of Thrifts & Banks $1.5–$5 Billion in 4- state FPFC market, OH, MI, IN, PA. |
Expense Control: Core Efficiency Ratio* 43 * Excludes non-recurring items and amortization of intangible assets ** Peers: Median of Thrifts & Banks $1.5–$5 Billion in 4- state FPFC market, OH, MI, IN, PA. 57.9% 58.6% 59.3% 57.0% 60.3% 58.5% 2Q'05 3Q'05 4Q'05 1Q'06 2Q'06 Peers** |
Maintain Asset Quality 44 * Peers: Median of Thrifts & Banks $1.5–$5 Billion in 4- state FPFC market, OH, MI, IN, PA. 0.17% 0.16% 0.09% 0.12% 0.20% 0.14% 0.47% 0.62% 0.72% 0.62% 0.61% 0.61% 0.00% 0.50% 1.00% 1.50% 2.00% 2Q'05 3Q'05 4Q'05 1Q'06 2Q'06 Peers* NCOs NPAs |
Tier 1 Risk Based Capital 45 10.13% 9.60% 9.17% 9.77% 10.01% 10.81% 2Q'05 3Q'05 4Q'05 1Q'06 2Q'06 Peers* * Peers: Median of Thrifts & Banks $1.5–$5 Billion in 4- state FPFC market, OH, MI, IN, PA. |
Tangible Equity/Tangible Assets 46 7.28% 6.90% 6.72% 6.61% 6.85% 6.90% 2Q'05 3Q'05 4Q'05 1Q'06 2Q'06 Peers* * Peers: Median of Thrifts & Banks $1.5–$5 Billion in 4- state FPFC market, OH, MI, IN, PA. |
12.05% 11.05% 11.21% 10.61% 10.18% 10.79% Q2'05 Q3'05 Q4'05 Q1'06 Q2'06 Peers* Total Capital Ratio 47 * Peers: Median of Thrifts & Banks $1.5–$5 Billion in 4- state FPFC market, OH, MI, IN, PA. |
Fiscal 2006 Strategic Goals Complete transformation to commercial bank Grow commercial loans Grow core deposits Maintain excellent asset quality Make strategic acquisitions • Within 4-state footprint • Accretive to EPS in first full year • Assist in transformation into a commercial bank Expand branch network • Sustainable and measured growth in 4- state footprint • 24-36 months minimum profitability requirement Fee-based businesses to diversify product line 48 0.13% 0.62% 57.73% 11.05% 0.95% 14.11% 13.7% 7% (A) 58% 19% (A) 39% 10% (A) 2006 YTD <0.25% 0.17% NCOs/ Avg. Loans <0.55% 0.47% NPAs / Assets <55% 60.3% Core Efficiency % >12.00% 12.05% Tot. Risk-Based Capital >1.30% 1.09% Core ROAA % >20% 14.9% Core ROATE % >10% - Core EPS Growth >10% - Total Deposit Growth >65% - Core Deposits (% of Total) >10% - Total Loan Growth >40% 19% Comm. Loans (% of Total) >10% - Asset Growth Top Quartile Performance 2006 Peer Median Performance (A) 2006 growth rates are annualized |
FPFC: An Attractive Investment Opportunity* 2.66% 2.33% Dividend Yield 42% 33% Dividend Payout Ratio 248% 205.6% Price/Tangible Book 180% 148.1% Price/Book 13.5x 13.2x Price/ Est. 2007 EPS 16.3x 14.8x Price/ LTM Core EPS Peers Median FPFC 49 * Based on December 31, 2005 data |
Investment Highlights • Proven management team • Diversified balance sheet • Asset-sensitive to interest-rate risk • Positive earning trends • Strong asset quality • Strong quality of earnings • Diversified markets • Commercial loan growth • Core deposit growth • Excellent Timing 50 |
The Bank That Means The Bank That Means Business Business |