August 1, 2006 2006 KBW Seventh Annual Community Bank Investor Conference July 31 - August 2, 2006 Steven Lewis CEO Paul Musgrove CFO Exhibit 99.1 |
Forward-looking Statements When used in this presentation, or future presentations or other public or shareholder communications, in filings by First Place Financial Corp. (the Company) with the Securities and Exchange Commission, or in oral statements made with the approval of an authorized executive officer, the words or phrases “will likely result,” “are expected to,” “will continue,” “is anticipated,” “estimate,” “project” or similar expressions are intended to identify “forward-looking statements” within the meaning of the Private Securities Litigation Reform Act of 1995. Such forward-looking statements involve known and unknown risks, uncertainties and other factors, which may cause the Company’s actual results to be materially different from those indicated. Such statements are subject to certain risks and uncertainties including changes in economic conditions in the market areas the Company conducts business, which could materially impact credit quality trends, changes in laws, regulations or policies of regulatory agencies, fluctuations in interest rates, demand for loans in the market areas the Company conducts business, and competition, that could cause actual results to differ materially from historical earnings and those presently anticipated or projected. The Company wishes to caution readers not to place undue reliance on any such forward-looking statements, which speak only as of the date made. The Company undertakes no obligation to publicly release the result of any revisions that may be made to any forward-looking statements to reflect events or circumstances after the date of such statements or to reflect the occurrence of anticipated or unanticipated events. 2 |
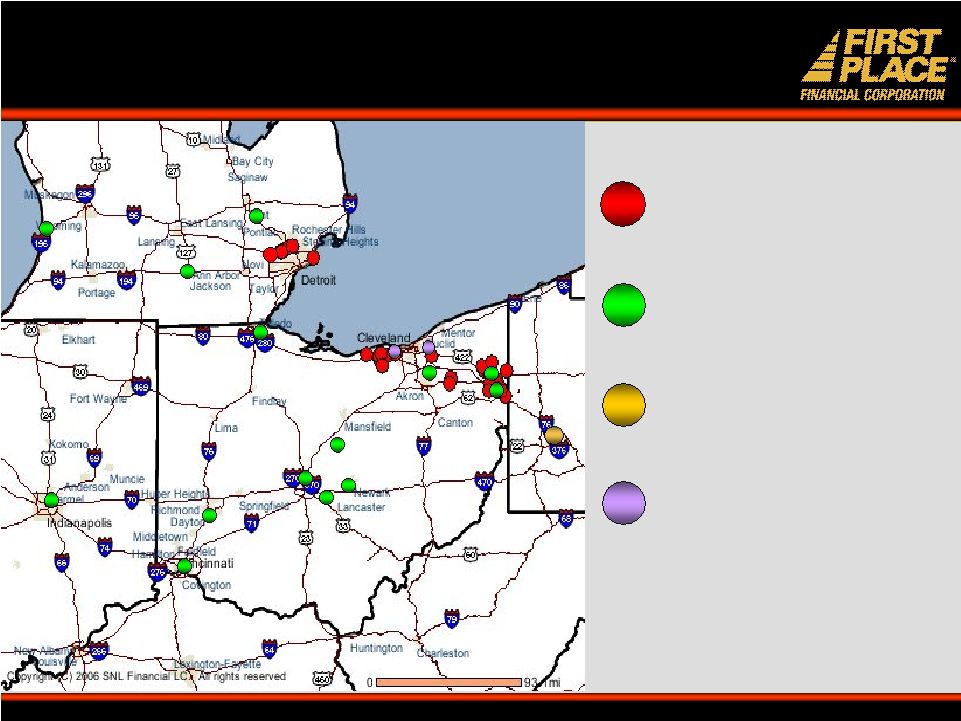
• $3.1 billion in assets • $401 million market cap at 6/30/06 • Four-state market: Ohio, Michigan, Pennsylvania, Indiana • 34 branches • 14 loan offices • 2 business financial centers • Market share leader in primary markets • Diversified bank: commercial, retail, consumer, insurance, wealth management, and real estate • Ticker Symbol: FPFC First Place Corporate Profile 3 |
• Expand into higher-growth markets • Build infrastructure for excellence • Enhance balance sheet for greater profitability • Diversify revenue opportunities • Maintain excellent asset quality • Execute above peer median financial results • Deliver outstanding results to shareholders First Place Core Strategy 4 Transition to a High-Performing Commercial Bank |
The Historical Transition Timeline • 1999: Listed on Nasdaq: FPFC • 2000: Doubled in asset size Acquisitions: Date Assets Ravenna Savings Bank May 2000 $194 MM FFY Financial Corp. (MOE) December 2000 $668 MM • 2002 & 2003: Restructured balance sheet – Reduced fixed rate real estate loans – Increased core deposits – Shifted investments into higher-yielding assets – Grew commercial portfolio • 2004: Expanded into Oakland County, MI Acquisition: Date Assets Franklin Bancorp May 2004 $536 MM • 2006: Expanded into Lorain County, OH Acquisition: Date Assets Northern Savings & Loan June 2006 $360 MM 5 |
The Future Transition Process LPO Network • Leverage existing LPO network to enhance non-interest fee income and provide diversified asset generation opportunities Bank Acquisitions • Within FPFC’s 4-state footprint • Accretive to EPS in first full year • Assist in transformation into a commercial bank Branch Expansion • Sustainable and measured growth in 4-state footprint • 24-36 months minimum profitability requirement Diversification • Fee-based businesses • Increase non-interest income as a percent of revenue 6 |
Expand into Higher-growth Markets 34 retail locations in Ohio and Michigan Network of 14 LPOs in OH, MI, and IN APB Financial Group in PA 2 Business Financial Services Centers 7 |
Mortgage Banking $8 $261 $146 $623 $1,038 $1,292 $1,387 $999 $464 $680 $900 $997 $161 $1,359 2000 2001 2002 2003 2004 2005 2006 Sales Originations Fiscal year ending 6/30 ($ in millions) 79% of 2006 Originations from LPOs 8 |
Recent Bank Acquisition: Northern Savings & Loan Company • Ohio-chartered savings association with 6 full service locations in Lorain County, Ohio • Assets of $360 MM • Closed in June, 2006 • Accretive to EPS in first full year – Price/Tangible book of 164% – Core deposit premium of 11.9% – Price/ LTM earnings of 25.2X 9 |
Northern Savings: Strategic Rationale • Natural branch fill-in between Ohio and Michigan • Access to $254 million (at 6/27/06) of low-cost deposits (wt. avg. cost = 2.94%) • Estimated cost savings and revenue enhancements of $3.1 million • Expansion of retail platforms and commercial lending opportunities 10 |
Northern Savings: Deposit Detail CD's 56.20% Money Market 17.04% Savings 13.64% NOW 10.47% Non-interest DDA 2.65% Northern Deposit value as of 6/27/2006: $254 Million 11 Deposit Mix as of June 27, 2006 |
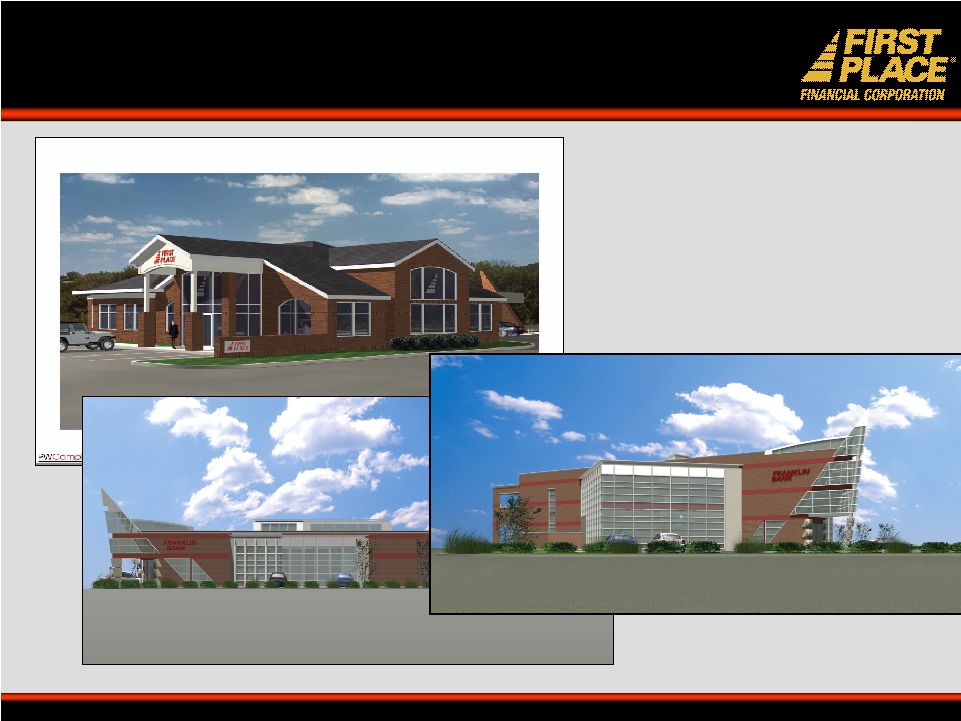
Branch Expansion 12 Goal: Core deposit growth • Sustainable growth in 4- state footprint • 24-36 months minimum profitability requirement Regional banking center — Livonia, Michigan Shelby, Michigan Howland, Ohio |
• Expand into higher-growth markets • Build infrastructure for excellence • Enhance balance sheet for greater profitability • Diversify revenue opportunities • Maintain excellent asset quality • Execute above peer median financial results • Deliver outstanding results to shareholders First Place Core Strategy 13 Transition to a High-Performing Commercial Bank |
Building an Infrastructure for Excellence • Strong management team • Flexible and effective organizational structure • Effective incentives • Development of sales culture 14 |
Infrastructure: A Strong Management Team • Steven Lewis, Chief Executive Officer 22 • Albert Blank, Chief Operating Officer 21 • Paul Musgrove, Chief Financial Officer 13 • Craig Johnson, Michigan Regional President 23 • Kenton Thompson, Ohio Regional President 26 • Bruce Wenmoth, Corporate EVP, Consumer Banking 22 • Dominique Stoeber, Corporate EVP, Retail Banking 15 • Tim Beaumont, Corporate EVP, Chief Credit Officer 25 Years in Banking 15 |
Infrastructure: Building A Sales Culture • Driven from bottom up • All Encompassing – sales staff, back office, and affiliates • Corporate Service Promises • Measurement Process – daily, weekly, monthly, quarterly, annually • Creative Recognition of Service/Sales Excellence 16 |
Incentive Compensation Drives Performance • 20 Commercial Lenders with an average of 19 years of experience • Employees have goals in four categories: – Profitability – Growth – Asset quality – Client service • All receive monthly scorecards on performance 17 |
• Expand into higher-growth markets • Build infrastructure for excellence • Enhance balance sheet for greater profitability • Diversify revenue opportunities • Maintain excellent asset quality • Execute above peer median financial results • Deliver outstanding results to shareholders First Place Core Strategy 18 Transition to a High-Performing Commercial Bank |
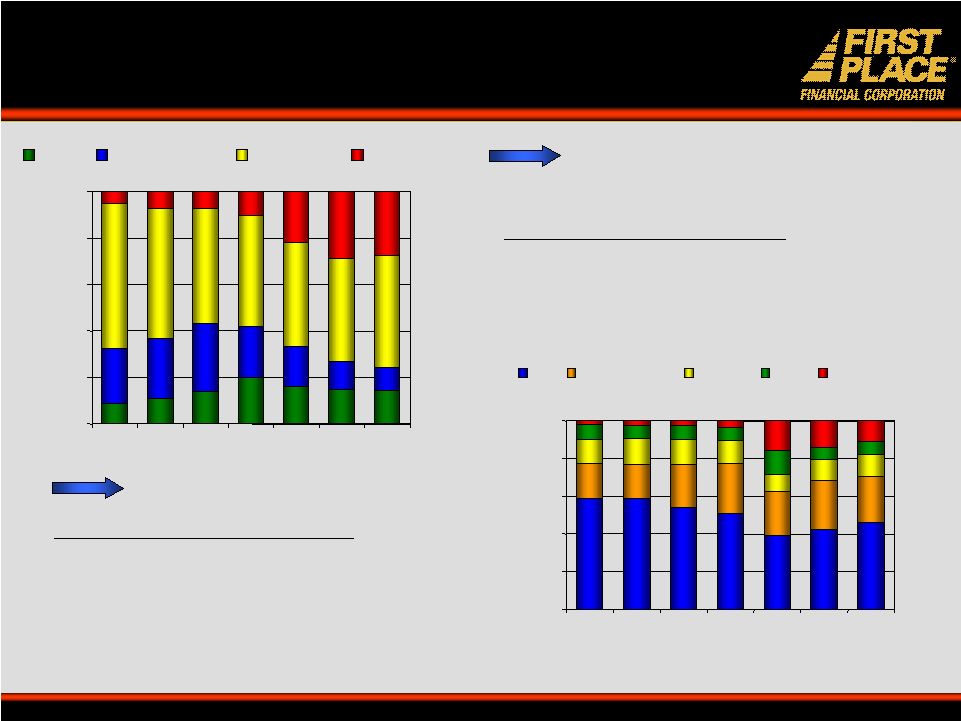
Transitioning the Balance Sheet 19 Change in Asset Mix from 2000: • Consumer loans declined from 62.5% to 48.0% • Commercial loans grew from 5.1% to 27.5% Change in Deposit Mix from 2000: • CDs declined from 59.0% to 45.7% • Non-interest DDAs grew from 1.8% to 10.9% • Core deposits = 82% of total deposits To Higher Yield Loans To Higher Yield Loans To Core Deposits To Core Deposits 0% 20% 40% 60% 80% 100% 2000 2001 2002 2003 2004 2005 2006 Other Investments Consumer Commercial 0% 20% 40% 60% 80% 100% 2000 2001 2002 2003 2004 2005 2006 CD's Money Market Savings NOW Non-interest DDA |
Asset Growth: CAGR* = 22.6% $747 $1,052 $1,593 $1,591 $1,559 $2,247 $2,499 $3,113 $0 $600 $1,200 $1,800 $2,400 $3,000 $3,600 1999 2000 2001 2002 2003 2004 2005 2006 Organic Growth* = 7.5% Organic Growth* = 7.5% ($millions) FYE 6/30: * CAGR = 7 years * CAGR = 7 years 20 |
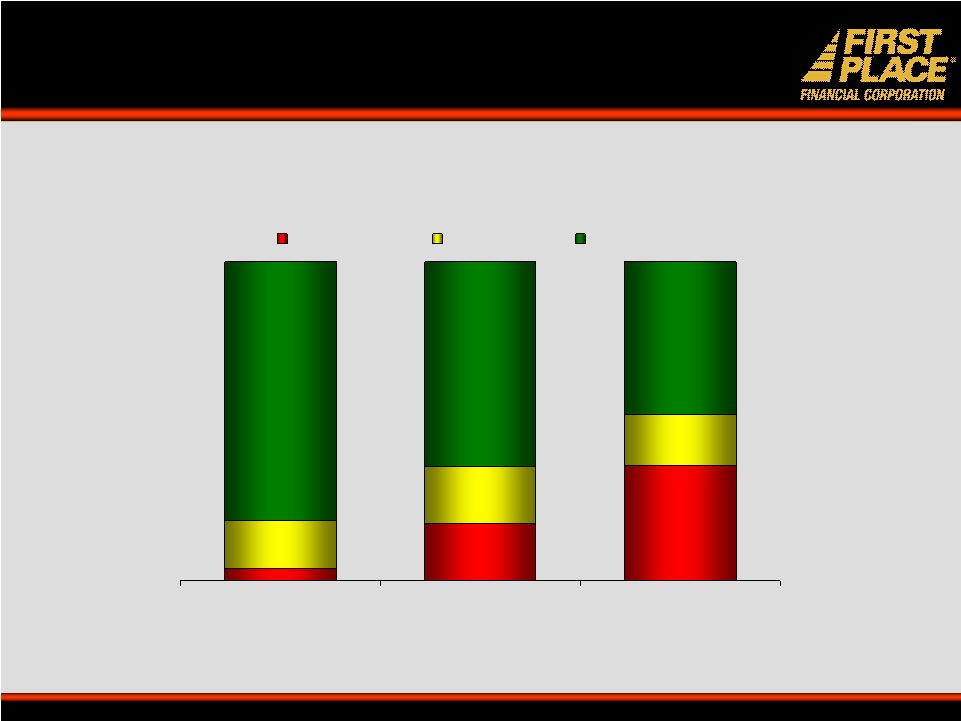
4% 18% 36% 15% 18% 16% 81% 64% 48% Commercial Consumer Real Estate A Changing Loan Mix Becoming More Bank-Like June 30, 1999 June 30, 2003 21 June 30, 2006 First Place Loan Portfolio |
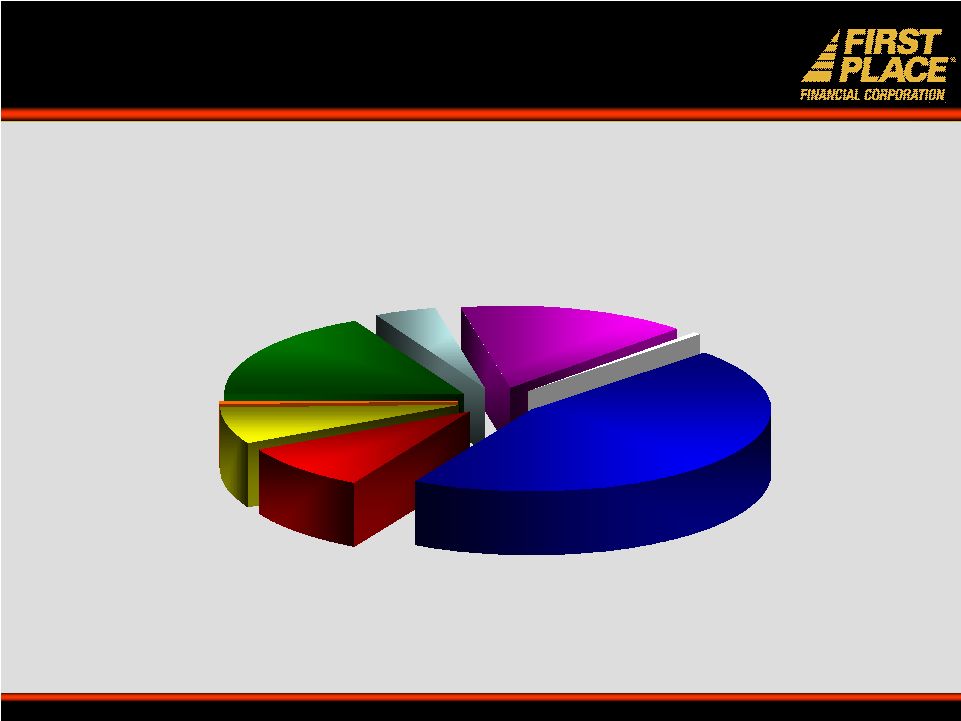
A Diversified Loan Portfolio 22 Loan portfolio value as of 6/30/2006: $2.351 Billion Loan Portfolio Mix as of June 30, 2006 Commercial Real Estate 17% Consumer 1% HELOC 7% Home Equity 9% Multi-Family Real Estate 4% C & I 16% Franklin Line 1% Residential 45% |
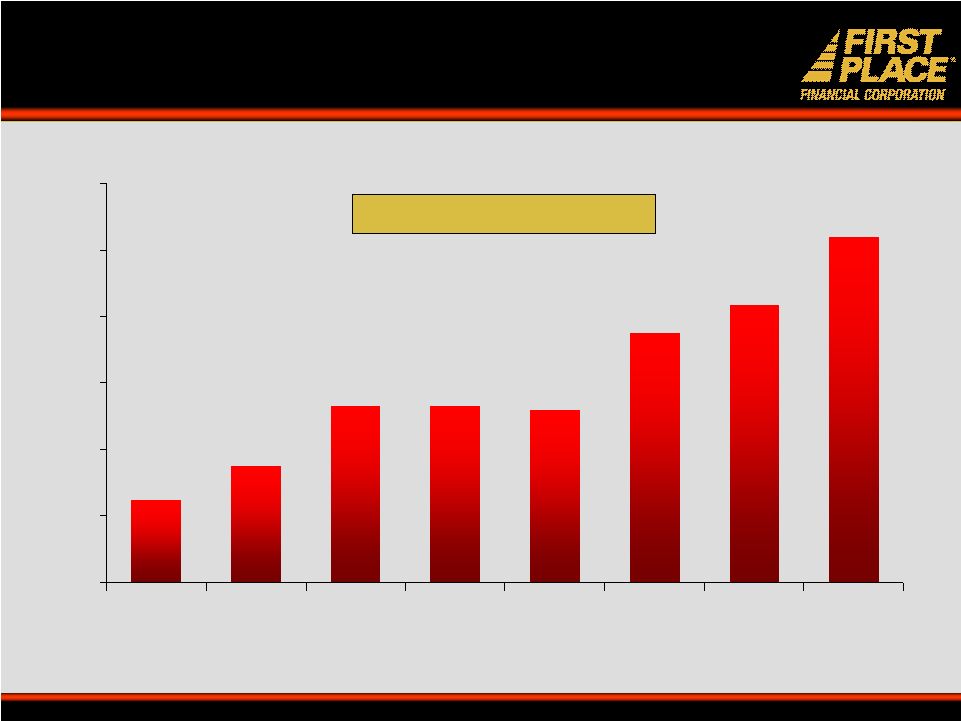
First Place: The Bank That Means Business $856 $716 $494 $160 $116 $120 $54 2000 2001 2002 2003 2004 2005 2006 Fiscal year ending 6/30 ($ in millions) Commercial Loans Commercial Loans • Mortgage and Commercial LPOs • Bank-within-a-bank • Regional Business centers • 20 commercial lenders 23 A leader in our markets for full-service commercial banking CAGR* = 58.5% * CAGR = 6 years |
C & I - 42% Multi-Family - 11% Franklin Line - 2% Commercial Real Estate - 45% Commercial Loan Diversification 24 Commercial loan total as of 6/30/2006: $856 Million Commercial Loan Mix as of June 30, 2006 |
Commercial Loans By State 52. 8% Michigan 5.4% Indiana 38.6% Ohio 1.4% Pennsylvania 25 |
$511 $867 $936 $938 $1,350 $1,405 $1,697 2000 2001 2002 2003 2004 2005 2006 Core Deposit Growth Core deposit growth strategies: • Business core deposits: • Adopt Michigan business strategy in Ohio • Consumer core deposits: • 2 new branches in SE Michigan over next 12 months • 2 branches (1 in Ohio & 1 in Michigan) will transition to new locations over next 12 months Fiscal year ending 6/30 ($ in millions) 26 CAGR* = 22.2% * CAGR = 6 years Core Deposits Core Deposits Core deposits are defined as total deposits minus all CDs over $100K |
$429 $587 $1,019 $1,061 $1,108 $1,559 $1,709 $2,061 $0 $600 $1,200 $1,800 $2,400 1999 2000 2001 2002 2003 2004 2005 2006 Deposit Growth: CAGR* = 25.1% Organic Growth* = 8.9% Organic Growth* = 8.9% ($millions) FYE 6/30: * CAGR = 7 years * CAGR = 7 years 27 |
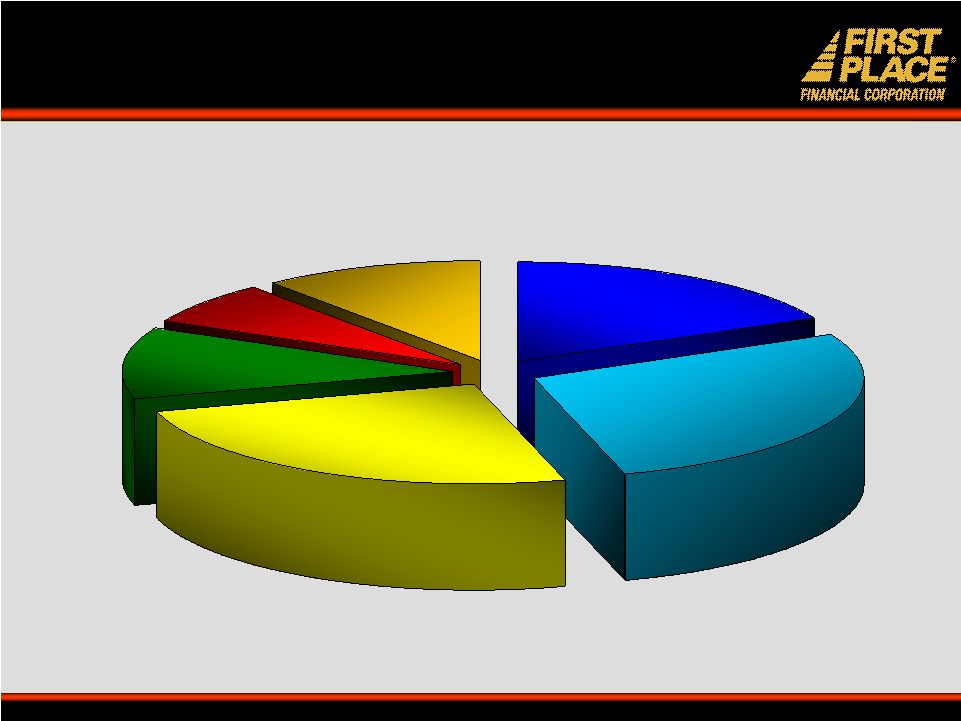
Core Deposits = 82% of Total Deposits Deposit Mix as of June 30, 2006 Deposit value as of 6/30/2006: $2.061 Billion 28 CDs over 100K 17.66% Money Market 24.82% Savings 11.75% NOW 6.83% Non-interest DDA 10.91% CDs under 100K 28.04% |
• Expand into higher-growth markets • Build infrastructure for excellence • Enhance balance sheet for greater profitability • Diversify revenue opportunities • Maintain excellent asset quality • Execute above peer median financial results • Deliver outstanding results to shareholders First Place Core Strategy 29 Transition to a High-Performing Commercial Bank |
Diversified Business Line 30 |
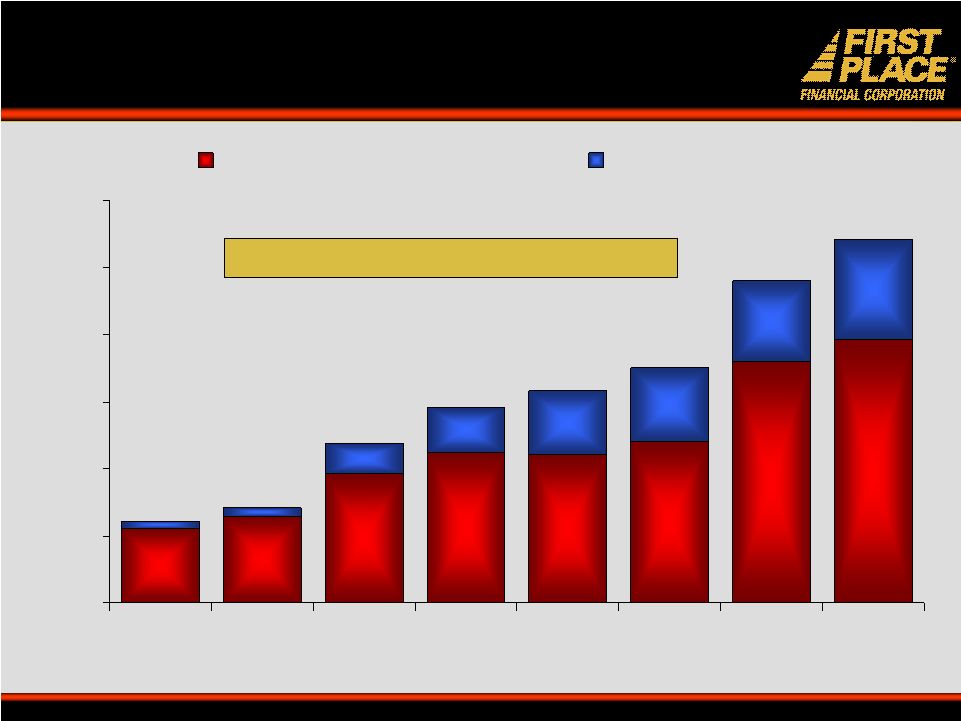
$8.9 $13.5 $19.1 $72.0 $48.2 $44.1 $44.7 $38.6 $25.8 $22.4 $78.4 $2.4 $22.0 $24.0 $2.0 $29.9 $0 $20 $40 $60 $80 $100 $120 1999 2000 2001** 2002 2003 2004 2005** 2006 Net interest Income Non-interest Income Total Operating Revenue Growth* : CAGR = 24% Non-interest Income Growth* = 47% Non-interest Income Growth* = 47% ($millions) FYE 6/30: $24.4 $28.2 $47.5 $58.2 * CAGR = 7 years 1999-2006 $63.2 $70.2 31 $96.0 $108.3 **Adjusted for one time charges: 2001, $4.8MM in restructuring losses associated with FFY merger and 2005, $5.2MM for an impairment of securities and a $1.0MM for nontaxable life insurance proceeds |
• Expand into higher-growth markets • Build infrastructure for excellence • Enhance balance sheet for greater profitability • Diversify revenue opportunities • Maintain excellent asset quality • Execute above peer median financial results • Deliver outstanding results to shareholders First Place Core Strategy 32 Transition to a High-Performing Commercial Bank |
Maintain Excellent Asset Quality • Loan production and underwriting are separated • Commercial loan officers have rapid access to decision- makers • Approval process is compressed yet efficient • Aggregate in-house limit is $15 million • Aggregate internal and external loan review process 33 |
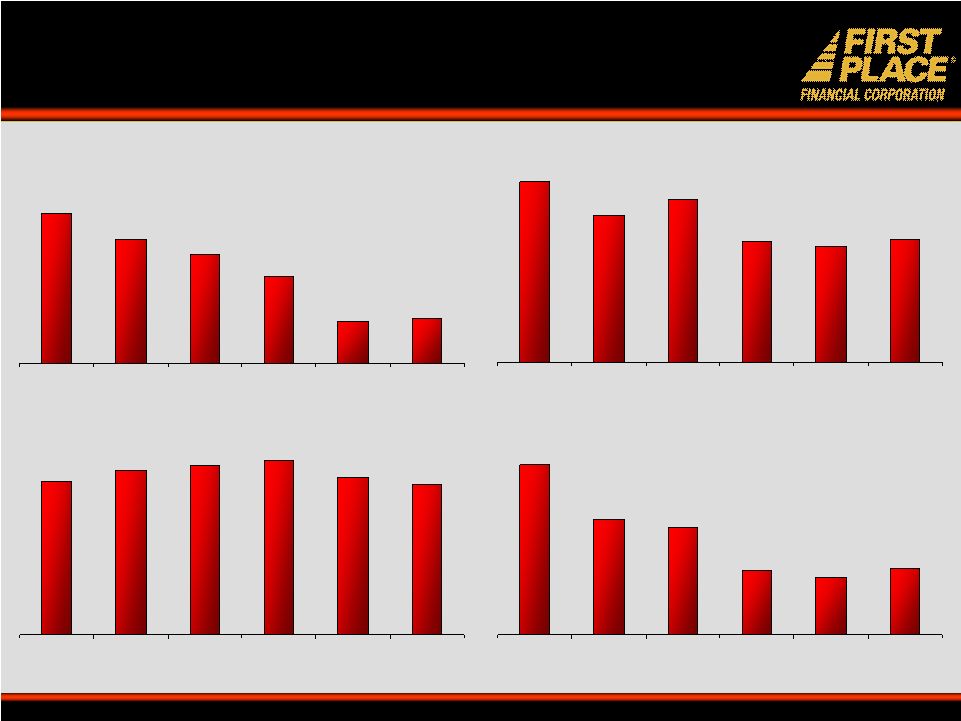
Delinquent Loans/ Loans 3.13% 2.12% 1.98% 1.19% 1.07% 1.22% 2001 2002 2003 2004 2005 2006 Asset Quality Net Charge-offs/ Average Loans 0.40% 0.33% 0.29% 0.23% 0.11% 0.12% 2001 2002 2003 2004 2005 2006 34 NPAs/ Assets 0.97% 0.79% 0.88% 0.65% 0.62% 0.66% 2001 2002 2003 2004 2005 2006 Loan Loss Reserves/ Loans 0.97% 1.04% 1.07% 1.10% 1.00% 0.95% 2001 2002 2003 2004 2005 2006 |
• Expand into higher-growth markets • Build infrastructure for excellence • Enhance balance sheet for greater profitability • Diversify revenue opportunities • Maintain excellent asset quality • Execute above peer median financial results • Deliver outstanding results to shareholders First Place Core Strategy 35 Transition to a High-Performing Commercial Bank |
First Place Strategic Goal: 36 Complete transformation to a diversified financial services company < 0.65% < 0.20% > 6.50% > 1.00% > 10.00% > 13.50% < 60% > 11% >10% >15%/ 14% >11%/ 10% - - - 2007 Strategic Plan 25% 13% 28%/ 20% 21%/ 21% 18% 28% 11% Growth: Assets Core EPS Loans / Commercial Loans Deposits/ Core Deposits Operating Revenue Non-interest Income/ Revenue Non-Interest Expense 0.66% 0.12% 6.85% Asset quality: NPAs/Assets NCOs Tang Equity/Tang Assets 0.94% 9.89% 13.76% 57.5% Performance: Core ROA Core ROE Core ROTE Core Efficiency* FY 2006 * Excludes CDI amortization |
Year-To-Date Performance: LTM 0.66 0.12 6.85 0.94 9.89 13.76 57.50 3.29 3,113 24,457 1.65 1,359,000 856,129 1,697 108,342 65,977 FY 2006 + 4 bp + 1 bp 0 bp + 5 bp + 53 bp + 6 bp - 194 bp - 4 bp 24.6% 14.6% 13.0% -2.0% 19.6% 20.8% 18.0% 7.2% Variance 2,499 21,343 1.46 1,386,800 715,903 1,405 91,800 61,546 Growth: Assets ($MM) Core Net Income ($M) Core EPS ($) Mortgage Originations ($M) Commercial Loans ($M) Core Deposits ($MM) Operating Revenue ($M) Core Non-Interest Expense ($M) 0.62 0.11 6.85 Asset quality: NPAs/Assets (%) NCOs/Loans (%) Tang Equity/Tang Assets (%) 0.89 9.36 13.70 59.44 3.33 Performance: Core ROA (%) Core ROE (%) Core ROTE (%) Core Efficiency* (%) NIM (%) FY 2005 37 *Excludes CDI Amortization |
$25.3 $26.3 $26.5 $27.9 $27.6 $16.0 $16.1 $16.5 $16.7 $16.6 4Q'05 1Q'06 2Q'06 3Q'06 4Q'06 Operating Revenue Non-interest Expense Operating Revenue versus Core Non-interest Expense 38 Values in millions CAGR = 3.7% CAGR = 9.2% |
Impact of Northern Merger* 6/30/2006 4Q2006 $ .12 Impact of Merger $ .02 Provision for Loan Loss $ .10 Merger, Restructuring Charges Related to Northern Merger $ .30 Gap Income 39 *Per Diluted shares outstanding |
Net Income to Core Net Income* $.40 $5,918 $.43 $6,326 $.41 $6,046 $.42 $6,167 $.41 $5,955 Core Earnings $.10 $.30 $1,413 - - - - - - - - Merger, integration and restructuring, net of tax 14,950 $4,505 6/30/2006 4Q2006 $.43 $.41 $.42 $.41 3/31/2006 3Q2006 12/31/2005 2Q2006 9/30/2005 1Q2006 6/30/2005 4Q2005 14,841 14,780 14,710 14,639 Avg. Diluted Shares Outstanding $6,326 $6,046 $6,167 $5,955 GAAP Net Income 40 *Values in thousands and per Diluted share |
$1.29 $0.72 $1.65 $1.20 $1.46 $1.16 2001 2002 2003 2004 2005 2006 Core Diluted EPS Diluted EPS: 2001-2006 $1.30 $1.09 $0.54 $1.16 $1.55 $1.29 2001 2002 2003 2004 2005 2006 GAAP Diluted EPS 41 2001: 11,784 2002: 14,035 2003: 12,967 2004: 12,972 2005: 14, 623 Average Diluted Shares Outstanding (thousands): 2006: 14,821 Fiscal Year Ended: 6/30 CAGR* = 18.0% CAGR* = 23.5% *CAGR = 5 years 2001-2006 |
Performance Measures 3/31/2006 Peers** LTM 6/30/2006 4Q2006 3/31/2006 3Q2006 12/31/2005 2Q2006 9/30/2005 1Q2006 6/30/2005 4Q2005 60.3% 56.3% 58.2% 58.5% 57.0% 59.3% Core Efficiency* 13.24% 12.66% 14.22% 13.77% 14.46% 14.63% Core ROTE 10.99% 9.22% 10.30% 9.86% 10.23% 10.18% Core ROE 1.02% .88% .98% .93% .96% .96% Core ROA 42 *Excludes CDI Amortization **Peers: Publicly Traded Banks & Thrifts with Assets between $1.0 - $5.0 Billion located in IL, IN, MI, OH & PA |
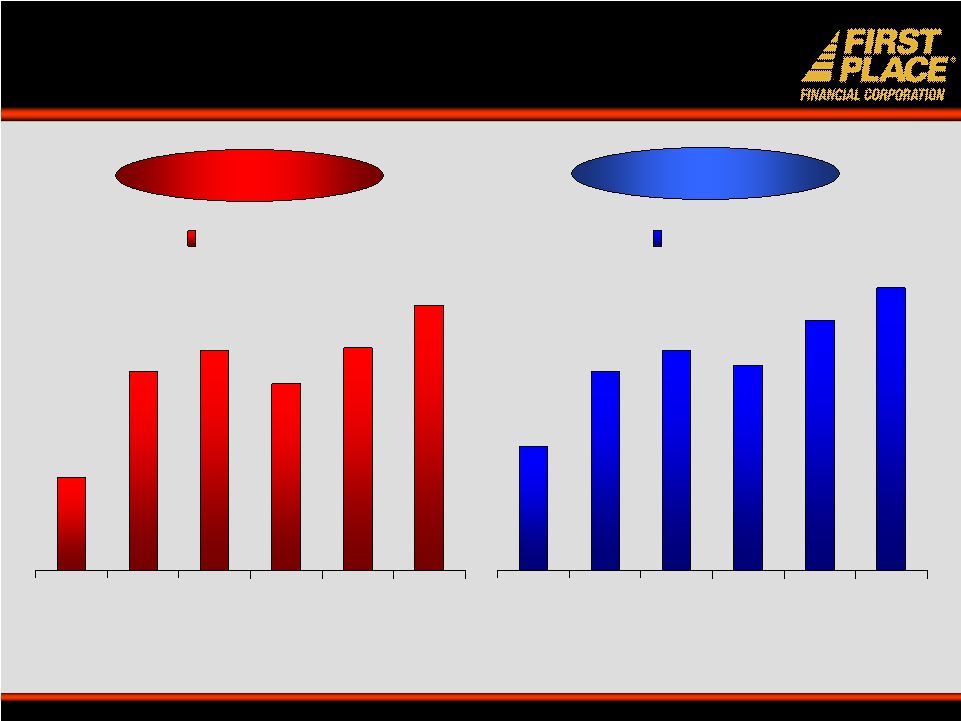
Core ROA and Core ROE : 2001-2006 43 Core ROA Core ROE *Peers: Publicly Traded Banks & Thrifts with Assets between $1.0 - $5.0 Billion located in IL, IN, MI, OH & PA. Values for LTM as of 3/31/2006 0.47% 0.99% 1.08% 0.83% 0.89% 0.94% 1.02% 2001 2002 2003 2004 2005 2006 Peers* 3.70% 8.54% 9.23% 7.46% 9.36% 9.89% 10.99% 2001 2002 2003 2004 2005 2006 Peers* |
• Expand into higher-growth markets • Build infrastructure for excellence • Enhance balance sheet for greater profitability • Diversify revenue opportunities • Maintain excellent asset quality • Execute above peer median financial results • Deliver outstanding results to shareholders First Place Core Strategy 44 Transition to a High-Performing Commercial Bank |
Investment Highlights • Proven management team • Diversified balance sheet • Asset-sensitive to interest-rate risk • Positive earning trends • Strong asset quality • Strong quality of earnings • Diversified markets • Commercial loan growth • Core deposit growth • Excellent Timing 45 |
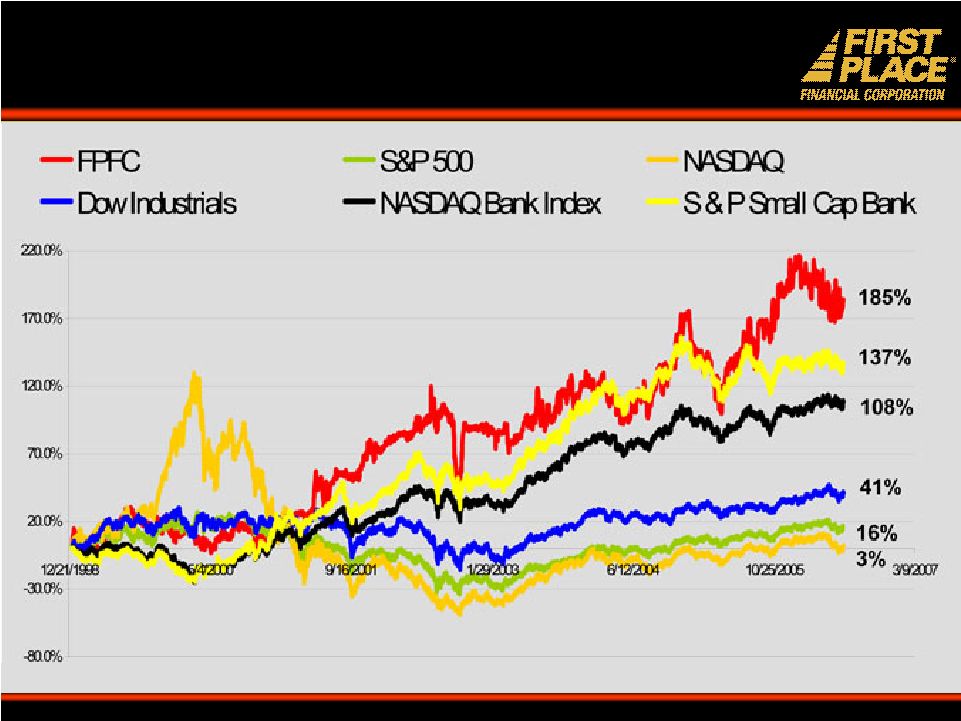
46 Total Return Comparison Returns are from 1/1/1999 to 06/30/2006 |
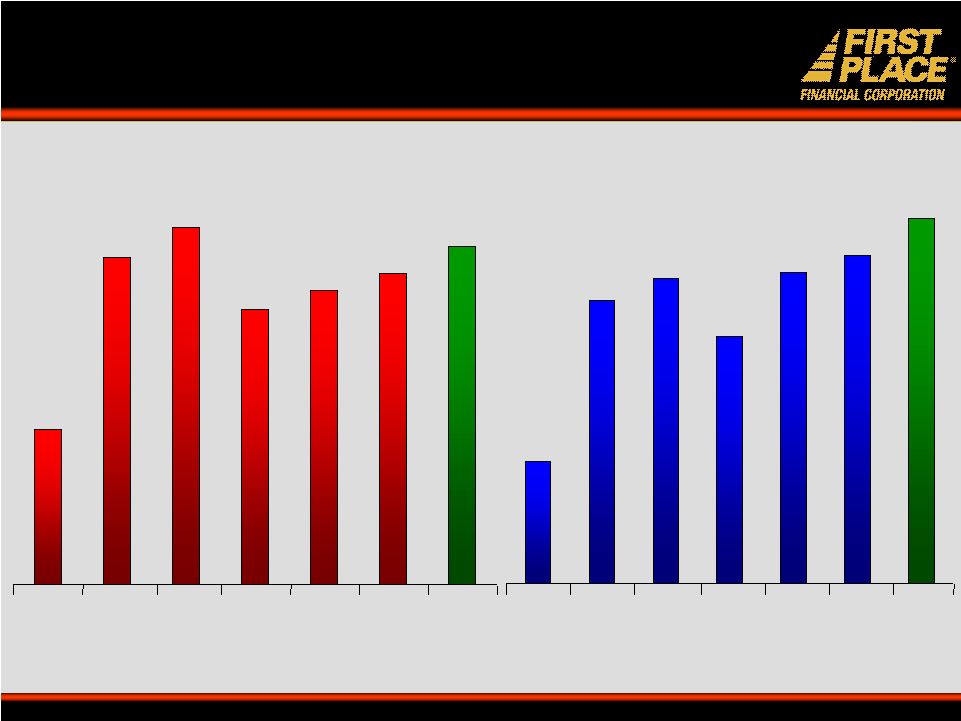
FPFC: Superior Performance* 9.64% 19.67% 16.73% 11.95% 15.56% 5.55% 6.49% 4.66% 9.82% 11.20% Core EPS Growth 3 Year Revenue Growth 3 Year Annualized Total Return 1 Year Annualized Total Return 3 Year Annualized Total Return 5 Year FPFC Peers 47 Peers: Publicly Traded Banks & Thrifts with Assets between $1.0 - $5.0 Billion located in IL, IN, MI, OH & PA Core EPS and Revenue Growth are for 3 years ended 3/31/06 and Return values are for 1,3 & 5 years ending 6/30/06 |
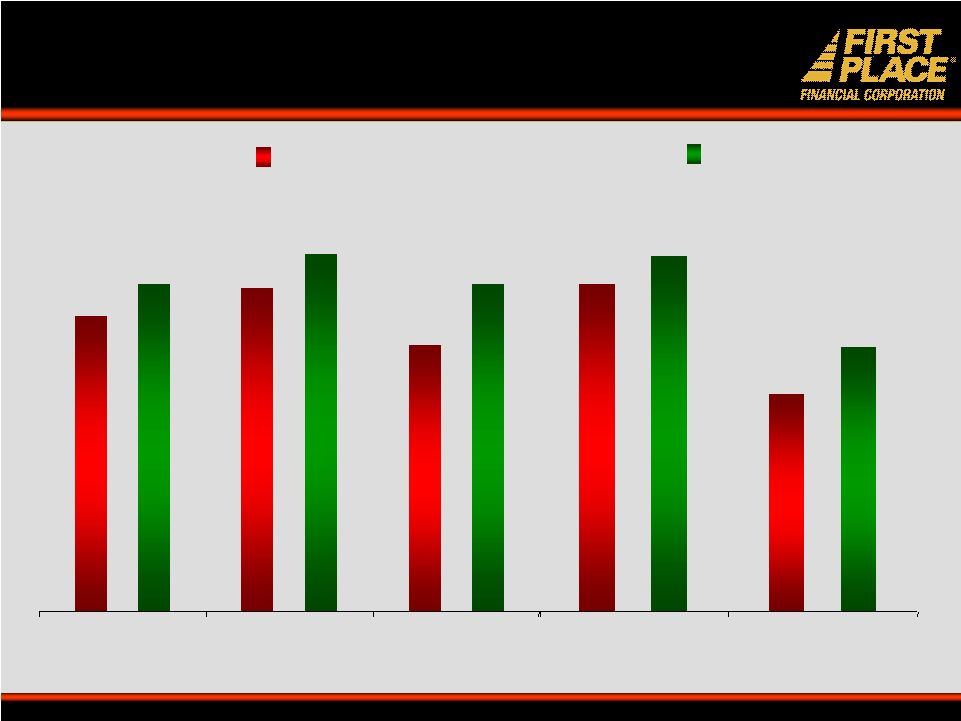
FPFC: An Attractive Investment Opportunity* 48 *Peers: Publicly Traded Banks & Thrifts with Assets between $1.0 - $5.0 Billion located in IL, IN, MI, OH & PA ratios and multiples as of 6/30/06 % % 12.70 X 13.90 X 11.50 14.10 X 15.40 X 14.1 Price to Forward 12 months Core EPS Price to LTM Core EPS Core Deposit Premium FPFC 195% 129% 212% 158% Price to Tangible Book Price to Book Peers |
The Bank That Means The Bank That Means Business Business |