Table of Contents
UNITED STATES
SECURITIES AND EXCHANGE COMMISSION
Washington, D.C. 20549
FORMN-CSR
CERTIFIED SHAREHOLDER REPORT OF REGISTERED
MANAGEMENT INVESTMENT COMPANIES
Investment Company Act file number811-08985
Western Asset Corporate Loan Fund Inc.
(Exact name of registrant as specified in charter)
620 Eighth Avenue, 49th Floor, New York, NY 10018
(Address of principal executive offices) (Zip code)
Robert I. Frenkel, Esq.
Legg Mason & Co., LLC
100 First Stamford Place
Stamford, CT 06902
(Name and address of agent for service)
Registrant’s telephone number, including area code:(877)-777-0102
Date of fiscal year end: September 30
Date of reporting period: March 31, 2019
Table of Contents
ITEM 1. REPORT TO STOCKHOLDERS.
TheSemi-Annual Report to Stockholders is filed herewith.
Table of Contents

| Semi-Annual Report | March 31, 2019 |
WESTERN ASSET
CORPORATE LOAN FUND INC. (TLI)
Beginning in March 2021, as permitted by regulations adopted by the Securities and Exchange Commission, the Fund intends to no longer mail paper copies of the Fund’s shareholder reports like this one, unless you specifically request paper copies of the reports from the Fund or from your financial intermediary (such as a broker-dealer or bank). Instead, the reports will be made available on a website, and you will be notified by mail each time a report is posted and provided with a website link to access the report.
If you invest through a financial intermediary and you already elected to receive shareholder reports electronically(“e-delivery”), you will not be affected by this change and you need not take any action. If you have not already electede-delivery, you may elect to receive shareholder reports and other communications from the Fund electronically by contacting your financial intermediary.
You may elect to receive all future reports in paper free of charge. If you invest through a financial intermediary, you can contact your financial intermediary to request that you continue to receive paper copies of your shareholder reports. That election will apply to all Legg Mason funds held in your account at that financial intermediary. If you are a direct shareholder with the Fund, you can call the Fund at1-888-888-0151, or write to the Fund by regular mail at P.O. Box 505000, Louisville, KY 40233 or by overnight delivery to Computershare, 462 South 4th Street, Suite 1600, Louisville, KY 40202 to let the Fund know you wish to continue receiving paper copies of your shareholder reports. That election will apply to all Legg Mason Funds held in your account held directly with the fund complex.

| INVESTMENT PRODUCTS: NOT FDIC INSURED • NO BANK GUARANTEE • MAY LOSE VALUE |
Table of Contents
Fund objective
The Fund’s investment objective is to maximize current income consistent with prudent efforts to preserve capital.
The Fund invests primarily in floating- or variable-rate collateralized senior loans to corporations, partnerships or other business entities operating in various industries and geographic regions.

Dear Shareholder,
We are pleased to provide the semi-annual report of Western Asset Corporate Loan Fund Inc. for thesix-month reporting period ended March 31, 2019. Please read on for Fund performance information and a detailed look at prevailing economic and market conditions during the Fund’s reporting period.
As always, we remain committed to providing you with excellent service and a full spectrum of investment choices. We also remain committed to supplementing the support you receive from your financial advisor. One way we accomplish this is through our website, www.lmcef.com. Here you can gain immediate access to market and investment information, including:
| • | Fund prices and performance, |
| • | Market insights and commentaries from our portfolio managers, and |
| • | A host of educational resources. |
We look forward to helping you meet your financial goals.
Sincerely,

Jane Trust, CFA
Chairman, President and Chief Executive Officer
April 26, 2019
| II | Western Asset Corporate Loan Fund Inc. |
Table of Contents
Economic review
Economic activity in the U.S. was mixed during the six months ended March 31, 2019 (the “reporting period”). Looking back, the U.S. Department of Commerce reported that third quarter 2018 U.S. gross domestic product (“GDP”)i growth was 3.4%. Fourth quarter 2018 GDP growth then moderated to 2.2%. Finally, the U.S. Department of Commerce’s initial reading for first quarter 2019 GDP growth, released after the reporting period ended, was 3.2%. The acceleration in GDP growth during the first quarter of 2019 was attributed to an upturn in state and local government spending, increases in private inventory investment and exports, and a smaller decrease in residential investment. These movements were partly offset by decelerations in personal consumption expenditures and nonresidential fixed investment, along with a downturn in federal government spending.
Job growth in the U.S. was solid overall and was a tailwind for the economy during the reporting period. As reported by the U.S. Department of Labor, when the reporting period ended on March 31, 2019, the unemployment rate was 3.8%, versus 3.7% when the period began. This modest uptick was partially due to an increase in the workforce participation rate. The percentage of longer-term unemployed declined during the reporting period. In March 2019, 21.1% of Americans looking for a job had been out of work for more than six months, versus 22.5% when the period began.
| Western Asset Corporate Loan Fund Inc. | III |
Table of Contents
Investment commentary (cont’d)
Market review
Q. How did the Federal Reserve Board (the “Fed”)ii respond to the economic environment?
A. The Fed continued tightening its monetary policy, as it raised interest rates once during the reporting period and further reduced its balance sheet. As widely expected, the Fed raised the federal funds rateiii at its meeting that ended on December 19, 2018, to a range between 2.25% and 2.50%. This represented the Fed’s fourth rate hike in 2018. However, at its meeting that concluded on January 30, 2019, the Fed kept interest rates on hold and said, “In light of global economic and financial developments and muted inflation pressures, the Committee will be patient as it determines what future adjustments to the target range for the federal funds rate may be appropriate ….” Finally, at its meeting that concluded on March 20, 2019, most Federal Open Market Committee (“FOMC”)iv members indicated that they did not feel additional rate hikes would be needed in 2019.
Q. Did Treasury yields trend higher or lower during the reporting period?
A. Both short-term and longer-term U.S. Treasury yields declined during thesix-month reporting period ended March 31, 2019. The yield for thetwo-year Treasury note began the reporting period at 2.81% and ended the period at 2.27%. The low for the period of 2.22% took place on March 27, 2019, and the peak for the period of 2.98% occurred on November 8, 2018. The yield for theten-year Treasury began the reporting period at 3.05% and ended the period at 2.41%. The low for the period of 2.39% took place on March 27, 2019, and the high for the period of 3.24% took place on November 8, 2018.
Q. What factors impacted the spread sectors(non-Treasuries) during the reporting period?
A.The spread sectors posted positive absolute returns during the reporting period. Performance fluctuated given changing expectations for global growth, central bank monetary policy adjustments, concerns over the trade conflict between the U.S. and China, and periods of investor risk aversion. All told, the broad U.S. bond market, as measured by the Bloomberg Barclays U.S. Aggregate Indexv, returned 4.63% during thesix-month reporting period ended March 31, 2019.
Performance review
For the six months ended March 31, 2019, Western Asset Corporate Loan Fund Inc. returned-0.43% based on its net asset value (“NAV”)vi and-1.47% based on its New York Stock Exchange (“NYSE”) market price per share. The S&P/LSTA Performing Loan Indexvii and the Lipper Loan ParticipationClosed-End Funds Category Averageviii returned 0.36% and-0.82%, respectively, for the same period. Please note that Lipper performance returns are based on each fund’s NAV.
During thissix-month period, the Fund made distributions to shareholders totaling $0.32 per share. As of March 31, 2019, the Fund estimates that all of the distributions were sourced from net investment income.* The
| * | These estimates are not for tax purposes. The Fund will issue a Form 1099 with final composition of the distributions for tax purposes afteryear-end. A return of capital is not taxable and results in a reduction in the tax basis of a shareholder’s investment. For more information about a distribution’s composition, please refer to the Fund’s distribution press release or, if applicable, the Section 19 notice located in the press release section of our website, www.lmcef.com (click on the name of the Fund). |
| IV | Western Asset Corporate Loan Fund Inc. |
Table of Contents
performance table shows the Fund’ssix-month total return based on its NAV and market price as of March 31, 2019.Past performance is no guarantee of future results.
| Performance Snapshotas of March 31, 2019 (unaudited) | ||||
| Price Per Share | 6-Month Total Return** | |||
| $10.90 (NAV) | -0.43 | %† | ||
| $9.47 (Market Price) | -1.47 | %‡ | ||
All figures represent past performance and are not a guarantee of future results. Performance figures for periods shorter than one year represent cumulative figures and are not annualized.
** Total returns are based on changes in NAV or market price, respectively. Returns reflect the deduction of all Fund expenses, including management fees, operating expenses, and other Fund expenses. Returns do not reflect the deduction of brokerage commissions or taxes that investors may pay on distributions or the sale of shares.
† Total return assumes the reinvestment of all distributions, including returns of capital, if any, at NAV.
‡ Total return assumes the reinvestment of all distributions, including returns of capital, if any, in additional shares in accordance with the Fund’s Dividend Reinvestment Plan.
Looking for additional information?
The Fund is traded under the symbol “TLI” and its closing market price is available in most newspapers under the NYSE listings. The daily NAV is availableon-line under the symbol “XTLIX” on most financial websites.Barron’s and the Wall Street Journal’sMonday edition both carryclosed-end fund tables that provide additional information. In addition, the Fund issues a quarterly press release that can be found on most major financial websites as well as www.lmcef.com (click on the name of the Fund).
In a continuing effort to provide information concerning the Fund, shareholders may call1-888-777-0102 (toll free), Monday through Friday from 8:00 a.m. to 5:30 p.m. Eastern time, for the Fund’s current NAV, market price and other information.
Thank you for your investment in Western Asset Corporate Loan Fund Inc. As always, we appreciate that you have chosen us to manage your assets and we remain focused on achieving the Fund’s investment goals.
Sincerely,
Jane Trust, CFA
Chairman, President and
Chief Executive Officer
April 26, 2019
RISKS: The Fund is anon-diversified,closed-end management investment company designed primarily as a long-term investment and not as a trading vehicle. The Fund is not intended to be a complete investment program and, due to the uncertainty inherent in all investments, there can be no assurance that the Fund will achieve its investment objective. The Fund’s common stock is traded on the New York Stock Exchange. Similar to stocks, the Fund’s share price will fluctuate with market conditions and, at the time of sale, may be worth more or less than the original investment. Shares ofclosed-end funds often trade at a discount to their net asset value. Because the Fund isnon-diversified, it may be
| Western Asset Corporate Loan Fund Inc. | V |
Table of Contents
Investment commentary (cont’d)
more susceptible to economic, political or regulatory events than a diversified fund. The Fund invests in fixed-income securities which are subject to a number of risks, such as credit risk, the risk of nonpayment of scheduled interest or loan payments, which could lower the Fund’s value. The Fund can normally be expected to have less significant interest rate related fluctuations in its NAV than investment companies investing primarily in fixed rate fixed-income securities (other than money market funds) because the floating or variable rate collateralized senior loans in which the Fund invests float in response to changes in prevailing market interest rates. Because floating or variable interest rates on collateralized senior loans reset periodically, however, there can be some, typically short term, dislocation between prevailing market interest rates and the interest rates paid on the Fund’s collateralized senior loans. Accordingly, the Fund’s NAV may experience related fluctuations from time to time. Similarly, a sudden and extreme increase in prevailing interest rates may cause a decline in the Fund’s NAV. The Fund may invest in foreign securities which are subject to certain risks not associated with domestic investing, such as currency fluctuations, and changes in political, social and economic conditions, which could increase volatility. High-yield lower-rated securities (commonly known as “junk bonds”), involve greater credit and liquidity risks than investment grade securities.
Leverage may result in greater volatility of NAV and the market price of common shares and increases a shareholder’s risk of loss. The Fund may make investments in derivative instruments. Derivative instruments can be illiquid, may disproportionately increase losses, and have a potentially large impact on Fund performance.
All investments are subject to risk including the possible loss of principal. Past performance is no guarantee of future results. All index performance reflects no deduction for fees, expenses or taxes. Please note that an investor cannot invest directly in an index.
The information provided is not intended to be a forecast of future events, a guarantee of future results or investment advice. Views expressed may differ from those of the firm as a whole.
| VI | Western Asset Corporate Loan Fund Inc. |
Table of Contents
| i | Gross domestic product (“GDP”) is the market value of all final goods and services produced within a country in a given period of time. |
| ii | The Federal Reserve Board (the “Fed”) is responsible for the formulation of U.S. policies designed to promote economic growth, full employment, stable prices and a sustainable pattern of international trade and payments. |
| iii | The federal funds rate is the rate charged by one depository institution on an overnight sale of immediately available funds (balances at the Federal Reserve) to another depository institution; the rate may vary from depository institution to depository institution and from day to day. |
| iv | The Federal Open Market Committee (“FOMC”) is a policy-making body of the Federal Reserve System responsible for the formulation of a policy designed to promote economic growth, full employment, stable prices and a sustainable pattern of international trade and payments. |
| v | The Bloomberg Barclays U.S. Aggregate Index is a broad-based bond index comprised of government, corporate, mortgage- and asset-backed issues, rated investment grade or higher, and having at least one year to maturity. |
| vi | Net asset value (“NAV”) is calculated by subtracting total liabilities, including liabilities associated with financial leverage (if any), from the closing value of all securities held by the Fund (plus all other assets) and dividing the result (total net assets) by the total number of the common shares outstanding. The NAV fluctuates with changes in the market prices of securities in which the Fund has invested. However, the price at which an investor may buy or sell shares of the Fund is the Fund’s market price as determined by supply of and demand for the Fund’s shares. |
| vii | The S&P/LSTA Performing Loan Index is asub-index of the S&P/LSTA Leveraged Loan Index (LLI) and it is all loans excluding those in payment default. The S&P/LSTA Leveraged Loan Index tracks the current outstanding balance and spread over LIBOR for fully funded term loans. The facilities included represent a broad cross section of leveraged loans syndicated in the U.S., including dollar denominated loans to overseas issuers. The market value return component of the Index is based on secondary market pricing received from dealers. |
| viii | Lipper, Inc., a wholly-owned subsidiary of Reuters, provides independent insight on global collective investments. Returns are based on thesix-month period ended March 31, 2019, including the reinvestment of all distributions, including returns of capital, if any, calculated among the 47 funds in the Fund’s Lipper category. |
| Western Asset Corporate Loan Fund Inc. | VII |
Table of Contents
Investment breakdown(%) as a percent of total investments
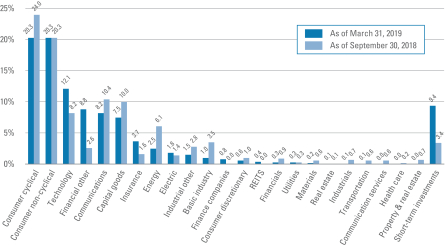
| † | The bar graph above represents the composition of the Fund’s investments as of March 31, 2019 and September 30, 2018. The Fund is actively managed. As a result, the composition of the Fund’s investments is subject to change at any time. |
| Western Asset Corporate Loan Fund Inc. 2019 Semi-Annual Report | 1 |
Table of Contents
Economic exposure —March 31, 2019
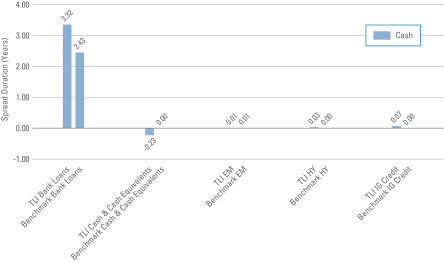
| Total Spread Duration | ||
| TLI | — 3.20 years | |
| Benchmark | — 2.44 years | |
Spread duration measures the sensitivity to changes in spreads. The spread over Treasuries is the annual risk-premium demanded by investors to holdnon-Treasury securities. Spread duration is quantified as the % change in price resulting from a 100 basis points change in spreads. For a security with positive spread duration, an increase in spreads would result in a price decline and a decline in spreads would result in a price increase. This chart highlights the market sector exposure of the Fund’s sectors relative to the selected benchmark sectors as of the end of the reporting period.
| Benchmark | — S&P/LSTA Performing Loan Index | |
| TLI | — Western Asset Corporate Loan Fund Inc. | |
| EM | — Emerging Markets | |
| HY | — High Yield | |
| IG | — Investment Grade Credit | |
| 2 | Western Asset Corporate Loan Fund Inc. 2019 Semi-Annual Report |
Table of Contents
Interest rate exposure —March 31, 2019
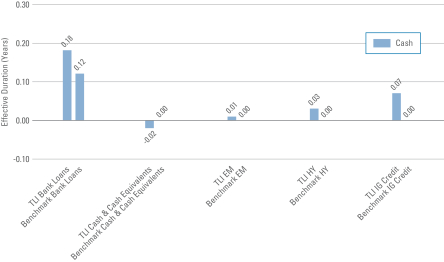
| Total Effective Duration | ||
| TLI | — 0.27 years | |
| Benchmark | — 0.12 years | |
Effective duration measures the sensitivity to changes in relevant interest rates. Effective duration is quantified as the % change in price resulting from a 100 basis points change in interest rates. For a security with positive effective duration, an increase in interest rates would result in a price decline and a decline in interest rates would result in a price increase. This chart highlights the interest rate exposure of the Fund’s sectors relative to the selected benchmark sectors as of the end of the reporting period.
| Benchmark | — S&P/LSTA Performing Loan Index | |
| TLI | — Western Asset Corporate Loan Fund Inc. | |
| EM | — Emerging Markets | |
| HY | — High Yield | |
| IG | — Investment Grade Credit | |
| Western Asset Corporate Loan Fund Inc. 2019 Semi-Annual Report | 3 |
Table of Contents
Schedule of investments(unaudited)
March 31, 2019
Western Asset Corporate Loan Fund Inc.
| Security† | Rate | Maturity Date | Face Amount | Value | ||||||||||||
| Senior Loans (a)(b) — 144.4% | ||||||||||||||||
Basic Industry — 1.7% | ||||||||||||||||
Frontdoor Inc., Initial Term Loan (1 mo. USD LIBOR + 2.500%) | 5.000 | % | 8/18/25 | $ | 199,000 | $ | 198,503 | (c)(d) | ||||||||
PQ Corp., Third Amendment Term Loan B1 (3 mo. USD LIBOR + 2.500%) | 5.244 | % | 2/8/25 | 524,931 | 519,681 | (d) | ||||||||||
Starfruit FInco BV, Initial Dollar Term Loan (1 mo. USD LIBOR + 3.250%) | 5.740 | % | 10/1/25 | 1,110,000 | 1,095,771 | (d) | ||||||||||
Total Basic Industry | 1,813,955 | |||||||||||||||
Capital Goods — 12.2% | ||||||||||||||||
American Traffic Solutions Inc., First Lien Initial Term Loan (1 mo. USD LIBOR + 3.750%) | 6.249 | % | 2/28/25 | 783,095 | 783,829 | (d) | ||||||||||
Brookfield WEC Holdings Inc., First Lien Initial Term Loan (1 mo. USD LIBOR + 3.750%) | 6.249 | % | 8/1/25 | 1,167,075 | 1,167,221 | (d) | ||||||||||
Concrete Pumping Holdings Inc., Initial Term Loan (Prime + 5.000%) | 10.500 | % | 11/14/25 | 390,000 | 379,275 | (d) | ||||||||||
Concrete Pumping Holdings Inc., Initial Term Loan | — | 12/12/25 | 250,000 | 243,125 | (e) | |||||||||||
Core & Main LP, Initial Term Loan (3 mo. USD LIBOR + 3.000%) | 5.626 | % | 8/1/24 | 730,750 | 726,165 | (c)(d) | ||||||||||
Ply Gem Midco Inc., Initial Term Loan (3 mo. USD LIBOR + 3.750%) | 6.547 | % | 4/12/25 | 664,975 | 635,051 | (c)(d) | ||||||||||
Printpack Holdings Inc., New Term Loan (1 mo. USD LIBOR + 3.000%) | 5.500 | % | 7/26/23 | 656,410 | 640,000 | (c)(d) | ||||||||||
Reynolds Group Holdings Inc., Incremental Term Loan (1 mo. USD LIBOR + 2.750%) | 5.249 | % | 2/6/23 | 2,211,532 | 2,188,431 | (d) | ||||||||||
Ring Container Technologies LLC, First Lien Initial Term Loan (1 mo. USD LIBOR + 2.750%) | 5.249 | % | 10/31/24 | 582,624 | 572,671 | (d) | ||||||||||
Transdigm Inc., 2018 New Term Loan E (1 mo. USD LIBOR + 2.500%) | 4.999 | % | 5/30/25 | 1,053,277 | 1,027,439 | (d) | ||||||||||
Transdigm Inc., 2018 New Term Loan F (1 mo. USD LIBOR + 2.500%) | 4.999 | % | 6/9/23 | 935,798 | 915,181 | (d) | ||||||||||
Travelport Finance (Luxembourg) SARL, First Lien Term Loan | — | 3/18/26 | 1,470,000 | 1,436,006 | (e) | |||||||||||
Ventia Deco LLC, 2017 Refinancing Term Loan B (3 mo. USD LIBOR + 3.500%) | 6.101 | % | 5/20/22 | 351,814 | 351,814 | (c)(d) | ||||||||||
Vertex Aerospace Service Corp., Initial Term Loan (1 mo. USD LIBOR + 4.750%) | 7.249 | % | 6/30/25 | 386,868 | 387,956 | (d) | ||||||||||
WP CPP Holdings LLC, First Lien Initial Term Loan (3 mo. USD LIBOR + 3.750%) | 6.510 | % | 4/30/25 | 1,354,447 | 1,346,404 | (d)(e) | ||||||||||
WP CPP Holdings LLC, Second Lien Term Loan (3 mo. USD LIBOR + 7.750%) | 10.510 | % | 4/30/26 | 410,000 | 408,975 | (d) | ||||||||||
Total Capital Goods | 13,209,543 | |||||||||||||||
Communications — 13.4% | ||||||||||||||||
Advantage Sales & Marketing Inc., First Lien Initial Term Loan (1 mo. USD LIBOR + 3.250%) | 5.749 | % | 7/23/21 | 396,775 | 338,746 | (d) | ||||||||||
See Notes to Financial Statements.
| 4 | Western Asset Corporate Loan Fund Inc. 2019 Semi-Annual Report |
Table of Contents
Western Asset Corporate Loan Fund Inc.
| Security† | Rate | Maturity Date | Face Amount | Value | ||||||||||||
Communications — continued | ||||||||||||||||
Ancestry.com Operations Inc., Term Loan B (1 mo. USD LIBOR + 3.250%) | 5.750 | % | 10/19/23 | $ | 1,317,804 | $ | 1,311,215 | (d) | ||||||||
CenturyLink Inc., Initial Term Loan B (1 mo. USD LIBOR + 2.750%) | 5.249 | % | 1/31/25 | 720,926 | 706,508 | (d) | ||||||||||
Charter Communications Operating LLC, Term Loan B (1 mo. USD LIBOR + 2.000%) | 4.500 | % | 4/30/25 | 486,963 | 484,311 | (d) | ||||||||||
CSC Holdings LLC, 2017 Refinancing Term Loan (1 mo. USD LIBOR + 2.250%) | 4.734 | % | 7/17/25 | 248,988 | 242,515 | (d) | ||||||||||
CSC Holdings LLC, January 2018 Term Loan (1 mo. USD LIBOR + 2.500%) | 4.984 | % | 1/25/26 | 1,240,625 | 1,215,619 | (d) | ||||||||||
EVO Payments International LLC, First Lien Term Loan (1 mo. USD LIBOR + 3.250%) | 5.750 | % | 12/22/23 | 887,758 | 887,203 | (d) | ||||||||||
Intelsat Jackson Holdings SA, Term Loan B3 | — | 11/27/23 | 970,000 | 953,631 | (e) | |||||||||||
Level 3 Financing Inc., 2024 Term Loan B (3 mo. USD LIBOR + 2.250%) | 4.736 | % | 2/22/24 | 500,000 | 495,000 | (d) | ||||||||||
Lions Gate Capital Holdings LLC, Term Loan B (1 mo. USD LIBOR + 2.250%) | 4.749 | % | 3/24/25 | 627,235 | 621,485 | (d) | ||||||||||
Meredith Corp., Term Loan B1 (1 mo. USD LIBOR + 2.750%) | 5.249 | % | 1/31/25 | 538,839 | 538,165 | (d) | ||||||||||
Numericable U.S. LLC, USD Incremental Term Loan B13 (1 mo. USD LIBOR + 4.000%) | 6.484 | % | 8/14/26 | 389,025 | 373,140 | (d) | ||||||||||
Numericable U.S. LLC, USD Term Loan B11 (1 mo. USD LIBOR + 2.750%) | 5.249 | % | 7/31/25 | 678,369 | 634,064 | (d) | ||||||||||
Numericable U.S. LLC, USD Term Loan B12 (1 mo. USD LIBOR + 3.688%) | 6.171 | % | 1/31/26 | 621,325 | 587,774 | (d) | ||||||||||
Radio One Inc., Initial Term Loan (1 mo. USD LIBOR + 4.000%) | 6.500 | % | 4/18/23 | 809,322 | 777,961 | (d) | ||||||||||
Shutterfly Inc., Incremental Term Loan (1 mo. USD LIBOR + 2.750%) | 5.250 | % | 8/17/24 | 232,717 | 229,323 | (d) | ||||||||||
Tribune Media Company, Term Loan C (1 mo. USD LIBOR + 3.000%) | 5.499 | % | 1/27/24 | 1,010,000 | 1,010,631 | (d) | ||||||||||
UnityMedia Hessen GmbH & Co. KG, Term Loan Senior Facility B (1 mo. USD LIBOR + 2.250%) | 4.734 | % | 9/30/25 | 430,000 | 426,468 | (d) | ||||||||||
Univision Communications Inc., 2017 Replacement Term Loan (1 mo. USD LIBOR + 2.750%) | 5.249 | % | 3/15/24 | 1,228,150 | 1,160,163 | (d) | ||||||||||
Virgin Media Bristol LLC, Term Loan K (1 mo. USD LIBOR + 2.500%) | 4.984 | % | 1/15/26 | 1,080,000 | 1,069,296 | (d) | ||||||||||
Ziggo Secured Finance Partnership, Term Loan E (1 mo. USD LIBOR + 2.500%) | 4.984 | % | 4/15/25 | 500,000 | 487,813 | (d) | ||||||||||
Total Communications | 14,551,031 | |||||||||||||||
Consumer Cyclical — 33.2% | ||||||||||||||||
Academy Ltd., Initial Term Loan (1 mo. USD LIBOR + 4.000%) | 6.489-6.490 | % | 7/1/22 | 421,391 | 304,718 | (d) | ||||||||||
See Notes to Financial Statements.
| Western Asset Corporate Loan Fund Inc. 2019 Semi-Annual Report | 5 |
Table of Contents
Schedule of investments(unaudited) (cont’d)
March 31, 2019
Western Asset Corporate Loan Fund Inc.
| Security† | Rate | Maturity Date | Face Amount | Value | ||||||||||||
Consumer Cyclical — continued | ||||||||||||||||
Alterra Mountain Company, Initial Term Loan (1 mo. USD LIBOR + 3.000%) | 5.499 | % | 7/31/24 | $ | 1,524,704 | $ | 1,519,304 | (d) | ||||||||
American Axle & Manufacturing Inc., Term Loan B (1 mo. USD LIBOR + 2.250%) | 4.740 | % | 4/6/24 | 657,536 | 643,700 | (d) | ||||||||||
AP NMT Acquisition BV, Second Lien Dollar Term Loan B (3 mo. USD LIBOR + 9.000%) | 11.808 | % | 8/13/22 | 390,000 | 389,025 | (d) | ||||||||||
ASHCO LLC, Initial Term Loan (1 mo. USD LIBOR + 5.000%) | 7.499 | % | 9/25/24 | 1,524,908 | 1,494,401 | (d) | ||||||||||
BJ’s Wholesale Club Inc., 2018 Other Term Loan (1 mo. USD LIBOR + 3.000%) | 5.499 | % | 2/3/24 | 496,703 | 496,127 | (d) | ||||||||||
BrightView Landscapes LLC, Initial Term Loan (1 mo. USD LIBOR + 2.500%) | 5.000 | % | 8/15/25 | 782,978 | 780,022 | (c)(d) | ||||||||||
Brookfield Property REIT Inc., Initial Term Loan B (1 mo. USD LIBOR + 2.500%) | 4.955-4.996 | % | 8/27/25 | 1,174,100 | 1,133,985 | (d) | ||||||||||
Caesars Resort Collection LLC, Term Loan B (1 mo. USD LIBOR + 2.750%) | 5.249 | % | 12/23/24 | 1,307,620 | 1,294,777 | (d) | ||||||||||
CEC Entertainment Inc., First Lien Term Loan B (1 mo. USD LIBOR + 3.250%) | 5.749 | % | 2/15/21 | 531,484 | 515,539 | (d) | ||||||||||
Crossmark Holdings Inc., First Lien Term Loan (Prime + 2.500%) | 8.000 | % | 12/20/19 | 516,919 | 145,168 | (d) | ||||||||||
CWGS Group LLC, Term Loan (1 mo. USD LIBOR + 2.750%) | 5.240-5.249 | % | 11/8/23 | 1,115,449 | 1,002,510 | (d) | ||||||||||
EG America LLC, Additional Facility Term Loan (3 mo. USD LIBOR + 4.000%) | 6.601 | % | 2/7/25 | 815,635 | 797,963 | (d) | ||||||||||
EG Dutch Finco BV, USD Term Loan Facility B (3 mo. USD LIBOR + 4.000%) | 6.601 | % | 2/7/25 | 79,200 | 77,484 | (d) | ||||||||||
Equinox Holdings Inc., First Lien Incremental Term Loan B1 (1 mo. USD LIBOR + 3.000%) | 5.499 | % | 3/8/24 | 869,807 | 864,371 | (d) | ||||||||||
Fitness International LLC, Term Loan B (1 mo. USD LIBOR + 3.250%) | 5.749 | % | 4/18/25 | 866,308 | 859,811 | (d) | ||||||||||
Four Seasons Hotels Ltd., Restated Term Loan (1 mo. USD LIBOR + 2.000%) | 4.499 | % | 11/30/23 | 1,134,510 | 1,127,277 | (d) | ||||||||||
Garda World Security Corp., Incremental Term Loan B | 6.115-8.000 | % | 5/24/24 | 914,054 | 907,960 | (d) | ||||||||||
Golden Nugget Inc., Term Loan B (1 mo. USD LIBOR + 2.750%) | 5.234-5.249 | % | 10/4/23 | 347,944 | 344,900 | (d) | ||||||||||
Greektown Holdings LLC, Initial Term Loan (1 mo. USD LIBOR + 2.750%) | 5.249 | % | 4/25/24 | 1,182,392 | 1,182,392 | (d) | ||||||||||
Hornblower Sub LLC, Term Loan B1 | — | 1/2/20 | 1,020,000 | 1,018,407 | (e) | |||||||||||
Leslie’s Poolmart Inc., Term Loan B2 (2 mo. USD LIBOR + 3.500%) | 6.079 | % | 8/16/23 | 1,010,865 | 979,275 | (d) | ||||||||||
Michaels Stores Inc., 2018 Term Loan B (1 mo. USD LIBOR + 2.500%) | 4.991-4.999 | % | 1/30/23 | 686,877 | 673,569 | (d) | ||||||||||
See Notes to Financial Statements.
| 6 | Western Asset Corporate Loan Fund Inc. 2019 Semi-Annual Report |
Table of Contents
Western Asset Corporate Loan Fund Inc.
| Security† | Rate | Maturity Date | Face Amount | Value | ||||||||||||
Consumer Cyclical — continued | ||||||||||||||||
Mohegan Tribal Gaming Authority, Term Loan B (1 mo. USD LIBOR + 4.000%) | 6.499 | % | 10/13/23 | $ | 762,321 | $ | 718,964 | (d)(e) | ||||||||
Panther BF Aggregator 2 LP, USD Term Loan | — | 3/18/26 | 2,430,000 | 2,405,639 | (c)(e) | |||||||||||
Penn National Gaming Inc., Term Loan Facility B1 (1 mo. USD LIBOR + 2.250%) | 4.749 | % | 10/15/25 | 678,300 | 671,446 | (d)(e) | ||||||||||
PetSmart Inc., Term Loan B2 (1 mo. USD LIBOR + 3.000%) | 5.490 | % | 3/11/22 | 894,699 | 804,670 | (d) | ||||||||||
Prime Security Services Borrower LLC, Term Loan B1 (1 mo. USD LIBOR + 2.750%) | 5.243-5.249 | % | 5/2/22 | 1,282,141 | 1,271,152 | (d)(e) | ||||||||||
Scientific Games International Inc., Initial Term Loan B5 | 5.249-5.329 | % | 8/14/24 | 1,121,971 | 1,092,920 | (d) | ||||||||||
Securus Technologies Holdings Inc., First Lien Initial Term Loan (1 mo. USD LIBOR + 4.500%) | 6.999 | % | 11/1/24 | 1,677,427 | 1,669,563 | (d)(e) | ||||||||||
Securus Technologies Holdings Inc., Second Lien Initial Term Loan | — | 11/1/25 | 420,000 | 413,700 | (e) | |||||||||||
ServiceMaster Co. LLC, Term Loan C (1 mo. USD LIBOR + 2.500%) | 4.993 | % | 11/8/23 | 141,073 | 140,896 | (d) | ||||||||||
Spencer Gifts LLC, Term Loan B1 | 6.750-8.750 | % | 7/16/21 | 538,453 | 533,069 | (d) | ||||||||||
Stars Group Holdings BV, USD Term Loan (3 mo. USD LIBOR + 3.500%) | 6.101 | % | 7/10/25 | 1,110,464 | 1,110,030 | (d) | ||||||||||
Station Casinos LLC, Term Loan Facility B (1 mo. USD LIBOR + 2.500%) | 5.000 | % | 6/8/23 | 431,365 | 427,656 | (d) | ||||||||||
TKC Holdings Inc., First Lien Initial Term Loan (1 mo. USD LIBOR + 3.750%) | 6.250 | % | 2/1/23 | 1,220,440 | 1,199,845 | (d) | ||||||||||
Trans Union LLC, 2017 Replacement Term Loan B3 (1 mo. USD LIBOR + 2.000%) | 4.499 | % | 4/10/23 | 1,224,096 | 1,214,806 | (d) | ||||||||||
Trans Union LLC, 2018 Incremental Term Loan B4 (1 mo. USD LIBOR + 2.000%) | 4.499 | % | 6/19/25 | 119,100 | 117,704 | (d) | ||||||||||
UFC Holdings LLC, First Lien Term Loan (1 mo. USD LIBOR + 3.250%) | 5.750 | % | 8/18/23 | 1,687,842 | 1,678,699 | (d)(e) | ||||||||||
UFC Holdings LLC, Second Lien Term Loan (1 mo. USD LIBOR + 7.500%) | 9.999 | % | 8/18/24 | 830,000 | 836,640 | (d) | ||||||||||
World Triathlon Corp., Initial Term loan (3 mo. USD LIBOR + 4.000%) | 6.601 | % | 6/25/21 | 1,064,226 | 1,061,565 | (c)(d) | ||||||||||
Total Consumer Cyclical | 35,921,649 | |||||||||||||||
Consumer Non-Cyclical — 33.3% | ||||||||||||||||
8th Avenue Food & Provisions Inc., First Lien Term Loan (1 mo. USD LIBOR + 3.750%) | 6.240 | % | 10/1/25 | 896,852 | 899,655 | (d)(e) | ||||||||||
8th Avenue Food & Provisions Inc., Second Lien Term Loan (1 mo. USD LIBOR + 7.750%) | 10.240 | % | 10/1/26 | 760,000 | 760,950 | (d)(e) | ||||||||||
Agiliti Health Inc., Delayed Draw Term Loan B (3 mo. USD LIBOR + 3.000%) | 5.500 | % | 1/4/26 | 590,000 | 589,248 | (c)(d) | ||||||||||
Air Medical Group Holdings Inc.,2017-2 New Term Loan (1 mo. USD LIBOR + 4.250%) | 6.736 | % | 3/14/25 | 256,750 | 242,228 | (d) | ||||||||||
See Notes to Financial Statements.
| Western Asset Corporate Loan Fund Inc. 2019 Semi-Annual Report | 7 |
Table of Contents
Schedule of investments(unaudited) (cont’d)
March 31, 2019
Western Asset Corporate Loan Fund Inc.
| Security† | Rate | Maturity Date | Face Amount | Value | ||||||||||||
Consumer Non-Cyclical — continued | ||||||||||||||||
Air Medical Group Holdings Inc., 2018 Term Loan (1 mo. USD LIBOR + 3.250%) | 5.739 | % | 4/28/22 | $ | 1,309,546 | $ | 1,233,920 | (d) | ||||||||
Air Methods Corp., Initial Term Loan (3 mo. USD LIBOR + 3.500%) | 6.101 | % | 4/21/24 | 145,288 | 109,765 | (d) | ||||||||||
Akorn Inc., Term Loan (1 mo. USD LIBOR + 5.500%) | 8.000 | % | 4/16/21 | 317,428 | 260,291 | (c)(d) | ||||||||||
Albany Molecular Research Inc., First Lien Initial Term Loan (1 mo. USD LIBOR + 3.250%) | 5.743 | % | 8/30/24 | 1,182,000 | 1,163,285 | (d) | ||||||||||
Albertson’s LLC, 2018 Term Loan B7 (1 mo. USD LIBOR + 3.000%) | 5.499 | % | 11/17/25 | 526,554 | 520,794 | (d)(e) | ||||||||||
Albertson’s LLC, Replacement2017-1 Term Loan B6 (1 mo. USD LIBOR + 3.000%) | 5.479 | % | 6/22/23 | 840,899 | 834,767 | (d) | ||||||||||
American Greetings Corp., Initial Term Loan (1 mo. USD LIBOR + 4.500%) | 6.999 | % | 4/6/24 | 267,975 | 264,625 | (c)(d) | ||||||||||
AthenaHealth Inc., First Lien Term Loan B (3 mo. USD LIBOR + 4.500%) | 7.197 | % | 2/11/26 | 1,540,000 | 1,519,467 | (d)(e) | ||||||||||
Atlantic Aviation FBO Inc., Term Loan (1 mo. USD LIBOR + 3.750%) | 6.250 | % | 12/6/25 | 1,236,900 | 1,247,692 | (c)(d)(e) | ||||||||||
Bausch Health Cos. Inc., Initial Term Loan (1 mo. USD LIBOR + 3.000%) | 5.481 | % | 6/2/25 | 1,117,785 | 1,111,002 | (d) | ||||||||||
Catalent Pharma Solutions Inc., Dollar Term Loan (1 mo. USD LIBOR + 2.250%) | 4.749 | % | 5/20/24 | 447,605 | 446,286 | (d) | ||||||||||
Champ Acquisition Corp., Initial Term Loan (3 mo. USD LIBOR + 5.500%) | 8.101 | % | 12/19/25 | 259,350 | 258,053 | (c)(d) | ||||||||||
Change Healthcare Holdings LLC, Closing Date Term Loan (1 mo. USD LIBOR + 2.750%) | 5.249 | % | 3/1/24 | 1,642,620 | 1,622,088 | (d) | ||||||||||
CHG Healthcare Services Inc., New Term Loan | 5.499-5.744 | % | 6/7/23 | 902,624 | 897,734 | (d) | ||||||||||
CHG PPC Parent LLC, First Lien Initial Term Loan (1 mo. USD LIBOR + 2.750%) | 5.249 | % | 3/31/25 | 148,875 | 146,642 | (c)(d) | ||||||||||
Dole Food Co. Inc., Term Loan B | 5.239-7.250 | % | 4/6/24 | 182,902 | 176,272 | (d) | ||||||||||
Endo Luxembourg Finance Company I SARL, Initial Term Loan (1 mo. USD LIBOR + 4.250%) | 6.750 | % | 4/29/24 | 1,284,840 | 1,265,969 | (d)(e) | ||||||||||
Envision Healthcare Corp., Initial Term Loan (1 mo. USD LIBOR + 3.750%) | 6.249 | % | 10/10/25 | 359,100 | 336,582 | (d) | ||||||||||
Exactech Inc., Closing Date Term Loan (3 mo. USD LIBOR + 3.750%) | 6.243 | % | 2/14/25 | 196,055 | 196,055 | (c)(d) | ||||||||||
GoodRX Inc., First Lien Initial Term Loan (1 mo. USD LIBOR + 3.000%) | 5.489 | % | 10/10/25 | 1,266,825 | 1,254,949 | (d)(e) | ||||||||||
HLF Financing SARL LLC, Term Loan B (1 mo. USD LIBOR + 3.250%) | 5.749 | % | 8/18/25 | 916,597 | 917,170 | (d)(e) | ||||||||||
Immucor Inc., Term Loan B3 (3 mo. USD LIBOR + 5.000%) | 7.601 | % | 6/15/21 | 1,322,961 | 1,322,145 | (d) | ||||||||||
Jaguar Holding Co. II, 2018 Term Loan (1 mo. USD LIBOR + 2.500%) | 4.999 | % | 8/18/22 | 1,211,451 | 1,200,356 | (d) | ||||||||||
See Notes to Financial Statements.
| 8 | Western Asset Corporate Loan Fund Inc. 2019 Semi-Annual Report |
Table of Contents
Western Asset Corporate Loan Fund Inc.
| Security† | Rate | Maturity Date | Face Amount | Value | ||||||||||||
Consumer Non-Cyclical — continued | ||||||||||||||||
Kingpin Intermediate Holdings LLC, 2018 Refinancing Term Loan (1 mo. USD LIBOR + 3.500%) | 6.000 | % | 7/3/24 | $ | 1,542,900 | $ | 1,542,861 | (c)(d) | ||||||||
Lantheus Medical Imaging Inc., 2017 Term Loan B (1 mo. USD LIBOR + 3.750%) | 6.249 | % | 6/30/22 | 793,800 | 795,784 | (d) | ||||||||||
LifePoint Health Inc., First Lien Term Loan B (3 mo. USD LIBOR + 4.500%) | 6.982 | % | 11/16/25 | 1,835,400 | 1,820,487 | (d)(e) | ||||||||||
NorthRiver Midstream Finance LP, Initial Term Loan B (3 mo. USD LIBOR + 3.250%) | 6.047 | % | 10/1/25 | 975,100 | 973,881 | (d) | ||||||||||
Party City Holdings Inc., 2018 Replacement Term Loan (1 mo. USD LIBOR + 2.500%) | 5.000 | % | 8/19/22 | 588,452 | 584,995 | (d) | ||||||||||
Pearl Intermediate Parent LLC, First Lien Delayed Draw Term Loan (1 mo. USD LIBOR + 2.750%) | 5.236 | % | 2/14/25 | 89,945 | 85,223 | (c)(d)(e) | ||||||||||
Pearl Intermediate Parent LLC, First Lien Initial Term Loan (1 mo. USD LIBOR + 2.750%) | 5.236 | % | 2/14/25 | 304,126 | 288,159 | (c)(d) | ||||||||||
Phoenix Guarantor Inc., First Lien Delayed Draw Term Loan (1 mo. USD LIBOR + 4.500%) | 6.923 | % | 3/5/26 | 138,718 | 136,868 | (d)(e) | ||||||||||
Phoenix Guarantor Inc., First Lien Initial Term Loan (1 mo. USD LIBOR + 4.500%) | 6.982 | % | 3/5/26 | 1,525,896 | 1,505,552 | (d)(e) | ||||||||||
Radnet Management Inc., First Lien Term Loan B1 (3 mo. USD LIBOR + 3.750%) | 6.529 | % | 6/30/23 | 830,068 | 832,143 | (c)(d)(e) | ||||||||||
RPI Finance Trust, Initial Term Loan B6 (1 mo. USD LIBOR + 2.000%) | 4.499 | % | 3/27/23 | 929,924 | 925,371 | (d) | ||||||||||
Shearer’s Foods LLC, First Lien Term Loan (1 mo. USD LIBOR + 4.250%) | 6.749 | % | 6/30/21 | 940,549 | 928,400 | (d) | ||||||||||
Surgery Center Holdings Inc., Initial Term Loan (1 mo. USD LIBOR + 3.250%) | 5.750 | % | 9/2/24 | 575,044 | 566,239 | (d) | ||||||||||
TOMS Shoes LLC, Initial Term Loan (1 mo. USD LIBOR + 5.500%) | 8.000 | % | 10/30/20 | 293,909 | 230,719 | (c)(d) | ||||||||||
U.S. Anesthesia Partners Inc., First Lien Initial Term Loan (1 mo. USD LIBOR + 3.000%) | 5.499 | % | 6/24/24 | 1,086,860 | 1,075,765 | (d) | ||||||||||
Vetcor Professional Practices LLC, First Lien Initial Term Loan (1 mo. USD LIBOR + 3.000%) | 5.499 | % | 7/2/25 | 853,550 | 832,211 | (c)(d) | ||||||||||
Vizient Inc., Term Loan B4 (1 mo. USD LIBOR + 2.750%) | 5.249 | % | 2/13/23 | 1,011,913 | 1,008,434 | (d)(e) | ||||||||||
Wink Holdco Inc., First Lien Initial Term Loan (1 mo. USD LIBOR + 3.000%) | 5.499 | % | 12/2/24 | 760,375 | 737,089 | (d) | ||||||||||
WP CityMD Bidco LLC, Refinancing Term Loan (3 mo. USD LIBOR + 3.500%) | 6.101 | % | 6/7/24 | 384,447 | 372,914 | (d) | ||||||||||
Total ConsumerNon-Cyclical | 36,041,085 | |||||||||||||||
Electric — 3.0% | ||||||||||||||||
Calpine Corp., Term Loan (3 mo. USD LIBOR + 2.500%) | 5.110 | % | 1/15/24 | 278,553 | 276,387 | (d) | ||||||||||
Calpine Corp., Term Loan B9 | — | 4/5/26 | 690,000 | 684,034 | (e) | |||||||||||
Eastern Power LLC, Term Loan B (1 mo. USD LIBOR + 3.750%) | 6.249 | % | 10/2/23 | 843,668 | 841,032 | (d) | ||||||||||
See Notes to Financial Statements.
| Western Asset Corporate Loan Fund Inc. 2019 Semi-Annual Report | 9 |
Table of Contents
Schedule of investments(unaudited) (cont’d)
March 31, 2019
Western Asset Corporate Loan Fund Inc.
| Security† | Rate | Maturity Date | Face Amount | Value | ||||||||||||
Electric — continued | ||||||||||||||||
Panda Temple Power LLC, Second Lien Term Loan (1 mo. USD LIBOR +8.000% PIK) | 10.482 | % | 2/7/23 | $ | 324,758 | $ | 324,216 | (d)(f) | ||||||||
Terra-Gen Finance Co. LLC, Term Loan (1 mo. USD LIBOR + 4.250%) | 6.749 | % | 12/9/21 | 162,117 | 143,879 | (d) | ||||||||||
Vistra Operations Co. LLC, Initial Term Loan B1 (1 mo. USD LIBOR + 2.000%) | 4.499 | % | 8/4/23 | 946,319 | 937,329 | (d) | ||||||||||
Total Electric | 3,206,877 | |||||||||||||||
Energy — 2.8% | ||||||||||||||||
BCP Renaissance Parent LLC, Initial Term Loan (3 mo. USD LIBOR + 3.500%) | 6.244 | % | 10/31/24 | 534,853 | 533,659 | (d) | ||||||||||
KCA Deutag Alpha Ltd., Term Loan B (3 mo. USD LIBOR + 6.750%) | 9.351 | % | 2/28/23 | 595,500 | 510,269 | (d) | ||||||||||
MEG Energy Corp., Initial Term Loan (1 mo. USD LIBOR + 3.500%) | 6.000 | % | 12/31/23 | 486,000 | 484,178 | (d) | ||||||||||
Paragon Offshore Finance Co., Term Loan | — | — | 1,830 | 835 | *(c)(g) | |||||||||||
Penn Virginia Holdings Corp., Second Lien Advance Term Loan (1 mo. USD LIBOR + 7.000%) | 9.500 | % | 9/29/22 | 390,000 | 384,150 | (c)(d) | ||||||||||
Permian Production Partners LLC, Initial Advances Term Loan (1 mo. USD LIBOR + 6.000%) | 8.490 | % | 5/20/24 | 808,500 | 788,287 | (c)(d) | ||||||||||
Traverse Midstream Partners LLC, Advance Term Loan (1 mo. USD LIBOR + 4.000%) | 6.500 | % | 9/27/24 | 377,651 | 378,003 | (d) | ||||||||||
Total Energy | 3,079,381 | |||||||||||||||
Finance Companies — 1.3% | ||||||||||||||||
Avolon TLB Borrower 1 (US) LLC, Term Loan B3 (1 mo. USD LIBOR + 2.000%) | 4.488 | % | 1/15/25 | 713,940 | 709,356 | (d) | ||||||||||
Clipper Acquisitions Corp., Term Loan B-1 (1 mo. USD LIBOR + 1.750%) | 4.232 | % | 12/27/24 | 743,119 | 733,830 | (c)(d) | ||||||||||
Total Finance Companies | 1,443,186 | |||||||||||||||
Financial Other — 14.3% | ||||||||||||||||
AqGen Ascensus Inc., Third Amendment Term Loan (3 mo. USD LIBOR + 4.000%) | 6.601 | % | 12/5/22 | 897,859 | 900,104 | (c)(d)(e) | ||||||||||
Citadel Securities LP, Term Loan (1 mo. USD LIBOR + 3.500%) | 5.999 | % | 2/27/26 | 1,610,000 | 1,612,012 | (c)(d) | ||||||||||
Citco Funding LLC, 2017 Term Loan | — | 9/28/23 | 897,710 | 895,466 | (c)(e) | |||||||||||
Deerfield Dakota Holding LLC, 2019 Incremental Term Loan (3 mo. USD LIBOR + 4.000%) | 6.489 | % | 2/13/25 | 420,000 | 418,425 | (d) | ||||||||||
Edelman Financial Center LLC, First Lien Initial Term Loan B | — | 7/21/25 | 927,675 | 923,616 | (e) | |||||||||||
Edelman Financial Center LLC, Second Lien Initial Term Loan | — | 7/20/26 | 480,000 | 482,400 | (c)(e) | |||||||||||
Financial & Risk US Holdings Inc., Initial Dollar Term Loan (1 mo. USD LIBOR + 3.750%) | 6.249 | % | 10/1/25 | 947,625 | 920,874 | (d)(e) | ||||||||||
Finco I LLC, 2018 Term Loan B (1 mo. USD LIBOR + 2.000%) | 4.499 | % | 12/27/22 | 1,022,489 | 1,015,715 | (d)(e) | ||||||||||
First Eagle Holdings Inc., Initial Term Loan (3 mo. USD LIBOR + 2.750%) | 5.351 | % | 12/2/24 | 987,525 | 985,056 | (c)(d)(e) | ||||||||||
See Notes to Financial Statements.
| 10 | Western Asset Corporate Loan Fund Inc. 2019 Semi-Annual Report |
Table of Contents
Western Asset Corporate Loan Fund Inc.
| Security† | Rate | Maturity Date | Face Amount | Value | ||||||||||||
Financial Other — continued | ||||||||||||||||
Focus Financial Partners LLC, Term Loan B2 | — | 7/3/24 | $ | 928,392 | $ | 925,684 | (e) | |||||||||
Guggenheim Partners Investment Management Holdings LLC, Term Loan B | — | 7/21/23 | 339,039 | 339,622 | (e) | |||||||||||
Jane Street Group LLC, New Term Loan (1 mo. USD LIBOR + 3.000%) | 5.499 | % | 8/25/22 | 1,175,048 | 1,170,612 | (c)(d) | ||||||||||
LPL Holdings Inc., Term Loan B (1 mo. USD LIBOR + 2.250%) | 4.737 | % | 9/23/24 | 817,924 | 812,792 | (c)(d)(e) | ||||||||||
Resolute Investment Managers Inc., Specified Refinancing Term Loan | — | 4/30/22 | 747,980 | 748,447 | (c)(e) | |||||||||||
TKC Holdings Inc., Second Lien Initial Term Loan (1 mo. USD LIBOR + 8.000%) | 10.500 | % | 2/1/24 | 380,000 | 371,569 | (d) | ||||||||||
Verscend Holdings Corp., Term Loan B (1 mo. USD LIBOR + 4.500%) | 6.999 | % | 8/27/25 | 1,235,221 | 1,226,714 | (d)(e) | ||||||||||
VFH Parent LLC, Initial Term Loan (3 mo. USD LIBOR + 3.500%) | 6.126 | % | 3/1/26 | 1,766,250 | 1,771,770 | (d)(e) | ||||||||||
Total Financial Other | 15,520,878 | |||||||||||||||
Industrial Other — 2.5% | ||||||||||||||||
Allflex Holdings III Inc., First Lien Initial Term Loan (1 mo. USD LIBOR + 3.250%) | 5.732 | % | 7/17/20 | 400,377 | 400,126 | (d) | ||||||||||
Allflex Holdings III Inc., Second Lien Initial Term Loan (1 mo. USD LIBOR + 7.000%) | 9.486 | % | 7/19/21 | 789,245 | 790,232 | (d) | ||||||||||
CRCI Longhorn Holdings Inc., First Lien Closing Date Term Loan (1 mo. USD LIBOR + 3.500%) | 5.999 | % | 8/8/25 | 255,659 | 250,866 | (d) | ||||||||||
Laureate Education Inc., Series 2024 Term Loan (1 mo. USD LIBOR + 3.500%) | 5.999 | % | 4/26/24 | 568,504 | 569,391 | (d) | ||||||||||
Mirion Technologies Inc., Initial Dollar Term (3 mo. USD LIBOR + 4.000%) | 6.595 | % | 3/6/26 | 730,000 | 732,433 | (d) | ||||||||||
Total Industrial Other | 2,743,048 | |||||||||||||||
Insurance — 6.1% | ||||||||||||||||
Asurion LLC, New Term Loan B7 (1 mo. USD LIBOR + 3.000%) | 5.499 | % | 11/3/24 | 1,661,487 | 1,652,921 | (d) | ||||||||||
Asurion LLC, Second Lien Replacement Term Loan B2 (1 mo. USD LIBOR + 6.500%) | 8.999 | % | 8/4/25 | 890,000 | 904,045 | (d)(e) | ||||||||||
Hyperion Refinance SARL, Initial Dollar Term Loan (1 mo. USD LIBOR + 3.500%) | 6.000 | % | 12/20/24 | 1,565,420 | 1,561,018 | (d)(e) | ||||||||||
MPH Acquisition Holdings LLC, Initial Term Loan (3 mo. USD LIBOR + 2.750%) | 5.351 | % | 6/7/23 | 1,556,072 | 1,508,028 | (d)(e) | ||||||||||
NMI Holdings Inc., Initial Term Loan (1 mo. USD LIBOR + 4.750%) | 7.246 | % | 5/24/23 | 307,675 | 308,829 | (c)(d) | ||||||||||
Sedgwick Claims Management Services Inc., Term Loan (1 mo. USD LIBOR + 3.250%) | 5.749 | % | 12/31/25 | 678,300 | 665,476 | (d) | ||||||||||
Total Insurance | 6,600,317 | |||||||||||||||
See Notes to Financial Statements.
| Western Asset Corporate Loan Fund Inc. 2019 Semi-Annual Report | 11 |
Table of Contents
Schedule of investments(unaudited) (cont’d)
March 31, 2019
Western Asset Corporate Loan Fund Inc.
| Security† | Rate | Maturity Date | Face Amount | Value | ||||||||||||
REITS — 0.7% | ||||||||||||||||
iStar Inc., New Term Loan B (1 mo. USD LIBOR + 2.750%) | 5.233-5.237 | % | 6/28/23 | $ | 724,525 | $ | 719,091 | (c)(d) | ||||||||
Technology — 19.8% | ||||||||||||||||
Access CIG LLC, First Lien Term Loan B (1 mo. USD LIBOR + 3.750%) | 6.243 | % | 2/27/25 | 875,296 | 868,731 | (d)(e) | ||||||||||
Ascend Learning LLC, Initial Term Loan (1 mo. USD LIBOR + 3.000%) | 5.499 | % | 7/12/24 | 792,925 | 779,049 | (d) | ||||||||||
Blackhawk Network Holdings Inc., First Lien Term Loan (1 mo. USD LIBOR + 3.000%) | 5.499 | % | 6/16/25 | 854,198 | 840,531 | (d)(e) | ||||||||||
Blackhawk Network Holdings Inc., Second Lien Term Loan B2 | — | 6/15/26 | 340,000 | 338,300 | (c)(e) | |||||||||||
Carbonite Inc., Initial Term Loan | — | 3/26/26 | 1,100,000 | 1,093,468 | (e) | |||||||||||
Commscope Inc., Term Loan B | — | 4/4/26 | 590,000 | 591,251 | (e) | |||||||||||
Datto Inc., Term Loan B | — | 4/2/26 | 1,100,000 | 1,102,750 | (e) | |||||||||||
DigiCert Holdings Inc., First Lien Term Loan (1 mo. USD LIBOR + 4.000%) | 6.499 | % | 10/31/24 | 1,564,826 | 1,542,006 | (d)(e) | ||||||||||
DigiCert Holdings Inc., Second Lien Term Loan (1 mo. USD LIBOR + 8.000%) | 10.499 | % | 10/31/25 | 630,000 | 621,731 | (d) | ||||||||||
Donnelley Financial Solutions Inc., 2017 Refinancing Term Loan (1 mo. USD LIBOR + 3.000%) | 5.481 | % | 9/29/23 | 47,643 | 47,286 | (c)(d) | ||||||||||
Finastra USA Inc., First Lien Dollar Term Loan (3 mo. USD LIBOR + 3.500%) | 6.101 | % | 6/13/24 | 1,161,941 | 1,121,909 | (d) | ||||||||||
Global Tel Link Corp., First Lien Term Loan (1 mo. USD LIBOR + 4.250%) | 6.749 | % | 11/29/25 | 1,216,950 | 1,212,386 | (c)(d) | ||||||||||
Global Tel Link Corp., Second Lien Term Loan | — | 11/20/26 | 1,120,000 | 1,098,300 | (e) | |||||||||||
Hyland Software Inc., 2018 Refinancing Term Loan (1 mo. USD LIBOR + 3.500%) | 5.999 | % | 7/1/24 | 791,385 | 791,508 | (d) | ||||||||||
MA Financeco LLC, Term Loan B2 (1 mo. USD LIBOR + 2.250%) | 4.749 | % | 11/19/21 | 297,000 | 291,803 | (d) | ||||||||||
MA Financeco LLC, Term Loan B3 (1 mo. USD LIBOR + 2.500%) | 4.999 | % | 6/21/24 | 143,011 | 139,197 | (d) | ||||||||||
McAfee LLC, Second Lien Inital Term Loan (1 mo. USD LIBOR + 8.500%) | 10.999 | % | 9/29/25 | 240,000 | 242,700 | (d) | ||||||||||
McAfee LLC, Term Loan B (1 mo. USD LIBOR + 3.750%) | 6.249 | % | 9/30/24 | 1,313,167 | 1,311,362 | (d) | ||||||||||
Microchip Technology Inc., Initial Term Loan (1 mo. USD LIBOR + 2.000%) | 4.500 | % | 5/29/25 | 822,505 | 814,147 | (d) | ||||||||||
Project Alpha Intermediate Holding Inc., Term Loan B | — | 4/26/24 | 1,380,000 | 1,366,200 | (e) | |||||||||||
Seattle Escrow Borrower LLC, Initial Term Loan (1 mo. USD LIBOR + 2.500%) | 4.999 | % | 6/21/24 | 965,789 | 940,034 | (d) | ||||||||||
Severin Acquisition LLC, First Lien Term Loan (3 mo. USD LIBOR + 3.250%) | 5.989 | % | 8/1/25 | 650,869 | 635,817 | (d) | ||||||||||
Sophia LP, Term Loan B (3 mo. USD LIBOR + 3.250%) | 5.851 | % | 9/30/22 | 587,681 | 584,192 | (d) | ||||||||||
See Notes to Financial Statements.
| 12 | Western Asset Corporate Loan Fund Inc. 2019 Semi-Annual Report |
Table of Contents
Western Asset Corporate Loan Fund Inc.
| Security† | Rate | Maturity Date | Face Amount | Value | ||||||||||||
Technology — continued | ||||||||||||||||
Sound Inpatient Physicians Inc., First Lien Initial Term Loan (1 mo. USD LIBOR + 2.750%) | 5.249 | % | 6/27/25 | $ | 673,304 | $ | 664,888 | (d) | ||||||||
Verifone Systems Inc., First Lien Initial Term Loan (3 mo. USD LIBOR + 4.000%) | 6.683 | % | 8/20/25 | 1,117,200 | 1,101,280 | (d) | ||||||||||
Web.com Group Inc., First Lien Initial Term Loan (1 mo. USD LIBOR + 3.750%) | 6.243 | % | 10/10/25 | 799,635 | 789,806 | (d) | ||||||||||
Zotec Partners LLC, Term Loan (1 mo. USD LIBOR + 5.000%) | 7.490 | % | 2/14/24 | 497,250 | 500,979 | (c)(d) | ||||||||||
Total Technology | 21,431,611 | |||||||||||||||
Transportation — 0.1% | ||||||||||||||||
Commercial Barge Line Co., Initial Term Loan (1 mo. USD LIBOR + 8.750%) | 11.249 | % | 11/12/20 | 196,011 | 138,433 | (d) | ||||||||||
Total Senior Loans (Cost — $158,443,815) | 156,420,085 | |||||||||||||||
| Corporate Bonds & Notes — 2.9% | ||||||||||||||||
| Consumer Discretionary — 0.7% | ||||||||||||||||
Diversified Consumer Services — 0.7% | ||||||||||||||||
Prime Security Services Borrower LLC/Prime Finance Inc., Secured Notes | 9.250 | % | 5/15/23 | 680,000 | 715,700 | (h) | ||||||||||
| Energy — 1.0% | ||||||||||||||||
Oil, Gas & Consumable Fuels — 1.0% | ||||||||||||||||
Endeavor Energy Resources LP/EER Finance Inc., Senior Notes | 5.500 | % | 1/30/26 | 350,000 | 360,500 | (h) | ||||||||||
Magnum Hunter Resources Corp. Escrow | — | — | 120,000 | 0 | *(c)(g)(i) | |||||||||||
NGPL PipeCo LLC, Senior Notes | 7.768 | % | 12/15/37 | 520,000 | 626,600 | (h) | ||||||||||
Northern Oil and Gas Inc., Secured Notes (8.500% Cash & 1.000% PIK) | 9.500 | % | 5/15/23 | 90,725 | 94,354 | (f) | ||||||||||
Total Energy | 1,081,454 | |||||||||||||||
| Financials — 0.4% | ||||||||||||||||
Diversified Financial Services — 0.4% | ||||||||||||||||
DAE Funding LLC, Senior Notes | 4.500 | % | 8/1/22 | 470,000 | 474,700 | (h) | ||||||||||
| Industrials — 0.2% | ||||||||||||||||
Machinery — 0.2% | ||||||||||||||||
Cleaver-Brooks Inc., Senior Secured Notes | 7.875 | % | 3/1/23 | 220,000 | 204,050 | (h) | ||||||||||
| Materials — 0.3% | ||||||||||||||||
Containers & Packaging — 0.3% | ||||||||||||||||
ARD Securities Finance SARL, Senior Secured Notes (8.750% PIK) | 8.750 | % | 1/31/23 | 360,176 | 342,167 | (f)(h) | ||||||||||
| Real Estate — 0.3% | ||||||||||||||||
Equity Real Estate Investment Trusts (REITs) — 0.3% | ||||||||||||||||
MPT Operating Partnership LP/MPT Finance Corp., Senior Notes | 5.250 | % | 8/1/26 | 260,000 | 268,775 | |||||||||||
Total Corporate Bonds & Notes (Cost — $2,987,957) | 3,086,846 | |||||||||||||||
See Notes to Financial Statements.
| Western Asset Corporate Loan Fund Inc. 2019 Semi-Annual Report | 13 |
Table of Contents
Schedule of investments(unaudited) (cont’d)
March 31, 2019
Western Asset Corporate Loan Fund Inc.
| Security† | Shares | Value | ||||||||||||||
| Common Stocks — 0.9% | ||||||||||||||||
| Consumer Discretionary — 0.3% | ||||||||||||||||
Automobiles — 0.2% | ||||||||||||||||
Dayco Products LLC | 4,745 | $ | 174,972 | * | ||||||||||||
Dayco Products LLC | 167 | 6,158 | * | |||||||||||||
Total Automobiles | 181,130 | |||||||||||||||
Household Durables — 0.1% | ||||||||||||||||
EveryWare Global | 66,667 | 158,334 | * | |||||||||||||
Total Consumer Discretionary | 339,464 | |||||||||||||||
| Energy — 0.2% | ||||||||||||||||
Energy Equipment & Services — 0.0% | ||||||||||||||||
Paragon Offshore Litigation Trust A | 503 | 472 | ||||||||||||||
Paragon Offshore Litigation Trust B | 252 | 9,292 | ||||||||||||||
Total Energy Equipment & Services | 9,764 | |||||||||||||||
Oil, Gas & Consumable Fuels — 0.2% | ||||||||||||||||
Montage Resources Corp. | 13,444 | 202,191 | * | |||||||||||||
Total Energy | 211,955 | |||||||||||||||
| Utilities — 0.4% | ||||||||||||||||
Electric Utilities — 0.4% | ||||||||||||||||
Panda Temple Power LLC | 21,649 | 465,453 | *(c) | |||||||||||||
Total Common Stocks (Cost — $2,757,973) | 1,016,873 | |||||||||||||||
Total Investments before Short-Term Investments (Cost — $164,189,745) |
| 160,523,803 | ||||||||||||||
| Rate | ||||||||||||||||
| Short-Term Investments — 15.3% | ||||||||||||||||
Dreyfus Government Cash Management, Institutional Shares (Cost — $16,557,990) | 2.385 | % | 16,557,990 | 16,557,990 | ||||||||||||
Total Investments — 163.5% (Cost — $180,747,735) | 177,081,793 | |||||||||||||||
Liabilities in Excess of Other Assets — (63.5)% | (68,781,790 | ) | ||||||||||||||
Total Net Assets — 100.0% | $ | 108,300,003 | ||||||||||||||
| † | Securities held by the Fund are subject to a lien, granted to the lenders, to the extent of the borrowing outstanding and any additional expenses. |
| * | Non-income producing security. |
| (a) | Interest rates disclosed represent the effective rates on collateralized and uncollateralized senior loans. Ranges in interest rates are attributable to multiple contracts under the same loan. |
| (b) | Senior loans may be considered restricted in that the Fund ordinarily is contractually obligated to receive approval from the agent bank and/or borrower prior to the disposition of a senior loan. |
| (c) | Security is valued using significant unobservable inputs (Note 1). |
| (d) | Variable rate security. Interest rate disclosed is as of the most recent information available. Certain variable rate securities are not based on a published reference rate and spread but are determined by the issuer or agent and are based on current market conditions. These securities do not indicate a reference rate and spread in their description above. |
See Notes to Financial Statements.
| 14 | Western Asset Corporate Loan Fund Inc. 2019 Semi-Annual Report |
Table of Contents
Western Asset Corporate Loan Fund Inc.
| (e) | All or a portion of this loan is unfunded as of March 31, 2019. The interest rate for fully unfunded term loans is to be determined. |
| (f) | Payment-in-kind security for which the issuer has the option at each interest payment date of making interest payments in cash or additional debt securities. |
| (g) | Security is valued in good faith in accordance with procedures approved by the Board of Directors (Note 1). |
| (h) | Security is exempt from registration under Rule 144A of the Securities Act of 1933. This security may be resold in transactions that are exempt from registration, normally to qualified institutional buyers. This security has been deemed liquid pursuant to guidelines approved by the Board of Directors. |
| (i) | Value is less than $1. |
Abbreviations used in this schedule: | ||
| LIBOR | — London Interbank Offered Rate | |
| PIK | —Payment-In-Kind | |
| REIT | — Real Estate Investment Trust | |
| USD | — United States Dollar | |
See Notes to Financial Statements.
| Western Asset Corporate Loan Fund Inc. 2019 Semi-Annual Report | 15 |
Table of Contents
Statement of assets and liabilities(unaudited)
March 31, 2019
| Assets: | ||||
Investments, at value (Cost — $180,747,735) | $ | 177,081,793 | ||
Cash | 205,167 | |||
Receivable for securities sold | 14,014,669 | |||
Interest receivable | 399,828 | |||
Prepaid expenses | 12,504 | |||
Total Assets | 191,713,961 | |||
| Liabilities: | ||||
Loan payable (Note 5) | 51,000,000 | |||
Payable for securities purchased | 31,464,115 | |||
Distributions payable | 526,765 | |||
Interest payable | 140,061 | |||
Investment management fee payable | 101,866 | |||
Directors’ fees payable | 3,800 | |||
Accrued expenses | 177,351 | |||
Total Liabilities | 83,413,958 | |||
| Total Net Assets | $ | 108,300,003 | ||
| Net Assets: | ||||
Par value ($0.001 par value; 9,938,962 shares issued and outstanding; 150,000,000 shares authorized) | $ | 9,939 | ||
Paid-in capital in excess of par value | 126,788,283 | |||
Total distributable earnings (loss) | (18,498,219) | |||
| Total Net Assets | $ | 108,300,003 | ||
| Shares Outstanding | 9,938,962 | |||
| Net Asset Value | $10.90 | |||
See Notes to Financial Statements.
| 16 | Western Asset Corporate Loan Fund Inc. 2019 Semi-Annual Report |
Table of Contents
Statement of operations(unaudited)
For the Six Months Ended March 31, 2019
| Investment Income: | ||||
Interest | $ | 4,690,183 | ||
| Expenses: | ||||
Interest expense (Note 5) | 816,781 | |||
Investment management fee (Note 2) | 642,645 | |||
Audit and tax fees | 32,022 | |||
Transfer agent fees | 17,879 | |||
Directors’ fees | 14,782 | |||
Legal fees | 13,222 | |||
Shareholder reports | 12,240 | |||
Fund accounting fees | 8,801 | |||
Custody fees | 6,761 | |||
Stock exchange listing fees | 6,237 | |||
Commitment fees (Note 5) | 5,963 | |||
Insurance | 1,270 | |||
Miscellaneous expenses | 8,388 | |||
Total Expenses | 1,586,991 | |||
Less: Fee waivers and/or expense reimbursements (Note 2) | (40,166) | |||
Net Expenses | 1,546,825 | |||
| Net Investment Income | 3,143,358 | |||
| Realized and Unrealized Loss on Investments (Notes 1 and 3): | ||||
Net Realized Loss From Investment Transactions | (1,562,462) | |||
Change in Net Unrealized Appreciation (Depreciation) From Investments | (2,149,012) | |||
| Net Loss on Investments | (3,711,474) | |||
| Decrease in Net Assets From Operations | $ | (568,116) | ||
See Notes to Financial Statements.
| Western Asset Corporate Loan Fund Inc. 2019 Semi-Annual Report | 17 |
Table of Contents
Statements of changes in net assets
| For the Six Months Ended March 31, 2019 (unaudited) and the Year Ended September 30, 2018 | 2019 | 2018 | ||||||
| Operations: | ||||||||
Net investment income | $ | 3,143,358 | $ | 6,328,999 | ||||
Net realized loss | (1,562,462) | (2,982,042) | ||||||
Change in net unrealized appreciation (depreciation) | (2,149,012) | 2,138,402 | ||||||
Increase (Decrease) in Net Assets From Operations | (568,116) | 5,485,359 | ||||||
| Distributions to Shareholders From (Note 1): | ||||||||
Total distributable earnings(a) | (3,160,590) | (6,460,325) | ||||||
Decrease in Net Assets From Distributions to Shareholders | (3,160,590) | (6,460,325) | ||||||
Decrease in Net Assets | (3,728,706) | (974,966) | ||||||
| Net Assets: | ||||||||
Beginning of period | 112,028,709 | 113,003,675 | ||||||
End of period(b) | $ | 108,300,003 | $ | 112,028,709 | ||||
| (a) | Distributions from net investment income and from realized gains are no longer required to be separately disclosed. See Note 9. For the year ended September 30, 2018, distributions from net investment income were $6,460,325. |
| (b) | Parenthetical disclosure of undistributed net investment income is no longer required. See Note 9. For the year ended September 30, 2018, end of year net assets included undistributed net investment income of $35,002. |
See Notes to Financial Statements.
| 18 | Western Asset Corporate Loan Fund Inc. 2019 Semi-Annual Report |
Table of Contents
Statement of cash flows(unaudited)
For the Six Months Ended March 31, 2019
| Increase (Decrease) in Cash: | ||||
| Cash Provided (Used) by Operating Activities: | ||||
Net decrease in net assets resulting from operations | $ | (568,116) | ||
Adjustments to reconcile net decrease in net assets resulting from operations to net cash provided (used) by operating activities: | ||||
Purchases of portfolio securities | (85,862,137) | |||
Sales of portfolio securities | 90,640,214 | |||
Net purchases, sales and maturities of short-term investments | (10,654,857) | |||
Payment-in-kind | (27,314) | |||
Net amortization of premium (accretion of discount) | (7,515) | |||
Increase in receivable for securities sold | (5,323,818) | |||
Decrease in interest receivable | 225,567 | |||
Increase in prepaid expenses | (4,993) | |||
Increase in payable for securities purchased | 14,027,085 | |||
Decrease in investment management fee payable | (587) | |||
Decrease in Directors’ fee payable | (1,107) | |||
Increase in interest payable | 50,835 | |||
Increase in accrued expenses | 35,505 | |||
Net realized loss on investments | 1,562,462 | |||
Change in net unrealized appreciation (depreciation) of investments | 2,149,012 | |||
Net Cash Provided by Operating Activities* | 6,240,236 | |||
| Cash Flows From Financing Activities: | ||||
Distributions paid on common stock | (3,160,590) | |||
Repayment of loan facility borrowings | (3,000,000) | |||
Net Cash Used in Financing Activities | (6,160,590) | |||
| Net Increase in Cash and Restricted Cash | 79,646 | |||
Cash at beginning of period | 125,521 | |||
Cash at end of period | $ | 205,167 | ||
| * | Included in operating expenses is cash of $771,297 paid for interest and commitment fees on borrowings. |
The following table provides a reconciliation of cash and restricted cash reported with the Statement of Assets and Liabilities that sums to the total of the such amounts shown on the Statement of Cash Flows. |
| March 31, 2019 | ||||
| Cash | $ | 205,167 | ||
| Restricted cash | — | |||
| Total cash and restricted cash shown in the Statement of Cash Flows | $ | 205,167 | ||
See Notes to Financial Statements.
| Western Asset Corporate Loan Fund Inc. 2019 Semi-Annual Report | 19 |
Table of Contents
| For a common share of capital stock outstanding throughout each year ended September 30, unless otherwise noted: | ||||||||||||||||||||||||
| 20191,2 | 20181 | 20171 | 20161 | 20151 | 20141 | |||||||||||||||||||
| Net asset value, beginning of period | $11.27 | $11.37 | $11.53 | $11.73 | $12.63 | $12.87 | ||||||||||||||||||
| Income (loss) from operations: | ||||||||||||||||||||||||
Net investment income | 0.32 | 0.64 | 0.71 | 0.71 | 0.80 | 0.78 | ||||||||||||||||||
Net realized and unrealized loss | (0.37) | (0.09) | (0.03) | (0.04) | (1.17) | (0.15) | ||||||||||||||||||
Distributions paid to Auction Rate Cumulative Preferred Stockholders from net investment income | — | — | — | (0.00) | 3 | (0.00) | 3 | (0.00) | 3 | |||||||||||||||
Total income (loss) from operations | (0.05) | 0.55 | 0.68 | 0.67 | (0.37) | 0.63 | ||||||||||||||||||
| Less distributions from: | ||||||||||||||||||||||||
Net investment income | (0.32) | 4 | (0.65) | (0.84) | (0.87) | (0.87) | (0.87) | |||||||||||||||||
Total distributions | (0.32) | (0.65) | (0.84) | (0.87) | (0.87) | (0.87) | ||||||||||||||||||
| Net increase from tender and repurchase of Auction Rate Cumulative Preferred Shares | — | — | — | — | 0.34 | — | ||||||||||||||||||
| Net asset value, end of period | $10.90 | $11.27 | $11.37 | $11.53 | $11.73 | $12.63 | ||||||||||||||||||
| Market price, end of period | $9.47 | $9.94 | $10.87 | $10.70 | $10.28 | $11.55 | ||||||||||||||||||
Total return, based on NAV5,6 | (0.43) | % | 4.96 | % | 5.94 | % | 6.36 | % | (0.27) | %7 | 4.97 | % | ||||||||||||
Total return, based on Market Price8 | (1.47) | % | (2.64) | % | 9.46 | % | 13.48 | % | (3.74) | % | 0.52 | % | ||||||||||||
| Net assets, end of period (millions) | $108 | $112 | $113 | $115 | $117 | $126 | ||||||||||||||||||
| Ratios to average net assets:9 | ||||||||||||||||||||||||
Gross expenses | 2.92 | %10 | 2.61 | % | 2.21 | % | 2.37 | % | 1.95 | % | 1.92 | % | ||||||||||||
Net expenses11 | 2.85 | 10 | 2.53 | 2.14 | 2.29 | 1.88 | 1.84 | |||||||||||||||||
Net investment income | 5.79 | 10 | 5.61 | 6.15 | 6.36 | 6.50 | 6.04 | |||||||||||||||||
| Portfolio turnover rate | 54 | % | 91 | % | 72 | % | 45 | % | 45 | % | 63 | % | ||||||||||||
| Supplemental data: | ||||||||||||||||||||||||
Loan Outstanding, End of Period (000s) | $51,000 | $54,000 | $53,000 | $48,500 | $56,000 | $30,500 | ||||||||||||||||||
Asset Coverage Ratio for Loan Outstanding12 | 312 | % | 307 | % | 313 | % | 336 | % | 310 | % | 626 | % | ||||||||||||
Asset Coverage, per $1,000 Principal Amount of Loan Outstanding12 | $3,124 | $3,075 | $3,132 | $3,363 | $3,096 | $6,264 | 13 | |||||||||||||||||
Weighted Average Loan (000s) | $52,137 | $53,890 | $52,944 | $50,790 | $34,730 | $30,500 | ||||||||||||||||||
Weighted Average Interest Rate on Loan | 3.14 | % | 2.46 | % | 1.67 | % | 1.41 | % | 1.18 | % | 1.07 | % | ||||||||||||
Auction Rate Cumulative Preferred Stock at Liquidation Value, End of Period (000s) | — | — | — | — | $875 | $35,000 | ||||||||||||||||||
Asset Coverage Ratio for Auction Rate Cumulative Preferred Stock | — | — | — | — | 305 | %14 | 292 | %13,14 | ||||||||||||||||
Asset Coverage, per $25,000 Liquidation Value per Share of Auction Rate Cumulative Preferred Stock | — | — | — | — | $76,220 | 14 | $72,916 | 14 | ||||||||||||||||
See Notes to Financial Statements.
| 20 | Western Asset Corporate Loan Fund Inc. 2019 Semi-Annual Report |
Table of Contents
| 1 | Per share amounts have been calculated using the average shares method. |
| 2 | For the six months ended March 31, 2019 (unaudited). |
| 3 | Amount represents less than $0.005 per share. |
| 4 | The actual source of the Fund’s current fiscal year distributions may be from investment income, return of capital or a combination of both. Shareholders will be informed of the tax characteristics of the distributions after the close of the fiscal year. |
| 5 | The total return calculation assumes that distributions are reinvested at NAV. Past performance is no guarantee of future results. Total returns for periods of less than one year are not annualized. |
| 6 | Performance figures may reflect compensating balance arrangements, fee waivers and/or expense reimbursements. In the absence of compensating balance arrangements, fee waivers and/or expense reimbursements, the total return would have been lower. Past performance is no guarantee of future results. Total returns for periods of less than one year are not annualized. |
| 7 | The total return based on NAV reflects the impact of the tender and repurchase by the Fund of a portion of its Auction Rate Cumulative Preferred Shares at 90% of the per share liquidation preference. Absent this transaction, the total return based on NAV would have been-3.25%. |
| 8 | The total return calculation assumes that distributions are reinvested in accordance with the Fund’s dividend reinvestment plan. Past performance is no guarantee of future results. Total returns for periods of less than one year are not annualized. |
| 9 | Calculated on the basis of average net assets of common stock shareholders. Ratios do not reflect the effect of dividend payments to auction rate cumulative preferred stockholders. |
| 10 | Annualized. |
| 11 | Reflects fee waivers and/or expense reimbursements. |
| 12 | Represents value of net assets plus the loan outstanding and auction rate cumulative preferred stock, if any, at the end of the period divided by the loan outstanding at the end of the period. |
| 13 | Added to conform to current period presentation. |
| 14 | Represents value of net assets plus the loan outstanding and auction rate preferred stock at the end of the period divided by the loan and auction rate cumulative preferred stock outstanding at the end of the period. |
See Notes to Financial Statements.
| Western Asset Corporate Loan Fund Inc. 2019 Semi-Annual Report | 21 |
Table of Contents
Notes to financial statements(unaudited)
1. Organization and significant accounting policies
Western Asset Corporate Loan Fund Inc. (the “Fund”) was incorporated in Maryland and is registered as anon-diversified,closed-end management investment company under the Investment Company Act of 1940, as amended (the “1940 Act”). The Fund’s investment objective is to maximize current income consistent with prudent efforts to preserve capital. The Fund invests primarily in floating- or variable-rate collateralized senior loans to corporations, partnerships or other business entities operating in various industries and geographic regions.
The following are significant accounting policies consistently followed by the Fund and are in conformity with U.S. generally accepted accounting principles (“GAAP”). Estimates and assumptions are required to be made regarding assets, liabilities and changes in net assets resulting from operations when financial statements are prepared. Changes in the economic environment, financial markets and any other parameters used in determining these estimates could cause actual results to differ. Subsequent events have been evaluated through the date the financial statements were issued.
(a) Investment valuation.The valuations for fixed income securities and certain derivative instruments are typically the prices supplied by independent third party pricing services, which may use market prices or broker/dealer quotations or a variety of valuation techniques and methodologies. The independent third party pricing services use inputs that are observable such as issuer details, interest rates, yield curves, prepayment speeds, credit risks/spreads, default rates and quoted prices for similar securities. Investments inopen-end funds are valued at the closing net asset value per share of each fund on the day of valuation. Equity securities for which market quotations are available are valued at the last reported sales price or official closing price on the primary market or exchange on which they trade. If independent third party pricing services are unable to supply prices for a portfolio investment, or if the prices supplied are deemed by the manager to be unreliable, the market price may be determined by the manager using quotations from one or more broker/dealers or at the transaction price if the security has recently been purchased and no value has yet been obtained from a pricing service or pricing broker. When reliable prices are not readily available, such as when the value of a security has been significantly affected by events after the close of the exchange or market on which the security is principally traded, but before the Fund calculates its net asset value, the Fund values these securities as determined in accordance with procedures approved by the Fund’s Board of Directors.
The Board of Directors is responsible for the valuation process and has delegated the supervision of the daily valuation process to the Legg Mason North Atlantic Fund Valuation Committee (the “Valuation Committee”). The Valuation Committee, pursuant to the policies adopted by the Board of Directors, is responsible for making fair value determinations, evaluating the effectiveness of the Fund’s pricing policies, and reporting to the Board of Directors. When determining the reliability of third party pricing information for investments
| 22 | Western Asset Corporate Loan Fund Inc. 2019 Semi-Annual Report |
Table of Contents
owned by the Fund, the Valuation Committee, among other things, conducts due diligence reviews of pricing vendors, monitors the daily change in prices and reviews transactions among market participants.
The Valuation Committee will consider pricing methodologies it deems relevant and appropriate when making fair value determinations. Examples of possible methodologies include, but are not limited to, multiple of earnings; discount from market of a similar freely traded security; discounted cash-flow analysis; book value or a multiple thereof; risk premium/yield analysis; yield to maturity; and/or fundamental investment analysis. The Valuation Committee will also consider factors it deems relevant and appropriate in light of the facts and circumstances. Examples of possible factors include, but are not limited to, the type of security; the issuer’s financial statements; the purchase price of the security; the discount from market value of unrestricted securities of the same class at the time of purchase; analysts’ research and observations from financial institutions; information regarding any transactions or offers with respect to the security; the existence of merger proposals or tender offers affecting the security; the price and extent of public trading in similar securities of the issuer or comparable companies; and the existence of a shelf registration for restricted securities.
For each portfolio security that has been fair valued pursuant to the policies adopted by the Board of Directors, the fair value price is compared against the last available and next available market quotations. The Valuation Committee reviews the results of such back testing monthly and fair valuation occurrences are reported to the Board of Directors quarterly.
The Fund uses valuation techniques to measure fair value that are consistent with the market approach and/or income approach, depending on the type of security and the particular circumstance. The market approach uses prices and other relevant information generated by market transactions involving identical or comparable securities. The income approach uses valuation techniques to discount estimated future cash flows to present value.
GAAP establishes a disclosure hierarchy that categorizes the inputs to valuation techniques used to value assets and liabilities at measurement date. These inputs are summarized in the three broad levels listed below:
| • | Level 1 — quoted prices in active markets for identical investments |
| • | Level 2 — other significant observable inputs (including quoted prices for similar investments, interest rates, prepayment speeds, credit risk, etc.) |
| • | Level 3 — significant unobservable inputs (including the Fund’s own assumptions in determining the fair value of investments) |
The inputs or methodologies used to value securities are not necessarily an indication of the risk associated with investing in those securities.
| Western Asset Corporate Loan Fund Inc. 2019 Semi-Annual Report | 23 |
Table of Contents
Notes to financial statements(unaudited) (cont’d)
The following is a summary of the inputs used in valuing the Fund’s assets carried at fair value:
| ASSETS | ||||||||||||||||
| Description | Quoted Prices (Level 1) | Other Significant Observable Inputs (Level 2) | Significant Unobservable Inputs (Level 3) | Total | ||||||||||||
| Long-term investments†: | ||||||||||||||||
Senior loans: | ||||||||||||||||
Basic industry | — | $ | 1,615,452 | $ | 198,503 | $ | 1,813,955 | |||||||||
Capital goods | — | 10,856,513 | 2,353,030 | 13,209,543 | ||||||||||||
Consumer cyclical | — | 31,674,423 | 4,247,226 | 35,921,649 | ||||||||||||
Consumernon-cyclical | — | 29,267,163 | 6,773,922 | 36,041,085 | ||||||||||||
Energy | — | 1,906,109 | 1,173,272 | 3,079,381 | ||||||||||||
Finance companies | — | 709,356 | 733,830 | 1,443,186 | ||||||||||||
Financial other | — | 7,913,989 | 7,606,889 | 15,520,878 | ||||||||||||
Insurance | — | 6,291,488 | 308,829 | 6,600,317 | ||||||||||||
REITS | — | — | 719,091 | 719,091 | ||||||||||||
Technology | — | 19,332,660 | 2,098,951 | 21,431,611 | ||||||||||||
Other senior loans | — | 20,639,389 | — | 20,639,389 | ||||||||||||
Corporate bonds & notes: | ||||||||||||||||
Energy | — | 1,081,454 | 0 | * | 1,081,454 | |||||||||||
Other corporate bonds & notes | — | 2,005,392 | — | 2,005,392 | ||||||||||||
Common stocks: | ||||||||||||||||
Consumer discretionary | — | 339,464 | — | 339,464 | ||||||||||||
Energy | $ | 202,191 | 9,764 | — | 211,955 | |||||||||||
Utilities | — | — | 465,453 | 465,453 | ||||||||||||
| Total long-term investments | 202,191 | 133,642,616 | 26,678,996 | 160,523,803 | ||||||||||||
| Short-term investments† | 16,557,990 | — | — | 16,557,990 | ||||||||||||
| Total investments | $ | 16,760,181 | $ | 133,642,616 | $ | 26,678,996 | $ | 177,081,793 | ||||||||
| † | See Schedule of Investments for additional detailed categorizations. |
| * | Amount represents less than $1. |
The following is a reconciliation of investments in which significant unobservable inputs (Level 3) were used in determining fair value:
| Investments in Securities | Balance as of September 30, 2018 | Accrued Premiums/ Discounts | Realized Gain (Loss)1 | Change in Unrealized Appreciation (Depreciation)2 | Purchases | |||||||||||||||
| Senior loans: | ||||||||||||||||||||
Basic industry | $ | 416,802 | $ | 16 | $ | 5,477 | $ | 3,032 | — | |||||||||||
Capital goods | 496,069 | 51 | (1,529) | 41,923 | — | |||||||||||||||
Consumer cyclical | 888,051 | 253 | (10) | 64,318 | $ | 2,907,575 | ||||||||||||||
Consumer non-cyclical | 1,432,198 | 6,095 | 12 | (43,888) | 2,080,509 | |||||||||||||||
Electric | 613,025 | (3,754) | — | 102,807 | — | |||||||||||||||
Energy | 1,224,580 | (766) | 378 | (29,920) | — | |||||||||||||||
| 24 | Western Asset Corporate Loan Fund Inc. 2019 Semi-Annual Report |
Table of Contents
| Investments in Securities (cont’d) | Balance as of September 30, 2018 | Accrued Premiums/ Discounts | Realized Gain (Loss)1 | Change in Unrealized Appreciation (Depreciation)2 | Purchases | |||||||||||||||
Finance companies | — | $ | 118 | $ | 30 | $ | 4,338 | $ | 731,225 | |||||||||||
Financial other | — | (783) | 706 | 13,003 | 7,741,388 | |||||||||||||||
Insurance | $ | 312,704 | 139 | 7 | (2,471) | — | ||||||||||||||
REITS | 727,504 | 2,096 | 4 | (6,863) | — | |||||||||||||||
Technology | 626,713 | 423 | 46 | (785) | 1,554,713 | |||||||||||||||
| Corporate bonds & notes: | ||||||||||||||||||||
Energy | 0 | * | — | — | — | — | ||||||||||||||
| Common stocks: | ||||||||||||||||||||
Consumer discretionary | 301,833 | — | — | 1,426,781 | — | |||||||||||||||
Energy | 236,723 | — | — | 316,506 | — | |||||||||||||||
Utilities | 522,282 | — | — | (56,829) | — | |||||||||||||||
| Total | $ | 7,798,484 | $ | 3,888 | $ | 5,121 | $ | 1,831,952 | $ | 15,015,410 | ||||||||||
| Investments in Securities (cont’d) | Sales | Transfers into Level 33 | Transfers out of Level 34 | Balance March 31, 2019 | Net change in Unrealized Appreciation (Depreciation) for Investments in Securities Still Held at March 31, 20192 | |||||||||||||||
| Senior loans: | ||||||||||||||||||||
Basic industry | $ | (418,843) | $ | 192,019 | — | $ | 198,503 | $ | 6,468 | |||||||||||
Capital goods | (490,000) | 2,306,516 | — | 2,353,030 | 46,342 | |||||||||||||||
Consumer cyclical | (4,278) | 740,782 | $ | (349,465) | 4,247,226 | 31,203 | ||||||||||||||
Consumer non-cyclical | (7,500) | 3,306,496 | — | 6,773,922 | (43,888) | |||||||||||||||
Electric | — | — | (712,078) | — | — | |||||||||||||||
Energy | (21,000) | — | — | 1,173,272 | (29,920) | |||||||||||||||
Finance companies | (1,881) | — | — | 733,830 | 4,338 | |||||||||||||||
Financial other | (147,425) | — | — | 7,606,889 | 13,003 | |||||||||||||||
Insurance | (1,550) | — | — | 308,829 | (2,471) | |||||||||||||||
REITS | (3,650) | — | — | 719,091 | (6,863) | |||||||||||||||
Technology | (9,425) | 46,690 | (119,424) | 2,098,951 | 1,005 | |||||||||||||||
| Corporate bonds & notes: | ||||||||||||||||||||
Energy | — | — | — | 0 | * | — | ||||||||||||||
| Common stocks: | ||||||||||||||||||||
Consumer discretionary | — | — | (1,728,614) | — | — | |||||||||||||||
Energy | — | — | (553,229) | — | — | |||||||||||||||
Utilities | — | — | — | 465,454 | (56,829) | |||||||||||||||
| Total | $ | (1,105,552) | $ | 6,592,503 | $ | (3,462,810) | $ | 26,678,996 | $ | (37,612) | ||||||||||
| * | Amount represents less than $1. |
| 1 | This amount is included in net realized gain (loss) from investment transactions in the accompanying Statement of Operations. |
| Western Asset Corporate Loan Fund Inc. 2019 Semi-Annual Report | 25 |
Table of Contents
Notes to financial statements(unaudited) (cont’d)
| 2 | This amount is included in the change in net unrealized appreciation (depreciation) in the accompanying Statement of Operations. Change in unrealized appreciation (depreciation) includes net unrealized appreciation (depreciation) resulting from changes in investment values during the reporting period and the reversal of previously recorded unrealized appreciation (depreciation) when gains or losses are realized. |
| 3 | Transferred into Level 3 as a result of the unavailability of a quoted price in an active market for an identical investment or the unavailability of other significant observable inputs. |
| 4 | Transferred out of Level 3 as a result of the availability of a quoted price in an active market for an identical investment or the availability of other significant observable inputs. |
(b) Net asset value.The net asset value (“NAV”) of the Fund’s common stock is determined no less frequently than the close of business on the Fund’s last business day of each week (generally Friday) and on the last business day of the month. It is determined by dividing the value of the net assets available to common stock by the total number of shares of common stock outstanding. For the purpose of determining the NAV per share of the common stock, the value of the Fund’s net assets shall be deemed to equal the value of the Fund’s assets less the Fund’s liabilities.
(c) Senior loans.Senior Loans generally are arranged through private negotiations between a borrower and several financial institutions (“Lenders”) represented in each case by one or more such Lenders acting as agent of the Lenders. On behalf of the Lenders, the agent will be primarily responsible for negotiating the loan agreement that establishes the relative terms and conditions of the Senior Loan and rights of the borrower and the Lenders. Also, an agent typically administers the terms of the loan agreement and is responsible for the monitoring of collateral and collection of principal and interest and fee payments from the borrower and the apportionment of these payments to the credit of all investors which are parties to the loan agreement. The Fund may act as one of the group of Lenders in a Senior Loan, and purchase assignments and participations in Senior Loans from third parties. Senior Loans are subject to credit risks, including the risk of nonpayment of scheduled interest or loan payments.
The Fund assumes the credit risk of the borrower, the lender that is selling the participation and any other persons interpositioned between the Fund and the borrower. In the event of the insolvency of the lender selling the participation, the Fund may be treated as a general creditor of the lender and may not benefit from anyoff-set between the lender and the borrower.
(d) Unfunded loan commitments.The Fund may enter into certain credit agreements where all or a portion of which may be unfunded. The Fund is obligated to fund these commitments at the borrower’s discretion. The commitments are disclosed in the accompanying Schedule of Investments. At March 31, 2019, the Fund had sufficient cash and/or securities to cover these commitments.
(e) Cash flow information.The Fund invests in securities and distributes dividends from net investment income and net realized gains, which are paid in cash and may be reinvested at the discretion of shareholders. These activities are reported in the Statement of Changes in Net Assets and additional information on cash receipts and cash payments are presented in the Statement of Cash Flows.
| 26 | Western Asset Corporate Loan Fund Inc. 2019 Semi-Annual Report |
Table of Contents
(f) Security transactions and investment income.Security transactions are accounted for on a trade date basis. Trade date for senior and subordinated loans purchased in the “primary market” is considered the date on which the credit agreement is executed. Trade date for senior and subordinated loans purchased in the “secondary market” is the date on which the transaction is entered into. Interest income (including interest income frompayment-in-kind securities), adjusted for amortization of premium and accretion of discount, is recorded on the accrual basis. Dividend income is recorded on theex-dividend date for dividends received in cash and/or securities. Certain fees received from issuers of the underlying loans, such as consent, amendment and upfront fees (collectively, “consent fees”) are generally recorded as a basis adjustment to the cost of loans held and accreted over the life of the loan. The cost of investments sold is determined by use of the specific identification method.
(g) Distributions to shareholders.Distributions to common shareholders from net investment income of the Fund, if any, are declared and paid on a monthly basis. The actual source of the Fund’s monthly distributions may be from net investment income, return of capital or a combination of both. Shareholders will be informed of the tax characteristics of the distributions after the close of the fiscal year. Distributions to common shareholders of net realized gains, if any, are declared at least annually. Distributions to common shareholders of the Fund are recorded on theex-dividend date and are determined in accordance with income tax regulations, which may differ from GAAP.
(h) Compensating balance arrangements.The Fund has an arrangement with its custodian bank whereby a portion of the custodian’s fees is paid indirectly by credits earned on the Fund’s cash on deposit with the bank.
(i) Federal and other taxes.It is the Fund’s policy to comply with the federal income and excise tax requirements of the Internal Revenue Code of 1986 (the “Code”), as amended, applicable to regulated investment companies. Accordingly, the Fund intends to distribute its taxable income and net realized gains, if any, to shareholders in accordance with timing requirements imposed by the Code. Therefore, no federal or state income tax provision is required in the Fund’s financial statements.
Management has analyzed the Fund’s tax positions taken on income tax returns for all open tax years and has concluded that as of September 30, 2018, no provision for income tax is required in the Fund’s financial statements. The Fund’s federal and state income and federal excise tax returns for tax years for which the applicable statutes of limitations have not expired are subject to examination by the Internal Revenue Service and state departments of revenue.
(j) Reclassification.GAAP requires that certain components of net assets be reclassified to reflect permanent differences between financial and tax reporting. These reclassifications have no effect on net assets or net asset value per share.
| Western Asset Corporate Loan Fund Inc. 2019 Semi-Annual Report | 27 |
Table of Contents
Notes to financial statements(unaudited) (cont’d)
2. Investment management agreement and other transactions with affiliates
Legg Mason Partners Fund Advisor, LLC (“LMPFA”) is the Fund’s investment manager and Western Asset Management Company, LLC (“Western Asset”) is the Fund’s subadviser. LMPFA and Western Asset are wholly-owned subsidiaries of Legg Mason, Inc. (“Legg Mason”).
LMPFA provides administrative and oversight services to the Fund. The Fund pays an investment management fee, calculated daily and paid monthly, at an annual rate of 0.80% of the Fund’s average daily net assets plus assets attributable to Preferred Stock, if any, plus proceeds of any outstanding borrowings used for leverage.
LMPFA has delegated to Western Asset theday-to-day portfolio management of the Fund. For its services, LMPFA pays Western Asset monthly 70% of the net management fee it receives from the Fund.
Effective December 1, 2012, LMPFA agreed to a waiver in the amount of 0.05% of the investment advisory fee that is paid to it by the Fund. The waiver will extend through November 30, 2019.
During periods in which the Fund utilizes financial leverage, the fees paid to LMPFA will be higher than if the Fund did not utilize leverage because the fees are calculated as a percentage of the Fund’s assets, including those investments purchased with leverage.
During the six months ended March 31, 2019, fees waived and/or expenses reimbursed amounted to $40,166.
All officers and one Director of the Fund are employees of Legg Mason or its affiliates and do not receive compensation from the Fund.
3. Investments
During the six months ended March 31, 2019, the aggregate cost of purchases and proceeds from sales of investments (excluding short-term investments) were as follows:
| Purchases | $ | 85,862,137 | ||
| Sales | 90,640,214 |
At March 31, 2019, the aggregate cost of investments and the aggregate gross unrealized appreciation and depreciation of investments for federal income tax purposes were substantially as follows:
| Cost | Gross Unrealized Appreciation | Gross Unrealized Depreciation | Net Unrealized Depreciation | |||||||||||||
| Securities | $ | 180,747,735 | $ | 490,967 | $ | (4,156,909) | $ | (3,665,942) | ||||||||
4. Derivative instruments and hedging activities
During the six months ended March 31, 2019, the Fund did not invest in derivative instruments.
| 28 | Western Asset Corporate Loan Fund Inc. 2019 Semi-Annual Report |
Table of Contents
5. Loan
The Fund has a revolving credit agreement with Toronto-Dominion Bank (“Credit Agreement”), which allows the Fund to borrow up to an aggregate amount of $60,000,000. The Credit Agreement terminates on April 9, 2020. The Fund pays a commitment fee on the unutilized portion of the loan commitment amount at an annual rate of 0.25%, except that the commitment fee is 0.15% in the event that the aggregate outstanding principal balance of the loan is equal to or greater than 75% of $60,000,000. The interest on the loan is calculated at a variable rate based on LIBOR plus any applicable margin. Securities held by the Fund are subject to a lien, granted to Toronto-Dominion Bank, to the extent of the borrowing outstanding and any additional expenses. The Fund’s Credit Agreement contains customary covenants that, among other things, may limit the Fund’s ability to pay distributions in certain circumstances, incur additional debt, change its fundamental investment policies and engage in certain transactions, including mergers and consolidations and require asset coverage ratios in addition to those required by the 1940 Act. In addition, the Credit Agreement may be subject to early termination under certain conditions and may contain other provisions that could limit the Fund’s ability to utilize borrowing under the agreement. Interest expense related to this loan for the six months ended March 31, 2019 was $815,105. For the six months ended March 31, 2019, the Fund incurred commitment fees of $5,963. For the six months ended March 31, 2019, the Fund had an average daily loan balance outstanding of $52,137,363 and the weighted average interest rate was 3.14%. At March 31, 2019, the Fund had $51,000,000 of borrowings outstanding per this credit agreement.
6. Distributions subsequent to March 31, 2019
The following distributions have been declared by the Fund’s Board of Directors and are payable subsequent to the period end of this report:
| Record Date | Payable Date | Amount | ||||||
| 3/22/2019 | 4/1/2019 | $ | 0.0530 | |||||
| 4/18/2019 | 5/1/2019 | $ | 0.0530 | |||||
| 5/24/2019 | 6/3/2019 | $ | 0.0530 | |||||
| 6/21/2019 | 7/1/2019 | $ | 0.0630 | |||||
| 7/19/2019 | 8/1/2019 | $ | 0.0630 | |||||
| 8/23/2019 | 9/3/2019 | $ | 0.0630 | |||||
7. Stock repurchase program
On November 16, 2015, the Fund announced that the Fund’s Board of Directors (the “Board”) had authorized the Fund to repurchase in the open market up to approximately 10% of the Fund’s outstanding common stock when the Fund’s shares are trading at a discount to net asset value. The Board has directed management of the Fund to repurchase shares of common stock at such times and in such amounts as management reasonably believes may enhance stockholder value. The Fund is under no obligation to purchase shares at any specific discount levels or in any specific amounts. During the six months ended March 31, 2019, the Fund did not repurchase any shares.
| Western Asset Corporate Loan Fund Inc. 2019 Semi-Annual Report | 29 |
Table of Contents
Notes to financial statements(unaudited) (cont’d)
8. Deferred capital losses
As of September 30, 2018, the Fund had deferred capital losses of $12,947,544, which have no expiration date, that will be available to offset future taxable capital gains.
9. Recent accounting pronouncements
In August 2018, the Securities and Exchange Commission released its Final Rule on Disclosure Update and Simplification (the “Final Rule”) which is intended to simplify an issuer’s disclosure compliance efforts by removing redundant or outdated disclosure requirements without significantly altering the mix of information provided to investors. Effective with the current reporting period, the Fund adopted the Final Rule with the most notable impacts being that the Fund is no longer required to present the components of distributable earnings on the Statement of Assets and Liabilities or the sources of distributions to shareholders and the amount of undistributed net investment income on the Statements of Changes in Net Assets. The tax components of distributable earnings and distributions to shareholders continue to be disclosed within the Notes to Financial Statements.
The Fund has adopted the disclosure provisions of the Financial Accounting Standards Board Accounting Standards UpdateNo. 2018-13,Fair Value Measurement (Topic 820) —Disclosure Framework — Changes to the Disclosure Requirements for Fair Value Measurement(“ASU2018-13”) which introduces new fair value disclosure requirements as well as eliminates and modifies certain existing fair value disclosure requirements. ASU2018-13 would be effective for fiscal years beginning after December 15, 2019, and interim periods within those fiscal years; however, management has elected to early adopt ASU2018-13. The impact of the Fund’s adoption was limited to changes in the Fund’s financial statement disclosures regarding fair value, primarily those disclosures related to transfers between levels of the fair value hierarchy.
| 30 | Western Asset Corporate Loan Fund Inc. 2019 Semi-Annual Report |
Table of Contents
Board approval of management and
subadvisory agreements(unaudited)
Background
The Investment Company Act of 1940, as amended (the “1940 Act”), requires that the Board of Directors (the “Board”) of Western Asset Corporate Loan Fund Inc. (the “Fund”), including a majority of its members who are not considered to be “interested persons” under the 1940 Act (the “Independent Directors”) voting separately, approve on an annual basis the continuation of the investment management contract (the “Management Agreement”) with the Fund’s manager, Legg Mason Partners Fund Advisor, LLC (the “Manager”) and thesub-advisory agreement (the“Sub-Advisory Agreement”) with the Manager’s affiliate, Western Asset Management Company, LLC (“Western Asset”). At a meeting (the “Contract Renewal Meeting”) heldin-person on November 7 and 8, 2018, the Board, including the Independent Directors, considered and approved the continuation of each of the Management Agreement and theSub-Advisory Agreement for an additionalone-year term. To assist in its consideration of the renewals of the Management Agreement and theSub-Advisory Agreement, the Board received and considered a variety of information (together with the information provided at the Contract Renewal Meeting, the “Contract Renewal Information”) about the Manager and Western Asset, as well as the management andsub-advisory arrangements for the Fund and the otherclosed-end funds in the same complex under the Board’s supervision (the “Legg MasonClosed-end Funds”), certain portions of which are discussed below. A presentation made by the Manager and Western Asset to the Board at the Contract Renewal Meeting in connection with its evaluations of the Management Agreement and theSub-Advisory Agreement encompassed the Fund and other Legg MasonClosed-end Funds. In addition to the Contract Renewal Information, the Board received performance and other information throughout the year related to the services rendered by the Manager and Western Asset to the Fund. The Board’s evaluation took into account the information received throughout the year and also reflected the knowledge and familiarity gained as members of the Boards of the Fund and other Legg MasonClosed-end Funds with respect to the services provided to the Fund by the Manager and Western Asset.
At a meeting held by conference call on October 31, 2018, the Independent Directors in preparation for the Contract Renewal Meeting met in a private session with their independent counsel to review Contract Renewal Information in respect of the Legg MasonClosed-end Funds, including the Fund, received to date. No representatives of the Manager or Western Asset participated in this meeting. The discussion below reflects all of these reviews.
The Manager provides the Fund with investment advisory and administrative services pursuant to the Management Agreement and Western Asset provides the Fund with certain investmentsub-advisory services pursuant to theSub-Advisory Agreement. The discussion below covers both the advisory and administrative functions being rendered by the Manager, each such function being encompassed by the Management Agreement, and the investmentsub-advisory functions being rendered by Western Asset.
| Western Asset Corporate Loan Fund Inc. | 31 |
Table of Contents
Board approval of management and
subadvisory agreements(unaudited) (cont’d)
Board approval of management agreement andsub-advisory agreement
In its deliberations regarding renewal of the Management Agreement and theSub-Advisory Agreement, the Board, including the Independent Directors, considered the factors below.
Nature, extent and quality of the services under the management agreement and thesub-advisory agreement
The Board received and considered Contract Renewal Information regarding the nature, extent, and quality of services provided to the Fund by the Manager and Western Asset under the Management Agreement and theSub-Advisory Agreement, respectively, during the past year. The Board also reviewed Contract Renewal Information regarding the Fund’s compliance policies and procedures established pursuant to the 1940 Act.
The Management Agreement permits the Manager to delegate certain of its responsibilities, including its investment advisory duties thereunder, provided that the Manager, in each case, will supervise the activities of the delegee. Pursuant to this provision of the Management Agreement (the “Delegation Provision”), the Manager, prior to December 1, 2012, did not provideday-to-day portfolio management services to the Fund but rather delegated such responsibilities to Citigroup Alternative Investments LLC (“CAI”), an indirect wholly owned subsidiary of Citigroup, Inc. (“Citigroup”) pursuant to a separatesub-advisory agreement (the “CAISub-Advisory Agreement”) with the Manager. The CAISub-Advisory Agreement expired on November 30, 2012.
The Manager, acting pursuant to its discretionary authority under the Management Agreement, assumed responsibility forday-to-day management of the Fund’s investment portfolio on December 1, 2012 (the “Manager Assumption Date”). The Manager implemented a Management Fee waiver (the “Management Fee Waiver”) of 0.05% for one year, until November 30, 2014, as a result of the elimination of CAI’s fees under the CAISub-Advisory Agreement, which were paid by the Manager. Prior to the Contract Renewal Meeting, the Management Fee Waiver was extended by the Manager each year since its implementation for an additional1-year period and was scheduled to expire on November 30, 2018.
At anin-person meeting held on February 10 and 11, 2016, the Manager presented a proposal to the Board to delegate, pursuant to the Delegation Provision, certain of its responsibilities under the Management Agreement, including its responsibility forday-to-day management of the Fund’s investment portfolio, to Western Asset (the “Western Asset Delegation”). The Manager recalled that beginning on the Manager Assumption Date, the Fund was managed on aday-to-day basis by a portfolio team (“portfolio management team”), which was comprised of individuals who were employees of the Manager and also employees of Western Asset. The Manager assured the Board, among other things, that the same individuals would continue to manage the Fund’s investment portfolio following the proposed Western Asset Delegation although they would do so solely as employees of Western Asset. The Manager also advised the Board that it would continue to provide management and administrative services pursuant to the
| 32 | Western Asset Corporate Loan Fund Inc. |
Table of Contents
Management Agreement following the proposed Western Asset Delegation and, as required by the Management Agreement, would be responsible for supervising Western Asset’s investmentsub-advisory services. The Board was advised that the Manager, not the Fund, would be responsible for fees payable to Western Asset and that the Western Asset Delegation consequently would not increase fees payable by the Fund. Based upon the information and assurances provided by the Manager regarding the Western Asset Delegation and advice from counsel to the Fund that the Western Asset Delegation was permissible under the 1940 Act and did not require shareholder approval, the Board approved the Western Asset Delegation and theSub-Advisory Agreement became effective April 1, 2016.
At the Contract Renewal Meeting, the Board reviewed the responsibilities of the Manager and Western Asset under the Management Agreement and theSub-Advisory Agreement, respectively, including the Manager’s coordination and oversight of the services provided to the Fund by Western Asset and others. As discussed above, the Manager does not provideday-to-day portfolio management services to the Fund. Rather, portfolio management services for the Fund are provided by Western Asset pursuant to theSub-Advisory Agreement between the Manager and Western Asset.
The Board also reviewed the qualifications, backgrounds and responsibilities of the Fund’s senior personnel and the portfolio management team. The Board considered, based on its knowledge of the Manager and its affiliates, the Contract Renewal Information and the Board’s discussions with the Manager and Western Asset at the Contract Renewal Meeting, the general reputation and investment performance records of the Manager, Western Asset, and their affiliates and the financial resources available to the corporate parent of the Manager and Western Asset, Legg Mason, Inc. (“Legg Mason”), to support their activities in respect of the Fund and the other Legg MasonClosed-end Funds.
In reaching its determinations regarding continuation of the Management Agreement and theSub-Advisory Agreement, the Board took into account that Fund shareholders, in pursuing their investment goals and objectives, likely purchased their shares based upon the reputation and the investment style, philosophy and strategy of the Manager and Western Asset, as well as the resources available to the Manager and Western Asset.
The Board concluded that, overall, the nature, extent, and quality of the management and other services provided to the Fund under the Management Agreement and theSub-Advisory Agreement have been satisfactory under the circumstances.
Fund performance
The Board received and considered information regarding Fund performance, including information and analyses (the “Broadridge Performance Information”) for the Fund, as well as for a group of funds (the “Performance Universe”) selected by Broadridge Financial Solutions, Inc. (“Broadridge”), an independent provider of investment company data. The Board was provided with a description of the methodology Broadridge used to determine the similarity of the Fund with the funds included in the Performance Universe. The Performance
| Western Asset Corporate Loan Fund Inc. | 33 |
Table of Contents
Board approval of management and
subadvisory agreements(unaudited) (cont’d)
Universe included the Fund and all leveragedclosed-end loan participation funds, as classified by Broadridge, regardless of asset size. The Performance Universe consisted of at least twenty-four funds, including the Fund, for each of the1-,3-,5- and10-year periods ended June 30, 2018. The Board noted that it had received and discussed with the Manager and Western Asset information throughout the year at periodic intervals comparing the Fund’s performance against its benchmark and its peer funds as selected by Broadridge.
The Broadridge Performance Information comparing the Fund’s performance to that of the Performance Universe based on net asset value per share showed, among other things, that the Fund’s performance was ranked in the fourth quintile of the funds in the Performance Universe for the1-year period ended June 30, 2018. In these performance rankings, the first quintile represents funds with the best performance among the funds in the Performance Universe and the fifth quintile represents funds with poorest performance among the funds in the Performance Universe. The Fund’s performance was ranked in the fifth quintile of the funds in the Performance Universe for each of the3- and5-year periods ended June 30, 2018 and was ranked in the second quintile for the10-year period ended such date. The Fund’s performance for each of the1-,3- and5-year periods ended June 30, 2018 was worse than the Performance Universe median, but its performance was better than the Performance Universe median for the10- year period ended such date. In addition to the Fund’s performance relative to the Performance Universe, the Board considered the Fund’s performance in absolute terms and the Fund’s performance relative to its benchmark for each of the1-,3- and5-year periods ended June 30, 2018. On a net asset value basis, the Fund underperformed its benchmark for each of the1- and3- year periods but outperformed its benchmark for the5-year period. The Board noted that the portfolio management team assumed responsibility for management of the Fund’s investment portfolio from CAI only on the Manager Assumption Date. The Board did not give significant weight to the Broadridge Performance Information or other performance information presented at the Contract Renewal Meeting for the10-year period ended June 30, 2018 since the results were attributable in part to CAI.
Based on the reviews and discussions of Fund performance and considering the agreement by the Manager to extend the Management Fee Waiver for an additional1-year period ending November 30, 2019 and other relevant factors, including those noted above, the Board concluded, under the circumstances, that continuation of the Management Agreement and theSub-Advisory Agreement for an additionalone-year period would be consistent with the interests of the Fund and its shareholders.
Management fees and expense ratios
The Board reviewed and considered the management fee (the “Management Fee”) payable by the Fund to the Manager under the Management Agreement and thesub-advisory fee (the“Sub-Advisory Fee”) payable to Western Asset under theSub-Advisory Agreement in light of the nature, extent and overall quality of the management, investment advisory and other services provided by the Manager and Western Asset. The Board noted that the
| 34 | Western Asset Corporate Loan Fund Inc. |
Table of Contents
Sub-Advisory Fee payable to Western Asset under theSub-Advisory Agreement is paid by the Manager, not the Fund, and accordingly, that the retention of Western Asset does not increase the fees or expenses otherwise incurred by the Fund’s shareholders.
Additionally, the Board received and considered information and analyses prepared by Broadridge (the “Broadridge Expense Information”) comparing the Management Fee and the Fund’s overall expenses with those of funds in an expense group (the “Expense Group”) selected and provided by Broadridge. The comparison was based upon the constituent funds’ latest fiscal years. The Expense Group consisted of the Fund and eight other leveragedclosed-end loan participation funds, as classified by Broadridge. The nine funds in the Expense Group had average net common share assets ranging from the Fund’s $115.4 million to $379.1 million.
The Broadridge Expense Information, comparing the Management Fee as well as the Fund’s actual total expenses to the Fund’s Expense Group, showed, among other things, that the Management Fee was ranked fourth among the funds in the Expense Group when compared on a contractual basis (first being lowest and, therefore, best in these expense component rankings). The Management Fee on an actual basis (i.e., giving effect to any voluntary fee waivers implemented by the Manager with respect to the Fund and by the managers of the other Expense Group funds) was ranked third among the funds in the Expense Group compared on the basis of common share assets only and was ranked second among the Expense Group funds when compared on the basis of common share and leveraged assets. The Broadridge Expense Information further showed that the Fund’s actual total expenses ranked third among the Expense Group funds whether compared on the basis of common share assets only or on the basis of common share and leveraged assets. Each of the Fund’s expense components was better (i.e., lower) than the Expense Group median for that expense component. The Board noted that the expense component comparisons reflected the impact of the Management Fee Waiver, which prior to the Contract Renewal meeting was scheduled to expire on November 30, 2018. The Board also noted that the small number of funds in the Expense Group made meaningful expense comparisons difficult. The Board took into consideration the Manager’s agreement to extend the Management Fee waiver for an additional1-year period ending November 30, 2019.
The Board also reviewed Contract Renewal Information regarding fees charged by the Manager to other U.S. clients investing primarily in an asset class similar to that of the Fund, including, where applicable, institutional and separate accounts. The Board was advised that the fees paid by such institutional, separate account and other clients (collectively, “institutional clients”) generally are lower, and may be significantly lower, than the Management Fee. The Contract Renewal Information discussed the significant differences in scope of services provided to the Fund and to institutional clients. Among other things, institutional clients have fewer compliance, administration and other needs than the Fund and the Fund is subject not only to heightened regulatory requirements relative to institutional clients but also to requirements for listing on the New York Stock
| Western Asset Corporate Loan Fund Inc. | 35 |
Table of Contents
Board approval of management and
subadvisory agreements(unaudited) (cont’d)
Exchange. The Contract Renewal Information noted further that the Fund is provided with administrative services, office facilities, Fund officers (including the Fund’s chief executive, chief financial and chief compliance officers), and that the Manager coordinates and oversees the provision of services to the Fund by other fund service providers. The Contract Renewal Information included information regarding management fees paid byopen-end mutual funds in the same complex (the “Legg MasonOpen-end Funds”) and such information indicated that the management fees paid by the Legg MasonClosed-end Funds generally were higher than those paid by the Legg MasonOpen-end Funds. The Manager, in response to an inquiry from the Board as to the reasons for the fee differential, provided information as to differences between the services provided to the Fund and the other Legg MasonClosed-end Funds and the services provided to the Legg MasonOpen-end Funds. The Board considered the fee comparisons in light of the different services provided in managing these other types of clients and funds.
Taking all of the above into consideration, the Board determined that the Management Fee and theSub-Advisory Fee were reasonable in light of the nature, extent, and overall quality of the management, investment advisory and other services provided to the Fund under the Management Agreement and theSub-Advisory Agreement.
Manager profitability
The Board, as part of the Contract Renewal Information, received an analysis of the profitability to the Manager and its affiliates in providing services to the Fund for the Manager’s fiscal years ended March 31, 2018 and March 31, 2017. The Board also received profitability information with respect to the Legg Mason fund complex as a whole. In addition, the Board received Contract Renewal Information with respect to the Manager’s revenue and cost allocation methodologies used in preparing such profitability data. The profitability analysis presented to the Board as part of the Contract Renewal Information indicated that profitability to the Manager had declined by 7 percent during the period covered by the analysis and remained at a level that the Board did not consider to be excessive in light of judicial guidance and the nature, extent and overall quality of the investment advisory and other services provided to the Fund. The Board considered that the profitability analysis reflected the impact of the Management Fee Waiver during the period covered by the analysis. The Board further considered that the Management Fee Waiver is scheduled to expire on November 30, 2019 and that the expiration could increase the Manager’s future profitability from its relationship with the Fund, but noted that it would have the ability to monitor any future increases in profitability on an annual basis.
Economies of scale
The Board received and discussed Contract Renewal Information concerning whether the Manager realizes economies of scale if the Fund’s assets grow. The Board noted that because the Fund is aclosed-end fund with no current plans to seek additional assets beyond maintaining its dividend reinvestment plan, any significant growth in its assets generally will occur through appreciation in the value of the Fund’s investment portfolio,
| 36 | Western Asset Corporate Loan Fund Inc. |
Table of Contents
rather than sales of additional shares in the Fund. The Board determined that the Management Fee structure, which incorporates no breakpoints reducing the Management Fee at specified increased asset levels, was appropriate under present circumstances.
Other benefits to the manager and western asset
The Board considered other benefits received by the Manager, Western Asset, and their affiliates as a result of their relationship with the Fund and did not regard such benefits as excessive.
* * * * * *
In light of all of the foregoing and other relevant factors, the Board determined, under the circumstances, that continuation of the Management Agreement and theSub-Advisory Agreement would be consistent with the interests of the Fund and its shareholders and unanimously voted to continue each Agreement for a period of one additional year. No single factor reviewed by the Board was identified by the Board as the principal factor in determining whether to approve continuation of the Management Agreement and theSub-Advisory Agreement, and each Board member may have attributed different weights to the various factors. The Independent Directors were advised by separate independent legal counsel throughout the process. Prior to the Contract Renewal Meeting, the Board received a memorandum prepared by the Manager discussing its responsibilities in connection with the proposed continuation of the Management Agreement and theSub-Advisory Agreement as part of the Contract Renewal Information and the Independent Directors separately received a memorandum discussing such responsibilities from their independent counsel. Prior to voting, the Independent Directors also discussed the proposed continuation of the Management Agreement and theSub-Advisory Agreement in private sessions with their independent legal counsel at which no representatives of the Manager or Western Asset were present.
| Western Asset Corporate Loan Fund Inc. | 37 |
Table of Contents
Additional shareholder information(unaudited)
Results of annual meeting of shareholders
The Annual Meeting of Shareholders of Western Asset Corporate Loan Fund Inc. was held on February 22, 2019, for the purpose of considering and voting upon the election of Directors. The following table provides information concerning the matter voted upon at the Meeting:
Election of directors
| Nominees | Votes For | Votes Withheld | ||||||
| Carol L. Colman | 8,230,955 | 986,212 | ||||||
| Nisha Kumar | 8,296,960 | 920,207 | ||||||
| Jane Trust | 8,308,927 | 908,240 | ||||||
At March 31, 2019, in addition to Carol L. Colman, Nisha Kumar and Jane Trust, the other Directors of the Fund were as follows:
Robert D. Agdern
Daniel P. Cronin
Paolo M. Cucchi
William R. Hutchinson
Eileen A. Kamerick
| 38 | Western Asset Corporate Loan Fund Inc. |
Table of Contents
Dividend reinvestment plan(unaudited)
Unless you elect to receive distributions in cash (i.e.,opt-out), all dividends, including any capital gain dividends and return of capital distributions, on your Common Stock will be automatically reinvested by Computershare Trust Company, N.A., as agent for the stockholders (the “Plan Agent”), in additional shares of Common Stock under the Fund’s Dividend Reinvestment Plan (the “Plan”). You may elect not to participate in the Plan by contacting the Plan Agent. If you do not participate, you will receive all cash distributions paid by check mailed directly to you by Computershare Trust Company, N.A., as dividend paying agent.
If you participate in the Plan, the number of shares of Common Stock you will receive will be determined as follows:
(1) If the market price of the Common Stock (plus $0.03 per share commission) on the payment date (or, if the payment date is not a NYSE trading day, the immediately preceding trading day) is equal to or exceeds the net asset value per share of the Common Stock at the close of trading on the NYSE on the payment date, the Fund will issue new Common Stock at a price equal to the greater of (a) the net asset value per share at the close of trading on the NYSE on the payment date or (b) 95% of the market price per share of the Common Stock on the payment date.
(2) If the net asset value per share of the Common Stock exceeds the market price of the Common Stock (plus $0.03 per share commission) at the close of trading on the NYSE on the payment date, the Plan Agent will receive the dividend or distribution in cash and will buy Common Stock in the open market, on the NYSE or elsewhere, for your account as soon as practicable commencing on the trading day following the payment date and terminating no later than the earlier of (a) 30 days after the dividend or distribution payment date, or (b) the payment date for the next succeeding dividend or distribution to be made to the stockholders; except when necessary to comply with applicable provisions of the federal securities laws. If during this period: (i) the market price (plus $0.03 per share commission) rises so that it equals or exceeds the net asset value per share of the Common Stock at the close of trading on the NYSE on the payment date before the Plan Agent has completed the open market purchases or (ii) if the Plan Agent is unable to invest the full amount eligible to be reinvested in open market purchases, the Plan Agent will cease purchasing Common Stock in the open market and the Fund shall issue the remaining Common Stock at a price per share equal to the greater of (a) the net asset value per share at the close of trading on the NYSE on the day prior to the issuance of shares for reinvestment or (b) 95% of the then current market price per share.
Common Stock in your account will be held by the Plan Agent innon-certificated form. Any proxy you receive will include all shares of Common Stock you have received under the Plan. You may withdraw from the Plan (i.e.,opt-out) by notifying the Plan Agent in writing at 462 South 4th Street, Suite 1600, Louisville, KY 40202 or by calling the Plan Agent at1-888-888-0151. Such withdrawal will be effective immediately if notice is received by the Plan Agent not less than ten business days prior to any dividend or distribution record date;
| Western Asset Corporate Loan Fund Inc. | 39 |
Table of Contents
Dividend reinvestment plan(unaudited) (cont’d)
otherwise such withdrawal will be effective as soon as practicable after the Plan Agent’s investment of the most recently declared dividend or distribution on the Common Stock.
Plan participants who sell their shares will be charged a service charge (currently $5.00 per transaction) and the Plan Agent is authorized to deduct brokerage charges actually incurred from the proceeds (currently $0.05 per share commission). There is no service charge for reinvestment of your dividends or distributions in Common Stock. However, all participants will pay a pro rata share of brokerage commissions incurred by the Plan Agent when it makes open market purchases. Because all dividends and distributions will be automatically reinvested in additional shares of Common Stock, this allows you to add to your investment through dollar cost averaging, which may lower the average cost of your Common Stock over time. Dollar cost averaging is a technique for lowering the average cost per share over time if the Fund’s net asset value declines. While dollar cost averaging has definite advantages, it cannot assure profit or protect against loss in declining markets.
Automatically reinvesting dividends and distributions does not mean that you do not have to pay income taxes due upon receiving dividends and distributions. Investors will be subject to income tax on amounts reinvested under the Plan.
The Fund reserves the right to amend or terminate the Plan if, in the judgment of the Board of Directors, the change is warranted. The Plan may be terminated, amended or supplemented by the Fund upon notice in writing mailed to stockholders at least 30 days prior to the record date for the payment of any dividend or distribution by the Fund for which the termination or amendment is to be effective. Upon any termination, you will be sent cash for any fractional share of Common Stock in your account. You may elect to notify the Plan Agent in advance of such termination to have the Plan Agent sell part or all of your Common Stock on your behalf. Additional information about the Plan and your account may be obtained from the Plan Agent at 462 South 4th Street, Suite 1600, Louisville, KY 40202 or by calling the Plan Agent at1-888-888-0151.
| 40 | Western Asset Corporate Loan Fund Inc. |
Table of Contents
Western Asset
Corporate Loan Fund Inc.
Directors
Robert D. Agdern
Carol L. Colman
Daniel P. Cronin
Paolo M. Cucchi
William R. Hutchinson
Eileen A. Kamerick
Nisha Kumar*
Jane Trust
Chairman
Officers
Jane Trust
President and Chief Executive Officer
Richard F. Sennett
Principal Financial Officer
Todd F. Kuehl
Chief Compliance Officer
Jenna Bailey
Identity Theft Prevention Officer
Robert I. Frenkel
Secretary and Chief Legal Officer
Thomas C. Mandia
Assistant Secretary
Jennifer S. Berg
Treasurer
Jeanne M. Kelly
Senior Vice President
| * | Effective January 1, 2019, Ms. Kumar became a Director. |
Western Asset Corporate Loan Fund Inc.
620 Eighth Avenue
49th Floor
New York, NY 10018
Investment manager
Legg Mason Partners Fund Advisor, LLC
Subadviser
Western Asset Management Company, LLC
Custodian
The Bank of New York Mellon
Transfer agent
Computershare Inc.
462 South 4th Street, Suite 1600
Louisville, KY 40202
Independent registered public accounting firm
PricewaterhouseCoopers LLP
Baltimore, MD
Legal counsel
Simpson Thacher & Bartlett LLP
425 Lexington Avenue
New York, NY 10017
New York Stock Exchange Symbol
TLI
Table of Contents
Legg Mason Funds Privacy and Security Notice
Your Privacy and the Security of Your Personal Information is Very Important to the Legg Mason Funds
This Privacy and Security Notice (the “Privacy Notice”) addresses the Legg Mason Funds’ privacy and data protection practices with respect to nonpublic personal information the Funds receive. The Legg Mason Funds include any funds sold by the Funds’ distributor, Legg Mason Investor Services, LLC, as well as Legg Mason-sponsoredclosed-end funds. The provisions of this Privacy Notice apply to your information both while you are a shareholder and after you are no longer invested with the Funds.
The Type of Nonpublic Personal Information the Funds Collect About You
The Funds collect and maintain nonpublic personal information about you in connection with your shareholder account. Such information may include, but is not limited to:
| • | Personal information included on applications or other forms; |
| • | Account balances, transactions, and mutual fund holdings and positions; |
| • | Bank account information, legal documents, and identity verification documentation; |
| • | Online account access user IDs, passwords, security challenge question responses; and |
| • | Information received from consumer reporting agencies regarding credit history and creditworthiness (such as the amount of an individual’s total debt, payment history, etc.). |
How the Funds Use Nonpublic Personal Information About You
The Funds do not sell or share your nonpublic personal information with third parties or with affiliates for their marketing purposes, or with other financial institutions or affiliates for joint marketing purposes, unless you have authorized the Funds to do so. The Funds do not disclose any nonpublic personal information about you except as may be required to perform transactions or services you have authorized or as permitted or required by law. The Funds may disclose information about you to:
| • | Employees, agents, and affiliates on a “need to know” basis to enable the Funds to conduct ordinary business or to comply with obligations to government regulators; |
| • | Service providers, including the Funds’ affiliates, who assist the Funds as part of the ordinary course of business (such as printing, mailing services, or processing or servicing your account with us) or otherwise perform services on the Funds’ behalf, including companies that may perform statistical analysis, market research and marketing services solely for the Funds; |
| • | Permit access to transfer, whether in the United States or countries outside of the United States to such Funds’ employees, agents and affiliates and service providers as required to enable the Funds to conduct ordinary business, or to comply with obligations to government regulators; |
| NOT PART OF THE SEMI-ANNUAL REPORT |
Table of Contents
Legg Mason Funds Privacy and Security Notice (cont’d)
| • | The Funds’ representatives such as legal counsel, accountants and auditors to enable the Funds to conduct ordinary business, or to comply with obligations to government regulators; |
| • | Fiduciaries or representatives acting on your behalf, such as an IRA custodian or trustee of a grantor trust. |
Except as otherwise permitted by applicable law, companies acting on the Funds’ behalf, including those outside the United States, are contractually obligated to keep nonpublic personal information the Funds provide to them confidential and to use the information the Funds share only to provide the services the Funds ask them to perform.
The Funds may disclose nonpublic personal information about you when necessary to enforce their rights or protect against fraud, or as permitted or required by applicable law, such as in connection with a law enforcement or regulatory request, subpoena, or similar legal process. In the event of a corporate action or in the event a Fund service provider changes, the Funds may be required to disclose your nonpublic personal information to third parties. While it is the Funds’ practice to obtain protections for disclosed information in these types of transactions, the Funds cannot guarantee their privacy policy will remain unchanged.
Keeping You Informed of the Funds’ Privacy and Security Practices
The Funds will notify you annually of their privacy policy as required by federal law. While the Funds reserve the right to modify this policy at any time they will notify you promptly if this privacy policy changes.
The Funds’ Security Practices
The Funds maintain appropriate physical, electronic and procedural safeguards designed to guard your nonpublic personal information. The Funds’ internal data security policies restrict access to your nonpublic personal information to authorized employees, who may use your nonpublic personal information for Fund business purposes only.
Although the Funds strive to protect your nonpublic personal information, they cannot ensure or warrant the security of any information you provide or transmit to them, and you do so at your own risk. In the event of a breach of the confidentiality or security of your nonpublic personal information, the Funds will attempt to notify you as necessary so you can take appropriate protective steps. If you have consented to the Funds using electronic communications or electronic delivery of statements, they may notify you under such circumstances using the most current email address you have on record with them.
In order for the Funds to provide effective service to you, keeping your account information accurate is very important. If you believe that your account information is incomplete, not accurate or not current, if you have questions about the Funds’ privacy practices, or our use of your nonpublic personal information, write the Funds using the contact information on your account statements, email the Funds by clicking on the Contact Us section of the Funds’ website at www.leggmason.com, or contact the Funds at1-888-777-0102.
Revised April 2018
| NOT PART OF THE SEMI-ANNUAL REPORT |
Table of Contents
Western Asset Corporate Loan Fund Inc.
Western Asset Corporate Loan Fund Inc.
620 Eighth Avenue
49th Floor
New York, NY 10018
Notice is hereby given in accordance with Section 23(c) of the Investment Company Act of 1940, as amended, that from time to time the Fund may purchase, at market prices, shares of its stock.
The Fund files its complete schedule of portfolio holdings with the Securities and Exchange Commission (“SEC”) for the first and third quarters of each fiscal year as an exhibit to its reports on FormN-PORT. Previously, the Fund filed a complete schedule of portfolio holdings with the SEC for the first and third quarters of each fiscal year on FormN-Q. The Fund’s FormsN-PORT andN-Q are available on the SEC’s website at www.sec.gov. To obtain information on FormsN-PORT andN-Q, shareholders can call the Fund at1-888-777-0102.
Information on how the Fund voted proxies relating to portfolio securities during the prior12-month period ended June 30th of each year and a description of the policies and procedures that the Fund uses to determine how to vote proxies related to portfolio transactions are available (1) without charge, upon request, by calling1-888-777-0102, (2) at www.lmcef.com and (3) on the SEC’s website at www.sec.gov.
This report is transmitted to the shareholders of Western Asset Corporate Loan Fund Inc. for their information. This is not a prospectus, circular or representation intended for use in the purchase of shares of the Fund or any securities mentioned in this report.
Computershare Inc.
462 South 4th Street, Suite 1600
Louisville, KY 40202
FD01642 5/19 SR19-3612
Table of Contents
ITEM 2. CODE OF ETHICS.
Not applicable.
ITEM 3. AUDIT COMMITTEE FINANCIAL EXPERT.
Not applicable.
ITEM 4. PRINCIPAL ACCOUNTANT FEES AND SERVICES.
Not applicable.
ITEM 5. AUDIT COMMITTEE OF LISTED REGISTRANTS.
Not applicable.
ITEM 6. SCHEDULE OF INVESTMENTS.
Included herein under Item 1.
ITEM 7. DISCLOSURE OF PROXY VOTING POLICIES AND PROCEDURES FORCLOSED-END MANAGEMENT INVESTMENT COMPANIES.
Not applicable.
ITEM 8. PORTFOLIO MANAGERS OFCLOSED-END MANAGEMENT INVESTMENT COMPANIES.
8(a): Not applicable.
8(b): Effective March 1, 2019, Ryan Kohan became part of the portfolio management team of the Fund.
NAME AND ADDRESS | LENGTH OF TIME SERVED | PRINCIPAL OCCUPATION(S) DURING PAST 5 YEARS | ||
Ryan Kohan
Western Asset 385 East Colorado Blvd. Pasadena, CA 91101 | Effective March 1, 2019 | Responsible for theday-to-day management with other members of the Fund’s portfolio management team; Portfolio Manager with Western Asset since 2019. Formerly, Mr. Kohan was a Portfolio Manager for Sound Point, a privately-owned credit asset manager for the last five years. |
The following tables set forth certain additional information with respect to the above named fund’s investment professional responsible for theday-to-day management with other members of the Fund’s portfolio management team for the fund. Unless noted otherwise, all information is provided as of March 31, 2019.
Other Accounts Managed by Investment Professional
Table of Contents
The table below identifies the number of accounts (other than the fund) for which the below named fund’s investment professional hasday-to-day management responsibilities and the total assets in such accounts, within each of the following categories:
registered investment companies, other pooled investment vehicles, and other accounts. For each category, the number of accounts and total assets in the accounts where fees are based on performance is also indicated.
Investment Professional | Type of Account | Number of Accounts Managed | Total Assets Managed ($) (billions) | Number of Accounts Managed for which Advisory Fee is Performance-Based | Assets Managed for which Advisory Fee is Performance-Based ($) (billions) | |||||||||||||
Ryan Kohan* | Registered investment companies | None | None | None | None | |||||||||||||
| Other pooled investment vehicles | 8 | 2.01 | 2 | 0.67 | ||||||||||||||
| Other accounts | 4 | 4.04 | 1 | 0.001 | ||||||||||||||
| * | Mr.Kohan joined the Fund’s portfolio management team on March 1, 2019. |
Investment Professional Compensation
With respect to the compensation of the investment professionals, Western Asset’s compensation system assigns each employee a total compensation range, which is derived from annual market surveys that benchmark each role with its job function and peer universe. This method is designed to reward employees with total compensation reflective of the external market value of their skills, experience, and ability to produce desired results. Standard compensation includes competitive base salaries, generous employee benefits, and a retirement plan.
In addition, the subadviser’s employees are eligible for bonuses. These are structured to closely align the interests of employees with those of the subadviser, and are determined by the professional’s job function andpre-tax performance as measured by a formal review process. All bonuses are completely discretionary. The principal factor considered is an investment professional’s investment performance versus appropriate peer groups and benchmarks (e.g., a securities index and with respect to a fund, the benchmark set forth in the fund’s Prospectus to which the fund’s average annual total returns are compared or, if none, the benchmark set forth in the fund’s annual report). Performance is reviewed on a 1, 3 and 5 year basis for compensation—with 3 years having the most emphasis. The subadviser may also measure an investment professional’spre-tax investment performance against other benchmarks, as it determines appropriate. Because investment professionals are generally responsible for multiple accounts (including the funds) with similar investment strategies, they are generally compensated on the performance of the aggregate group of similar accounts, rather than a specific account. Other factors that may be considered when making bonus decisions include client service, business development, length of service to the subadviser, management or supervisory responsibilities, contributions to developing business strategy and overall contributions to the subadviser’s business.
Finally, in order to attract and retain top talent, all professionals are eligible for additional incentives in recognition of outstanding performance. These are determined based upon the factors described above and include Legg Mason stock options and long-term incentives that vest over a set period of time past the award date.
Table of Contents
Potential Conflicts of Interest
The subadviser has adopted compliance policies and procedures to address a wide range of potential conflicts of interest that could directly impact client portfolios. For example, potential conflicts of interest may arise in connection with the management of multiple portfolios (including portfolios managed in a personal capacity). These could include potential conflicts of interest related to the knowledge and timing of a portfolio’s trades, investment opportunities and broker selection. Portfolio managers are privy to the size, timing, and possible market impact of a portfolio’s trades.
It is possible that an investment opportunity may be suitable for both a portfolio and other accounts managed by a portfolio manager, but may not be available in sufficient quantities for both the portfolio and the other accounts to participate fully. Similarly, there may be limited opportunity to sell an investment held by a portfolio and another account. A conflict may arise where the portfolio manager may have an incentive to treat an account preferentially as compared to a portfolio because the account pays a performance-based fee or the portfolio manager, the subadviser or an affiliate has an interest in the account. The subadviser has adopted procedures for allocation of portfolio transactions and investment opportunities across multiple client accounts on a fair and equitable basis over time. Eligible accounts that can participate in a trade generally share the same price on apro-rata allocation basis, taking into account differences based on factors such as cash availability, investment restrictions and guidelines, and portfolio composition versus strategy.
With respect to securities transactions, the subadviser determines which broker or dealer to use to execute each order, consistent with their duty to seek best execution of the transaction. However, with respect to certain other accounts (such as pooled investment vehicles that are not registered investment companies and other accounts managed for organizations and individuals), the subadviser may be limited by the client with respect to the selection of brokers or dealers or may be instructed to direct trades through a particular broker or dealer. In these cases, trades for a portfolio in a particular security may be placed separately from, rather than aggregated with, such other accounts. Having separate transactions with respect to a security may temporarily affect the market price of the security or the execution of the transaction, or both, to the possible detriment of a portfolio or the other account(s) involved. Additionally, the management of multiple portfolios and/or other accounts may result in a portfolio manager devoting unequal time and attention to the management of each portfolio and/or other account. The subadviser’s team approach to portfolio management and block trading approach seeks to limit this potential risk.
The subadviser also maintains a gift and entertainment policy to address the potential for a business contact to give gifts or host entertainment events that may influence the business judgment of an employee. Employees are permitted to retain gifts of only a nominal value and are required to make reimbursement for entertainment events above a certain value. All gifts (except those of a de minimis value) and entertainment events that are given or sponsored by a business contact are required to be reported in a gift and entertainment log which is reviewed on a regular basis for possible issues.
Employees of the subadviser have access to transactions and holdings information regarding client accounts and the subadviser’s overall trading activities. This information represents a potential conflict of interest because employees may take advantage of this information as they trade in their personal accounts. Accordingly, the subadviser maintains a Code of Ethics that is compliant with Rule17j-1 under the Investment Company Act of 1940, as amended, and Rule204A-1 under the Investment Advisers Act of 1940, to address personal trading. In addition, the Code of Ethics seeks to establish broader principles of good conduct and fiduciary responsibility in all aspects of the subadviser’s business. The Code of Ethics is administered by the Legal and Compliance Department and monitored through the subadviser’s compliance monitoring program.
The subadviser may also face other potential conflicts of interest with respect to managing client assets, and the description above is not a complete description of every conflict of interest that could be deemed to exist.
Table of Contents
The subadviser also maintains a compliance monitoring program and engages independent auditors to conduct a SOC1/ISAE 3402 audit on an annual basis. These steps help to ensure that potential conflicts of interest have been addressed.
Investment Professional Securities Ownership
The table below identifies the dollar range of securities beneficially owned by the named investment professional as of March 31, 2019.
Investment Professional | Dollar Range of Ownership of Securities ($) | |
Ryan Kohan* | None |
| * | Mr.Kohan joined the Fund’s portfolio management team on March 1, 2019. |
Dollar Range ownership is as follows:
A: none
B: $1 - $10,000
C: 10,001 - $50,000
D: $50,001 - $100,000
E: $100,001 - $500,000
F: $500,001 - $1 million
G: over $1 million
ITEM 9. PURCHASES OF EQUITY SECURITIES BYCLOSED-END MANAGEMENT INVESTMENT COMPANY AND AFFILIATED PURCHASERS.
Not applicable.
ITEM 10. SUBMISSION OF MATTERS TO A VOTE OF SECURITY HOLDERS.
Not applicable.
ITEM 11. CONTROLS AND PROCEDURES.
| (a) | The registrant’s principal executive officer and principal financial officer have concluded that the registrant’s disclosure controls and procedures (as defined in Rule30a- 3(c) under the Investment Company Act of 1940, as amended (the “1940 Act”)) are effective as of a date within 90 days of the filing date of this report that includes the disclosure required by this paragraph, based on their evaluation of the disclosure controls and procedures required by Rule30a-3(b) under the 1940 Act and15d-15(b) under the Securities Exchange Act of 1934. |
| (b) | There were no changes in the registrant’s internal control over financial reporting (as defined in Rule30a-3(d) under the 1940 Act) that occurred during the second fiscal quarter of the period covered by this report that have materially affected, or are likely to materially affect the registrant’s internal control over financial reporting. |
Table of Contents
ITEM 12. DISCLOSURE OF SECURITIES LENDING ACTIVITIES FORCLOSED-END MANAGEMENT INVESTMENT COMPANIES.
Not applicable.
ITEM 13. EXHIBITS.
(a) (1) Not applicable.
Exhibit 99.CODE ETH
(a) (2) Certifications pursuant to section 302 of the Sarbanes-Oxley Act of 2002 attached hereto.
Exhibit 99.CERT
(b) Certifications pursuant to Section 906 of the Sarbanes-Oxley Act of 2002 attached hereto.
Exhibit 99.906CERT
Table of Contents
SIGNATURES
Pursuant to the requirements of the Securities Exchange Act of 1934 and the Investment Company Act of 1940, the registrant has duly caused this Report to be signed on its behalf by the undersigned, there unto duly authorized.
Western Asset Corporate Loan Fund Inc.
| By: | /s/ Jane Trust | |
| Jane Trust | ||
| Chief Executive Officer | ||
| Date: | May 24, 2019 | |
Pursuant to the requirements of the Securities Exchange Act of 1934 and the Investment Company Act of 1940, this report has been signed below by the following persons on behalf of the registrant and in the capacities and on the dates indicated.
| By: | /s/ Jane Trust | |
| Jane Trust | ||
| Chief Executive Officer | ||
| Date: | May 24, 2019 | |
| By: | /s/ Richard F. Sennett | |
| Richard F. Sennett | ||
| Principal Financial Officer | ||
| Date: | May 24, 2019 | |