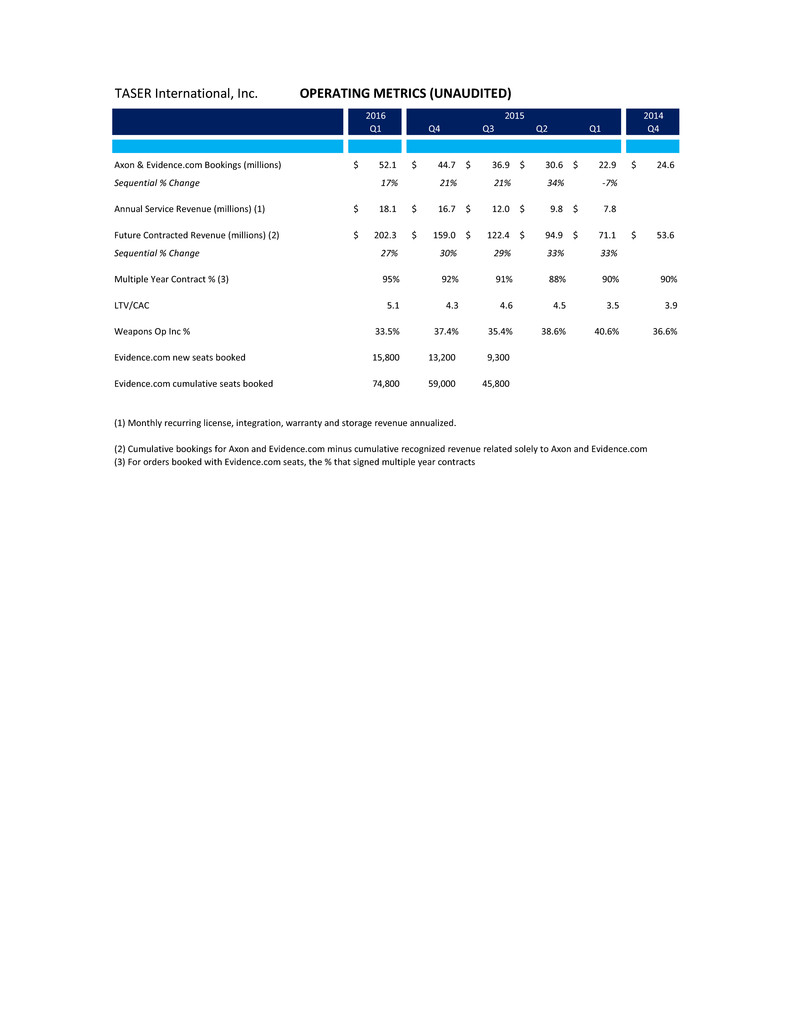
TASER International, Inc. OPERATING METRICS (UNAUDITED) Q1 Q4 Q3 Q2 Q1 Q4 Axon & Evidence.com Bookings (millions) 52.1$ 44.7$ 36.9$ 30.6$ 22.9$ 24.6$ Sequential % Change 17% 21% 21% 34% -7% Annual Service Revenue (millions) (1) 18.1$ 16.7$ 12.0$ 9.8$ 7.8$ Future Contracted Revenue (millions) (2) 202.3$ 159.0$ 122.4$ 94.9$ 71.1$ 53.6$ Sequential % Change 27% 30% 29% 33% 33% Multiple Year Contract % (3) 95% 92% 91% 88% 90% 90% LTV/CAC 5.1 4.3 4.6 4.5 3.5 3.9 Weapons Op Inc % 33.5% 37.4% 35.4% 38.6% 40.6% 36.6% Evidence.com new seats booked 15,800 13,200 9,300 Evidence.com cumulative seats booked 74,800 59,000 45,800 (1) Monthly recurring license, integration, warranty and storage revenue annualized. (3) For orders booked with Evidence.com seats, the % that signed multiple year contracts 2014 (2) Cumulative bookings for Axon and Evidence.com minus cumulative recognized revenue related solely to Axon and Evidence.com 20152016

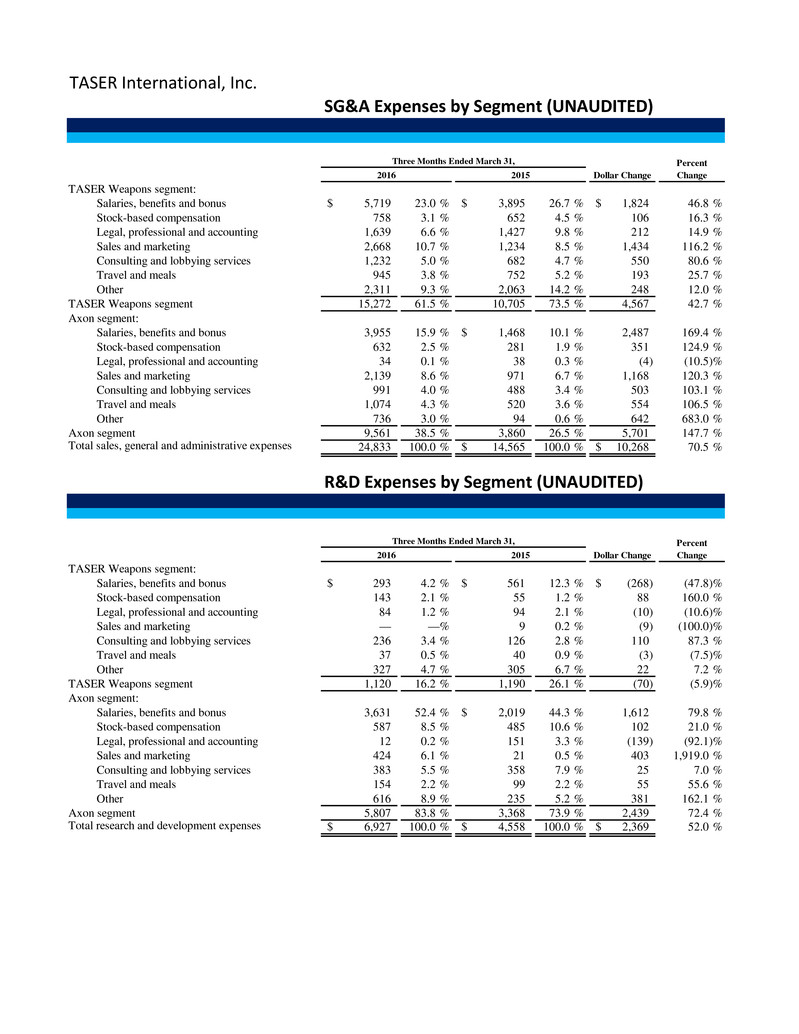
TASER International, Inc. SG&A Expenses by Segment (UNAUDITED) TASER Weapons segment: Salaries, benefits and bonus 5,719$ 23.0 % 3,895$ 26.7 % 1,824$ 46.8 % Stock-based compensation 758 3.1 % 652 4.5 % 106 16.3 % Legal, professional and accounting 1,639 6.6 % 1,427 9.8 % 212 14.9 % Sales and marketing 2,668 10.7 % 1,234 8.5 % 1,434 116.2 % Consulting and lobbying services 1,232 5.0 % 682 4.7 % 550 80.6 % Travel and meals 945 3.8 % 752 5.2 % 193 25.7 % Other 2,311 9.3 % 2,063 14.2 % 248 12.0 % TASER Weapons segment 15,272 61.5 % 10,705 73.5 % 4,567 42.7 % Axon segment: Salaries, benefits and bonus 3,955 15.9 % 1,468$ 10.1 % 2,487 169.4 % Stock-based compensation 632 2.5 % 281 1.9 % 351 124.9 % Legal, professional and accounting 34 0.1 % 38 0.3 % (4) (10.5)% Sales and marketing 2,139 8.6 % 971 6.7 % 1,168 120.3 % Consulting and lobbying services 991 4.0 % 488 3.4 % 503 103.1 % Travel and meals 1,074 4.3 % 520 3.6 % 554 106.5 % Other 736 3.0 % 94 0.6 % 642 683.0 % Axon segment 9,561 38.5 % 3,860 26.5 % 5,701 147.7 % Total sales, general and administrative expenses 24,833 100.0 % 14,565$ 100.0 % 10,268$ 70.5 % R&D Expenses by Segment (UNAUDITED) TASER Weapons segment: Salaries, benefits and bonus 293$ 4.2 % 561$ 12.3 % (268)$ (47.8)% Stock-based compensation 143 2.1 % 55 1.2 % 88 160.0 % Legal, professional and accounting 84 1.2 % 94 2.1 % (10) (10.6)% Sales and marketing — —% 9 0.2 % (9) (100.0)% Consulting and lobbying services 236 3.4 % 126 2.8 % 110 87.3 % Travel and meals 37 0.5 % 40 0.9 % (3) (7.5)% Other 327 4.7 % 305 6.7 % 22 7.2 % TASER Weapons segment 1,120 16.2 % 1,190 26.1 % (70) (5.9)% Axon segment: Salaries, benefits and bonus 3,631 52.4 % 2,019$ 44.3 % 1,612 79.8 % Stock-based compensation 587 8.5 % 485 10.6 % 102 21.0 % Legal, professional and accounting 12 0.2 % 151 3.3 % (139) (92.1)% Sales and marketing 424 6.1 % 21 0.5 % 403 1,919.0 % Consulting and lobbying services 383 5.5 % 358 7.9 % 25 7.0 % Travel and meals 154 2.2 % 99 2.2 % 55 55.6 % Other 616 8.9 % 235 5.2 % 381 162.1 % Axon segment 5,807 83.8 % 3,368 73.9 % 2,439 72.4 % Total research and development expenses 6,927$ 100.0 % 4,558$ 100.0 % 2,369$ 52.0 % Three Months Ended March 31, Dollar Change Percent Change2016 2015 Three Months Ended March 31, Dollar Change Percent Change2016 2015

