SECURITIES AND EXCHANGE COMMISSION
WASHINGTON, D.C. 20549
FORM 10-K
(Mark One)
| x | ANNUAL REPORT PURSUANT TO SECTION 13 OR 15(d) OF THE SECURITIES EXCHANGE ACT OF 1934 |
For the fiscal year ended December 31, 2006
OR
| ¨ | TRANSITION REPORT PURSUANT TO SECTION 13 OR 15(d) OF THE SECURITIES EXCHANGE ACT OF 1934 |
For the transition period from to .
COMMISSION FILE NUMBER 0-28977
VARSITY GROUP INC.
(Exact name of registrant as specified in its charter)
| | |
| DELAWARE | | 54-1876848 |
(State or other jurisdiction of incorporation or organization) | | (IRS Employer Identification No.) |
1300 19th Street, NW, Suite 800
WASHINGTON, D.C. 20036
(Address of principal executive offices) (Zip Code)
Registrant’s telephone number, including area code: (202) 667-3400
SECURITIES REGISTERED PURSUANT TO SECTION 12(b) OF THE ACT:
Common Stock, $.0001 par value
The NASDAQ Stock Market LLC
SECURITIES REGISTERED PURSUANT TO SECTION 12(g) OF THE ACT:
None
Indicate by check mark if the registrant is a well-known seasoned issuer, as defined in Rule 405 of the Securities Act.
Yes ¨ No x
Indicate by check mark whether the registrant (1) has filed all reports required to be filed by Section 13 or 15(d) of the Securities Exchange Act of 1934 during the preceding 12 months (or for such shorter period that the registrant was required to file such reports), and (2) has been subject to such filing requirements for the past 90 days. Yes x No ¨
Indicate by check mark if disclosure of delinquent filers pursuant to Item 405 of Regulation S-K is not contained herein, and will not be contained, to the best of registrant’s knowledge, in definitive proxy or information statements incorporated by reference in Part III of this Form 10-K or any amendment to this Form 10-K. ¨
Indicate by check mark whether the registrant is a large accelerated filer, an accelerated filer, or a non-accelerated filer. See the definitions of “accelerated filer and large accelerated filer” in Rule 12b-2 of the Act. (Check one):
Large accelerated filer ¨ Accelerated filer ¨ Non-accelerated filer x
Indicate by check mark whether the registrant is a shell company (as defined in Rule 12b-2 of the Act). Yes ¨ No x
The aggregate market value of common stock held by non-affiliates of the registrant was $65,364,901 based on the last reported sale price of $4.08 on June 30, 2006. For purposes of the determination of affiliate status, we have assumed that all executive
officers, directors and greater than 10% stockholders are affiliates. This determination is not necessarily controlling for other purposes.
As of March 28, 2007, there were 18,457,879 shares of common stock outstanding.
DOCUMENTS INCORPORATED BY REFERENCE
The registrant intends to file a definitive Proxy Statement for its Annual Meeting of Stockholders pursuant to Regulation 14A within 120 days of the end of the fiscal year ended December 31, 2006. Portions of such proxy statement are incorporated by reference into Part III of this report.
2
Forward-Looking Statements
This Annual Report on Form 10-K (“Form 10-K”) contains forward-looking statements within the meaning of Section 27A of the Securities and Exchange Act of 1934, which statements can be identified by the use of forward looking terminology, such as “may”, “will”, “expect”, “anticipate”, “estimate”, or “continue” or the negative thereof or other variations thereon or comparable terminology. Our actual results could differ materially from those anticipated in these forward-looking statements as a result of many factors, including those set forth elsewhere in this Form 10-K. Please see Item 1A “Risk Factors” for cautionary statements identifying important factors with respect to such forward-looking statements, including risks and uncertainties, that could cause actual results to differ materially from results referred to in forward-looking statements.
PART I
ITEM 1: BUSINESS
GENERAL
We are an outsourcing solutions provider for the education community. Under the umbrella of our “VarsityBooks” and “Campus Outfitters” brands we offer an outsourcing solution to provide textbooks, uniforms and school supplies to private K-12 schools, colleges, and distance and continuing education markets. Our textbook and apparel solutions are designed to release our partner institutions from the operational and financial challenges associated with managing highly seasonal retail operations and allows them to focus valuable resources on their core educational mission. Our textbook program, eduPartners, was the first online bookstore solution focused on meeting the needs of private middle and high schools nationwide. Please see Note 16 to our consolidated financial statements for financial information on our business segments.
Students and families enjoy the convenience of purchasing learning materials, school uniforms, and other supplies through our convenient online stores (located atwww.varsitybooks.com andwww.campusoutfitters.com), at select retail locations or at managed on-campus sales events. To date, the primary channel for textbook sales has been through online eCommerce transactions, while the majority of our uniform sales have been recognized through retail stores and on-campus sales events.
Within our textbook solution, we create a customized virtual bookstore for each partner school which is hosted on our website, www.varsitybooks.com. This site contains the required and optional educational materials and supplies selected by the school organized by grade, academic discipline and course name. Students and parents from each of our partner schools access their customized bookstore to place their orders via a direct link from their school’s homepage or by searching for their school bookstore by region and state on our homepage. Once an order has been submitted, it is picked, packed and shipped from one of three distribution centers nationwide.
Member schools leverage our textbook solution to lower their operating overhead by outsourcing their bookstore operation while delivering a more efficient and flexible bookstore solution to their community. In addition, our partner schools have access to our unique program administration website that provides them with sales and inventory reports, among other valuable features. Student and parent customers value the convenience of our online shopping experience and take comfort in the knowledge that our posted booklists have been reviewed for content and accuracy and approved by their school. As a further convenience to parents, students and school officials, to the extent any of our partner schools adopt textbooks to be used in the next school term, we will typically offer parents and students several options to sell back their textbooks to us at the end of the school year, helping to lower their total cost of textbook ownership. These used textbooks are offered for sale the following school year providing our student and parent customers lower cost pricing alternatives.
As part of our strategy to expand the number of services and products we offer our customers, we acquired Campus Outfitters in May 2005, creating a single source solution for school textbook and uniform needs. Our acquisition of Campus Outfitters allows us to leverage relationships with schools partnered under either our textbook or uniform programs by cross-promoting the other product lines. Through the Campus Outfitters brand, we own and operate nine retail locations serving private K-12 school communities as their official school uniform provider. As a further convenience to our uniform customers, we travel to eligible schools and conduct on-campus sales events during which families can purchase and take home all necessary uniform components the same day. Finally, parents and students always have the ability to shop online through customized virtual stores which are created onwww.campusoutfitters.com for each partner school containing all required uniform components.
Similar to our textbook solution, partner uniform schools leverage their relationship with us to lower their operating overhead by outsourcing their school uniform operation while delivering a more flexible uniform solution to their community.
Throughout 2006, we continued to expand our core online textbook model, while integrating the Campus Outfitters acquisition. During the year ended December 31, 2006, revenues increased by 7.7% or $3.8 million to $53.9 million, from $50.1 million in fiscal 2005.
3
We believe a key aspect of our textbook and uniform models are the underlying school, parent and student relationships we build with each new partner school. During fiscal 2006, we met the textbook or uniform needs of over 700 schools. Approximately 90% of our textbook accounts are currently private elementary and secondary schools and virtually all of our uniform accounts are currently private elementary and secondary schools.
During our second quarter of fiscal 2006, we again focused on increasing our used textbook inventory by expanding our on-campus textbook buyback program. Through these buyback events, we provide our partner school parents and students the option of selling back to us at the end of the current school year textbooks that our partner schools are adopting for use during the approaching school year. This increases the overall number of used textbooks available to our partner schools throughout the school year, lowers the total cost of textbook ownership for parents and students and provides customers more purchasing options. During fiscal 2006, approximately 16% of our textbook revenue was from used books.
Our overall success and ability to maintain and increase profitability from operations will depend, in part, upon our ability to retain our current customers, attract additional schools to our programs, provide a compelling and satisfying shopping experience to our retail customers, and manage our relationship with our primary fulfillment partner, Baker and Taylor, Inc. (“B&T”), a leading distributor of books, videos and music products.
Substantially all of our computer and communications hardware and software systems are located at a single facility that is owned, maintained and serviced by a third party. Any damage, failure or delay that causes interruptions in our systems operations could materially harm our business.
Varsity Group Inc. was founded in 1997. We are a Delaware corporation with our principal executive offices located at 1300 19th Street, NW, Suite 800, Washington, D.C. 20036, and our telephone number is (202) 667-3400.
We provide website access to our periodic and current SEC filings and press releases, free of charge, on our website located athttp://www.varsitygroup.com as soon as reasonably practicable after the materials are filed with the SEC or otherwise made public.
MARKET OVERVIEW
Textbook Market
The retail textbook market is presently dominated by on-campus bookstores at all educational levels, with most educational institutions either operating their own physical bookstore or contracting these services to a third party. However, both selling and purchasing new textbooks through traditional retail outlets can be expensive and inconvenient. Each year students and parents often face the prospects of long lines, inconvenient bookstore hours of operation and out-of-stock inventory problems causing delays and necessitating multiple trips to the bookstore.
Educational institutions also face many challenges associated with operating an efficient and profitable retail bookstore on campus. These challenges are exacerbated at smaller schools where operating economies of scale are not present and profitability and high customer service levels are more difficult to achieve or sustain. This is particularly true at the private middle and high school market, where there is typically only one major textbook buying season (Fall back-to-school) and supplemental clothing, school supplies and electronic product sales are limited or non-existent as a means to increase store profitability and smooth operational peaks.
Online commerce provides the opportunity to offer the college and private middle and high school student markets a more convenient and efficient alternative to the traditional brick-and-mortar bookstore model. Each year, the number of schools purchasing their books online continues to grow, some augmenting their current bookstore operations rather than replacing them.
Private Elementary and Secondary Education
The private school market represents approximately 25% of all elementary and secondary schools and 10% of all elementary and secondary students, according to the National Center of Education Statistics (NCES). There are approximately 6.4 million students enrolled in over 30,000 private elementary and secondary schools nationwide. Approximately 5.0 million students are in elementary level schools and approximately 1.4 million students are in secondary level schools. Almost half of all private school students attend schools that are located in urban areas. According to the Council on American Private Education, private secondary school enrollment is expected to increase as much as 6% between 2001 and 2013.
Based upon market research conducted by us, we believe there are at least 5,000 private middle and high schools nationwide that present an immediate fit with the strengths and benefits of our eduPartners model. Factors we considered in our research include school policy requiring students to purchase their own textbooks, school enrollment and the extent of state subsidy of textbooks for private school students. We believe approximately 750 schools in this segment had adopted an online textbook solution similar to our eduPartners model by the start of the 2006 back-to-school selling season. Of the estimated 750 schools served by
4
an online textbook solution during the 2006 back-to-school selling season, approximately 375, or 50%, of those were served by our eduPartners program.
Higher Education
The college student market is large and growing. The National Association of College Stores reports that there are approximately 16.7 million undergraduate and graduate students at more than 4,250 colleges and universities in the United States. According to the NCES, college enrollment will increase to approximately 17 million students by 2008.
While the primary source of school growth within eduPartners has been the private middle and high school market to date, many higher education institutions share the same operational and financial challenges which make eduPartners such a compelling outsource solution to the elementary and secondary education market. In particular, smaller institutions struggle to deliver the budget, available retail space and operating economies of scale necessary to support a profitable bookstore operation. Forty nine percent of higher education institutions have enrollments below 1,000 students, and just 12% have enrollments higher than 10,000 students, according to the National Association of College Stores.
Although the college market is large and diverse, students still have common needs. For instance, students typically must buy expensive school-related goods and services such as textbooks and school supplies. In fact, textbooks are most students’ single largest school related expenditure after tuition, room and board. The College Board reports that the average per student expense for books and supplies during 2004-2005 was $843 to $870. Overall textbook and course material sales were approximately $11.2 billion, up from $10.8 billion in the academic year 2003-2004, based on statistics published by the National Association of College Stores.
School Uniform Market
According to the NPD Group, Inc. the broader domestic retail school uniform market represents an annual $1.0 billion opportunity. In a survey conducted to over 21,000 households, over 17% of children wear uniforms to school. However, this includes the “dress code” segment often associated with public school dress policies, which, for example, may simply require students to wear a generic white dress shirt and khaki pants, which can be purchased at most apparel retailers. Over $835 million of school uniforms were purchased in 2006, five percent of the total apparel market for children age five to fourteen and an increase of 3% since 2000.
NPD reports that most schools do not include the cost of school uniforms in tuition and parents spend an average of $162 on school uniforms a year with 12% of these purchases taking place online. Our uniform solution is currently focused on an attractive sub-segment of the school uniform market serving private K-12 schools that have mandatory, branded school requirements served through exclusive retailer relationships. These products are a required purchase of every student and typically feature a school logo or other branding element on one or multiple uniform components.
STRATEGY
Build a Significant and Profitable School Outsourcing Business.
During the last five years we believe that we have taken the steps necessary to create a profitable and scalable online book business with significant growth potential. In recent years, we have aggressively grown our revenues and our network of partner schools while maintaining strong margins and containing marketing, sales and overhead expenses. We believe, over time, expansion of our used book offering may allow for the expansion of product margins while delivering to our customers a more compelling, cost effective textbook solution. At the same time, the addition of our school uniform business with higher average gross margins than that of the book business may allow us to grow both revenue and overall gross margins.
Beginning in the second quarter of 2006, we moved aggressively to launch service offerings outside our core book and uniform offerings. Significant costs were incurred in this effort. In November 2006, due to the financial impact of cost increases together with limited new revenue generation from non-book/uniform service offerings, efforts to launch service offerings outside the book and uniform areas were terminated or suspended. Significant cost reductions have been implemented, and our current strategy includes only the book, uniform and school supplies businesses.
Increase the Position of Our Textbook Solution Serving Private Middle and High Schools.
We will look to extend our current position in the private middle and high school marketplace and extend our sales effort significantly beyond our initial target market of 3,000 schools and much deeper into the full universe of over 29,000 private elementary and secondary schools nationwide.
Our textbook program was the first online bookstore solution focused on meeting the needs of private middle and high schools. We have partner schools located in most key markets nationwide and are aggressively targeting remaining areas to establish a
5
comprehensive nationwide network of member schools. We have extended our presence in new markets by leveraging the positive experience and word-of-mouth generated once our initial account in that market has completed a successful back-to-school selling season.
Expand the Presence of our Textbook Solution in Higher Education and Continuing Education Markets.
Concurrent to our anticipated growth in the private elementary and secondary school market, we will commit the appropriate resources to attempt to accelerate our growth in the higher education and distance learning markets. We believe the textbook model offers a compelling value proposition to these target markets and are focused on building our network of schools in this segment.
Expand Apparel Solution To More Markets Nationwide and Expand Product Offering.
We plan to expand our network of uniform school relationships by increasing the number of schools in markets currently served by our nine retail locations and entering new markets nationwide by leveraging the Varsity brand and school relationships developed through our textbook solutions in those markets We will also continue to explore opportunities to expand the scope of products and services we provide through our apparel business, including non-uniform branded or promotional school apparel, team or affinity group apparel and corporate branded apparel.
Identify New Product or Service Offerings To Enhance Current Solutions or Broaden School Relationships.
We will continue to explore opportunities to cost-effectively expand the scope of products and services we provide our partner schools and will pursue opportunities which we believe will enable us to introduce new, profitable revenue streams or strengthen the underlying school and end customer related assets we have forged through our textbook and uniform solutions
THE VARSITY TEXTBOOK SOLUTION
We provide students, parents and schools with a reliable and convenient alternative to the traditional campus bookstore model. We are able to reduce the overhead associated with textbook sales because we typically do not maintain individual stores and are able to consolidate our ordering, inventory, warehousing and fulfillment needs through our relationship with B&T. In addition to providing textbooks at competitive prices, we are committed to providing best-in-class customer service, dedicated account management, and customized websites for each partner school and rapid shipment of orders.
Through our textbook program, we provide an opportunity for educational institutions to maximize their resources and offer increased convenience to their students by outsourcing textbook sales to us. We believe that for many schools the expense and inconvenience of maintaining a physical retail bookstore on campus exceeds the school’s financial return. We provide an innovative solution for schools and enable them to offer increased convenience and value to students, their parents, and the entire school community. Our program has been designed to meet the needs of these schools by offering a number of compelling program features, including:
| | • | | Dedicated Account Managers to serve schools; |
| | • | | Customized online bookstores featuring detailed course and book information; |
| | • | | Communications and training materials for each school community; |
| | • | | Innovative website program management tools providing school administrators access to sales and inventory reports; |
| | • | | Convenience and simplicity of a user-friendly online shopping experience; |
| | • | | Flexibility to purchase books for the upcoming semester/year from anywhere, anytime; |
| | • | | Toll-free ordering options and superior customer service; |
| | • | | Online adoption tools for textbook adoption programs; |
| | • | | Used textbook buyback programs, – both online and on-campus; and |
| | • | | Textbook teacher editions. |
Through these relationships, we are endorsed as the exclusive textbook retailer at our eduPartners schools and gain direct access to their students.
Our exclusive relationships generally are for a period of one to four years and typically automatically renew on a year-to-year basis. As of March 2007 a majority of our program agreements associated with schools served during our 2006 back-to-school season have either been renewed or terminated. These agreements typically automatically renew for one year if neither party serves notice of intent to terminate 90 days prior to the date of expiration. We expect our revenue retention rate for fiscal 2007 to be approximately 85% of total fiscal 2006 revenues. This figure is similar to historical revenue retention rates, which have approximated 90% or more year over year
With our textbook program, we create a personalized virtual bookstore for each school on our website. Students are able to search by region and state on our homepage to locate the link to their co-branded bookstore. Parents and students can be linked
6
directly to their school bookstore page from their school’s homepage. Once they reach the entry page to their customized online bookstore, the student or parent can navigate the site by clicking on the appropriate grade, discipline and class to select required and optional books. The school benefits by eliminating the operational and financial burdens associated with the physical operation of a highly seasonal retail bookstore on campus. In addition, schools have access to our unique program administration website that provides them with sales and inventory reports, among other valuable features.
User Experience
Our eCommerce website, www.varsitybooks.com, offers several benefits to customers including convenience, ease of use and depth of product selection. When logging on to our website, visitors are presented with several shopping options, including:
| | • | | Searching by School. Students at our partner schools can use our customized map to locate their school. Once they find their school they can link through a list of subjects to a list of classes and to the specific booklists for the courses they are taking. Our customers have the option of placing all the textbooks for a particular class in their shopping cart with a single click or selecting only those titles that interest them. |
| | • | | Searching for Books. If we have not posted a specific school’s booklist, our customers can search for the books they need by author, title, keyword, publisher or ISBN. Our website offers additional book verification for many selections, including pictures of jacket art, editor’s name, volume number and other identifying characteristics. |
Ordering and Delivery
When our customers are ready to place an order, they can proceed through our shopping cart function directly to our checkout page. Orders can be placed online through our website or via our toll-free telephone number where customer service agents are available to take orders from customers that do not have access to the Internet or are uncomfortable placing an order online. We presently accept major credit cards, money orders and personal checks as payment for our products. For our partner schools, we also offer school and student credit accounts.
Once a customer places an order, he or she immediately receives an e-mail that includes a unique order number and confirms that the order has been received and processed. If a book is not in stock at the time an order is processed, that title is automatically placed on backorder and shipped to the customer as soon as it returns to stock. Customers are not charged for any book until it has been shipped. After an order is shipped, the customer receives a second e-mail that includes a parcel tracking number, a description of titles shipped and placed on backorder, the amount charged to their credit card for this shipment and a link to a page on our website where they can follow their order through the delivery process. We use a variety of shipping services to offer our customers a selection of delivery options to ensure their orders are received in timely manner.
Customer Service
We are committed to delivering superior customer service to all of our customers, including our partner schools, parents and students. We offer extended customer service hours and increase our staffing levels during the busy back-to-school season, providing our customers convenient toll-free access to our customer service representatives and fast response to their queries. The customer service page of our website offers answers to frequently asked questions and enables our customers to ask their own questions through e-mail. We also have a toll-free customer service telephone number.
Fulfillment
B&T, a leading distributor of books, videos and music products, has provided our order fulfillment and drop shipment services since our inception. We have a series of agreements relating to the operating and financial terms of our relationship, which were recently renewed and are now scheduled to expire in June 2008.
Under these agreements, we agree to provide B&T with our written demand forecasts for each upcoming year and we agree to use B&T as our principal supplier of textbooks and exclusive provider of drop-ship and fulfillment services. We pay fees and expenses related to the services B&T provides and we purchase products from B&T at a discount to the suggested price. In return, B&T agrees not to provide drop-ship services to any person or entity that has as its principal business activity the goal of establishing exclusive relationships with educational institutions for the purpose of selling textbooks via the Internet, unless the retailer was an existing customer of B&T on or prior to June 10, 1998, the date we initially contracted with B&T. Our agreements with B&T provide us access to, and use of, an electronic set of data elements from B&T’s title file database that contains bibliographic records. In addition, under these agreements, B&T provides us with promotional, customer service, and database management services.
As a result of the data access our agreements provide, information on availability of book titles is automatically updated on our website on an hourly basis based on title and inventory data feeds from B&T, ensuring that our customers receive accurate in-stock inventory information. Orders placed on our website are automatically transmitted to B&T within twenty minutes of their receipt. At the B&T warehouses currently used for fulfillment, the order is processed, packaged and shipped directly to our
7
customers. We extend a convenient return policy to our customers under which returns are shipped directly to B&T to expedite processing. Finally, providing B&T with our demand forecasts for each semester helps to ensure they maintain an adequate and relevant inventory to meet the demands of our customers.
Technology
We use an array of site management, search, customer interaction, transaction-processing and fulfillment services and systems using a combination of proprietary technologies and commercially available, licensed technologies.
Our technology environment is designed to provide:
| | • | | a satisfying customer experience; |
| | • | | consistent system availability and good performance; |
| | • | | appropriate security for all transactions, particularly, our customers’ commerce transactions; |
| | • | | scalability for continued growth; and |
| | • | | the collection, maintenance and security of valuable information. |
On July 10, 2006, we entered into a Services and Management Agreement with SchoolOne.com LLC in which SchoolOne develops the Company’s new technology and provides services and support for the Company’s processes and systems.
We currently use a Microsoft Windows operating system platform on multiple servers that house our web and back office applications. These servers handle applications including accepting and validating customer orders, handling multiple shipment methods and accepting, authorizing and charging customer credit cards. In addition, our system maintains ongoing automated e-mail and EDI communications with customers and vendors throughout the ordering and fulfillment process. These systems entirely automate many routine communications, facilitate management of customer inquiries and allow customers to, on a self-service basis, check order and tracking information. We manage user requests and other traffic-using load balancing devices in front of our outwardly facing hardware. This strategy of balancing traffic allows all customers and site users to enjoy favorable response times and other performance measures, regardless of traffic fluctuations.
Substantially all of our computer and communications hardware and software systems associated with the operation of our website are located at a single secure located in Cleveland, Ohio, which hosts our server environment and acts as our Internet service provider A disruption in this Internet service could cause a disruption in our ability to service our clients.
We use the Microsoft suite of tools for our development environment, including Microsoft Visual Studio, Microsoft BizTalk and .Net editions with SQL Server for relational database management. Additionally, we have separate database servers that capture and retain transaction “logs” of all activity that occurs on the site. These log databases can, among other things, trace a transaction from its inception to its completion. Our databases generate and deliver reports and interfaces for our marketing, operations and financial systems.
We employ SSL data encryption technology to protect credit card data while it is passed from the customer through the site during a purchase transaction. This is designed to prevent outside parties from intercepting the customer’s credit card data during transaction processing.
Textbook Competition
Online commerce, in general, and online textbooks sales, more specifically, are highly competitive markets. The number of e-commerce websites competing for customers’ attention has increased rapidly in the past two fiscal years, and the market for online textbook sales is relatively new, competitive and evolving. We currently or potentially compete, directly and indirectly, for retail customers with the following categories of companies:
| | • | | traditional new and used textbook retailers, such as campus bookstores; |
| | • | | traditional used textbook retailers, some of which have begun online selling; |
| | • | | textbook retailers and distributors such as the Follett Corporation, MBS Textbook Exchange, Nebraska Book Company, eCampus and Adams Book Company; and |
| | • | | Internet-based booksellers such as Amazon.com, Wal-Mart.com and BarnesandNoble.com. |
THE VARSITY UNIFORM SOLUTION
8
Our uniform solution is currently focused on private K-12 schools that have mandatory, exclusive products. These are products that must be purchased by every student and feature a school logo or other branding on one or multiple uniform components. The typical target school has a specific customized uniform requirement, not the broader “dress code” policies that, for example, may simply require students to wear a generic white dress shirt and khaki pants which can be purchased at any apparel retailer.
Ordering and Delivery
Similar to our eduPartners textbook solution, our uniform solution forges exclusive relationships with schools to provide school logo embroidered uniforms to their students and families. We deliver our uniform solution to our school, parent and student customers through a number of retail channels:
| | • | | Retail Stores - Our primary sales channel has been through nine retail stores operated by us in College Park, Maryland, Rockville, Maryland, Fairfax, Virginia, Raleigh, North Carolina, Buffalo, New York, Southfield, Michigan, Richardson, Texas, Cincinnati, Ohio, and Indianapolis, Indiana. We offer convenient hours of operation throughout the year with extended operating hours during the busy back-to-school shopping season in August and September each year. Uniform inventory is held on-site at each store and parents and students are able to purchase and take home all necessary uniform components the same day. This is currently our primary retail channel through which the majority of our revenues are recorded. |
| | • | | On Site Sales -As a further convenience to our uniform customers, we travel to eligible schools in select markets and conduct on-campus sales events during which families can purchase on-site at their school and take home all necessary uniform components the same day. During 2007 we plan to conduct approximately 70 on-site uniform sales events. |
| | • | | Online Purchases -Parents and students always have the ability to shop online through customized virtual stores which are created onwww.campusoutfitters.com for each partner school containing all required uniform components. Orders placed online are typically picked, packed and shipped to the customer within 1-2 business days from our uniform headquarters and warehouse located in College Park, Maryland. |
Customer Service
We are committed to delivering superior customer service to all of our customers, including our partner schools, parents and students. We offer extended customer service hours and increase our staffing levels during the busy back-to-school season, providing our customers convenient toll-free access to our customer service representatives and fast response to their queries. The customer service page of our website offers answers to frequently asked questions including uniform care tips, sizing charts and store locations and policies. Customers can also submit questions via e-mail. Also, our teams of dedicated school account managers provide a single point of contact for each school, expediting planning and problem resolution for school management.
Technology
We use an array of site management, search, customer interaction, transaction-processing and fulfillment services and systems using a combination of proprietary technologies and commercially available, licensed technologies. We migrated to a new retail point-of-sale and inventory management application during 2006. This licensed solution operates on a Microsoft Windows operating system platform with database storage at a store and enterprise level. We also transitioned our uniform website to an integrated application with our new point-of-sale and inventory management system.
Uniform Competition
The sale of school uniforms is a mature, highly fragmented and competitive market. Our uniform solution is currently focused on the sale of mandatory, school required uniform and related apparel products. All students at partner schools are typically required to purchase school approved uniform components, some of which may feature a school logo or other branding element on the garment. This target segment differs from the broader “dress code” uniform policies, for example, may simply require students to wear a generic white dress shirt and khaki pants, which can be purchased at any apparel retailer.
While competitors in the broader “dress code” environment include large traditional national apparel retailers like Target and Wal-Mart, the overwhelming majority of companies competing in the customized school uniform segment that we are focused on are private, family-run businesses. We currently or potentially compete, directly and indirectly, for retail customers with the following categories of companies:
| | • | | regional school uniform retailers, such as Dennis Uniforms, Parker School Uniforms and Flynn & O-Hara; |
| | • | | small, single market school uniform retailers; |
| | • | | traditional chain store apparel retailers such as Target, Wal-Mart and The Gap; and |
| | • | | online apparel and branded apparel retailers such as Land’s End. |
9
INTELLECTUAL PROPERTY
We regard our trademarks, service marks, trade dress, copyrights, trade secrets, proprietary technology and similar intellectual property as important to our success. We rely on trademark and copyright law, trade secret protection and confidentiality and license agreements with our employees, customers, independent contractors, sponsors and others to protect our proprietary rights.
We may be required to obtain licenses from others to refine, develop, market and deliver new products and services. There can be no assurance that we will be able to obtain any such license on commercially reasonable terms or at all, or that rights granted pursuant to any licenses will be valid and enforceable.
Domain names are the user’s Internet “address.” Domain names have been the subject of significant trademark litigation in the United States. Domain names derive value from the individual’s ability to remember such names, therefore there can be no assurance that our domain name will not lose its value if, for example, users begin to rely on mechanisms other than domain names to access online resources.
GOVERNMENT REGULATION
Internet Regulation
There are an increasing number of laws and regulations pertaining to the Internet. Laws or regulations may be adopted relating to issues such as to liability for information retrieved from or transmitted over the Internet, online content regulation, user privacy, taxation and quality of products and services. Moreover, it may take years to determine whether and how existing laws such as those governing intellectual property ownership and infringement, privacy, libel, copyright, trade mark, trade secret, obscenity, personal privacy, taxation and the regulation of the sale of other specified goods and services apply to the Internet. The requirement that we comply with any new legislation or regulation, or any unanticipated application or interpretation of existing laws, may decrease the growth in the use of the Internet, which could in turn decrease the demand for our Internet-based services, increase our cost of doing business or otherwise materially harm our business.
Privacy Concerns
Federal, state and foreign governments have enacted or may enact laws or consider regulations regarding the collection and use of personal identifying information obtained from individuals when accessing websites, with particular emphasis on access by minors. Such regulations may include requirements that companies establish procedures to:
| | • | | give adequate notice to consumers regarding information collection and disclosure practices; |
| | • | | provide consumers with the ability to have personal identifying information deleted from a company’s data; |
| | • | | provide consumers with access to their personal information and with the ability to rectify inaccurate information; |
| | • | | clearly identify affiliations or a lack thereof with third parties that may collect information or sponsor activities on a company’s website; and |
| | • | | obtain express parental consent prior to collecting and using personal identifying information obtained from children. |
Such regulation may also include enforcement and redress provisions. While we have implemented programs designed to enhance the protection of the privacy of our users, including children, there can be no assurance that such programs will conform to applicable laws or regulations. Moreover, even in the absence of such regulations, the Federal Trade Commission has begun investigations into the privacy practices of companies that collect information on the Internet. One such investigation has resulted in a consent decree pursuant to which an Internet company agreed to establish programs to implement the privacy safeguards described above.
It is also possible that “cookies” may become subject to laws limiting or prohibiting their use. The term “cookies” refers to information keyed to a specific server, file pathway or directory location that is stored on a user’s hard drive, possibly without the user’s knowledge, and which is used to, among other things, track demographic information and to target advertising. Some of the currently available Internet browsers allow users to modify their browser settings to remove cookies or prevent cookies from being stored on their hard drives.
We currently obtain and retain personal information about our website users with their consent. We have a stringent privacy policy covering this information. However, if third persons were able to penetrate our network security and gain access to, or otherwise misappropriate, our users’ personal information, we could be subject to liability. Such liability could include claims for misuses of personal information, such as for unauthorized marketing purposes or unauthorized use of credit cards. These claims could result in litigation, our involvement in which, regardless of the outcome, could require us to expend significant financial resources.
10
Internet Taxation
A number of legislative proposals have been made at the federal, state and local levels, and by foreign governments, that would impose additional taxes on the sale of goods and services over the Internet and some states have taken measures to tax Internet-related activities. Although Congress has placed a moratorium on state and local taxes on Internet access or on discriminatory taxes on e-commerce, existing state or local laws have been expressly excepted from this moratorium. Further, once this moratorium is lifted, some type of federal or state taxes may be imposed upon Internet commerce. Such legislation or other attempts at regulating commerce over the Internet may substantially impair the growth or increase the cost of commerce on the Internet and, as a result, adversely affect our opportunity to derive financial benefit from such activities.
Jurisdiction
Due to the global reach of the Internet, it is possible that, although our transmissions over the Internet originate primarily in the State of Ohio, the governments of other states and foreign countries might attempt to regulate Internet activity and our transmissions or take action against us for violations of their laws.
EMPLOYEES
As of March 13, 2007, we had 62 full time and 16 year round part-time employees. In addition, we hire seasonal temporary employees, generally at the beginning of the Fall school semester to support our customer service efforts, and contract service providers, generally during our inventory buyback program, as necessary. None of our employees are represented by a labor union or are the subject of a collective bargaining agreement. We believe that relations with our employees are good.
In addition to the other information in this Form 10-K, the following factors should be considered in evaluating our business and our Company. The risks and uncertainties described in this section are not the only ones facing us. Additional risks and uncertainties that we do not presently know or that we currently deem immaterial, may also impair our business, operating performance and financial condition.
WE HAVE A LIMITED OPERATING HISTORY UPON WHICH TO EVALUATE AN INVESTMENT IN OUR COMPANY.
We were founded in December 1997 and began selling textbooks on our website in August 1998. In May 2005, we acquired privately held Campus Outfitters, L.L.C. (“Campus Outfitters,”) a retailer of private elementary, middle and high school uniforms, which was founded in 1997 and began selling school uniforms in 1998. As a relatively new company, we face significant risks and uncertainties relating to our ability to successfully implement our strategy. If we are unable to grow as planned, our chances of maintaining profitability and the anticipated or forecasted results of operations could be reduced. You must consider the risks and uncertainties that a company with a limited operating history like ours faces. If we are unsuccessful in addressing these risks and uncertainties or are unable to execute our strategy, our business could be harmed which, in turn, could have a material adverse effect on the market price of our stock.
WE MUST CONTINUE TO CONVERT SCHOOLS TO OUR SCHOOL PROGRAMS AND RETAIN THEM IN THE PROGRAMS.
To be successful, we must attract and retain a significant number of schools to our eduPartner and Campus Outfitter school programs. Ultimately, we must attract the students and parents from each eduPartner and Campus Outfitter school to our website or retail stores at a reasonable cost. Any significant shortfall in the expected number of purchases occurring through our website or retail stores may negatively affect our financial results. Conversion of schools from traditional on campus bookstore operations to our online textbook and retail uniform outsource solutions may not occur as rapidly as we expect. Therefore, we may not achieve the customer traffic we believe is necessary to sustain the growth and profitability of our enterprise. Specific factors that could prevent widespread customer acceptance of our business and our ability to increase retail revenues include:
| | • | | lack of awareness of our eduPartner and Campus Outfitter school programs; |
| | • | | pricing that does not meet consumer expectations; |
| | • | | consumer concerns about the security of online transactions; |
| | • | | shipping charges, which do not apply to shopping at traditional retail stores and are not always charged by some of our online competitors; |
| | • | | the delivery time associated with online orders, as compared to the immediate receipt of products at traditional retail stores; |
| | • | | product damage from shipping or shipments of the wrong products, which may result in a failure to establish trust in purchasing our products online; |
| | • | | delays in responses to consumer inquiries or in deliveries to consumers; and |
11
| | • | | difficulty in returning or exchanging orders. |
Based on these or other factors, we may not be able to retain existing eduPartners or Campus Outfitter member schools or sign-up new eduPartners or Campus Outfitter member schools.
WE PRIMARILY RELY ON ONE SUPPLIER TO MEET OUR TEXTBOOK FULFILLMENT NEEDS.
We depend on B&T as our primary supplier of the textbooks that we offer. Our relationship with B&T is critical to our success. Our current contract with B&T expires on June 30, 2008. If we are unable to renew this contract when it expires, or are unable to otherwise rely on B&T for inventory maintenance and shipping services and we are unable to open our own distribution center or establish a comparable vendor relationship before the B&T relationship discontinues, our business may be materially harmed.
B&T warehouses most of our textbook inventory and we rely on them to maintain adequate inventory levels and rapidly fill our customers’ orders. Prices we pay for promotional, customer service and database management services and credits that we receive from B&T are currently based on volume and average cost requirements. Failure to meet these benchmarks would increase our costs. If they do not maintain sufficient inventory, or if they are unable to deliver the specific books our customers order or deliver these books in a timely fashion, we would not be able to meet our obligations to our customers, our revenues would decrease and we would likely experience a reduction in the value of our brand. If our relationship with B&T is disrupted or does not continue for any reason and we are unable to establish a comparable vendor relationship or open our own warehouse before the B&T relationship discontinues, we would not be able to fulfill our customers’ textbook orders. We cannot be certain that we would be able to establish new vendor relationships to ensure acquisition and distribution of textbooks in a timely and efficient manner or on acceptable commercial terms. In such event, we may determine that we need to maintain inventory, establish warehouse facilities and provide distribution services, which would require us to change our business model.
In addition, we estimate that a single publisher represented approximately 18% of our textbook revenues in 2006. If B&T’s relationship with this publisher is disrupted or discontinued, our business may be harmed.
We benefit from the shipping discounts offered to B&T by UPS and we rely on UPS and other third party common carriers for all shipments to and from B&T. If B&T’s relationship with UPS is discontinued or disrupted for any reason, we cannot be certain we would be able to affordably obtain comparable delivery services and might not be able to deliver textbooks to our customers in a timely manner. In addition, because we rely on third party common carriers to ship products to and from the B&T warehouses that our fulfillment is currently conducted from, we are subject to the risks, including employee strikes and inclement weather, that may prevent such third parties from meeting our fulfillment and delivery needs. Failure to deliver products to our customers in a timely and accurate manner may harm our reputation, our brand and our business.
WE FACE SIGNIFICANT COMPETITION IN THE ONLINE TEXTBOOK MARKETS AND THAT COMPETITION MAY INCREASE SUBSTANTIALLY BECAUSE OF THE LOW BARRIERS TO MARKET ENTRY.
The e-commerce and online textbook markets are new, rapidly evolving and intensely competitive. We expect competition to intensify in the future. Barriers to entry in the e-commerce industry are minimal, and current and new competitors can launch new websites quickly and at a relatively low cost. In addition, new and expanded Internet technologies, including search and web services, may further increase competition in the online textbook and e-commerce industries. We currently compete with a variety of other companies in the sale of textbooks, and if we are able to add other online product or service offerings we will have additional competition in those markets. Our current and potential competition in the textbook market includes the following categories of companies:
| | • | | traditional new and used textbook retailers, such as campus bookstores; |
| | • | | traditional used textbook retailers, some of which have begun online selling; |
| | • | | textbook retailers and distributors such as the Follett Corporation, MBS Textbook Exchange, Nebraska Book Company, eCampus and Adams Book Company; and |
| | • | | Internet-based booksellers such as Amazon.com, Wal-Mart.com and BarnesandNoble.com |
We are not able to reliably estimate the number of our direct competitors. To date, our most active competitor targeting the private middle and high school textbook market with an online bookstore program is MBS Textbook Exchange. Many of our current and potential competitors have longer general retail operating histories, larger customer bases, greater brand recognition and significantly greater financial, marketing, technological, operational and other resources than we do. Some of our competitors may be able to secure textbooks from vendors on more favorable terms, devote greater resources to marketing and promotional campaigns, adopt more aggressive pricing, shipping policies or inventory availability policies and devote substantially more resources to website and systems development than we can. As competition increases, we may experience reduced operating margins from pricing pressure or higher customer acquisition and retention costs, loss of market share and a diminished brand franchise.
12
To remain competitive, we may from time to time make pricing, service or marketing decisions or acquisitions that could negatively affect our financial condition and results of operations. It is possible that our supply channel (distributors and, indirectly, publishers) may enter the market and match our pricing through direct retail centers. Either or both of our supply channel or traditional operators of school bookstores may enter the online commerce market as our competitors.
As Internet use becomes increasingly prevalent, it is possible that the full text of books we offer for sale will be available for viewing on the web or on other electronic devices such as virtual textbooks. If virtual textbooks become a reality and students rely on them in lieu of purchasing hard copies of textbooks, our business may decline.
WE RELY ON OUR RELATIONSHIPS WITH VENDORS TO PURCHASE UNIFORM AND APPAREL MERCHANDISE AT FAVORABLE PRICES. IF THESE RELATIONSHIPS WERE TO BE IMPAIRED, WE MAY NOT BE ABLE TO OBTAIN A SUFFICIENT SELECTION OF MERCHANDISE AT ATTRACTIVE PRICES, WHICH COULD HAVE A NEGATIVE IMPACT ON OUR COMPETITIVE POSITION, OUR BUSINESS AND FINANCIAL PERFORMANCE.
We do not have long-term supply agreements or exclusive arrangements with any of our uniform and apparel vendors and, therefore, our success in the school uniform retail market depends on maintaining good relations with them. Since our business is fundamentally dependent on selling merchandise at attractive prices, we must continue to obtain from our vendors a wide selection of this merchandise at favorable wholesale prices. Our growth strategy depends to a significant extent on the willingness and ability of our vendors to supply us with sufficient inventory to stock our stores. If we fail to continue to deepen and strengthen our relations with our existing vendors to improve the quality of merchandise they supply us we may limit our ability to obtain a sufficient amount and variety of merchandise at favorable prices, which could have a negative impact on our competitive position.
WE PRIMARILY RELY ON ONE MANUFACTURER FOR CERTAIN MATERIALS REQUIRED BY SOME OF OUR CAMPUS OUTFITTER SCHOOLS.
Some of our Campus Outfitter program schools require uniforms with specific fabric and design requirements. We believe that suitable materials for these school uniforms could be obtained from other manufacturers in the event that our regular supplier (because of financial difficulties or otherwise) is unable or fail to provide them. However, there could be a significant production delay or disruption caused by the inability of the current supplier to deliver these materials which would make it difficult to identify and utilize alternative suppliers quickly, which in turn could have a material adverse impact on our results of operations. If we did experience any such delays or interruptions, there is no assurance that we would be able to find adequate alternative suppliers at a reasonable cost or without significant disruption to our business.
WE MAY VIOLATE FINANCIAL COVENANTS UNDER OUR CREDIT FACILITY, WHICH COULD HAVE A MATERIAL ADVERSE EFFECT ON OUR LIQUIDITY AND FINANCIAL CONDITION.
On March 8, 2007, the Company entered into a Revolving Line of Credit Loan Agreement (“Loan Agreement” and Security Agreement with Bank of America, N.A. (“BOA”). If our financial performance results in a violation of financial covenants under our Loan Agreement in future periods, BOA retains the right, among others, to unilaterally alter or eliminate the extension of financing under the agreement, which could have a material adverse effect on our liquidity and financial condition. Please see Note 19.
WE EXPERIENCED A SIGNIFICANT LOSS IN FISCAL 2006 DUE TO EXPENDITURES RELATED TO THE LAUNCH OF NEW SERVICE OFFERINGS AND LOSSES MAY CONTINUE IN 2007.
Beginning in the second quarter of 2006, we moved aggressively to launch service offerings outside our core book and uniform offerings. Significant costs were incurred in this effort. In November 2006, due to the financial impact of cost increases together with limited new revenue generation from non-book/uniform service offerings, efforts to launch service offerings outside the book and uniform areas were terminated or suspended. Significant cost reductions have been implemented and our current strategy includes only the book, uniform and school supplies businesses, however, with management turnover and a significantly smaller management and employee workforce, the 2007 financial impact of these actions are uncertain.
WE HAVE REDUCED OUR WORKFORCE AS PART OF OUR RECENT COST REDUCTION INITIATIVES. IF WE FAIL TO FIELD AND RETAIN A QUALIFIED WORKFORCE, OUR OPERATING PERFORMANCE AND FINANCIAL CONDITION COULD BE MATERIALLY ADVERSELY AFFECTED.
13
We believe that our success depends on our ability to motivate and retain highly skilled personnel. Competition for skilled personnel can be intense, and there can be no assurance that we will be successful in attracting, motivating and retaining the personnel required to improve our financial performance and grow. In addition, the cost of hiring and retaining skilled employees is high. Failure to attract and retain highly skilled personnel could materially and adversely affect our business.
Our recent cost reduction initiative may yield unintended consequences, such as attrition beyond our planned reduction in workforce, reduced employee morale and decreased productivity. In addition, the recent trading levels of our stock have decreased the value of our stock options granted to employees under our stock option plans. As a result of these factors, our remaining personnel may seek alternate employment, such as with larger, more established companies or companies that they perceive as having less volatile stock prices or better prospects. Continuity of personnel is a very important factor in sales and implementation of our software and our product development efforts. Attrition beyond our planned reduction in workforce or a material decrease in employee morale or productivity could have a material adverse effect on our operating performance and financial condition.
YOU SHOULD NOT RELY ON OUR QUARTERLY OPERATING RESULTS AS AN INDICATION OF OUR FUTURE RESULTS BECAUSE THEY ARE SUBJECT TO SIGNIFICANT FLUCTUATIONS.
Our quarterly operating results may fluctuate significantly in the future due to a variety of factors that could affect our revenues or our expenses in any particular quarter. We expect to continue to experience significant seasonality in our business related to the academic calendar and the corresponding demand for textbooks, uniforms and educational materials. Due to the concentration of private middle and high schools in our eduPartners and Campus Outfitters school programs, our revenues are concentrated in the traditional Fall back-to-school season of July, August and September, our third calendar quarter. During the third quarter of 2006, 2005, and 2004, our revenues were approximately 88%, 86%, and 85% of total annual revenues, respectively. We expect this trend to continue. Fluctuations in our quarterly operating results could cause our stock price to decline. You should not rely on sequential quarter-to-quarter comparisons of our results of operations as an indication of future performance. Factors that may affect our quarterly results include:
| | • | | seasonal trends in the textbook and school uniform industry and in the buying habits of students; |
| | • | | concentration of private middle and high schools in our eduPartners and Campus Outfitters school programs; |
| | • | | our ability to manage or influence inventory and fulfillment operations; |
| | • | | the level of merchandise returns we experience; |
| | • | | our ability to attract new customers, retain existing customers, maintain customer satisfaction and respond to our competitors; |
| | • | | introduction of enhancements or a change in pricing policies, by us or our competitors, or a change in pricing policy by our fulfillment sources in either the textbook or school uniform industries; |
| | • | | changes in the amount and timing of expenditures related to marketing, information technology and other operating expenses to support future growth; |
| | • | | technical difficulties or system downtime affecting the Internet generally or the operation of our website specifically; |
| | • | | potential acquisitions or strategic alliances either by us or our competitors; |
| | • | | general economic conditions, economic conditions specific to the Internet, eCommerce or the textbook and uniform industries; and |
| | • | | our ability to adequately staff our retail locations. |
As a result of the seasonal fluctuations and because the online sale of textbooks and online selling in general is relatively new and it is difficult to predict consumer demand, it is possible that in some future periods our results of operations may be below the expectations of public market analysts and investors. In that event, it is likely that the price of our stock would decline.
WE FACE SIGNIFICANT INVENTORY RISK WITH OUR TEXTBOOKS.
Our textbook inventory balance as of December 31, 2006 consisted mainly of:
| | • | | New textbooks consist of new book inventory primarily held at Baker & Taylor (“B&T”), our fulfillment partner, acquired by B&T or by the Company in support of our eduPartners program for which there generally are not standard return privileges with the publisher. New textbooks also include inventory held at Campus Outfitters retail locations and new textbooks held at other locations; and |
| | • | | Used textbooks held at B&T, Campus Outfitters retail locations, or other locations. |
Under our agreement with B&T in which B&T provides our order fulfillment and drop shipment services, B&T assumes ownership of all new textbooks until shipment and does not assume ownership of the used products it processes for us.
14
Approximately 90% of new textbook unsold inventory at B&T is returned for credit with our publishers, which substantially reduces our risk of inventory obsolescence, however, we take title to the remaining unsold inventory and write down this balance for estimated excess and obsolete or unmarketable inventory equal to the difference between the cost of inventory and the estimated market value based upon assumptions about future demand and market conditions on a quarterly basis.
Should textbook return privileges extended to B&T or us by publishers materially change, we may face increased inventory risk and higher working capital requirements which could adversely affect our operating results. For example, during 2006, our largest publisher imposed a restocking fee on textbook returns, increasing our cost of sales by approximately $0.4 million.
To the extent that we continue to procure used textbooks and maintain textbook inventory at our Campus Outfitter retail operations, we will face increased inventory risk, which may adversely affect our operation results.
WE HAVE EXPERIENCED THE LOSS OF SEVERAL KEY EXECUTIVE MANAGEMENT PERSONNEL AND THE LOSS OF ANY OF OUR REMAINING KEY MANAGEMENT PERSONNEL OR THE INABILITY OF OUR REMAINING KEY MANAGEMENT PERSONNEL TO WORK TOGETHER EFFECTIVELY OR SUCCESSFULLY MANAGE OUR OPERATIONS COULD NEGATIVELY AFFECT OUR BUSINESS.
Our future operations depend to a significant extent on the continued service and coordination of our management team, particularly Eric J. Kuhn, our co-founder and Chairman of the Board, and Jim Craig, our Chief Financial Officer since May 17, 2006 and Interim President and Chief Executive Officer since November 17, 2006. We have entered into agreements with Mr. Kuhn and Mr. Craig that provide, among other things, that they are compensated in the event they are terminated without cause. The loss or departure of any of our executive officers or key employees could harm our ability to implement our business plan. We do not maintain key person insurance on any member of our management team.
WE REDUCED OUR STAFFING BY APPROXIMATELY 40% DURING OUR FOURTH QUARTER OF 2006 AND IF WE FAIL TO EMPLOY AND RETAIN A QUALIFIED WORKFORCE, OUR OPERATING PERFORMANCE AND FINANCIAL CONDITION COULD BE MATERIALLY ADVERSELY AFFECTED.
Our future success depends to a significant extent on the continued service of several key operating managers and employees, many of whom have been employed by Varsity Group for extended periods and have intimate knowledge of our systems, processes and procedures. We have entered into agreements with several key operating managers and employees that provide, among other things, that they are compensated in the event they are terminated without cause. Also, several key members of the SchoolOne staff have intimate knowledge of our information technology systems and their operation. SchoolOne has taken actions to retain these key staff members. The loss or departure of any significant number of these individuals could harm our operating performance and our financial condition could be materially adversely affected.
IF WE ARE UNABLE TO ADAPT AS INTERNET TECHNOLOGIES AND CUSTOMER DEMANDS CONTINUE TO EVOLVE, OUR SERVICES AND PRODUCTS COULD BECOME LESS DESIRABLE.
The satisfactory performance, reliability and availability of our website, transaction-processing systems and network infrastructure are critical to our reputation and our ability to attract and retain customers and maintain adequate customer service levels. An unanticipated dramatic increase in the volume of traffic on our website or the number of orders placed by our customers may force us to expand and upgrade our technology, transaction-processing systems and network infrastructure. There can be no assurance that we will be able to accurately project the rate or timing of increases, if any, in the use of our website or timely expand and upgrade our systems and infrastructure to accommodate such increases. To be successful, we must adapt to our rapidly changing market by continually enhancing the technologies used in our Internet products and services and introducing new technology to address the changing needs of our business and customers. If we are unable, for technical, legal, financial or other reasons, to adapt in a timely manner in response to changing market conditions or business and customer requirements, our business could be harmed.
We are continuing to upgrade our information systems, which includes substantially all aspects of transaction processing, including order management, cash and credit card processing, purchasing, inventory management and shipping in order to accommodate the Campus Outfitters acquisition, the continued growth of our textbook program, and to comply with the numerous reporting and control requirements imposed by the Sarbanes Oxley Act, including Section 404, in part for our December 31, 2007 10-K and fully for 2008. Our success, in particular our ability to successfully receive and fulfill orders and provide high-quality customer service, largely depends on the efficient and uninterrupted operation of our computer and communications hardware systems. While many of the Campus Outfitters uniform systems were upgraded in time for the 2006 selling season, we did experience delays in the release of our new order management and inventory management software systems, which contributed to operational difficulties that we feel were a considerable factor contributing to the causes of the
15
increase in cost of uniforms in 2006. We completed upgrades to our textbook transaction system in our second quarter of 2006, however, these systems upgrades are complex. This complexity can make it difficult to detect errors or failure in our website prior to implementation. We may not immediately discover errors in our new system until the volume of orders placed by our customers significantly increases from the levels we experienced in our last fall back to school season. As a result, the upgraded website may not achieve the expected benefits. Unanticipated problems with our website may result in customer dissatisfaction, a loss of, or delays in, the market acceptance of our website, and lost revenue and collection difficulties during the period required to correct these errors. Failure to correct these problems may harm our reputation, our brand and our business.
WE DEPEND ON A THIRD-PARTY SERVICE PROVIDER FOR OUR INFORMATION TECHNOLOGY INFRASTRUCTURE. IF OUR THIRD-PARTY SERVICE PROVIDER EXPERIENCES ANY SYSTEM FAILURE OR INADEQUACY, OUR OPERATIONS COULD BE JEOPARDIZED.
Our operations are dependent on our ability to maintain our computer and communications software and equipment in effective working order and to protect our systems against damage from fire, natural disaster, power loss, communications failure or similar events. In addition, the growth of our customer base may strain or exceed the capacity of our computer and communications systems and lead to degradations in performance or systems failure. Our success, in particular our ability to successfully receive and fulfill orders and provide high-quality customer service, largely depends on the efficient and uninterrupted operation of our computer and communications hardware systems. We use an internally developed system for our website, search engine and substantially all aspects of transaction processing, including order management, cash and credit card processing, purchasing, inventory management and shipping.
Substantially all of our computer and communications hardware and software systems associated with the operation of our website are located at a single facility in Cleveland, Ohio. Substantially all of our computer and communications hardware and software systems associated with the operation of our website are located at a single secure which is located in Cleveland, Ohio, hosts our server environment and acts as our Internet service provider A disruption in this Internet service could cause a disruption in our ability to service our clients.
Despite our implementation of network security measures, our servers are vulnerable to computer viruses, physical or electronic break-ins, fire, flood, power loss, telecommunications failure, break-ins, earthquake and similar disruptions, which could lead to interruptions, delays, loss of data or the inability to accept and fulfill customer orders. Any damage, failure or delay that causes interruptions in our system operations could have a material adverse effect on our business.
In addition to our offsite software and hardware related to our website, at our headquarters we maintain a local area network, or LAN, which we use for our financial reporting systems, customer service operations, monitoring of our customer orders, e-mails and other internal processes. Any loss of service or other failure of this LAN, regardless of the availability of our website, would significantly impair our ability to service our customers and monitor and fulfill customer orders, which could have a material adverse effect on our business.
The failure of either our website or our LAN or any other systems interruptions that results in unavailability of our website or reduced order fulfillment performance, especially during the peak Fall sales period of July/August/September, could result in negative publicity or could reduce the volume of goods sold and attractiveness of our website and would seriously impair our ability to service our customers’ orders, all of which could negatively affect our revenues. Because our servers are located at a third-party’s facility and because some of the reasons for a systems interruption may be outside of our control, we also may not be able to exercise sufficient control to remedy the problem quickly or at all. Regardless of whether we or a third-party controls or creates system failure, the occurrence of system failure could adversely affect our reputation, seriously harm our business and cause us to lose a significant and disproportionate amount of revenues.
CONCERNS ABOUT SECURITY ON THE INTERNET MAY REDUCE THE USE OF OUR WEBSITE AND IMPEDE OUR GROWTH.
A significant barrier to confidential communications over the Internet has been the need for security. We rely on SSL encryption technology designed to prevent the misappropriation of customer credit card data during the transaction process. Under current credit card practices, a merchant is liable for fraudulent credit card transactions where, as is the case with the transactions we process, that merchant does not obtain a cardholder’s signature. A failure to adequately control fraudulent credit card transactions could reduce our collections and harm our business. Internet usage could decline if any well-publicized compromise of security occurred. Our site could be particularly affected by any such breach because our online commerce model requires the entry of confidential customer ordering, purchasing and delivery data over the Internet, and we maintain a database of this historical customer information. Until more comprehensive security technologies are developed, the security and privacy concerns of existing and potential customers may inhibit the growth of the Internet as a medium for commerce. We cannot be certain that advances in computer capabilities, new discoveries in the field of cryptography or other developments will not result in the compromise or breach of the algorithms we use to protect content and transactions on our website or proprietary information in our databases. Anyone who is able to circumvent our security measures could misappropriate proprietary, confidential customer
16
or company information or cause interruptions in our operations. We may incur significant costs to protect against the threat of such security breaches or to alleviate problems caused by these breaches.
WE MAY BECOME SUBJECT TO BURDENSOME GOVERNMENT REGULATIONS AND LEGAL UNCERTAINTIES AFFECTING THE INTERNET THAT COULD ADVERSELY AFFECT OUR BUSINESS.
To date, governmental regulations have not materially restricted use of the Internet in our markets. However, the legal and regulatory environment that pertains to the Internet is uncertain and may change. Uncertainty and new regulations could increase our costs of doing business and prevent us from delivering our products and services over the Internet. The growth of the Internet may also be significantly slowed. This could delay growth in demand for our online services and limit the growth of our revenues. In addition to new laws and regulations being adopted, existing laws may be applied to the Internet. New and existing laws may cover issues, which include:
| | • | | characteristics and quality of products and services; |
| | • | | copyright, trademark and patent infringement; and |
| | • | | other claims based on the nature and content of Internet materials. |
THE SARBANES OXLEY ACT OF 2002 IMPOSES ADDITIONAL OBLIGATIONS ON US, INCLUDING THE REQUIREMENT THAT WE DOCUMENT AND EVALUATE OUR INTERNAL CONTROLS. THIS EXERCISE HAS NO PRECEDENT AVAILABLE BY WHICH TO MEASURE THE ADEQUACY OF OUR COMPLIANCE AND MAY RESULT IN NON- COMPLIANCE WHICH MAY ADVERSELY AFFECT OUR STOCK PRICE. EFFORTS TO COMPLY WILL RESULT IN ADDITIONAL OPERATING EXPENSES, WHICH MAY MATERIALLY AFFECT OUR FINANCIAL RESULTS.
The Sarbanes-Oxley Act of 2002 and newly proposed or enacted rules and regulations of the SEC and NASDAQ impose new duties on us and our executives, directors, attorneys and independent accountants. In order to comply with the Sarbanes-Oxley Act and such new rules and regulations, we are evaluating our internal controls systems to allow management to report on, and our independent registered public accounting firm to attest to, our internal controls over financial reporting. Based on the most recent rules adopted by the SEC, we will be required to comply with Section 404 of the Sarbanes-Oxley Act, in part, for our December 31, 2007 Form 10-K and fully for 2008. Given our small company size and our limited resources, we expect that efforts to comply with these new regulations will partially offset our anticipated significant decreases in general and administrative expenses in fiscal 2007 and 2008 due to our recent cost reductions as we will be required to hire additional personnel and use additional outside legal, accounting and advisory services. Additionally, we expect that our efforts to prepare to comply with these new regulations will also result in a significant diversion of management time and attention from operating activities to compliance activities. Any of these developments could materially offset savings otherwise anticipated in our operating expenses or affect our operating performance, which would adversely affect financial results.
We cannot be certain as to the outcome of our testing and resulting remediation actions or the impact of the same on our operations since there is no precedent available by which to measure compliance adequacy. If we are not able to implement the requirements of the Sarbanes-Oxley Act in a timely manner or with adequate compliance, we may be subject to sanctions or investigation by regulatory authorities, such as the SEC or NASDAQ, and our reputation may be harmed. Any such action could adversely affect our financial results and may adversely affect our stock price. Moreover, because these laws, regulations and standards are subject to varying interpretations, their application in practice may evolve over time as new guidance becomes available. This evolution may result in continuing uncertainty regarding compliance matters and additional costs necessitated by ongoing revisions to our disclosure and governance practices.
WE HAVE LIMITED FINANCIAL RESOURCES AND OPERATE IN A HIGHLY SEASONAL BUSINESS WHICH MAY IMPACT OUR ABILITY TO FUND OUR OPERATIONS OR TAKE ADVANTAGE OF FINANCIAL INCENTIVES IMPACTING OUR OPERATING MARGINS.
Our business is presently highly seasonal, with the vast bulk of our revenues from the sale of books and apparel being earned during the back to school season in the third quarter of each year. In addition, beginning in the second quarter of 2006, we moved aggressively to launch service offerings outside our core book and uniform offerings. We experienced significant cash expenditures in this effort. In November 2006, due to the financial impact of cost increases and cash expenditures together with limited new revenue generation from non-book/uniform service offerings, efforts to launch service offerings outside the book and uniform areas were terminated or suspended. Significant cost reductions have been implemented, and our current strategy
17
includes only the book, uniform and school supplies businesses, however, as a result of this, our net cash and investments position is approximately $9.8 million lower as of December 31, 2006 compared to the prior period. This lower cash position as of December 31, 2006 together with the negative seasonality impact on cash during the January to June 2007 period may effect our ability to take advantage of significant early payment discounts available from our textbook fulfillment provider during part of or most of our Fall 2007 selling season and thereby increase the cost of textbooks in fiscal 2007. Early payment and prompt payment discounts from our textbook fulfillment provider were approximately $0.3 million and $0.7 million, respectively, during 2006. As a result of our lower cash position as of December 31, 2006, we entered into a Revolving Line of Credit Loan Agreement and Security Agreement with Bank of America, N.A. (“BOA”) in which BOA will lend up to a maximum amount of $5 million to assist in funding our seasonal cash requirements. We may also issue letters of credit under the facility. Borrowing ceiling levels are established monthly utilizing a borrowing base formula based on percentages of month-end inventory, receivable and investment collateral values. A $2 million restricted cash investment is required to be maintained at all times as the investment collateral portion of the borrowing base. The facility is secured by substantially all of our assets. The agreement terminates on April 30, 2008. With the BOA agreement in place, we presently believe that our cash, cash equivalents and investments are sufficient to fund our operating needs until the 2007 back to school season and that cash generated from our sales during the back to school season will fund our cash needs for the remainder of the fiscal 2007 year. We are still considering spending reductions and additional external financings to meet our liquidity needs. Please see “Forward-Looking Statements.”
NEW ACCOUNTING PRONOUNCEMENTS MAY NEGATIVELY IMPACT OUR STOCK PRICE.
In December 2004, the Financial Accounting Standards Board, issued Statement of Financial Accounting Standards, or SFAS, No. 123R, “Share-Based Payment,” (“SFAS 123R”.) This statement, which because effective in our first quarter of 2006, changes how we account for share-based compensation and may negatively impact our stock price. The future impact of adoption of SFAS 123R is difficult to predict because it will depend on levels of share-based payments granted in the future. However, we believe if we had adopted SFAS 123R in periods prior to fiscal 2006, the impact of that standard would have approximated the impact of SFAS 123 as described in the notes to our consolidated financial statements. SFAS 123R also requires the benefits of tax deductions in excess of recognized compensation cost to be reported as a financing cash flow, rather than as an operating cash flow. This requirement will reduce our net operating cash flows and increase our net financing cash flows in periods after adoption. In the year ended December 31, 2006, we recognized approximately $725,000 in expense related to the adoption of this new accounting standard.
OUR ACQUISITION OF CAMPUS OUTFITTERS MAY ADVERSELY AFFECT OUR COMBINED FINANCIAL RESULTS IN FUTURE YEARS.
On May 26, 2005, we completed our first acquisition, acquiring substantially all of the assets of Campus Outfitters, a leading retailer of private elementary, middle and high school uniforms. As a result, we incurred acquisition and integration costs which contributed to a decrease in income before taxes. During our third and fourth quarters of 2006, the uniform business of Campus Outfitters experienced unexpected operational difficulties, which negatively affected its financial performance and the overall performance of Varsity Group, contributing to a significant decrease in Varsity Group market capitalization during the fourth quarter of 2006. We may experience additional unforeseen integration expenditures or we may not realize expected synergies between our businesses. If this happens, our financial results may be materially adversely affected.
OUR CAMPUS OUTFITTER BUSINESS DEPENDS IN PART ON THE AVAILABILITY OF SUITABLE LEASE SPACE TO SELL ITS SCHOOL UNIFORMS.
Through our Campus Outfitters brand, we sell school uniforms to the private K-12 school marketplace at retail locations in Indiana, Maryland, Michigan, North Carolina, New York, Ohio, Texas and Virginia. Part of our future growth is dependent on our ability to continue to operate these stores in desirable locations with lease costs that allow us to earn a reasonable return. One retail location is currently leased month-to-month and the other retail locations have leases that are scheduled to expire between January 2007 and May 2015. There can be no assurance that we will be able to renew our current leases as they expire, or that new leases will be available on terms acceptable to us. Failure to renew expiring leases may harm our reputation, our brand and our business.
IF WE DO NOT SUCCESSFULLY OPERATE OUR CAMPUS OUTFITTER RETAIL LOCATIONS, OUR BUSINESS COULD BE HARMED.
If we do not successfully operate our Campus Outfitter retail locations, our ability to meet customer demand could be significantly limited. Because our business model has not depended on sales from retail locations in the past, we may not manage our retail facilities in an optimal way, which may result in an excess or insufficient amount of inventory at our retail locations. A failure to optimize inventory in our retail locations will increase our shipping costs, by requiring us to make additional shipments to or from retail locations or vendors. We may be unable to adequately staff our retail locations. As we
18
expand our retail customer base, our fulfillment network may become increasingly complex and operating it will become more challenging. There can be no assurance that we will be able to operate our fulfillment network effectively.
AS INTERNET TECHNOLOGY AND REGULATION ADVANCES, WE MAY NOT BE ABLE TO PROTECT OUR DOMAIN NAMES.
We currently hold various Internet domain names relating to our brands, including the “VarsityBooks.com”, “VarsityGroup.com”, “Varsity-Group.com” and “CampusOutfitters.com” domain names. Governmental agencies and their designees generally regulate the acquisition and maintenance of domain names. The regulation of domain names in the generic category of domain names (i.e., .com, .net and .org) is now controlled by a non-profit corporation, which may create additional top-level domains. Requirements for holding domain names have also been affected. As a result, there can be no assurance that we will be able to acquire or maintain relevant domain names. Furthermore, the relationship between regulations governing domain names and laws protecting trademarks and similar proprietary rights is unclear. Therefore, we may be unable to prevent third parties from acquiring domain names that are similar to, infringe upon or otherwise decrease the value of our trademarks and other proprietary rights. Any such inability could harm our business.
SOME STATES MAY IMPOSE A NEW SALES TAX ON OUR BUSINESS.
A 1992 Supreme Court decision held that the Commerce Clause of the United States Constitution limits a state’s ability to impose a sales or use tax collection responsibility on an out-of-state vendor unless such vendor maintains a physical presence, i.e., substantial nexus, in the taxing state. Based on this Supreme Court decision, we have determined that we do not have a substantial nexus in some jurisdictions where our products are received by customers, and, therefore, do not collect or remit sales or use tax in such jurisdictions. Because the scope of the 1992 Supreme Court decision is unclear, states may challenge our determination of substantial nexus. If successful, such challenges could result in significant liabilities for sales and use taxes with a material and adverse effect on our business. We currently collect and remit sales or use tax on all shipments to eighteen states. The 1992 Supreme Court decision also established that Congress has the power to enact legislation that would permit states to require collection of sales and use taxes by mail-order companies. Congress has from time to time considered proposals for such legislation. We anticipate that any legislative change, if adopted, would be applied on a prospective basis. While there is no case law on the issue, we believe that this analysis could also apply to our online business. Recently, several states and local jurisdictions have expressed an interest in taxing e-commerce companies who do not have any contacts with their jurisdictions other than selling products online to customers in such jurisdictions.
IF WE ARE UNABLE TO MAINTAIN OUR NASDAQ NATIONAL MARKET LISTING, OUR COMMON STOCK MAY BE SUBJECT TO DELISTING FROM THE NATIONAL MARKET AND YOUR ABILITY TO TRADE SHARES OF OUR COMMON STOCK COULD SUFFER.
In September 2004, our common stock was approved for relisting on the NASDAQ National Market and began trading on the NASDAQ National Market on September 29, 2004. For our common stock to remain listed on the NASDAQ, we must meet the minimum listing requirements for continued listing, including, among other requirements, minimum bid price and market value of public float requirements. If we fail to continue to meet the minimum listing requirements, we may be delisted from the NASDAQ. If our common stock is delisted from the NASDAQ, sales of our common stock would likely be conducted only in the over-the counter market. This may have a negative impact on the liquidity and the price of our common stock, and investors may find it more difficult to purchase or dispose of, or to obtain accurate quotations as to the market value of, our common stock.
THE TRADING PRICE FOR OUR COMMON STOCK MAY DROP AND THIS COULD AFFECT YOUR ABILITY TO RESELL YOUR SHARES AT OR ABOVE THE PRICE YOU PAID TO PURCHASE SUCH SHARES.
The stock market, in general, and the trading prices of shares in public technology companies, particularly those such as ours that offer Internet-based products and services, have experienced extraordinary price and volume volatility in recent years. Such volatility has adversely affected the stock prices for many companies irrespective of, or disproportionately to, the operating performance of these companies. Indeed, the trading price of our common stock dropped significantly during the year ended December 31, 2000, thereby precipitating our delisting from the NASDAQ National Market in March 2001. Alternatively, the trading price of our common stock rose significantly during the years ended December 31, 2003 and 2004, ultimately leading to our common stock being relisted on the NASDAQ National Market in September 2004. During the years ended December 31, 2005 and 2006, the trading price of our common stock dropped significantly. We believe that these fluctuations in our stock prices could be the result of many factors, some of which are beyond our control, such as:
| | • | | our quarterly or annual results in operations; |
| | • | | investor perception of us, online retailing services and retail store services in general; |
| | • | | general economic conditions both in the United States and in foreign countries; |
| | • | | adverse or favorable business developments; |
19
| | • | | futures sales of substantial amounts of our common stock by our existing shareholders, officers or directors; |
| | • | | failure to meet estimates or expectations of securities analysts or changes in financial estimates by securities analysts; and |
| | • | | announcements by us or our competitors of new products and services. |
As a result of these factors, we cannot assure you that the trading price of our common stock will not drop again or stay at its current price. Market and industry factors may materially and adversely further affect the market price of our common stock, regardless of our actual operating performance. Significant decreases in the trading price of our common stock is likely to affect our visibility and credibility in our market and this could affect your ability to resell your shares at or above the price you paid to purchase such shares.
IF OUR STOCK PRICE IS VOLATILE, WE MAY BECOME SUBJECT TO SECURITIES LITIGATION WHICH IS EXPENSIVE AND COULD RESULT IN A DIVERSION OF RESOURCES.
Securities class action litigation has often been brought against companies that experience volatility in the market price of their securities. Litigation brought against us could result in substantial costs to us in defending against the lawsuit and a diversion of management’s attention that could cause our business to be harmed.
FUTURE SALES OF OUR COMMON STOCK MAY NEGATIVELY AFFECT OUR STOCK PRICE.
The market price of our common stock could decline as a result of sales of a large number of shares of our common stock by our existing shareholders, officers or directors, or the perception that such sales could occur. These sales also might make it more difficult for us to sell equity securities in the future at a time and at a price that we deem appropriate.
IT MAY BE DIFFICULT FOR A THIRD PARTY TO ACQUIRE OUR COMPANY AND THIS COULD DEPRESS OUR STOCK PRICE.
Delaware corporate law and our amended and restated certificate of incorporation and our by-laws contain provisions that could have the effect of delaying, deferring or preventing a change in control of Varsity Group or a change of our management that stockholders may consider favorable or beneficial. These provisions could discourage proxy contests and make it more difficult for you and other stockholders to elect directors and take other corporate actions. These provisions could also limit the price that investors might be willing to pay in the future for shares of our common stock. These provisions include those which:
| | • | | authorize the issuance of “blank check” preferred stock, which is preferred stock that can be created and issued by the board of directors without prior stockholder approval, with rights senior to those of common stock; |
| | • | | provide for a staggered board of directors, so that it would take three successive annual meetings to replace all directors; |
| | • | | prohibit stockholder action by written consent; and |
| | • | | establish advance notice requirements for submitting nominations for election to the board of directors and for proposing matters that can be acted upon by stockholders at a meeting. |
20
Our headquarters is located at 1300 19th Street NW, 8th Floor, Washington, D.C., 20036. We currently lease approximately 92,200 square feet pursuant to thirteen leases that are month-to-month or are scheduled to expire between May 2007 and May 2015.
| | | | | | |
Location | | | | Use | | Square Feet |
1300 19th Street, Suite 800, Washington, D.C. | | (1) | | Office Space – New Headquarters | | 16,000 |
5112 Berwyn Rd College Park, MD | | | | Office Space / Retail store | | 16,850 |
5127 Berwyn Rd, College Park, MD | | | | Main Warehouse | | 10,000 |
5107A College Park, MD | | | | Warehouse | | 2,425 |
5107E College Park, MD | | | | Warehouse | | 1,975 |
Rockville MD | | | | Retail Store | | 1,175 |
Fairfax, VA | | | | Retail Store | | 1,400 |
Raleigh, NC | | | | Retail Store | | 1,175 |
Cincinnati, OH | | | | Retail Store | | 5,700 |
Indianapolis, IN | | | | Retail Store | | 6,825 |
Williamsville, NY | | | | Retail Store | | 3,000 |
Southfield, MI | | | | Retail Store | | 5,000 |
Richardson, TX | | | | Retail Store | | 2,825 |
Akron, OH | | (2) | | Office Space (unoccupied) | | 8,628 |
Fort Lauderdale, FL | | (2) | | Warehouse / Retail store (unoccupied) | | 9,260 |
| (1) | On March 31, 2006, we entered into a four-year lease agreement for a new headquarters facility at 1300 19th Street NW, Suite 800, Washington, D.C. for approximately 16,000 square feet to replace our existing headquarters facilities at 1850 M Street NW, Washington, D.C. We moved into our new headquarters space during our second quarter of fiscal 2006. |
| (2) | Beginning in the second quarter of 2006, we moved aggressively to launch service offerings outside our core book and uniform offerings. Significant costs were incurred in this effort. In November 2006, due to the financial impact of cost increases together with limited new revenue generation from non-book/uniform service offerings, efforts to launch service offerings outside the book and uniform areas were terminated or suspended. As a result, these locations are currently unoccupied and we are actively looking to sublease the space. |
We are a party to various legal proceedings and claims incidental to our business. Management does not believe that the resolution of any such matters that are pending as of the date of this report will have a material adverse effect on the results of operations or financial condition of our company.
| ITEM 4. | SUBMISSION OF MATTERS TO A VOTE OF SECURITY HOLDERS |
None.
21
PART II
| ITEM 5. | MARKET FOR REGISTRANT’S COMMON EQUITY, RELATED STOCKHOLDER MATTERS AND ISSUER PURCHASES OF EQUITY SECURITIES |
Our common stock was traded on the NASDAQ National Market under the symbol VSTY from February 15, 2000 until March 20, 2001. Beginning on March 21, 2001 our common stock traded on the OTC Bulletin Board under the symbol VSTY.OB until September 29, 2004 when our stock was relisted on the NASDAQ National Market trading under the symbol VSTY where it continues to trade as of the date of this report. Prior to February 15, 2000, our common stock was not publicly traded.
For the period from January 1, 2005 to December 31, 2006, the high and low closing prices per share of our common stock were as follows:
| | | | | | | | |
| | | | | High | | Low |
Fiscal Year 2005 | | | | | | | | |
First Quarter | | (Period from January 1, 2005 to March 31, 2005) | | $ | 7.98 | | $ | 6.56 |
Second Quarter | | (Period from April 1, 2005 to June 30, 2005) | | $ | 6.94 | | $ | 4.91 |
Third Quarter | | (Period from July 1, 2005 to September 30, 2005) | | $ | 5.79 | | $ | 4.74 |
Fourth Quarter | | (Period from October 1, 2005 to December 31, 2005) | | $ | 5.01 | | $ | 3.82 |
Fiscal Year 2006 | | | | | | | | |
First Quarter | | (Period from January 1, 2006 to March 31, 2006) | | $ | 4.37 | | $ | 3.58 |
Second Quarter | | (Period from April 1, 2006 to June 30, 2006) | | $ | 5.48 | | $ | 3.74 |
Third Quarter | | (Period from July 1, 2006 to September 30, 2006) | | $ | 4.05 | | $ | 2.91 |
Fourth Quarter | | (Period from October 1, 2006 to December 31, 2006) | | $ | 4.15 | | $ | 1.36 |
As of March 21, 2007, there were 177 stockholders of record, excluding the number of beneficial owners whose shares were held in street name. On March 21, 2007, the closing price of our common stock as reported on the NASDAQ National Market was $1.47 per share. We believe that the number of beneficial holders is significantly in excess of such amount based on the security position listings we obtain from time to time for the purpose of facilitating mailings to our stockholders.
We have never declared or paid any cash dividends on our common stock. Any decision regarding the declaration of future cash dividends will be made by our Board of Directors in their discretion.
There were no share repurchases of our commons stock during fiscal 2006.
The information required by this item regarding equity compensation plans is incorporated herein by reference from the information contained in Item 12 of this Form 10-K.
The following graph compares our cumulative total stockholder return on the common stock (no dividends have been paid thereon) with the cumulative total return of the Nasdaq Stock Market (US) index and a self determined peer group comprised of issuers in the same industry from January 1, 2001 through December 31, 2006. The comparison assumes as investment of $100 on January 1, 2001 in our common stock and each of the foregoing indices.
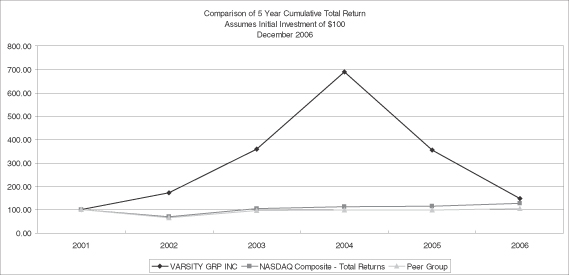
22
| ITEM 6. | SELECTED FINANCIAL DATA |
The selected financial data presented below as of and for the fiscal years ended December 31, 2006, 2005, 2004, 2003 and 2002 have been derived from our audited consolidated financial statements. This data should be read in conjunction with Management’s Discussion and Analysis of Financial Condition and Results of Operations, our Consolidated Financial Statements and Notes thereto, and other financial information appearing elsewhere in this Form 10-K.
| | | | | | | | | | | | | | | | | | | |
| | | Years Ended December 31, | |
| | | (in thousands, except per share data) | |
| | | 2006 | | | 2005 | | 2004 | | | 2003 | | | 2002 | |
Statement of Operations Data | | | | | | | | | | | | | | | | | | | |
Net Sales | | | | | | | | | | | | | | | | | | | |
Textbooks | | $ | 41,903 | | | $ | 40,663 | | $ | 34,437 | | | $ | 22,979 | | | $ | 15,264 | |
Uniforms | | | 7,855 | | | | 5,768 | | | — | | | | — | | | | — | |
Solutions | | | 308 | | | | — | | | — | | | | — | | | | — | |
Shipping | | | 3,840 | | | | 3,638 | | | 3,245 | | | | 2,262 | | | | 1,309 | |
| | | | | | | | | | | | | | | | | | | |
Total net sales | | | 53,906 | | | | 50,069 | | | 37,682 | | | | 25,241 | | | | 16,573 | |
| | | | | | | | | | | | | | | | | | | |
Operating Expenses | | | | | | | | | | | | | | | | | | | |
Cost of textbooks | | | 28,846 | | | | 28,187 | | | 23,349 | | | | 15,814 | | | | 10,558 | |
Cost of uniforms | | | 4,433 | | | | 2,645 | | | — | | | | — | | | | — | |
Cost of solutions | | | 186 | | | | — | | | — | | | | — | | | | — | |
Cost of shipping | | | 3,996 | | | | 2,868 | | | 2,529 | | | | 1,459 | | | | 979 | |
Sales and marketing | | | 14,662 | | | | 9,275 | | | 5,803 | | | | 3,912 | | | | 2,754 | |
Tax related benefit | | | — | | | | — | | | — | | | | (515 | ) | | | — | |
General and administrative | | | 11,398 | | | | 4,855 | | | 3,240 | | | | 2,224 | | | | 1,540 | |
Amortization of acquired intangibles | | | 220 | | | | 91 | | | — | | | | — | | | | — | |
Impairment of goodwill and acquired intangibles | | | 3,257 | | | | — | | | — | | | | — | | | | — | |
Non-cash compensation | | | — | | | | — | | | — | | | | 216 | | | | 388 | |
| | | | | | | | | | | | | | | | | | | |
Total operating expenses | | | 66,998 | | | | 47,921 | | | 34,921 | | | | 23,110 | | | | 16,219 | |
| | | | | | | | | | | | | | | | | | | |
(Loss) income from operations | | | (13,092 | ) | | | 2,148 | | | 2,761 | | | | 2,131 | | | | 354 | |
| | | | | | | | | | | | | | | | | | | |
Other (expense) income | | | (55 | ) | | | 16 | | | (4 | ) | | | (4 | ) | | | (4 | ) |
Interest income, net | | | 299 | | | | 451 | | | 316 | | | | 245 | | | | 311 | |
| | | | | | | | | | | | | | | | | | | |
(Loss) income before taxes | | | (12,848 | ) | | | 2,615 | | | 3,073 | | | | 2,372 | | | | 661 | |
Income tax (expense) benefit | | | (15,530 | ) | | | 9,514 | | | 3,808 | | | | 2,000 | | | | — | |
| | | | | | | | | | | | | | | | | | | |
Net (loss) income | | $ | (28,378 | ) | | $ | 12,129 | | $ | 6,881 | | | $ | 4,372 | | | $ | 661 | |
| | | | | | | | | | | | | | | | | | | |
Net (loss) income per share: | | | | | | | | | | | | | | | | | | | |
Basic | | $ | (1.59 | ) | | $ | 0.72 | | $ | 0.41 | | | $ | 0.27 | | | $ | 0.04 | |
| | | | | | | | | | | | | | | | | | | |
Diluted | | $ | (1.59 | ) | | $ | 0.64 | | $ | 0.39 | | | $ | 0.25 | | | $ | 0.04 | |
| | | | | | | | | | | | | | | | | | | |
Weighted average shares: | �� | | | | | | | | | | | | | | | | | | |
Basic | | | 17,809 | | | | 16,947 | | | 16,715 | | | | 16,440 | | | | 16,086 | |
| | | | | | | | | | | | | | | | | | | |
Diluted | | | 17,809 | | | | 18,831 | | | 17,726 | | | | 17,323 | | | | 16,941 | |
| | | | | | | | | | | | | | | | | | | |
| |
| | | As of December 31, | |
| | | (in thousands) | |
| | | 2006 | | | 2005 | | 2004 | | | 2003 | | | 2002 | |
BALANCE SHEET DATA | | | | | | | | | | | | | | | | | | | |
Total cash, cash equivalents and investments | | $ | 6,883 | | | $ | 12,475 | | $ | 18,858 | | | $ | 19,904 | | | $ | 18,450 | |
Working capital | | | 6,476 | | | | 14,588 | | | 14,244 | | | | 19,111 | | | | 16,948 | |
Total assets | | | 23,648 | | | | 44,804 | | | 30,712 | | | | 23,206 | | | | 19,074 | |
Margin loan | | | 4,205 | | | | — | | | — | | | | — | | | | — | |
Total stockholders’ equity | | | 14,192 | | | | 41,051 | | | 27,988 | | | | 21,401 | | | | 17,012 | |
23
| ITEM 7. | MANAGEMENT’S DISCUSSION AND ANALYSIS OF FINANCIAL CONDITION AND RESULTS OF OPERATIONS |
Forward Looking Statements
The following discussion and analysis of our financial condition and results of operations should be read in conjunction with our consolidated financial statements and related notes included elsewhere in this annual report on Form 10-K. This discussion contains forward-looking statements that involve risks and uncertainties that could cause our actual results to differ materially. These statements relate to future events or our future financial performance and are based on information available to us as of the date hereof, and we assume no obligation to update any forward-looking statement. In some cases, you can identify forward-looking statements by terminology such as “may,” “will,” “should,” “except,” “plan,” “anticipate,” “intend,” “seek,” “expect,” “believe,” “estimate,” “predict,” “potential” or “continue,” the negative of such terms or other comparable terminology. These statements are only predictions. Our actual results could differ materially from those anticipated in these forward-looking statements as a result of certain factors, including but not limited to, those discussed in “Risk Factors” included elsewhere in this annual report on Form 10-K and other reports and filings made with the Securities and Exchange Commission.
The following discussion provides additional information to the accompanying consolidated financial statements and notes to help provide an understanding of our financial condition, changes in financial condition and results of operations. This discussion is organized as follows:
| | • | | Overview. This section provides a general description of our business, economic and industry-wide factors relevant to us and material opportunities, challenges and risks in our business. |
| | • | | Critical Accounting Policies. This section discusses those accounting policies that contain uncertainties and require significant judgment in their application. |
| | • | | Results of Operations. This section provides an analysis of our results of operations for all three years presented in the accompanying consolidated statements of operations. |
| | • | | Liquidity and Capital Resources. This section provides an analysis of our sources and uses of cash, capital expenditures and the amount of financial capacity available to fund our future commitments. |
OVERVIEW
We are an outsourcing solutions provider for the education community. Under the “VarsityBooks” and “Campus Outfitters” brands, we offer a comprehensive outsource solution to provide textbooks, uniforms and school supplies to private K-12 schools, colleges, and distance and continuing education markets. Through our textbook and uniform outsource solutions, schools are released from the operational and financial challenges associated with managing highly seasonal retail operations and are free to focus on their core educational mission. Parents and students benefit from the increased convenience and value associated with our comprehensive textbook and uniform programs.
We were incorporated in December 1997 and began offering books for sale on our website on August 10, 1998. Prior to 2005, our revenues consisted primarily of sales of new textbooks. In May 2005, we acquired Campus Outfitters, a retailer of school uniforms to the private K-12 school marketplace, and introduced school uniforms as a second revenue stream into our business. To date, the primary channel for textbook sales has been through online eCommerce transactions, while the majority of uniform sales have been recognized through retail stores and on-campus sales events.
Our original sales model focused on building a broad consumer brand offering promotions and deeply discounted textbook prices to entice college students to visit our website and purchase their textbooks from us. However, during 2000 we began to focus resources on the growth and development of our eduPartners program, whereby we became a provider of new textbooks and learning materials to private middle and high school, college, distance, and continuing education markets. This model represents the overwhelming majority of our textbook business today.
Fiscal 2002 marked a significant milestone for us as we recorded the first profitable fiscal year in our company. This was accomplished through a combination of revenue growth, margin enhancement and cost reduction efforts initiated during 2000. As part of this transformation we successfully lowered our overall expense structure and improved the margins of our retail book business while growing eduPartners revenues.
In May 2005, as part of our strategy to expand the number of services and products we offer our customers, we acquired Campus Outfitters. Through the Campus Outfitters brand, Varsity Group owns and operates nine retail locations serving private K-12 school communities as their official school uniform provider. Parents and students are also able to purchase uniforms and related
24
items via on-campus sales events which are held at eligible schools as well as online through customized virtual stores which are created onwww.campusoutfitters.com for each partner school containing all required uniform components. We believe with the Campus Outfitters acquisition, we now have the opportunity to begin cross-selling our textbook and uniform model between our combined network of existing customers.
Beginning in the second quarter of 2006, we moved aggressively to launch service offerings outside our core book and uniform offerings. Significant costs were incurred in this effort. In November 2006, due to the financial impact of cost increases together with limited new revenue generation from non-book/uniform service offerings, efforts to launch service offerings outside the book and uniform areas were terminated or suspended. Significant cost reductions have been implemented, and our current strategy includes only the book, uniform and school supplies businesses.
We believe the textbook model affords our company certain scale benefits that will allow us to grow revenues while maintaining margins. We will continue to cross-promote our school uniform solution to our textbook customers and our textbook solution to our uniform customers. We will strive to expand the addressable market of target schools by continuously improving and refining our core textbook and uniform solutions, as well as exploring cost-effective means for delivering new products and services, book and non-book related, to meet the demand of our customers.
In view of the rapidly evolving nature of our business and our limited operating history, we have limited experience forecasting our revenues. Therefore we believe that period-to-period comparisons of our financial results might not necessarily be meaningful and you should not rely on them as an indication of future performance.
Seasonality
We experience significant seasonality in our results of operations. Consistent with our focus on the expansion of eduPartners and introduction of Campus Outfitters uniform model and their current concentration of private middle and high school institutions, since the year ended December 31, 2000, our peak selling period is the July/August/September back-to-school season. During fiscal 2006 and 2005, approximately 88% and 86% of our revenues, respectively, were recognized in this period. We expect this trend to continue during fiscal 2007. While many private middle and high school institutions have an active book-buying season in December/January, the volume of purchases are typically significantly lower than the initial back-to-school season. Historically, Campus Outfitters has experienced the same seasonality in its results of operations. Consistent with its current concentration of private elementary, middle and high schools, Campus Outfitters peak selling season has been July/August/September back-to-school season. Part of our strategy is to extend our textbook program more deeply into the college and distance learning markets, expand our uniform model to more broadly incorporate branded apparel and identify profitable new products or services to market to our existing customer base. This could result in more balanced revenues throughout the year. However, based upon our current program, product and school mix, we will continue to experience significant fluctuations in quarterly operating results. Please see “Forward-Looking Statements.”
CRITICAL ACCOUNTING POLICIES
Our consolidated financial statements are prepared in conformity with accounting principles generally accepted in the United States. For a comprehensive discussion of our accounting policies, see Note 2 in the accompanying consolidated financial statements included in this Annual Report on Form 10-K. We do not have any ownership interest in any special purpose or similar entities and do not have any significant related party transactions.
Pursuant to guidance published by the SEC regarding disclosure about critical accounting policies, we have identified the following accounting policies as critical to the understanding of our financial statements.
Revenue Recognition
We recognize revenue from textbook and uniform sales, net of any discounts and coupons, when our customers receive the products. We take title to new textbooks sold online via our eduPartners program upon transfer to the shipper and assume the risks and rewards of ownership including the risk of loss for collection. We take title to our uniform and textbook inventory held at our retail locations at the time of purchase from the supplier, publisher or buyback customer and we place them in inventory as available for sale at that time. We do not function as an agent or broker for our supplier (see Note 3 to the consolidated financial statements). Outbound shipping charges are included in net sales. We provide allowances for sales returns, promotional discounts and coupons based on historical experience in the period of the sale. Through May 2005, our revenues have consisted primarily of sales of textbooks. After our acquisition of Campus Outfitters in May 2005, our revenues have consisted of sales of textbooks and uniforms.
25
Deferred Income Taxes
We account for income taxes in accordance with Statement of Financial Accounting Standards No. 109 (“SFAS 109”), “Accounting for Income Taxes.” Under SFAS No. 109, deferred tax assets and liabilities are determined based on differences between the financial reporting and tax basis of assets and liabilities and are measured using the enacted tax rates and laws that will be in effect when the differences are expected to reverse. A valuation allowance is established when necessary to reduce deferred tax assets to the amount expected to be realized. In determining the need for a valuation allowance, management reviews both positive and negative evidence pursuant to the requirements of SFAS No. 109, including current and historical results of operations, the annual limitation on utilization of net operating loss carryforwards pursuant to Internal Revenue Code Section 382, future income projections and the overall prospects of our business. We performed our regular assessment of realization of our net deferred tax assets as of September 30, 2006. Statement of Financial Accounting Standards (SFAS) No. 109, “Accounting for Income Taxes” (SFAS No. 109), requires that all available evidence, both positive and negative, be considered in determining whether a valuation allowance is needed relating to net deferred tax assets. Cumulative losses in recent years represent significant negative evidence under SFAS No.109. After considering our pretax losses for the nine months ended September 30, 2006 and the expectation of a pre-tax loss for the full year of 2006, we concluded, based on the criteria outlined in SFAS No. 109, that the significance of the negative evidence of cumulative losses from the most recent years could not be overcome as there was insufficient objective evidence at this time that the deferred tax assets would be realized through future taxable income or available tax planning strategies. Accordingly, we recorded a non-cash charge in the third quarter of 2006 of $18.0 million to increase the valuation allowance against net deferred tax assets. With this increase, we have a full valuation allowance against our net deferred tax assets. This non-cash charge has been recorded in the provision for income taxes in the accompanying consolidated statement of operations. We expect to continue to record a full valuation allowance on future tax benefits until other positive evidence is sufficient to justify realization. Any increase or decrease in the valuation allowance would result in additional or lower income tax expense in such period and could have a significant impact on that period’s earnings.
Stock-Based Compensation Plans
On January 1, 2006, the Company adopted the provisions of SFAS No. 123 (revised 2004), “Share-Based Payment” (“SFAS 123(R)”), which requires the measurement and recognition of non-cash compensation expense for all share-based payment awards made to employees and directors based on estimated fair values. SFAS No. 123R supersedes the Company’s previous accounting under Accounting Principles Board Opinion No. 25 “Accounting for Stock Issued to Employees” (“APB 25”), for periods beginning in fiscal 2006. In March 2005, the Securities and Exchange Commission issued Staff Accounting Bulletin No. 107, or SAB 107, relating to SFAS No. 123R. The Company has applied the provisions of SAB 107 in its adoption of SFAS No. 123R. Prior to the adoption of SFAS No. 123R, the Company previously accounted for its stock-based compensation plans under the recognition and measurement provisions of APB 25 and related interpretations, and provided the disclosure-only provisions of SFAS No. 123, “Accounting for Stock-Based Compensation,” as amended by SFAS No. 148 “Accounting for Stock Based Compensation Transition and Disclosure.” Under the fair value recognition provisions of this statement, stock-based compensation cost is measured at the grant date based on the fair value of the award and is recognized as expense on a straight-line basis over the requisite service period, which is the vesting period. The Company adopted SFAS 123(R) using the modified prospective application transition method and recognized approximately $725,000 in expense related to the adoption of the new accounting standard in the year ended December 31, 2006.
Valuation of Inventories
Inventories, consisting of textbooks and uniforms available for sale, are valued at the lower of cost or market value, net of an obsolescence allowance and are accounted for principally using the FIFO method. Our inventory balance as of December 31, 2006 consists mainly of new book inventory primarily held at B&T, our fulfillment partner, acquired by B&T or by the Company in support of our eduPartners program for which they generally do not have standard return privileges with the publisher or new textbooks that we are able to procure from publishers at better terms than those available to B&T. New textbooks also include inventory held at Campus Outfitters retail locations and new textbooks held at other locations. Our book inventory also consists of used textbooks that we purchased during fiscal 2006. Our inventory also consists of uniforms or apparel located in our College Park warehouse or at our retail locations. Historically, approximately 90% of the unsold new textbook inventory held by B&T in support of our eduPartners program has been returned for full credit with publishers, which substantially reduces our risk of inventory obsolescence. We take title to the remaining unsold inventory and write down this balance, as well as any remaining used book inventory, for estimated excess and obsolete or unmarketable inventory equal to the difference between the cost of inventory and the estimated market value, based upon assumptions about future demand and market conditions on a quarterly basis.
Business Acquisition and Valuation and Impairment Review of Long-Lived Assets
We accounted for our purchases of Campus Outfitters in May 2005 and IQ Digital in May 2006 in accordance Statement of Financial Accounting Standards No. 141 “Business Combinations” (“SFAS 141”) and accounted for the related acquired intangible assets in accordance with Statement of Financial Accounting Standards No. 142 “Goodwill and Other Intangible Assets” (“SFAS 142”). In accordance with SFAS 141, we allocated the cost of our acquisitions to the identifiable tangible and intangible assets and liabilities assumed, with the remaining amount being classified as goodwill. Management’s estimates of the
26
fair value of the identifiable intangible assets acquired was based on discounted cash flow techniques that included significant estimates about future performance.
As required by SFAS 142, we test goodwill for impairment annually and any time a triggering indicator exists. During our third and fourth quarters of 2006, the uniform business of Campus Outfitters experienced unexpected operational difficulties, which negatively affected its financial performance and the overall performance of Varsity Group, contributing to a significant decrease in Varsity Group market capitalization during the fourth quarter of 2006. Accordingly, we performed a goodwill impairment test for our uniform reporting unit as of December 31, 2006 by applying a fair value-based test and we believed that the carrying value of our uniform segment goodwill exceeded its fair value and therefore, recorded a goodwill impairment charge of approximately $1.9 million. This conclusion was based on our judgment, taking into consideration expectations regarding future profitability and the status of the uniform reporting unit that has reported goodwill. The determination of the value of such intangible assets and the annual impairment tests required by SFAS 142 requires that we make estimates of future revenues, customer retention rates, estimated useful lives and other assumptions that affect our consolidated financial statements. This impairment expense is included in the impairment of goodwill and acquired intangibles line item in our Consolidated Statement of Operations for the fiscal year ended December 31, 2006.
During the fourth quarter of fiscal 2006, we decided to terminate or suspend new service offerings launched earlier in the fiscal year, which included closing its IQ-Digital office. Accordingly, we recognized impairment charges in our Solutions business unit of approximately $0.7 million against goodwill and approximately $0.1 million against other intangible assets. This impairment expense is included in the impairment of goodwill and acquired intangibles line item in our Consolidated Statement of Operations for the fiscal year ended December 31, 2006.
We assess the impairment of long-lived assets, including software developed for internal use and acquired definite life intangible assets, in accordance with Statement of Financial Accounting Standards No. 144 (“SFAS 144”) “Accounting for the Impairment of Long-Lived Assets,” whenever events or changes in circumstances indicate that the carrying value may not be fully recoverable. When we determine that the carrying value of such assets may not be recoverable, we generally measure any impairment as the amount by which the carrying amount of a long-lived asset exceeded its fair value. Fair value is based on a projected discounted cash flow method using a discount rate determined by management to be commensurate with the risk inherent in our current business model. To the extent the unamortized capitalized costs exceed the net fair value, the excess amount is written off. In accordance with SFAS 144, we recorded a write-off of approximately $342,000 during the fiscal year ended December 31, 2006 related to the discontinued use of our Lydia Learn software. Also, during our third and fourth quarters of 2006, the uniform business of Campus Outfitters experienced unexpected operational difficulties, which negatively affected its financial performance and the overall performance of Varsity Group, triggering, in connection with a FAS 142 review of goodwill, a uniform segment goodwill impairment charge of approximately $1.9 million. Accordingly, in accordance with SFAS 144, we performed additional impairment testing for definite life intangible assets acquired as part of our acquisition of Campus Outfitters for our uniform reporting unit as of December 31, 2006 by applying a fair value-based test. These definite life intangible assets include customer-related assets, non-compete agreements and trademarks. We believed that the carrying value of our uniform segment definite life intangible assets exceeded their fair value and therefore, recorded an impairment charge of approximately $0.6 million. This conclusion was based on our judgment, taking into consideration expectations regarding future profitability and the status of the uniform reporting unit. This impairment expense is included in the impairment of goodwill and acquired intangibles line item in our Consolidated Statement of Operations for the fiscal year ended December 31, 2006.
Evaluating long-lived assets for impairment involves judgments as to when an asset may potentially be impaired. We consider there to be a risk of impairment if there is a significant decrease in the market value of an asset or if there is a significant change in the extent or intended use of an asset.
27
RESULTS OF OPERATIONS
| | | | | | | | | |
| | | Fiscal Years Ended
December 31, | |
| | | 2006 | | | 2005 | | | 2004 | |
Net sales: | | | | | | | | | |
Textbooks | | 77.7 | % | | 81.2 | % | | 91.4 | % |
Uniforms | | 14.6 | % | | 11.5 | % | | — | |
Solutions | | 0.6 | % | | — | | | — | |
Shipping | | 7.1 | % | | 7.3 | % | | 8.6 | % |
| | | | | | | | | |
Total net sales | | 100.0 | % | | 100.0 | % | | 100.0 | % |
| | | | | | | | | |
Operating Expenses: | | | | | | | | | |
Cost of textbooks | | 53.5 | % | | 56.3 | % | | 62.0 | % |
Cost of uniforms | | 8.2 | % | | 5.3 | % | | — | |
Cost of shipping | | 7.4 | % | | 5.7 | % | | 6.7 | % |
Cost of solutions | | 0.3 | % | | — | | | — | |
Sales and marketing | | 27.2 | % | | 18.5 | % | | 15.4 | % |
General and administrative | | 21.1 | % | | 9.7 | % | | 8.6 | % |
Amortization of acquired intangibles | | 0.4 | % | | 0.2 | % | | — | |
Impairment of goodwill and acquired intangibles | | 6.0 | % | | — | | | — | |
| | | | | | | | | |
Total operating expenses | | 124.3 | % | | 95.7 | % | | 92.7 | % |
| | | | | | | | | |
(Loss) income from operations | | (24.3 | )% | | 4.3 | % | | 7.3 | % |
Other income, net | | 0.5 | % | | 0.9 | % | | 0.8 | % |
| | | | | | | | | |
(Loss) income before income taxes | | (23.8 | )% | | 5.2 | % | | 8.2 | % |
Income tax (expense) benefit | | (28.8 | )% | | 19.0 | % | | 10.1 | % |
| | | | | | | | | |
Net income | | (52.6 | )% | | 24.2 | % | | 18.3 | % |
| | | | | | | | | |
YEAR ENDED DECEMBER 31, 2006 COMPARED TO YEAR ENDED DECEMBER 31, 2005
Net Sales
Net sales increased 7.7%, or $3.8 million, to $53.9 million for the year ended December 31, 2006. Uniform revenue introduced with our acquisition of Campus Outfitters in May 2005 represented approximately $2.1 million of this increase, textbook revenue represented approximately $1.2 million of this increase and shipping and solutions revenue represented approximately $0.5 million of this increase. An increase in online textbook revenue was largely offset by the non-renewal of an on-campus bookstore management agreement that represented approximately $1.7 million of revenue during fiscal 2005 and generated no revenue during fiscal 2006. The remaining increase was due to the growth of textbook and related revenues attributable to the increase in the number of schools we serviced during 2006 compared to the prior year period.
Net sales consist of sales of textbooks and uniforms and charges to customers for outbound shipping and are net of allowances for returns, promotional discounts and coupons. Revenues from sales are recognized at the time products are received by the customer. Over time, expansion of used book revenue as a percentage of total revenues may serve to lower textbook revenue growth since used books are typically priced at a 25% discount to comparable new textbooks. However, the related decrease in revenue growth is typically offset by higher gross margins associated with the sale of used books. See “Forward Looking Statements.”
Operating Expenses
Cost of Textbooks
Cost of textbooks consists of the cost of textbooks and related education material sold to customers. Cost of textbooks increased 2.3%, or approximately $0.7 million, to approximately $28.9 million for the year ended December 31, 2006. This increase was attributable to our increased sales volume. Expressed as a percentage of related revenue, cost of textbooks was 68.8% for the
28
year ended December 31, 2006, compared to 69.3% for the year ended December 31, 2005. This decrease in fiscal 2006 was largely attributable to a 20% increase in units of used books sold during 2006 as compared to the prior year period. Cost of textbooks varies with textbook revenue and we expect these costs to increase in absolute dollars as our customer base and number of partner schools served expands. Please see “Forward-Looking Statements.”
Cost of Uniforms
Cost of uniforms consists of the cost of uniforms and apparel sold to customers. Cost of uniforms increased 67.6%, or approximately $1.8 million, to approximately $4.4 million for the year ended December 31, 2006. Expressed as a percentage of related revenue, cost of uniforms was 56.4% for the year ended December 31, 2006 compared to 45.9% for the year ended December 31, 2005. The increase is costs as a percentage of related revenue in fiscal 2006 were largely attributable to year over year price increases in product, which were not passed on to our customers and integration issues related to the acquisition of Campus Outfitters. Before our acquisition of Campus Outfitters in May 2005, Campus Outfitters had been privately owned and operated and possessed minimal inventory and purchasing management, data and controls. In order to integrate the Campus Outfitters acquisition, we began upgrading virtually all aspects of its transaction processing systems, including order management, cash and credit card processing, purchasing, inventory management and shipping. While many of the systems were upgraded in time, we did experience delays in the release of our new order management and inventory management software systems, which contributed to operational difficulties that was a considerable factor contributing to the cause of the increase in cost of uniforms. Cost of uniforms varies with uniform revenue and we expect these costs to increase in absolute dollars as our customer base expands. Please see “Forward-Looking Statements.”
Cost of Shipping
Cost of shipping consists of outbound shipping to our customers. Cost of shipping increased 39.3%, or approximately $1.1 million, to approximately $4.0 million, for the year ended December 31, 2006. This increase was attributable to our increased sales volume. Expressed as a percentage of related revenue, cost of shipping was 104.1% for the year ended December 31, 2006 compared to 78.8% for the year ended December 31, 2005. This increase was largely the result of Campus Outfitter integration issues mentioned earlier. Uniforms and textbooks that are not in stock at Campus Outfitter on campus road shows or in retail stores for our customers are generally shipped directly to customers free of shipping charges. Also contributing to the increase are higher shipping costs related to an increase in multiple shipments from different warehouses in order to optimize reduction in delivery time and price increases we did not pass on to our customers. We expect that shipping margins will improve in fiscal 2007 once our new order management and inventory management software systems are fully implemented.
Certain aspects of our agreements with B&T provide for the assignment of separate values to the separate services provided by them: supply of books, shipping and other services, including website content and customer database management. Such assignment is based on the relative fair value of each element as determined by B&T. Consequently, we have included in “cost of textbooks” in our statement of operations the cost of purchased books from B&T, we have included in “cost of shipping” the cost of shipping charges from B&T and we have included in sales and marketing the cost of other services including website content and customer database management charged from B&T.
Sales and Marketing
Sales and marketing expense consists primarily of promotional expenditures, credit card processing fees, travel expense, expenses associated with contracting with our eduPartners schools, expenses associated with our Campus Outfitters retail locations and road shows, seasonal overhead associated with performing inventory purchases at eduPartner schools, and payroll and related expenses for personnel engaged in sales and marketing, account management, eduPartners operations and Campus Outfitters operations. Sales and marketing expense increased 58.0%, or approximately $5.4 million, to approximately $14.7 million for the year ended December 31, 2006.
The following table sets forth sales and marketing expense for the years ended December 31, 2006 and 2005 (in thousands):
| | | | | | | | |
| | | Years ended December 31, | |
| | | 2006 | | | 2005 | |
Variable sales and marketing expense | | $ | 5,832 | | | $ | 4,591 | |
Percentage of total revenue | | | 10.8 | % | | | 9.1 | % |
Other sales and marketing expense | | $ | 8,830 | | | $ | 4,684 | |
Percentage of total revenue | | | 16.4 | % | | | 9.4 | % |
| | | | | | | | |
Sales and marketing expense, as reported | | $ | 14,662 | | | $ | 9,275 | |
Percentage of total revenue | | | 27.2 | % | | | 18.5 | % |
29
Variable sales and marketing expense consists of credit card expenses, certain expenses associated with contracting with our eduPartners and Campus Outfitters schools, and sales expenses associated with our agreement with B&T. During fiscal 2006, variable sales and marketing expense increased 27.0%, or approximately $1.2 million, to approximately $5.8 million from the comparable year period. This increase was attributable to an increase in expenses associated with contracting with our eduPartners and Campus Outfitters schools due to a more competitive market and our revenue growth. We expect that variable sales and marketing expense will continue to increase at levels consistent with growth in the number of schools we service. Please see “Forward-Looking Statements.”
Other sales and marketing expense consists primarily of payroll and related expenses for personnel engaged in sales and marketing, account management, eduPartners operations and Campus Outfitters operations, travel expense, expenses associated with our Campus Outfitters retail locations and road shows and seasonal overhead associated with performing inventory purchases at eduPartner schools. During fiscal 2006, fixed sales and marketing expense increased 88.5%, or approximately $4.1 million, to approximately $8.8 million from the comparable year period. The acquisition of Campus Outfitters, which was purchased in May 2005, contributed to approximately $2.5 million of this increase and the acquisition of IQ Digital in May 2006 contributed approximately $0.6 million of this increase for the year ended December 31, 2006, respectively. Also included in this increase was a non-cash charge of $70,000 for the year ended December 31, 2006, for share-based compensation expense as a result of the adoption of SFAS 123(R), effective January 1, 2006.
In conjunction with our prior plans to accelerate the growth of our business and support the introduction of new businesses during fiscal 2006, we experienced significant increases in sales and marketing headcount and overhead in fiscal 2006. We anticipate that the termination or suspension of all non textbook / uniforms / school supply service offerings in our fourth quarter of fiscal 2006 will decrease other sales and marketing expenses in fiscal 2007. Please see “Forward-Looking Statements.”
General and Administrative
General and administrative expense consists of payroll and related expenses for executive, administrative, and our development and systems personnel, facilities expenses, costs associated with the upgrade and maintenance of our website, outside consultant and professional services expenses, travel, and other general corporate expenses. General and administrative expense, reported net of $1.7 million and $0.7 million of costs capitalized for software developed for internal use for fiscal 2006 and 2005, respectively, increased 134.7%, or approximately $6.5 million, to approximately $11.4 million for the year ended December 31, 2006 compared to the prior year period. The net increase was primarily attributable to:
| | • | | Approximately $0.8 million of additional costs in Campus Outfitters for the year ended December 31, 2006 and approximately $0.6 million of additional costs in IQ Digital for the year ended December 31, 2006, compared to the same periods in 2005 which only had seven months associated with our acquisition of Campus Outfitters in late May 2005 and no months associated with our acquisition of IQ Digital in May 2006; |
| | • | | Approximately $0.6 million in increased amortization associated with the costs we have capitalized in prior periods for software developed for internal use and for impairment charges related to the termination of our LydiaLearn technology; |
| | • | | non-cash charges of approximately $0.7 million for share-based compensation expense as a result of the adoption of SFAS 123(R), effective January 1, 2006; and |
| | • | | significant increases in general and administrative headcount and overhead associated with our prior plans to accelerate the growth of our textbook and uniform business and support new business lines. |
We anticipate that the termination or suspension of all non-textbook, uniform and school supply business lines in our fourth quarter of fiscal 2006 will decrease general and administrative expenses in fiscal 2007. Please see “Forward-Looking Statements.”
We are capitalizing development costs in accordance with American Institute of Certified Public Accountants (“AICPA”) Statement of Position No. 98-1 (“SOP 98-1”), “Accounting for the Costs of Computer Software Developed or Obtained for Internal Use.” Please see “Forward-Looking Statements.”
Amortization of Acquired Intangibles.
Our acquisitions of Campus Outfitters in May 2005 and IQ Digital in May 2006 were accounted for under the purchase method of accounting. As a result, we recorded intangible assets at their applicable fair values of the net tangible assets acquired. Intangible assets are amortized over periods ranging from one to ten years. Amortization of acquired intangibles was approximately $0.2 million during the fiscal year ended December 31, 2006, compared to $0.1 during the prior fiscal year.
30
Impairment of Goodwill and Acquired Intangibles.
We recorded approximately $3.3 million of impairment charges against goodwill and other intangible assets during our fourth quarter of fiscal 2006. Our acquisitions of Campus Outfitters in May 2005, and IQ Digital in May 2006 were accounted for under the purchase method of accounting. As a result, we recorded goodwill that represent the excess of the purchase price paid over the fair value of the net tangible and intangible assets acquired. As required by SFAS 142, in lieu of amortizing goodwill, we test for goodwill for impairment annually and any time a triggering indicator exists. During our third and fourth quarters of 2006, the uniform business of Campus Outfitters experienced unexpected operational difficulties, which negatively affected its financial performance and the overall performance of Varsity Group, contributing to a significant decrease in Varsity Group market capitalization during the fourth quarter of 2006. Accordingly, we performed a goodwill impairment test for our uniform reporting unit as of December 31, 2006 by applying a fair value-based test and management believed that the carrying value of the uniform segment goodwill exceeded its fair value and therefore, recorded a goodwill impairment charge of approximately $1.9 million. Also, in accordance with SFAS 144, we performed additional impairment testing for definite life intangible assets acquired as part of our acquisition of Campus Outfitters for our uniform reporting unit as of December 31, 2006 by applying a fair value-based test. We believed that the carrying value of our uniform segment definite life intangible assets exceeded their fair value and therefore, recorded an impairment charge of approximately $0.6 million.
Also during our fourth quarter of fiscal 2006, we terminated or suspended all non-textbook, uniform and school supply business lines. As a result, we closed our IQ Digital office in Akron, Ohio and accordingly, recorded an impairment charges against goodwill for approximately $0.7 million and against other intangibles for approximately $0.1 million. See Note 10 to the consolidated financial statements.
Other Income (Expense), net
Other income (expense), net consists primarily of interest income on our cash and cash equivalents and investments. Other income was $0.2 million for the year ended December 31, 2006, compared to $0.5 million for the year ended December 31, 2005. The decrease in fiscal 2006 as compared to the prior year period was due to lower average cash invested in short-term and long-term investments.
Income Taxes
Income tax expense for the year ended December 31, 2006 was approximately $15.5 million, compared to an income tax benefit of approximately $9.5 million for the prior year period. We account for income taxes in accordance with SFAS 109. Under SFAS No. 109, deferred tax assets and liabilities are determined based on differences between the financial reporting and tax basis of assets and liabilities and are measured using the enacted tax rates and laws that will be in effect when the differences are expected to reverse. A valuation allowance is established when necessary to reduce deferred tax assets to the amount expected to be realized. In determining the need for a valuation allowance, management reviews both positive and negative evidence pursuant to the requirements of SFAS No. 109, including current and historical results of operations, the annual limitation on utilization of net operating loss carry forwards pursuant to Internal Revenue Code section 382, future income projections and the overall prospects of our business. We performed our regular assessment of realization of our net deferred tax assets as of September 30, 2006. Statement of Financial Accounting Standards (SFAS) No. 109, “Accounting for Income Taxes” (SFAS No. 109), requires that all available evidence, both positive and negative, be considered in determining whether a valuation allowance is needed relating to net deferred tax assets. Cumulative losses in recent years represent significant negative evidence under SFAS No.109. After our assessment as of September 30, 2006, we concluded, based on the criteria outlined in SFAS No. 109, that the significance of the negative evidence of cumulative losses from the most recent years could not be overcome as there was insufficient objective evidence at this time that the deferred tax assets would be realized through future taxable income or available tax planning strategies. Accordingly, we recorded a non-cash charge in the third quarter of 2006 of $18.0 million to increase the valuation allowance against net deferred tax assets. With this increase, we have a full valuation allowance against our net deferred tax assets. This non-cash charge has been recorded in the provision for income taxes in the accompanying consolidated statement of operations. We expect to continue to record a full valuation allowance on future tax benefits until other positive evidence is sufficient to justify realization. Any increase or decrease in the valuation allowance would result in additional or lower income tax expense in such period and could have a significant impact on that period’s earnings. Please see “Forward-Looking Statements” and Note 15 to the consolidated financial statements.
YEAR ENDED DECEMBER 31, 2005 COMPARED TO YEAR ENDED DECEMBER 31, 2004
Net Sales
Net sales increased 32.9%, or $12.4 million, to $50.1 million for year ended December 31, 2005. Uniform revenue introduced with our acquisition of Campus Outfitters in May 2005 represented approximately $5.8 million of this increase. The remaining increase of $6.6 million was due to the growth of textbook and related revenues attributable to the increase in the number of schools we serviced during 2005 compared to the prior year period.
31
Net sales consist of sales of textbooks and uniforms and charges to customers for outbound shipping and are net of allowances for returns, promotional discounts and coupons. Revenues from sales are recognized at the time products are received by the customer.
Operating Expenses
Cost of Textbooks
Cost of textbooks consists of the cost of textbooks and related education material sold to customers. Cost of textbooks increased 20.7%, or approximately $4.8 million, to approximately $28.2 million for the year ended December 31, 2005. This increase was attributable to our increased sales volume. Expressed as a percentage of related revenue, cost of textbooks was 69.5% for the year ended December 31, 2005, compared to 67.9% for the year ended December 31, 2004. This increase was attributable, in part, to increased inventory and related obsolescence costs associated with our expansion to a second distribution center located in Reno, Nevada in 2005, deeper ordering in support of our eduPartners program and increased costs associated with textbook sales through our Campus Outfitter retail stores.
Cost of Uniforms
Cost of uniforms consists of the cost of uniforms and apparel sold to customers. Cost of uniforms was approximately $2.6 million for the year ended December 31, 2005. Expressed as a percentage of related revenue, cost of uniforms was 45.9% for the year ended December 31, 2005.
Cost of Shipping
Cost of shipping consists of outbound shipping to our customers. Cost of shipping increased 13.4%, or approximately $0.3 million, to approximately $2.9 million, for the year ended December 31, 2005. This increase was attributable to our increased sales volume. Expressed as a percentage of related revenue, cost of shipping was 78.8% for the year ended December 31, 2005 compared to 77.9% for the year ended December 31, 2004.
Certain aspects of our agreements with B&T provide for the assignment of separate values to the separate services provided by them: supply of books, shipping and other services, including website content and customer database management. Such assignment is based on the relative fair value of each element as determined by B&T. Consequently, we have included in “cost of textbooks” in our statement of operations the cost of purchased books from B&T, we have included in “cost of shipping” the cost of shipping charges from B&T and we have included in sales and marketing the cost of other services including website content and customer database management charged from B&T.
Sales and Marketing
Sales and marketing expense consists primarily of promotional expenditures, credit card processing fees, travel expense, expenses associated with contracting with our eduPartners schools, expenses associated with our Campus Outfitters retail locations and road shows, seasonal overhead associated with performing inventory purchases at eduPartner schools, and payroll and related expenses for personnel engaged in sales and marketing, account management, eduPartners operations and Campus Outfitters operations. Sales and marketing expense increased 59.8%, or approximately $3.5 million, to approximately $9.3 million for the year ended December 31, 2005. The increase during fiscal 2005 was attributable to increased costs associated with the acquisition of Campus Outfitters, increased credit card processing fees associated with higher absolute sales levels, an increase in expenses for payments to our program schools based upon increased sales levels and increases in payroll and related expenses and other costs resulting from an increase in the number of staff dedicated to sales and marketing, account management and operations compared to the prior year period.
The following table sets forth sales and marketing expense for the years ended December 31, 2005 and 2004 (in thousands):
| | | | | | | | |
| | | Years ended December 31, | |
| | | 2005 | | | 2004 | |
Variable sales and marketing expense | | $ | 4,591 | | | $ | 3,665 | |
Percentage of total revenue | | | 9.1 | % | | | 9.7 | % |
Other sales and marketing expense | | $ | 4,684 | | | $ | 2,137 | |
Percentage of total revenue | | | 9.4 | % | | | 5.7 | % |
| | | | | | | | |
Sales and marketing expense, as reported | | $ | 9,275 | | | $ | 5,803 | |
Percentage of total revenue | | | 18.5 | % | | | 15.4 | % |
32
Variable sales and marketing expense consists of credit card expenses, certain expenses associated with contracting with our eduPartners and Campus Outfitters schools, and sales expenses associated with our agreement with B&T. During fiscal 2005, variable sales and marketing expense increased 27.8%, or approximately $1.0 million, to approximately $4.6 million from the comparable year period. This increase was attributable to our revenue growth.
Other sales and marketing expense consists of primarily of payroll and related expenses for personnel engaged in sales and marketing, account management, eduPartners operations and Campus Outfitters operations, travel expense, expenses associated with our Campus Outfitters retail locations and road shows and seasonal overhead associated with performing inventory purchases at eduPartner schools. During fiscal 2005, fixed sales and marketing expense increased 114.8%, or approximately $2.5 million, to approximately $4.7 million from the comparable year period.
General and Administrative
General and administrative expense consists of payroll and related expenses for executive, administrative, and our development and systems personnel, facilities expenses, costs associated with the upgrade and maintenance of our website, outside consultant and professional services expenses, travel, and other general corporate expenses. General and administrative expense, reported net of $0.7 million and $0.8 million of costs capitalized for software developed for internal use for fiscal 2005 and 2004, respectively, increased 50.0%, or approximately $1.6 million, to approximately $4.9 million for the year ended December 31, 2005 compared to the prior year period. The net increase was primarily attributable to increased costs associated with our acquisition of Campus Outfitters in May 2005, an increase in maintenance costs associated with the costs we have capitalized in prior periods for software developed for internal use and general increases in personnel and infrastructure expenditures associated with the growth of our business.
We are capitalizing costs associated with our website upgrade in accordance with American Institute of Certified Public Accountants (“AICPA”) Statement of Position No. 98-1 (“SOP 98-1”), “Accounting for the Costs of Computer Software Developed or Obtained for Internal Use.” We began to amortize the capitalized costs on our balance sheet as of June 30, 2004 on a straight-line basis beginning in our third quarter of fiscal 2004 when the website was placed into service, and we will continue to capitalize the costs of new functionality related to the website upgrade during fiscal 2006 in accordance with SOP 98-1.
Amortization of Acquired Intangibles.
Our acquisition of Campus Outfitters in May 2005 was accounted for under the purchase method of accounting. As a result, we recorded intangible assets at their applicable fair values of the net tangible assets acquired. Intangible assets are amortized over periods ranging from three to ten years. Amortization of intangibles was approximately $0.1 million during fiscal 2005. See Note 10 to the consolidated financial statements.
Other Income, net
Other income, net consists primarily of interest income on our cash and cash equivalents and investments. Other income was $0.5 million for the year ended December 31, 2005, compared to $0.3 million for the year ended December 31, 2004. The increase in fiscal 2005 as compared to the prior year period was due to higher average interest rates.
Income Taxes
Income tax benefit for the years ended December 31, 2005 and 2004 was approximately $9.5 million and $3.8 million, respectively. We account for income taxes in accordance with SFAS 109. Under SFAS No. 109, deferred tax assets and liabilities are determined based on differences between the financial reporting and tax basis of assets and liabilities and are measured using the enacted tax rates and laws that will be in effect when the differences are expected to reverse. A valuation allowance is established when necessary to reduce deferred tax assets to the amount expected to be realized. In determining the need for a valuation allowance, management reviews both positive and negative evidence pursuant to the requirements of SFAS No. 109, including current and historical results of operations, the annual limitation on utilization of net operating loss carry forwards pursuant to Internal Revenue Code section 382, future income projections and the overall prospects of our business. During fiscal 2005 and 2004, management reassessed the potential realization of its remaining valuation allowance based on its financial projections, estimates of future profitability and the overall prospects of our business and concluded that it was more likely than not that a portion of the recorded deferred tax benefits would be realized. Consequently, we released $10.0 million and $5.0 million of the valuation allowance in fiscal 2005 and 2004, respectively, which has resulted in a tax benefit during both years compared to an expected combined federal and state statutory tax rate of approximately 38.9% and 38.0%, respectively. The deferred tax benefits of $10.0 million and $5.0 million recorded in 2005 and 2004, respectively, were offset by income tax provisions of approximately $0.5 million and $1.2 million related to pre-tax income recorded in fiscal 2005 and 2004, respectively. At December 31, 2005 and 2004, we had net operating loss carryforwards for federal income tax purposes of approximately $57.3 million and $60.3 million, respectively, which expire beginning in 2018.
33
LIQUIDITY AND CAPITAL RESOURCES
As of December 31, 2006, we had $2.9 million of cash, cash equivalents and short-term investments and net working capital of approximately $6.5 million compared to approximately $6.1 million of cash, cash equivalents and short-term investments and net working capital of approximately $14.6 million at December 31, 2005. As of December 31, 2006, we had long-term investments of approximately $3.9 million compared to approximately $6.4 million as of December 31, 2005. As of December 31, 2006, we had net borrowings against our short and long-term investments of approximately $4.2 million compared to no net borrowings as of December 31, 2005. The $9.8 million decrease in our overall net cash and investment position during 2006 was primarily attributable to:
| | • | | Significant increases in headcount and overhead associated with the aggressive growth strategy put in place early in the fiscal year to support new business lines; and |
| | • | | Approximately $1.7 million for the purchase of the LydiaLearn assets in March 2006 and the IQ Digital acquisition in May 2006. |
As of December 31, 2006, our principal commitments consisted of obligations outstanding under operating leases, our service agreement with SchoolOne, and accounts payable. Beginning in the second quarter of 2006, we moved aggressively to launch service offerings outside our core book and uniform offerings. Significant costs and cash expenditures were incurred in this effort. In November 2006, due to the financial impact of cost increases together with limited new revenue generation from non-book/uniform service offerings, efforts to launch service offerings outside the book and uniform areas were terminated or suspended. Significant cost reductions have been implemented, and our current strategy includes only the book, uniform and school supplies businesses. As a result, we anticipate a reduction in cash used in operating activities in fiscal 2007. Please see “Forward-Looking Statements.”
Net cash (used in) provided by operating activities was $(6.5) million, $(2.5) million and $0.2 million during the years ended December 31, 2006, 2005 and 2004, respectively. The change in operating cash flows of $(4.0) million during the year ended December 31, 2006 from the prior year period was primarily due to our net loss and inventory purchases partially offset by a decrease in other current assets related to payments made by B&T for deposits we had with them as of December 31, 2005 and the non cash tax charge associated with the valuation allowance taken against deferred tax assets in our third quarter of fiscal 2006. The change in operating cash flows of $(2.7) million during the year ended December 31, 2005 from the prior year period was due to an increase in other current assets related to deposits we had with B&T; and an increase in accounts receivable associated with the increase in revenues recorded in fiscal 2005.
Investing activities consist of acquisitions of businesses, capitalization of software developed for internal use, purchases of property, plant and equipment, purchases of software, and purchases and sales of short-term and long-term investments. Net cash (used in) provided by investing activities was $(0.8) million, $0.1 million, and $4.0 million during the years ended December 31, 2006, 2005 and 2004, respectively. Total purchases of property, equipment and software, including capitalization of software, was approximately $2.8 million during the year ended December 31, 2006, an increase of approximately $1.8 million over the comparable period in 2005 primarily due to the purchase of the LydiaLearn assets and infrastructure growth as we made significant investments in our people, processes and systems to accelerate the growth of our business. Cash payments for the IQ Digital acquisition was approximately $1.3 million during the year ended December 31, 2006, as compared to approximately $3.1 million for cash payments made during the comparable reporting period for Campus Outfitters. During the years ended December 31, 2006 and 2005, we had net sales of short-term and long-term investments of approximately $3.4 million and $4.1 million, respectively, which we used to fund our business acquisitions, infrastructure growth, and operations.
Net cash provided by (used in) financing activities was $4.9 million, $0.3 million and, $(0.3) million for the years ended December 31, 2006, 2005 and 2004, respectively. Net cash provided by financing activities in 2006 consisted of $4.2 million of margin loan borrowings against our short and long-term investments and $0.7 million cash proceeds from the exercise of stock options and warrants. Net cash provided by financing activities in 2005 consisted of $0.3 million proceeds from the exercise of stock options and warrants. Net cash used in financing activities during 2004 consisted of $0.5 million cash used to purchase treasury shares, partially offset by net proceeds from the exercise of stock options and warrants.
Commitments
The following table provides an overview of our aggregate contractual obligations and the effect these obligations are expected to have on our liquidity and cash flows in future periods are as follows (in thousands):
34
| | | | | | | | | | | | | | | | | | | | | |
Contractual Obligations | | 2007 | | 2008 | | 2009 | | 2010 | | 2011 | | Thereafter | | Total |
Capital lease obligations and other | | $ | 18 | | $ | 5 | | $ | — | | $ | — | | $ | — | | $ | — | | $ | 23 |
SchoolOne | | $ | 1,040 | | $ | — | | $ | — | | $ | — | | $ | — | | $ | — | | $ | 1,040 |
Operating lease obligations | | $ | 1,537 | | $ | 1,337 | | $ | 1,213 | | $ | 802 | | $ | 398 | | $ | 738 | | $ | 6,025 |
| | | | | | | | | | | | | | | | | | | | | |
Total | | $ | 2,595 | | $ | 1,342 | | $ | 1,213 | | $ | 802 | | $ | 398 | | $ | 738 | | $ | 7,088 |
| | | | | | | | | | | | | | | | | | | | | |
As of the date of this filing, we lease approximately 92,000 square feet of office, retail and warehouse space pursuant to leases that are month-to-month or are scheduled to expire between May 2007 and May 2015.
Our business is presently highly seasonal, with the vast bulk of our revenues from the sale of books and apparel being earned during the back to school season in the third quarter of each year. In addition, beginning in the second quarter of 2006, we moved aggressively to launch service offerings outside our core book and uniform offerings. We experienced significant cash expenditures in this effort. In November 2006, due to the financial impact of cost increases and cash expenditures together with limited new revenue generation from non-book/uniform service offerings, efforts to launch service offerings outside the book and uniform areas were terminated or suspended. Significant cost reductions have been implemented, and our current strategy includes only the book and uniform businesses, however, as a result of this, our net cash and investments position is approximately $9.8 million lower as of December 31, 2006 compared to the prior period. In March 2007, we entered into a Revolving Line of Credit Loan Agreement and Security Agreement with Bank of America, N.A. (“BOA”) in which BOA will lend up to a maximum amount of $5 million to assist in funding the Company’s seasonal cash requirements. The Company may also issue letters of credit under the facility. Borrowing ceiling levels are established monthly utilizing a borrowing base formula based on percentages of month-end inventory, receivable and investment collateral values. A $2 million restricted cash investment is required to be maintained at all times as the investment collateral portion of the borrowing base. The facility is secured by substantially all of our assets. The agreement terminates on April 30, 2008. With the BOA agreement in place, we presently believe that our cash, cash equivalents and investments are sufficient to fund our operating needs until the 2007 back to school season and that cash generated from our sales during the back to school season will fund our cash needs for the remainder of the fiscal 2007 year. We are still considering spending reductions and additional external financings to meet our liquidity needs. Please see “Forward-Looking Statements.”
RECENT ACCOUNTING STANDARDS
In June 2006, the FASB issued Financial Interpretation No. 48, “Accounting for Uncertainty in Income Taxes” (“FIN 48”) which clarifies the accounting for uncertainty in income taxes recognized in a company’s financial statements in accordance with SFAS No. 109, “Accounting for Income Taxes.” FIN 48 prescribes a recognition threshold and measurement attribute for the financial statement recognition and measurement of a tax position taken or expected to be taken in a tax return. The Company is required to adopt FIN 48 as of January 1, 2007 and is in the process of determining the impact, if any, the adoption of FIN 48 will have on its consolidated financial statements and related disclosures.
In September 2006, the Securities and Exchange Commission (“SEC”) issued Staff Accounting Bulletin No. 108 (“SAB 108”), “Considering the Effects of Prior Year Misstatements when Quantifying Misstatements in Current Year Financial Statements”, to address diversity in practice in quantifying financial statement misstatements. SAB 108 provides interpretive guidance on the consideration of the effects of prior year misstatements in quantifying current year misstatements for the purpose of a materially assessment. SAB 108 is effective for the Company’s year ended December 31, 2006, and allows a one-time transitional cumulative effect adjustment to retained earnings as of January 1, 2006 for errors that were not previously deemed material, but are material under the guidance in SAB 108. The adoption of SAB 108 did not have any impact on the Company’s results of operations or cash flows.
| ITEM 7A. | QUANTITATIVE AND QUALITATIVE DISCLOSURES ABOUT MARKET RISK |
We are exposed to market risk for the effect of interest rate changes and changes in the market values of our investments.
Interest Rate Risk. Our cash equivalents, short-term investments and long-term investments are subject to interest rate risk. We manage this risk by maintaining a diversified investment portfolio of instruments with high credit quality and varying maturity dates. These instruments are designated as available-for-sale and, accordingly, are presented at fair value on our balance sheets and include, but are not limited to, commercial paper, money-market instruments, bank time deposits and variable rate and fixed rate obligations of corporations and national, state and local governments and agencies. These instruments are denominated in
35
U.S. dollars. The fair market value of cash equivalents, short-term investments and long-term investments held was $6.4 million and $12.5 million at December 31, 2006 and December 31, 2005, respectively. We also hold cash balances in accounts with commercial banks in the United States. These cash balances represent operating balances only and are invested in short-term deposits of the local bank.
The weighted average yield on interest-bearing investments held as of December 31, 2006 was approximately 3.8% per annum. Based on our investment holdings at December 31, 2006, a 100 basis point decline in the average yield would have reduced our annual interest income by $0.1 million.
| ITEM 8. | FINANCIAL STATEMENTS AND SUPPLEMENTARY DATA |
Our financial statements required by Regulation S-X are included herein beginning on page F-1.
| ITEM 9. | CHANGES IN AND DISAGREEMENTS WITH ACCOUNTANTS ON ACCOUNTING AND FINANCIAL DISCLOSURE |
None.
| ITEM 9A. | CONTROLS AND PROCEDURES |
Evaluation of Disclosure Controls and Procedures
As required by Rule 13a-15 under the Securities Exchange Act of 1934 (Exchange Act), management has evaluated, with the participation of our Chief Executive Officer and Chief Financial Officer, the effectiveness of our disclosure controls and procedures as of the end of the period covered by this report. Disclosure controls and procedures refer to controls and other procedures designed to ensure that information required to be disclosed in the reports we file or submit under the Exchange Act is recorded, processed, summarized and reported within the time periods specified in the rules and forms of the Securities and Exchange Commission. Disclosure controls and procedures include, without limitation, controls and procedures designed to ensure that information required to be disclosed by us in our reports that we file or submit under the Exchange Act is accumulated and communicated to our management, including our Chief Executive Officer and Chief Financial Officer, as appropriate to allow timely decisions regarding our required disclosure. In designing and evaluating our disclosure controls and procedures, management recognizes that any controls and procedures, no matter how well designed and operated, can provide only reasonable assurance of achieving the desired control objectives, and management is required to apply its judgment in evaluating and implementing possible controls and procedures.
As described below, management identified a material weakness in our internal control over financial reporting. The Public Company Accounting Oversight Board’s Auditing Standard No. 2 defines a material weakness as a significant deficiency, or combination of significant deficiencies, that results in more than a remote likelihood that a material misstatement of the annual or interim financial statements will not be prevented or detected. As a result of the material weakness, our Chief Executive Officer and Chief Financial Officer have concluded that, as of December 31, 2006, the end of the period covered by this report, our disclosure controls and procedures were not effective at a reasonable assurance level.
Material Weakness in Internal Control Over Financial Reporting
As of December 31, 2006, we did not maintain effective controls over the accuracy of the calculation of earnings per share. Effective controls were not in place over the calculation of diluted shares outstanding for purposes of calculating diluted earnings per share. This control deficiency resulted in a computational error of the number of shares to be assumed as repurchased in the application of the treasury stock method that was not prevented or detected. Additionally, this control deficiency could result in a misstatement of earnings per share that would have resulted in a material misstatement to annual or interim financial statements that would not have been prevented or detected. Accordingly, management has determined that this control deficiency constitutes a material weakness.
As a result of the material weakness described above, we performed additional analysis and other post-closing procedures which included the recalculation of all share amounts used in the earnings per share calculation to ensure that the consolidated financial statements were prepared in accordance with generally accepted accounting principles. Accordingly, management believes that the financial statements included in this report fairly present in all material respects our financial condition, results of operations and cash flows for the periods presented.
36
We have taken appropriate steps to remediate the identified material weakness by correcting the methodology used to calculate diluted shares outstanding, placing further controls around this process, and acquiring a third-party software product to automate this process, with the new product to be run in parallel with the existing system. While the remediation measures have improved the design effectiveness of our internal control over financial reporting, the newly designed controls have not operated for a sufficient period of time to demonstrate operating effectiveness. We will continue to test, monitor and assess our remediation activities to ensure that this material weakness is remediated as soon as practicable.
Changes in Internal Control over Financial Reporting
Management has evaluated, with the participation of our Chief Executive Officer and Chief Financial Officer, whether any changes in our internal control over financial reporting that occurred during our last fiscal quarter have materially affected, or are reasonably likely to materially affect, our internal control over financial reporting. No such changes occurred during our last fiscal quarter.
| ITEM 9B. | OTHER INFORMATION |
None.
PART III
| ITEM 10. | DIRECTORS, EXECUTIVE OFFICERS AND CORPORATE GOVERNANCE |
The information required by this item is incorporated herein by reference to our definitive Proxy Statement to be filed pursuant to Regulation 14A under the Exchange Act in connection with our annual meeting of stockholders.
| ITEM 11. | EXECUTIVE COMPENSATION |
The information required by this item is incorporated herein by reference to our definitive Proxy Statement to be filed pursuant to Regulation 14A under the Exchange Act in connection with our annual meeting of stockholders.
| ITEM 12. | SECURITY OWNERSHIP OF CERTAIN BENEFICIAL OWNERS AND MANAGEMENT AND RELATED STOCKHOLDER MATTERS |
On October 2, 1998, the Company adopted the 1998 Stock Plan, under which incentive stock options, non-qualified stock options or stock rights, or any combination thereof may be granted to the Company’s employees. As of December 31, 2006, there are 8.6 million shares authorized under the Company’s Stock Option Plan.
The following table summarizes equity compensation plans as of December 31, 2006.
| | | | | | | |
Plan Category | | Number of securities
to be issued upon
exercise of
outstanding options,
warrants and rights (thousands) (a) | | Weighted-average
exercise price of
outstanding
options, warrants
and rights (b) | | Number of securities
remaining available
for future issuance
under equity
compensation plans
(excluding securities
reflected in column) (thousands) (c) |
Equity compensation plans approved by security holders | | 3,513 | | $ | 4.73 | | 1,272 |
Equity compensation plans not approved by security holders | | — | | | — | | — |
| | | | | | | |
Total | | 3,513 | | | | | 1,272 |
All additional information required by this item is incorporated herein by reference to our definitive Proxy Statement to be filed pursuant to Regulation 14A under the Exchange Act in connection with our annual meeting of stockholders.
| ITEM 13. | CERTAIN RELATIONSHIPS AND RELATED TRANSACTIONS AND DIRECTOR INDEPENDENCE |
The information required by this item is incorporated herein by reference to our definitive Proxy Statement to be filed pursuant to Regulation 14A under the Exchange Act in connection with our annual meeting of stockholders.
37
| ITEM 14. | PRINCIPAL ACCOUNTANT FEES AND SERVICES |
The information required by this item is incorporated herein by reference to our definitive Proxy Statement to be filed pursuant to Regulation 14A under the Exchange Act in connection with our annual meeting of stockholders.
PART IV
| ITEM 15. | EXHIBITS AND FINANCIAL STATEMENT SCHEDULES. |
| (A) 1. | Consolidated Financial Statements. The following consolidated financial statements of registrant and its subsidiaries and report of independent auditors are included in Item 8 of this Form 10-K: |
| | (a) | Report of Independent Registered Public Accounting Firm |
| | (b) | Consolidated Statements of Operations and Comprehensive Income (Loss) for the Years Ended December 31, 2006, 2005 and 2004 |
| | (c) | Consolidated Balance Sheets as of December 31, 2006 and 2005 |
| | (d) | Consolidated Statements of Stockholders’ Equity for the Years Ended December 31, 2006, 2005 and 2004 |
| | (e) | Consolidated Statements of Cash Flows for the Years Ended December 31, 2006, 2005 and 2004 |
| | (f) | Notes to Consolidated Financial Statements |
| | 2. | All schedules for which provision is made in the applicable accounting regulations of the Securities and Exchange Commission either have been included in the Consolidated Financial Statements or are not required under the related instructions, or are inapplicable and therefore have been omitted. |
| | 3. | Exhibits. The Exhibits listed in the Exhibit Index immediately preceding such Exhibits are filed as part of this Annual Report on Form 10-K, and such Exhibit Index is incorporated herein by reference. |
| | |
| EXHIBIT | | DESCRIPTION |
| 2.1(4) | | Purchase agreement between Varsity Group Inc. and Campus Outfitters, LLC (Exhibits and Schedules omitted, but available upon request by the Securities and Exchange Commission.) |
| |
| 2.2(9) | | Purchase agreement between Varsity Group Inc. and IQ Digital Studios. |
| |
| 3.1(1) | | Amended and Restated Certificate of Incorporation of the Company, as amended. |
| |
| 3.2(1) | | Amended and Restated By-laws of the Company. |
| |
| 3.3(6) | | Second Amended and Restated By-laws of the Company. |
| |
| 4.1(1) | | Specimen Certificate of the Company’s common stock. |
| |
| 10.1(1) | | Form of Indemnification Agreement entered into between the Company and its directors and executive officers. |
| |
| 10.2* | | Second Amended and Restated 1998 Stock Option Plan. |
| |
| 10.3(1) | | Amended and Restated Operating Agreement by and between Baker & Taylor, Inc. and Varsity Group Inc. dated as of October 1, 1999. |
| |
| 10.4(1) | | Amended and Restated Database License Agreement by and between Baker & Taylor, Inc. and Varsity Group Inc. dated as of October 1, 1999. |
| |
| 10.5(1) | | Amended and Restated Drop Ship Agreement by and between Baker & Taylor, Inc. and Varsity Group Inc. dated as of October 1, 1999 |
| |
| 10.6(1) | | Promotional and Customer Service Agreement by and between Baker & Taylor, Inc. and Varsity Group Inc. dated as of October 1, 1999. |
| |
| 10.7(1)* | | Agreement for Eric J. Kuhn. |
| |
| 10.7b(5)* | | Amended agreement dated February 15, 2006 between Varsity Group Inc. and Eric J. Kuhn. |
| |
| 10.8(2)* | | Employment Agreement dated August 18, 2003 between Varsity Group Inc. and Daniel Rush, Vice President of Sales |
| |
| 10.9(2)* | | Employment Agreement dated August 18, 2003 between Varsity Group Inc. and Jeff Gatto, Vice President of Operations. |
| |
| 10.10(2)* | | Employment Agreement dated August 18, 2003 between Varsity Group Inc. and Jack M Benson, Chief Financial Officer. |
| |
| 10.11(1)* | | Employee Stock Purchase Plan. |
| |
| 10.12(4)* | | Employment Agreement dated May 26, 2005 between Varsity Group Inc. and Adam Hanin, Executive Vice President of Sales. |
38
| | |
| |
| 10.13(5)* | | Letter Agreement dated February 14, 2006 between Varsity Group Inc. and Mark F. Thimmig, President and Chief Executive Officer. |
| |
| 10.14(7)* | | Separation agreement dated June 14, 2006 between Varsity Group Inc. and Adam Hanin. |
| |
| 10.15(8)* | | Letter agreement and amended agreement dated November 16, 2006 between Varsity Group Inc. and James M. Craig |
| |
| 10.16(8)* | | Separation agreement dated November 16, 2006 between Varsity Group Inc. and Mark F. Thimmig. |
| |
| 10.20(2)* | | Amendment to the Company’s Second Amended and Restated 1998 Stock Option Plan approved by stockholders at the 2003 Annual Meeting of Stockholders. |
| |
| 10.33(5)* | | Share Purchase Agreement dated November 12, 2004 between Varsity Group and Eric J. Kuhn, President and Chief Executive Officer. |
| |
| 10.34(5)* | | Restricted Stock Agreement dated February 15, 2005 between Varsity Group Inc. and Mark F. Thimmig. |
| |
| 10.40(4) | | 2004 / 2005 Fulfillment letter agreement by and between Baker & Taylor, Inc. and Varsity Group Inc. dated as of February 17, 2004. |
| |
| 10.41(4) | | Amended and Restated 2004 / 2005 fulfillment letter agreement by and between Baker & Taylor, Inc. and Varsity Group Inc. dated as of July 15, 2005. |
| |
| 10.42(4) | | 2007/2008 Fulfillment letter agreement by and between Baker & Taylor, Inc. and Varsity Group Inc. dated as of July 15, 2005. |
| |
| 10.43(10) | | Services and Management agreement between Varsity Group Inc. and SchoolOne.com LLC |
| |
| 10.44 | | Line of Credit Agreement between Varsity Group Inc. and Bank of America, N.A. dated March 8, 2007 |
| |
| 21.1(1) | | List of Subsidiaries of the Company. |
| |
| 23.1 | | Consent of PricewaterhouseCoopers LLP |
| |
| 24.1 | | Power of Attorney (included on Signature Page to this report) |
| |
| 31.1 | | Certification of Chief Executive Officer Pursuant to Item 601 (b)(31) of Regulation S-K, as adopted pursuant to 302 of the Sarbanes-Oxley Act of 2002 |
| |
| 31.2 | | Certification of Chief Financial Officer Pursuant to Item 601 (b)(31) of Regulation S-K, as adopted pursuant to 302 of the Sarbanes-Oxley Act of 2002. |
| |
| 32.1 | | Certification of Chief Executive Officer Pursuant to 18 U.S.C. Section 1350, as adopted pursuant to Section 906 of the Sarbanes-Oxley Act of 2002. |
| |
| 32.2 | | Certification of Chief Financial Officer Pursuant to 18 U.S.C. Section 1350, as adopted pursuant to Section 906 of the Sarbanes-Oxley Act of 2002 |
| (1) | Incorporated herein by reference to the exhibits to the Company’s Registration Statement on Form S-1 (File No. 33-89049). |
| (2) | Incorporated herein by reference to the exhibits to the Company’s Quarterly Report on Form 10-Q for the quarter ended September 30, 2003. |
| (3) | Incorporated herein by reference to the exhibits to the Company’s Annual report on Form 10-K for the year ended December 31, 2004. |
| (4) | Incorporated herein by reference to the exhibits to the Company’s Quarterly Report on Form 10-Q for the quarter ended June 30, 2005. |
| (5) | Incorporated herein by reference to the exhibits to the Company’s Current Report on Form 8-K dated February 14, 2006. |
| (6) | Incorporated herein by reference to the exhibits to the Company’s Current Report on Form 8-K dated February 27, 2007. |
| (7) | Incorporated herein by reference to the exhibits to the Company’s Current Report on Form 8-K dated June 6, 2006. |
| (8) | Incorporated herein by reference to the exhibits to the Company’s Current Report on Form 8-K dated November 16, 2006. |
| (9) | Incorporated herein by reference to the exhibits to the Company’s Current Report on Form 8-K dated May 1, 2006. |
| (10) | Incorporated herein by reference to the exhibits to the Company’s Current Report on Form 8-K dated July 14, 2006 and amended on Form 8-K December 20, 2006. |
| * | Indicates a management contract or compensatory plan or arrangement |
The Company hereby files as part of this Form 10-K the exhibits listed on the Exhibit Index referenced in Item 15(A)(3) above. Exhibits can be inspected and copied at the public reference facilities maintained by the Commission, 100 F Street, N.E., Room 1580, Washington, D.C., 20549. In addition we are required to file electronic versions of these documents with the Commission
39
through the Commission’s Electronic Data Gathering, Analysis and Retrieval (EDGAR) system. The Commission maintains a website at http://www.sec.gov that contains reports, proxy and information statements and other information regarding registrants that file electronically with the Commission.
SIGNATURES
Pursuant to the requirements of Section 13 or 15(d) of the Securities Exchange Act of 1934, the registrant has duly caused this report to be signed on its behalf by the undersigned thereunto duly authorized, in the city of Washington, District of Columbia, on the 13th day of April 2007.
| | |
| Varsity Group Inc. |
| |
| By: | | /s/ James Craig |
| James Craig |
| Chief Executive Officer, Chief Financial Officer and President |
POWER OF ATTORNEY AND SIGNATURES
We, the undersigned officers and directors of Varsity Group Inc., hereby severally constitute and appoint Eric J. Kuhn, our true and lawful attorney, with full power to him, to sign for us in our names in the capacities indicated below, amendments to this report, and generally to do all things in our names and on our behalf in such capacities to enable Varsity Group Inc. to comply with the provisions of the Securities Exchange Act of 1934, as amended, and all requirements of the Securities and Exchange Commission. Pursuant to the requirements of the Securities Exchange Act of 1934, this report has been signed by the following persons in the capacities and on the dates indicated.
| | | | |
Signature | | Title | | Date |
| | |
/s/ James Craig James Craig | | Chief Executive Officer and President
(Principal Executive, Financial and Accounting Officer) | | April 13, 2007 |
| | |
/s/ Eric J. Kuhn Eric J. Kuhn | | Chairman of the Board of Directors | | April 13, 2007 |
| | |
/s/ John Kernan John Kernan | | Director | | April 13, 2007 |
| | |
/s/ Allen L. Morgan Allen L. Morgan | | Director | | April 13, 2007 |
| | |
/s/ William Pade William Pade | | Director | | April 13, 2007 |
| | |
/s/ Robert Holster Robert Holster | | Director | | April 13, 2007 |
40
Report of Independent Registered Public Accounting Firm
To the Board of Directors and
Stockholders of Varsity Group Inc.:
In our opinion, the accompanying consolidated balance sheets and the related consolidated statements of operations and comprehensive income (loss), of stockholders’ equity and of cash flows present fairly, in all material respects, the financial position of Varsity Group Inc. at December 31, 2006 and 2005, and the results of their operations and their cash flows for each of the three years in the period ended December 31, 2006 in conformity with accounting principles generally accepted in the United States of America. These financial statements are the responsibility of the Company’s management. Our responsibility is to express an opinion on these financial statements based on our audits. We conducted our audits of these statements in accordance with the standards of the Public Company Accounting Oversight Board (United States). Those standards require that we plan and perform the audit to obtain reasonable assurance about whether the financial statements are free of material misstatement. An audit includes examining, on a test basis, evidence supporting the amounts and disclosures in the financial statements, assessing the accounting principles used and significant estimates made by management, and evaluating the overall financial statement presentation. We believe that our audits provide a reasonable basis for our opinion.
As discussed in Note 2 to the consolidated financial statements, the Company changed the manner in which it accounts for stock-based compensation in 2006.
/s/ PricewaterhouseCoopers LLP
McLean, Virginia
April 10, 2007
41
VARSITY GROUP INC.
CONSOLIDATED STATEMENTS OF OPERATIONS AND COMPREHENSIVE INCOME (LOSS)
Years ended December 31, 2006, 2005 and 2004
(in thousands, except per share data)
| | | | | | | | | | | | |
| | | 2006 | | | 2005 | | | 2004 | |
Net Sales | | | | | | | | | | | | |
Textbooks | | $ | 41,903 | | | $ | 40,663 | | | $ | 34,437 | |
Uniforms | | | 7,855 | | | | 5,768 | | | | — | |
Solutions | | | 308 | | | | — | | | | — | |
Shipping | | | 3,840 | | | | 3,638 | | | | 3,245 | |
| | | | | | | | | | | | |
Total net sales | | | 53,906 | | | | 50,069 | | | | 37,682 | |
| | | | | | | | | | | | |
Operating Expenses | | | | | | | | | | | | |
Cost of textbooks | | | 28,846 | | | | 28,187 | | | | 23,349 | |
Cost of uniforms | | | 4,433 | | | | 2,645 | | | | — | |
Cost of solutions | | | 186 | | | | — | | | | — | |
Cost of shipping | | | 3,996 | | | | 2,868 | | | | 2,529 | |
Sales and marketing | | | 14,662 | | | | 9,275 | | | | 5,803 | |
General and administrative | | | 11,398 | | | | 4,855 | | | | 3,240 | |
Amortization of acquired intangibles | | | 220 | | | | 91 | | | | — | |
Impairment of goodwill and acquired intangibles | | | 3,257 | | | | — | | | | — | |
| | | | | | | | | | | | |
Total operating expenses | | | 66,998 | | | | 47,921 | | | | 34,921 | |
| | | | | | | | | | | | |
(Loss) income from operations | | | (13,092 | ) | | | 2,148 | | | | 2,761 | |
| | | | | | | | | | | | |
Other income, net | | | | | | | | | | | | |
Interest income | | | 377 | | | | 480 | | | | 318 | |
Interest expense | | | (78 | ) | | | (29 | ) | | | (3 | ) |
Other (expense) income | | | (55 | ) | | | 16 | | | | (3 | ) |
| | | | | | | | | | | | |
Other income, net | | | 244 | | | | 467 | | | | 312 | |
| | | | | | | | | | | | |
(Loss) income before income taxes | | | (12,848 | ) | | | 2,615 | | | | 3,073 | |
Income tax (expense) benefit | | | (15,530 | ) | | | 9,514 | | | | 3,808 | |
| | | | | | | | | | | | |
Net (loss) income | | $ | (28,378 | ) | | $ | 12,129 | | | $ | 6,881 | |
| | | | | | | | | | | | |
Net (loss) income per share | | | | | | | | | | | | |
Basic | | $ | (1.59 | ) | | $ | 0.72 | | | $ | 0.41 | |
| | | | | | | | | | | | |
Diluted | | $ | (1.59 | ) | | $ | 0.64 | | | $ | 0.39 | |
| | | | | | | | | | | | |
Weighted average shares | | | | | | | | | | | | |
Basic | | | 17,809 | | | | 16,947 | | | | 16,715 | |
| | | | | | | | | | | | |
Diluted | | | 17,809 | | | | 18,831 | | | | 17,726 | |
| | | | | | | | | | | | |
Comprehensive (loss) income: | | | | | | | | | | | | |
Net (loss) income | | $ | (28,378 | ) | | $ | 12,129 | | | $ | 6,881 | |
Other comprehensive loss: | | | | | | | | | | | | |
Change in unrealized gain (losses) on securities | | | 105 | | | | (100 | ) | | | (7 | ) |
| | | | | | | | | | | | |
Total comprehensive (loss) income | | $ | (28,273 | ) | | $ | 12,029 | | | $ | 6,874 | |
| | | | | | | | | | | | |
See accompanying notes to consolidated financial statements.
42
VARSITY GROUP INC.
CONSOLIDATED BALANCE SHEETS
As of December 31, 2006 and 2005
(in thousands, except par values)
| | | | | | | | |
| | | December 31, | |
| | | 2006 | | | 2005 | |
| ASSETS | | | | | | | | |
Current assets | | | | | | | | |
Cash and cash equivalents | | $ | 436 | | | $ | 2,733 | |
Short-term investments | | | 2,498 | | | | 3,336 | |
Accounts receivable, net of allowance for doubtful accounts of $203 at December 31, 2006 and $80 at December 31, 2005, respectively | | | 1,673 | | | | 2,188 | |
Inventory | | | 8,636 | | | | 4,476 | |
Deferred income taxes | | | — | | | | 367 | |
Other | | | 2,532 | | | | 5,211 | |
| | | | | | | | |
Total current assets | | | 15,775 | | | | 18,311 | |
Property and equipment, net of depreciation | | | 1,156 | | | | 495 | |
Software developed for internal use, net of amortization | | | 2,090 | | | | 1,188 | |
Intangible assets, net of amortization | | | 8 | | | | 719 | |
Goodwill | | | 511 | | | | 2,427 | |
Deferred income taxes | | | — | | | | 15,157 | |
Long-term investments | | | 3,949 | | | | 6,406 | |
Other assets | | | 159 | | | | 101 | |
| | | | | | | | |
Total assets | | $ | 23,648 | | | $ | 44,804 | |
| | | | | | | | |
| LIABILITIES AND STOCKHOLDERS’ EQUITY | | | | | | | | |
Current liabilities: | | | | | | | | |
Accounts payable | | $ | 2,384 | | | $ | 1,874 | |
Other accrued expenses and other current liabilities | | | 2,654 | | | | 1,513 | |
Margin loan | | | 4,205 | | | | — | |
Taxes payable | | | 56 | | | | 336 | |
| | | | | | | | |
Total current liabilities | | | 9,299 | | | | 3,723 | |
Long-term liabilities: | | | | | | | | |
Other non-current liabilities | | | 157 | | | | 30 | |
| | | | | | | | |
Total liabilities | | | 9,456 | | | | 3,753 | |
| | | | | | | | |
Commitments and contingencies (See Note 11) | | | | | | | | |
Stockholders’ equity: | | | | | | | | |
Preferred stock: $.0001 par value, 20,000 shares authorized; 0 shares issued and outstanding at December 31, 2006 and 2005, respectively | | | — | | | | — | |
Common stock, $.0001 par value, 60,000 shares authorized, 19,575 and 18,353 shares issued and 18,360 and 17,138 shares outstanding at December 31, 2006 and 2005, respectively | | | 2 | | | | 2 | |
Additional paid-in capital | | | 90,721 | | | | 89,307 | |
Accumulated unrealized loss on securities | | | (2 | ) | | | (107 | ) |
Accumulated deficit | | | (74,796 | ) | | | (46,418 | ) |
Treasury stock, $.0001 par value, 1,215 at December 31, 2006 and 2005, respectively | | | (1,733 | ) | | | (1,733 | ) |
| | | | | | | | |
Total stockholders’ equity | | | 14,192 | | | | 41,051 | |
| | | | | | | | |
Total liabilities and stockholders’ equity | | $ | 23,648 | | | $ | 44,804 | |
| | | | | | | | |
See accompanying notes to consolidated financial statements.
43
VARSITY GROUP INC.
CONSOLIDATED STATEMENTS OF STOCKHOLDERS’ EQUITY
Years ended December 31, 2006, 2005 and 2004
(in thousands, except share data)
| | | | | | | | | | | | | | | | | | | | | | | | | | | | | |
| | | Common Stock | | Add’l
Paid-In
Capital | | Deferred Comp. | | | Accum Deficit | | | Accumulated Comprehensive
Loss | | | Treasury
Stock | | | Totals | |
Description | | Shares | | | Amt | | | | | | |
Balance at December 31, 2003 | | 16,596,350 | | | $ | 2 | | $ | 88,100 | | $ | (40 | ) | | $ | (65,428 | ) | | | — | | | $ | (1,233 | ) | | $ | 21,401 | |
Issuance of common stock – options exercised | | 178,827 | | | | | | | 159 | | | | | | | | | | | | | | | | | | | 159 | |
Deferred compensation | | | | | | | | | | | | 40 | | | | | | | | | | | | | | | | 40 | |
Purchase treasury stock | | (83,334 | ) | | | | | | | | | | | | | | | | | | | | | (500 | ) | | | (500 | ) |
Warrants exercised | | 62,500 | | | | | | | 14 | | | | | | | | | | | | | | | | | | | 14 | |
Unrealized loss on securities | | | | | | | | | | | | | | | | | | | | (7 | ) | | | | | | | (7 | ) |
Net income | | | | | | | | | | | | | | | | 6,881 | | | | | | | | | | | | 6,881 | |
| | | | | | | | | | | | | | | | | | | | | | | | | | | | | |
Balance at December 31, 2004 | | 16,754,343 | | | $ | 2 | | $ | 88,273 | | $ | 0 | | | $ | (58,547 | ) | | $ | (7 | ) | | $ | (1,733 | ) | | $ | 27,988 | |
Issuance of common stock – options exercised | | 249,359 | | | | | | | 339 | | | | | | | | | | | | | | | | | | | 339 | |
Warrants exercised | | 10,145 | | | | | | | | | | | | | | | | | | | | | | | | | | — | |
Shares issued – acquisition | | 123,967 | | | | | | | 695 | | | | | | | | | | | | | | | | | | | 695 | |
Unrealized loss on securities | | | | | | | | | | | | | | | | | | | | (100 | ) | | | | | | | (100 | ) |
Net income | | | | | | | | | | | | | | | | 12,129 | | | | | | | | | | | | 12,129 | |
| | | | | | | | | | | | | | | | | | | | | | | | | | | | | |
Balance at December 31, 2005 | | 17,137,814 | | | $ | 2 | | $ | 89,307 | | $ | 0 | | | $ | (46,418 | ) | | $ | (107 | ) | | $ | (1,733 | ) | | $ | 41,051 | |
Issuance of common stock – options | | 1,066,306 | | | | | | | 719 | | | | | | | | | | | | | | | | | | | 719 | |
Warrants exercised | | 25,000 | | | | | | | 27 | | | | | | | | | | | | | | | | | | | 27 | |
Restricted Stock | | 130,759 | | | | | | | 350 | | | | | | | | | | | | | | | | | | | 350 | |
Non-cash compensation | | | | | | | | | 318 | | | | | | | | | | | | | | | | | | | 318 | |
Change in unrealized gain/loss on securities | | | | | | | | | | | | | | | | | | | | 105 | | | | | | | | 105 | |
Net income | | | | | | | | | | | | | | | | (28,378 | ) | | | | | | | | | | | (28,378 | ) |
| | | | | | | | | | | | | | | | | | | | | | | | | | | | | |
Balance at December 31, 2006 | | 18,359,879 | | | $ | 2 | | $ | 90,721 | | $ | 0 | | | $ | (74,796 | ) | | $ | (2 | ) | | $ | (1,733 | ) | | $ | 14,192 | |
| | | | | | | | | | | | | | | | | | | | | | | | | | | | | |
See accompanying notes to consolidated financial statements.
44
VARSITY GROUP INC.
CONSOLIDATED STATEMENTS OF CASH FLOWS
Years ended December 31, 2006, 2005 and 2004
(in thousands)
| | | | | | | | | | | | |
| | | 2006 | | | 2005 | | | 2004 | |
Operating activities: | | | | | | | | | | | | |
Net (loss) income | | $ | (28,378 | ) | | $ | 12,129 | | | $ | 6,881 | |
Adjustments to reconcile net (loss) income to net cash (used in) provided by operating activities: | | | | | | | | | | | | |
Depreciation and amortization | | | 1,831 | | | | 545 | | | | 178 | |
Provision for bad debt | | | 195 | | | | 109 | | | | 151 | |
Goodwill and intangible impairment | | | 3,257 | | | | — | | | | — | |
Deferred income tax | | | 15,524 | | | | (9,623 | ) | | | (3,808 | ) |
Non-cash stock compensation | | | 725 | | | | — | | | | 40 | |
Changes in operating assets and liabilities: | | | | | | | | | | | | |
Accounts receivable | | | 367 | | | | (1,045 | ) | | | (863 | ) |
Inventory | | | (4,160 | ) | | | 629 | | | | (2,135 | ) |
Other current and non-current assets | | | 2,671 | | | | (4,001 | ) | | | (1,119 | ) |
Accounts payable | | | 529 | | | | (746 | ) | | | 520 | |
Other accrued expenses and other current liabilities | | | 1,259 | | | | (410 | ) | | | 383 | |
Taxes payable | | | (280 | ) | | | (123 | ) | | | 16 | |
| | | | | | | | | | | | |
Net cash (used in) provided by operating activities | | | (6,460 | ) | | | (2,536 | ) | | | 244 | |
| | | | | | | | | | | | |
Investing activities: | | | | | | | | | | | | |
Payments for acquisition | | | (1,308 | ) | | | (3,065 | ) | | | — | |
Purchases of property, equipment and software developed for internal use | | | (2,787 | ) | | | (1,011 | ) | | | (962 | ) |
Payments for intangible asset | | | (25 | ) | | | — | | | | — | |
Sales of short-term investments | | | 850 | | | | 9,150 | | | | 20,850 | |
Purchases of short-term investments | | | — | | | | (5,500 | ) | | | (8,850 | ) |
Sales of long-term investments | | | 2,500 | | | | 7,000 | | | | 8,000 | |
Purchases of long-term investments | | | — | | | | (6,500 | ) | | | (14,993 | ) |
| | | | | | | | | | | | |
Net cash (used in) provided by investing activities | | | (770 | ) | | | 74 | | | | 4,045 | |
| | | | | | | | | | | | |
Financing activities: | | | | | | | | | | | | |
Borrowings under margin loan | | | 4,205 | | | | — | | | | — | |
Payments for capital lease obligations | | | (18 | ) | | | (9 | ) | | | — | |
Proceeds from exercise of stock options and warrants | | | 746 | | | | 339 | | | | 172 | |
Purchase of treasury stock | | | — | | | | — | | | | (500 | ) |
| | | | | | | | | | | | |
Net cash provided by (used in) financing activities | | | 4,933 | | | | 330 | | | | (328 | ) |
| | | | | | | | | | | | |
Net (decrease) increase in cash and cash equivalents | | | (2,297 | ) | | | (2,132 | ) | | | 3,961 | |
Cash and cash equivalents at beginning of period | | | 2,733 | | | | 4,865 | | | | 904 | |
| | | | | | | | | | | | |
Cash and cash equivalents at end of period | | $ | 436 | | | $ | 2,733 | | | $ | 4,865 | |
| | | | | | | | | | | | |
Supplemental disclosure of cash flow information: | | | | | | | | | | | | |
Cash paid for income taxes | | $ | 166 | | | $ | 124 | | | $ | 91 | |
Cash paid for interest | | | 75 | | | | 29 | | | | — | |
Acquisition of IQ Digital (May 2006) and Campus Outfitters (May 2005) | | | | | | | | | | | | |
Fair value of inventory acquired | | $ | — | | | $ | (2,642 | ) | | $ | — | |
Fair value fixed assets and other assets acquired | | | (444 | ) | | | (199 | ) | | | — | |
Identified intangible assets | | | (136 | ) | | | (809 | ) | | | — | |
Goodwill | | | (712 | ) | | | (2,427 | ) | | | — | |
Fair value of liabilities assumed | | | 34 | | | | 2,317 | | | | — | |
Issuance of stock for acquisition | | | — | | | | 695 | | | | — | |
| | | | | | | | | | | | |
Cash expended for acquisitions | | | (1,258 | ) | | | (3,065 | ) | | | | |
| | | | | | | | | | | | |
Cash paid against acquisition accruals and adjustments to goodwill | | | (50 | ) | | | — | | | | | |
| | | | | | | | | | | | |
Total cash expended for acquisitions | | $ | (1,308 | ) | | $ | (3,065 | ) | | | — | |
| | | | | | | | | | | | |
See accompanying notes to consolidated financial statements.
45
VARSITY GROUP INC.
NOTES TO CONSOLIDATED FINANCIAL STATEMENTS
1. DESCRIPTION OF BUSINESS
Varsity Group Inc. (the “Company”) was incorporated on December 16, 1997 and launched its website, www.varsitybooks.com, in August 1998, at which time the Company began generating revenues. Varsity Group is an outsourcing solutions provider for the education community. Varsity Group offers schools a comprehensive eCommerce solution for their textbook procurement operations and is a provider of uniform apparel needs for schools and businesses with physical retail locations in Indiana, Maryland, Michigan, North Carolina, New Jersey, New York, Ohio, Texas and Virginia.
2. SUMMARY OF SIGNIFICANT ACCOUNTING POLICIES
PRINCIPLES OF CONSOLIDATION
The consolidated financial statements include the accounts of the Company and its wholly-owned subsidiaries. All significant intercompany balances and transactions have been eliminated.
USE OF ESTIMATES
The preparation of consolidated financial statements in conformity with accounting principles generally accepted within the United States of America requires management to make estimates and assumptions that affect the reported amounts of assets and liabilities at the date of the financial statements and the reported amounts of revenues and expenses during the reporting period. Actual results could differ from those estimates.
FAIR VALUE INFORMATION
The carrying amounts of current assets and current liabilities approximate fair value because of the short maturity of these items.
CASH, CASH EQUIVALENTS AND SHORT-TERM INVESTMENTS
Cash, cash equivalents and short-term investments are comprised of amounts in operating accounts, money market investments and other short-term, highly liquid investments. Each is recorded at cost, which approximates market value. The Company’s policy is to record investment securities with original remaining securities of three months or less as cash equivalents. Investment securities with original or remaining maturities of more than three months but less than one year are considered short-term investments. The Company designates its short-term investments as available for sale with unrealized gains or losses reported as a separate component of stockholders’ equity. The fair value of the Company’s investments was determined based on quoted market prices at the reporting date for those instruments. The balance at December 31, 2006 was comprised of $0.4 million in operating accounts and $2.5 million in short term investments. The balance at December 31, 2005 was comprised of $2.7 million in operating accounts, $0.1 million in money market investments and $3.3 million in short term investments in auction rate marketable securities.
LONG-TERM INVESTMENTS
Long-term investments are designated as available-for-sale and, accordingly, are presented at fair value with unrealized gains and losses reported as a component of stockholders’ equity on the Company’s balance sheets. On December 31, 2006, long-term investments included fixed rate obligations of corporations and governments and agencies. The balance of long-term investments at December 31, 2006 and 2005 was $3.9 million and $6.4 million, respectively. As of December 31, 2006, all of the Company’s long-term investments had maturity dates of less than three years.
MARGIN LOANS ON SHORT-TERM AND LONG-TERM INVESTMENTS
The Company has the ability to borrow on margin against up to 70% of its outstanding short and long-term investments. On December 31, 2006, margin loans against outstanding short and long-term investments were approximately $4.2 million with an annual interest rate computed daily of approximately 5.5%.
CONCENTRATIONS OF CREDIT RISK
Accounts receivable consists primarily of amounts due from certain of the Company’s schools. The Company monitors its accounts receivable balances to assess any collectability issues. The Company recorded an allowance for potentially uncollectible receivables of $203,000 and $80,000 at December 31, 2006 and 2005, respectively. The allowance for potentially uncollectible receivables is included as a reduction of accounts receivable in the accompanying consolidated
46
balance sheet. Bad debt expense for the years ended December 31, 2006, 2005 and 2004 was $195,000, $109,000 and $151,000, respectively.
LIQUIDITY
The Company’s business is presently highly seasonal, with the vast bulk of its revenues from the sale of books and apparel being earned during the back to school season in the third quarter of each year. In addition, beginning in the second quarter of 2006, the Company moved aggressively to launch service offerings outside its core book and uniform offerings. The Company experienced significant cash expenditures in this effort. In November 2006, due to the financial impact of cost increases and cash expenditures together with limited new revenue generation from non-book/uniform service offerings, efforts to launch service offerings outside the book and uniform areas were terminated or suspended. Significant cost reductions have been implemented, and the Company’s current strategy includes only the book, uniform and school supplies businesses, however, as a result of this, the Company’s net cash position is approximately $9.8 million lower as of December 31, 2006 compared to the prior period. In March 2007, the Company entered into a Revolving Line of Credit Loan Agreement and Security Agreement with Bank of America, N.A. (“BOA”) in March 2007 to assist in funding the Company’s seasonal cash requirements (See Note 19). With the BOA agreement in place, we presently believe that our cash, cash equivalents and investments are sufficient to fund our operating needs until the 2007 back to school season and that cash generated from our sales during the back to school season will fund our cash needs for the next twelve months. The Company is still considering spending reductions and additional external financings to meet our liquidity needs.
RELIANCE ON SUPPLIERS
The Company primarily relies on a single supplier as its primary provider of textbooks, fulfillment and shipping services. While the Company believes it could obtain these services from other qualified suppliers on similar terms and conditions, a disruption in the supply of these services by the current supplier could materially harm the business. See Note 3.
The Company relies on four suppliers to provide approximately 68% of its uniforms. While the Company uses approximately 70 suppliers to provide all of its needs, a disruption in the supply of this inventory from any one of the Company’s top four suppliers could materially harm the business.
Substantially all of the Company’s computer and communications hardware and software systems are located at a single facility that is owned, maintained and serviced by a third party. Any damage, failure or delay that causes interruptions in the Company’s systems operations could materially harm the Company’s business.
PROPERTY AND EQUIPMENT
Property and equipment are recorded at cost and are depreciated using the straight-line method over the estimated useful lives of the assets or the lease term, whichever is shorter. Furniture and fixtures, machinery, and computer equipment are depreciated over useful lives generally ranging from three to ten years. Software is depreciated over useful lives of 18 months. Leasehold improvements are amortized over the shorter of the lease term or the useful life of the improvements. Repairs and maintenance costs are expensed as incurred.
SOFTWARE DEVELOPED FOR INTERNAL USE
The Company capitalizes certain costs to develop or obtain internal use software in accordance with American Institute of Certified Public Accountants (“AICPA”) Statement of Position No. 98-1 (“SOP 98-1”), “Accounting for the Costs of Computer Software Developed or Obtained for Internal Use.” These capitalized costs are amortized on a straight-line basis over a period of one to five years after completion or acquisition of the software.
LONG-LIVED ASSETS
The Company’s policy is to review its long-lived assets for impairment whenever events or changes in circumstances indicate that the carrying amount of an asset may not be recoverable in accordance with SFAS No. 144, “Accounting for the Impairment or Disposal of Long-Lived Assets.” The Company recognizes an impairment loss when the sum of expected undiscounted net future cash flows is less than the carrying amount of the assets. The amount of the impairment is measured as the difference between the asset’s estimated fair value and its book value. Fair market value is determined primarily using the projected future cash flows discounted at a rate commensurate with the risk involved.
During the fourth quarter of fiscal 2006, the Company decided to terminate or suspend new service offerings launched earlier in the fiscal year. As a result, it was determined that the carrying value of some of its fixed assets held in its Varsity Solutions business unit were not recoverable. Accordingly, the Company recognized an impairment of
47
approximately $0.3 million of its software developed for internal use, and approximately $0.1 million of its fixed assets. This impairment expense is included in the Company’s General and Administrative expense line item in the Company’s Consolidated Statement of Operations for the fiscal year ended December 31, 2006. See Note 4.
REVENUE RECOGNITION
The Company recognizes revenue primarily from textbook and uniform sales, net of any discounts and coupons, when its customers receive the products. The Company takes title to new textbooks sold online via its eduPartners program upon transfer to the shipper and assumes the risks and rewards of ownership including the risk of loss for collection. The Company takes title to its uniform and textbook inventory held at its retail locations at the time of purchase from the supplier, publisher or buyback customer and places them in inventory as available for sale at that time. The Company does not function as an agent or broker for its supplier (see Note 3). Outbound shipping charges are included in net sales. The Company provides allowances for sales returns, promotional discounts and coupons based on historical experience in the period of the sale. Through May 2005, the Company’s revenues consisted primarily of sales of textbooks. After its acquisition of Campus Outfitters in May 2005, the Company’s revenues have consisted principally of sales of textbooks and uniforms.
SALES AND MARKETING
Payments to the Company’s partnership program schools are accrued as the related revenue is earned. Such amounts are included as a component of sales and marketing expense in the accompanying consolidated statements of operations. The Company recognized an expense of approximately $1.7 million, $1.2 million, and $0.8 million for payments earned by its partnership program schools for the years ended December 31, 2006, 2005 and 2004, respectively. Liabilities to such schools were approximately $1.6 million and $1.1 million as of December 31, 2006 and 2005, respectively.
The Company’s agreement with B&T provides for assignment of separate values to the separate services provided by B&T: supply of books, shipping and other services, including website content and customer database management. Such assignment is based on the relative fair value of each element as determined by B&T. The Company has included in “cost of textbooks” in its statement of operations the cost of purchased books from B&T, the cost of shipping charges from B&T in “cost of shipping”, and the cost of other services including website content and customer database management charged by B&T in the “sales and marketing” section of its statement of operations. Expenses associated with these agreements recorded in the “sales and marketing” section of its statement of operations totaled $2.2 million, $2.1 million and $2.1 million for the years ended December 31, 2006, 2005 and 2004, respectively.
INTANGIBLE ASSETS AND GOODWILL
Intangible assets include goodwill, customer related assets, non-compete agreements and trademarks. Goodwill, which is equal to the excess of cost over the fair value of acquired assets, has been recorded in conjunction with the acquisitions of Campus Outfitters in May 2005 and iQ Digital Studios (“iQ Digital”) in May 2006. During 2006, customer related assets were amortized on a straight-line basis between one and 4.5 years. Non-compete agreements and trademarks were amortized on a straight-line basis between one and four years. Goodwill and intangible assets are accounted for in accordance with Statement of Financial Accounting Standards No. 142 “Goodwill and Other Intangible Assets” (“SFAS 142”). Under SFAS 142, goodwill and intangible assets deemed to have an indefinite life are not amortized and are subject to impairment tests, at least annually. The Company does not amortize goodwill and indefinite lived intangible assets.
The Company tests goodwill and indefinite lived intangible assets for impairment using a fair value approach at the reporting unit level. A reporting unit is an operating segment or one level below an operating segment for which discrete financial information is available and reviewed regularly by management. See Note 10.
STOCK-BASED COMPENSATION
Our stock-based compensation programs consist of stock options and restricted stock granted to employees and directors.
On January 1, 2006, the Company adopted the provisions of SFAS No. 123 (revised 2004), “Share-Based Payment” (“SFAS 123(R)”), which requires the measurement and recognition of non-cash compensation expense for all share-based payment awards made to employees and directors based on estimated fair values. SFAS No. 123R supersedes the Company’s previous accounting under Accounting Principles Board Opinion No. 25 “Accounting for Stock Issued to Employees” (“APB 25”), for periods beginning in fiscal 2006. In March 2005, the Securities and Exchange Commission issued Staff Accounting Bulletin No. 107, or SAB 107, relating to SFAS No. 123R. The Company has applied the provisions of SAB 107 in its adoption of SFAS No. 123R. Prior to the adoption of SFAS No. 123R, the Company previously accounted for its stock-based compensation plans under the recognition and measurement
48
provisions of APB 25 and related interpretations, and provided the disclosure-only provisions of SFAS No. 123, “Accounting for Stock-Based Compensation,” as amended by SFAS No. 148 “Accounting for Stock Based Compensation Transition and Disclosure.” See note 13.
Had the Company accounted for its stock-based compensation plan in fiscal 2005 and 2004 using the fair value based method of accounting in accordance with the provisions as required SFAS 123, as amended by Statement of Financial Accounting Standards No. 148 (“SFAS 148”), “Accounting for Stock-Based Compensation – Transition and Disclosure,” the Company’s net income and income per basic and diluted share amounts would have been as follows, in thousands:
| | | | | | | | |
| | | Fiscal Years ended
December 31, | |
| | | 2005 | | | 2004 | |
Net income as reported | | $ | 12,129 | | | $ | 6,881 | |
Less: SFAS No. 123 stock-based compensation expense, net tax | | | (5,696 | ) | | | (1,862 | ) |
Add: APB No. 25 stock-based compensation expense | | | — | | | | 40 | |
| | | | | | | | |
Pro forma net income | | $ | 6,433 | | | $ | 5,059 | |
| | | | | | | | |
Net income per share as reported | | | | | | | | |
Basic | | $ | 0.72 | | | $ | 0.41 | |
Diluted | | $ | 0.64 | | | $ | 0.39 | |
Pro forma net income per share | | | | | | | | |
Basic | | $ | 0.38 | | | $ | 0.30 | |
Diluted | | $ | 0.34 | | | $ | 0.29 | |
INCOME TAXES
The Company accounts for income taxes in accordance with Statement of Financial Accounting Standards No. 109 (“SFAS 109,”) “Accounting for Income Taxes.” Under SFAS No. 109, deferred tax assets and liabilities are determined based on differences between the financial reporting and tax basis of assets and liabilities and are measured using the enacted tax rates and laws that will be in effect when the differences are expected to reverse. A valuation allowance is established when necessary to reduce deferred tax assets to the amount expected to be realized. In determining the need for a valuation allowance, our management reviews both positive and negative evidence pursuant to the requirements of SFAS No. 109, including current and historical results of operations, the annual limitation on utilization of net operating loss carry forwards pursuant to Internal Revenue Code Section 382, future income projections and the overall prospects of our business. (See Note 15.)
SEGMENT REPORTING
In fiscal 2006, the Company’s operations were aggregated into two business segments across domestic markets: textbook trade and uniform trade. International sales are not material. Substantially all of the Company’s operating results and all of its identifiable assets are in the United States.
RECENT ACCOUNTING STANDARDS
In June 2006, the FASB issued Financial Interpretation No. 48, “Accounting for Uncertainty in Income Taxes” (“FIN 48”) which clarifies the accounting for uncertainty in income taxes recognized in a company’s financial statements in accordance with SFAS No. 109, “Accounting for Income Taxes.” FIN 48 prescribes a recognition threshold and measurement attribute for the financial statement recognition and measurement of a tax position taken or expected to be taken in a tax return. The Company is required to adopt FIN 48 as of January 1, 2007 and is in the process of determining the impact, if any, the adoption of FIN 48 will have on its consolidated financial statements and related disclosures.
In September 2006, the Securities and Exchange Commission (“SEC”) issued Staff Accounting Bulletin No. 108 (“SAB 108”), “Considering the Effects of Prior Year Misstatements when Quantifying Misstatements in Current Year Financial Statements”, to address diversity in practice in quantifying financial statement misstatements. SAB 108 provides interpretive guidance on the consideration of the effects of prior year misstatements in quantifying current year misstatements for the purpose of a materially assessment. SAB 108 is effective for the Company’s year ended December 31, 2006, and allows a one-time transitional cumulative effect adjustment to retained earnings as of January
49
1, 2006 for errors that were not previously deemed material, but are material under the guidance in SAB 108. The adoption of SAB 108 did not have any impact on the Company’s results of operations or cash flows.
RECLASSIFICATIONS
Certain prior year amounts have been reclassified to conform to the current year presentation. These changes have no impact on previously reported results of operations or stockholders’ equity.
3. TRANSACTIONS WITH BAKER & TAYLOR
Baker & Taylor (“B&T”) has provided the Company’s order fulfillment and drop shipment services since its inception. The Company has a series of agreements relating to the operating and financial terms of its relationship, which were renewed in July 2005 and are now scheduled to expire in June 2008.
Under these agreements, the Company agrees to provide B&T with written demand forecasts for each upcoming semester and to use B&T as its principal supplier of textbooks and drop-ship and fulfillment services for textbooks and educational materials. The Company pays fees and expenses related to the services B&T provides and purchases products from B&T at a discount to the suggested price. In return, B&T agrees not to provide drop-ship services to any person or entity that has as its principal business activity the goal of establishing exclusive relationships with educational institutions for the purpose of selling textbooks via the Internet, unless the retailer was an existing customer of B&T on or prior to June 10, 1998, the date the Company initially contracted with B&T. The Company’s agreements with Baker & Taylor provide it access to, and use of, an electronic set of data elements from B&T’s title file database that contains bibliographic records. In addition, under these agreements, B&T provides the Company with promotional, customer service, and database management services.
As of December 31, 2006 and 2005, B&T owed the Company approximately $1.4 million and $4.1 million, respectively, related to Company owned textbooks that were returned to publishers for credit during the fourth quarter in each of those fiscal years. Balances owed to the Company are included in other current assets in our Consolidated Balance Sheets as of December 31, 2006 and 2005.
4. ACQUISITIONS AND PURCHASE OF ASSETS
On May 1, 2006, the Company acquired substantially all the assets of IQ Digital Studios (“IQ Digital”) from White Hat Ventures, LLC for approximately $1.3 million cash plus the assumption of certain liabilities. IQ Digital was based in Akron, Ohio and was an advertising agency focused on educational branding, communications and marketing. The acquisition of IQ Digital was part of an aggressive plan of becoming a one-source solution for educational institutions by providing a new line of services that the Company can offer to its existing school client base. Due to the financial impact of cost increases together with limited new revenue generation from non-book/uniform service offerings, efforts to launch service offerings outside the book and uniform areas were terminated or suspended in November 2006 and the goodwill and most of the intangible assets associated with the purchase were fully impaired during the Company’s fourth quarter (See note 10). The results of operations for IQ Digital have been included in the Company’s operations since the acquisition date.
On March 29, 2006, the Company purchased the assets of Lydia Learn (www.lydialearn.com) from White Hat On Campus, LLC, for cash of approximately $0.4 million. Management determined under the guidance of EITF 98-3 “Determining Whether a Nonmonetary Transaction Involves Receipt of Productive Assets or of a Business” that the assets acquired did not constitute a business combination and therefore the assets were recorded at relative fair values of the assets acquired and liabilities assumed. Accordingly, approximately $350,000 was allocated to acquired software and $25,000 was allocated to a non-compete agreement, and the remaining balance of the purchase price was allocated to various fixed or current assets. In late November 2006, efforts to launch service offerings outside the book and uniform areas were terminated or suspended and accordingly, the Lydia Learn asset was fully impaired.
On May 26, 2005, the Company acquired substantially all of the assets of privately held Campus Outfitters, LLC, for cash of approximately $3.1 million and 123,967 shares of common stock valued at approximately $0.7 million, for an aggregate purchase price of approximately $3.8 million, plus the assumption of certain liabilities. The Company may be required to make additional contingent payments if the common stock recipients do not sell, pledge, or in any way transfer the common stock before the two year anniversary of the acquisition close date and the value of the Company’s common stock is not equal to or greater than the per share purchase price on the two year anniversary date. The additional contingent payments, if any, would be payable in cash or shares of the Company’s common stock. During our fourth quarter of fiscal 2006, the Company determined that the uniform goodwill resulting from the Campus acquisition was impaired and accordingly, the Company recorded a goodwill impairment charge of approximately $1.9 million. Also during the fourth quarter of fiscal 2006 the Company determined that the definite life intangible assets
50
resulting from the Campus acquisition were impaired and accordingly, the company recorded an impairment charge against definite life intangible assets of approximately $0.6 million. See note 10.
The results of operations for Campus Outfitters have been included in the Company’s operations since the acquisition date. Unaudited pro forma results of operations for the years ended December 31, 2005 and 2004 are included below. Such pro forma information assumes that the acquisition had occurred as of the beginning of each period presented. This summary is not necessarily indicative of what the Company’s results of operations would have been had the Company and Campus Outfitters been a consolidated entity during such periods, this information is unaudited and does not purport to represent results of operations for any future periods (in thousands, except per share data):
| | | | | | |
| | | December 31,
2005 | | December 31,
2004 |
Net revenue | | $ | 51,355 | | $ | 43,587 |
Net income | | | 11,733 | | | 6,686 |
Diluted net income per share | | | 0.62 | | | 0.37 |
| | | | | | |
5. OTHER CURRENT ASSETS
The following is a summary of other current assets as of December 31, 2006 and 2005 (in thousands):
| | | | | | |
| | | December 31,
2006 | | December 31,
2005 |
Other Current Assets | | | | | | |
Amounts due from B&T, net | | $ | 1,357 | | $ | 4,108 |
Returns in transit | | | 605 | | | 762 |
Other | | | 570 | | | 341 |
| | | | | | |
| | $ | 2,532 | | $ | 5,211 |
| | | | | | |
| | • | | Amounts due from B&T, net, result from Company owned textbooks that B&T has returned to publishers for credit during the fourth quarter of fiscal 2006 net of amounts payable that the Company owes to B&T as of December 31, 2006; and |
| | • | | Returns-in-transit consists of new textbooks that the Company returned to publishers for credit during the fourth quarter of fiscal 2006 that had not yet been processed by the publishers as of December 31, 2006. |
6. CASH, CASH EQUIVALENTS AND INVESTMENTS
The following is a summary of our cash, cash equivalents and investments as of December 31, 2006 and 2005 (in thousands):
| | | | | | | | | | | | |
| | | Cost | | Realized
Loss | | | Unrealized
Loss | | | Market |
December 31, 2006 | | | | | | | | | | | | |
Cash | | $ | 436 | | — | | | — | | | $ | 436 |
Money market funds | | | — | | — | | | — | | | | — |
Short-term investments | | | 2,500 | | — | | | (2 | ) | | | 2,498 |
| | | | | | | | | | | | |
Total cash, cash equivalents and short-term investments | | | 2,936 | | — | | | (2 | ) | | | 2,934 |
Long-term investments | | | 4,000 | | (51 | ) | | — | | | | 3,949 |
| | | | | | | | | | | | |
Total cash, cash equivalents and investments | | $ | 6,936 | | (51 | ) | | (2 | ) | | $ | 6,883 |
| | | | | | | | | | | | |
| | | |
| | | | | Unrealized | | | |
| | | Cost | | Gain | | | Loss | | | Market |
December 31, 2005 | | | | | | | | | | | | |
Cash | | $ | 2,619 | | — | | | — | | | $ | 2,619 |
Money market funds | | | 114 | | — | | | — | | | | 114 |
Short-term investments | | | 3,350 | | — | | | (14 | ) | | | 3,336 |
| | | | | | | | | | | | |
Total cash, cash equivalents and short-term investments | | | 6,083 | | — | | | (14 | ) | | | 6,069 |
Long-term investments | | | 6,499 | | — | | | (93 | ) | | | 6,406 |
| | | | | | | | | | | | |
Total cash, cash equivalents and investments | | $ | 12,582 | | — | | | (107 | ) | | $ | 12,475 |
| | | | | | | | | | | | |
51
7. INVENTORIES
Inventories, consisting of products available for sale, are valued at the lower of cost or market value net of an allowance for obsolescence and are accounted for principally using the FIFO method. The Company’s inventory balance as of December 31, 2006 and December 31, 2005 consists of (in thousands):
| | | | | | |
| | | December 31,
2006 | | December 31,
2005 |
New textbooks, net | | $ | 3,739 | | $ | 1,708 |
Used textbooks, net | | | 1,724 | | | 1,191 |
Uniforms and apparel, net | | | 3,173 | | | 1,577 |
| | | | | | |
| | $ | 8,636 | | $ | 4,476 |
| | | | | | |
The components of inventory are as follows:
| | • | | New textbooks consist of new book inventory primarily held at Baker & Taylor (“B&T”), our fulfillment partner, acquired by B&T or by the Company in support of our eduPartners program for which they generally do not have standard return privileges with the publisher. New textbooks also include inventory held at Campus Outfitters retail locations and new textbooks held at other locations; |
| | • | | Used textbooks consist of used textbooks held at B&T, Campus Outfitters retail locations, or other locations; and |
| | • | | Uniforms and apparel consists of school uniform related inventory held at our Campus Outfitters warehouses or retail locations. |
Under the Company’s agreement with B&T in which B&T provides most of the Company’s order fulfillment and drop shipment services, B&T generally only assumes ownership of new textbooks that they purchase and are able to return to publishers for credit, which historically has approximated 90% of all new textbook inventories. B&T does not assume ownership of the used textbooks it processes for the Company or for new textbooks that the Company purchases and per the agreement with B&T, the Company purchases from B&T at cost new textbooks that B&T procured in support of our eduPartners program and cannot return for publisher credit at the conclusion of each selling season. This inventory has typically been held by B&T for fulfillment in subsequent periods. On a quarterly basis, the Company assesses for write down its inventory for estimated excess and obsolete or unmarketable inventory equal to the difference between the cost of inventory and the estimated market value based upon assumptions about future demand and market conditions.
8. PROPERTY & EQUIPMENT
Property and equipment consist of the following at December 31, (in thousands):
| | | | | | | | |
| | | December 31, | |
| | | 2006 | | | 2005 | |
Computer equipment | | $ | 1,753 | | | $ | 940 | |
Software | | | 252 | | | | 79 | |
Machinery and other | | | 224 | | | | 45 | |
Leasehold improvements | | | 161 | | | | 85 | |
Furniture and fixtures | | | 245 | | | | 99 | |
| | | | | | | | |
| | | 2,635 | | | | 1,248 | |
Less: accumulated depreciation | | | (1,479 | ) | | | (753 | ) |
| | | | | | | | |
Fixed assets, net | | $ | 1,156 | | | $ | 495 | |
| | | | | | | | |
Depreciation expense was approximately $0.8 million, $0.2 million and $0.1 million for the years ended December 31, 2006, 2005 and 2004, respectively. Included in the $0.8 million 2006 depreciation expense was write downs of approximately $0.1 million related to the closure of the Company’s IQ Digital office.
9. SOFTWARE DEVELOPED FOR INTERNAL USE
The Company capitalized software developed for internal use costs of $1.7 million and $0.7 million for fiscal 2006 and 2005, respectively. The Company recorded related amortization of $0.8 million, $0.2 million and $0.1 million for fiscal 2006, 2005 and 2004, respectively, in accordance with SOP 98-1. Costs associated with software developed for
52
internal use are capitalized as they are incurred and are amortized on a straight-line basis over a period of one to five years after completion or acquisition of the software. Included in the $0.8 million 2006 amortization expense was the write-off of the remaining value of the Lydia Learn assets of approximately $0.3 million.
10. INTANGIBLE ASSETS AND GOODWILL
As required by SFAS 142, the Company tests goodwill for impairment annually and any time a triggering indicator exists. During the Company’s third and fourth quarters of 2006, the uniform business of Campus Outfitters experienced unexpected operational difficulties which negatively affected its financial performance and the overall performance of Varsity Group. Accordingly, the Company performed a goodwill impairment test for its uniform reporting unit as of December 31, 2006 by applying a fair value-based test and the Company believed that the carrying value of the uniform segment goodwill exceeded the fair value of its goodwill and therefore, recorded a goodwill impairment charge of approximately $1.9 million. The fair value of the uniform segment was determined using a discounted cash flow analysis. This conclusion was based on management’s judgment, taking into consideration expectations regarding future profitability and the status of the uniform reporting unit that have reported goodwill. As a result of this goodwill impairment charge, in accordance with SFAS 144, the Company performed additional impairment testing for definite life intangible assets acquired as part of its acquisition of Campus Outfitters for its uniform reporting unit as of December 31, 2006 by applying a fair value-based test. The Company believed that the carrying value of its uniform segment definite life intangible assets exceeded their fair value and therefore, recorded an impairment charge of approximately $0.6 million. This conclusion was based on management’s judgment, taking into consideration expectations regarding future profitability and the status of the uniform reporting unit. The determination of the value of such intangible assets and the annual impairment tests required by SFAS 142 and SFAS 144 requires management to make estimates of future revenues, customer retention rates, estimated useful lives and other assumptions that affect our consolidated financial statements. The goodwill and definite life intangible assets impairment expense is included in the Company’s Impairment of Goodwill and Acquired Intangibles line item in the Company’s Consolidated Statement of Operations for the fiscal year ended December 31, 2006.
During the fourth quarter of fiscal 2006, the Company decided to terminate or suspend new service offerings launched earlier in the fiscal year, which included closing its IQ-Digital office. Accordingly, the Company recognized impairment charges of approximately $0.7 million against goodwill and approximately $0.1 million against other intangible assets. This impairment expense is included in the Company’s Impairment of Goodwill and Acquired Intangibles line item in the Company’s Consolidated Statement of Operations for the fiscal year ended December 31, 2006.
Intangible assets resulting from (i) the purchase price allocation of the May 2005 Campus Outfitters acquisition; (ii) the non-compete agreement associated with the purchase of the LydiaLearn assets in March 2006; and (iii) the purchase price allocation of the May 2006 IQ-Digital acquisition, were as follows (in thousands):
| | | | | | | | | | | |
| | | Life | | Gross
Assets | | Accumulated
Amortization | | Net
Assets as of
Dec. 31, 2005 |
| December 31, 2005 | | | | | | | | | | | |
Customer related assets | | | | | | | | | | | |
Campus Outfitters | | 10 yrs | | $ | 491 | | $ | 29 | | $ | 462 |
Non-compete agreements | | | | | | | | | | | |
Campus Outfitters | | 3 yrs | | | 178 | | | 34 | | | 144 |
Trademark | | | | | | | | | | | |
Campus Outfitters | | 3 yrs | | | 140 | | | 27 | | | 113 |
| | | | | | | | | | | |
Total | | | | $ | 810 | | $ | 90 | | $ | 719 |
| | | | | | | | | | | |
53
| | | | | | | | | | | | | | |
| | | Life | | Gross
Assets | | Accumulated
Amortization | | FY06 Impairments | | Net
Assets as of
Dec. 31, 2006 |
| December 31, 2006 | | | | | | | | | | | | | | |
Customer related assets | | | | | | | | | | | | | | |
Campus Outfitters | | 10 yrs | | $ | 491 | | $ | 78 | | $ | 413 | | $ | — |
IQ Digital | | 1yrs | | | 76 | | | 44 | | | 32 | | | — |
Non-compete agreements | | | | | | | | | | | | | | |
Campus Outfitters | | 3 yrs | | | 178 | | | 94 | | | 84 | | | — |
IQ Digital | | 2 yrs | | | 50 | | | 15 | | | 35 | | | — |
Lydia Learn | | 4 yrs | | | 25 | | | 4 | | | 21 | | | — |
Trademark | | | | | | | | | | | | | | |
Campus Outfitters | | 3 yrs | | | 140 | | | 74 | | | 66 | | | — |
IQ Digital | | 3 yrs | | | 10 | | | 2 | | | — | | | 8 |
| | | | | | | | | | | | | | |
Total | | | | $ | 970 | | $ | 311 | | $ | 651 | | $ | 8 |
| | | | | | | | | | | | | | |
The changes in the amount of carrying value of goodwill in the year ended December 31, 2006 were as follows (amounts in thousands):
| | | | |
| | | Net
Assets | |
Balance as of December 31, 2004 | | $ | — | |
Campus Outfitters acquisition | | | 2,427 | |
| | | | |
Balance as of December 31, 2005 | | $ | 2,427 | |
IQ-Digital acquisition | | | 712 | |
Reduction in goodwill related to changes in estimated liabilities assumed in Campus Outfitters acquisition | | | (23 | ) |
Uniform goodwill impairment | | | (1,893 | ) |
IQ Digital goodwill impairment | | | (712 | ) |
| | | | |
Balance as of December 31, 2006 | | $ | 511 | |
Amortization expense related to the Company’s acquired intangible assets was approximately $0.9 million, $0.1 million and zero in fiscal 2006, 2005, and 2004, respectively, including approximately $0.7 million of impairment write-offs in fiscal 2006. Estimated aggregate future amortization expense for intangible assets remaining as of December 31, 2006 is as follows: (amounts in thousands):
| | | | | | | | | | | | | | | | | | | | | |
| | | 2007 | | 2008 | | 2009 | | 2010 | | 2011 | | Thereafter | | Total |
Amortization expense | | $ | 3 | | $ | 3 | | $ | 2 | | $ | — | | $ | — | | $ | — | | $ | 8 |
| | | | | | | | | | | | | | | | | | | | | |
11. COMMITMENTS AND CONTINGENCIES
LEASES
The Company’s headquarters is located at 1300 19th Street NW, Washington, D.C. The Company currently occupies approximately 92,000 square feet of office and warehouse space pursuant to leases that are month-to-month or are scheduled to expire between May 2007 and May 2015.
54
The Company entered into a Services and Management Agreement with SchoolOne.com LLC (“SchoolOne”) in which SchoolOne will develop the Company’s new technology and provide services and support for the Company’s processes and systems.
Rent expense under operating leases was approximately $1.3 million, $0.7 million and $0.2 million for the years ended December 31, 2006, 2005 and 2004, respectively. The remaining payments associated with the Company’s commitments are as follows:
| | | | | | | | | | | | | | | | | | | | | |
Contractual Obligations | | 2007 | | 2008 | | 2009 | | 2010 | | 2011 | | Thereafter | | Total |
Capital lease obligations | | $ | 18 | | $ | 5 | | $ | — | | $ | — | | $ | — | | $ | — | | $ | 23 |
SchoolOne | | $ | 1,040 | | $ | — | | $ | — | | $ | — | | $ | — | | $ | — | | $ | 1,040 |
Operating lease obligations | | $ | 1,537 | | $ | 1,337 | | $ | 1,213 | | $ | 802 | | $ | 398 | | $ | 738 | | $ | 6,025 |
| | | | | | | | | | | | | | | | | | | | | |
Total | | $ | 2,595 | | $ | 1,342 | | $ | 1,213 | | $ | 802 | | $ | 398 | | $ | 738 | | $ | 7,088 |
| | | | | | | | | | | | | | | | | | | | | |
LEGAL PROCEEDINGS
The Company is party to various legal proceedings and claims incidental to our business. Management does not believe that the resolution of any such matters that are pending as of the date of this report will have a material adverse effect on the results of operations or financial condition of our Company.
12. STOCKHOLDERS’ EQUITY
AUTHORIZED CAPITAL
At December 31, 2006, the Company was authorized to issue 20,000,000 shares of preferred stock, $.0001 par value per share, and 60,000,000 shares of common stock, $.0001 par value per share.
WARRANTS
During fiscal 1998 and fiscal 1999, in connection with the issuance of convertible promissory notes, the Company issued warrants to purchase 160,707 shares of the Company’s common stock. No warrants associated with these grants were exercised prior to fiscal 2003. During fiscal 2003, warrants to purchase 82,547 shares of the Company’s common stock were exercised. During fiscal 2005, warrants to purchase 10,145 shares of the Company’s common stock were exercised.
During fiscal 1998 and fiscal 1999, the Company issued warrants to B&T, its supplier of textbooks, to purchase up to 219,643 shares of common stock at exercise prices of $2.33, $0.20 and $0.22 per share. No warrants associated with these grants were exercised prior to fiscal 2003. During fiscal 2003, warrants to purchase 52,251 shares of the Company’s common stock were exercised and 104,892 warrants were either cancelled or expired without being exercised. The 62,500 warrants that remained outstanding as of December 31, 2003 were exercised in February 2004.
During fiscal 2000, in connection with a line of credit agreement that has since expired, the Company issued warrants to purchase 37,500 shares of its common stock at an exercise price of $10.00 per share. The 37,500 warrants outstanding as of December 31, 2004 expired in fiscal 2005.
During fiscal 2000, the Company issued warrants to a third party to purchase up to 50,000 shares of common stock at an exercise price of $1.06 per share in return for certain advisory and consulting services. The 25,000 warrants outstanding as of December 31, 2005, were exercised in the Company’s second quarter of fiscal 2006.
As of December 31, 2006, there were no outstanding warrants of the Company’s common stock.
TREASURY SHARES
In November 2004, the Company repurchased 83,334 shares of the Company’s common stock from an officer of the Company for approximately $0.5 million. The purchase price of the shares was $6.00 per share, representing a five
55
percent discount from the 30-day trailing average prior to the repurchase date. In October 2003, the Company repurchased 175,000 shares of the Company’s common stock from two officers of the Company for approximately $0.7 million. The purchase price of the shares was $3.765 per share, representing a five percent discount from the 30-day trailing average prior to the repurchase date. These transactions had no effect on the Company’s results of operations. As of December 31, 2006, the Company’s cumulative repurchases totaled 1,215,397 shares for approximately $1.7 million in cash.
13. STOCK-BASED COMPENSATION
On October 2, 1998, the Company adopted the 1998 Stock Plan, which was amended and restated in fiscal year 2000 and further amended in 2003, and under which incentive stock options, non-qualified stock options, restricted stock or stock rights, or any combination thereof may be granted to the Company’s employees and directors. There presently are 8.6 million shares authorized under the 1998 Stock Plan, subject to increase annually on the date of our annual meeting of stockholders by (i) three percent of the Company’s outstanding common stock on such date, (ii) 750,000 shares, or (iii) such lesser amount as the Company’s Board may determine. The Company has reserved an additional 1,272,000 shares of its common stock for future option grants. The Board of Directors, or a Committee appointed by the Board, administers the Plan and determines the individuals to whom options will be granted, the number of options granted, the exercise price and vesting schedule. Options are exercisable at prices established at the date of grant and have a term of ten years and vesting periods between one and 60 months. Vested options held at the date of termination may be exercised within three months. Shares issued under the plan upon option exercise or granting of restricted stock are generally issued from authorized but previously unissued shares. The Board of Directors may terminate the Plan at anytime.
Adoption of SFAS No. 123R
On January 1, 2006, the Company adopted the provisions of SFAS 123R, which establishes accounting for stock-based awards made to employees and directors. Accordingly, stock-based compensation expense is measured at grant date, based on the fair value of the award, and is recognized as expense over the remaining requisite service period. The Company previously applied APB Opinion No. 25, “Accounting for Stock Issued to Employees”, and related interpretations and provided the required pro forma disclosures of SFAS 123. The adoption of SFAS 123R resulted in stock-based compensation expense of approximately $725,000 for the year ended December 31, 2006. This stock-based compensation expense negatively impacted basic and diluted loss per share by approximately $0.04 per share for the year ended December 31, 2006.
On December 19, 2005, the Board of Directors, upon recommendation of the Compensation and Stock Option Committee, approved the immediate vesting of all unvested stock options with an exercise price greater than $4.10 per share held by certain current employees, including executive officers and members of the board of directors. The Board made the decision to immediately vest these options in part due to the issuance of SFAS 123(R). By vesting all previously unvested options, the stock-based compensation expense under SFAS 123 will only be reflected in the Company’s footnote disclosures.
The weighted-average fair value of options granted during the year ended December 31, 2006 was $1.89, compared to $2.37 and $3.20 for the years ended December 31, 2005 and 2004, respectively. There were 835,000 options granted during the year ended December 31, 2006. The fair value of each option is estimated on the date of grant using the Black-Scholes option-pricing model. The application of this valuation model involves assumptions that are highly subjective, judgmental and sensitive in the determination of compensation expense. The following weighted-average assumptions were used for grants during the year ended December 31:
| | | | | | | | | |
| | | Fiscal Years Ended December 31, | | | | |
| | | 2006 | | | 2005 | | | 2004 | |
Expected volatility | | 54.3 | % | | 50.0 | % | | 90 | % |
Risk-free rate | | 4.88 | % | | 3.63 | % | | 3.60 | % |
Expected term | | 6.1 years | | | 2 – 6 years | | | 2 – 6 years | |
Dividend yield | | 0.0 | % | | 0.0 | % | | 0.0 | % |
The Company’s computation of expected volatility for grants during the fiscal year ended December 31, 2006 is based on the historical volatility of the Company’s stock over a period generally commensurate with the expected term of the share option. The Company used the simplified method under SAB 107 to calculate the expected term for grants during the year ended December 31, 2006. The risk-free interest rate for periods corresponding to the expected term of the option is based on the U.S. Treasury yield curve in effect at the time of grant. The Company currently recognizes stock-
56
based compensation expense for the fair values of these awards on a straight-line basis over the requisite service period of each of these awards.
A summary of activity of all options is as follows (in thousands, except per share data and contractual term):
| | | | | | | | | | |
| | | Number
of Stock
Options | | | Weighted
Average
Exercise
Price | | Weighted
Average
Contractual
Term | | Aggregate
Intrinsic
Value |
Outstanding, December 31, 2005 | | 4,805 | | | 4.19 | | 7.02 | | $ | 6,112 |
Granted | | 835 | | | 3.38 | | | | | |
Exercised | | (1,066 | ) | | 0.67 | | | | | |
Forfeited | | (1,061 | ) | | 5.37 | | | | | |
| | | | | | | | | | |
Outstanding, December 31, 2006 | | 3,513 | | | 4.73 | | 7.00 | | $ | 392 |
| | | | | | | | | | |
Exercisable, December 31, 2006 | | 2,903 | | | 5.08 | | 6.46 | | $ | 319 |
| | | | | | | | | | |
The following table summarizes all stock options outstanding as of December 31, 2006:
| | | | | | | | | | | | |
| Options Outstanding | | Options Exercisable |
Range of
Exercise Prices | | Number of
Stock Options | | Weighted Average
Contractual Term | | Weighted Average
Exercise Price | | Number
Exercisable | | Weighted Average
Exercise Price |
| $0.34 - $1.79 | | 878,938 | | 6.9 | | $ | 1.33 | | 628,625 | | $ | 1.26 |
| $2.15 - $4.96 | | 953,339 | | 8.1 | | $ | 3.92 | | 593,824 | | $ | 3.77 |
| $5.00 - $8.00 | | 1,225,084 | | 7.7 | | $ | 5.83 | | 1,225,084 | | $ | 5.83 |
| $10.00 | | 455,633 | | 3.0 | | $ | 10.00 | | 455,633 | | $ | 10.00 |
The aggregate intrinsic value in the above table reflects the total pre-tax intrinsic value (the difference between the Company’s closing stock price on the last trading day of the period and the exercise price of the options, multiplied by the number of in-the-money stock options) that would have been received by the option holders had all option holders exercised their options on December 31, 2006. The intrinsic value of the Company’s stock options changes based on the closing price of the Company’s stock. The closing price per share of the Company’s common stock on December 31, 2006 was $1.77. The total intrinsic value of options exercised during the year ended December 31, 2006 was approximately $3.8 million. The intrinsic value is calculated as the difference between the market value as of the date of exercise and the exercise price of the shares.
As of December 31, 2006, unrecognized stock-based compensation expense related to stock options of approximately $1.0 million is expected to be recognized over a weighted-average period of 3.1 years.
Because of the Company’s net operating losses, the Company did not realize any tax benefits from the tax deductions from share-based payment arrangements during the fiscal year ended December 31, 2006.
Restricted Stock
As of December 31, 2005, there were no shares of restricted stock outstanding. The Company issued 300,000 shares of restricted stock awards to its former CEO during the three months ended March 31, 2006 that had a weighted average grant date fair value of $4.19 per share, amounting to total compensation expense over the life of the award of approximately $1.3 million. These awards vest over a four-year period and are amortized on a straight-line basis to compensation expense over the life of the vesting period. On November 16, 2006, the CEO resigned from the Company and in accordance with terms of a termination agreement, the original restricted stock awards were modified. Prior to the CEO’s resignation, 42,000 restricted stock awards vested for a total compensation expense of approximately $0.2 million. Per the termination agreement, 88,757 restricted shares vested immediately for an additional compensation expense of approximately $0.2 million and the remaining 169,242 shares were forfeited.
57
14. EARNINGS PER SHARE
Financial Accounting Standards Board Statement No. 128, “Earnings per Share” (“SFAS 128”) promulgates accounting standards for the computation and manner of presentation of the Company’s earnings per share data. Under SFAS 128, the Company is required to present basic and diluted earnings per share. Basic earnings per share is computed by dividing net income applicable to common stockholders by the weighted average number of common shares outstanding for the period. Diluted earnings per share reflects dilution that would occur if securities or other contracts to issue common stock were exercised or converted into common stock or resulted in the issuance of common stock that shared in the earnings of the Company. The 2006, 2005, and 2004, diluted earnings per share amounts exclude the effects of 3,513,000, 1,844,000, and 955,000 stock options outstanding, respectively, as their inclusion would be antidilutive.
The following table sets forth the computation of basic and diluted (loss) income per share (in thousands, except per share data):
| | | | | | | | | | |
| | | For the Fiscal Year Ended |
| | | 2006 | | | 2005 | | 2004 |
Numerator: | | | | | | | | | | |
Net (loss) income | | $ | (28,378 | ) | | $ | 12,129 | | $ | 6,881 |
| | | | | | | | | | |
Denominator: | | | | | | | | | | |
Denominator for basic income per share
Weighted average shares outstanding | | | 17,809 | | | | 16,947 | | | 16,715 |
Employee stock options and warrants | | | — | | | | 1,884 | | | 1,011 |
| | | | | | | | | | |
Denominator for diluted income per share | | | | | | | | | | |
Adjusted weighted average shares, assuming exercise of common equivalent shares | | | 17,809 | | | | 18,831 | | | 17,726 |
| | | | | | | | | | |
Basic net (loss) income per share | | $ | (1.59 | ) | | $ | 0.72 | | $ | 0.41 |
Diluted net (loss) income per share | | $ | (1.59 | ) | | $ | 0.64 | | $ | 0.39 |
15. INCOME TAXES
The income tax (benefit) expense for 2006, 2005 and 2004 consists of the following:
| | | | | | | | | | | | |
| | | For the Fiscal Year Ended | |
| | | 2006 | | | 2005 | | | 2004 | |
Current | | | | | | | | | | | | |
Federal | | $ | 30 | | | $ | 70 | | | $ | — | |
State | | | (24 | ) | | | 38 | | | | — | |
| | | | | | | | | | | | |
| | $ | 6 | | | $ | 108 | | | $ | — | |
| | | | | | | | | | | | |
Deferred | | | | | | | | | | | | |
Federal | | $ | 13,556 | | | $ | (7,890 | ) | | $ | (3,411 | ) |
State | | | 1,968 | | | | (1,732 | ) | | | (397 | ) |
| | | | | | | | | | | | |
| | $ | 15,524 | | | $ | (9,622 | ) | | $ | (3,808 | ) |
| | | | | | | | | | | | |
Total | | | | | | | | | | | | |
Federal | | $ | 13,586 | | | $ | (7,820 | ) | | $ | (3,411 | ) |
State | | | 1,944 | | | | (1,694 | ) | | | (397 | ) |
| | | | | | | | | | | | |
| | $ | 15,530 | | | $ | (9,514 | ) | | $ | (3,808 | ) |
| | | | | | | | | | | | |
The income tax benefit recognized differs from the expense at the maximum statutory Federal tax rate as follows:
| | | | | | | | | | | | |
| | | For the Fiscal Year Ended | |
| | | 2006 | | | 2005 | | | 2004 | |
Federal tax at maximum rate | | $ | (4,368 | ) | | $ | 889 | | | $ | 1,054 | |
State taxes, net of federal benefit | | | (636 | ) | | | 130 | | | | 123 | |
Permanent differences | | | 147 | | | | 21 | | | | 24 | |
Change in applicable state rate | | | — | | | | (598 | ) | | | — | |
Other | | | 4 | | | | 44 | | | | — | |
Change in the valuation allowance | | | 20,383 | | | | (10,000 | ) | | | (5,009 | ) |
| | | | | | | | | | | | |
Tax benefit | | $ | 15,530 | | | $ | (9,514 | ) | | $ | (3,808 | ) |
| | | | | | | | | | | | |
58
Deferred income taxes reflect the net tax effects of temporary differences between the carrying amounts of assets and liabilities for financial reporting purposes and the amounts used for income tax purposes. Significant components of the Company’s deferred tax assets and liabilities are as follows at December 31 (in thousands):
| | | | | | | | |
| | | For the Fiscal Year
Ended | |
| | | 2006 | | | 2005 | |
Current deferred tax assets: | | | | | | | | |
Inventory | | $ | 942 | | | $ | 431 | |
Allowance for accounts receivables | | | 105 | | | | 34 | |
Prepaid expenses | | | (36 | ) | | | (47 | ) |
Accrued expenses | | | 95 | | | | 112 | |
Non-cash compensation | | | 43 | | | | — | |
| | | | | | | | |
Total current deferred tax assets | | | 1,149 | | | | 530 | |
Valuation allowance | | | (1,149 | ) | | | (163 | ) |
| | | | | | | | |
Net current deferred tax asset | | $ | — | | | $ | 367 | |
Long-term deferred tax asset | | | | | | | | |
Net operating loss /other carryforwards | | $ | 25,353 | | | $ | 22,309 | |
ATM credit carryforward | | | 61 | | | | 70 | |
Intangible amortization | | | 1,374 | | | | — | |
Depreciation and amortization | | | (640 | ) | | | (471 | ) |
| | | | | | | | |
Total long-term deferred tax assets | | | 26,148 | | | | 21,908 | |
Valuation allowance | | | (26,148 | ) | | | (6,751 | ) |
| | | | | | | | |
Net long-term deferred tax asset | | | — | | | | 15,157 | |
| | | | | | | | |
Total deferred tax asset | | $ | — | | | $ | 15,524 | |
| | | | | | | | |
At December 31, 2006 and 2005, the Company had net operating loss carryforwards of approximately $68.9 million and $57.3 million, respectively, related to federal and state jurisdictions. We excluded $3.8 million of the $68.9 million U.S. net operating loss carryforwards from the calculation of the deferred tax asset above because it represents excess stock option deductions that did not reduce taxes payable. These unrealized excess stock option deductions, if realized in the future, will result in an increase to paid-in capital. These net operating loss carryforwards will begin to expire at various times beginning in 2019. For federal and state tax purposes, a portion of the Company’s net operating loss may be subject to significant limitations on annual utilization by virtue of changes in ownership, as defined by federal and state tax laws.
At December 31, 2006 and 2005, the Company had Alternative Minimum Tax (“AMT”) credit carryforwards of approximately $0.1 million and $0.1 million, respectively. These credits do not expire and will be available to reduce future Federal income tax liabilities.
The Company accounts for income taxes in accordance with Statement of Financial Accounting Standards No. 109 (“SFAS 109,”) “Accounting for Income Taxes.” Under SFAS No. 109, deferred tax assets and liabilities are determined based on differences between the financial reporting and tax basis of assets and liabilities and are measured using the enacted tax rates and laws that will be in effect when the differences are expected to reverse. A valuation allowance is established when necessary to reduce deferred tax assets to the amount expected to be realized. In determining the need for a valuation allowance, our management reviews both positive and negative evidence pursuant to the requirements of SFAS No. 109, including current and historical results of operations, the annual limitation on utilization of net operating loss carry forwards pursuant to Internal Revenue Code section 382, future income projections and the overall prospects of our business. Based upon management’s assessment of all available evidence at the time, we concluded in our fourth quarter of fiscal 2003 and again in our second and third quarters of 2004 and 2005 that it was more likely than not that a portion of the recorded deferred tax benefits would be realized. Based upon management’s assessment of all current available evidence, including the current year operating loss, we have concluded that none of the deferred tax benefits should be recognized at this time. Consequently in 2006, we have reversed any tax benefit recorded in 2003 through 2005. We will continue to monitor all available evidence and reassess the potential realization of our deferred tax assets. Approximately $1.9 million of the valuation allowance relates to net operating losses resulting from
59
stock option windfall benefits, e.g. disqualifying dispositions. Reductions in the valuation allowance for those assets will result in an increase to additional paid-in capital after the valuation allowance related to all other deferred tax assets amounts have been reduced.
Paragraph 81 of FASB Statement 123R provides that for purposes of calculating the pool of excess tax benefits (“APIC pool”), the Company should include the net excess tax benefits that would have qualified had the Company adopted FASB 123R from inception. The FASB issued FSP 123(R)-3, which provides an alternative transition method to calculate the beginning pool of excess tax benefits. The Company is electing to adopt the alternative transition method (“short cut method”) in calculating their historical APIC pool of windfall tax benefits in regards to its stock based compensation.
16: BUSINESS SEGMENTS.
Prior to its acquisition of Campus Outfitters in May 2005, the Company was primarily an Internet retailer of textbooks and educational materials targeting private middle and high schools, small colleges and distance and continuing education markets. The Company’s chief operating decision maker reviewed financial information presented on a consolidated basis. Accordingly, the Company considered itself to be in a single industry segment. In May 2005, the Company added a second product line with its acquisition of Campus Outfitters, a provider of uniform apparel needs to schools and businesses. Accordingly, the Company’s operations during fiscal 2006 were aggregated into two reportable business segments: textbooks and uniforms.
The business segments reported below are the segments of the Company for which discrete financial information was available and for which the Company’s chief operating decision maker evaluated gross margins in fiscal 2006 and fiscal 2005. In fiscal 2004, the Company considered itself to be in a single industry segment – textbooks. (Amounts in thousands):
| | | | | | | | | | | | | | | | | | | | | | | | | | |
| | | Textbooks | | Uniforms | | Corporate / Other | | Total |
| | | 2006 | | 2005 | | 2006 | | | 2005 | | 2006 | | 2005 | | 2006 | | | 2005 |
Sales | | $ | 41,903 | | $ | 40,663 | | $ | 7,855 | | | $ | 5,768 | | $ | 308 | | $ | — | | $ | 50,066 | | | $ | 46,431 |
Product gross margin | | $ | 13,057 | | $ | 12,476 | | $ | 3,422 | | | $ | 3,123 | | $ | 122 | | $ | — | | $ | 16,601 | | | $ | 15,599 |
Shipping revenue | | $ | 3,778 | | $ | 3,638 | | $ | 62 | | | $ | — | | $ | — | | $ | — | | $ | 3,840 | | | $ | 3,638 |
Shipping gross margin | | $ | 136 | | $ | 770 | | $ | (291 | ) | | $ | — | | $ | — | | $ | — | | $ | (155 | ) | | $ | 770 |
Total sales | | $ | 45,681 | | $ | 44,301 | | $ | 7,917 | | | $ | 5,768 | | $ | 308 | | $ | — | | $ | 53,906 | | | $ | 50,069 |
Blended gross margin | | $ | 13,193 | | $ | 13,246 | | $ | 3,131 | | | $ | 3,123 | | $ | 122 | | $ | — | | $ | 16,446 | | | $ | 16,369 |
Goodwill | | $ | 511 | | $ | 511 | | $ | — | | | $ | 1,916 | | $ | — | | $ | — | | $ | 511 | | | $ | 2,427 |
Total assets | | $ | 11,468 | | $ | 11,348 | | $ | 4,815 | | | $ | 5,229 | | $ | 7,365 | | $ | 28,227 | | $ | 23,648 | | | $ | 44,804 |
17. RELATED PARTY TRANSACTION.
Connected with the acquisition of Campus Outfitters, the Company assumed the lease to the Campus Outfitters 16,800 square foot corporate headquarters building in College Park, MD which, up until July 2006, was owned by 5112 Berwyn LLC, a Maryland limited liability company whose controlling shareholders include Adam Hanin, the founder of Campus Outfitters and Executive Vice President of Sales of the Company until June 15, 2006. Under the terms of the lease, the Company is obligated to pay 5112 Berwyn LLC $18,000 a month through May 2015. In July 2006, 5112 Berwyn LLC sold the Campus Outfitters headquarters building to an unrelated party. The Company’s total related party payments in fiscal 2006 until the time of sale was $126,000. During fiscal 2005, total related party payments were $126,000.
18. SELECTED QUARTERLY FINANCIAL DATA (Unaudited)
The Company experiences significant seasonality in its results of operations. Consistent with the Company’s focus on the expansion of its eduPartners program and its current concentration of private middle and high school institutions,
60
since the year ended December 31, 2000, the Company’s peak selling period for textbooks has been the July/August/September back-to-school season. Historically, Campus Outfitters has experienced the same seasonality in its results of operations prior to our acquisition on May 26, 2005. Consistent with its current concentration of private elementary, middle and high schools, Campus Outfitters peak selling season has been the July/August/September back-to-school season. During fiscal 2006 and 2005, approximately 88% and 86% of the Company’s revenues, respectively, were recognized in this period.
In addition, during the third quarter of fiscal 2005 the Company released $10.0 million of its deferred tax asset valuation allowance when it deemed it was more likely than not that a portion of the recorded deferred tax benefits would be realized. During the third quarter of fiscal 2006, the Company recorded a non-cash charge of $18.0 million to increase the valuation allowance against net deferred tax assets. With this increase, the Company has a full valuation allowance against its net deferred tax assets. The effect of these two transactions increased net income by $10.0 million during the third quarter of fiscal 2005 and decreased net income by $18.0 million in the third quarter of fiscal 2006 (see Note 15.) During the fourth quarter of fiscal 2006, the Company recorded approximately $3.2 million of impairment charges to goodwill and other acquired intangibles (see Note 10), and an impairment charges to other long-lived assets of approximately $0.5 million related to the closure of its IQ-Digital office and termination of its LydiaLearn technology.
The following table presents summarized quarterly financial data (in thousands, except per share data):
| | | | | | | | | | | | | | | | |
| | | First
Quarter | | | Second
Quarter | | | Third
Quarter | | | Fourth
Quarter | |
Fiscal 2006 | | | | | | | | | | | | | | | | |
Net Sales | | $ | 2,221 | | | $ | 1,951 | | | $ | 47,165 | | | $ | 2,569 | |
(Loss) income from operations | | | (2,152 | ) | | | (4,074 | ) | | | 2,389 | | | | (9,255 | ) |
Income tax (expense) benefit | | | 873 | | | | 1,584 | | | | (18,031 | ) | | | 44 | |
Net loss | | | (1,160 | ) | | | (2,391 | ) | | | (15,602 | ) | | | (9,225 | ) |
Diluted loss per share | | $ | (0.07 | ) | | $ | (0.14 | ) | | $ | (0.86 | ) | | $ | (0.50 | ) |
Fiscal 2005 | | | | | | | | | | | | | | | | |
Net Sales | | $ | 2,344 | | | $ | 1,727 | | | $ | 43,037 | | | $ | 2,961 | |
(Loss) income from operations | | | (961 | ) | | | (1,422 | ) | | | 6,757 | | | | (2,226 | ) |
Income tax benefit | | | 308 | | | | 499 | | | | 7,311 | | | | 1,396 | |
Net (loss) income | | | (502 | ) | | | (815 | ) | | | 14,172 | | | | (726 | ) |
Diluted (loss) earnings per share | | $ | (0.03 | ) | | $ | (0.05 | ) | | $ | 0.80 | | | $ | (0.04 | ) |
19. SUBSEQUENT EVENTS
On March 8, 2007, the Company entered into a Revolving Line of Credit Loan Agreement and Security Agreement with Bank of America, N.A. (“BOA”) in which BOA will lend up to a maximum amount of $5 million to assist in funding the Company’s seasonal cash requirements. The Company may also issue letters of credit under the facility. Borrowing ceiling levels are established monthly utilizing a borrowing base formula based on percentages of month-end inventory, receivable and investment collateral values. A $2 million restricted cash investment is required to be maintained at all times as the investment collateral portion of the borrowing base. The facility is secured by substantially all of the Company’s assets. The agreement terminates on April 30, 2008.
61