

RGC RESOURCES IS SITTING FRONT AND CENTER, ENJOYING THE VIEW AS THE WORLD TURNS MORE AND MORE TO NATURAL GAS AS A PREFERRED FUEL. WE’RE SECURE IN OUR POSITION, POISED TO TAKE FULL ADVANTAGE OF THE INDUSTRY’S METAMORPHOSIS AS WE SERVE OUR LOCAL COMMUNITY’S NEEDS, STAKE OUR CLAIM AS A REGIONAL LEADER IN THE INCREASED USE OF NATURAL GAS, AND CELEBRATE THE RISING GLOBAL PERSPECTIVE OF NATURAL GAS AS THE MOST ECONOMICAL, ECOLOGICAL AND INCREASINGLY PLENTIFUL FUEL OF THE PRESENT AND FUTURE.
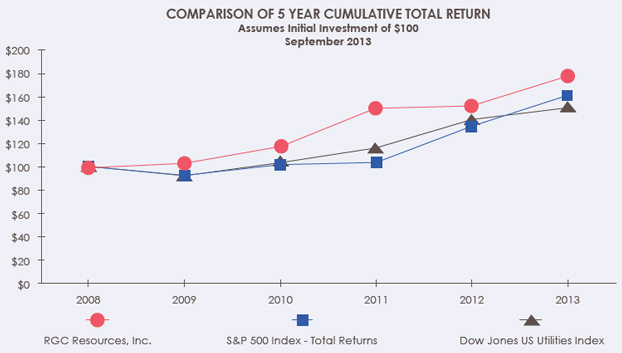
RGC CONTINUES TO GROW STRONG AND STEADY. OUR INVESTORS CONSISTENTLY SEE IMPRESSIVE DIVIDENDS AS STOCK PRICES RISE, FOLLOWING AN INDUSTRY TREND. HISTORICALLY LOW PRICES OF NATURAL GAS, COMBINED WITH A MULTITUDE OF ALTERNATIVE USES, ARE BOLSTERING THE DRAMATICALLY EMERGING POPULARITY OF THE CLEANER FUEL.
THE FUTURE FOR OUR INDUSTRY IS AS BRIGHT AND DYNAMIC AS THE BUTTERFLIES IN THEIR SPECTACULAR NEW HABITAT AT THE REVITALIZED CENTER IN THE SQUARE, A GREEN FACILITY IN DOWNTOWN ROANOKE ON TRACK TO BE LEED-CERTIFIED. IT’S REFLECTIVE OF A NEW DAY IN ROANOKE, STANDING AS OUR CITY’S OWN MICROCOSM OF POSITIVE CHANGE HAPPENING WORLDWIDE.
FROM GENERATING ELECTRICITY ON A GLOBAL SCALE TO HEATING HOMES AROUND ROANOKE, NATURAL GAS HAS GROWN INTO A MAJOR PLAYER, AND IT’S HERE TO STAY. AT RGC, NATURAL GAS IS ENSURING OUR FUTURE.

| | |
| RGC RESOURCES | ANNUAL REPORT 2013 | | 1 |


THE WORLD LOOKS TO NATURAL GAS
GLOBAL DEMAND FOR NATURAL GAS IS ON THE RISE, AND THE UNITED STATES IS READY TO ANSWER THE CALL WITH SUPPLIES MADE SUDDENLY ABUNDANT THROUGH UNCONVENTIONAL RESOURCES. FORTUNATELY FOR RGC, ONE OF THE MOST IMPRESSIVE SITES FOR SHALE GAS PRODUCTION IS THE APPALACHIAN BASIN’S HUGE MARCELLUS SHALE FORMATION. THE MARCELLUS IS ONE OF THE LARGEST NATURAL GAS FIELDS IN THE WORLD, ENRICHING US WITH VAST, INEXPENSIVE SUPPLIES CLOSE TO HOME. IN A DRAMATIC TURNAROUND, DEVELOPMENT OF THESE UNCONVENTIONAL RESOURCES IS EXPECTED TO MAKE THE UNITED STATES A NET EXPORTER IN YEARS TO COME. AND THE WORLD IS READY FOR IT — NATURAL GAS’ APPLICATIONS ARE MANY, FROM HEATING AND COOLING HOMES TO CHEMICAL PRODUCTION ESSENTIAL IN THE MANUFACTURE OF EVERYDAY ITEMS INCLUDING CLOTHING, CARPET, ELECTRONICS, FURNITURE AND FERTILIZER. LOW PRICES AND SUPPLY SURPLUSES ARE BRINGING INVESTMENT INTO THE UNITED STATES AS WELL, AS FOREIGN COMPANIES EXPAND THEIR PLANTS AND INDUSTRIAL PROJECTS.

| | |
| RGC RESOURCES | ANNUAL REPORT 2013 | | 3 |
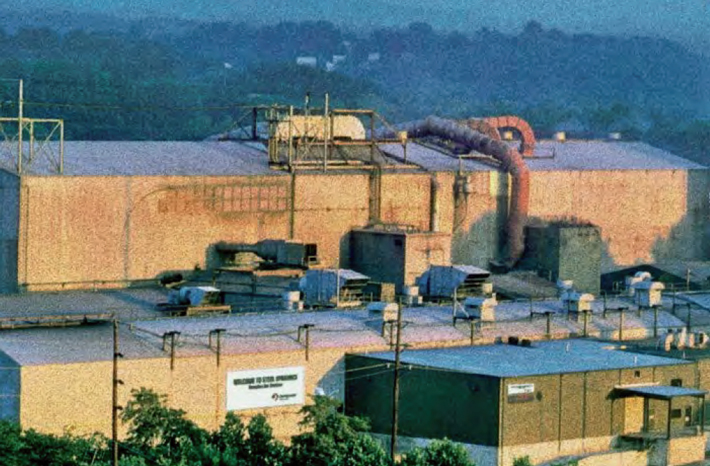
AS THE NATION SHIFTS, SO DOES THE SOUTHEAST
U.S. COMPANIES ARE BUILDING AND ADAPTING TO TAKE ADVANTAGE OF NATURAL GAS — ESPECIALLY IN THE SOUTHEAST, WHERE GAS IS BECOMING MORE USEFUL FOR POWER GENERATION. MANUFACTURERS ARE INCREASINGLY EXPANDING THEIR GAS USE IN PRODUCTION. AT STEEL DYNAMICS, RGC’S LARGEST INDUSTRIAL CUSTOMER, NATURAL GAS IS USED TO EXPEDITE THE MELTING PROCESS, REDUCING MELT TIMES AND IMPROVING OVERALL EFFICIENCY. IMPROVED EFFICIENCIES TRANSLATE TO REDUCED COSTS AND A STRONGER COMPETITIVE POSITION IN THE GLOBAL MARKETPLACE. ON THE ECONOMY FRONT, THE BOOM IN NATURAL GAS PRODUCTION HAS LED TO ECONOMIC GROWTH AND JOB CREATION. AND WHAT’S GOOD FOR THIS REGION AND THIS NATION IS GOOD FOR THE PLANET: BURNING NATURAL GAS PRODUCES ABOUT HALF THE CARBON EMISSIONS AS DOES BURNING COAL. AMONG OTHER APPLICATIONS, NATURAL GAS IS BEING USED AS AN ENVIRONMENTALLY FRIENDLY ALTERNATIVE TO POWER VEHICLES AS PRIVATE COMPANIES AND SOME LOCAL GOVERNMENTS CONVERT VEHICLES TO NATURAL GAS.

| | |
| 4 | | RGC RESOURCES | ANNUAL REPORT 2013 |
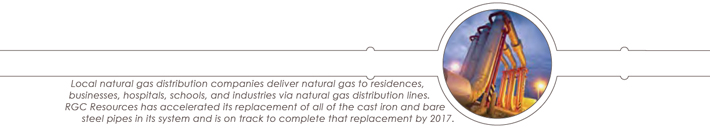
We continue to aggressively modernize our distribution system through the
replacement of cast iron and bare steel pipeline with plastic or coated steel pipe.
We invested more than $10 million in capital improvements in 2013.
a period of high prices and long-term natural gas supply concerns to what now appears to be a future of supply abundance and relative price stability. Natural gas in America is truly helping to ensure our future. With appropriate and reasonable regulatory policy, natural gas should improve the competitiveness of the nation’s manufacturing sector and enhance economic opportunity.
We continue to aggressively modernize our distribution system through the replacement of cast iron and bare steel pipeline with plastic or coated steel pipe. We invested more than $10 million in capital improvements in 2013. After 20 years of a steady replacement program, we approximately doubled our prior annual replacement efforts starting in 2012. We plan to invest approximately $13 million in capital improvements in 2014 and anticipate replacing all remaining cast iron and bare steel pipe by 2017. We also will upgrade some
crucial equipment at our liquefied natural gas facility, which is used to ensure adequate gas supply on extremely cold days.
The new-home construction market remains weak compared with pre-2008 levels. However, we are experiencing modest customer growth, including conversion to natural gas of homes previously heated with fuel oil or electricity. Industrial deliveries remained steady in 2013. While always difficult to predict, we anticipate similar activity in 2014, assuming the U.S. economy does not dip back into recession.
We continue to be active in regulatory filings with the Virginia State Corporation Commission to ensure timely cost recovery. We filed a rate case in September 2013 to recover the added cost of 2013 investment in capital improvements, along with increased depreciation and operating expense. We filed for an amendment to a separate regulatory plan designed to recover

| | |
| RGC RESOURCES | ANNUAL REPORT 2013 | | 5 |

We announced a management succession plan in 2013. John D’Orazio was
appointed President and CEO of Roanoke Gas Company, our largest and primary
subsidiary, while John Williamson continued as Chairman, President and CEO
of RGC Resources, Inc., on a part-time basis.
the increased cost and depreciation expense associated with future planned pipeline replacement through 2018, modernization of our liquefied natural gas facility in 2014, and replacement of one of our gas transfer stations on the interstate pipeline system.
We announced a management succession plan in 2013. John D’Orazio was appointed President and CEO of Roanoke Gas Company, our largest and primary subsidiary, while John Williamson continued as Chairman, President and CEO of RGC Resources, Inc., on a part-time basis. The Board of Directors’ approved succession plan is progressing nicely and Mr. Williamson is expected to step down as President and CEO of RGC Resources following the shareholder meeting in February 2014. Under the provisions of the succession plan, Mr. D’Orazio will become President and CEO of RGC Resources at that time. Mr. Williamson is expected to
remain as Chairman and to be available in an advisory capacity when needed.
On behalf of our employees and the Board of Directors, we thank you for your interest in our operations and your continuing decision to own RGC Resources stock. We are pleased to be part of an exciting new era for natural gas in America, and continue to believe it is in the long-term interest of our shareholders to invest in the natural gas distribution business and the Roanoke, Va., region.
| | |
| Sincerely, | | |
 | | |
| John B. Williamson, III | | |
| Chairman, President & CEO - RGC Resources, Inc. | | |
| |  |
 | | |
| John S. D’Orazio | | |
| President & CEO -Roanoke Gas Company | | |

| | |
| 6 | | RGC RESOURCES | ANNUAL REPORT 2013 |

HERE AT HOME, GREEN INITIATIVES TAKE FLIGHT
GREEN CONSTRUCTION HAS EMERGED AS A THING OF BEAUTY IN DOWNTOWN ROANOKE. FOR ITS ENERGY EFFICIENCY AND FORWARD FOCUS, WE AT RGC SALUTE THE NEWLY REVITALIZED CENTER IN THE SQUARE. IT’S A PHENOMENAL SPACE CONCEIVED AS A “LIVING” FACILITY WHERE BUTTERFLIES CAPTURE THE SPIRIT OF SUSTAINABLE LIVING AS PART OF THE SCIENCE MUSEUM OF WESTERN VIRGINIA. BUTTERFLIES RULE INSIDE THE FACILITY, FROM THE CREATURES FLUTTERING FREELY ON THE FIFTH FLOOR TO THE 66-FOOT BUTTERFLY DESIGN INLAID INTO THE LOBBY FLOOR BELOW. CENTER IN THE SQUARE’S REDESIGN IS ONE OF INTERCONNECTIVITY, FILLED WITH MUSEUMS AND EDUCATIONAL EXHIBITS. A LIVING CORAL REEF AQUARIUM IS FULL OF TROPICAL FISH, AND OTHER AQUARIUMS ARE HOME TO JELLYFISH, SEAHORSES, FRESHWATER FISH AND TURTLES. ON THE ROOFTOP, A KOI AND GOLDFISH POND COMPLEMENTS ATTRACTIVE VEGETATION IRRIGATED BY RAINWATER. THE ROOFTOP PAVILION ALSO FEATURES A GLASS DOME ALLOWING VISITORS TO LOOK DOWN INTO THE BUTTERFLY HABITAT. CENTER IN THE SQUARE IS DESIGNED AS A CUTTING-EDGE, ENERGY-EFFICIENT FACILITY ABLE TO GROW WITH TECHNOLOGICAL ADVANCES IN THE FUTURE.
| | |
| RGC RESOURCES | ANNUAL REPORT 2013 | | 7 |


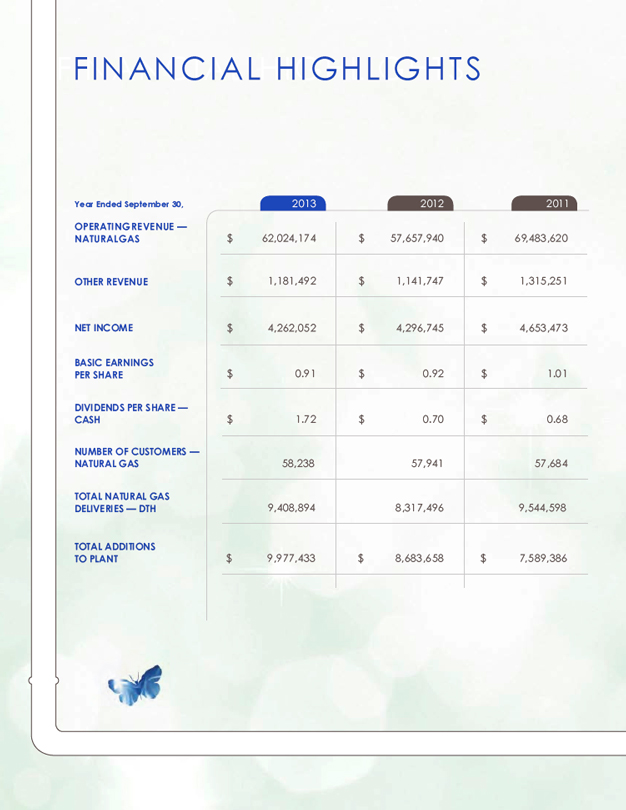
SELECTED FINANCIAL DATA
| | | | | | | | | | | | | | | | | | | | |
Years Ended September 30, | | 2013 | | | 2012 | | | 2011 | | | 2010 | | | 2009 | |
OPERATING REVENUES | | $ | 63,205,666 | | | $ | 58,799,687 | | | $ | 70,798,871 | | | $ | 73,823,914 | | | $ | 82,184,473 | |
GROSS MARGIN | | | 27,602,891 | | | | 26,933,097 | | | | 27,269,566 | | | | 26,440,273 | | | | 27,075,924 | |
OPERATING INCOME | | | 8,795,055 | | | | 8,786,535 | | | | 9,313,046 | | | | 8,982,181 | | | | 9,844,516 | |
NET INCOME | | | 4,262,052 | | | | 4,296,745 | | | | 4,653,473 | | | | 4,445,436 | | | | 4,869,010 | |
BASIC EARNINGS PER SHARE | | $ | 0.91 | | | $ | 0.92 | | | $ | 1.01 | | | $ | 0.98 | | | $ | 1.09 | |
CASH DIVIDENDS DECLARED PER SHARE | | | 1.72 | | | | 0.70 | | | | 0.68 | | | | 0.66 | | | | 0.64 | |
BOOK VALUE PER SHARE | | | 10.51 | | | | 10.85 | | | | 10.55 | | | | 10.18 | | | | 10.00 | |
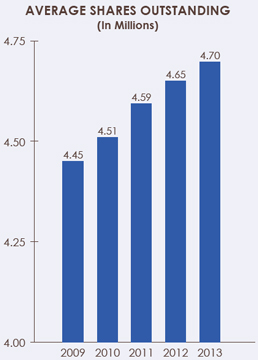
AVERAGE SHARES OUTSTANDING | | | 4,698,727 | | | | 4,647,439 | | | | 4,592,713 | | | | 4,514,262 | | | | 4,447,454 | |
TOTAL ASSETS | | $ | 124,526,701 | | | $ | 129,756,338 | | | $ | 125,549,049 | | | $ | 120,683,316 | | | $ | 118,801,892 | |
LONG-TERM DEBT (Less Current Portion) | | | 13,000,000 | | | | 13,000,000 | | | | 13,000,000 | | | | 28,000,000 | | | | 28,000,000 | |
STOCKHOLDERS’ EQUITY | | | 49,502,422 | | | | 50,682,930 | | | | 48,785,778 | | | | 46,309,747 | | | | 44,799,871 | |
SHARES OUTSTANDING AT SEPT. 30 | | | 4,709,326 | | | | 4,670,567 | | | | 4,624,682 | | | | 4,548,864 | | | | 4,477,974 | |
| | |
| 10 | | RGC RESOURCES | ANNUAL REPORT 2013 |
FORWARD-LOOKING STATEMENTS
This report contains forward-looking statements that relate to future transactions, events or expectations. In addition, RGC Resources, Inc. (“Resources” or the “Company”) may publish forward-looking statements relating to such matters as anticipated financial performance, business prospects, technological developments, new products, research and development activities and similar matters. These statements are based on management’s current expectations and information available at the time of such statements and are believed to be reasonable and are made in good faith. The Private Securities Litigation Reform Act of 1995 provides a safe harbor for forward-looking statements. In order to comply with the terms of the safe harbor, the Company notes that a variety of factors could cause the Company’s actual results and experience to differ materially from the anticipated results or expectations expressed in the Company’s forward-looking statements. The risks and uncertainties that may affect the operations, performance, development and results of the Company’s business include, but are not limited to those set forth in the
following discussion and within Item 1A “Risk Factors” of this Annual Report on Form 10-K. All of these factors are difficult to predict and many are beyond the Company’s control. Accordingly, while the Company believes its forward-looking statements to be reasonable, there can be no assurance that they will approximate actual experience or that the expectations derived from them will be realized. When used in the Company’s documents or news releases, the words “anticipate,” “believe,” “intend,” “plan,” “estimate,” “expect,” “objective,” “projection,” “forecast,” “budget,” “assume,” “indicate” or similar words or future or conditional verbs such as “will,” “would,” “should,” “can,” “could” or “may” are intended to identify forward-looking statements.
Forward-looking statements reflect the Company’s current expectations only as of the date they are made. The Company assumes no duty to update these statements should expectations change or actual results differ from current expectations except as required by applicable laws and regulations.
| | |
| RGC RESOURCES | ANNUAL REPORT 2013 | | 11 |
MANAGEMENT’S DISCUSSION & ANALYSIS
OVERVIEW
Resources is an energy services company primarily engaged in the regulated sale and distribution of natural gas to approximately 58,200 residential, commercial and industrial customers in Roanoke, Virginia and the surrounding localities through its Roanoke Gas Company (“Roanoke Gas”) subsidiary. Resources also provides certain unregulated services through Roanoke Gas and utility consulting and information system services through RGC Ventures of Virginia, Inc., which operates as The Utility Consultants and Application Resources. The unregulated operations represent less than 3% of revenues and margins of Resources.
The utility operations of Roanoke Gas are regulated by the Virginia State Corporation Commission (“SCC”) which oversees the terms, conditions, and rates to be charged to customers for natural gas service, safety standards, extension of service, accounting and depreciation. The Company is also subject to federal regulation from the Department of Transportation in regard to the construction, operation, maintenance, safety and integrity of its transmission and distribution pipelines. The Federal Energy Regulatory Commission regulates the prices for the transportation and delivery of natural gas to the Company’s distribution system and underground storage services. The Company is also subject to other regulations which are not necessarily industry specific.
The Company is committed to the safe and reliable delivery of natural gas to its customers. Since 1991, the Company has placed an emphasis on the modernization of its distribution system through the renewal and replacement of its cast iron and bare steel natural gas distribution pipelines. With recent regulatory actions placing a greater focus on pipeline safety, the Company continues to focus its efforts on completing its renewal and replacement program. Management anticipates replacing all remaining cast iron and bare steel pipe within the next four years.
The Company is also dedicated to the safeguarding of its information technology systems. These systems contain confidential customer, vendor and employee information as well as important financial data. There is risk associated with the unauthorized access of this information with a malicious intent to corrupt data, cause operational disruptions, or compromise information. Management believes it has taken reasonable security measures to protect these systems from cyber security attacks and other types of breaches; however, there can be no guarantee that a breach will not occur. In the event of a breach, the Company is prepared to execute its Security Incident Response Plan to reduce the impact of the incident. The Company also maintains cyber-insurance coverage to mitigate financial implications resulting from a potential breach of confidential information.
| | |
| 12 | | RGC RESOURCES | ANNUAL REPORT 2013 |
The SCC authorizes the rates and fees that the Company charges its customers for regulated natural gas service. These rates are designed to provide the Company with the opportunity to recover its gas and non-gas expenses and to earn a reasonable rate of return for shareholders. The Company’s business is seasonal in nature and weather dependent as a majority of natural gas sales are for space heating during the winter season. Volatility in winter weather and the commodity price of natural gas can impact the effectiveness of the Company’s rates in recovering its costs and providing a reasonable rate of return for its shareholders. Over the past several years, the Company has implemented certain approved rate mechanisms that reduce some of the volatility in earnings associated with variations in winter weather and the cost of natural gas, including the weather normalization adjustment mechanism and inventory carrying cost revenue.
The weather normalization adjustment mechanism (“WNA”) is based on a weather measurement band around the most recent 30- year temperature average. Because the SCC authorizes billing rates for the utility operations
of Roanoke Gas based on normal weather, warmer than normal weather may result in the Company failing to earn its authorized rate of return. Therefore, the WNA provides the Company with a level of earnings protection when weather is significantly warmer than normal and provides its customers with price protection when the weather is significantly colder than normal. The WNA mechanism provides for a weather band of 3% above and below the 30-year average, whereby the Company would bill its customers for the lost margin (excluding gas costs) for the impact of weather that was more than 3% warmer than normal or refund customers the excess margin earned for weather that was more than 3% colder than normal. The annual WNA period extends from April to March. For the most recently completed WNA period ending in March 2013, total heating degree days fell within the 3% weather band and thereby did not trigger the WNA mechanism for the current WNA period. Weather during the corresponding WNA period in fiscal 2012 was approximately 22% warmer than the 30-year normal with 883 fewer heating degree days (an industry measure by which the average daily temperature falls below 65 degrees
| | |
| RGC RESOURCES | ANNUAL REPORT 2013 | | 13 |
Fahrenheit) compared to normal. As a result, the Company recorded approximately $1,747,000 in additional revenues to reflect the impact of the WNA in fiscal 2012 for the difference in margin not realized for warmer weather between 3% and 22% of the 30-year average. The Company did not record any WNA revenues during the WNA period in fiscal 2011 as total heating degree days were within the 3% weather band.
The Company also has an approved rate structure in place that mitigates the impact of financing costs of its natural gas inventory. Under this rate structure, Roanoke Gas recognizes revenue for the financing costs, or “carrying costs”, of its investment in natural gas inventory. The carrying cost revenue factor applied to inventory is based on the Company’s weighted-average cost of capital including interest rates on short-term and long-term debt and the Company’s authorized return on equity. During times of rising gas costs and rising inventory levels, the Company recognizes revenues to offset higher financing costs associated with higher inventory balances. Conversely, during times of decreasing gas costs and declining inventory balances, the Company recognizes less carrying cost revenue as financing costs are lower. Although the price of natural gas in storage at September 30, 2013 was higher than the price in storage at September 30, 2012, the average price of gas in storage during fiscal 2013 was $0.61 a decatherm or 14% lower than last year’s levels. Correspondingly, carrying cost revenues declined by $299,000 in fiscal 2013. After five years of decline, natural gas commodity prices appeared to have bottomed out in 2012 and have rebounded to a small degree. The cost of gas delivered into storage during the 2013 summer fill months was higher compared to the prior year,
resulting in the higher gas in storage balances at September 30, 2013. As a result, carrying cost revenues are expected to increase modestly during the next fiscal year.
Generally, as investment in natural gas inventory increases so does the level of borrowing under the Company’s line-of-credit. However, as the carrying cost factor used in determining carrying cost revenues is based on the Company’s weighted-average cost of capital, carrying cost revenues do not directly correspond with incremental short-term financing costs. Therefore, when inventory balances decline due to a reduction in commodity prices, net income will decline as carrying cost revenues decrease by a greater amount than short-term financing costs decrease. The inverse occurs when inventory costs increase.
The economic environment has a direct correlation with business and industrial production, customer growth and natural gas utilization. The local economy continues to show signs of modest improvement from the economic downturn that began in 2008, and industrial production activities and the related interruptible and transportation sales to support those activities have returned to pre-2008 levels. Although there are signs of improvement, residential construction and housing starts continue to remain below historical levels, thereby limiting new customer growth opportunities. If economic uncertainty continues, industrial activity and new customer growth could be negatively impacted. In addition to economic considerations, natural gas consumption continues to be impacted by technological improvements to heating equipment which improve efficiency and reduce energy usage.
| | |
| 14 | | RGC RESOURCES | ANNUAL REPORT 2013 |
RESULTSOF OPERATIONS
Fiscal Year 2013 Compared with Fiscal Year 2012
The table below reflects operating revenues, volume activity and heating degree-days.
Operating Revenues
| | | | | | | | | | | | | | | | |
Year Ended September 30, | | 2013 | | | 2012 | | | Increase | | | Percentage | |
Gas Utilities | | $ | 62,024,174 | | | $ | 57,657,940 | | | $ | 4,366,234 | | | | 8 | % |
Other | | | 1,181,492 | | | | 1,141,747 | | | | 39,745 | | | | 3 | % |
| | | | | | | | | | | | | | | | |
Total Operating Revenues | | $ | 63,205,666 | | | $ | 58,799,687 | | | $ | 4,405,979 | | | | 7 | % |
| | | | | | | | | | | | | | | | |
Delivered Volumes
| | | | | | | | | | | | | | | | |
Year Ended September 30, | | 2013 | | | 2012 | | | Increase/
(Decrease) | | | Percentage | |
Regulated Natural Gas (DTH) | | | | | | | | | | | | | | | | |
Residential and Commercial | | | 6,498,783 | | | | 5,335,836 | | | | 1,162,947 | | | | 22 | % |
Transportation and Interruptible | | | 2,910,111 | | | | 2,981,660 | | | | (71,549 | ) | | | -2 | % |
| | | | | | | | | | | | | | | | |
Total Delivered Volumes | | | 9,408,894 | | | | 8,317,496 | | | | 1,091,398 | | | | 13 | % |
| | | | | | | | | | | | | | | | |
Heating Degree Days (Unofficial) | | | 4,001 | | | | 3,189 | | | | 812 | | | | 25 | % |
Total gas utility operating revenues for the year ended September 30, 2013 increased by 7% from the year ended September 30, 2012. The increase in gas revenues is primarily attributable to a 22% increase in residential and commercial delivery volumes, partially offset by lower natural gas commodity prices during the winter heating season. The increase in delivered volumes was driven by the much colder winter heating season than the prior year, evidenced by the 25% increase
in heating degree days. The total heating degree days for 2013 approximated the 30-year average. Transportation and interruptible volumes, which are primarily driven by production activities rather than weather, declined by 2%. Other revenues increased by 3% due to the completion of a one-time project more than offsetting declines in the level of certain other contract services from last year.
| | |
| RGC RESOURCES | ANNUAL REPORT 2013 | | 15 |
The table below reflects gross margin.
Gross Margin
| | | | | | | | | | | | | | | | |
Year Ended September 30, | | 2013 | | | 2012 | | | Increase/
(Decrease) | | | Percentage | |
Gas Utility | | $ | 27,108,112 | | | $ | 26,379,767 | | | $ | 728,345 | | | | 3 | % |
Other | | | 494,779 | | | | 553,330 | | | | (58,551 | ) | | | -11 | % |
| | | | | | | | | | | | | | | | |
Total Gross Margin | | $ | 27,602,891 | | | $ | 26,933,097 | | | $ | 669,794 | | | | 2 | % |
| | | | | | | | | | | | | | | | |
Regulated natural gas margins from utility operations increased by 3% from the same period last year primarily as a result of significantly higher residential and commercial sales volumes, the implementation of a non-gas rate increase and the addition of the SAVE Plan rider. Residential and commercial volumes (which are strongly correlated to the weather) increased due to the much colder winter season. The higher margins generated by the increased residential and commercial volume was mostly offset by the $1,747,000 in WNA revenues recorded last year. The Company also implemented a non-gas rate increase effective November 1, 2012 and a SAVE Plan Rider beginning January 1, 2013. The non-gas rate increase was designed to provide approximately $650,000 in additional non-gas revenues annually. The implementation of the new rates in November accounted for approximately $254,000 of the $280,000 increase in customer base charges, a flat monthly fee billed to each natural gas customer, and $328,000 of the $2,344,000 additional volumetric revenue. The SAVE Plan Rider, as discussed in more detail under Regulatory Affairs below, provided an additional $169,000 in margin. Carrying cost revenues continued to decline with a $299,000 reduction due to lower average price of gas in storage during the current fiscal year as discussed above.
Other margins, consisting of non-utility related services, decreased by $58,551 due to a reduction in the services requested. Some of these non-utility services are subject to annual or semi-annual contract renewals and the level of activity under these contracts will fluctuate. If the Company is unable to continue renewing or extending the largest contracts, or if activity under these contracts continues to decline, margins from other revenues would be negatively impacted. The Company intends to continue to pursue these contracts where profitable; however, future continuation of some of these contracted services is uncertain.
The changes in the components of the gas utility margin are summarized below:
Net Utility Margin Increase
| | | | |
Customer Base Charge | | $ | 279,872 | |
Volumetric | | | 2,343,618 | |
SAVE Plan | | | 168,747 | |
WNA | | | (1,747,150 | ) |
Carrying Cost | | | (299,029 | ) |
Other | | | (17,713 | ) |
| | | | |
Total | | $ | 728,345 | |
| | | | |
| | |
| 16 | | RGC RESOURCES | ANNUAL REPORT 2013 |
Operations and Maintenance Expense –Operations and maintenance expenses increased by $305,906, or 2%, in fiscal 2013 compared with fiscal 2012 primarily due to higher labor costs, contracted services, bad debt expense, corporate insurance expense and stock option expense more than offsetting greater capitalization of Company overheads on construction projects and LNG (liquefied natural gas) production. Labor costs and contracted services increased by $453,000 primarily due to an increase in operations staffing, timing of leak surveys and pipeline right-of-way clearing, costs related to an SCC mandated meter installation inspection and remediation program, and network services support and training. Bad debt expense increased by approximately $74,000. Total bad debt expense was 0.13% of gross natural gas billings for the year and is consistent with the five-year average. Last year’s bad debt expense ratio was only 0.02%. This unusually low rate was due to much warmer weather and low gas prices, resulting in the lowest bad debt write-off in over twenty-five years. Corporate property and liability insurance increased by $126,000 due to a combination of higher premiums and increased general liability coverage limits. A similar increase in premiums is expected in fiscal 2014. The Company also recognized $85,000 in expense related to the granting of stock options. These were the first option grants since 2002. These higher costs were partially offset by greater capitalization of overheads due to a higher level of pipeline construction expenditures and increased LNG production. The Company continued to increase activity under its pipeline renewal program, with
total capital expenditures rising by more than $1.3 million over last year, resulting in a greater capitalization of overheads.
General Taxes –General taxes increased $114,066, or 8%, primarily due to higher property taxes associated with increases in utility property.
Depreciation – Depreciation expense increased by $241,302, or 6%, corresponding to the increase in utility plant investment.
Other Income (Expense) –Other expense, net, increased by $40,161 primarily due to the reduction in interest income related to the payoff of the ANGD note.
Interest Expense –Total interest expense remained virtually unchanged from last year as the Company only briefly accessed its line-of-credit during fiscal 2013.
Income Taxes –Income tax expense was nearly unchanged on slightly less pre-tax earnings. The effective tax rate for fiscal 2013 was 38.3% compared to 38.0% for 2012.
Net Income and Dividends –Net income for fiscal 2013 was $4,262,052 compared to $4,296,745 for fiscal 2012. Basic and diluted earnings per share were $0.91 in fiscal 2013 compared to $0.92 in fiscal 2012. Dividends declared per share of common stock were $1.72, which includes the one-time special dividend of $1.00 paid in December, in fiscal 2013 and $0.70 in fiscal 2012.
| | |
| RGC RESOURCES | ANNUAL REPORT 2013 | | 17 |
Fiscal Year 2012 Compared with Fiscal Year 2011
The table below reflects operating revenues, volume activity and heating degree-days.
Operating Revenues
| | | | | | | | | | | | | | | | |
Year Ended September 30, | | 2012 | | | 2011 | | | (Decrease) | | | Percentage | |
Gas Utilities | | $ | 57,657,940 | | | $ | 69,483,620 | | | $ | (11,825,680 | ) | | | -17 | % |
Other | | | 1,141,747 | | | | 1,315,251 | | | | (173,504 | ) | | | -13 | % |
| | | | | | | | | | | | | | | | |
Total Operating Revenues | | $ | 58,799,687 | | | $ | 70,798,871 | | | $ | (11,999,184 | ) | | | -17 | % |
| | | | | | | | | | | | | | | | |
Delivered Volumes
| | | | | | | | | | | | | | | | |
Year Ended September 30, | | 2012 | | | 2011 | | | Increase/
(Decrease) | | | Percentage | |
Regulated Natural Gas (DTH) | | | | | | | | | | | | | | | | |
Residential and Commercial | | | 5,335,836 | | | | 6,582,487 | | | | (1,246,651 | ) | | | -19 | % |
Transportation and Interruptible | | | 2,981,660 | | | | 2,962,111 | | | | 19,549 | | | | 1 | % |
| | | | | | | | | | | | | | | | |
Total Delivered Volumes | | | 8,317,496 | | | | 9,544,598 | | | | (1,227,102 | ) | | | -13 | % |
| | | | | | | | | | | | | | | | |
Heating Degree Days (Unofficial) | | | 3,189 | | | | 4,091 | | | | (902 | ) | | | -22 | % |
Total gas utility operating revenues for the year ended fiscal 2012 decreased by 17% from fiscal 2011 as total delivered volumes decreased by 13%. The decrease in gas revenues was due to significantly reduced natural gas sales attributed to a much warmer winter heating season combined with a continued downward trend in gas costs. Residential and commercial volumes declined by 19% compared to fiscal 2011 as total heating degree days during the period fell by 22%. A majority of residential and commercial sales volumes are dependent on weather and the significantly warmer winter resulted in a decrease in usage.
Transportation and interruptible volumes were nearly unchanged with a small increase of 1% with volumes returning to the pre-2008 levels. Natural gas commodity prices were approximately $3 a decatherm as of the end of September 2012 and were below $3 a decatherm for much of calendar 2012. For fiscal 2012, the average commodity price per unit cost of natural gas reflected in cost of sales decreased by 22% compared to the prior year while the average total price per unit (including pipeline demand fees) decreased by 11%. Other revenues declined by 13% due to the decline in the level of certain contract services.
| | |
| 18 | | RGC RESOURCES | ANNUAL REPORT 2013 |
The table below reflects gross margin.
Gross Margin
| | | | | | | | | | | | | | | | |
Year Ended September 30, | | 2012 | | | 2011 | | | (Decrease) | | | Percentage | |
Gas Utility | | $ | 26,379,767 | | | $ | 26,667,821 | | | $ | (288,054 | ) | | | -1 | % |
Other | | | 553,330 | | | | 601,745 | | | | (48,415 | ) | | | -8 | % |
| | | | | | | | | | | | | | | | |
Total Gross Margin | | $ | 26,933,097 | | | $ | 27,269,566 | | | $ | (336,469 | ) | | | -1 | % |
| | | | | | | | | | | | | | | | |
Regulated natural gas margins from utility operations decreased 1% from the same period last year primarily as a result of significantly less total natural gas deliveries. Much of the margin lost due to the reduction in volumes delivered was recovered through the triggering of the WNA mechanism during the period. The Company recorded approximately $1,747,000 in additional revenues during the period to mitigate the shortfall in volumetric sales activity attributable to the warmer winter season. The Company also implemented a non-gas base rate increase designed to provide approximately $235,000 in additional annual revenues based on normal weather. The rate increase in non-gas billing rates accounted for approximately $200,000 in higher margins with approximately $90,000 attributable to customer base charges, a flat monthly fee billed to each natural gas customer, with the remaining balance related to volumetric sales. The remaining increase in customer base charges was primarily attributable to a higher number of billed meter accounts related to the conversion of six apartment complexes from a single master meter for each building to individual meters for each apartment that occurred during fiscal 2011. Carrying cost revenues declined $159,000 due to the lower average price of gas in storage combined with lower inventory balances.
Other margins, consisting of non-utility related services, decreased by $48,415 due to a reduction in the level of certain contract services.
The changes in the components of the gas utility margin are summarized below:
Net Utility Margin Decrease
| | | | |
Customer Base Charge | | $ | 178,106 | |
Volumetric | | | (2,014,190 | ) |
WNA | | | 1,747,150 | |
Carrying Cost | | | (159,164 | ) |
Other | | | (39,956 | ) |
| | | | |
Total | | $ | (288,054 | ) |
| | | | |
Operations and Maintenance Expense –Operations and maintenance expenses decreased by $114,288, or 1%, in fiscal 2012 compared with fiscal 2011 primarily due to greater capitalization of Company labor and overheads on related construction projects and lower bad debt expense more than offsetting higher employee benefit costs. The Company increased activity under its pipeline renewal program resulting in total capital expenditures rising by more than $1 million, or 14%, over the prior year. As a result of higher
| | |
| RGC RESOURCES | ANNUAL REPORT 2013 | | 19 |
capital spending and increased employee costs, the Company capitalized approximately $385,000 more in related overheads. Employee benefit costs increased by approximately $294,000, which also contributed to the increase in capitalized overheads. The major components of the higher employee benefit costs related to increases in health insurance premiums and higher pension and post-retirement medical plan costs attributable to a decline in the discount rate used to measure the benefit liabilities and the underperformance of the plan assets in the prior year. Both components were used in determining fiscal 2012 expense. The Company also realized a $55,000 reduction in bad debt expense. The lower bad debt expense was primarily attributable to significantly reduced natural gas deliveries and lower natural gas prices contributing to lower customer billings and reduced delinquencies. The remaining difference in operation and maintenance expenses primarily resulted from a $62,000 increase in corporate insurance premiums and a variety of other minor expense variances.
General Taxes – General taxes increased $75,945, or 6%, primarily due to higher property taxes associated with increases in utility property partially offset by greater capitalization of payroll taxes.
Depreciation –Depreciation expense increased by $228,385, or 6%, corresponding to the increase in utility plant investment as part of the ongoing pipeline renewal program.
Other Income (Expense) –This line item moved from a net other income to a net other expense primarily due to reduction in investment earnings related to lower interest rates.
Interest Expense –Total interest expense for fiscal 2012 remained virtually unchanged from fiscal
2011 as total debt remained consistent between both years.
Income Taxes –Income tax expense decreased by $208,162, or 7%, from fiscal 2011 corresponding to a comparable decrease in pre-tax earnings. The effective tax rate for fiscal 2012 and 2011 was 38.0%.
Net Income and Dividends –Net income for fiscal 2012 was $4,296,745 compared to $4,653,473 for fiscal 2011. Basic and diluted earnings per share were $0.92 in fiscal 2012 compared to $1.01 in fiscal 2011. Dividends declared per share of common stock were $0.70 in fiscal 2012 and $0.68 in fiscal 2011.
ASSET MANAGEMENT
Roanoke Gas uses a third-party asset manager to manage its pipeline transportation, storage rights and gas supply inventories and deliveries. In return for being able to utilize the excess capacities of the transportation and storage rights, the third party pays Roanoke Gas a monthly utilization fee, which is used to reduce the cost of gas for customers. Under the provision of the asset management contract, the Company has an obligation to purchase its winter storage requirements during the spring and summer injection periods at the market price in place at the time of purchase. This commitment amounts to approximately 2,100,000 decatherms per year or approximately one-third of the Company’s total annual purchases. In addition to the storage purchase requirements, the Company generally purchases its monthly supply requirements from the asset manager based on market price. In October 2013, Roanoke Gas executed a new agreement with a new asset manager under terms similar to the expiring contract. The new agreement expires in March 2017.
| | |
| 20 | | RGC RESOURCES | ANNUAL REPORT 2013 |
CAPITAL RESOURCESAND LIQUIDITY
Due to the capital intensive nature of the utility business, as well as the related weather sensitivity, the Company’s primary capital needs are for the funding of its continuing construction program, the seasonal funding of its natural gas inventories and accounts receivables and payment of dividends. To meet these needs, the Company relies on its operating cash flows, line-of-credit
agreement, long-term debt and to a lesser extent, capital raised through the Company’s Dividend Reinvestment and Stock Purchase Plan (“DRIP”).
Cash and cash equivalents decreased by $6,063,647 in fiscal 2013 compared to an increase of $958,442 in fiscal 2012 and an increase of $1,205,799 in fiscal 2011. The following table summarizes the categories of sources and uses of cash:
Cash Flow Summary
| | | | | | | | | | | | |
Year Ended September 30, | | 2013 | | | 2012 | | | 2011 | |
Provided by operating activities | | $ | 10,037,070 | | | $ | 11,783,041 | | | $ | 10,683,344 | |
Used in investing activities | | | (9,947,510 | ) | | | (8,650,715 | ) | | | (7,589,102 | ) |
Used in financing activities | | | (6,153,207 | ) | | | (2,173,884 | ) | | | (1,888,443 | ) |
| | | | | | | | | | | | |
Increase (decrease) in cash and cash equivalents | | $ | (6,063,647 | ) | | $ | 958,442 | | | $ | 1,205,799 | |
| | | | | | | | | | | | |
As discussed below, a special $1.00 per share dividend was paid by the Company on December 17, 2012, resulting in additional cash used in financing activities of $4,675,337, of which $425,630 was returned to the Company under the DRIP Plan.
Cash Flows from Operating Activities:
The seasonal nature of the natural gas business causes operating cash flows to fluctuate significantly during the year as well as from year to year. Factors, including weather, energy prices, natural gas storage levels and customer collections, all contribute to working capital levels and related cash flows. Generally, operating cash flows are positive during the second and third quarters as a combination of earnings, declining storage gas levels and collections on customer accounts all contribute to higher cash levels. During the first and fourth quarters, operating cash flows generally decrease due to the combination of increases in natural gas storage levels and rising customer receivable balances.
Cash provided by operating activities was $10,037,070 in fiscal 2013, $11,783,041 in fiscal 2012 and $10,683,344 in fiscal 2011. Cash provided by operating activities declined from last year primarily as a result of an increase in cost of gas in storage partially offset by a current year over-collection on gas costs and the continued tax
| | |
| RGC RESOURCES | ANNUAL REPORT 2013 | | 21 |
deferral benefits of bonus depreciation. The cost of gas in storage had declined for the last few years as the commodity price of gas declined; however, when the Company began its fiscal 2013 summer storage program to refill the storage balances, the commodity price of gas was higher than the prior year resulting in higher storage balances by year-end. The average price of natural gas in storage was $4.08, $3.51, $4.92 and $5.26 as of September 30, 2013, 2012, 2011 and 2010, respectively. Fiscal 2012 had the biggest reduction in cost as the price of gas in storage declined by 29% which generated $3.4 million in cash while the higher injection prices during fiscal 2013 used a net $850,000 in cash. Cash provided by operations were positively impacted by the over-collection of gas costs. As provided under the provisions of the Company’s Purchased Gas Adjustment (“PGA”) clause, the Company is allowed to recover the actual cost of natural gas from its customers. Any amounts billed in excess of the actual cost are considered an over-collection of these costs and are reflected as a liability on the financial statements. Conversely, any actual costs incurred in excess of amounts billed are considered an under-collection of gas costs and are reflected as an asset on the financial statements. During fiscal 2013, the Company went from an under-collected position of $687,000 to an over-collected position of $1,027,000, which generated $1,714,000 in operating cash. During fiscal 2012, the Company had an operating use of cash of $1,043,000 as the Company went from an over-collected position to an under-collected position. In addition, 50% bonus depreciation for tax purposes was extended through December 31, 2013. As a result, the Company’s deferred income tax liability associated with its utility property increased by $1,700,000 in fiscal 2013 and more than $2,200,000 in fiscal 2012, thereby deferring payment of income taxes until future periods. The Company has approximately $16,600,000 in
deferred tax liabilities related to accelerated and bonus depreciation on its utility plant that will begin to reverse in 2014 or later, assuming bonus depreciation is not extended, resulting in additional cash outflows for payment of the deferred taxes.
Cash Flows Used in Investing Activities:
Investing activities are generally composed of expenditures under the Company’s construction program, which involves a combination of replacing aging bare steel and cast iron pipe with new plastic or coated steel pipe, making improvements to the LNG plant and, to a lesser extent, expansion of its natural gas system to meet the demands of customer growth. The Company’s expenditures related to its pipeline renewal program and other system and infrastructure improvements and expansion have continued to trend upward with nearly $10,000,000 spent in fiscal 2013 compared to $8,700,000 in fiscal 2012 and $7,600,000 in fiscal 2011. The Company renewed 13 miles of bare steel and cast iron natural gas distribution main and replaced 1,064 services in fiscal 2013. This compares to 15.8 miles of main and 1,429 services in fiscal 2012 and 8.9 miles of gas main and 720 services in fiscal 2011. Total costs related to the renewal program are higher this year even though the total mileage of mains and the number of services replaced were less than last year. As the renewal program has progressed, most of the less complex and more highly concentrated areas of the Company’s natural gas distribution system have been completed leaving the more difficult and smaller sections to be done. Completion of the remaining pipeline replacement will more than likely be at a higher per foot cost, as indicated by fiscal 2013 activity. RGC Resources is committed to the safe and reliable delivery of natural gas to its customers and, as a result, plans to commit the necessary resources to its pipeline renewal program with an expectation to replace all remaining cast
| | |
| 22 | | RGC RESOURCES | ANNUAL REPORT 2013 |
iron and bare steel pipe within the next four years. Depreciation provided approximately 47% of the current year’s capital expenditures compared to 51% for 2012 and 55% for 2011. In addition to the continuation of the pipeline renewal program in fiscal 2014, the Company is also planning two major projects, one at its LNG plant and the other at its Gala transfer station. These two projects are estimated to increase capital expenditures an additional $4.3 million over fiscal 2013. With future capital expenditures projected to remain at higher than historical levels, the Company expects additional corporate borrowing activity will be required.
Cash Flows Used in Financing Activities:
Financing activities generally consist of long-term and short-term borrowings and repayments, issuance of stock and the payment of dividends. As discussed above, the Company uses its line-of-credit arrangement to fund seasonal working capital and provide temporary financing for capital projects, as needed. For the first time since 2009, the Company accessed its line-of-credit during the winter months. Cash flows used in financing activities were $6,153,000 for fiscal 2013 compared to $2,174,000 for fiscal 2012 and $1,888,000 in fiscal 2011. The increase in cash used in financing activities was primarily due to the special $1.00 per share dividend paid by the Company on December 17, 2012. The special dividend totaled $4,675,337, of which $425,630 was returned to the Company under the DRIP Plan. The intent of the dividend was to distribute a portion of equity capital previously deployed and to allow for the realignment of the Company’s capital structure to be more in line with regulatory expectations. The Company’s consolidated capitalization, including the note payable, was 64.4% equity and 35.6% debt at September 30, 2012. As of September 30, 2013,
the consolidated capitalization only changed by 50 basis points to 63.9% equity and 36.1% debt. The decrease in the equity component would have been greater if not for the significant reduction in accumulated other comprehensive loss.
The remaining difference in cash used in financing activities related to the receipt for the pay-off of the balance on the two remaining notes offset by an increase in the regular annual dividend payment rate from $0.70 per share to $0.72 per share.
On March 31, 2013, the Company entered into a new line-of-credit agreement. This new agreement maintains the same terms and rates as provided for under the expired agreement. The interest rate is based on 30-day LIBOR plus 100 basis points and includes an availability fee of 15 basis points applied to the difference between the face amount of the note and the average outstanding balance during the period. The Company maintained the multi-tiered borrowing limits to accommodate
| | |
| RGC RESOURCES | ANNUAL REPORT 2013 | | 23 |
seasonal borrowing demands and minimize overall borrowing costs, with available limits ranging from $1,000,000 to $7,000,000 during the term of the agreement. The line-of-credit agreement will expire March 31, 2014, unless extended. The Company anticipates being able to extend or replace the line-of-credit upon expiration; however, there is no guarantee that the line-of-credit will be extended or replaced under the same or equivalent terms currently in place.
Also on March 31, 2013, the Company executed an unsecured term note in the amount of $15,000,000. This term note extends the maturity date of the original promissory note dated November 28, 2005. The term note, which has a maturity date of March 31, 2014, retains all other terms and conditions provided for in the original promissory note. The Company anticipates being able to renew this note on comparable terms as currently in place until such time the note
co-terminates with the corresponding interest rate swap on November 30, 2015.
As mentioned above, the Company accessed its line-of-credit facility for the first time in four years. The key factors behind the Company’s recent strong cash position have been declining commodity prices of natural gas and the availability of bonus depreciation deductions for tax purposes. With natural gas prices beginning to rise and the continued high levels of capital expenditures anticipated over the next few years, in addition to the anticipated expiration of bonus depreciation, the Company expects to increase utilization of its line-of-credit to provide funding for these cash needs.
OFF-BALANCE SHEET ARRANGEMENTS
The Company has no off-balance sheet arrangements as defined in Regulation S-K, Item 303(a)(4)(ii).
| | |
| 24 | | RGC RESOURCES | ANNUAL REPORT 2013 |
CONTRACTUAL OBLIGATIONSAND COMMITMENTS
The Company has incurred various contractual obligations and commitments in the normal
course of business. As of September 30, 2013, the estimated recorded and unrecorded obligations are as follows:
| | | | | | | | | | | | | | | | | | | | |
| | | Payments Due By Period | |
| | | Less Than
1 Year | | | 1-3
Years | | | 4-5
Years | | | After
5 Years | | | Total | |
RecordedContractual obligations: | | | | | | | | | | | | | | | | | | | | |
Long-Term Debt(1) | | $ | — | | | $ | 8,200,000 | | | $ | 3,200,000 | | | $ | 1,600,000 | | | $ | 13,000,000 | |
Short-Term Debt(2) | | | 15,000,000 | | | | — | | | | — | | | | — | | | | 15,000,000 | |
| | | | | | | | | | | | | | | | | | | | |
Total | | $ | 15,000,000 | | | $ | 8,200,000 | | | $ | 3,200,000 | | | $ | 1,600,000 | | | $ | 28,000,000 | |
| | | | | | | | | | | | | | | | | | | | |
| (1) | See Note 4 to the consolidated financial statements. |
| (2) | See Note 3 to the consolidated financial statements. |
| | | | | | | | | | | | | | | | | | | | |
| | | Payments Due By Period | |
| | | Less Than
1 Year | | | 1-3
Years | | | 4-5
Years | | | After
5 Years | | | Total | |
Unrecorded Contractual obligationsNOT reflected in consolidated balance sheets in accordance with U.S. GAAP: | | | | | | | | | | | | | | | | | | | | |
Pipeline and Storage Capacity(3) | | $ | 11,328,754 | | | $ | 20,765,336 | | | $ | 15,830,608 | | | $ | 7,574,341 | | | $ | 55,499,039 | |
Gas Supply(4) | | | — | | | | — | | | | — | | | | — | | | | — | |
Interest on Short-Term Debt(5) | | | 1,589,322 | | | | — | | | | — | | | | — | | | | 1,589,322 | |
Interest on Long-Term Debt(6) | | | 902,300 | | | | 1,236,524 | | | | 408,534 | | | | 20,427 | | | | 2,567,785 | |
Pension Plan Funding(7) | | | 500,000 | | | | 2,450,000 | | | | 2,400,000 | | | | — | | | | 5,350,000 | |
Other Obligations(8) | | | 93,997 | | | | 115,289 | | | | 29,178 | | | | — | | | | 238,464 | |
| | | | | | | | | | | | | | | | | | | | |
Total | | $ | 14,414,373 | | | $ | 24,567,149 | | | $ | 18,668,320 | | | $ | 7,594,768 | | | $ | 65,244,610 | |
| | | | | | | | | | | | | | | | | | | | |
| (3) | Recoverable through PGA process. |
| (4) | Volumetric obligation for the purchase of contracted decatherms of natural gas at market prices in effect at the time of purchase. See Note 9 to the consolidated financial statements. |
| (5) | Includes payments under the Swap agreement including the estimated settlement of the Swap assuming the corresponding note was not extended. The Company expects to extend this note until such time as the Swap matures. See Note 3 to the consolidated financial statements. |
| (6) | Includes payment under the Swap agreement. See Note 4 to the consolidated financial statements. |
| (7) | Estimated funding beyond five years is not available. See Note 6 to the consolidated financial statements. |
| (8) | Various lease, maintenance, equipment and service contracts. |
| | |
| RGC RESOURCES | ANNUAL REPORT 2013 | | 25 |
REGULATORY AFFAIRS
On November 1, 2012, the Company placed into effect new base rates, subject to refund, that would provide approximately $1,840,000 in additional non-gas revenues on an annual basis. On April 16, 2013, the SCC issued a final order granting a rate award of $649,639 in annual non-gas revenues based on a 9.75% authorized return on equity. In May 2013, the Company completed its refund of excess non-gas revenues collected for rates placed into effect on November 1, 2012 and the rates approved in the final order.
On August 16, 2013, the Company filed an application for a modification to the Company’s SAVE (Steps to Advance Virginia’s Energy) Plan and Rider. The original SAVE Plan and Rider were approved by the SCC through an order issued on August 29, 2012. The original SAVE Plan was designed to facilitate the accelerated replacement of aging natural gas infrastructure assets by providing a mechanism for the Company to recover the related depreciation and expenses and return on rate base of the additional capital investment without the filing of a formal application for an increase in non-gas base rates. Under the original filing, the SAVE Plan primarily covered replacement of the Company’s bare steel and cast iron natural gas distribution pipe. Under the modification, the Company is seeking to include two unique projects; the replacement of the boil-off compressor at the Company’s LNG plant and replacement of the natural gas transfer station located in Gala, VA in the 2014 SAVE Plan year. These replacements will enhance the safety and reliability of the Company’s gas distribution system.
On September 13, 2013, the Company filed a request for an expedited increase in rates with the SCC. The request was for an increase of
approximately $1,664,000 in annual non-gas revenues. As provided for under this expedited rate request, the Company was able to place the increased rates into effect for service rendered on and after November 1, 2013, subject to refund pending a final order by the SCC. The public hearing on the request for this rate increase is scheduled for March 25, 2014, with a final order expected after that date.
During 2011, the Company completed its Distribution Integrity Management Plan (“DIMP”) as required by federal regulations issued by the Pipeline and Hazardous Materials Safety Administration (PHMSA). Under these regulations, distribution operators are required to develop and implement a written DIMP plan that includes the following elements: (i) an operator must demonstrate an understanding of the gas distribution system, (ii) an operator must define the potential threats to the gas distribution pipeline and determine the relative probability of each threat (a risk based approach), (iii) an operator must determine and implement measures designed to reduce the risks of failure of its gas distribution system, (iv) an operator must develop and monitor performance measures to evaluate the effectiveness of its plan, and (v) an operator must continually re-evaluate threats and risks on its entire system and update its plan as necessary.
The Company had been proactive in the area of pipeline safety well before implementation of the DIMP regulations. Over the past 20 years, the Company has replaced much of its cast iron and bare steel pipe. As this pipe has been underground for well over 60 years, the leak potential from such pipe is much higher than the plastic or coated steel pipe currently being installed. The Company prioritized its replacement program using a risk-based evaluation that included leak
| | |
| 26 | | RGC RESOURCES | ANNUAL REPORT 2013 |
history, population density and other factors. The Company expects to replace the remaining pipe within the next four years.
The Company’s provision for depreciation is computed principally based on composite rates determined by depreciation studies. These depreciation studies are required to be performed on the regulated utility assets of Roanoke Gas Company every five years. The last depreciation study was completed and implemented in fiscal 2009. The Company is currently in the process of conducting a new depreciation study for submission to the SCC for approval. Once approved, any changes to the current depreciation rates will be implemented in fiscal 2014. The potential impact of the new depreciation study is not known at this time.
CRITICAL ACCOUNTING POLICIESAND ESTIMATES
The consolidated financial statements of Resources are prepared in accordance with accounting principles generally accepted in the United States of America. The amounts of assets, liabilities, revenues and expenses reported in the Company’s financial statements are affected by accounting policies, estimates and assumptions that are necessary to comply with generally accepted accounting principles. Estimates used in the financial statements are derived from prior experience, statistical analysis and professional judgments. Actual results may differ significantly from these estimates and assumptions.
The Company considers an estimate to be critical if it is material to the financial statements and requires assumptions to be made that were uncertain at the time the estimate was made and changes in the estimate are reasonably likely
to occur from period to period. The Company considers the following accounting policies and estimates to be critical.
Regulatory accounting –The Company’s regulated operations follow the accounting and reporting requirements of FASB ASC No. 980, Regulated Operations. The economic effects of regulation can result in a regulated company deferring costs that have been or are expected to be recovered from customers in a period different from the period in which the costs would be charged to expense by an unregulated enterprise. When this occurs, costs are deferred as assets in the consolidated balance sheet (regulatory assets) and recorded as expenses when such amounts are reflected in rates. Additionally, regulators can impose liabilities upon a regulated company for amounts previously collected from customers and for current collection in rates of costs that are expected to be incurred in the future (regulatory liabilities).
If, for any reason, the Company ceases to meet the criteria for application of regulatory accounting treatment for all or part of its operations, the Company would remove the applicable regulatory assets or liabilities from the balance sheet and include them in the consolidated statements of income and comprehensive income for the period in which the discontinuance occurred.
Revenue recognition –Regulated utility sales and transportation revenues are based upon rates approved by the SCC. The non-gas cost component of rates may not be changed without a formal rate increase application and corresponding authorization by the SCC in the form of a Commission order; however, the gas cost component of rates may be adjusted quarterly through the purchased gas adjustment (“PGA”)
| | |
| RGC RESOURCES | ANNUAL REPORT 2013 | | 27 |
mechanism with administrative approval from the SCC. When the Company files a request for a non-gas rate increase, the SCC may allow the Company to place such rates into effect subject to refund pending a final order. Under these circumstances, the Company estimates the amount of increase it anticipates will be approved based on the best available information.
The Company bills its regulated natural gas customers on a monthly cycle. The billing cycle for most customers does not coincide with the accounting periods used for financial reporting. The Company accrues estimated revenue for natural gas delivered to customers but not yet billed during the accounting period based on weather during the period and current and historical data. The financial statements include unbilled revenue of $1,056,253 and $951,301 as of September 30, 2013 and 2012, respectively.
Allowance for Doubtful Accounts –The Company evaluates the collectability of its accounts receivable balances based upon a variety of factors including loss history, level of delinquent account balances, collections on previously written off accounts and general economic climate.
Pension and Postretirement Benefits –The Company offers a defined benefit pension plan (“pension plan”) and a postretirement medical and life insurance plan (“postretirement plan”) to eligible employees. The expenses and liabilities associated with these plans, as disclosed in Note 6 to the consolidated financial statements, are based on numerous assumptions and factors, including provisions of the plans, employee demographics, contributions made to the plan, return on plan assets and various actuarial calculations, assumptions and accounting requirements. In regard to the pension plan, specific factors include assumptions
regarding the discount rate used in determining future benefit obligations, expected long-term rate of return on plan assets, compensation increases and life expectancies. Similarly, the postretirement medical plan also requires the estimation of many of the same factors as the pension plan in addition to assumptions regarding the rate of medical inflation and Medicare availability. Actual results may differ materially from the results expected from the actuarial assumptions due to changing economic conditions, differences in actual returns on plan assets, different rates of medical inflation, volatility in interest rates and changes in life expectancy. Such differences may result in a material impact on the amount of expense recorded in future periods or the value of the obligations on the balance sheet.
In selecting the discount rate to be used in determining the benefit liability, the Company evaluated the IRS yield curves and the Citigroup yield curves which incorporate the rates of return on high-quality, fixed-income investments that corresponded to the length and timing of benefit streams expected under both the pension plan and postretirement plan. The Company used a discount rate of 4.82% and 4.73% for valuing its pension benefit liability and postretirement plan liability at September 30, 2013, representing an increase of 0.76% and 0.78% in their respective rates from the prior year. The increase in the discount rates corresponded with similar increases in long-term interest rates. The 30-year Treasury rate increased from 2.82% to 3.69%. Likewise, the Moody’s Aaa and Moody’s Baa increased by 1.14% and 0.67%, respectively. The increase in discount rates for valuing the benefit liabilities nearly reversed the reduction in rates experienced in the prior fiscal year. The pension and postretirement plan liability discount rates dropped by 0.98% and 1.01% for the September 30, 2012 valuation from
| | |
| 28 | | RGC RESOURCES | ANNUAL REPORT 2013 |
those used for the September 30, 2011 valuation. The increase in the discount rates for both plans resulted in a significant reduction in the benefit obligation at September 30, 2013. In addition, both plans experienced better than expected returns on the related pension and postretirement assets. The
combination of the discount rate increase and the strong asset performance improved both plans’ funded status significantly and will result in lower pension and postretirement medical plan expense in fiscal 2014.
| | | | | | | | | | | | |
Funded Status – September 30, 2013 | | Pension | | | Postretirement | | | Total | |
Benefit obligation | | $ | 21,468,769 | | | $ | 13,028,628 | | | $ | 34,497,397 | |
Fair value of assets | | | 18,801,262 | | | | 10,114,062 | | | | 28,915,324 | |
| | | | | | | | | | | | |
Funded status | | $ | (2,667,507 | ) | | $ | (2,914,566 | ) | | $ | (5,582,073 | ) |
| | | | | | | | | | | | |
| | | |
Funded Status – September 30, 2012 | | Pension | | | Postretirement | | | Total | |
Benefit obligation | | $ | 23,570,451 | | | $ | 13,707,309 | | | $ | 37,277,760 | |
Fair value of assets | | | 16,063,381 | | | | 8,673,128 | | | | 24,736,509 | |
| | | | | | | | | | | | |
Funded status | | $ | (7,507,070 | ) | | $ | (5,034,181 | ) | | $ | (12,541,251 | ) |
| | | | | | | | | | | | |
The current economic environment makes it difficult to project interest rates and future investment returns. If the economy improves, long-term interest rates could continue to increase and reduce the benefit liabilities and investment returns could be higher. However, if the economy stagnates or declines, interest rates could drop again and lead to an increase in the benefit liabilities and investment returns could be lower. The Company also annually evaluates the returns on its targeted investment allocation model. The investment policy as of the measurement date in September reflected a targeted allocation of 60% equity and 40% fixed income on the pension plan and a targeted allocation of 50% equity and 50% fixed income for the postretirement plan. As a result of this evaluation, the Company set its
expected return on pension assets at 7.00% and postretirement assets at 4.92% (net of income taxes) for fiscal 2014. These rates represent a small reduction from the current year due to the lower expected returns from the fixed income portfolios resulting from a rising interest rate environment.
In early July 2012, the President of the United States signed into law the “Moving Ahead for Progress in the 21st Century Act” (MAP- 21), which provided funding relief for defined benefit pension plans. The requirements of the Employee Retirement Income Security Act of 1974 (ERISA) and the Pension Protection Act of 2006 (PPA) subject defined benefit plans to minimum funding rules. As a result, when interest rates are low, pension plan liabilities increase thereby
| | |
| RGC RESOURCES | ANNUAL REPORT 2013 | | 29 |
resulting in higher mandatory contributions to meet minimum funding obligations. The MAP-21 provides funding relief by allowing pension plans to adjust the interest rate used in determining funding requirements so that they are within 10% of the average of interest rates for the 25-year period preceding the current year for funding calculations for 2013 to within 30% for funding periods beginning in 2016. MAP-21 also provides for increases in the PBGC (Pension Benefit Guaranty Corporation) premiums paid by sponsors of pension plans to protect participants in the event of default by the employer. Although
MAP-21 allows the Company some short-term funding relief, management expects to continue to fund its pension plan at the greater of any minimum pension contribution requirement or its expense level for subsequent years. As a result, the Company expects to contribute approximately $500,000 to its pension plan and $500,000 to its postretirement plan in fiscal 2014. The Company will continue to evaluate its benefit plan funding levels in light of funding requirements and ongoing investment returns and make adjustments, as necessary, to avoid benefit restrictions.
The following schedule reflects the sensitivity of pension costs to changes in certain actuarial assumptions, assuming that the other components of the calculation remain constant.
| | | | | | | | | | | | |
Actuarial Assumption | | Change In
Assumption | | | Increase In
Pension Cost | | | Increase In Projected
Benefit Obligation | |
Discount rate | | | -0.25 | % | | $ | 71,000 | | | $ | 866,000 | |
Rate of return on plan assets | | | -0.25 | % | | | 27,000 | | | | N/A | |
Rate of increase in compensation | | | 0.25 | % | | | 47,000 | | | | 253,000 | |
The following schedule reflects the sensitivity of postretirement benefit costs from changes in certain actuarial assumptions, while the other components of the calculation remain constant.
| | | | | | | | | | | | |
Actuarial Assumption | | Change In
Assumption | | | Increase In
Postretirement
Benefit Cost | | | Increase In
Accumulated
Postretirement
Benefit Obligation | |
Discount rate | | | -0.25 | % | | $ | 23,000 | | | $ | 458,000 | |
Rate of return on plan assets | | | -0.25 | % | | | 25,000 | | | | N/A | |
Healthcare cost trend rate | | | 0.25 | % | | | 60,000 | | | | 478,000 | |
Derivatives –The Company may hedge certain risks incurred in its operation through the use of derivative instruments. The Company applies the requirements of FASB ASC No. 815,Derivatives and Hedging,which requires the recognition of derivative instruments as assets or liabilities in the Company’s balance sheet at fair value. In most instances, fair value is based upon quoted futures
prices for natural gas commodities and interest rate futures for interest rate swaps. Changes in the commodity and futures markets will impact the estimates of fair value in the future. Furthermore, the actual market value at the point of realization of the derivative may be significantly different from the values used in determining fair value in prior financial statements.
| | |
| 30 | | RGC RESOURCES | ANNUAL REPORT 2013 |
MARKET PRICEAND DIVIDEND INFORMATION
RGC Resources’ common stock is listed on the Nasdaq Global Market under the trading symbol RGCO. Payment of dividends is within the discretion of the Board of Directors and will depend on, among other factors, earnings, capital
requirements and the operating and financial condition of the Company. The Company’s long-term indebtedness contains restrictions on dividends based on cumulative net earnings and dividends previously paid.
| | | | | | | | | | | | |
| | | Range of Bid Prices | | | Cash Dividends | |
Fiscal Year Ended September 30, | | High | | | Low | | | Declared | |
2013 | | | | | | | | | | | | |
First Quarter | | $ | 19.72 | | | $ | 17.51 | | | $ | 0.180 | |
Second Quarter | | | 19.40 | | | | 17.96 | | | | 0.180 | |
Third Quarter | | | 21.94 | | | | 18.44 | | | | 0.180 | |
Fourth Quarter | | | 20.97 | | | | 17.86 | | | | 0.180 | |
Special Dividend | | | | | | | | | | | 1.000 | |
| | | |
2012 | | | | | | | | | | | | |
First Quarter | | $ | 19.19 | | | $ | 17.14 | | | $ | 0.175 | |
Second Quarter | | | 19.52 | | | | 17.03 | | | | 0.175 | |
Third Quarter | | | 18.88 | | | | 16.99 | | | | 0.175 | |
Fourth Quarter | | | 18.81 | | | | 17.49 | | | | 0.175 | |
CAPITALIZATION STATISTICS
| | | | | | | | | | | | | | | | | | | | |
Year Ended September 30, | | 2013 | | | 2012 | | | 2011 | | | 2010 | | | 2009 | |
COMMON STOCK: | | | | | | | | | | | | | | | | | | | | |
Shares Issued | | | 4,709,326 | | | | 4,670,567 | | | | 4,624,682 | | | | 4,548,864 | | | | 4,477,974 | |
Earnings Per Share | | | | | | | | | | | | | | | | | | | | |
Basic Earnings Per Share | | $ | 0.91 | | | $ | 0.92 | | | $ | 1.01 | | | $ | 0.98 | | | $ | 1.09 | |
Diluted Earnings Per Share | | $ | 0.91 | | | $ | 0.92 | | | $ | 1.01 | | | $ | 0.98 | | | $ | 1.09 | |
Dividends Paid Per Share (Cash) | | $ | 1.72 | | | $ | 0.70 | | | $ | 0.68 | | | $ | 0.66 | | | $ | 0.64 | |
Dividends Paid Out Ratio | | | 189.0 | % | | | 76.1 | % | | | 67.3 | % | | | 67.3 | % | | | 58.7 | % |
| | | | | | | | | | | | | | | | | | | | |
| | | | | |
CAPITALIZATION RATIOS: | | | | | | | | | | | | | | | | | | | | |
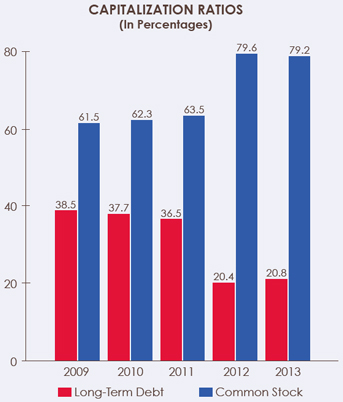
Long-Term Debt, Including Current Maturities | | | 20.8 | % | | | 20.4 | % | | | 36.5 | % | | | 37.7 | % | | | 38.5 | % |
Common Stock And Surplus | | | 79.2 | % | | | 79.6 | % | | | 63.5 | % | | | 62.3 | % | | | 61.5 | % |
| | | | | | | | | | | | | | | | | | | | |
Total | | | 100.0 | % | | | 100.0 | % | | | 100.0 | % | | | 100.0 | % | | | 100.0 | % |
| | | | | | | | | | | | | | | | | | | | |
Long-Term Debt, Including Current Maturities | | $ | 13,000,000 | | | $ | 13,000,000 | | | $ | 28,000,000 | | | $ | 28,000,000 | | | $ | 28,000,000 | |
Common Stock And Surplus | | | 49,502,422 | | | | 50,682,930 | | | | 48,785,778 | | | | 46,309,747 | | | | 44,799,871 | |
| | | | | | | | | | | | | | | | | | | | |
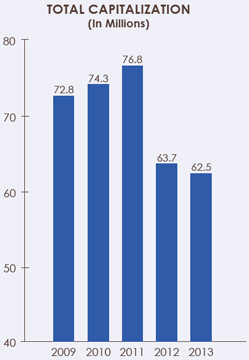
Total Capitalization Plus Current Maturities | | $ | 62,502,422 | | | $ | 63,682,930 | | | $ | 76,785,778 | | | $ | 74,309,747 | | | $ | 72,799,871 | |
| | | | | | | | | | | | | | | | | | | | |
| | |
| RGC RESOURCES | ANNUAL REPORT 2013 | | 31 |
SUMMARYOF GAS SALESAND STATISTICS
| | | | | | | | | | | | | | | | | | | | |
Years Ended September 30, | | 2013 | | | 2012 | | | 2011 | | | 2010 | | | 2009 | |
REVENUES: | | | | | | | | | | | | | | | | | | | | |
Residential Sales | | $ | 36,271,831 | | | $ | 32,784,791 | | | $ | 40,051,923 | | | $ | 42,277,903 | | | $ | 46,215,441 | |
Commercial Sales | | | 20,597,084 | | | | 19,164,789 | | | | 23,463,529 | | | | 25,166,672 | | | | 28,936,307 | |
Interruptible Sales | | | 1,205,788 | | | | 1,397,353 | | | | 1,572,270 | | | | 573,946 | | | | 609,698 | |
Transportation Gas Sales | | | 2,912,550 | | | | 2,957,344 | | | | 2,843,115 | | | | 2,674,151 | | | | 2,506,958 | |
Backup Services | | | — | | | | — | | | | — | | | | — | | | | 300 | |
Inventory Carrying Cost Revenues | | | 937,684 | | | | 1,236,713 | | | | 1,395,877 | | | | 1,546,544 | | | | 2,327,508 | |
Late Payment Charges | | | 37,407 | | | | 37,519 | | | | 44,252 | | | | 63,949 | | | | 56,718 | |
Miscellaneous Gas Utility Revenue | | | 61,830 | | | | 79,431 | | | | 112,654 | | | | 123,493 | | | | 133,298 | |
Other | | | 1,181,492 | | | | 1,141,747 | | | | 1,315,251 | | | | 1,397,256 | | | | 1,398,245 | |
| | | | | | | | | | | | | | | | | | | | |
Total | | $ | 63,205,666 | | | $ | 58,799,687 | | | $ | 70,798,871 | | | $ | 73,823,914 | | | $ | 82,184,473 | |
NET INCOME | | $ | 4,262,052 | | | $ | 4,296,745 | | | $ | 4,653,473 | | | $ | 4,445,436 | | | $ | 4,869,010 | |
DTH DELIVERED: | | | | | | | | | | | | | | | | | | | | |
Residential | | | 3,821,200 | | | | 3,036,076 | | | | 3,866,489 | | | | 3,910,639 | | | | 3,866,956 | |
Commercial | | | 2,677,583 | | | | 2,299,760 | | | | 2,715,998 | | | | 2,712,692 | | | | 2,830,782 | |
Interruptible | | | 247,069 | | | | 286,326 | | | | 263,851 | | | | 79,858 | | | | 75,061 | |
Transportation Gas | | | 2,663,042 | | | | 2,695,334 | | | | 2,698,260 | | | | 2,610,962 | | | | 2,487,670 | |
| | | | | | | | | | | | | | | | | | | | |
Total | | | 9,408,894 | | | | 8,317,496 | | | | 9,544,598 | | | | 9,314,151 | | | | 9,260,469 | |
HEATING DEGREE DAYS | | | 4,001 | | | | 3,189 | | | | 4,091 | | | | 4,047 | | | | 3,914 | |
NUMBER OF CUSTOMERS: | | | | | | | | | | | | | | | | | | | | |
Natural Gas | | | | | | | | | | | | | | | | | | | | |
Residential | | | 53,093 | | | | 52,836 | | | | 52,579 | | | | 51,922 | | | | 51,069 | |
Commercial | | | 5,110 | | | | 5,072 | | | | 5,073 | | | | 5,020 | | | | 5,018 | |
Interruptible and Transportation | | | 35 | | | | 33 | | | | 32 | | | | 33 | | | | 32 | |
| | | | | | | | | | | | | | | | | | | | |
Total | | | 58,238 | | | | 57,941 | | | | 57,684 | | | | 56,975 | | | | 56,119 | |
GAS ACCOUNT (DTH): | | | | | | | | | | | | | | | | | | | | |
Natural Gas Available | | | 9,622,988 | | | | 8,521,983 | | | | 9,772,756 | | | | 9,561,029 | | | | 9,549,231 | |
Natural Gas Deliveries | | | 9,408,894 | | | | 8,317,496 | | | | 9,544,598 | | | | 9,314,151 | | | | 9,260,469 | |
Storage - LNG | | | 139,875 | | | | 111,735 | | | | 114,670 | | | | 136,972 | | | | 124,925 | |
Company Use And Miscellaneous | | | 50,282 | | | | 41,620 | | | | 42,147 | | | | 47,759 | | | | 39,697 | |
System Loss | | | 23,937 | | | | 51,132 | | | | 71,341 | | | | 62,147 | | | | 124,140 | |
| | | | | | | | | | | | | | | | | | | | |
Total Gas Available | | | 9,622,988 | | | | 8,521,983 | | | | 9,772,756 | | | | 9,561,029 | | | | 9,549,231 | |
TOTAL ASSETS | | $ | 124,526,701 | | | $ | 129,756,338 | | | $ | 125,549,049 | | | $ | 120,683,316 | | | $ | 118,801,892 | |
LONG-TERM OBLIGATIONS | | $ | 13,000,000 | | | $ | 13,000,000 | | | $ | 13,000,000 | | | $ | 28,000,000 | | | $ | 28,000,000 | |
| | |
| 32 | | RGC RESOURCES | ANNUAL REPORT 2013 |
RGC Resources, Inc. and Subsidiaries
Consolidated Financial Statements
for the Years Ended September 30, 2013, 2012
and 2011, and Report of Independent
Registered Public Accounting Firm
RGC RESOURCES, INC. AND SUBSIDIARIES
TABLE OF CONTENTS

REPORT OF INDEPENDENT REGISTERED PUBLIC ACCOUNTING FIRM
Board of Directors and Stockholders
RGC Resources, Inc.
Roanoke, Virginia
We have audited the accompanying consolidated balance sheets of RGC Resources, Inc. and Subsidiaries (“the Company”) as of September 30, 2013 and 2012, and the related consolidated statements of income, comprehensive income, stockholders’ equity, and cash flows for each of the years in the three-year period ended September 30, 2013. RGC Resources, Inc.’s management is responsible for these financial statements. Our responsibility is to express an opinion on these consolidated financial statements based on our audits.
We conducted our audits in accordance with the standards of the Public Company Accounting Oversight Board (United States). Those standards require that we plan and perform the audit to obtain reasonable assurance about whether the financial statements are free of material misstatement. An audit includes examining, on a test basis, evidence supporting the amounts and disclosures in the financial statements. An audit also includes assessing the accounting principles used and significant estimates made by management, as well as evaluating the overall financial statement presentation. We believe that our audits provide a reasonable basis for our opinion.
In our opinion, the financial statements referred to above present fairly, in all material respects, the financial position of RGC Resources, Inc. and Subsidiaries as of September 30, 2013 and 2012, and the consolidated results of its operations and its cash flows for each of the years in the three-year period ended September 30, 2013, in conformity with accounting principles generally accepted in the United States of America.
We have also audited, in accordance with the standards of the Public Company Accounting Oversight Board (United States), RGC Resources, Inc and Subsidiaries’ internal control over financial reporting as of September 30, 2013, based on criteria established inInternal Control—Integrated Framework issued by the Committee of Sponsoring Organizations of the Treadway Commission (COSO), and our report dated November 25, 2013 expressed an unqualified opinion.
|
 |
|
| CERTIFIED PUBLIC ACCOUNTANTS |
100 Arbor Drive
Christiansburg, Virginia
November 25, 2013
RGC RESOURCES, INC. AND SUBSIDIARIES
CONSOLIDATED BALANCE SHEETS
AS OF SEPTEMBER 30, 2013 AND 2012
| | | | | | | | |
| | | 2013 | | | 2012 | |
ASSETS | | | | | | | | |
CURRENT ASSETS: | | | | | | | | |
Cash and cash equivalents | | $ | 2,846,224 | | | $ | 8,909,871 | |
Accounts receivable, less allowance for doubtful accounts of $68,539 in 2013 and $65,219 in 2012 | | | 3,729,106 | | | | 3,617,925 | |
Notes receivable | | | — | | | | 1,142,770 | |
Materials and supplies | | | 760,781 | | | | 613,548 | |
Gas in storage | | | 10,316,240 | | | | 9,466,095 | |
Prepaid income taxes | | | 836,966 | | | | 2,072,687 | |
Deferred income taxes | | | 2,852,073 | | | | 2,371,609 | |
Under-recovery of gas costs | | | — | | | | 687,194 | |
Other | | | 866,646 | | | | 1,365,615 | |
| | | | | | | | |
Total current assets | | | 22,208,036 | | | | 30,247,314 | |
| | | | | | | | |
UTILITY PROPERTY: | | | | | | | | |
In service | | | 144,388,721 | | | | 135,912,571 | |
Accumulated depreciation and amortization | | | (48,653,487 | ) | | | (46,563,520 | ) |
| | | | | | | | |
In service, net | | | 95,735,234 | | | | 89,349,051 | |
| | | | | | | | |
Construction work in progress | | | 2,001,315 | | | | 1,481,041 | |
| | | | | | | | |
Utility plant, net | | | 97,736,549 | | | | 90,830,092 | |
| | | | | | | | |
OTHER ASSETS: | | | | | | | | |
Regulatory assets | | | 4,474,111 | | | | 8,542,048 | |
Other | | | 108,005 | | | | 136,884 | |
| | | | | | | | |
Total other assets | | | 4,582,116 | | | | 8,678,932 | |
| | | | | | | | |
TOTAL ASSETS | | $ | 124,526,701 | | | $ | 129,756,338 | |
| | | | | | | | |
(Continued)
- 2 -
RGC RESOURCES, INC. AND SUBSIDIARIES
CONSOLIDATED BALANCE SHEETS
AS OF SEPTEMBER 30, 2013 AND 2012
| | | | | | | | |
| | | 2013 | | | 2012 | |
LIABILITIES AND STOCKHOLDERS’ EQUITY | | | | | | | | |
CURRENT LIABILITIES: | | | | | | | | |
Note payable | | $ | 15,000,000 | | | $ | 15,000,000 | |
Dividends payable | | | 847,736 | | | | 817,462 | |
Accounts payable | | | 5,723,107 | | | | 4,756,460 | |
Customer credit balances | | | 1,277,515 | | | | 2,382,089 | |
Customer deposits | | | 1,476,451 | | | | 1,567,501 | |
Accrued expenses | | | 2,118,182 | | | | 2,102,165 | |
Over-recovery of gas costs | | | 1,027,303 | | | | — | |
Fair value of marked-to-market transactions | | | 1,986,695 | | | | 2,916,718 | |
| | | | | | | | |
Total current liabilities | | | 29,456,989 | | | | 29,542,395 | |
| | | | | | | | |
LONG-TERM DEBT | | | 13,000,000 | | | | 13,000,000 | |
| | | | | | | | |
DEFERRED CREDITS AND OTHER LIABILITIES: | | | | | | | | |
Asset retirement obligations | | | 4,525,355 | | | | 4,251,295 | |
Regulatory cost of retirement obligations | | | 8,180,173 | | | | 7,828,157 | |
Benefit plan liabilities | | | 5,582,073 | | | | 12,541,251 | |
Deferred income taxes | | | 14,276,596 | | | | 11,898,178 | |
Deferred investment tax credits | | | 3,093 | | | | 12,132 | |
| | | | | | | | |
Total deferred credits and other liabilities | | | 32,567,290 | | | | 36,531,013 | |
| | | | | | | | |
COMMITMENTS AND CONTINGENCIES (Note 9) | | | | | | | | |
CAPITALIZATION: | | | | | | | | |
Stockholders’ Equity: | | | | | | | | |
Common Stock, $5 par value; authorized 10,000,000 shares; issued and outstanding 4,709,326 and 4,670,567 shares in 2013 and 2012, respectively | | | 23,546,630 | | | | 23,352,835 | |
Preferred stock, no par; authorized 5,000,000 shares; no shares issued and outstanding in 2013 and 2012 | | | — | | | | — | |
Capital in excess of par value | | | 8,003,787 | | | | 7,375,666 | |
Retained earnings | | | 20,103,239 | | | | 23,904,514 | |
Accumulated other comprehensive loss | | | (2,151,234 | ) | | | (3,950,085 | ) |
| | | | | | | | |
Total stockholders’ equity | | | 49,502,422 | | | | 50,682,930 | |
| | | | | | | | |
TOTAL LIABILITIES AND STOCKHOLDERS’ EQUITY | | $ | 124,526,701 | | | $ | 129,756,338 | |
| | | | | | | | |
(Concluded)
See notes to consolidated financial statements.
- 3 -
RGC RESOURCES, INC. AND SUBSIDIARIES
CONSOLIDATED STATEMENTS OF INCOME
YEARS ENDED SEPTEMBER 30, 2013, 2012 AND 2011
| | | | | | | | | | | | |
| | | 2013 | | | 2012 | | | 2011 | |
OPERATING REVENUES: | | | | | | | | | | | | |
Gas utilities | | $ | 62,024,174 | | | $ | 57,657,940 | | | $ | 69,483,620 | |
Other | | | 1,181,492 | | | | 1,141,747 | | | | 1,315,251 | |
| | | | | | | | | | | | |
Total operating revenues | | | 63,205,666 | | | | 58,799,687 | | | | 70,798,871 | |
| | | | | | | | | | | | |
COST OF SALES: | | | | | | | | | | | | |
Gas utilities | | | 34,916,062 | | | | 31,278,173 | | | | 42,815,799 | |
Other | | | 686,713 | | | | 588,417 | | | | 713,506 | |
| | | | | | | | | | | | |
Total cost of sales | | | 35,602,775 | | | | 31,866,590 | | | | 43,529,305 | |
| | | | | | | | | | | | |
GROSS MARGIN | | | 27,602,891 | | | | 26,933,097 | | | | 27,269,566 | |
| | | | | | | | | | | | |
OTHER OPERATING EXPENSES: | | | | | | | | | | | | |
Operations and maintenance | | | 12,853,599 | | | | 12,547,693 | | | | 12,661,981 | |
General taxes | | | 1,480,746 | | | | 1,366,680 | | | | 1,290,735 | |
Depreciation and amortization | | | 4,473,491 | | | | 4,232,189 | | | | 4,003,804 | |
| | | | | | | | | | | | |
Total other operating expenses | | | 18,807,836 | | | | 18,146,562 | | | | 17,956,520 | |
| | | | | | | | | | | | |
OPERATING INCOME | | | 8,795,055 | | | | 8,786,535 | | | | 9,313,046 | |
OTHER INCOME (EXPENSE), net | | | (60,117 | ) | | | (19,956 | ) | | | 20,250 | |
INTEREST EXPENSE | | | 1,828,099 | | | | 1,830,885 | | | | 1,832,712 | |
| | | | | | | | | | | | |
INCOME BEFORE INCOME TAXES | | | 6,906,839 | | | | 6,935,694 | | | | 7,500,584 | |
INCOME TAX EXPENSE | | | 2,644,787 | | | | 2,638,949 | | | | 2,847,111 | |
| | | | | | | | | | | | |
NET INCOME | | $ | 4,262,052 | | | $ | 4,296,745 | | | $ | 4,653,473 | |
| | | | | | | | | | | | |
EARNINGS PER COMMON SHARE: | | | | | | | | | | | | |
Basic | | $ | 0.91 | | | $ | 0.92 | | | $ | 1.01 | |
Diluted | | $ | 0.91 | | | $ | 0.92 | | | $ | 1.01 | |
WEIGHTED AVERAGE SHARES OUTSTANDING: | | | | | | | | | | | | |
Basic | | | 4,698,727 | | | | 4,647,439 | | | | 4,592,713 | |
Diluted | | | 4,698,766 | | | | 4,650,949 | | | | 4,600,792 | |
See notes to consolidated financial statements.
- 4 -
RGC RESOURCES, INC. AND SUBSIDIARIES
CONSOLIDATED STATEMENTS OF COMPREHENSIVE INCOME
YEARS ENDED SEPTEMBER 30, 2013, 2012 AND 2011
| | | | | | | | | | | | |
| | | 2013 | | | 2012 | | | 2011 | |
NET INCOME | | $ | 4,262,052 | | | $ | 4,296,745 | | | $ | 4,653,473 | |
| | | | | | | | | | | | |
Other comprehensive income, net of tax: | | | | | | | | | | | | |
Interest rate SWAPs | | | 576,985 | | | | 245,343 | | | | 139,199 | |
Defined benefit plans | | | 1,221,866 | | | | (162,090 | ) | | | (305,714 | ) |
| | | | | | | | | | | | |
OTHER COMPREHENSIVE INCOME (LOSS), NET OF TAX | | | 1,798,851 | | | | 83,253 | | | | (166,515 | ) |
| | | | | | | | | | | | |
COMPREHENSIVE INCOME | | $ | 6,060,903 | | | $ | 4,379,998 | | | $ | 4,486,958 | |
| | | | | | | | | | | | |
See notes to consolidated financial statements.
- 5 -
RGC RESOURCES, INC. AND SUBSIDIARIES
CONSOLIDATED STATEMENTS OF STOCKHOLDERS’ EQUITY
YEARS ENDED SEPTEMBER 30, 2013, 2012 AND 2011
| | | | | | | | | | | | | | | | | | | | |
| | | Common
Stock | | | Capital in
Excess of
Par Value | | | Retained
Earnings | | | Accumulated
Other
Comprehensive
Income (Loss) | | | Total
Stockholders’
Equity | |
Balance - September 30, 2010 | | $ | 11,372,160 | | | $ | 17,462,670 | | | $ | 21,341,740 | | | $ | (3,866,823 | ) | | $ | 46,309,747 | |
Net income | | | — | | | | — | | | | 4,653,473 | | | | — | | | | 4,653,473 | |
Other comprehensive income | | | — | | | | — | | | | — | | | | (166,515 | ) | | | (166,515 | ) |
Tax benefits from stock option exercise | | | — | | | | 40,746 | | | | — | | | | — | | | | 40,746 | |
Cash dividends declared ($0.68 per share) | | | — | | | | — | | | | (3,129,902 | ) | | | — | | | | (3,129,902 | ) |
Stock split | | | 11,560,575 | | | | (11,560,575 | ) | | | — | | | | — | | | | — | |
Issuance costs - stock split | | | — | | | | (34,205 | ) | | | — | | | | — | | | | (34,205 | ) |
Issuance of common stock (75,818 shares) | | | 190,675 | | | | 921,759 | | | | — | | | | — | | | | 1,112,434 | |
| | | | | | | | | | | | | | | | | | | | |
Balance - September 30, 2011 | | $ | 23,123,410 | | | $ | 6,830,395 | | | $ | 22,865,311 | | | $ | (4,033,338 | ) | | $ | 48,785,778 | |
| | | | | | | | | | | | | | | | | | | | |
Net income | | | — | | | | — | | | | 4,296,745 | | | | — | | | | 4,296,745 | |
Other comprehensive income | | | — | | | | — | | | | — | | | | 83,253 | | | | 83,253 | |
Tax benefits from stock option exercise | | | — | | | | 34,818 | | | | — | | | | — | | | | 34,818 | |
Cash dividends declared ($0.70 per share) | | | — | | | | — | | | | (3,257,542 | ) | | | — | | | | (3,257,542 | ) |
Issuance of common stock (45,885 shares) | | | 229,425 | | | | 510,453 | | | | — | | | | — | | | | 739,878 | |
| | | | | | | | | | | | | | | | | | | | |
Balance - September 30, 2012 | | $ | 23,352,835 | | | $ | 7,375,666 | | | $ | 23,904,514 | | | $ | (3,950,085 | ) | | $ | 50,682,930 | |
| | | | | | | | | | | | | | | | | | | | |
Net income | | | — | | | | — | | | | 4,262,052 | | | | — | | | | 4,262,052 | |
Other comprehensive income | | | — | | | | — | | | | — | | | | 1,798,851 | | | | 1,798,851 | |
Stock option grants | | | — | | | | 84,840 | | | | — | | | | — | | | | 84,840 | |
Cash dividends declared ($1.72 per share) | | | — | | | | — | | | | (8,063,327 | ) | | | — | | | | (8,063,327 | ) |
Issuance of common stock (38,759 shares) | | | 193,795 | | | | 543,281 | | | | — | | | | — | | | | 737,076 | |
| | | | | | | | | | | | | | | | | | | | |
Balance - September 30, 2013 | | $ | 23,546,630 | | | $ | 8,003,787 | | | $ | 20,103,239 | | | $ | (2,151,234 | ) | | $ | 49,502,422 | |
| | | | | | | | | | | | | | | | | | | | |
See notes to consolidated financial statements.
- 6 -
RGC RESOURCES, INC. AND SUBSIDIARIES
CONSOLIDATED STATEMENTS OF CASH FLOWS
YEARS ENDED SEPTEMBER 30, 2013, 2012 AND 2011
| | | | | | | | | | | | |
| | | 2013 | | | 2012 | | | 2011 | |
CASH FLOWS FROM OPERATING ACTIVITIES: | | | | | | | | | | | | |
Net income | | $ | 4,262,052 | | | $ | 4,296,745 | | | $ | 4,653,473 | |
Adjustments to reconcile net income to net cash provided by operations: | | | | | | | | | | | | |
Depreciation and amortization | | | 4,656,716 | | | | 4,387,016 | | | | 4,164,320 | |
Cost of retirement of utility plant, net | | | (502,587 | ) | | | (436,120 | ) | | | (302,340 | ) |
Stock option grants | | | 84,840 | | | | — | | | | — | |
Deferred taxes and investment tax credits | | | 786,990 | | | | 2,410,468 | | | | 2,720,657 | |
Other noncash items, net | | | 39,186 | | | | 35,865 | | | | (42,938 | ) |
Changes in assets and liabilities which provided (used) cash: | | | | | | | | | | | | |
Accounts receivable and customer deposits, net | | | (374,682 | ) | | | (51,234 | ) | | | (189,410 | ) |
Inventories and gas in storage | | | (997,378 | ) | | | 3,394,448 | | | | 899,295 | |
Over/under recovery of gas costs | | | 1,714,497 | | | | (1,042,670 | ) | | | (2,309,284 | ) |
Other assets | | | 1,106,590 | | | | (418,598 | ) | | | 882,148 | |
Accounts payable, customer credit balances and accrued expenses, net | | | (739,154 | ) | | | (792,879 | ) | | | 207,423 | |
| | | | | | | | | | | | |
Total adjustments | | | 5,775,018 | | | | 7,486,296 | | | | 6,029,871 | |
| | | | | | | | | | | | |
Net cash provided by operating activities | | | 10,037,070 | | | | 11,783,041 | | | | 10,683,344 | |
| | | | | | | | | | | | |
CASH FLOWS FROM INVESTING ACTIVITIES: | | | | | | | | | | | | |
Expenditures for utility property | | | (9,977,433 | ) | | | (8,683,658 | ) | | | (7,589,386 | ) |
Proceeds from disposal of utility property | | | 29,923 | | | | 32,943 | | | | 284 | |
| | | | | | | | | | | | |
Net cash used in investing activities | | | (9,947,510 | ) | | | (8,650,715 | ) | | | (7,589,102 | ) |
| | | | | | | | | | | | |
CASH FLOWS FROM FINANCING ACTIVITIES: | | | | | | | | | | | | |
Proceeds on collection of notes | | | 1,142,770 | | | | 277,770 | | | | 87,000 | |
Borrowings under line-of-credit | | | 4,354,402 | | | | — | | | | — | |
Repayments under line-of-credit | | | (4,354,402 | ) | | | — | | | | — | |
Proceeds from issuance of stock | | | 737,076 | | | | 774,696 | | | | 1,118,975 | |
Cash dividends paid | | | (8,033,053 | ) | | | (3,226,350 | ) | | | (3,094,418 | ) |
| | | | | | | | | | | | |
Net cash used in financing activities | | | (6,153,207 | ) | | | (2,173,884 | ) | | | (1,888,443 | ) |
| | | | | | | | | | | | |
NET INCREASE (DECREASE) IN CASH AND CASH EQUIVALENTS | | | (6,063,647 | ) | | | 958,442 | | | | 1,205,799 | |
CASH AND CASH EQUIVALENTS AT BEGINNING OF YEAR | | | 8,909,871 | | | | 7,951,429 | | | | 6,745,630 | |
| | | | | | | | | | | | |
CASH AND CASH EQUIVALENTS AT END OF YEAR | | $ | 2,846,224 | | | $ | 8,909,871 | | | $ | 7,951,429 | |
| | | | | | | | | | | | |
SUPPLEMENTAL DISCLOSURE OF CASH FLOW INFORMATION: | | | | | | | | | | | | |
Cash paid (refunded) during the year for: | | | | | | | | | | | | |
Interest | | $ | 1,803,528 | | | $ | 1,783,918 | | | $ | 1,799,459 | |
Income taxes | | | 622,076 | | | | 525,000 | | | | (705,000 | ) |
Non-cash transactions:
A note in the amount of $381,540 was received in 2011 to reimburse the Company for the relocation of a gas distribution line.
See notes to consolidated financial statements.
- 7 -
RGC RESOURCES, INC. AND SUBSIDIARIES
NOTES TO CONSOLIDATED FINANCIAL STATEMENTS
YEARS ENDED SEPTEMBER 30, 2013, 2012 AND 2011
| 1. | SUMMARY OF SIGNIFICANT ACCOUNTING POLICIES |
Principles of Consolidation—RGC Resources, Inc. is an energy services company engaged in the sale and distribution of natural gas. The consolidated financial statements include the accounts of RGC Resources, Inc. and its wholly owned subsidiaries (“Resources” or the “Company”); Roanoke Gas Company (“Roanoke Gas”); Diversified Energy Company; and RGC Ventures of Virginia, Inc., operating as Application Resources and The Utility Consultants. Roanoke Gas is a natural gas utility, which distributes and sells natural gas to approximately 58,200 residential, commercial and industrial customers within its service areas in Roanoke, Virginia and the surrounding localities. The Company’s business is seasonal in nature and weather dependent as a majority of natural gas sales are for space heating during the winter season. Roanoke Gas is regulated by the Virginia State Corporation Commission (“SCC” or “Virginia Commission”). Application Resources provides information system services to software providers in the utility industry. The Utility Consultants provides regulatory consulting services to other utilities. Diversified Energy Company is currently inactive.
The Company follows accounting and reporting standards set by the Financial Accounting Standards Board (“FASB”) and the Securities and Exchange Commission (“SEC”).
Resources has only one reportable segment as defined under FASB ASC No. 280 –Segment Reporting. All intercompany transactions have been eliminated in consolidation.
Rate Regulated Basis of Accounting—The Company’s regulated operations follow the accounting and reporting requirements of FASB ASC No. 980,Regulated Operations. The economic effects of regulation can result in a regulated company deferring costs that have been or are expected to be recovered from customers in a period different from the period in which the costs would be charged to expense by an unregulated enterprise. When this situation occurs, costs are deferred as assets in the consolidated balance sheet (regulatory assets) and recorded as expenses when such amounts are reflected in rates. Additionally, regulators can impose liabilities upon a regulated company for amounts previously collected from customers and for current collection in rates of costs that are expected to be incurred in the future (regulatory liabilities). In the event the provisions of FASB ASC No. 980 no longer apply to any or all regulatory assets or liabilities, the Company would write off such amounts and include them in the consolidated statements of income and comprehensive income in the period for which FASB ASC No. 980 no longer applied.
- 8 -
Regulatory assets and liabilities included in the Company’s consolidated balance sheets as of September 30, 2013 and 2012 are as follows:
| | | | | | | | |
| | | September 30 | |
| | | 2013 | | | 2012 | |
Regulatory Assets: | | | | | | | | |
Current Assets: | | | | | | | | |
Under-recovery of gas costs | | $ | — | | | $ | 687,194 | |
Other: | | | | | | | | |
Accrued pension and postretirement medical | | | 184,063 | | | | 706,470 | |
Utility Property: | | | | | | | | |
In service: | | | | | | | | |
Other | | | 11,945 | | | | 11,945 | |
Other Assets: | | | | | | | | |
Regulatory assets: | | | | | | | | |
Premium on early retirement of debt | | | 65,817 | | | | 96,193 | |
Accrued pension and postretirement medical | | | 4,267,211 | | | | 8,433,855 | |
Other | | | 141,083 | | | | 12,000 | |
| | | | | | | | |
Total regulatory assets | | $ | 4,670,119 | | | $ | 9,947,657 | |
| | | | | | | | |
Regulatory Liabilities: | | | | | | | | |
Current Liabilities: | | | | | | | | |
Over-recovery of gas costs | | $ | 1,027,303 | | | $ | — | |
Deferred Credits and Other Liabilities: | | | | | | | | |
Asset retirement obligations | | | 4,525,355 | | | | 4,251,295 | |
Regulatory cost of retirement obligations | | | 8,180,173 | | | | 7,828,157 | |
| | | | | | | | |
Total regulatory liabilities | | $ | 13,732,831 | | | $ | 12,079,452 | |
| | | | | | | | |
As of September 30, 2013, the Company had regulatory assets in the amount of $4,591,357 on which the Company did not earn a return during the recovery period. These assets primarily pertain to the net funded position of the Company’s benefit plans related to its regulated operations. As such, the amortization period is not specifically defined.
Utility Plant and Depreciation—Utility plant is stated at original cost. The cost of additions to utility plant includes direct charges and overhead. The cost of depreciable property retired is charged to accumulated depreciation. The cost of asset removals, less salvage, is charged to “regulatory cost of retirement obligations” or “asset retirement obligations” as explained under Asset Retirement Obligations below. Maintenance, repairs, and minor renewals and betterments of property are charged to operations and maintenance.
Provisions for depreciation are computed principally at composite straight-line rates as determined by depreciation studies required to be performed on the regulated utility assets of Roanoke Gas Company every five years. The Company completed its most recent depreciation study in July 2009. The composite weighted-average depreciation rate under the current depreciation study was 3.35%, 3.34% and 3.34% for the fiscal years ended September 30, 2013, 2012 and 2011, respectively.
The composite rates are comprised of two components, one based on average service life and one based on cost of retirement. As a result, the Company accrues the estimated cost of retirement of long-lived assets through depreciation expense. Retirement costs are not a legal obligation but rather the result of cost-based regulation and are accounted for under the provisions of FASB ASC No. 980. Such amounts are classified as a regulatory liability.
The Company reviews long-lived assets and certain identifiable intangibles for impairment whenever events or changes in circumstances indicate that the carrying amount of an asset may not be recoverable. These reviews have not identified any impairments which would have a material effect on the results of operations or financial condition.
Asset Retirement Obligations—FASB ASC No. 410,Asset Retirement and Environmental Obligations, requires entities to record the fair value of a liability for an asset retirement obligation when there exists a legal obligation for the retirement of the asset. When the liability is initially recorded, the entity capitalizes the cost, thereby increasing the carrying amount of the underlying asset. In subsequent periods, the liability is accreted, and the capitalized cost is depreciated over the useful life of the underlying asset. The Company has recorded asset retirement obligations for its
- 9 -
future legal obligations related to purging and capping its distribution mains and services upon retirement, although the timing of such retirements is uncertain.
The Company’s composite depreciation rates include a component to provide for the cost of retirement of assets. As a result, the Company accrues the estimated cost of retirement of its utility plant through depreciation expense and creates a corresponding regulatory liability. The costs of retirement considered in the development of the depreciation component include those costs associated with the legal liability. Therefore, the asset retirement obligation is reclassified from the regulatory cost of retirement obligation. If the legal obligations were to exceed the regulatory liability provided for in the depreciation rates, the Company would establish a regulatory asset for such difference with the anticipation of future recovery through rates charged to customers. In both 2013 and 2012, the Company increased its asset retirement obligation to reflect changes in the estimated cash flows for asset retirements.
The following is a summary of the asset retirement obligation:
| | | | | | | | |
| | | Years Ended September 30 | |
| | | 2013 | | | 2012 | |
Beginning balance | | $ | 4,251,295 | | | $ | 3,863,933 | |
Liabilities incurred | | | 75,312 | | | | 63,965 | |
Liabilities settled | | | (194,602 | ) | | | (213,581 | ) |
Accretion | | | 249,293 | | | | 221,048 | |
Revisions to estimated cash flows | | | 144,057 | | | | 315,930 | |
| | | | | | | | |
Ending balance | | $ | 4,525,355 | | | $ | 4,251,295 | |
| | | | | | | | |
Cash, Cash Equivalents and Short-Term Investments—From time to time, the Company will have balances on deposit at banks in excess of the amount insured by the Federal Deposit Insurance Corporation (“FDIC”). The Company has not experienced any losses on these accounts and does not consider these amounts to be at credit risk. As of September 30, 2013, the Company did not have any bank deposits in excess of the FDIC insurance limits. For purposes of the consolidated statements of cash flows, the Company considers all highly liquid debt instruments purchased with an original maturity of three months or less to be cash equivalents.
Customer Receivables and Allowance for Doubtful Accounts—Accounts receivable include amounts billed to customers for natural gas sales and related services and gas sales occurring subsequent to normal billing cycles but before the end of the period. The Company provides an estimate for losses on these receivables by utilizing historical information, current account balances, account aging and current economic conditions. Customer accounts are charged off annually when deemed uncollectible or when turned over to a collection agency for action.
A reconciliation of changes in the allowance for doubtful accounts is as follows:
| | | | | | | | | | | | |
| | | Years Ended September 30 | |
| | | 2013 | | | 2012 | | | 2011 | |
Beginning balance | | $ | 65,219 | | | $ | 66,058 | | | $ | 65,275 | |
Provision for doubtful accounts | | | 85,033 | | | | 11,588 | | | | 67,317 | |
Recoveries of accounts written off | | | 122,432 | | | | 134,331 | | | | 190,995 | |
Accounts written off | | | (204,145 | ) | | | (146,758 | ) | | | (257,529 | ) |
| | | | | | | | | | | | |
Ending balance | | $ | 68,539 | | | $ | 65,219 | | | $ | 66,058 | |
| | | | | | | | | | | | |
Financing Receivables—Financing receivables represent a contractual right to receive money either on demand or on fixed or determinable dates and are recognized as assets on the entity’s balance sheet. The Company has two primary types of financing receivables: trade accounts receivable, resulting from the sale of natural gas and other services to its customers, and notes receivable. Trade accounts receivable are short-term in nature and a provision for uncollectible balances is included in the financial statements. The Company’s notes receivable represented the balance on a five-year note with a fifteen year amortization for partial payment on the sale of the Bluefield, Virginia natural gas distribution assets to ANGD, LLC in October 2007 and a 24-month note from a customer related to the payment for relocating a portion of a natural gas distribution main. Both notes were paid in full during 2013.
Inventories—Inventories, consisting of natural gas in storage and materials and supplies, are recorded at average cost. Injections into storage are priced at the purchase cost at the time of injection and withdrawals from storage are priced at the weighted average price in storage. Materials and supplies are removed from inventory at average cost.
Unbilled Revenues—The Company bills its natural gas customers on a monthly cycle basis; however, the billing cycle period for most customers does not coincide with the accounting periods used for financial reporting. As the Company
- 10 -
recognizes revenue when gas is delivered, an accrual is made to estimate revenues for natural gas delivered to customers but not billed during the accounting period. The amounts of unbilled revenue receivable included in accounts receivable on the consolidated balance sheets at September 30, 2013 and 2012 were $1,056,253 and $951,301, respectively.
Income Taxes—Income taxes are accounted for using the asset and liability method. Under the asset and liability method, deferred tax assets and liabilities are recognized for the estimated future tax consequences attributable to differences between the financial statement carrying amounts of existing assets and liabilities and their respective tax bases. Deferred tax assets and liabilities are measured using enacted tax rates in effect for the years in which those temporary differences are expected to be recovered or settled. A valuation allowance against deferred tax assets is provided if it is more likely than not the deferred tax asset will not be realized. The Company and its subsidiaries file state and federal consolidated income tax returns.
Debt Expenses—Debt issuance expenses are amortized over the lives of the debt instruments.
Over/Under-Recovery of Natural Gas Costs—Pursuant to the provisions of the Company’s Purchased Gas Adjustment (“PGA”) clause, the SCC provides the Company with a method of passing along to its customers increases or decreases in natural gas costs incurred by its regulated operations, including gains and losses on natural gas derivative hedging instruments. On a quarterly basis, the Company files a PGA rate adjustment request with the SCC to adjust the gas cost component of its rates up or down depending on projected price and activity. Once administrative approval is received, the Company adjusts the gas cost component of its rates to reflect the approved amount. As actual costs will differ from the projections used in establishing the PGA rate, the Company may either over-recover or under-recover its actual gas costs during the period. Any difference between actual costs incurred and costs recovered through the application of the PGA is recorded as a regulatory asset or liability. At the end of the deferral period, the balance of the net deferred charge or credit is amortized over an ensuing 12-month period as amounts are reflected in customer billings.
Fair Value—Fair value is defined as the price that would be received to sell an asset or paid to transfer a liability in an orderly transaction between market participants at the measurement date. The Company determines fair value based on the following fair value hierarchy which prioritizes each input to the valuation methods into one of the following three broad levels:
| | • | | Level 1 – Unadjusted quoted prices in active markets for identical assets or liabilities that the Company has the ability to access at the measurement date. |
| | • | | Level 2 – Inputs other than quoted prices in Level 1 that are either for similar assets or liabilities in active markets, quoted prices for identical or similar assets or liabilities in markets that are not active, inputs other than quoted prices that are observable for the asset or liability, or inputs that are derived principally from or corroborated by observable market data by correlation or other means. |
| | • | | Level 3 – Unobservable inputs for the asset or liability where there is little, if any, market activity which require the Company to develop its own assumptions. |
The fair value hierarchy gives the highest priority to unadjusted quoted prices in active markets (Level 1) and the lowest priority to unobservable inputs (Level 3). All fair value disclosures are categorized within one of the three categories in the hierarchy. See fair value disclosures below and in Notes 6 and 10.
Use of Estimates—The preparation of financial statements in conformity with Generally Accepted Accounting Principles in the United States of America requires management to make estimates and assumptions that affect the reported amounts of assets and liabilities, disclosure of contingent liabilities at the date of the financial statements and the reported amounts of revenues and expenses during the reporting period. Actual results could differ from those estimates.
Excise and Sales Taxes—Certain excise and sales taxes imposed by the state and local governments in the Company’s service territory are collected by the Company from its customers. These taxes are accounted for on a net basis and therefore are not included as revenues in the Company’s Consolidated Statements of Income.
- 11 -
Earnings Per Share—Basic earnings per share and diluted earnings per share are calculated by dividing net income by the weighted-average common shares outstanding during the period and the weighted-average common shares outstanding during the period plus dilutive potential common shares, respectively. Dilutive potential common shares are calculated in accordance with the treasury stock method, which assumes that proceeds from the exercise of all options are used to repurchase common stock at market value. The amount of shares remaining after the proceeds are exhausted represents the potentially dilutive effect of the securities. A reconciliation of basic and diluted earnings per share is presented below:
| | | | | | | | | | | | |
| | | Years Ended September 30 | |
| | | 2013 | | | 2012 | | | 2011 | |
Net Income | | $ | 4,262,052 | | | $ | 4,296,745 | | | $ | 4,653,473 | |
| | | | | | | | | | | | |
Weighted-average common shares | | | 4,698,727 | | | | 4,647,439 | | | | 4,592,713 | |
Effect of dilutive securities: | | | | | | | | | | | | |
Options to purchase common stock | | | 39 | | | | 3,510 | | | | 8,079 | |
| | | | | | | | | | | | |
Diluted average common shares | | | 4,698,766 | | | | 4,650,949 | | | | 4,600,792 | |
| | | | | | | | | | | | |
Earnings Per Share of Common Stock: | | | | | | | | | | | | |
Basic | | $ | 0.91 | | | $ | 0.92 | | | $ | 1.01 | |
Diluted | | $ | 0.91 | | | $ | 0.92 | | | $ | 1.01 | |
Business and Credit Concentrations—The primary business of the Company is the distribution of natural gas to residential, commercial and industrial customers in its service territories.
No regulated sales to individual customers accounted for more than 5% of total revenue in any period or amounted to more than 5% of total accounts receivable.
Roanoke Gas currently holds the only franchises and/or certificates of public convenience and necessity to distribute natural gas in its service area. These franchises are effective through January 1, 2016. Certificates of public convenience and necessity in Virginia are exclusive and are intended for perpetual duration.
Roanoke Gas is served directly by two primary pipelines. These two pipelines provide 100% of the natural gas supplied to the Company’s customers. Depending upon weather conditions and the level of customer demand, failure of one or both of these transmission pipelines could have a major adverse impact on the Company.
Derivative and Hedging Activities—FASB ASC No. 815,Derivatives and Hedging, requires the recognition of all derivative instruments as assets or liabilities in the Company’s balance sheet and measurement of those instruments at fair value.
The Company’s hedging and derivatives policy allows management to enter into derivatives for the purpose of managing commodity and financial market risks of its business operations. The Company’s hedging and derivatives policy specifically prohibits the use of derivatives for speculative purposes. The key market risks that RGC Resources, Inc. hedges against include the price of natural gas and the cost of borrowed funds.
The Company periodically enters into collars, swaps and caps for the purpose of hedging the price of natural gas in order to provide price stability during the winter months. The fair value of these instruments is recorded in the balance sheet with the offsetting entry to either under-recovery of gas costs or over-recovery of gas costs. Net income and other comprehensive income are not affected by the change in market value as any cost incurred or benefit received from these instruments is recoverable or refunded through the PGA as the SCC allows for full recovery of prudent costs associated with natural gas purchases. At September 30, 2013 and 2012, the Company had no outstanding derivative instruments for the purchase of natural gas.
The Company also has two interest rate swaps associated with its variable rate notes. The first swap relates to a $15,000,000 note issued in November 2005. This swap essentially converts the floating rate note based upon LIBOR into fixed rate debt with a 5.74% effective interest rate. The second swap relates to the $5,000,000 variable rate note issued in October 2008. This swap converts the variable rate note based on LIBOR into a fixed rate debt with a 5.79% effective interest rate. Both swaps qualify as cash flow hedges with changes in fair value reported in other comprehensive income.
No derivative instruments were deemed to be ineffective for any period presented.
- 12 -
The table below reflects the fair values of the derivative instruments and their corresponding classification in the consolidated balance sheets under the current liabilities caption of “Fair value of marked-to-market transactions” as of September 30, 2013 and 2012:
Fair Value of Derivative Instruments
| | | | | | | | |
| | | September 30 | |
| | | 2013 | | | 2012 | |
Derivatives designated as hedging instruments: | | | | | | | | |
Interest rate swaps | | $ | 1,986,695 | | | $ | 2,916,718 | |
| | | | | | | | |
Total derivatives designated as hedging instruments | | $ | 1,986,695 | | | $ | 2,916,718 | |
| | | | | | | | |
See Note 10 for additional information on fair value.
Based on the interest rate environment as of September 30, 2013, approximately $935,000 of the fair value of the interest rate hedges will be reclassified from other comprehensive loss into interest expense on the income statement over the next 12 months. Changes in LIBOR rates during that period could significantly change the estimated amount to be reclassified to income as well as the fair value of the interest rate hedges.
Stock Split—On July 25, 2011, the Board of Directors of RGC Resources, Inc. declared a two-for-one stock split effected in the form of a 100% share dividend upon the issued and outstanding common stock. The stock dividend was payable on September 1, 2011 to shareholders of record on August 15, 2011. As the par value of the common stock remained at $5 per share, the Company reclassified $11,560,575 from “Capital in excess of par value” to “Common Stock” associated with the issuance of 2,312,115 shares.
- 13 -
Other Comprehensive Income(Loss)—A summary of other comprehensive income is provided below:
| | | | | | | | | | | | |
| | | Before Tax
Amount | | | Tax
(Expense)
or Benefit | | | Net-of Tax
Amount | |
Year Ended September 30, 2013: | | | | | | | | | | | | |
Interest rate swaps: | | | | | | | | | | | | |
Unrealized losses | | $ | (20,479 | ) | | $ | 7,774 | | | $ | (12,705 | ) |
Transfer of realized losses to interest expense | | | 950,501 | | | | (360,811 | ) | | | 589,690 | |
| | | | | | | | | | | | |
Net unrealized losses on interest rate SWAPs | | | 930,022 | | | | (353,037 | ) | | | 576,985 | |
| | | | | | | | | | | | |
Defined benefit plans: | | | | | | | | | | | | |
Net gain arising during period | | | 1,714,890 | | | | (651,659 | ) | | | 1,063,231 | |
Amortization of actuarial losses | | | 219,890 | | | | (83,558 | ) | | | 136,332 | |
Amortization of transition obligation | | | 35,972 | | | | (13,669 | ) | | | 22,303 | |
| | | | | | | | | | | | |
Net defined benefit plans | | | 1,970,752 | | | | (748,886 | ) | | | 1,221,866 | |
| | | | | | | | | | | | |
Other comprehensive income | | $ | 2,900,774 | | | $ | (1,101,923 | ) | | $ | 1,798,851 | |
| | | | | | | | | | | | |
Year Ended September 30, 2012: | | | | | | | | | | | | |
Interest rate swaps: | | | | | | | | | | | | |
Unrealized losses | | $ | (543,826 | ) | | $ | 206,437 | | | $ | (337,389 | ) |
Transfer of realized losses to interest expense | | | 939,285 | | | | (356,553 | ) | | | 582,732 | |
| | | | | | | | | | | | |
Net unrealized losses on interest rate SWAPs | | | 395,459 | | | | (150,116 | ) | | | 245,343 | |
| | | | | | | | | | | | |
Defined benefit plans: | | | | | | | | | | | | |
Net loss arising during period | | | (508,666 | ) | | | 193,294 | | | | (315,372 | ) |
Amortization of actuarial losses | | | 200,136 | | | | (76,052 | ) | | | 124,084 | |
Amortization of transition obligation | | | 47,093 | | | | (17,895 | ) | | | 29,198 | |
| | | | | | | | | | | | |
Net defined benefit plans | | | (261,437 | ) | | | 99,347 | | | | (162,090 | ) |
| | | | | | | | | | | | |
Other comprehensive income | | $ | 134,022 | | | $ | (50,769 | ) | | $ | 83,253 | |
| | | | | | | | | | | | |
Year Ended September 30, 2011: | | | | | | | | | | | | |
Interest rate swaps: | | | | | | | | | | | | |
Unrealized losses | | $ | (723,525 | ) | | $ | 274,652 | | | $ | (448,873 | ) |
Transfer of realized losses to interest expense | | | 947,894 | | | | (359,822 | ) | | | 588,072 | |
| | | | | | | | | | | | |
Net unrealized losses on interest rate SWAPs | | | 224,369 | | | | (85,170 | ) | | | 139,199 | |
| | | | | | | | | | | | |
Defined benefit plans: | | | | | | | | | | | | |
Net loss arising during period | | | (689,785 | ) | | | 262,119 | | | | (427,666 | ) |
Amortization of actuarial losses | | | 149,604 | | | | (56,850 | ) | | | 92,754 | |
Amortization of transition obligation | | | 47,093 | | | | (17,895 | ) | | | 29,198 | |
| | | | | | | | | | | | |
Net defined benefit plans | | | (493,088 | ) | | | 187,374 | | | | (305,714 | ) |
| | | | | | | | | | | | |
Other comprehensive loss | | $ | (268,719 | ) | | $ | 102,204 | | | $ | (166,515 | ) |
| | | | | | | | | | | | |
The amortization of actuarial losses and transition obligation is included as components of net periodic pension and postretirement benefit costs and is included in operations and maintenance expense.
- 14 -
Composition of Accumulated Other Comprehensive Income (Loss)
| | | | | | | | | | | | |
| | | Interest Rate
Swaps | | | Defined Benefit
Plans | | | Accumulated
Other
Comprehensive
Income (Loss) | |
Balance October 1, 2010 | | $ | (2,194,073 | ) | | $ | (1,672,750 | ) | | $ | (3,866,823 | ) |
Other comprehensive income (loss) | | | 139,199 | | | | (305,714 | ) | | | (166,515 | ) |
| | | | | | | | | | | | |
| | | |
Balance September 30, 2011 | | | (2,054,874 | ) | | | (1,978,464 | ) | | | (4,033,338 | ) |
Other comprehensive income (loss) | | | 245,343 | | | | (162,090 | ) | | | 83,253 | |
| | | | | | | | | | | | |
| | | |
Balance September 30, 2012 | | | (1,809,531 | ) | | | (2,140,554 | ) | | | (3,950,085 | ) |
Other comprehensive income (loss) | | | 576,985 | | | | 1,221,866 | | | | 1,798,851 | |
| | | | | | | | | | | | |
| | | |
Balance September 30, 2013 | | $ | (1,232,546 | ) | | $ | (918,688 | ) | | $ | (2,151,234 | ) |
| | | | | | | | | | | | |
Recently Adopted Accounting Standards—In June 2011, the FASB issued guidance under FASB ASC No. 220 –Comprehensive Income that defines the presentation of Comprehensive Income in the financial statements. According to the guidance, an entity may present a single continuous statement of comprehensive income or two separate statements – a statement of income and a statement of other comprehensive income that immediately follows the statement of income. In either presentation, the entity is required to present on the face of the financial statement the components of other comprehensive income including the reclassification adjustment for items that are reclassified from other comprehensive income to net income. In December 2011, the FASB issued additional guidance under FASB ASC No. 220 that deferred the effective date of earlier guidance with regard to the presentation of reclassifications of items out of accumulated other comprehensive income. All other provisions of the original guidance remain in effect. The new requirements have been included in the Consolidated Statements of Comprehensive Income presented in the Company’s financial statements. Additional information is provided in the Other Comprehensive Income section above.
In February 2013, the FASB issued additional guidance regarding the reporting of amounts reclassified out of accumulated other comprehensive income. Under the new provisions, an entity must present the effects on the line items of net income of significant amounts reclassified out of accumulated comprehensive income. The disclosures required under this guidance are provided above.
Recently Issued Accounting Standards—In December 2011, the FASB issued disclosure guidance under FASB ASC No. 210 –Balance Sheet that requires an entity to disclose information about offsetting and related arrangements that enable users of its financial statements to understand the effect of those arrangements on its financial position. Management is currently evaluating the requirements of this guidance but does not anticipate these changes to have a material impact on its financial position. The new requirements are effective on a retrospective basis for annual reporting periods, and interim periods within those annual periods, beginning on or after January 1, 2013.
Other accounting standards that have been issued or proposed by the FASB or other standard–setting bodies are not currently applicable to the Company or are not expected to have a significant impact on the Company’s financial position, results of operations and cash flows.
The SCC exercises regulatory authority over the natural gas operations of Roanoke Gas Company. Such regulation encompasses terms, conditions and rates to be charged to customers for natural gas service, safety standards, service extension, accounting and depreciation.
On November 1, 2012 the Company placed into effect new base rates, subject to refund, that provided for approximately $1,840,000 in additional non-gas revenues. On April 16, 2013, the SCC issued a final order granting the Company a rate award in the amount of $649,639 in additional non-gas revenues while maintaining a 9.75% authorized return on equity. During May 2013, the Company completed its refund for the difference between the rates placed into effect November 1 and the final rates approved in the Commission order.
On August 16, 2013, the Company filed an application for a modification to the SAVE (Steps to Advance Virginia’s Energy) Plan and Rider. The original SAVE Plan and Rider were approved by the SCC through an order issued on August 29, 2012. The original SAVE plan was designed to facilitate the accelerated replacement of aging natural gas infrastructure assets by providing a mechanism for the Company to recover the related depreciation and expenses and return on rate base of the additional capital investment without the filing of a formal application for an increase in non-gas base rates. Under the original filing, the SAVE Plan primarily covered replacement of the Company’s bare steel
- 15 -
and cast iron natural gas distribution pipe. Under the modification, the Company is seeking to include two unique projects; the replacement of the boil off compressor at the Company’s liquified natural gas (LNG) plant and modifications to the natural gas transfer station located in Gala, VA in the 2014 SAVE Plan year. These replacements will enhance the safety and reliability of the Company’s gas distribution system.
On September 13, 2013, the Company filed a request for an expedited increase in rates with the SCC. The request was for an increase of approximately $1,664,000 in annual non-gas revenues. As provided for under this expedited rate request, the Company will be able to place the increased rates into effect for service rendered on or after November 1, 2013, subject to refund pending a final order by the SCC. The public hearing on the request for this rate increase is scheduled for March 25, 2014, with a final order expected after that date.
The Company has available an unsecured line-of-credit with a bank which will expire March 31, 2014. The Company anticipates being able to extend or replace this line-of-credit upon expiration. The Company’s available unsecured line-of-credit varies during the year to accommodate its seasonal borrowing demands. Available limits under this agreement for the remaining term are as follows:
| | | | |
Effective | | Available
Line-of-Credit | |
September 30, 2013 | | $ | 5,000,000 | |
November 23, 2013 | | | 7,000,000 | |
January 25, 2014 | | | 5,000,000 | |
March 1, 2014 | | | 1,000,000 | |
A summary of the line-of-credit follows:
| | | | | | | | | | | | |
| | | September 30 | |
| | | 2013 | | | 2012 | | | 2011 | |
Line-of-credit at year-end | | $ | 5,000,000 | | | $ | 3,000,000 | | | $ | 3,000,000 | |
Outstanding balance at year-end | | | — | | | | — | | | | — | |
Highest month-end balance outstanding | | | 1,414,955 | | | | — | | | | — | |
Average daily balance | | | 80,593 | | | | — | | | | — | |
Average rate of interest during year on outstanding balances | | | 1.21 | % | | | — | % | | | — | % |
Interest rate at year-end | | | 1.18 | % | | | 1.22 | % | | | 1.24 | % |
Interest rate on unused line-of-credit | | | 0.15 | % | | | 0.15 | % | | | 0.15 | % |
On March 31, 2013, the Company executed an unsecured term note in the amount of $15,000,000. This note continues to extend the maturity date of the original promissory note dated November 28, 2005. The term note, which has a maturity date of March 31, 2014, retains all other terms and conditions provided for in the original promissory note including an interest rate of 30-day LIBOR plus 69 basis point spread. The Company also has an interest rate swap related to the $15,000,000 note. This swap was executed in November 2005 in connection with the original promissory note with a maturity date of November 30, 2015. This swap essentially converts the variable rate note into fixed rate debt with a 5.74% interest rate. The Company anticipates being able to extend the maturity date of the $15,000,000 note on an annual basis at terms comparable to the note currently in place until such time the note co-terminates with the corresponding interest rate swap.
- 16 -
Long-term debt consists of the following:
| | | | | | | | |
| | | September 30 | |
| | | 2013 | | | 2012 | |
Unsecured note payable, with variable interest rate based on three month LIBOR (0.25% at September 30, 2013) plus 125 basis point spread, with provision for retirement on December 1, 2015 | | $ | 5,000,000 | | | $ | 5,000,000 | |
Unsecured senior note payable, at 7.66%, with provision for retirement of $1,600,000 each year beginning December 1, 2014 through December 1, 2018 | | | 8,000,000 | | | | 8,000,000 | |
| | | | | | | | |
Total long-term debt | | | 13,000,000 | | | | 13,000,000 | |
Less current maturities | | | — | | | | — | |
| | | | | | | | |
Total long-term debt | | $ | 13,000,000 | | | $ | 13,000,000 | |
| | | | | | | | |
The above debt obligations contain various provisions, including a minimum interest charge coverage ratio, limitations on debt as a percentage of total capitalization and a provision restricting the payment of dividends, primarily based on the earnings of the Company and dividends previously paid. The Company was in compliance with these provisions at September 30, 2013 and 2012. At September 30, 2013, approximately $11,103,000 of retained earnings was available for dividends.
The $5,000,000 variable rate note also has an interest rate swap that converts the note into a fixed rate debt with a 5.79% effective interest rate. The interest rate swap matures on December 1, 2015.
The aggregate annual maturities of long-term debt for the next five years ending after September 30, 2013 are as follows:
| | | | |
Year Ending September 30 | | Maturities | |
2014 | | $ | — | |
2015 | | | 1,600,000 | |
2016 | | | 6,600,000 | |
2017 | | | 1,600,000 | |
2018 | | | 1,600,000 | |
Thereafter | | | 1,600,000 | |
| | | | |
Total | | $ | 13,000,000 | |
| | | | |
The details of income tax expense (benefit) are as follows:
| | | | | | | | | | | | |
| | | Years Ended September 30 | |
| | | 2013 | | | 2012 | | | 2011 | |
Current income taxes: | | | | | | | | | | | | |
Federal | | $ | 1,404,450 | | | $ | (38,608 | ) | | $ | (178,190 | ) |
State | | | 453,347 | | | | 232,270 | | | | 263,898 | |
| | | | | | | | | | | | |
Total current income taxes | | | 1,857,797 | | | | 193,662 | | | | 85,708 | |
| | | | | | | | | | | | |
Deferred income taxes: | | | | | | | | | | | | |
Federal | | | 829,080 | | | | 2,269,921 | | | | 2,586,877 | |
State | | | (33,051 | ) | | | 184,405 | | | | 189,224 | |
| | | | | | | | | | | | |
Total deferred income taxes | | | 796,029 | | | | 2,454,326 | | | | 2,776,101 | |
| | | | | | | | | | | | |
Amortization of investment tax credits | | | (9,039 | ) | | | (9,039 | ) | | | (14,698 | ) |
| | | | | | | | | | | | |
Total income tax expense | | $ | 2,644,787 | | | $ | 2,638,949 | | | $ | 2,847,111 | |
| | | | | | | | | | | | |
- 17 -
Income tax expense for the years ended September 30, 2013, 2012 and 2011 differed from amounts computed by applying the U.S. Federal income tax rate of 34% to earnings before income taxes due to the following:
| | | | | | | | | | | | |
| | | Years Ended September 30 | |
| | | 2013 | | | 2012 | | | 2011 | |
Income before income taxes | | $ | 6,906,839 | | | $ | 6,935,694 | | | $ | 7,500,584 | |
| | | | | | | | | | | | |
Income tax expense computed at the federal statutory rate | | $ | 2,348,325 | | | $ | 2,358,136 | | | $ | 2,550,199 | |
State income taxes, net of federal income tax benefit | | | 277,395 | | | | 275,005 | | | | 299,061 | |
Amortization of investment tax credits | | | (9,039 | ) | | | (9,039 | ) | | | (14,698 | ) |
Other, net | | | 28,106 | | | | 14,847 | | | | 12,549 | |
| | | | | | | | | | | | |
Total income tax expense | | $ | 2,644,787 | | | $ | 2,638,949 | | | $ | 2,847,111 | |
| | | | | | | | | | | | |
The tax effects of temporary differences that give rise to the deferred tax assets and deferred tax liabilities are as follows:
| | | | | | | | |
| | | September 30 | |
| | | 2013 | | | 2012 | |
Deferred tax assets: | | | | | | | | |
Allowance for uncollectibles | | $ | 26,017 | | | $ | 24,757 | |
Accrued pension and postretirement medical benefits | | | 1,997,001 | | | | 2,698,204 | |
Accrued vacation | | | 229,669 | | | | 232,516 | |
Over-recovery of gas costs | | | 389,965 | | | | — | |
Costs of gas held in storage | | | 1,055,768 | | | | 1,181,336 | |
Accrued gas costs | | | 8,999 | | | | — | |
Deferred compensation | | | 493,088 | | | | 510,288 | |
Interest rate swap | | | 754,149 | | | | 1,107,186 | |
Other | | | 214,172 | | | | 279,981 | |
| | | | | | | | |
Total gross deferred tax assets | | | 5,168,828 | | | | 6,034,268 | |
| | | | | | | | |
Deferred tax liabilities: | | | | | | | | |
Utility plant | | | 16,593,351 | | | | 14,925,657 | |
Under-recovery of gas costs | | | — | | | | 260,859 | |
Accrued gas costs | | | — | | | | 374,321 | |
| | | | | | | | |
Total gross deferred tax liabilities | | | 16,593,351 | | | | 15,560,837 | |
| | | | | | | | |
Net deferred tax liability | | $ | 11,424,523 | | | $ | 9,526,569 | |
| | | | | | | | |
FASB ASC No. 740 -Income Taxes provides for the determination of whether tax benefits claimed or expected to be claimed on a tax return should be recognized in the financial statements. The Company has evaluated its tax positions and accordingly has not identified any significant uncertain tax positions. The Company’s policy is to classify interest associated with uncertain tax positions as interest expense in the financial statements. Penalties are classified under other expense.
The Company files a consolidated federal income tax return and state income tax returns in Virginia and West Virginia. The federal returns and the state returns for both Virginia and West Virginia for the tax years ended prior to September 30, 2010 are no longer subject to examination.
The Company sponsors both a noncontributory defined benefit pension plan and a postretirement benefit plan (“Plans”). The defined benefit pension plan covers substantially all employees and benefits fully vest after 5 years of credited service. Benefits paid to retirees are based on age at retirement, years of service and average compensation. The postretirement benefit plan provides certain healthcare, supplemental retirement and life insurance benefits to retired employees who meet specific age and service requirements. Employees hired prior to January 1, 2000 are eligible to participate in the postretirement benefit plan. Employees must have a minimum of 10 years of service and
- 18 -
retire after attaining the age of 55 in order to vest in the postretirement plan. Retiree contributions to the plan are based on the number of years of service to the Company as determined under the defined benefit plan.
Employers who sponsor defined benefit plans must recognize the funded status of defined benefit pension and other postretirement plans as an asset or liability in its statement of financial position and recognize changes in that funded status in the year in which the changes occur through comprehensive income. For pension plans, the benefit obligation is the projected benefit obligation, and for other postretirement plans, the benefit obligation is the accumulated benefit obligation. The Company established a regulatory asset for the portion of the obligation expected to be recovered in rates in future periods. The regulatory asset is adjusted for the amortization of the transition obligation and recognition of actuarial gains and losses. The portion of the obligation attributable to the unregulated operations of the holding company is recognized in other comprehensive income.
The following tables set forth the benefit obligation, fair value of plan assets, the funded status of the benefit plans, amounts recognized in the Company’s financial statements and the assumptions used.
| | | | | | | | | | | | | | | | |
| | | Pension Plan | | | Postretirement Plan | |
| | | 2013 | | | 2012 | | | 2013 | | | 2012 | |
Accumulated benefit obligation | | $ | 17,909,824 | | | $ | 18,993,062 | | | $ | 13,028,628 | | | $ | 13,707,308 | |
| | | | | | | | | | | | | | | | |
Change in benefit obligation: | | | | | | | | | | | | | | | | |
Benefit obligation at beginning of year | | $ | 23,570,451 | | | $ | 19,167,918 | | | $ | 13,707,309 | | | $ | 12,185,319 | |
Service cost | | | 634,892 | | | | 521,701 | | | | 213,131 | | | | 195,777 | |
Interest cost | | | 946,247 | | | | 953,197 | | | | 531,845 | | | | 592,359 | |
Actuarial (gain) loss | | | (3,105,394 | ) | | | 3,445,737 | | | | (939,539 | ) | | | 1,128,635 | |
Benefit payments, net of retiree contributions | | | (577,427 | ) | | | (518,102 | ) | | | (484,118 | ) | | | (394,781 | ) |
| | | | | | | | | | | | | | | | |
Benefit obligation at end of year | | $ | 21,468,769 | | | $ | 23,570,451 | | | $ | 13,028,628 | | | $ | 13,707,309 | |
| | | | | | | | | | | | | | | | |
Change in fair value of plan assets: | | | | | | | | | | | | | | | | |
Fair value of plan assets at beginning of year | | $ | 16,063,381 | | | $ | 12,992,723 | | | $ | 8,673,128 | | | $ | 7,033,605 | |
Actual return on plan assets, net of taxes | | | 2,215,308 | | | | 2,488,760 | | | | 1,075,052 | | | | 1,184,304 | |
Employer contributions | | | 1,100,000 | | | | 1,100,000 | | | | 850,000 | | | | 850,000 | |
Benefit payments, net of retiree contributions | | | (577,427 | ) | | | (518,102 | ) | | | (484,118 | ) | | | (394,781 | ) |
| | | | | | | | | | | | | | | | |
Fair value of plan assets at end of year | | $ | 18,801,262 | | | $ | 16,063,381 | | | $ | 10,114,062 | | | $ | 8,673,128 | |
| | | | | | | | | | | | | | | | |
Funded status | | $ | (2,667,507 | ) | | $ | (7,507,070 | ) | | $ | (2,914,566 | ) | | $ | (5,034,181 | ) |
| | | | | | | | | | | | | | | | |
Amounts recognized in the balance sheets consist of: | | | | | | | | | | | | | | | | |
Noncurrent liabilities | | $ | (2,667,507 | ) | | $ | (7,507,070 | ) | | $ | (2,914,566 | ) | | $ | (5,034,181 | ) |
| | | | | | | | | | | | | | | | |
Amounts recognized in accumulated other comprehensive loss: | | | | | | | | | | | | | | | | |
Transition obligation, net of tax | | $ | — | | | $ | — | | | $ | — | | | $ | 22,303 | |
Net actuarial loss, net of tax | | | 591,195 | | | | 1,568,916 | | | | 327,493 | | | | 549,335 | |
| | | | | | | | | | | | | | | | |
Total amounts included in other comprehensive loss, net of tax | | $ | 591,195 | | | $ | 1,568,916 | | | $ | 327,493 | | | $ | 571,638 | |
| | | | | | | | | | | | | | | | |
Amounts deferred to a regulatory asset: | | | | | | | | | | | | | | | | |
Transition obligation | | $ | — | | | $ | — | | | $ | — | | | $ | 105,699 | |
Net actuarial loss | | | 2,581,852 | | | | 5,719,060 | | | | 1,869,422 | | | | 3,315,566 | |
| | | | | | | | | | | | | | | | |
Amounts recognized as regulatory assets | | $ | 2,581,852 | | | $ | 5,719,060 | | | $ | 1,869,422 | | | $ | 3,421,265 | |
| | | | | | | | | | | | | | | | |
The Company expects that approximately $42,000, before tax, of accumulated other comprehensive loss will be recognized as a portion of net periodic benefit costs in fiscal 2014 and approximately $184,000 of amounts deferred as regulatory assets will be amortized and recognized in net periodic benefit costs in fiscal 2014.
The Company amortized the unrecognized transition obligation over 20 years ending in June 2013.
- 19 -
The following table details the actuarial assumptions used in determining the projected benefit obligations and net benefit cost of the pension and the accumulated benefit obligations and net benefit cost of the postretirement plan for 2013, 2012 and 2011.
| | | | | | | | | | | | | | | | | | | | | | | | |
| | | Pension Plan | | | Postretirement Plan | |
| | | 2013 | | | 2012 | | | 2011 | | | 2013 | | | 2012 | | | 2011 | |
Assumptions used to determine benefit obligations: | | | | | | | | | | | | | | | | | | | | | | | | |
Discount rate | | | 4.82 | % | | | 4.06 | % | | | 5.04 | % | | | 4.73 | % | | | 3.95 | % | | | 4.96 | % |
Expected rate of compensation increase | | | 4.00 | % | | | 4.00 | % | | | 4.00 | % | | | N/A | | | | N/A | | | | N/A | |
| | | | | | |
Assumptions used to determine benefit costs: | | | | | | | | | | | | | | | | | | | | | | | | |
Discount rate | | | 4.06 | % | | | 5.04 | % | | | 5.25 | % | | | 3.95 | % | | | 4.96 | % | | | 5.00 | % |
Expected long-term rate of return on plan assets | | | 7.25 | % | | | 7.25 | % | | | 7.25 | % | | | 5.11 | % | | | 5.11 | % | | | 5.09 | % |
Expected rate of compensation increase | | | 4.00 | % | | | 4.00 | % | | | 4.00 | % | | | N/A | | | | N/A | | | | N/A | |
To develop the expected long-term rate of return on assets assumption, the Company, with input from the plans actuaries and investment advisors, considered the historical returns and the future expectations for returns for each asset class, as well as the target asset allocation of each plan’s portfolio. This resulted in the selection of the corresponding long-term rate of return assumptions used for each plan’s assets.
Components of net periodic benefit cost are as follows:
| | | | | | | | | | | | | | | | | | | | | | | | |
| | | Pension Plan | | | Postretirement Plan | |
| | | 2013 | | | 2012 | | | 2011 | | | 2013 | | | 2012 | | | 2011 | |
Service cost | | $ | 634,892 | | | $ | 521,701 | | | $ | 479,236 | | | $ | 213,131 | | | $ | 195,777 | | | $ | 194,842 | |
Interest cost | | | 946,247 | | | | 953,197 | | | | 908,873 | | | | 531,845 | | | | 592,359 | | | | 579,976 | |
Expected return on plan assets | | | (1,184,787 | ) | | | (959,178 | ) | | | (928,207 | ) | | | (452,383 | ) | | | (367,359 | ) | | | (357,278 | ) |
Amortization of unrecognized transition obligation | | | — | | | | — | | | | — | | | | 141,671 | | | | 188,892 | | | | 188,892 | |
Recognized loss | | | 578,263 | | | | 475,414 | | | | 327,173 | | | | 241,747 | | | | 239,387 | | | | 201,151 | |
| | | | | | | | | | | | | | | | | | | | | | | | |
Net periodic benefit cost | | $ | 974,615 | | | $ | 991,134 | | | $ | 787,075 | | | $ | 676,011 | | | $ | 849,056 | | | $ | 807,583 | |
| | | | | | | | | | | | | | | | | | | | | | | | |
The assumed health care cost trend rates used in measuring the accumulated benefit obligation for the postretirement medical plan as of September 30, 2013, 2012 and 2011 are presented below:
| | | | | | | | | | | | | | | | | | | | | | | | |
| | | Pre 65 | | | Post 65 | |
| | | 2013 | | | 2012 | | | 2011 | | | 2013 | | | 2012 | | | 2011 | |
Health care cost trend rate assumed for next year | | | 9.00 | % | | | 9.00 | % | | | 10.00 | % | | | 5.00 | % | | | 6.00 | % | | | 7.00 | % |
Rate to which the cost trend is assumed to decline (the ultimate trend rate) | | | 5.00 | % | | | 5.00 | % | | | 5.00 | % | | | 5.00 | % | | | 5.00 | % | | | 5.00 | % |
Year that the rate reaches the ultimate trend rate | | | 2021 | | | | 2016 | | | | 2017 | | | | 2013 | | | | 2013 | | | | 2013 | |
The health care cost trend rate assumptions could have a significant effect on the amounts reported. A change of 1% would have the following effects:
| | | | | | | | |
| | | 1% Increase | | | 1% Decrease | |
Effect on total service and interest cost components | | $ | 130,000 | | | $ | (105,000 | ) |
Effect on accumulated postretirement benefit obligation | | | 1,911,000 | | | | (1,568,000 | ) |
The primary objectives of the Plan’s investment policy are to maintain investment portfolios that diversify risk through prudent asset allocation parameters, achieve asset returns that meet or exceed the plans’ actuarial assumptions, achieve asset returns that are competitive with like institutions employing similar investment strategies and meet expected future benefits in both the short-term and long-term. The investment policy provides for a range of investment allocations to allow for flexibility in responding to market conditions. The investment policy is periodically reviewed by the Company and a third-party fiduciary for investment matters.
- 20 -
The Company’s target and actual asset allocation in the pension and postretirement benefit plans as of September 30, 2013 and 2012 were:
| | | | | | | | | | | | | | | | | | | | | | | | |
| | | Pension Plan | | | Postretirement
Plan | |
| | | Target | | | 2013 | | | 2012 | | | Target | | | 2013 | | | 2012 | |
Asset category: | | | | | | | | | | | | | | | | | | | | | | | | |
Equity securities | | | 60 | % | | | 63 | % | | | 59 | % | | | 50 | % | | | 62 | % | | | 60 | % |
Debt securities | | | 40 | % | | | 37 | % | | | 38 | % | | | 50 | % | | | 36 | % | | | 39 | % |
Cash | | | — | % | | | — | % | | | 3 | % | | | — | % | | | 1 | % | | | 1 | % |
Other | | | — | % | | | — | % | | | — | % | | | — | % | | | 1 | % | | | — | % |
The assets of the plans are invested in mutual funds. The Company uses the fair value hierarchy described in Note 1 to classify these assets. The mutual funds are included under Level 2 in the fair value hierarchy as their fair values are determined based on individual prices for each security that comprises the mutual funds. Most all of the individual investments are determined based on quoted market prices for each security; however, certain fixed income securities and other investments are not actively traded and are valued based on similar investments. The following table contains the fair value classifications of the benefit plan assets:
| | | | | | | | | | | | | | | | |
| | | | | | Defined Benefit Pension Plan
Fair Value Measurements - September 30, 2013 | |
| | | Fair Value | | | Level 1 | | | Level 2 | | | Level 3 | |
Asset Class: | | | | | | | | | | | | | | | | |
Cash | | $ | 66,084 | | | $ | 66,084 | | | $ | — | | | $ | — | |
Common and Collective Trust and | | | | | | | | | | | | | | | | |
Pooled Funds: | | | | | | | | | | | | | | | | |
Bonds | | | | | | | | | | | | | | | | |
Domestic Fixed Income | | | 2,043,005 | | | | — | | | | 2,043,005 | | | | — | |
Equities | | | | | | | | | | | | | | | | |
Domestic Large Cap Growth | | | 2,769,927 | | | | — | | | | 2,769,927 | | | | — | |
Domestic Large Cap Value | | | 3,430,746 | | | | — | | | | 3,430,746 | | | | — | |
Domestic Small/Mid Cap Core | | | 1,770,381 | | | | — | | | | 1,770,381 | | | | — | |
Mutual Funds: | | | | | | | | | | | | | | | | |
Bonds | | | | | | | | | | | | | | | | |
Domestic Fixed Income | | | 4,326,814 | | | | — | | | | 4,326,814 | | | | — | |
Foreign Fixed Income | | | 597,799 | | | | — | | | | 597,799 | | | | — | |
Equities | | | | | | | | | | | | | | | | |
Domestic Large Cap Growth | | | 2,115,392 | | | | — | | | | 2,115,392 | | | | — | |
Foreign Large Cap Value | | | 698,554 | | | | — | | | | 698,554 | | | | — | |
Foreign Large Cap Core | | | 982,560 | | | | — | | | | 982,560 | | | | — | |
| | | | | | | | | | | | | | | | |
Total | | $ | 18,801,262 | | | $ | 66,084 | | | $ | 18,735,178 | | | $ | — | |
| | | | | | | | | | | | | | | | |
- 21 -
| | | | | | | | | | | | | | | | |
| | | | | | Defined Benefit Pension Plan
Fair Value Measurements - September 30, 2012 | |
| | | Fair Value | | | Level 1 | | | Level 2 | | | Level 3 | |
Asset Class: | | | | | | | | | | | | | | | | |
Cash | | $ | 522,626 | | | $ | 522,626 | | | $ | — | | | $ | — | |
Common and Collective Trust | | | | | | | | | | | | | | | | |
Bonds | | | | | | | | | | | | | | | | |
Domestic Fixed Income | | | 2,040,204 | | | | — | | | | 2,040,204 | | | | — | |
Mutual Funds | | | | | | | | | | | | | | | | |
Bonds | | | | | | | | | | | | | | | | |
Domestic Fixed Income | | | 3,349,538 | | | | — | | | | 3,349,538 | | | | — | |
Foreign Fixed Income | | | 631,442 | | | | — | | | | 631,442 | | | | — | |
Equities | | | | | | | | | | | | | | | | |
Domestic Large Cap Growth | | | 3,101,385 | | | | — | | | | 3,101,385 | | | | — | |
Domestic Large Cap Value | | | 3,114,649 | | | | — | | | | 3,114,649 | | | | — | |
Domestic Small/Mid Cap Core | | | 1,414,211 | | | | — | | | | 1,414,211 | | | | — | |
Foreign Large Cap Growth | | | 661,895 | | | | — | | | | 661,895 | | | | — | |
Foreign Large Cap Core | | | 1,227,431 | | | | — | | | | 1,227,431 | | | | — | |
| | | | | | | | | | | | | | | | |
Total | | $ | 16,063,381 | | | $ | 522,626 | | | $ | 15,540,755 | | | $ | — | |
| | | | | | | | | | | | | | | | |
| | |
| | | | | | Postretirement Benefit Plan
Fair Value Measurements - September 30, 2013 | |
| | | Fair Value | | | Level 1 | | | Level 2 | | | Level 3 | |
Asset Class: | | | | | | | | | | | | | | | | |
Cash | | $ | 124,350 | | | $ | 124,350 | | | $ | — | | | $ | — | |
Mutual Funds | | | | | | | | | | | | | | | | |
Bonds | | | | | | | | | | | | | | | | |
Domestic Fixed Income | | | 3,448,416 | | | | — | | | | 3,448,416 | | | | — | |
Foreign Fixed Income | | | 214,528 | | | | — | | | | 214,528 | | | | — | |
Equities | | | | | | | | | | | | | | | | |
Domestic Large Cap Growth | | | 2,277,582 | | | | — | | | | 2,277,582 | | | | — | |
Domestic Large Cap Value | | | 1,671,591 | | | | — | | | | 1,671,591 | | | | — | |
Domestic Small/Mid Cap Growth | | | 480,438 | | | | — | | | | 480,438 | | | | — | |
Domestic Small/Mid Cap Value | | | 467,661 | | | | — | | | | 467,661 | | | | — | |
Domestic Small/Mid Cap Core | | | 35,809 | | | | — | | | | 35,809 | | | | — | |
Foreign Large Cap Growth | | | 420,153 | | | | — | | | | 420,153 | | | | — | |
Foreign Large Cap Value | | | 386,684 | | | | — | | | | 386,684 | | | | — | |
Foreign Large Cap Core | | | 534,747 | | | | — | | | | 534,747 | | | | — | |
Other | | | 52,103 | | | | — | | | | 52,103 | | | | — | |
| | | | | | | | | | | | | | | | |
Total | | $ | 10,114,062 | | | $ | 124,350 | | | $ | 9,989,712 | | | $ | — | |
| | | | | | | | | | | | | | | | |
- 22 -
| | | | | | | | | | | | | | | | |
| | | | | | Postretirement Benefit Plan
Fair Value Measurements - September 30, 2012 | |
| | | Fair Value | | | Level 1 | | | Level 2 | | | Level 3 | |
Asset Class: | | | | | | | | | | | | | | | | |
Cash | | $ | 63,991 | | | $ | 63,991 | | | $ | — | | | $ | — | |
Mutual Funds | | | | | | | | | | | | | | | | |
Bonds | | | | | | | | | | | | | | | | |
Domestic Fixed Income | | | 3,121,786 | | | | — | | | | 3,121,786 | | | | — | |
Foreign Fixed Income | | | 226,562 | | | | — | | | | 226,562 | | | | — | |
Equities | | | | | | | | | | | | | | | | |
Domestic Large Cap Growth | | | 1,597,675 | | | | — | | | | 1,597,675 | | | | — | |
Domestic Large Cap Value | | | 1,719,786 | | | | — | | | | 1,719,786 | | | | — | |
Domestic Small/Mid Cap Growth | | | 367,369 | | | | — | | | | 367,369 | | | | — | |
Domestic Small/Mid Cap Value | | | 381,378 | | | | — | | | | 381,378 | | | | — | |
Domestic Small/Mid Cap Core | | | 35,450 | | | | — | | | | 35,450 | | | | — | |
Foreign Large Cap Growth | | | 381,020 | | | | — | | | | 381,020 | | | | — | |
Foreign Large Cap Core | | | 727,867 | | | | — | | | | 727,867 | | | | — | |
Other | | | 50,244 | | | | — | | | | 50,244 | | | | — | |
| | | | | | | | | | | | | | | | |
Total | | $ | 8,673,128 | | | $ | 63,991 | | | $ | 8,609,137 | | | $ | — | |
| | | | | | | | | | | | | | | | |
Each mutual fund has been categorized based on its primary investment strategy.
The Company expects to contribute $500,000 to its pension plan and $500,000 to its postretirement benefit plan in fiscal 2014.
The following table reflects expected future benefit payments:
| | | | | | | | |
Fiscal year ending September 30 | | Pension
Plan | | | Postretirement
Plan | |
2014 | | $ | 608,543 | | | $ | 556,997 | |
2015 | | | 631,566 | | | | 588,359 | |
2016 | | | 641,345 | | | | 624,335 | |
2017 | | | 678,723 | | | | 622,733 | |
2018 | | | 753,561 | | | | 613,201 | |
2019-2023 | | | 5,264,988 | | | | 3,549,388 | |
The Company also sponsors a defined contribution plan (“401k Plan”) covering all employees who elect to participate. Employees may contribute from 1% to 50% of their annual compensation to the 401k Plan, limited to a maximum annual amount as set periodically by the Internal Revenue Service. The Company matches 100% of the participant’s first 4% of contributions and 50% on the next 2% of contributions. Company matching contributions were $306,382, $295,584 and $274,701 for 2013, 2012 and 2011, respectively.
The Company’s stockholders approved the RGC Resources, Inc. Key Employee Stock Option Plan (“KESOP”). The KESOP provides for the issuance of common stock options to officers and certain other full-time salaried employees to acquire shares of the Company’s common stock. As of September 30, 2012, the number of shares available for future grants under the Plan was 4,000 shares. On February 4, 2013, the Company’s shareholders approved an additional 100,000 shares for future grants. As of September 30, 2013, the number of shares available for future grants was 83,000.
- 23 -
FASB ASC No. 718 -Compensation-Stock Compensation requires that compensation expense be recognized for the issuance of equity instruments to employees. During 2013, the Board approved a stock option grant. As required by the KEYSOP, each option’s exercise price per share equaled the fair value of the Company’s common stock on the grant date. Pursuant to the Plan, the options vest over a six-month period and are exercisable over a ten-year period from the date of issuance.
As the Company stock options are not traded on the open market, the fair value of each grant is estimated on the date of grant using the Black-Scholes option pricing model including the following assumptions:
| | | | | | | | | | | | |
| | | Years Ended September 30, | |
| | | 2013 | | | 2012 | | | 2011 | |
Expected volatility | | | 34.75 | % | | | N/A | | | | N/A | |
Expected dividends | | | 4.32 | % | | | N/A | | | | N/A | |
Expected exercise term (years) | | | 7.00 | | | | N/A | | | | N/A | |
Risk-free interest rate | | | 1.23 | % | | | N/A | | | | N/A | |
The underlying methods regarding each assumption are as follows:
Expected volatility is based on the historical volatilities of the daily closing price of the Company’s common stock.
Expected dividend rate is based on historical dividend payout trends.
Expected exercise term is based on the average time historical option grants were outstanding before being exercised.
Risk-free interest rate is based on the 7-year Treasury rate on the date of option grant.
Noforfeitures are assumed to occur.
- 24 -
Stock option transactions under the Company’s plans for the years ended September 30, 2013, 2012 and 2011 are summarized below:
| | | | | | | | | | | | | | | | |
| | | Number
of Shares | | | Weighted-
Average
Exercise
Price | | | Weighted-
Average
Remaining
Contractual
Terms (years) | | | Aggregate
Intrinsic Value | |
Options outstanding, September 30, 2010 | | | 28,000 | | | $ | 9.42 | | | | 1.4 | | | $ | 158,965 | |
Options granted | | | — | | | | — | | | | | | | | | |
Options exercised | | | (17,000 | ) | | | 9.66 | | | | | | | | | |
Options expired | | | — | | | | — | | | | | | | | | |
Options forfeited | | | — | | | | — | | | | | | | | | |
| | | | | | | | | | | | | | | | |
Options outstanding, September 30, 2011 | | | 11,000 | | | | 9.05 | | | | 1.2 | | | | 105,600 | |
Options granted | | | — | | | | — | | | | | | | | | |
Options exercised | | | (11,000 | ) | | | 9.05 | | | | | | | | | |
Options expired | | | — | | | | — | | | | | | | | | |
Options forfeited | | | — | | | | — | | | | | | | | | |
| | | | | | | | | | | | | | | | |
Options outstanding, September 30, 2012 | | | — | | | | — | | | | — | | | | — | |
Options granted | | | 21,000 | | | | 19.01 | | | | | | | | | |
Options exercised | | | — | | | | — | | | | | | | | | |
Options expired | | | — | | | | — | | | | | | | | | |
Options forfeited | | | — | | | | — | | | | | | | | | |
| | | | | | | | | | | | | | | | |
Options outstanding, September 30, 2013 | | | 21,000 | | | $ | 19.01 | | | | 9.5 | | | $ | 5,229 | |
| | | | | | | | | | | | | | | | |
| | | | |
Vested and exercisable at September 30, 2013 | | | 21,000 | | | $ | 19.01 | | | | 9.5 | | | $ | 5,229 | |
The weighted-average grant-date fair value of options granted during the year ended September 30, 2013 was $4.04. The intrinsic value of the options exercised during fiscal 2012 and 2011 were $91,721 and $107,335. The Company recognized $84,840 in stock option expense in during fiscal 2013.
The Company received $99,550 and $164,285 from the exercise of options in 2012 and 2011, respectively.
- 25 -
Dividend Reinvestment and Stock Purchase Plan
The Company offers a Dividend Reinvestment and Stock Purchase Plan (“DRIP”) to shareholders of record for the reinvestment of dividends and the purchase of additional investments of up to $40,000 per year in shares of common stock of the Company. Under the DRIP plan, the Company issued 24,905, 25,077 and 48,316 shares in 2013, 2012 and 2011, respectively, after adjusting for the stock split. As of September 30, 2013, the Company had 366,815 shares of stock available for issuance under the DRIP Plan.
Restricted Stock Plan
The Board of Directors of the Company implemented the Restricted Stock Plan for Outside Directors (“Plan”) effective January 27, 1997. Under the Plan, a minimum of 40% of the monthly retainer fee paid to each non-employee director of Resources is paid in shares of common stock (“Restricted Stock”). The number of shares of Restricted Stock is calculated each month based on the closing sales price of Resources’ common stock on the NASDAQ Global Market on the first business day of the month. The Restricted Stock issued under this Plan vests only in the case of a participant’s death, disability, retirement, or in the event of a change in control of Resources. The Restricted Stock may not be sold, transferred, assigned or pledged by the participant until the shares have vested under the terms of this Plan. The shares of Restricted Stock will be forfeited to Resources by a participant’s voluntary resignation during his or her term on the Board or removal for cause as a director.
The Company assumes all directors will complete their term and there will be no forfeiture of the Restricted Stock. Since the inception of the Plan, no director has forfeited any shares of Restricted Stock. The Company recognizes as compensation the market value of the Restricted Stock in the period it is issued.
The following table reflects the director compensation activity pursuant to the Restricted Stock Plan:
| | | | | | | | | | | | | | | | | | | | | | | | |
| | | 2013 | | | 2012 | | | 2011 | |
| | | Shares | | | Weighted-Average
Fair Value on
Date of Grant | | | Shares | | | Weighted-Average
Fair Value on
Date of Grant | | | Shares | | | Weighted-Average
Fair Value on
Date of Grant | |
Beginning of year balance | | | 54,011 | | | $ | 13.51 | | | | 61,955 | | | $ | 12.81 | | | | 56,169 | | | $ | 12.45 | |
Granted | | | 5,053 | | | | 18.93 | | | | 5,327 | | | | 18.23 | | | | 5,786 | | | | 16.31 | |
Vested | | | — | | | | — | | | | (13,271 | ) | | | 12.16 | | | | — | | | | — | |
Forfeited | | | — | | | | — | | | | — | | | | — | | | | — | | | | — | |
| | | | | | | | | | | | | | | | | | | | | | | | |
End of year balance | | | 59,064 | | | $ | 13.97 | | | | 54,011 | | | $ | 13.51 | | | | 61,955 | | | $ | 12.81 | |
| | | | | | | | | | | | | | | | | | | | | | | | |
The fair market value of the Restricted Stock issued as compensation during fiscal 2013, 2012 and 2011 was $95,667, $97,133 and $94,350. The fair market value of the Restricted Stock vested during fiscal 2013, 2012 and 2011 is $0, $161,338 and $0, respectively.
As of September 30, 2013, the Company had 85,264 shares available for issuance. No shares of Restricted Stock were forfeited to Resources by a director during the fiscal year ended September 30, 2013.
Stock Bonus Plan
Under the Stock Bonus Plan, executive officers are encouraged to own a position in the Company’s common stock of at least 50% of the value of their annual salary. To promote this policy, the Plan provides that all officers with stock ownership positions below 50% of the value of their annual salaries must, unless approved by the Committee, receive no less than 50% of any performance bonus in the form of Company common stock. Shares from the Stock Bonus Plan may also be issued to certain employees and management personnel in recognition of their performance and service. Under the Stock Bonus Plan, the Company issued 4,022, 1,640 and 1,549 shares valued at $72,580, $30,763 and $24,160, respectively, in 2013, 2012 and 2011. As of September 30, 2013 the Company had 15,003 shares of stock available for issuance under the Stock Bonus Plan.
- 26 -
| 9. | COMMITMENTS AND CONTINGENCIES |
Roanoke Gas currently holds the only franchises and/or certificates of public convenience and necessity to distribute natural gas in its service area. These franchises are effective through January 1, 2016. Certificates of public convenience and necessity in Virginia are exclusive and are intended for perpetual duration.
Long-Term Contracts
Due to the nature of the natural gas distribution business, the Company has entered into agreements with both suppliers and pipelines to contract for natural gas commodity purchases, storage capacity and pipeline delivery capacity.
The Company obtains most of its regulated natural gas supply through an asset management contract between Roanoke Gas and a 3rd party asset manager. The current asset management contract expired October 31, 2013, and the Company has entered into a contract with a new asset manager effective November 1, 2013 to provide gas management services through March 2017. The Company utilizes an asset manager to optimize the use of its transportation, storage rights, and gas supply inventories which helps to ensure a secure and reliable source of natural gas. Under the asset management contract, the Company has designated the asset manager as agent for their storage capacity and all gas balances in storage. The asset manager provides agency service and manages the utilization of storage assets and the corresponding withdrawals from and injections into storage. The Company retains ownership of gas in storage. Under provisions of this contract, the Company is obligated to purchase its winter storage requirements during the spring and summer injection periods at market price. The table below details the volumetric obligations as of September 30, 2013 for the remainder of the contract period.
| | | | |
Years | | Natural Gas Contracts
(In Decatherms) | |
2013-2014 | | | 2,093,062 | |
2014-2015 | | | 2,071,061 | |
2015-2016 | | | 2,071,061 | |
2016-2017 | | | 295,866 | |
| | | | |
Total | | | 6,531,050 | |
| | | | |
The Company also has contracts for pipeline and storage capacity which extend for various periods. These capacity costs and related fees are valued at tariff rates in place as of September 30, 2013. These rates may increase or decrease in the future based upon rate filings and rate orders granting a rate change to the pipeline or storage operator. Roanoke Gas is currently served directly by two primary pipelines. These two pipelines deliver all the natural gas supplied to the Company’s customers. Depending upon weather conditions and the level of customer demand, failure of either of these transmission pipelines could have a major adverse impact on the Company. The Company expended approximately $35,348,000, $26,794,000 and $39,951,000 under the asset management, pipeline and storage contracts for Roanoke Gas in fiscal years 2013, 2012 and 2011, respectively. The table below details the pipeline and storage capacity obligations as of September 30, 2013 for the remainder of the contract period.
| | | | |
Year | | Pipeline and
Storage Capacity | |
2013-2014 | | $ | 11,328,754 | |
2014-2015 | | | 10,411,414 | |
2015-2016 | | | 10,353,922 | |
2016-2017 | | | 8,979,400 | |
2017-2018 | | | 6,851,208 | |
Thereafter | | | 7,574,341 | |
| | | | |
Total | | $ | 55,499,039 | |
| | | | |
Other Contracts
The Company maintains other agreements in the ordinary course of business covering various lease, maintenance, equipment and service contracts. These agreements currently extend through March 2020 and are not material to the Company.
- 27 -
Legal
From time to time, the Company may become involved in litigation or claims arising out of its operations in the normal course of business. Management currently believes the amount of ultimate liability, if any, with respect to these actions will not materially affect the Company’s financial position, results of operations, or liquidity.
Environmental Matters
Both Roanoke Gas Company and a previously owned gas subsidiary operated manufactured gas plants (MGPs) as a source of fuel for lighting and heating until the early 1950’s. A by-product of operating MGPs was coal tar, and the potential exists for on-site tar waste contaminants at the former plant sites. While the company does not currently recognize any commitments or contingencies related to environmental costs at either site, should the Company ever be required to remediate either site, it will pursue all prudent and reasonable means to recover any related costs, including the use of insurance claims and regulatory approval for rate case recognition of expenses associated with any work required.
| 10. | FAIR VALUE MEASUREMENTS |
The following table summarizes the Company’s financial assets and liabilities that are measured at fair value on a recurring basis and the fair value measurements by level within the fair value hierarchy as defined in Note 1 as of September 30, 2013 and 2012, respectively:
| | | | | | | | | | | | | | | | |
| | | | | | Fair Value Measurements - September 30, 2013 | |
| | | Fair Value | | | Quoted Prices in
Active Markets
Level 1 | | | Significant Other
Observable
Inputs
Level 2 | | | Significant
Unobservable
Inputs
Level 3 | |
Liabilities: | | | | | | | | | | | | | | | | |
Natural gas purchases | | $ | 1,177,521 | | | $ | — | | | $ | 1,177,521 | | | $ | — | |
Interest rate swaps | | | 1,986,695 | | | | — | | | | 1,986,695 | | | | — | |
| | | | | | | | | | | | | | | | |
Total | | $ | 3,164,216 | | | $ | — | | | $ | 3,164,216 | | | $ | — | |
| | | | | | | | | | | | | | | | |
| | |
| | | | | | Fair Value Measurements - September 30, 2012 | |
| | | Fair Value | | | Quoted Prices in
Active Markets
Level 1 | | | Significant Other
Observable
Inputs
Level 2 | | | Significant
Unobservable
Inputs
Level 3 | |
Liabilities: | | | | | | | | | | | | | | | | |
Natural gas purchases | | $ | 1,065,243 | | | $ | — | | | $ | 1,065,243 | | | $ | — | |
Interest rate swaps | | | 2,916,718 | | | | — | | | | 2,916,718 | | | | — | |
| | | | | | | | | | | | | | | | |
Total | | $ | 3,981,961 | | | $ | — | | | $ | 3,981,961 | | | $ | — | |
| | | | | | | | | | | | | | | | |
Under the asset management contract, a timing difference can exist between the payment for natural gas purchases and the actual receipt of such purchases. Payments are made based on a predetermined monthly volume with the price based on the weighted average first of the month index prices corresponding to the month of the scheduled payment. At September 30, 2013 and 2012, the Company had recorded in accounts payable the estimated fair value of the liability determined on the corresponding first of month index prices for which the liability was expected to be settled.
The fair value of the interest rate swaps, included in the line item “Fair value of marked-to-market transactions”, is determined by using the counterparty’s proprietary models and certain assumptions regarding past, present and future market conditions.
The Company’s nonfinancial assets and liabilities that are measured at fair value on a nonrecurring basis consist of its asset retirement obligations. The asset retirement obligations are measured at fair value at initial recognition based on expected future cash flows to settle the obligation.
The carrying value of cash and cash equivalents, accounts receivable, accounts payable (with the exception of the timing difference under the asset management contract), customer credit balances and customer deposits is a reasonable estimate of fair value due to the short-term nature of these financial instruments. The following table
- 28 -
summarizes the fair value of the Company’s financial assets and liabilities that are not adjusted to fair value in the financial statements as of September 30, 2013 and 2012.
| | | | | | | | | | | | | | | | |
| | | | | | Fair Value Measurements - September 30, 2013 | |
| | | Carrying
Amount | | | Quoted Prices in
Active Markets
Level 1 | | | Significant Other
Observable Inputs
Level 2 | | | Significant
Unobservable
Inputs
Level 3 | |
Liabilities: | | | | | | | | | | | | | | | | |
Note payable | | $ | 15,000,000 | | | $ | — | | | $ | — | | | $ | 14,976,818 | |
Long-term debt | | | 13,000,000 | | | | — | | | | — | | | | 13,762,952 | |
| | | | | | | | | | | | | | | | |
Total | | $ | 28,000,000 | | | $ | — | | | $ | — | | | $ | 28,739,770 | |
| | | | | | | | | | | | | | | | |
| | |
| | | | | | Fair Value Measurements - September 30, 2012 | |
| | | Carrying
Amount | | | Quoted Prices in
Active Markets
Level 1 | | | Significant Other
Observable Inputs
Level 2 | | | Significant
Unobservable
Inputs
Level 3 | |
Assets: | | | | | | | | | | | | | | | | |
Notes Receivable | | $ | 1,142,770 | | | $ | — | | | $ | — | | | $ | 1,152,896 | |
| | | | | | | | | | | | | | | | |
Total | | $ | 1,142,770 | | | $ | — | | | $ | — | | | $ | 1,152,896 | |
| | | | | | | | | | | | | | | | |
| | | | |
Liabilities: | | | | | | | | | | | | | | | | |
Note payable | | $ | 15,000,000 | | | $ | — | | | $ | — | | | $ | 14,976,818 | |
Long-term debt | | | 13,000,000 | | | | — | | | | — | | | | 14,310,450 | |
| | | | | | | | | | | | | | | | |
Total | | $ | 28,000,000 | | | $ | — | | | $ | — | | | $ | 29,287,268 | |
| | | | | | | | | | | | | | | | |
Note payable is included in current liabilities at September 30, 2013 and 2012. Notes receivable of $1,142,770 is classified as current assets at September 30, 2012.
The fair value of the notes receivable are estimated by discounting future cash flows based on a range of rates for similar investments adjusted for management’s expectation of credit and other risks. The fair value of the note payable is estimated by using the interest rate under the Company’s line-of-credit agreement which renewed at the same time as the term note. Both the line-of-credit and term note have a term of one year. The fair value of long-term debt is estimated by discounting the future cash flows of the fixed rate debt at rates extrapolated based on current market conditions. The variable rate long-term debt and note payable have interest rate swaps that effectively convert such debt to a fixed rate. The values of the swap agreements are included in the first table above.
FASB ASC 825 –Financial Instruments requires disclosures regarding concentrations of credit risk from financial instruments. Cash equivalents are investments in high-grade, short-term securities (original maturity less than three months), placed with financially sound institutions. Accounts receivable are from a diverse group of customers including individuals and small and large companies in various industries. The Company maintains certain credit standards with its customers and requires a customer deposit if such evaluation warrants.
- 29 -
| 11. | QUARTERLY FINANCIAL INFORMATION (UNAUDITED) |
Quarterly financial data for the years ended September 30, 2013 and 2012 is summarized as follows:
| | | | | | | | | | | | | | | | |
| | | First | | | Second | | | Third | | | Fourth | |
2013 | | Quarter | | | Quarter | | | Quarter | | | Quarter | |
| | | | |
Operating revenues | | $ | 18,746,592 | | | $ | 24,175,638 | | | $ | 11,037,308 | | | $ | 9,246,128 | |
| | | | | | | | | | | | | | | | |
| | | | |
Gross margin | | $ | 7,936,483 | | | $ | 9,585,727 | | | $ | 5,229,027 | | | $ | 4,851,654 | |
| | | | | | | | | | | | | | | | |
| | | | |
Operating income | | $ | 2,950,091 | | | $ | 4,813,348 | | | $ | 645,821 | | | $ | 385,795 | |
| | | | | | | | | | | | | | | | |
| | | | |
Net income (loss) | | $ | 1,554,153 | | | $ | 2,698,707 | | | $ | 110,103 | | | $ | (100,911 | ) |
| | | | | | | | | | | | | | | | |
| | | | |
Earnings per share of common stock: | | | | | | | | | | | | | | | | |
Basic | | $ | 0.33 | | | $ | 0.57 | | | $ | 0.02 | | | $ | (0.02 | ) |
Diluted | | $ | 0.33 | | | $ | 0.57 | | | $ | 0.02 | | | $ | (0.02 | ) |
| | | | |
| | | First | | | Second | | | Third | | | Fourth | |
2012 | | Quarter | | | Quarter | | | Quarter | | | Quarter | |
| | | | |
Operating revenues | | $ | 18,499,176 | | | $ | 21,290,227 | | | $ | 9,679,742 | | | $ | 9,330,542 | |
| | | | | | | | | | | | | | | | |
| | | | |
Gross margin | | $ | 8,129,627 | | | $ | 9,118,522 | | | $ | 4,975,378 | | | $ | 4,709,570 | |
| | | | | | | | | | | | | | | | |
| | | | |
Operating income | | $ | 3,408,945 | | | $ | 4,455,171 | | | $ | 530,491 | | | $ | 391,928 | |
| | | | | | | | | | | | | | | | |
| | | | |
Net income (loss) | | $ | 1,834,912 | | | $ | 2,483,307 | | | $ | 52,298 | | | $ | (73,772 | ) |
| | | | | | | | | | | | | | | | |
| | | | |
Earnings per share of common stock: | | | | | | | | | | | | | | | | |
Basic | | $ | 0.40 | | | $ | 0.54 | | | $ | 0.01 | | | $ | (0.02 | ) |
Diluted | | $ | 0.40 | | | $ | 0.53 | | | $ | 0.01 | | | $ | (0.02 | ) |
The Company has evaluated subsequent events through the date the financial statements were issued. There were no items not otherwise disclosed which would have materially impacted the Company’s consolidated financial statements.
* * * * * *
- 30 -
CORPORATE INFORMATION
CORPORATE OFFICE
RGC Resources, Inc.
519 Kimball Avenue, N.E.
P.O. Box 13007
Roanoke, VA 24030
Tel: (540) 777-4GAS (4427)
Fax: (540) 777-2636
INDEPENDENT REGISTERED ACCOUNTING FIRM
Brown Edwards & Company, L.L.P.
100 Arbor Drive
Christiansburg, VA 24073
COMMON STOCK TRANSFER AGENT, REGISTRAR, DIVIDEND DISBURSING
American Stock Transfer &
Trust Company, LLC
6201 15th Avenue
Brooklyn, NY 11219
(866) 673-8053
COMMON STOCK
RGC Resources’ common stock is listed on the NASDAQ Global Market under the trading symbol RGCO.

DIRECT DEPOSIT OF DIVIDENDS AND SAFEKEEPING OF STOCK CERTIFICATES
Shareholders can have their cash dividends deposited automatically into checking, savings or money market accounts. The shareholder’s financial institution must be a member of the Automated Clearing House. Also, RGC Resources offers safekeeping of stock certificates for shares enrolled in the dividend reinvestment plan. For more information about these shareholder services, please contact the Transfer Agent, American Stock Transfer & Trust Company, LLC.
10-K REPORT
A copy of RGC Resources, Inc.’s latest annual report to the Securities & Exchange Commission on Form 10-K will be provided without charge upon written request to:
Dale P. Lee
Vice President and Secretary
RGC Resources, Inc.
P.O. Box 13007
Roanoke, VA 24030
(540) 777-3846
Access all of RGC Resources Inc.’s Securities and Exchange filings through the links provided on our website atwww.rgcresources.com.
SHAREHOLDER INQUIRIES
Questions concerning shareholder accounts, stock transfer requirements, consolidation of accounts, lost stock certificates, safekeeping of stock certificates, replacement of lost dividend checks, payment of dividends, direct deposit of dividends, initial cash payments, optional cash payments and name or address changes should be directed to the Transfer Agent, American Stock Transfer & Trust Company, LLC. All other shareholder questions should be directed to:
RGC Resources, Inc.
Vice President and Secretary
P.O. Box 13007
Roanoke, VA 24030
(540) 777-3846
FINANCIAL INQUIRIES
All financial analysts and professional investment managers should direct their questions and requests for financial information to:
RGC Resources, Inc.
Vice President and Secretary
P.O. Box 13007
Roanoke, VA 24030
(540) 777-3846
Access up-to-date information on RGC Resources and its subsidiaries atwww.rgcresources.com.