EXHIBIT 99.1
PRESENTATION MATERIALS

Exhibit 99
Connecting People With Opportunities SM
PBNY
George Strayton
President Chief Executive Officer
Deposit Growth November 2, 2005
Forward-looking Statements
Statements contained in this news release that are not historical facts are forward-looking statements as that term is defined in the Private Securities Litigation Reform Act of 1995. Such forward-looking statements are subject to risks and uncertainties which could cause actual results to differ materially from those currently anticipated due to a number of factors.
Words such as “expect”, “feel”, “believe”, “will”, “may”, “anticipate”, “plan”, “estimate”, “intend”, “should”, and similar expressions are intended to identify forward-looking statements. These statements include, but are not limited to, financial projections and estimates and their underlying assumptions; statements regarding plans, objectives and expectations with respect to future operations, products and services; and statements regarding future performance. These statements are subject to certain risks and uncertainties, many of which are difficult to predict and generally beyond the control of Provident New York Bancorp (PBNY). The following factors, among others, could cause actual results to differ materially from the anticipated results or other expectations expressed in the forward-looking statements: (1) the businesses acquired may not be combined successfully, or the combination may take longer to accomplish than expected; (2) the growth opportunities and cost savings from the merger may not be fully realized or may take longer to realize than expected; (3) competitive factors which could affect net interest income and non-interest income, general economic conditions which could affect the volume of loan originations, deposit flows and real estate values; (4) the levels of non-interest income and the amount of loan losses as well as other factors discussed in the documents filed by PBNY with the Securities and Exchange Commission from time to time. PBNY undertakes no obligation to update these forward-looking statements to reflect events or circumstances that occur after the date on which such statements were made. 3
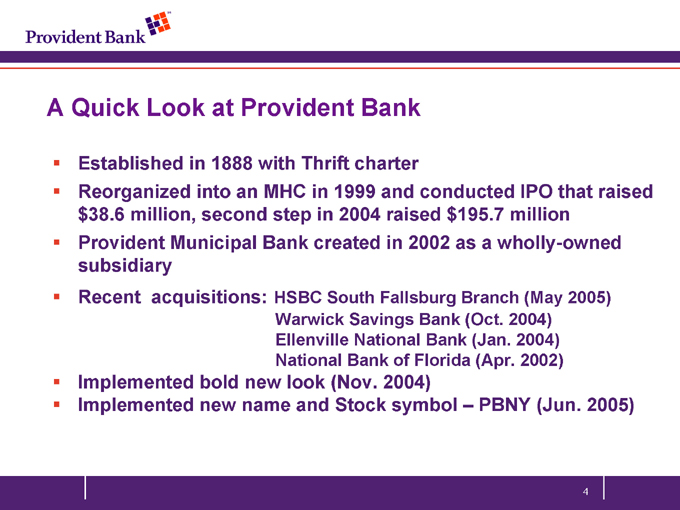
A Quick Look at Provident Bank
Established in 1888 with Thrift charter
Reorganized into an MHC in 1999 and conducted IPO that raised $38.6 million, second step in 2004 raised $195.7 million Provident Municipal Bank created in 2002 as a wholly-owned subsidiary
Recent acquisitions: HSBC South Fallsburg Branch (May 2005) Warwick Savings Bank (Oct. 2004) Ellenville National Bank (Jan. 2004) National Bank of Florida (Apr. 2002)
Implemented bold new look (Nov. 2004)
Implemented new name and Stock symbol – PBNY (Jun. 2005)
4
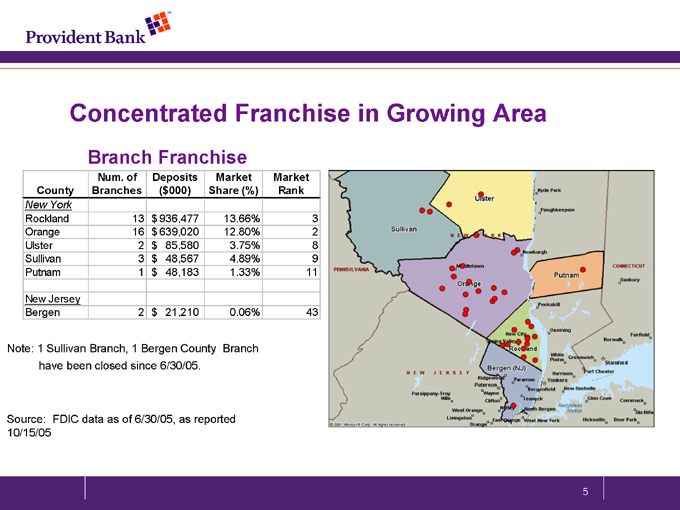
Concentrated Franchise in Growing Area
Branch Franchise
County Num. of Branches Deposits ($ 000) Market Share (%) Market Rank
New York
Rockland 13 $ 936,477 13.66% 3
Orange 16 $ 639,020 12.80% 2
Ulster 2 $ 85,580 3.75% 8
Sullivan 3 $ 48,567 4.89% 9
Putnam 1 $ 48,183 1.33% 11
New Jersey
Bergen 2 $ 21,210 0.06% 43
Note: 1 Sullivan Branch, 1 Bergen County Branch have been closed since 6/30/05.
Source: FDIC data as of 6/30/05, as reported 10/15/05
5
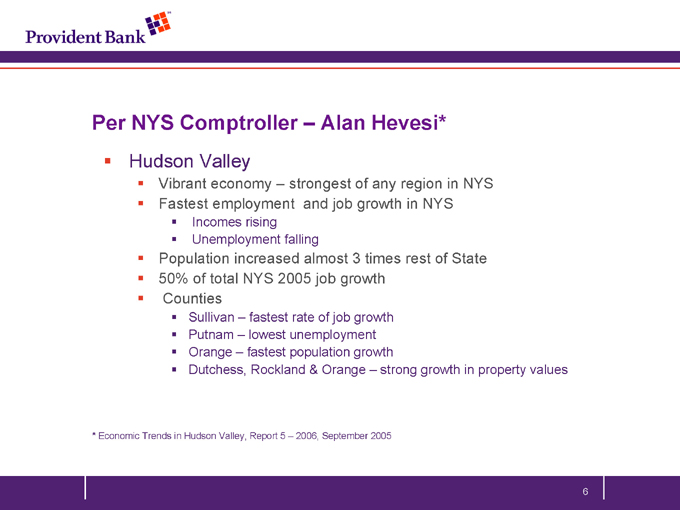
Per NYS Comptroller – Alan Hevesi*
Hudson Valley
Vibrant economy – strongest of any region in NYS Fastest employment and job growth in NYS
Incomes rising Unemployment falling
Population increased almost 3 times rest of State 50% of total NYS 2005 job growth Counties
Sullivan – fastest rate of job growth Putnam – lowest unemployment Orange – fastest population growth
Dutchess, Rockland & Orange – strong growth in property values
* Economic Trends in Hudson Valley, Report 5 – 2006, September 2005
6
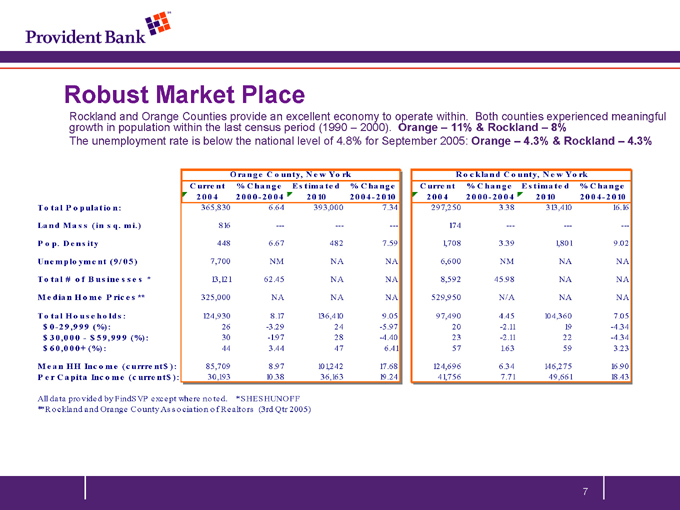
Robust Market Place
Rockland and Orange Counties provide an excellent economy to operate within. Both counties experienced meaningful growth in population within the last census period (1990 – 2000). Orange – 11% & Rockland – 8% The unemployment rate is below the national level of 4.8% for September 2005: Orange – 4.3% & Rockland – 4.3%
Orange County, New York Rockland County, NewYork
Current 2004 % Change 2000-2004 Estimated 2010 % Change 2004-2010 Current 2004 % Change 2000-2004 Estimated 2010 % Change 2004-2010
Total Population: 365,830 6.64 393,000 7.34 297,250 3.38 313,410 16.16
Land Mass (in sq. mi.) 816 -— -— -— 174 -— -— -—
Pop. Density 448 6.67 482 7.59 1,708 3.39 1,801 9.02
Unemployment (9/05) 7,700 NM NA NA 6,600 NM NA NA
Total # of Businesses* 13,121 62.45 NA NA 8,592 45.98 NA NA
Median Home Prices** 325,000 NA NA NA 529,950 N/A NA NA
Total Households: 124,930 8.17 136,410 9.05 97,490 4.45 104,360 7.05
$0-29,999 (%): 26 -3.29 24 -5.97 20 -2.11 19 -4.34
$30,000 —$59,999 (%): 30 -1.97 28 -4.40 23 -2.11 22 -4.34
$60,000+ (%): 44 3.44 47 6.41 57 1.63 59 3.23
Mean HH Income (currrent$): 85,709 8.97 101,242 17.68 124,696 6.34 146,275 16.90
Per Capita Income (current$): 30,193 10.38 36,163 19.24 41,756 7.71 49,661 18.43
All data provided by FindSVP except where noted. * SHESHUNOFF
** Rockland and Orange County Association of Realtors (3rd Qtr 2005)
7
Successful Business Strategy
Full Service Community Bank
Vibrant and Growing Market Place
Full array of Products
Profitable, Strategically Positioned Institution
Exceptional Asset Quality Commercial Profile Bold new look Large Core Deposit base
8
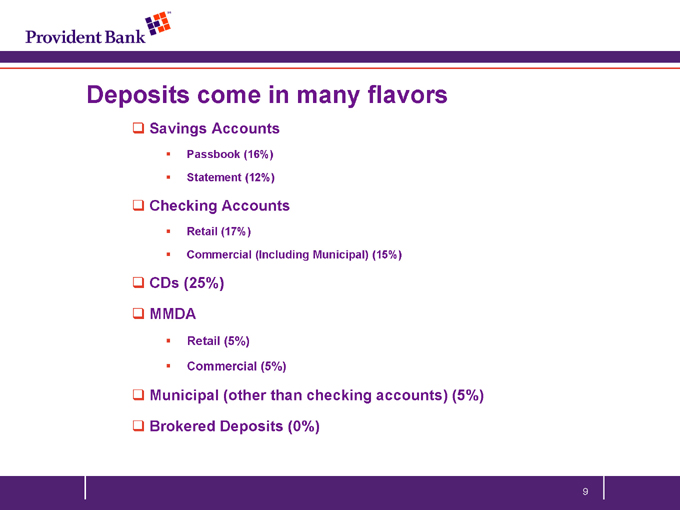
Deposits come in many flavors
Savings Accounts
Passbook (16%)
Statement (12%)
Checking Accounts
Retail (17%)
Commercial (Including Municipal) (15%)
CDs (25%)
MMDA
Retail (5%)
Commercial (5%)
Municipal (other than checking accounts) (5%)
Brokered Deposits (0%)
9
Every Flavor is Good -
Low cost funds
Management of interest rate risk
First chance for new business relationships Fee income opportunities
BUT …
10
But … Some Flavors are better
Deposits that stay (Core deposits)
Deposits that produce higher profitability Deposits that produce fees Transitory deposits that are less than wholesale borrowing
Lets look at results …
11
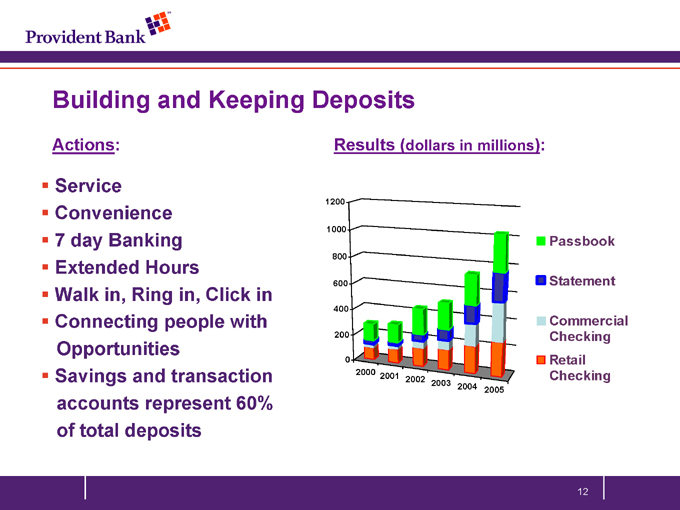
Building and Keeping Deposits
Actions:
Service Convenience 7 day Banking Extended Hours Walk in, Ring in, Click in Connecting people with Opportunities Savings and transaction accounts represent 60% of total deposits
Results (dollars in millions):
1200 1000 800 600 400 200 0
2000 2001 2002 2003 2004 2005
Passbook
Statement
Commercial Checking Retail Checking
12
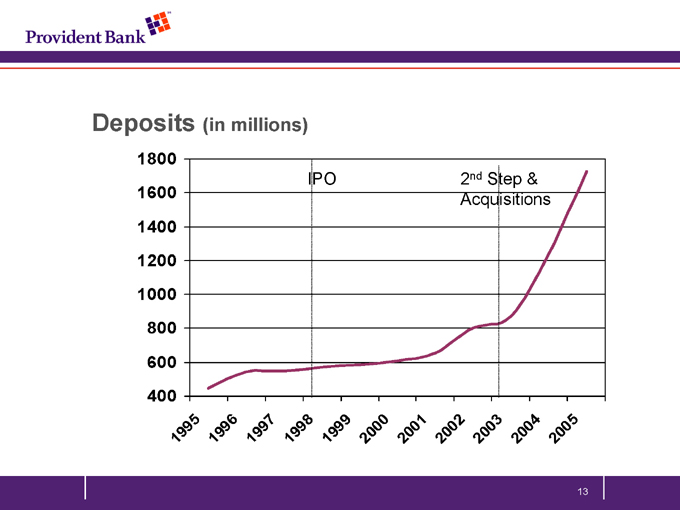
Deposits (in millions)
1800 1600 1400 1200 1000 800 600 400
IPO
2nd Step & Acquisitions
1995 1996 1997 1998 1999 2000 2001 2002 2003 2004 2005
13
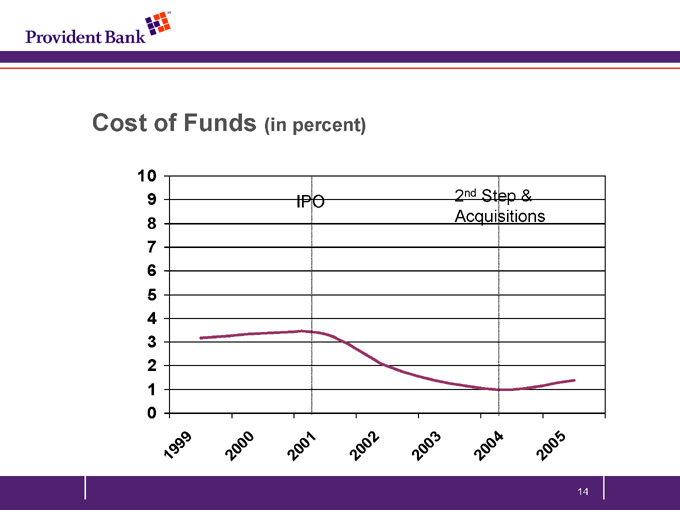
Cost of Funds (in percent)
10 9 8 7 6 5 4 3 2 1 0
IPO
2nd Step & Acquisitions
1999 2000 2001 2002 2003 2004 2005
14
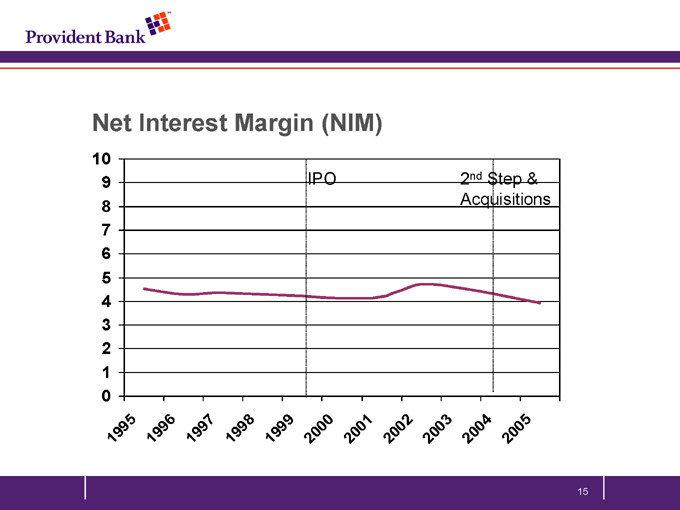
Net Interest Margin (NIM)
10 9 8 7 6 5 4 3 2 1 0
IPO
2nd Step & Acquisitions
1995 996 1997 1998 1999 2000 2001 2002 2003 2004 2005
15
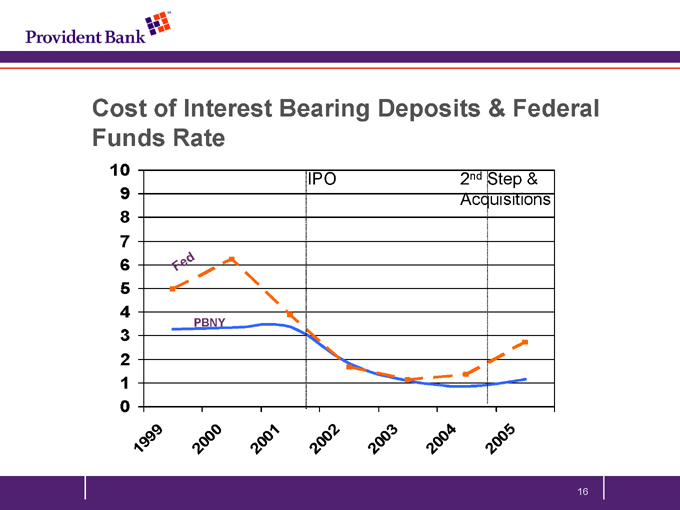
Cost of Interest Bearing Deposits & Federal Funds Rate
10 9 8 7 6 5 4 3 2 1 0
IPO
2nd Step & Acquisitions
1999 2000 2001 2002 2003 2004 2005
16
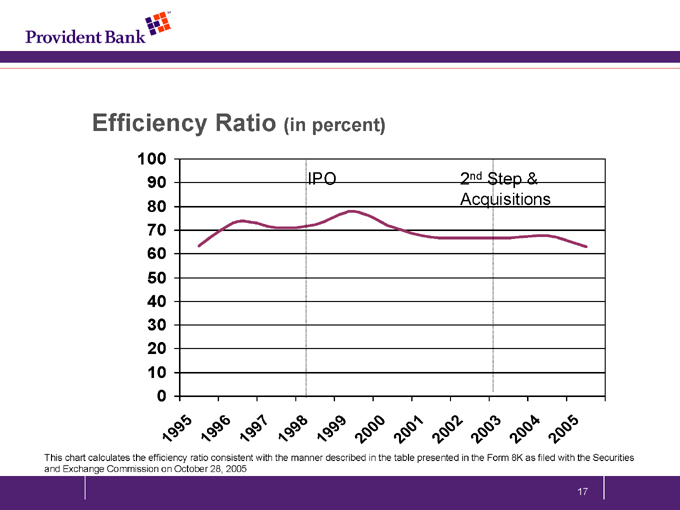
Efficiency Ratio (in percent)
100 90 80 70 60 50 40 30 20 10 0
1995 1996 1997 1998 1999 2000 2001 2002 2003 2004 2005
IPO
2nd Step & Acquisitions
This chart calculates the efficiency ratio consistent with the manner described in the table presented in the Form 8K as filed with the Securities and Exchange Commission on October 28, 2005
17
A Delicate Balance—attracting deposits while controlling cost
Service
Access Technology Vibrant Market
Right Products for the Market Strong Asset Quality
Attract stronger credits Maintain spread
Putting it all together …
18

Fiscal 2006
Revenue
Growing Stronger, Serving Better … It’s All Coming Together
Expense