Table of Contents
UNITED STATES
SECURITIES AND EXCHANGE COMMISSION
Washington, D.C. 20549
FORM N-CSR
CERTIFIED SHAREHOLDER REPORT OF REGISTERED
MANAGEMENT INVESTMENT COMPANIES
Investment Company Act file number 811-09025
New Covenant Funds
(Exact name of registrant as specified in charter)
200 East Twelfth Street
Jeffersonville, IN 47130
(Address of principal executive offices) (Zip code)
Patrick Turley
Dechert LLP
1775 I Street, N.W.
Washington, DC 20006
(Name and address of agent for service)
202-261-3364
Registrant’s telephone number, including area code
Date of fiscal year end: June 30, 2012
Date of reporting period: December 31, 2011
Table of Contents
Item 1. Reports to Stockholders.
1
Table of Contents

Table of Contents
| 2 | ||||
| 8 | ||||
| 18 | ||||
| 19 | ||||
| 20 | ||||
| 22 | ||||
| 26 | ||||
| 34 | ||||
Table of Contents
NEW COVENANT FUNDS
Letter to Shareholders
Dear Shareholder,
The six-month period since our June 30 annual letter to shareholders has featured volatile swings in world capital markets. Paralysis and dysfunction in Washington and Europe intensified fears about dramatic topics, including the downgrade of the creditworthiness of the U.S. and the potential destruction of the common European currency. What’s encouraging is U.S. equity markets managed to give back only what they had gained earlier for the year. All told, we believe a “flat” 2011 for U.S. stocks demonstrates remarkable resilience by investors amid frightening headlines, an uncertain regulatory and tax environment, and political partisanship.
But the pathway to a “flat” outcome for 2011 was extremely bumpy! During the fourth quarter, for example, the S&P 500 Index began by marking a new low for 2011 in early October. Then, on its way back to a near-zero return for the year, the S&P 500 Index continued to experience high levels of volatility. The Chicago Board Options Exchange’s index of market volatility—the VIX, sometimes called the “fear index”—closed the year above its long-term average, finishing the year at 23. Only in 2002, 2008, and 2009 had the VIX previously ended the year higher than 20. The Dow Jones Industrial Average, which managed to end 2011 higher than it began, seemed to see-saw from big gains to big losses.
It’s no surprise that investors are struggling to find a clear direction. Concerns about the world economy—from unsustainable debt levels in the U.S. and Europe to a slowdown in China—are large-scale, long-term issues. On the other hand, we are increasingly seeing good news, too. For example, recently the Labor Department announced 200,000 jobs were added in the U.S. during December. Consumer sentiment is improving. Italy and Spain were recently able to issue new debt at reasonable (non-panic) yields. U.S. corporate balance sheets, especially among large-cap companies, are in excellent shape. Profit margins among those large companies continue to be strong. Some companies are well positioned with cash on their balance sheets to take strategic advantage of depressed valuations, whether their own through share repurchases or acquisition targets.
It’s also helpful to place the difficult though “flat” year for U.S. equities in the context of world equity markets. Of 48 countries tracked by MCSI AC World Index ex USA, the U.S. performed better than 45 of them for the year ended December 31. Only Indonesia, Ireland and New Zealand fared better. The median equity market return among this group of countries was -17.8% in dollar terms. In the context of a particularly difficult year in international markets, we are especially pleased with the performance contribution of Baillie Gifford Overseas Ltd., which manages the international allocation of the New Covenant Growth Fund. We believe Baillie Gifford’s vigorous growth-oriented approach to investment analysis continues to identify compelling investments for the Growth Fund.
Although in 2012 we are unlikely to see resolution of many of the world’s long-term problems, we do believe signs of stabilization are promising. We believe the Growth Fund’s active-management U.S. equity sub-advisers are continuing to find compelling stock picks as they seek companies with attractive fundamentals, including strong competitive positions and capable management teams.
In fixed-income markets, the Fed’s interest rate policy continued to support low short- and long-term rates. In addition, investors seeking perceived safety again turned to U.S. Treasury bonds, further supporting low U.S. rates even at 10-year and longer horizons. The 10-year Treasury rate ended 2011 below 2%—dramatically lower than the 3.36% 10-year yield at the outset of 2011. While money is cheap, it is less certain whether economic and political conditions will allow corporations to make use of these low rates to fuel growth. Our view is the resilience of the corporate sector will continue, with slow but nonetheless positive growth in the U.S. during 2012.
The following table shows performance data for the New Covenant Funds relative to their benchmarks.
Average Annual Returns as of December 31, 2011 (%)
Please note that indices are unmanaged and an investment cannot be made directly in an index. Index results are not adjusted for fees or socially responsible investment (SRI) restrictions.
| 1 Year | 3 Year | 5 Year | 10 Year | |||||||||||||||
| NCGFX | New Covenant Growth Fund | -3.02 | 12.23 | -1.93 | 2.09 | |||||||||||||
| S&P 500 Index | 2.11 | 14.11 | -0.25 | 2.92 | ||||||||||||||
| 80% S&P 500 / 20% MSCI ACWI ex. US | -1.13 | 13.59 | -0.62 | 3.74 | ||||||||||||||
| NCICX | New Covenant Income Fund | 5.41 | 8.15 | 2.67 | 3.60 | |||||||||||||
| Barclays Capital Intermediate Aggregate Bond Index | 5.97 | 6.19 | 6.09 | 5.39 | ||||||||||||||
| NCBGX | New Covenant Balanced Growth Fund | 0.28 | 10.70 | 0.09 | 2.95 | |||||||||||||
| 60% S&P 500 / 40% Barclays Capital Intermediate Aggregate Bond Index | 3.93 | 11.34 | 2.68 | 4.24 | ||||||||||||||
| NCBIX | New Covenant Balanced Income Fund | 2.04 | 9.40 | 1.08 | 3.25 | |||||||||||||
| 35% S&P 500 / 65% Barclays Capital Intermediate Aggregate Bond Index | 4.88 | 9.34 | 4.25 | 4.84 | ||||||||||||||
Per our prospectus dated October 28, 2011, our Total Annual Fund Operating Expenses are 0.98% for the New Covenant Growth Fund, 0.76% for the New Covenant Income Fund, 1.12% for the New Covenant Balanced Growth Fund, and 1.08% for the New Covenant Balanced Income Fund.
Past performance does not guarantee future results. The performance data quoted represents past performance and current returns may be lower or higher. Total return figures include changes in share price, and include reinvestment of dividends and capital gains. The investment return and principal value will fluctuate so that an investor’s shares, when redeemed, may be worth more or less than the original cost. To obtain more current performance information, call 877-835-4531 or visit www.NewCovenantFunds.com.
The New Covenant Growth Fund
The New Covenant Growth Fund returned -3.02% for the one-year period ending December 31, 2011. This performance was lower than the performance of its blended benchmark consisting of the S&P 500 Index (80%) and the MSCI All Country World Index ex U.S. (20%), which returned -1.13% for the same period.
The Fund’s core portfolio, managed by Brockhouse & Cooper International, Inc., represented approximately 41% of the Fund as of December 31, 2011. Brockhouse & Cooper continues to manage the core portfolio to closely track risk characteristics and performance of the S&P 500 Index while also abiding by the General Assembly of the Presbyterian Church’s (U.S.A.) criteria for socially responsible investment.
2
Table of Contents
to our shareholders
NEW COVENANT FUNDS
December 31, 2011 (Unaudited)
The Fund’s active-management sub-advisers continue to seek and invest in companies with strong balance sheets, consistent free cash flows, and compelling valuations. During the second half of 2011, we were pleased to welcome a new active-management sub-adviser to the Growth Fund. On October 19, Sustainable Growth Advisers, LP began managing a portfolio of large, established companies it expects to grow over time. We increased the Growth Fund’s allocation to the large-cap growth stock portfolio from approximately 14% to 17% of the Fund’s total assets during the fourth quarter, with the commensurate reduction coming from the core portion of the portfolio. Sustainable Growth Advisers replaced Santa Barbara Asset Management as the Fund’s large-cap growth stock sub-adviser.
Following are the Growth Fund’s other active-management sub-advisers and allocations as of December 31, 2011:
| • | Sound Shore Management, Inc., which applies a value-focused approach to investments among large domestic companies, represented approximately 19% of the Fund. |
| • | TimesSquare Capital Management, which focuses on mid-cap growth stocks, managed approximately 4% of the Fund. |
| • | Baillie Gifford Overseas Ltd., headquartered in Edinburgh, Scotland, which manages the international allocation, represented approximately 19% of the Fund. |
The New Covenant Income Fund
The New Covenant Income Fund returned 5.41% for the one-year period ending December 31, 2011. The Fund underperformed its benchmark, the Barclays Capital Intermediate Aggregate Bond Index, which gained 5.97%. This underperformance generally related to an underweight allocation of U.S. Treasuries versus the benchmark during a period of sharply rising Treasury bond prices, as investors sought perceived safety in U.S. government obligations. At year end, the Fund was overweight in allocations to spread sectors including corporate bonds and commercial mortgage backed securities—investments that outperformed in late 2011 and helped the Fund’s overall performance. This positioning may subject the Fund to additional price volatility versus the benchmark, but we remain pleased with the Fund’s yield profile.
We remain confident in the investment capabilities of the Income Fund’s two sub-advisers, which were unchanged in 2011:
| • | Baird Advisors, an investment management department operating within Robert W. Baird & Co., Inc., which manages a duration-neutral portfolio relative to the benchmark, managed approximately 50% of the Fund. |
| • | EARNEST Partners, which focuses on securities that are backed by the full faith and credit of the U.S. Treasury or are issued by U.S. Government sponsored agencies but are not Treasury securities, managed approximately 50% of the Fund. |
New Covenant Balanced Growth Fund and New Covenant Balanced Income Fund
Our two balanced funds are each a mix of the New Covenant Growth Fund and the New Covenant Income Fund. For the one-year period ending December 31, 2011, the New Covenant Balanced Growth Fund returned 0.28%, whereas its benchmark of S&P 500 Index (60% weighting) blended with the Barclays Capital Intermediate Aggregate Bond Index (40% weighting) returned 3.93% for the same period. The underperformance relative to the benchmark is in part a result of the Growth Fund’s international allocation; the benchmark does not include an international equity component. In addition, the Balanced Growth Fund is slightly overweight in equities relative to its blended benchmark, in a twelve-month period that saw bonds significantly outperform equities in the U.S.
The New Covenant Balanced Income Fund returned 2.04% for the one-year period ending December 31, 2011. For this Fund, the benchmark is a blend of 35% for the S&P 500 and 65% for the same Barclays index, which returned 4.88% for the same period. Underperformance relative to the benchmark occurred for reasons similar to those noted above for the Balanced Growth Fund.
At December 31, 2011, the Balanced Growth Fund’s target allocation is 62% for the New Covenant Growth Fund and 38% for the New Covenant Income Fund. The Balanced Income Fund’s target allocation is 38% for the New Covenant Growth Fund and 62% for the New Covenant Income Fund.
New Investment Adviser for the New Covenant Funds
In November, the New Covenant Funds Board approved, subject to shareholder approval, a new investment advisor, SEI Investments Management Corporation (“SIMC’’). This decision came after the parent of One Compass Advisors—the Presbyterian Church (U.S.A.) Foundation, which is also the Funds’ largest shareholder—conducted an extensive review of its business model and determined the need to reduce risk and complexity in its organization by ceasing to provide investment advisory services.
Proxy materials have since been mailed to shareholders in advance of a special meeting called to approve SIMC as the Funds’ new investment adviser. More information about SIMC is available in the proxy materials, but we’d like to emphasize here that SIMC will continue to manage the Funds in accordance with the social witness principles of the General Assembly of the Presbyterian Church (U.S.A.), which the Funds have followed since their inception.
If you have questions about the pending change in investment adviser for the Funds, or any other issues or concerns, please let us know. We appreciate the trust you have placed in us and recognize that the opportunity to manage your capital is a privilege.
Sincerely,

Timothy P. Clark
President, New Covenant Funds
Please note that indices are unmanaged and an investment cannot be made directly in an index. Index results are not adjusted for fees or socially responsible investment (SRI) restrictions.
Past performance is not a guarantee of future results.
3
Table of Contents
to our shareholders
NEW COVENANT FUNDS
December 31, 2011 (Unaudited)
Opinions expressed are those of the Advisor and are subject to change, not guaranteed, and should not be considered investment advice.
The Standard & Poor’s 500 Index (“S&P 500”) is an unmanaged, capitalization-weighted index that measures the performance of 500 large-capitalization stocks representing all major industries. The Barclays Capital U.S. Intermediate Aggregate Bond Index is an unmanaged index of Intermediate U.S. bonds which includes reinvestment of any earnings. It is widely used to measure the overall performance of the Intermediate U.S. bond market. MSCI AC World Index ex USA measures equity market performance in the global developed and emerging markets. It includes 48 developed and emerging market country indices. VIX is the ticker symbol for the Chicago Board Options Exchange Market Volatility Index, a popular measure of the implied volatility of the S&P 500 index options. Often referred to as the fear index or the fear gauge, it represents one measure of the market’s expectation of stock market volatility over the next 30 day period. The Dow Jones Industrial Average (DJIA) is an unmanaged index of common stocks comprised of major industrial companies and assumes reinvestment of dividends. You cannot invest directly in an index.
Duration is a commonly used measure of the potential volatility of the price of a debt security, or the aggregate market value of a portfolio of debt securities, prior to maturity. Securities with a longer duration generally have more volatile prices than securities of comparable quality with a shorter duration.
Free cash flow is revenue less operating expenses including interest expense and maintenance capital spending. It is the discretionary cash that a company has after all expenses and is available for purposes such as dividend payments, investing back into the business or share repurchases.
Portfolio composition is subject to change.
The New Covenant Funds are advised by One Compass Advisors, a subsidiary of the Presbyterian Church (U.S.A.) Foundation. The New Covenant Funds are distributed by Quasar Distributors, Inc.
Mutual fund investing involves risk. Principal loss is possible. The Growth Fund invests in smaller companies, which involve additional risks such as limited liquidity and greater volatility than larger companies. The Growth Fund invests in foreign securities which involve political, economic and currency risks, greater volatility and differences in accounting methods. The Growth Fund may also use options and futures contracts, which have the risks of unlimited losses of the underlying holdings due to unanticipated market movements and failure to correctly predict the direction of securities prices, interest rates and currency exchange rates. The investment in options is not suitable for all investors. Investments in debt securities typically decrease in value when interest rates rise. This risk is usually greater for longer-term debt securities. The Fund may choose not to purchase, or may sell, otherwise profitable investments in companies which have been identified as being in conflict with its established social-witness principles. This means that the Fund may underperform other similar mutual funds that do not consider social-witness principles in their investing.
Must be preceded or accompanied by a prospectus
4
Table of Contents
to our shareholders
Portfolio Allocation as of 12/31/2011 (Unaudited)
GROWTH FUND:
| Security Allocation | Percentage of Market Value | |||
| Information Technology | 19.2 | % | ||
| Financials | 13.9 | % | ||
| Health Care | 11.8 | % | ||
| Consumer Discretionary | 11.4 | % | ||
| Energy | 11.0 | % | ||
| Consumer Staples | 10.9 | % | ||
| Industrials | 9.6 | % | ||
| Materials | 6.4 | % | ||
| Utilities | 3.2 | % | ||
| Telecommunication Services | 1.7 | % | ||
| Cash Equivalents | 0.9 | % | ||
| Total | 100.0 | % | ||
INCOME FUND:
| Security Allocation | Percentage of Market Value | |||
U.S. Government Agency Mortgage Backed Securities | 46.6 | % | ||
| Corporate Bonds | 24.3 | % | ||
| U.S. Treasury Obligations | 9.7 | % | ||
Non-Government Agency Mortgage Backed Securities | 9.5 | % | ||
| Asset Backed Securities | 5.4 | % | ||
| Cash Equivalents | 3.4 | % | ||
| Other | 0.5 | % | ||
| Municipal Bonds | 0.4 | % | ||
| Foreign Government Agency Securities | 0.2 | % | ||
| Total | 100.0 | % | ||
BALANCED GROWTH FUND:
| Security Allocation | Percentage of Market Value | |||
| New Covenant Growth Fund | 62.0 | % | ||
| New Covenant Income Fund | 36.9 | % | ||
| Cash Equivalents | 1.1 | % | ||
| Total | 100.0 | % | ||
BALANCED INCOME FUND:
| Security Allocation | Percentage of Market Value | |||
| New Covenant Income Fund | 60.3 | % | ||
| New Covenant Growth Fund | 38.3 | % | ||
| Cash Equivalents | 1.4 | % | ||
| Total | 100.0 | % | ||
5
Table of Contents
to our shareholders
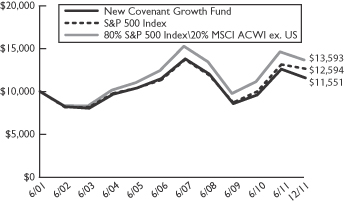
Hypothetical Illustration of a $10,000 Investment
As of December 31, 2011
New Covenant Growth Fund (Unaudited)
| Average Annual Total Return | ||||||||||||||||
| 1 Year | 3 Year | 5 Year | 10 Year | |||||||||||||
| New Covenant Growth Fund | -3.02 | % | 12.23 | % | -1.93 | % | 2.09 | % | ||||||||
| S&P 500 Index | 2.11 | % | 14.11 | % | -0.25 | % | 2.92 | % | ||||||||
| Blended S&P 500 Index/ | ||||||||||||||||
| MSCI ACWI ex. US | -1.13 | % | 13.59 | % | -0.62 | % | 3.74 | % | ||||||||
The S&P 500 Index is a capitalization weighted index that measures the performance of 500 large-capitalization stocks representing all major industries. The index is unmanaged and does not reflect fees or expenses associated with a mutual fund. Investors cannot invest directly in an index.
The Blended S&P 500 Index/MSCI ACWI ex. US is a composite index composed of 80% S&P 500 Index and 20% MSCI ACWI ex. US. The S&P 500 Index is a capitalization weighted index that measures the performance of 500 large capitalization stocks representing all major industries. The MSCI ACWI ex. US is a free float-adjusted market capitalization weighted index that is designed to measure the equity market performance of developed and emerging markets. These indices are unmanaged and do not reflect fees or expenses associated with a mutual fund. Investors cannot invest directly in an index.
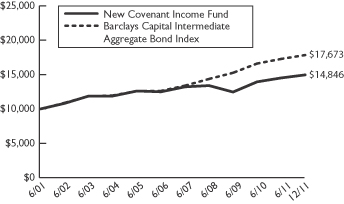
As of December 31, 2011
New Covenant Income Fund (Unaudited)
| Average Annual Total Return | ||||||||||||||||
| 1 Year | 3 Year | 5 Year | 10 Year | |||||||||||||
| New Covenant Income Fund | 5.41 | % | 8.15 | % | 2.67 | % | 3.60 | % | ||||||||
| Barclays Capital Intermediate | ||||||||||||||||
| Aggregate Bond Index | 5.97 | % | 6.19 | % | 6.09 | % | 5.39 | % | ||||||||
The Barclays Capital Intermediate Aggregate Bond index is representative of intermediate investment grade government and corporate debt securities with maturities of 10 years or less. Investors cannot invest directly in an index. The index is unmanaged and does not reflect fees or expenses associated with a mutual fund.
Past performance does not guarantee future results. The performance data quoted represents past performance and current returns may be lower or higher. Total return figures include change in share price, reinvestment of dividends and capital gains. The investment return and principal value will fluctuate so that an investor’s shares, when redeemed, may be worth more or less than the original cost. Returns do not reflect the deduction of taxes that a shareholder would pay on Fund distributions or redemptions of Fund shares. To obtain performance information current to the most recent month end, please call 877-835-4531 or visit our website at www.NewCovenantFunds.com.
The growth charts above illustrate a hypothetical investment in the Funds versus the appropriate indices and represent the reinvestment of dividends and capital gains. The performance of the Funds does not reflect any sales charge or the deduction of taxes that a shareholder would pay on Fund distributions or redemptions of Fund shares.
6
Table of Contents
to our shareholders
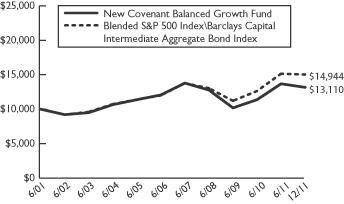
Hypothetical Illustration of a $10,000 Investment
As of December 31, 2011
New Covenant Balanced Growth Fund (Unaudited)
| Average Annual Total Return | ||||||||||||||||
| 1 Year | 3 Year | 5 Year | 10 Year | |||||||||||||
| New Covenant Balanced Growth Fund | 0.28 | % | 10.70 | % | 0.09 | % | 2.95 | % | ||||||||
| Blended S&P 500 Index/Barclays Capital Intermediate Aggregate Bond Index | 3.93 | % | 11.34 | % | 2.68 | % | 4.24 | % | ||||||||
The Blended S&P 500 Index/Barclays Capital Intermediate Aggregate Bond Index is a composite index composed of 60% S&P 500 Index and 40% Barclays Capital Intermediate Aggregate Bond Index. The S&P 500 Index is a capitalization weighted index that measures the performance of 500 large capitalization stocks representing all major industries. The Barclays Capital Intermediate Aggregate Bond Index is representative of intermediate investment grade government and corporate debt securities with maturities of 10 years of less. These indices are unmanaged and do not reflect fees or expenses associated with a mutual fund. Investors cannot invest directly in an index.
As of December 31, 2011
New Covenant Balanced Income Fund (Unaudited)

| Average Annual Total Return | ||||||||||||||||
| 1 Year | 3 Year | 5 Year | 10 Year | |||||||||||||
| New Covenant Balanced Income Fund | 2.04 | % | 9.40 | % | 1.08 | % | 3.25 | % | ||||||||
Blended S&P 500 Index/ Barclays Capital Intermediate Aggregate Bond Index | 4.88 | % | 9.34 | % | 4.25 | % | 4.84 | % | ||||||||
The Blended S&P 500 Index/Barclays Capital Intermediate Aggregate Bond Index is a composite index composed of 35% S&P 500 Index and 65% Barclays Capital Intermediate Aggregate Bond Index. The S&P 500 Index is a capitalization weighted index that measures the performance of 500 large capitalization stocks representing all major industries. The Barclays Capital Intermediate Aggregate Bond Index is representative of intermediate investment grade government and corporate debt securities with maturities of 10 years of less. These indices are unmanaged and do not reflect fees or expenses associated with a mutual fund. Investors cannot invest directly in an index.
Past performance does not guarantee future results. The performance data quoted represents past performance and current returns may be lower or higher. Total return figures include change in share price, reinvestment of dividends and capital gains. The investment return and principal value will fluctuate so that an investor’s shares, when redeemed, may be worth more or less than the original cost. Returns do not reflect the deduction of taxes that a shareholder would pay on Fund distributions or redemptions of Fund shares. To obtain performance information current to the most recent month end, please call 877-835-4531 or visit our website at www.NewCovenantFunds.com.
The growth charts above illustrate a hypothetical investment in the Funds versus the appropriate index and represent the reinvestment of dividends and capital gains. The performance of the Funds does not reflect any sales charge or the deduction of taxes that a shareholder would pay on Fund distributions or redemptions of Fund shares.
7
Table of Contents
NEW COVENANT GROWTH FUND
December 31, 2011 (Unaudited)
Shares | Value | Shares | Value |
| COMMON STOCKS — 97.7% | ||||||||
| Automotive — 1.1% | ||||||||
| 144,866 | Ford Motor Co.(a) | $1,558,758 | ||||||
| 166,540 | General Motors Co.(a) | 3,375,766 | ||||||
| 3,777 | Hyundai Mobis | 959,630 | ||||||
| 33,689 | Johnson Controls, Inc. | 1,053,118 | ||||||
|
| |||||||
| 6,947,272 | ||||||||
|
| |||||||
| Banks — 2.7% | ||||||||
| 15,228 | BB&T Corp. | 383,289 | ||||||
| 16,742 | Credicorp Ltd.(a) | 1,832,747 | ||||||
| 160,176 | DBS Group Holdings Ltd. | 1,421,767 | ||||||
| 10,967 | Fifth Third Bancorp | 139,500 | ||||||
| 99,700 | Hang Seng Bank Ltd. | 1,180,987 | ||||||
| 3,874 | KeyCorp | 29,791 | ||||||
| 8,563 | PNC Financial Services Group, Inc. | 493,828 | ||||||
| 37,066 | Regions Financial Corp. | 159,384 | ||||||
| 60,400 | Sberbank - ADR(a) | 599,168 | ||||||
| 10,500 | SunTrust Banks, Inc. | 185,850 | ||||||
| 97,186 | Svenska Handelsbanken AB | 2,546,815 | ||||||
| 161,500 | Turkiye Garanti Bankasi A/S | 502,082 | ||||||
| 81,506 | U.S. Bancorp | 2,204,737 | ||||||
| 168,552 | United Overseas Bank Ltd. | 1,983,612 | ||||||
| 153,829 | Wells Fargo & Co. | 4,239,527 | ||||||
| 277 | Zions Bancorporation | 4,510 | ||||||
|
| |||||||
| 17,907,594 | ||||||||
|
| |||||||
| Chemicals — 3.3% | ||||||||
| 4,834 | Air Products & Chemicals, Inc. | 411,808 | ||||||
| 4,600 | Airgas, Inc. | 359,168 | ||||||
| 12,784 | Cabot Corp. | 410,878 | ||||||
| 1,653 | CF Industries Holdings, Inc. | 239,652 | ||||||
| 8,708 | Eastman Chemical Co. | 340,135 | ||||||
| 86,000 | Ecolab, Inc. | 4,971,660 | ||||||
| 23,254 | EI du Pont de Nemours & Co. | 1,064,568 | ||||||
| 38,200 | LyondellBasell Industries NV | 1,241,118 | ||||||
| 77,176 | Monsanto Co. | 5,407,722 | ||||||
| 54,740 | Novozymes A/S | 1,686,429 | ||||||
| 40,370 | Praxair, Inc. | 4,315,553 | ||||||
| 46,035 | The Dow Chemical Co. | 1,323,967 | ||||||
|
| |||||||
| 21,772,658 | ||||||||
|
| |||||||
| Commercial Services — 3.6% | ||||||||
| 6,500 | Alliance Data Systems Corp.(a) | 674,960 | ||||||
| 339,994 | Brambles Ltd. | 2,482,380 | ||||||
| 40,400 | Cintas Corp. | 1,406,324 | ||||||
| 57,581 | Edenred | 1,412,461 | ||||||
| 148,403 | Experian PLC | 2,017,160 | ||||||
| 8,500 | Global Payments, Inc. | 402,730 | ||||||
| 4,300 | IHS, Inc.(a) | 370,488 | ||||||
| 4,200 | Manpower, Inc. | 150,150 | ||||||
| 11,300 | Nielsen Holdings NV(a) | 335,497 | ||||||
| 11,100 | Pool Corp. | 334,110 | ||||||
| 1,308 | priceline.com, Inc.(a) | 611,765 | ||||||
| 47,388 | Ritchie Bros. Auctioneers, Inc.(a) | 1,041,955 | ||||||
| 47,085 | RR Donnelley & Sons Co. | 679,436 | ||||||
| 124,879 | The Capita Group PLC | 1,217,771 | ||||||
| 2,684 | Towers Watson & Co. | 160,852 | ||||||
| 83,727 | Visa, Inc. | 8,500,802 | ||||||
| 75,031 | Western Union Co. | 1,370,066 | ||||||
| 13,950 | Xerox Corp. | 111,042 | ||||||
|
| |||||||
| 23,279,949 | ||||||||
|
| |||||||
| Computer Services & Software — 8.6% | ||||||||
| 5,802 | Adobe Systems, Inc.(a) | 164,023 | ||||||
| 19,600 | Amdocs Ltd.(a) | 559,188 | ||||||
| 32,383 | Apple, Inc.(a) | 13,115,115 | ||||||
| 88,784 | Automatic Data Processing, Inc. | 4,795,224 | ||||||
| 21,086 | BMC Software, Inc.(a) | 691,199 | ||||||
| COMMON STOCKS (cont.) | ||||||||
| Computer Services & Software (cont.) | ||||||||
| 173,420 | Cisco Systems, Inc. | $3,135,434 | ||||||
| 2,334 | Citrix System, Inc.(a) | 141,720 | ||||||
| 91,776 | Dell, Inc.(a) | 1,342,683 | ||||||
| 43,288 | EMC Corp.(a) | 932,424 | ||||||
| 8,300 | Gartner, Inc.(a) | 288,591 | ||||||
| 61,211 | Hewlett Packard Co. | 1,576,795 | ||||||
| 3,400 | Informatica Corp.(a) | 125,562 | ||||||
| 24,179 | International Business Machinces Corp. | 4,446,035 | ||||||
| 9,040 | Lexmark International, Inc.(a) | 298,953 | ||||||
| 23,400 | MercadoLibre, Inc. | 1,861,236 | ||||||
| 4,800 | MICROS System, Inc.(a) | 223,584 | ||||||
| 379,989 | Microsoft Corp. | 9,864,514 | ||||||
| 16,907 | NetApp, Inc.(a) | 613,217 | ||||||
| 121,491 | Oracle Corp. | 3,116,244 | ||||||
| 125,625 | Red Hat, Inc.(a) | 5,187,056 | ||||||
| 12,716 | Salesforce.com, Inc.(a) | 1,290,165 | ||||||
| 2,408 | SanDisk Corp.(a) | 118,498 | ||||||
| 5,700 | Solera Holdings, Inc. | 253,878 | ||||||
| 4,200 | Teradata Corp.(a) | 203,742 | ||||||
| 314,228 | The Sage Group PLC | 1,435,811 | ||||||
| 6,900 | Tibco Software, Inc.(a) | 164,979 | ||||||
| 23,500 | Trend Micro, Inc. | 700,759 | ||||||
|
| |||||||
| 56,646,629 | ||||||||
|
| |||||||
| Construction & Building Materials — 0.6% | ||||||||
| 66,123 | CRH PLC | 1,309,032 | ||||||
| 24,093 | EMCOR Group, Inc. | 645,933 | ||||||
| 162,373 | James Hardie Industries SE - ADR(a) | 1,132,002 | ||||||
| 24,933 | Lafarge SA | 872,834 | ||||||
| 8,200 | URS Corp.(a) | 287,984 | ||||||
|
| |||||||
| 4,247,785 | ||||||||
|
| |||||||
| Consumer Products — 2.8% | ||||||||
| 6,100 | Coach, Inc. | 372,344 | ||||||
| 54,953 | Colgate Palmolive Co. | 5,077,108 | ||||||
| 8,700 | Hanesbrands, Inc.(a) | 190,182 | ||||||
| 6,000 | Herbalife Ltd. | 310,020 | ||||||
| 19,590 | Inditex SA | 1,599,224 | ||||||
| 13,676 | Kimberly-Clark Corp. | 1,006,007 | ||||||
| 6,846 | NIKE, Inc., Class B | 659,749 | ||||||
| 8,052 | Nu Skin Enterprises, Inc., Class A | 391,086 | ||||||
| 116,402 | Procter & Gamble Co. | 7,765,177 | ||||||
| 8,873 | Tempur Pedic International, Inc.(a) | 466,099 | ||||||
| 3,916 | The Estee Lauder Cos., Inc. | 439,845 | ||||||
|
| |||||||
| 18,276,841 | ||||||||
|
| |||||||
| Diversified Operations — 1.4% | ||||||||
| 13,134 | 3M Co. | 1,073,442 | ||||||
| 18,234 | Cooper Industries PLC | 987,371 | ||||||
| 332,980 | General Electric Co. | 5,963,672 | ||||||
| 82,800 | Mitsui & Co. Ltd. | 1,283,337 | ||||||
| 7,476 | Textron, Inc. | 138,231 | ||||||
|
| |||||||
| 9,446,053 | ||||||||
|
| |||||||
| Electric Utilities — 0.4% | ||||||||
| 9,178 | Dominion Resources, Inc. | 487,168 | ||||||
| 41,533 | Northeast Utilities | 1,498,096 | ||||||
| 1,099 | Progress Energy, Inc. | 61,566 | ||||||
| 21,604 | Southern Co. | 1,000,049 | ||||||
|
| |||||||
| 3,046,879 | ||||||||
|
| |||||||
| Electronics — 2.8% | ||||||||
| 26,815 | AMETEK, Inc. | 1,128,912 | ||||||
| 9,897 | Emerson Electric Co. | 461,101 | ||||||
| 504,000 | Flextronics International Ltd.(a) | 2,852,640 | ||||||
| 6,500 | FLIR Systems, Inc. | 162,955 | ||||||
| 247,343 | Hon Hai Precision Industry Co., Ltd. | 1,360,388 | ||||||
| 249,433 | Premier Farnell PLC | 697,123 | ||||||
The accompanying notes are an integral part of these financial statements.
8
Table of Contents
schedule of investments (continued)
NEW COVENANT GROWTH FUND
December 31, 2011 (Unaudited)
Shares | Value | Shares | Value |
| COMMON STOCKS (cont.) | ||||||||
| Electronics (cont.) | ||||||||
| 3,614 | Samsung Electronics Co., Ltd. | $3,324,295 | ||||||
| 236,496 | Taiwan Semiconductor - ADR | 3,053,163 | ||||||
| 182,665 | Texas Instruments, Inc. | 5,317,378 | ||||||
| 7,000 | Trimble Navigation Ltd.(a) | 303,800 | ||||||
|
| |||||||
| 18,661,755 | ||||||||
|
| |||||||
| Energy — 3.9% | ||||||||
| 310,400 | AES Corp.(a) | 3,675,136 | ||||||
| 82,667 | Aker Solutions | 866,506 | ||||||
| 7,500 | Cameron International Corp.(a) | 368,925 | ||||||
| 375,500 | China Shenhua Energy Co., Ltd. | 1,623,763 | ||||||
| 2,100 | Core Laboratories NV | 239,295 | ||||||
| 26,997 | Duke Energy Corp. | 593,934 | ||||||
| 10,097 | Entergy Corp. | 737,586 | ||||||
| 99,111 | Exelon Corp. | 4,298,444 | ||||||
| 24,726 | Halliburton Co. | 853,294 | ||||||
| 72,980 | National-Oilwell Varco, Inc. | 4,961,910 | ||||||
| 18,378 | NextEra Energy, Inc. | 1,118,853 | ||||||
| 40,964 | PG&E Corp. | 1,688,536 | ||||||
| 49,000 | Public Service Enterprise Group | 1,617,490 | ||||||
| 7,000 | Southwestern Energy Co.(a) | 223,580 | ||||||
| 13,134 | Spectra Energy Corp. | 403,871 | ||||||
| 90,329 | Xcel Energy, Inc. | 2,496,693 | ||||||
|
| |||||||
| 25,767,816 | ||||||||
|
| |||||||
| Financial Services — 6.9% | ||||||||
| 27,178 | American Express Co. | 1,281,986 | ||||||
| 7,929 | Ameriprise Financial, Inc. | 393,596 | ||||||
| 748,305 | Bank of America Corp. | 4,160,576 | ||||||
| 25,244 | Bank of New York Mellon Corp. | 502,608 | ||||||
| 246,460 | BM&F Bovespa SA | 1,294,898 | ||||||
| 4,705 | Capital One Financial Corp. | 198,974 | ||||||
| 195,577 | Citigroup, Inc. | 5,145,631 | ||||||
| 111,100 | Credit Suisse Group - ADR | 2,608,628 | ||||||
| 30,702 | Deutsche Boerse AG(a) | 1,606,871 | ||||||
| 36,700 | Discover Financial Services | 880,800 | ||||||
| 2,098 | Franklin Resources, Inc. | 201,534 | ||||||
| 5,739 | Goldman Sachs Group, Inc. | 518,978 | ||||||
| 16,577 | Groupe Bruxelles Lambert SA | 1,102,775 | ||||||
| 84,885 | Hargreaves Lansdow | 567,154 | ||||||
| 133,000 | Hong Kong Exchanges & Clearing Ltd. | 2,116,296 | ||||||
| 348,225 | Infrastructure Development Finance Co., Ltd. | 599,852 | ||||||
| 2,744 | IntercontinentalExchange, Inc.(a) | 330,789 | ||||||
| 253,825 | Invesco Ltd. | 5,099,344 | ||||||
| 94,313 | JPMorgan Chase & Co. | 3,135,907 | ||||||
| 6,900 | Lazard Ltd. | 180,159 | ||||||
| 39,722 | Morgan Stanley | 600,994 | ||||||
| 14,800 | NASDAQ OMX Group, Inc.(a) | 362,748 | ||||||
| 2,280 | Northern Trust Corp. | 90,425 | ||||||
| 1,166 | Paychex, Inc. | 35,108 | ||||||
| 45,896 | SLM Corp. | 615,006 | ||||||
| 200,948 | State Street Corp. | 8,100,214 | ||||||
| 2,886 | T Rowe Price Group, Inc. | 164,358 | ||||||
| 287,758 | The Charles Schwab Corp. | 3,240,155 | ||||||
|
| |||||||
| 45,136,364 | ||||||||
|
| |||||||
| Food & Beverages — 6.8% | ||||||||
| 6,175 | Archer Daniels Midland Co. | 176,605 | ||||||
| 45,113 | BIM Birlesik Magazalar A/S | 1,249,274 | ||||||
| 125,185 | Coca-Cola Co. | 8,759,194 | ||||||
| 252,400 | Danone - ADR | 3,190,336 | ||||||
| 27,799 | Dr. Pepper Snapple Group, Inc. | 1,097,505 | ||||||
| 34,176 | General Mills, Inc. | 1,381,052 | ||||||
| 1,101 | Hansen Natural Corp.(a) | 101,446 | ||||||
| 5,600 | Hershey Co. | 345,968 | ||||||
| 45,307 | Kraft Foods, Inc. | 1,692,670 | ||||||
| 22,625 | Kroger Co. | 547,978 | ||||||
| COMMON STOCKS (cont.) | ||||||||
| Food & Beverages (cont.) | ||||||||
| 53,021 | Magnit OJSC - ADR(a) | $1,121,924 | ||||||
| 75,419 | Nestle SA | 4,330,825 | ||||||
| 92,108 | PepsiCo, Inc. | 6,111,366 | ||||||
| 18,448 | Safeway, Inc. | 388,146 | ||||||
| 89,225 | Starbucks Corp. | 4,105,242 | ||||||
| 148,913 | Sysco Corp. | 4,367,618 | ||||||
| 59,303 | Unilever NV | 2,039,043 | ||||||
| 1,297,000 | Want Want China Holdings Ltd. | 1,291,917 | ||||||
| 48,701 | Woolworths Ltd. | 1,250,073 | ||||||
| 45,157 | X5 Retail Group NV - GDR(a) | 1,031,386 | ||||||
|
| |||||||
| 44,579,568 | ||||||||
|
| |||||||
| Health Care Services — 2.5% | ||||||||
| 27,883 | Aetna, Inc. | 1,176,384 | ||||||
| 72,200 | Cerner Corp.(a) | 4,422,250 | ||||||
| 26,224 | Cie Generale d’Optique Essilor International SA | 1,848,567 | ||||||
| 15,700 | DaVita, Inc.(a) | 1,190,217 | ||||||
| 9,780 | Express Scripts, Inc., Class A(a) | 437,068 | ||||||
| 29,400 | Health Management Associates, Inc.(a) | 216,678 | ||||||
| 7,400 | Intuitive Surgical, Inc.(a) | 3,426,274 | ||||||
| 5,921 | McKesson Corp. | 461,305 | ||||||
| 7,118 | Medco Health Solutions, Inc.(a) | 397,896 | ||||||
| 2,713 | Stryker Corp. | 134,864 | ||||||
| 3,200 | SXC Health Solutions Corp.(a) | 180,736 | ||||||
| 38,787 | UnitedHealth Group, Inc. | 1,965,725 | ||||||
| 11,088 | WellPoint, Inc. | 734,580 | ||||||
|
| |||||||
| 16,592,544 | ||||||||
|
| |||||||
| Hotels Restaurants & Leisure — 0.9% | ||||||||
| 21,042 | Carnival Corp. | 686,811 | ||||||
| 6,212 | Marriott International, Inc. | 181,204 | ||||||
| 621 | Marriott Vacations Worldwide Corp.(a) | 10,656 | ||||||
| 70,072 | Starwood Hotels & Resorts Worldwide, Inc. | 3,361,354 | ||||||
| 43,423 | The Walt Disney Company | 1,628,363 | ||||||
|
| |||||||
| 5,868,388 | ||||||||
|
| |||||||
| Household Durables — 0.5% | ||||||||
| 49,762 | Newell Rubbermaid, Inc. | 803,656 | ||||||
| 8,830 | Pulte Group, Inc.(a) | 55,718 | ||||||
| 3,000 | Stanley Black & Decker, Inc. | 202,800 | ||||||
| 51,992 | Wolseley PLC | 1,719,635 | ||||||
|
| |||||||
| 2,781,809 | ||||||||
|
| |||||||
| Insurance — 3.1% | ||||||||
| 5,700 | AFLAC, Inc. | 246,582 | ||||||
| 1,590 | Allied World Assurance Co. Holdings Ltd. | 100,059 | ||||||
| 3,916 | American International Group, Inc.(a) | 90,851 | ||||||
| 289,563 | Amlin PLC | 1,410,243 | ||||||
| 12,200 | Assured Guaranty Ltd. | 160,308 | ||||||
| 9,600 | Axis Capital Holdings Ltd. | 306,816 | ||||||
| 38,590 | Berkshire Hathaway, Inc.(a) | 2,944,417 | ||||||
| 5,364 | Fairfax Financial Holdings Ltd.(a) | 2,300,978 | ||||||
| 35,610 | Genworth Financial, Inc.(a) | 233,246 | ||||||
| 27,149 | Hartford Financial Services Group, Inc. | 441,171 | ||||||
| 111,522 | Marsh & McLennan Cos., Inc. | 3,526,326 | ||||||
| 119,341 | Metlife, Inc. | 3,721,052 | ||||||
| 5,434 | Prudential Financial, Inc. | 272,352 | ||||||
| 9,500 | RenaissanceRe Holdings Ltd. | 706,515 | ||||||
| 41,655 | Sampo OYJ | 1,030,379 | ||||||
| 35,561 | The Allstate Corp. | 974,727 | ||||||
| 12,338 | The Travelers Cos., Inc. | 730,039 | ||||||
| 5,643 | Transatlantic Holdings, Inc. | 308,841 | ||||||
| 42,883 | Unum Group | 903,545 | ||||||
|
| |||||||
| 20,408,447 | ||||||||
|
| |||||||
The accompanying notes are an integral part of these financial statements.
9
Table of Contents
schedule of investments (continued)
NEW COVENANT GROWTH FUND
December 31, 2011 (Unaudited)
Shares | Value | Shares | Value |
| COMMON STOCKS (cont.) | ||||||||
| Internet — 4.2% | ||||||||
| 25,452 | Amazon.com, Inc.(a) | $4,405,741 | ||||||
| 17,768 | Baidu, Inc. - ADR(a) | 2,069,439 | ||||||
| 179,685 | eBay, Inc.(a) | 5,449,846 | ||||||
| 12,117 | Google, Inc.(a) | 7,826,370 | ||||||
| 2,105 | Rakuten, Inc. | 2,264,666 | ||||||
| 182,441 | Symantec Corp.(a) | 2,855,202 | ||||||
| 5,200 | VeriFone Systems, Inc.(a) | 184,704 | ||||||
| 34,598 | VeriSign, Inc. | 1,235,841 | ||||||
| 33,890 | Vistaprint NV(a) | 1,037,034 | ||||||
| 13,542 | Yahoo, Inc.(a) | 218,432 | ||||||
|
| |||||||
| 27,547,275 | ||||||||
|
| |||||||
| Leisure Equipment & Products — 0.2% | ||||||||
| 47,607 | Mattel, Inc. | 1,321,570 | ||||||
| 1,500 | Shimano, Inc. | 73,008 | ||||||
|
| |||||||
| 1,394,578 | ||||||||
|
| |||||||
| Machinery & Equipment — 2.4% | ||||||||
| 198,764 | Atlas Copco AB | 3,762,643 | ||||||
| 16,315 | Caterpillar, Inc. | 1,478,139 | ||||||
| 10,225 | Deere & Co. | 790,904 | ||||||
| 1,143 | ITT Corp. | 22,094 | ||||||
| 25,268 | Joy Global, Inc. | 1,894,342 | ||||||
| 44,518 | Kone OYJ | 2,304,709 | ||||||
| 4,900 | Pall Corp. | 280,035 | ||||||
| 9,800 | SMC Corp. | 1,576,680 | ||||||
| 5,500 | WABCO Holdings, Inc.(a) | 238,700 | ||||||
| 218,700 | Weatherford International Ltd.(a) | 3,201,768 | ||||||
| 2,287 | Xylem, Inc. | 58,753 | ||||||
|
| |||||||
| 15,608,767 | ||||||||
|
| |||||||
| Manufacturing — 1.6% | ||||||||
| 5,400 | Altera Corp. | 200,340 | ||||||
| 33,782 | Analog Devices, Inc. | 1,208,720 | ||||||
| 5,200 | Church & Dwight Co., Inc. | 237,952 | ||||||
| 33,504 | Danaher Corp. | 1,576,028 | ||||||
| 8,435 | Dover Corp. | 489,652 | ||||||
| 12,794 | GrafTech International Ltd.(a) | 174,638 | ||||||
| 24,305 | Honeywell International, Inc. | 1,320,977 | ||||||
| 3,430 | Illinois Tool Works, Inc. | 160,215 | ||||||
| 5,724 | International Paper Co. | 169,430 | ||||||
| 159,238 | Owens-Illinois, Inc.(a) | 3,086,033 | ||||||
| 8,966 | Parker Hannifin Corp. | 683,658 | ||||||
| 5,160 | Precision Castparts Corp. | 850,316 | ||||||
| 7,300 | Skyworks Solutions, Inc.(a) | 118,406 | ||||||
| 5,000 | SPX Corp. | 301,350 | ||||||
|
| |||||||
| 10,577,715 | ||||||||
|
| |||||||
| Media — 2.9% | ||||||||
| 37,379 | CBS Corp. | 1,014,466 | ||||||
| 248,890 | Comcast Corp., Class A | 5,901,182 | ||||||
| 2,649 | DIRECTV(a) | 113,271 | ||||||
| 14,800 | Discovery Communications, Inc., Class C(a) | 557,960 | ||||||
| 26,173 | Gannett, Inc. | 349,933 | ||||||
| 53,298 | Naspers Ltd. | 2,328,136 | ||||||
| 12,200 | National CineMedia, Inc. | 151,280 | ||||||
| 63,646 | News Corp. | 1,135,445 | ||||||
| 6,380 | Time Warner Cable, Inc. | 405,577 | ||||||
| 166,460 | Time Warner, Inc. | 6,015,864 | ||||||
| 6,102 | Viacom, Inc. | 277,092 | ||||||
| 35,700 | Virgin Media, Inc. | 763,266 | ||||||
|
| |||||||
| 19,013,472 | ||||||||
|
| |||||||
| Medical — 2.5% | ||||||||
| 5,697 | Allergan, Inc. | 499,855 | ||||||
| 22,417 | Amgen, Inc. | 1,439,396 | ||||||
| 12,365 | Baxter Inernational, Inc. | 611,820 | ||||||
| 37,557 | Boston Scientific Corp.(a) | 200,554 | ||||||
| COMMON STOCKS (cont.) | ||||||||
| Medical (cont.) | ||||||||
| 13,369 | Celgene Corp.(a) | $903,744 | ||||||
| 22,470 | Cochlear Ltd. | 1,427,092 | ||||||
| 16,558 | Covidien Plc | 745,276 | ||||||
| 7,000 | Dendreon Corp.(a) | 53,200 | ||||||
| 60,000 | DENTSPLY International, Inc. | 2,099,400 | ||||||
| 15,000 | Hologic, Inc.(a) | 262,650 | ||||||
| 68,297 | Johnson & Johnson, Inc. | 4,478,917 | ||||||
| 29,006 | Medtronic, Inc. | 1,109,480 | ||||||
| 61,500 | Olympus Corp. | 808,411 | ||||||
| 23,187 | St. Jude Medical, Inc. | 795,314 | ||||||
| 13,599 | Thermo Fisher Scientific, Inc.(a) | 611,547 | ||||||
|
| |||||||
| 16,046,656 | ||||||||
|
| |||||||
| Metals & Mining — 1.7% | ||||||||
| 16,715 | Alcoa, Inc. | 144,585 | ||||||
| 90,650 | Antofagasta PLC | 1,714,410 | ||||||
| 25,000 | Barrick Gold Corp. | 1,131,250 | ||||||
| 51,018 | BHP Billiton PLC | 1,491,535 | ||||||
| 98,937 | Eldorado Gold Corp.(a) | 1,361,567 | ||||||
| 29,209 | Freeport-McMoRan Copper & Gold, Inc., Class B | 1,074,599 | ||||||
| 66,453 | IAMGOLD Corp.(a) | 1,055,420 | ||||||
| 13,533 | Newmont Mining Corp. | 812,115 | ||||||
| 9,181 | Peabody Energy Corp. | 303,983 | ||||||
| 44,521 | Rio Tinto PLC | 2,174,681 | ||||||
|
| |||||||
| 11,264,145 | ||||||||
|
| |||||||
| Oil & Gas — 9.3% | ||||||||
| 17,938 | Anadarko Petroleum Corp. | 1,369,208 | ||||||
| 9,135 | Apache Corp. | 827,448 | ||||||
| 21,218 | Baker Hughes, Inc. | 1,032,044 | ||||||
| 75,125 | BG Group PLC | 1,604,931 | ||||||
| 7,604 | Cabot Oil & Gas Corp. | 577,144 | ||||||
| 27,711 | Cenovus Energy, Inc.(a) | 920,209 | ||||||
| 48,993 | Chevron Texaco Corp. | 5,212,855 | ||||||
| 3,600 | Concho Resources Inc.(a) | 337,500 | ||||||
| 38,420 | ConocoPhillips | 2,799,665 | ||||||
| 15,000 | Denbury Resources, Inc.(a) | 226,500 | ||||||
| 63,857 | Devon Energy Corp. | 3,959,134 | ||||||
| 17,460 | Dresser-Rand Group, Inc.(a) | 871,429 | ||||||
| 6,917 | EOG Resources, Inc. | 681,394 | ||||||
| 118,453 | Exxon Mobil Corp. | 10,040,076 | ||||||
| 48,565 | Galp Energia SGPS SA | 713,542 | ||||||
| 10,076 | Hess Corp. | 572,317 | ||||||
| 225 | Inpex Corp. | 1,416,651 | ||||||
| 1,328,000 | Kunlun Energy Co., Ltd. | 1,883,194 | ||||||
| 33,907 | Marathon Oil Corp. | 992,458 | ||||||
| 16,953 | Marathon Petroleum Corp. | 564,365 | ||||||
| 21,223 | Occidental Petroleum Corp. | 1,988,595 | ||||||
| 136,955 | OGX Petroleo e Gas Participacoes SA(a) | 1,000,041 | ||||||
| 4,500 | Oil States International, Inc.(a) | 343,665 | ||||||
| 60,740 | Petroleo Brasileiro SA - ADR | 1,509,389 | ||||||
| 101,305 | Schlumberger Ltd. | 6,920,145 | ||||||
| 56,799 | Seadrill Ltd. | 1,894,194 | ||||||
| 105,100 | Sunoco, Inc. | 4,311,202 | ||||||
| 13,152 | The Williams Cos., Inc. | 434,279 | ||||||
| 101,135 | Tullow Oil PLC | 2,197,463 | ||||||
| 61,326 | UGI Corp. | 1,802,984 | ||||||
| 13,392 | Ultra Petroleum Corp.(a) | 396,805 | ||||||
| 4,141 | Valero Energy Corp. | 87,168 | ||||||
| 6,900 | Whiting Petroleum Corp.(a) | 322,161 | ||||||
| 28,200 | YPF Sociedad Anonima - ADR | 977,976 | ||||||
|
| |||||||
| 60,788,131 | ||||||||
|
| |||||||
| Pharmaceuticals — 6.2% | ||||||||
| 113,922 | Abbott Laboratories | 6,405,834 | ||||||
| 34,831 | Bristol Myers Squibb Co. | 1,227,444 | ||||||
The accompanying notes are an integral part of these financial statements.
10
Table of Contents
schedule of investments (continued)
NEW COVENANT GROWTH FUND
December 31, 2011 (Unaudited)
Shares | Value | Shares | Value |
| COMMON STOCKS (cont.) | ||||||||
| Pharmaceuticals (cont.) | ||||||||
| 41,184 | Eli Lilly & Co. | $1,711,607 | ||||||
| 23,810 | Forest Laboratories, Inc.(a) | 720,491 | ||||||
| 31,089 | Gilead Sciences, Inc.(a) | 1,272,473 | ||||||
| 93,756 | Merck & Co., Inc. | 3,534,601 | ||||||
| 1,700 | Mettler-Toledo International, Inc.(a) | 251,107 | ||||||
| 215,350 | Mylan(a) | 4,621,411 | ||||||
| 52,800 | Novartis AG - ADR | 3,018,576 | ||||||
| 28,400 | Novo Nordisk A/S - ADR | 3,273,384 | ||||||
| 21,700 | Perrigo Co. | 2,111,410 | ||||||
| 404,798 | Pfizer, Inc. | 8,759,829 | ||||||
| 87,400 | Sanofi SA - ADR | 3,193,596 | ||||||
| 3,700 | Shire Pharmaceuticals PLC - ADR | 384,430 | ||||||
| 5,671 | Watson Pharmaceuticals, Inc.(a) | 342,188 | ||||||
|
| |||||||
| 40,828,381 | ||||||||
|
| |||||||
| Real Estate — 1.0% | ||||||||
| 596 | Apartment Investment & Management Co. | 13,654 | ||||||
| 3,046 | Boston Properties, Inc. | 303,382 | ||||||
| 90,000 | Cheung Kong Holdings Ltd. | 1,067,615 | ||||||
| 5,080 | Equity Residential | 289,712 | ||||||
| 37,951 | Forest City Enterprises, Inc.(a) | 448,581 | ||||||
| 4,461 | HCP, Inc. | 184,819 | ||||||
| 12,546 | Host Hotels & Resorts, Inc. | 185,304 | ||||||
| 3,900 | Jones Lang Lasalle, Inc. | 238,914 | ||||||
| 2,780 | Plum Creek Timber Co, Inc. | 101,637 | ||||||
| 6,138 | Prologis, Inc. | 175,485 | ||||||
| 17,779 | PS Business Parks, Inc. | 985,490 | ||||||
| 6,962 | Public Storage | 936,111 | ||||||
| 9,070 | Simon Property Group, Inc. | 1,169,486 | ||||||
| 2,359 | Vornado Reality Trust | 181,313 | ||||||
| 15,878 | Weyerhaeuser Co. | 296,442 | ||||||
|
| |||||||
| 6,577,945 | ||||||||
|
| |||||||
| Restaurant — 1.3% | ||||||||
| 29,498 | McDonald’s Corp. | 2,959,534 | ||||||
| 99,567 | Yum Brands, Inc. | 5,875,449 | ||||||
|
| |||||||
| 8,834,983 | ||||||||
|
| |||||||
| Retail — 4.7% | ||||||||
| 3,082 | Abercrombie & Fitch Co., Class A | 150,525 | ||||||
| 9,693 | Big Lots, Inc.(a) | 366,007 | ||||||
| 26,427 | CFAO SA | 894,064 | ||||||
| 157,097 | CVS Caremark Corp. | 6,406,416 | ||||||
| 10,500 | Fast Retailing Co. | 1,910,001 | ||||||
| 50,933 | Gap, Inc. | 944,807 | ||||||
| 48,730 | Home Depot, Inc. | 2,048,609 | ||||||
| 10,423 | Kohl’s Corp. | 514,375 | ||||||
| 183,300 | Lowe’s Cos., Inc. | 4,652,154 | ||||||
| 49,490 | Massmart Holdings | 1,034,132 | ||||||
| 6,658 | Nordstrom, Inc. | 330,969 | ||||||
| 4,000 | O’Reilly Automotive, Inc.(a) | 319,800 | ||||||
| 8,574 | Staples, Inc. | 119,093 | ||||||
| 21,683 | Target Corp. | 1,110,603 | ||||||
| 7,162 | The Sherwin-Williams Co. | 639,352 | ||||||
| 4,100 | Tiffany & Co. | 271,666 | ||||||
| 13,867 | TJX Cos., Inc. | 895,115 | ||||||
| 1,900 | Tractor Supply Co. | 133,285 | ||||||
| 15,353 | Urban Outfitters, Inc.(a) | 423,129 | ||||||
| 113,208 | Wal Mart Stores, Inc. | 6,765,310 | ||||||
| 23,338 | Walgreen Co. | 771,554 | ||||||
| 6,691 | Whole Foods Market, Inc. | 465,560 | ||||||
|
| |||||||
| 31,166,526 | ||||||||
|
| |||||||
| Schools — 0.0% | ||||||||
| 3,500 | Devry, Inc. | 134,610 | ||||||
|
| |||||||
| COMMON STOCKS (cont.) | ||||||||
| Semiconductor Equipment — 0.9% | ||||||||
| 43,171 | Aixtron | $548,667 | ||||||
| 243,400 | Applied Materials, Inc. | 2,606,814 | ||||||
| 5,300 | ASML Holding NV - ADR | 221,487 | ||||||
| 4,000 | Linear Technology Corp. | 120,120 | ||||||
| 178,000 | Mediatek, Inc. | 1,629,234 | ||||||
| 19,265 | Xilinx, Inc. | 617,636 | ||||||
|
| |||||||
| 5,743,958 | ||||||||
|
| |||||||
| Technology — 1.9% | ||||||||
| 8,995 | Accenture PLC | 478,804 | ||||||
| 42,200 | Canon, Inc. | 1,857,110 | ||||||
| 4,188 | Cognizant Technology Solutions Corp.(a) | 269,330 | ||||||
| 2,287 | Exelis, Inc. | 20,697 | ||||||
| 7,700 | Goodrich Corp. | 952,490 | ||||||
| 110,734 | Intel Corp. | 2,685,300 | ||||||
| 23,081 | Juniper Networks, Inc.(a) | 471,083 | ||||||
| 87,200 | Life Technologies Corp.(a) | 3,392,952 | ||||||
| 39,734 | Maxim Integrated Products, Inc. | 1,034,673 | ||||||
| 26,342 | United Technologies Corp. | 1,925,337 | ||||||
|
| |||||||
| 13,087,776 | ||||||||
|
| |||||||
| Telecommunication — 2.4% | ||||||||
| 11,701 | American Tower Corp., Class A(a) | 702,177 | ||||||
| 188,542 | AT&T, Inc. | 5,701,510 | ||||||
| 25,678 | Broadcom Corp. | 753,906 | ||||||
| 20,301 | Corning, Inc. | 263,507 | ||||||
| 6,829 | Motorola Mobility Holdings, Inc.(a) | 264,965 | ||||||
| 7,804 | Motorola Solutions, Inc. | 361,247 | ||||||
| 41,716 | NeuStar, Inc., Class A(a) | 1,425,436 | ||||||
| 45,578 | Qualcomm, Inc. | 2,493,117 | ||||||
| 17,400 | SBA Communications Corp., Class A(a) | 747,504 | ||||||
| 109,914 | Sprint Nextel Corp.(a) | 257,199 | ||||||
| 85,680 | Verizon Communications, Inc. | 3,437,481 | ||||||
|
| |||||||
| 16,408,049 | ||||||||
|
| |||||||
| Transportation — 2.6% | ||||||||
| 151 | A.P. Moller - Maersk A/S | 993,229 | ||||||
| 3,600 | C.H. Robinson Worldwide, Inc. | 251,208 | ||||||
| 13,539 | CSX Corp. | 285,131 | ||||||
| 341,035 | Delta Air Lines, Inc.(a) | 2,758,973 | ||||||
| 70,752 | DSV A/S | 1,264,339 | ||||||
| 2,051 | Fedex Corp. | 171,279 | ||||||
| 19,631 | J.B. Hunt Transport Services, Inc. | 884,769 | ||||||
| 7,400 | Kansas City Southern(a) | 503,274 | ||||||
| 8,455 | Norfolk Southern Corp. | 616,031 | ||||||
| 303,000 | Pacific Basin Shipping Ltd. | 120,980 | ||||||
| 52,724 | Ryanair Holdings PLC - ADR(a) | 1,468,891 | ||||||
| 369,196 | Southwest Airlines Co. | 3,160,318 | ||||||
| 13,082 | Union Pacific Corp. | 1,385,907 | ||||||
| 25,848 | United Parcel Service, Inc., Class B | 1,891,815 | ||||||
| 42,596 | Werner Enterprises, Inc. | 1,026,564 | ||||||
|
| |||||||
| 16,782,708 | ||||||||
|
| |||||||
| Waste Management — 0.0% | ||||||||
| 7,421 | Waste Management, Inc. | 242,741 | ||||||
|
| |||||||
| Total Common Stocks (Cost $584,915,606) | 643,416,767 | |||||||
|
| |||||||
| PREFERRED STOCKS — 0.5% | ||||||||
| Banks — 0.2% | ||||||||
| 61,043 | Itau Unibanco Holding SA | 1,132,958 | ||||||
|
| |||||||
| Metals & Mining — 0.3% | ||||||||
| 117,139 | Vale SA | 2,413,063 | ||||||
|
| |||||||
| Total Preferred Stocks (Cost $3,851,866) | 3,546,021 | |||||||
|
| |||||||
The accompanying notes are an integral part of these financial statements.
11
Table of Contents
schedule of investments (continued)
NEW COVENANT GROWTH FUND
December 31, 2011 (Unaudited)
Shares | Value |
| CASH EQUIVALENTS — 0.9% | ||||||||
| 5,987,056 | JP Morgan Cash Trade Execution | $5,987,056 | ||||||
|
| |||||||
| Total Cash Equivalents (Cost $5,987,056) | 5,987,056 | |||||||
|
| |||||||
| TOTAL INVESTMENTS — 99.1% | ||||||||
| (Cost $594,754,528) | $652,949,844 | |||||||
| Other Assets in Excess of Liabilities — 0.9% | 5,539,202 | |||||||
|
| |||||||
| NET ASSETS — 100.0% | $658,489,046 | |||||||
|
| |||||||
| Percentages are stated as a percent of net assets. | ||
| (a) | Non-income producing security. | |
| Abbreviations: | ||
| ADR | American Depository Receipt | |
| PLC | Public Liability Company | |
| GDR | Global Depository Receipt | |
Country Diversification: December 31, 2011
(Shown as a percentage of Investments)(Unaudited)
| United States | 75.2 | % | ||
| United Kingdom | 2.5 | % | ||
| Switzerland | 2.0 | % | ||
| Japan | 1.8 | % | ||
| France | 1.8 | % | ||
| Bermuda | 1.6 | % | ||
| Canada | 1.3 | % | ||
| Brazil | 1.1 | % | ||
| Denmark | 1.1 | % | ||
| Netherlands | 1.1 | % | ||
| Other | 10.5 | % | ||
|
| |||
| Total | 100.0 | % | ||
|
|
The accompanying notes are an integral part of these financial statements.
12
Table of Contents
schedule of investments (continued)
NEW COVENANT INCOME FUND
December 31, 2011 (Unaudited)
| Principal Amount | Value | Principal Amount | Value | |||||||||
| ASSET BACKED SECURITIES — 5.4% | ||||||||
| $2,000,000 | AEP Texas Central Transition Funding LLC 2006-2 5.170%, 01/01/2020 | $2,335,941 | ||||||
| 600,000 | American Express Credit 2011-1 A 0.488%, 04/17/2017 | 600,658 | ||||||
| 647,903 | Atlantic City Electric 2002-1 A-3 4.910%, 07/20/2017 | 691,042 | ||||||
| 550,000 | Bayview Financial Trust 2007-A 6.205%, 05/28/2037 | 534,684 | ||||||
| 2,039,000 | CenterPoint Energy Transition Bond Co. 2005-A3 5.090%, 08/01/2015 | 2,163,680 | ||||||
| 934,184 | Centex Home Equity Trust 2005-C 5.048%, 06/25/2035 | 921,053 | ||||||
| 3,500,000 | Citibank Credit Card Issuance Trust 2009-A2 1.828%, 05/15/2014 | 3,519,826 | ||||||
| 2,250,000 | Consumers Funding LLC 2001-1 5.760%, 10/20/2016 | 2,573,380 | ||||||
| 635,006 | Continental Airlines 2000-2 7.707%, 10/02/2022 (Acquired 09/23/2010 and 02/22/2011, Cost $693,882)(a) | 680,218 | ||||||
| 594,548 | Countrywide Asset-Backed Certificates 2005-1 5.030%, 07/25/2035 | 570,434 | ||||||
| 4,475,000 | GE Capital Credit Master Note Trust 2007-4 0.328%, 06/15/2015 | 4,472,250 | ||||||
| 1,798,117 | New Valley Generation I 2000-1 7.299%, 03/15/2019 | 2,173,474 | ||||||
| Union Pacific Raildroad Co. | ||||||||
| 1,834,703 | 2004-1, 5.404%, 07/02/2025 | 2,065,508 | ||||||
| 940,713 | 2002-1, 6.061%, 01/17/2023 | 1,067,022 | ||||||
|
| |||||||
| Total Asset Backed Securities (Cost $23,913,930) | 24,369,170 | |||||||
|
| |||||||
| CORPORATE BONDS — 24.2% | ||||||||
| 692,000 | Aegon NV 4.750%, 06/01/2013 | 708,310 | ||||||
| 675,000 | Allied Waste North America, Inc. 6.875%, 06/01/2017 | 714,618 | ||||||
| 600,000 | America Movil SAB De CV 5.500%, 03/01/2014 | 647,452 | ||||||
| 2,196,748 | American Airlines 5.250%, 07/31/2022 | 2,042,975 | ||||||
| 850,000 | American Express Co. 8.125%, 05/20/2019 | 1,100,541 | ||||||
| 1,150,000 | American Water Capital Corp. 6.085%, 10/15/2017 | 1,339,391 | ||||||
| 800,000 | ANZ National International Ltd. 3.125%, 08/10/2015 (Acquired 08/03/2010, Cost $799,336)(a) | 800,465 | ||||||
| 700,000 | Arcelormittal SA 9.850%, 06/01/2019 | 779,591 | ||||||
| 1,000,000 | Arden Realty LP 5.250%, 03/01/2015 | 1,062,837 | ||||||
| 1,000,000 | ASIF Global Financing XIX 4.900%, 01/17/2013 (Acquired 05/26/2011, Cost $1,034,451)(a) | 1,009,111 | ||||||
| 1,000,000 | AT&T, Inc. 4.850%, 02/15/2014 | 1,078,417 | ||||||
| 550,000 | Bank of America Funding Corp. 7.625%, 06/01/2019 | 569,621 | ||||||
| 1,000,000 | Barclays Bank Plc 6.750%, 05/22/2019 | 1,110,253 | ||||||
| 600,000 | BB&T Corp. 6.850%, 04/30/2019 | 733,229 | ||||||
| 375,000 | BlackRock, Inc. 2.250%, 12/10/2012 | 380,156 | ||||||
| Burlington Northern and Santa Fe Railway Co. | ||||||||
| 1,549,479 | 5.140%, 01/15/2021 | 1,691,399 | ||||||
| 981,221 | 4.830%, 01/15/2023 (Acquired 09/01/2010 through 03/25/2011, Cost $1,066,119)(a) | 1,085,123 | ||||||
| 894,050 | Cal Dive International, Inc. 4.930%, 02/01/2027 | 1,034,589 | ||||||
| 1,627,600 | Canal Barge Co., Inc. 4.500%, 11/12/2034 | 1,951,214 | ||||||
| 2,800,000 | Carolina Power & Light Co. 6.500%, 07/15/2012 | 2,884,076 | ||||||
| 800,000 | CBS Corp. 8.875%, 05/15/2019 | 1,028,974 | ||||||
| CORPORATE BONDS (cont.) | ||||||||
| Citigroup, Inc. | ||||||||
| $500,000 | 6.000%, 12/13/2013 | $517,616 | ||||||
| 1,250,000 | 6.125%, 11/21/2017 | 1,335,687 | ||||||
| 403,000 | 5.375%, 08/09/2020 | 415,104 | ||||||
| 500,000 | CNA Financial Corp. 5.875%, 08/15/2020 | 514,489 | ||||||
| 1,750,000 | Commonwealth Edison Co. 6.150%, 09/15/2017 | 2,080,697 | ||||||
| 1,000,000 | Computer Sciences Corp. 5.500%, 03/15/2013 | 995,250 | ||||||
| 1,590,221 | Continental Airlines 6.545%, 02/02/2019 | 1,655,738 | ||||||
| 1,000,000 | Cox Communications, Inc. 5.450%, 12/15/2014 | 1,110,791 | ||||||
| 1,250,899 | CSX Transportation, Inc. 6.251%, 01/15/2023 | 1,511,277 | ||||||
| 1,961,862 | CVS Caremark Corp. 6.036%, 12/10/2028 | 2,047,175 | ||||||
| 1,925,000 | Delphi Financial Group, Inc. 7.875%, 01/31/2020 | 2,191,697 | ||||||
| 1,839,368 | Delta Air Lines 6.200%, 07/02/2018 | 1,958,927 | ||||||
| 1,400,000 | DIRECTV Holdings LLC 7.625%, 05/15/2016 | 1,487,126 | ||||||
| 1,500,000 | Dominion Resources Inc. 2.879%, 09/30/2066 | 1,270,097 | ||||||
| 1,000,000 | Energy Transfer Partners LP 5.950%, 02/01/2015 | 1,081,636 | ||||||
| 1,775,000 | Entergy Louisiana LLC 6.500%, 09/01/2018 | 2,147,583 | ||||||
| 750,000 | Enterprise Products Operating LLC 7.625%, 02/15/2012 | 754,751 | ||||||
| 600,000 | Exelon Corp. 4.900%, 06/15/2015 | 647,002 | ||||||
| 1,497,303 | FedEx Corp. 6.720%, 06/15/2023 | 1,770,561 | ||||||
| 2,700,000 | Fifth Third Bancorp 6.250%, 05/01/2013 | 2,839,161 | ||||||
| General Electric Capital Corp. | ||||||||
| 1,990,000 | 5.625%, 05/01/2018 | 2,231,803 | ||||||
| 2,500,000 | 6.000%, 08/07/2019 | 2,876,025 | ||||||
| 1,695,000 | Global Industries Ltd. 7.710%, 02/15/2025 | 2,068,520 | ||||||
| Goldman Sachs Group, Inc. | ||||||||
| 647,000 | 5.350%, 01/15/2016 | 663,867 | ||||||
| 1,000,000 | 5.950%, 01/18/2018 | 1,025,512 | ||||||
| 1,000,000 | Home Depot, Inc. 5.400%, 03/01/2016 | 1,156,061 | ||||||
| 1,500,000 | ING Bank NV 2.000%, 10/18/2013 (Acquired 05/20/2011, Cost $1,500,687)(a) | 1,465,702 | ||||||
| 215,000 | Investco Ltd. 5.375%, 12/15/2014 | 230,636 | ||||||
| JP Morgan Chase & Co. | ||||||||
| 1,500,000 | 2.125%, 06/22/2012 | 1,514,656 | ||||||
| 1,100,000 | 5.750%, 01/02/2013 | 1,141,351 | ||||||
| 650,000 | Kookmin Bank 7.250%, 05/14/2014 (Acquired 08/24/2009, Cost $677,908)(a) | 721,202 | ||||||
| 215,000 | Korea Electric Power Corp. 7.750%, 04/01/2013 | 229,238 | ||||||
| 600,000 | Kraft Foods, Inc. 4.125%, 02/09/2016 | 652,054 | ||||||
| 1,200,000 | Liberty Mutual Group, Inc. 5.750%, 03/15/2014 (Acquired 05/19/2011, Cost $1,271,560)(a) | 1,252,001 | ||||||
| Marsh & McLennan Cos., Inc. | ||||||||
| 1,000,000 | 6.250%, 03/15/2012 | 1,009,433 | ||||||
| 300,000 | 4.850%, 02/15/2013 | 309,615 | ||||||
| 1,352,000 | Matson Navigation Co., Inc. 5.337%, 09/04/2028 | 1,585,977 | ||||||
| Merrill Lynch & Co. | ||||||||
| 1,000,000 | 6.050%, 08/15/2012 | 1,014,593 | ||||||
| 590,000 | 6.875%, 04/25/2018 | 582,437 | ||||||
| 1,000,000 | MetLife, Inc. 5.000%, 06/15/2015 | 1,090,261 | ||||||
| 800,000 | Metropolitan Life Global Funding 5.125%, 04/10/2013 (Acquired 06/26/2009 through 08/05/2010, Cost $815,557)(a) | 835,965 | ||||||
| 1,000,000 | Morgan Stanley 6.000%, 05/13/2014 | 1,010,265 | ||||||
The accompanying notes are an integral part of these financial statements.
13
Table of Contents
schedule of investments (continued)
NEW COVENANT INCOME FUND
December 31, 2011 (Unaudited)
| Principal Amount | Value | Principal Amount | Value | |||||||||
| CORPORATE BONDS (cont.) | ||||||||
| National Australia Bank Ltd. | ||||||||
| $535,000 | 3.750%, 03/02/2015 (Acquired 05/19/2011, Cost $1,271,560)(a) | $552,505 | ||||||
| 600,000 | 3.000%, 07/27/2016 (Acquired 07/27/2011, Cost $598,344)(a) | 598,394 | ||||||
| National Rural Utility Corp. | ||||||||
| 1,825,000 | 5.450%, 02/01/2018 | 2,104,643 | ||||||
| 650,000 | 10.375%, 11/01/2018 | 936,430 | ||||||
| 400,000 | Nationsbank Corp. 10.200%, 07/15/2015 | 428,822 | ||||||
| 600,000 | Pemex Finance Ltd. 10.610%, 08/15/2017 | 737,677 | ||||||
| 656,295 | Petrodrill Five Ltd. 4.390%, 04/15/2016 | 704,703 | ||||||
| 937,564 | Petrodrill Four Ltd. 4.240%, 01/15/2016 | 991,792 | ||||||
| 500,000 | Plum Creek Timberlands LP 5.875%, 11/15/2015 | 555,471 | ||||||
| PNC Funding Corp. | ||||||||
| 1,025,000 | 5.500%, 09/28/2012 | 1,053,222 | ||||||
| 510,000 | 5.125%, 02/08/2020 | 577,254 | ||||||
| 600,000 | Principal Life Global Funding I 6.250%, 02/15/2012 (Acquired 08/25/2009, Cost $601,765)(a) | 603,820 | ||||||
| 750,000 | Prudential Financial, Inc. 5.100%, 09/20/2014 | 807,181 | ||||||
| 850,000 | Prudential Holdings LLC 8.695%, 12/18/2023 (Acquired 11/09/2009 and 10/31/2011, Cost $941,526)(a) | 1,070,018 | ||||||
| 750,000 | Rio Tinto Finance USA Ltd. 5.200%, 11/02/2040 | 862,382 | ||||||
| 1,200,000 | Santander US Debt SA Unipersonal 2.991%, 10/07/2013 (Acquired 09/27/2010, Cost $1,200,000)(a) | 1,147,697 | ||||||
| 800,000 | Sumitomo Mitsui Banking Corp. 2.150%, 07/22/2013 (Acquired 07/14/2010, Cost $799,696)(a) | 812,550 | ||||||
| 816,000 | TCI Communications, Inc. 8.750%, 08/01/2015 | 992,072 | ||||||
| 718,000 | Teck Resources Ltd. 10.250%, 05/15/2016 | 826,438 | ||||||
| 875,000 | Telecom Italia Capital SA 5.250%, 10/01/2015 | 803,327 | ||||||
| 1,000,000 | Telefonica Emisiones S A U 6.421%, 06/20/2016 | 1,047,505 | ||||||
| 750,000 | Time Warner Cable, Inc. 5.000%, 02/01/2020 | 823,100 | ||||||
| Time Warner, Inc. | ||||||||
| 915,000 | 5.875%, 11/15/2016 | 1,057,251 | ||||||
| 850,000 | 4.700%, 01/15/2021 | 916,906 | ||||||
| 2,290,000 | Totem Ocean Trailer Express, Inc. 6.365%, 12/18/2027 | 3,031,035 | ||||||
| 775,000 | UFJ Finance Aruba AEC 6.750%, 07/15/2013 | 828,435 | ||||||
| 1,500,000 | USB Capital IX 3.500%, 04/15/2042 | 1,047,810 | ||||||
| 1,727,000 | Vessel Management Services, Inc. 5.125%, 04/16/2035 | 1,997,680 | ||||||
| 1,000,000 | Vodafone Group PLC 5.625%, 02/27/2017 | 1,162,453 | ||||||
| 300,000 | Volkswagen International Finance NV 1.625%, 08/12/2013 (Acquired 11/05/2010, Cost $302,080)(a) | 300,943 | ||||||
| 900,000 | Wells Fargo & Co. 5.625%, 12/11/2017 | 1,026,886 | ||||||
| 850,000 | Westpac Banking Corp. 4.200%, 02/27/2015 | 886,551 | ||||||
| 200,000 | Williams Partners LP 7.250%, 02/01/2017 | 237,525 | ||||||
| 1,260,000 | Xstrata Canada Corp. 7.350%, 06/05/2012 | 1,292,778 | ||||||
|
| |||||||
| Total Corporate Bonds (Cost $105,294,517) | 109,575,137 | |||||||
|
| |||||||
| FOREIGN GOVERNMENT AGENCY ISSUES — 0.2% | ||||||||
| $1,000,000 | Corporacion Andina De Fomento Note 3.750%, 01/15/2016 | $1,020,408 | ||||||
|
| |||||||
| Total Foreign Government Agency Issues (Cost $1,007,760) | 1,020,408 | |||||||
|
| |||||||
| NON AGENCY MORTGAGE BACKED SECURITIES - 9.5% | ||||||||
| 780,677 | American Home Mortgage Investment Trust 2005-1 7A1 2.801%, 06/25/2045 | 685,832 | ||||||
| Banc of America Commercial Mortgage | ||||||||
| 1,175,415 | 2004-3 A5, 5.544%, 06/10/2039 | 1,267,594 | ||||||
| 4,215,000 | 2006-3, 5.858%, 07/10/2044 | 4,082,419 | ||||||
| 5,235,000 | 2006-4, 5.675%, 07/10/2046 | 5,393,406 | ||||||
| 700,000 | 2007-1, 5.451%, 01/15/2049 | 763,417 | ||||||
| 403,000 | 2007-1 A3, 5.449%, 01/15/2049 | 424,952 | ||||||
| Bear Stearns Commercial Mortgage Securites | ||||||||
| 1,470,000 | 2007-PWR18, 6.187%, 06/13/2050 | 917,970 | ||||||
| 2,300,000 | 2005-PWR9, 4.871%, 09/11/2042 | 2,504,018 | ||||||
| 1,596,000 | Citigroup Commercial Mortgage Trust 2008-C7 6.007%, 12/10/2049 | 821,460 | ||||||
| 1,950,000 | Citigroup/Deutsche Bank Commercial Mortgage Trust A4 5.225%, 07/15/2044 | 2,164,101 | ||||||
| 2,350,000 | Commercial Mortgage Pass Through Certificate 5.116%, 06/10/2044 | 2,586,438 | ||||||
| 1,125,761 | Countrywide Alternative Loan Trust 2003-20CB 5.500%, 10/25/2033 | 1,186,737 | ||||||
| 1,205,000 | Credit Suisse Mortgage Capital Certificate 2006-C1 AM 5.412%, 02/15/2039 | 1,226,847 | ||||||
| 1,632,097 | Deutsche ALT-A Securities, Inc. Mortgage Loan Trust 005-3 5A5 5.250%, 06/25/2035 | 1,481,720 | ||||||
| 1,300,793 | GE Capital Commercial Mortgage Corp. 2004-C1 4.596%, 11/10/2038 | 1,353,781 | ||||||
| 1,230,000 | GMAC Commercial Mortgage Securities, Inc. 2004-C2 A4 5.301%, 08/10/2038 | 1,312,202 | ||||||
| JP Morgan Chase Commerical Mortgage Securities Corp. | ||||||||
| 550,000 | 2006-CIBC15 A4, 5.814%, 06/12/2043 | 596,835 | ||||||
| 2,310,000 | 2005-CIBC12 A4, 4.895%, 09/12/2037 | 2,529,688 | ||||||
| 3,770,000 | LB-UBS Commercial Morgage Trust 2006-C6 AM 5.413%, 09/15/2039 | 3,812,827 | ||||||
| 393,399 | MASTR Alernative Loans Trust 2004-2 4A1 5.000%, 02/25/2019 | 398,007 | ||||||
| 1,300,000 | NCUA Guaranteed Notes Trust 2010-C1 2.900%, 10/29/2020 | 1,374,486 | ||||||
| 524,473 | Residential Accredit Loans, Inc. 2004-QS5 A1 4.600%, 04/25/2034 | 509,957 | ||||||
| 261,321 | Residential Asset Securitization Trust 2004-IP2 2.604%, 12/25/2034 | 225,364 | ||||||
| 839,711 | Structured Adjustable Rate Mortgage Loan Trust 2004-3AC A2 1.618%, 03/25/2034 | 744,905 | ||||||
| 1,774,750 | TBW Morgage Backed Pass-Through Certificates 2006-2 7A1 7.000%, 07/25/2036(D) | 469,960 | ||||||
| Wachovia Bank Commercial Mortgage Trust | ||||||||
| 2,285,000 | 2004-C12 A4, 5.316%, 07/15/2041 | 2,458,994 | ||||||
| 1,500,000 | 2005-C22, 5.269%, 12/15/2044 | 1,657,026 | ||||||
|
| |||||||
| Total Non Agency Mortgage Backed Securities (Cost $43,656,588) | 42,950,943 | |||||||
|
| |||||||
| US GOVERNMENT AGENCIES — 46.5% | ||||||||
| Fannie Mae | ||||||||
| 1,603,013 | 6.183%, 02/01/2012 | 1,603,940 | ||||||
| 1,283,000 | 1.250%, 08/20/2013 | 1,301,483 | ||||||
The accompanying notes are an integral part of these financial statements.
14
Table of Contents
schedule of investments (continued)
NEW COVENANT INCOME FUND
December 31, 2011 (Unaudited)
| Principal Amount | Value | Principal Amount | Value | |||||||||
| US GOVERNMENT AGENCIES (cont.) | ||||||||
| Fannie Mae (cont.) | ||||||||
| $333,059 | 6.500%, 08/01/2017 | $366,040 | ||||||
| 804,792 | 4.377%, 11/01/2019 | 894,725 | ||||||
| 2,136,953 | 4.530%, 12/01/2019 | 2,389,524 | ||||||
| 1,168,225 | 4.501%, 01/01/2020 | 1,290,970 | ||||||
| 2,112,365 | 4.600%, 04/01/2020 | 2,369,940 | ||||||
| 2,242,916 | 3.685%, 01/01/2021 | 2,412,466 | ||||||
| 1,141,963 | 5.000%, 01/01/2021 | 1,233,603 | ||||||
| 501,855 | 4.500%, 09/25/2024 | 519,711 | ||||||
| 1,717,669 | 4.000%, 06/01/2025 | 1,812,630 | ||||||
| 2,435,416 | 3.500%, 08/01/2026 | 2,549,845 | ||||||
| 185,576 | 4.500%, 07/25/2033 | 187,913 | ||||||
| 4,935,000 | 5.000%, 04/25/2034 | 5,302,343 | ||||||
| 2,992,718 | 5.500%, 09/01/2034 | 3,270,117 | ||||||
| 2,043,984 | 5.500%, 12/25/2034 | 2,271,702 | ||||||
| 1,840,244 | 5.500%, 02/01/2035 | 2,010,819 | ||||||
| 971,346 | 5.000%, 06/01/2035 | 1,050,606 | ||||||
| 4,838,951 | 5.000%, 07/01/2035 | 5,233,798 | ||||||
| 1,466,074 | 5.000%, 11/01/2035 | 1,585,244 | ||||||
| 363,665 | 5.494%, 01/01/2036 | 389,615 | ||||||
| 1,813,996 | 5.000%, 02/01/2036 | 1,961,447 | ||||||
| 2,566,750 | 5.000%, 03/01/2036 | 2,775,389 | ||||||
| 286,230 | 5.438%, 03/01/2036 | 306,174 | ||||||
| 3,229,670 | 5.500%, 04/01/2036 | 3,527,015 | ||||||
| 798,302 | 6.000%, 07/01/2037 | 880,031 | ||||||
| 1,037,668 | 6.000%, 09/01/2037 | 1,143,903 | ||||||
| 1,003,713 | 5.000%, 03/01/2038 | 1,085,143 | ||||||
| 718,585 | 5.500%, 05/01/2038 | 783,170 | ||||||
| 1,731,571 | 5.500%, 06/01/2038 | 1,887,202 | ||||||
| 574,176 | 5.500%, 08/01/2038 | 625,782 | ||||||
| 981,716 | 6.000%, 11/01/2038 | 1,081,916 | ||||||
| 954,524 | 4.500%, 03/01/2039 | 1,016,847 | ||||||
| 1,751,477 | 4.500%, 03/01/2040 | 1,865,836 | ||||||
| 1,093,908 | 5.000%, 03/01/2040 | 1,182,484 | ||||||
| 1,380,380 | 5.000%, 06/01/2040 | 1,493,015 | ||||||
| 139,846 | 5.000%, 06/01/2040 | 151,170 | ||||||
| 1,761,037 | 5.000%, 06/01/2040 | 1,904,734 | ||||||
| 2,924,231 | 4.000%, 08/01/2040 | 3,075,543 | ||||||
| 996,286 | 4.500%, 08/01/2040 | 1,061,336 | ||||||
| 4,584,039 | 4.000%, 02/01/2041 | 4,821,236 | ||||||
| 2,174,457 | 3.500%, 03/01/2041 | 2,238,946 | ||||||
| 2,192,029 | 4.000%, 09/01/2041 | 2,306,138 | ||||||
| 1,842,514 | 5.900%, 07/25/2042 | 2,054,726 | ||||||
|
| |||||||
| 79,276,217 | ||||||||
|
| |||||||
| Federal Home Loan Bank | ||||||||
| 1,000,000 | 0.875%, 08/22/2012 | 1,004,208 | ||||||
|
| |||||||
| Freddie Mac | ||||||||
| 1,450,000 | 1.125%, 07/27/2012 | 1,457,592 | ||||||
| 1,878,342 | 6.000%, 01/15/2017 | 1,913,441 | ||||||
| 2,000,000 | 3.750%, 03/27/2019 | 2,286,726 | ||||||
| 436,294 | 5.000%, 02/15/2020 | 437,643 | ||||||
| 1,423,641 | 5.000%, 12/01/2020 | 1,534,771 | ||||||
| 193,131 | 6.000%, 12/15/2021 | 196,392 | ||||||
| 655,484 | 5.000%, 05/01/2022 | 704,296 | ||||||
| 542,743 | 5.000%, 04/01/2024 | 582,227 | ||||||
| 796,579 | 5.000%, 03/15/2032 | 823,753 | ||||||
| 1,066,556 | 5.500%, 12/01/2036 | 1,160,084 | ||||||
| 199,716 | 5.000%, 08/01/2038 | 214,857 | ||||||
| 817,090 | 5.500%, 08/01/2038 | 887,848 | ||||||
| 962,148 | 5.500%, 11/01/2038 | 1,045,468 | ||||||
| 564,664 | 5.000%, 03/01/2039 | 607,475 | ||||||
| 1,739,020 | 5.000%, 02/01/2040 | 1,870,595 | ||||||
| 6,502,637 | 4.500%, 08/01/2040 | 6,896,433 | ||||||
| 7,533,229 | 4.500%, 08/01/2040 | 7,989,437 | ||||||
| 465,768 | 4.000%, 09/01/2040 | 489,359 | ||||||
|
| |||||||
| 31,098,397 | ||||||||
|
| |||||||
| US GOVERNMENT AGENCIES (cont.) | ||||||||
| Ginnie Mae | ||||||||
| $1,903,142 | 4.666%, 07/16/2031 | $1,968,598 | ||||||
| 1,577,304 | 4.397%, 12/16/2032 | 1,680,731 | ||||||
| 96,210 | 4.430%, 04/16/2034 | 96,318 | ||||||
| 2,389,293 | 3.536%, 09/16/2035 | 2,501,235 | ||||||
| 358,437 | 5.500%, 02/20/2037 | 402,984 | ||||||
| 2,245,898 | 2.174%, 07/16/2038 | 2,287,041 | ||||||
| 1,283,329 | 4.500%, 07/20/2038 | 1,400,163 | ||||||
| 458,737 | 5.500%, 07/20/2038 | 515,032 | ||||||
| 1,908,216 | 4.000%, 09/20/2038 | 2,011,108 | ||||||
| 434,334 | 5.000%, 12/20/2038 | 469,502 | ||||||
| 1,209,503 | 5.500%, 01/15/2039 | 1,358,801 | ||||||
| 1,116,550 | 5.000%, 03/15/2039 | 1,238,184 | ||||||
| 1,925,000 | 3.489%, 03/16/2039 | 2,063,870 | ||||||
| 1,234,684 | 5.000%, 03/20/2039 | 1,334,655 | ||||||
| 1,701,677 | 3.853%, 02/16/2040 | 1,790,663 | ||||||
| 2,026,309 | 4.229%, 02/16/2040 | 2,157,005 | ||||||
| 3,888,950 | 4.500%, 05/20/2040 | 4,254,025 | ||||||
| 1,806,921 | 5.000%, 07/20/2040 | 2,000,713 | ||||||
| 2,040,327 | 4.500%, 01/20/2041 | 2,230,268 | ||||||
| 325,694 | 4.930%, 11/16/2044 | 330,295 | ||||||
| 2,106,614 | 4.650%, 12/20/2060 | 2,313,855 | ||||||
| 2,456,619 | 4.863%, 05/20/2061 | 2,729,223 | ||||||
| 2,446,549 | 4.826%, 06/20/2061 | 2,711,256 | ||||||
| 2,023,025 | 4.295%, 07/20/2061 | 2,218,583 | ||||||
| 2,092,027 | 4.697%, 09/20/2061 | 2,319,016 | ||||||
|
| |||||||
| 44,383,124 | ||||||||
|
| |||||||
| Small Business Administration | ||||||||
| 1,319,657 | 5.459%, 02/10/2017 | 1,428,956 | ||||||
| 563,646 | 5.250%, 09/01/2017 | 601,959 | ||||||
| 949,589 | 3.880%, 03/10/2019 | 1,009,785 | ||||||
| 1,186,764 | 4.620%, 03/10/2019 | 1,285,095 | ||||||
| 467,851 | 7.300%, 08/01/2019 | 518,843 | ||||||
| 711,731 | 7.300%, 09/01/2019 | 790,703 | ||||||
| 478,100 | 7.060%, 11/01/2019 | 531,580 | ||||||
| 896,604 | 5.310%, 08/01/2022 | 982,811 | ||||||
| 1,019,008 | 5.240%, 08/01/2023 | 1,131,330 | ||||||
| 1,535,690 | 4.890%, 12/01/2023 | 1,682,349 | ||||||
| 774,767 | 4.720%, 02/01/2024 | 845,330 | ||||||
| 877,076 | 4.770%, 04/01/2024 | 959,095 | ||||||
| 1,123,304 | 5.180%, 05/01/2024 | 1,239,720 | ||||||
| 1,650,814 | 5.170%, 08/01/2024 | 1,821,221 | ||||||
| 1,260,122 | 4.880%, 11/01/2024 | 1,384,292 | ||||||
| 1,576,851 | 4.625%, 02/01/2025 | 1,722,968 | ||||||
| 1,293,445 | 5.090%, 10/01/2025 | 1,432,555 | ||||||
| 1,780,286 | 5.350%, 02/01/2026 | 1,965,751 | ||||||
| 1,829,775 | 5.570%, 03/01/2026 | 2,065,859 | ||||||
| 1,198,719 | 5.870%, 05/01/2026 | 1,352,000 | ||||||
| 740,668 | 5.370%, 10/01/2026 | 828,599 | ||||||
| 1,772,039 | 5.120%, 12/01/2026 | 1,973,522 | ||||||
| 1,216,120 | 5.320%, 01/01/2027 | 1,359,124 | ||||||
| 1,934,149 | 5.230%, 03/01/2027 | 2,158,079 | ||||||
| 2,108,269 | 5.780%, 08/01/2027 | 2,401,645 | ||||||
| 1,296,090 | 5.490%, 03/01/2028 | 1,452,335 | ||||||
| 2,317,861 | 5.370%, 04/01/2028 | 2,585,545 | ||||||
| 1,853,331 | 5.490%, 05/01/2028 | 2,068,707 | ||||||
| 1,715,227 | 5.870%, 07/01/2028 | 1,960,503 | ||||||
| 1,364,933 | 5.600%, 09/01/2028 | 1,548,073 | ||||||
| 2,006,371 | 4.760%, 02/01/2029 | 2,209,203 | ||||||
| 1,508,712 | 4.660%, 03/01/2029 | 1,655,998 | ||||||
| 1,000,940 | 4.310%, 04/01/2029 | 1,086,583 | ||||||
| 1,755,531 | 4.950%, 06/01/2029 | 1,942,476 | ||||||
| 2,011,149 | 4.300%, 07/01/2029 | 2,199,246 | ||||||
| 2,087,650 | 4.200%, 09/01/2029 | 2,300,052 | ||||||
|
| |||||||
| 54,481,892 | ||||||||
|
| |||||||
| Total US Government Agencies (Cost $201,055,259) | 210,243,838 | |||||||
|
| |||||||
The accompanying notes are an integral part of these financial statements.
15
Table of Contents
schedule of investments (continued)
NEW COVENANT INCOME FUND
December 31, 2011 (Unaudited)
Principal Amount | Value | Shares | Value | |||||||||
| OTHER AGENCY SECURITIES — 0.5% | ||||||||
| $1,250,000 | Federal Farm Credit Bank 3.000%, 09/22/2014 | $1,330,601 | ||||||
| 850,000 | Private Export Funding Corp. 4.550%, 05/15/2015 | 955,682 | ||||||
|
| |||||||
| Total Other Securities (Cost $2,141,283) | 2,286,283 | |||||||
|
| |||||||
| MUNICIPAL BONDS — 0.4% | ||||||||
| 1,500,000 | Dallas Indepdendent School District 4.950%, 02/15/2022 | 1,727,745 | ||||||
|
| |||||||
| Total Municipal Bonds (Cost $1,513,958) | 1,727,745 | |||||||
|
| |||||||
| U.S. TREASURY OBLIGATIONS — 9.7% | ||||||||
| 9,025,000 | U.S. Treasury Bond 6.250%, 08/15/2023 | 12,918,439 | ||||||
| 28,925,000 | U.S. Treasury Note 2.375%, 07/31/2017 | 31,092,119 | ||||||
|
| |||||||
| Total U.S. Treasury Obligations (Cost $41,369,812) | 44,010,558 | |||||||
|
| |||||||
| CASH EQUIVALENTS — 3.4% | ||||||||
| 15,187,035 | JP Morgan Cash Trade Execution | $15,187,035 | ||||||
|
| |||||||
| Total Cash Equivalents (Cost $15,187,035) | 15,187,035 | |||||||
|
| |||||||
| TOTAL INVESTMENTS — 99.8% | ||||||||
| (Cost $435,140,142) | $451,371,117 | |||||||
| Other Assets in Excess of Liabilities — 0.2% | 1,347,369 | |||||||
|
| |||||||
| NET ASSETS — 100.0% | $452,718,486 | |||||||
|
| |||||||
| Percentages are stated as a percent of net assets. | ||
| Footnotes: | ||
| (a) | Security exempt from registration under Rule 144A under the Securities Act of 1933 or otherwise restricted as to resale. These securities may be resold in transactions exempt from registration, normally to qualified institutional buyers. The Adviser, using procedures approved by the Board of Trustees, has deemed these securities to be liquid. The value of these securities totals $12,935,714, which represents 2.86% of total net assets. | |
| (D) | In default. | |
| Abbreviations: | ||
| LP Limited Partnership | ||
| PLC Public Liability Company | ||
The accompanying notes are an integral part of these financial statements.
16
Table of Contents
schedule of investments (continued)
NEW COVENANT BALANCED GROWTH FUND
December 31, 2011 (Unaudited)
| Shares | Value | |||||||
| INVESTMENT COMPANIES — 98.9% | ||||||||
| 5,270,865 | New Covenant Growth Fund(a) | $156,860,928 | ||||||
| 4,058,035 | New Covenant Income Fund(a) | 93,415,974 | ||||||
|
| |||||||
| Total Investment Companies (Cost $229,120,408) | 250,276,902 | |||||||
|
| |||||||
| CASH EQUIVALENTS — 1.1% | ||||||||
| 2,815,794 | JP Morgan Cash Trade Execution | 2,815,794 | ||||||
|
| |||||||
Total Cash Equivalents (Cost $2,815,794) | 2,815,794 | |||||||
|
| |||||||
| TOTAL INVESTMENTS — 100.0% | ||||||||
| (Cost $231,936,202) | $253,092,696 | |||||||
| Other Assets in Excess of Liabilities — 0.0% | 51,102 | |||||||
|
| |||||||
| NET ASSETS — 100.0% | $253,143,798 | |||||||
|
| |||||||
| Percentages are stated as a percent of net assets. | ||
| Footnotes: | ||
| (a) | Investment in affiliate. | |
NEW COVENANT BALANCED INCOME FUND
December 31, 2011 (Unaudited)
| Shares | Value | |||||||
| INVESTMENT COMPANIES — 98.6% | ||||||||
| 1,092,159 | New Covenant Growth Fund(a) | $32,502,638 | ||||||
| 2,221,474 | New Covenant Income Fund(a) | 51,138,342 | ||||||
|
| |||||||
| Total Investment Companies (Cost $78,084,826) | 83,640,980 | |||||||
|
| |||||||
| CASH EQUIVALENTS — 1.4% | ||||||||
| 1,171,529 | JP Morgan Cash Trade Execution | 1,171,529 | ||||||
|
| |||||||
| Total Cash Equivalents (Cost $1,171,529) | 1,171,529 | |||||||
|
| |||||||
| | TOTAL INVESTMENTS — 100.0% (Cost $79,256,355) | $84,812,509 | ||||||
| Other Assets in Excess of Liabilities — 0.0% | 15,923 | |||||||
|
| |||||||
| NET ASSETS — 100.0% | $84,828,432 | |||||||
|
| |||||||
| Percentages are stated as a percent of net assets. | ||
| Footnotes: | ||
| (a) | Investment in affiliate. | |
The accompanying notes are an integral part of these financial statements.
17
Table of Contents
statements of assets and liabilities
NEW COVENANT FUNDS
December 31, 2011
(Unaudited)
| Growth Fund | Income Fund | Balanced Growth Fund | Balanced Income Fund | |||||||||||||
| ASSETS: | ||||||||||||||||
Investments, at value(1) | ||||||||||||||||
Unaffiliated issuers | $652,949,844 | $451,371,117 | $2,815,794 | $1,171,529 | ||||||||||||
Affiliated issuers | — | — | 250,276,902 | 83,640,980 | ||||||||||||
Cash | 4,070,762 | — | — | — | ||||||||||||
Cash denominated in foreign currency, at value(2) | 922,425 | — | — | — | ||||||||||||
Receivable for investments sold | 1,220,044 | — | — | — | ||||||||||||
Receivable for shares issued | 103,855 | 45,753 | 99,308 | 8,664 | ||||||||||||
Dividends and interest receivable | 878,510 | 4,012,291 | 55,841 | 30,569 | ||||||||||||
Prepaid expenses and other assets | 34,110 | 29,676 | 22,918 | 15,888 | ||||||||||||
|
|
|
|
|
|
|
| |||||||||
Total Assets | 660,179,550 | 455,458,837 | 253,270,763 | 84,867,630 | ||||||||||||
|
|
|
|
|
|
|
| |||||||||
| LIABILITIES: | ||||||||||||||||
Payable for investments purchased | 1,058,070 | 2,166,835 | — | — | ||||||||||||
Payable for shares redeemed | 1,835 | 413 | 49,898 | 2,953 | ||||||||||||
Distribution payable | — | 250,519 | — | — | ||||||||||||
Accrued expense and other payables: | ||||||||||||||||
Investment advisory, net | 482,477 | 247,931 | — | — | ||||||||||||
Administration | 25,067 | 15,921 | 9,208 | 3,277 | ||||||||||||
Shareholder service | 490 | 13 | 337 | 20 | ||||||||||||
Transfer agent | 14,397 | 10,540 | 23,137 | 10,775 | ||||||||||||
Accounting | 25,804 | 19,248 | 5,140 | 1,704 | ||||||||||||
Chief compliance officer | 4,620 | 2,368 | 1,658 | 505 | ||||||||||||
Audit | 32,812 | 22,292 | 11,859 | 7,698 | ||||||||||||
Other | 44,932 | 4,271 | 25,728 | 12,266 | ||||||||||||
|
|
|
|
|
|
|
| |||||||||
Total Liabilities | 1,690,504 | 2,740,351 | 126,965 | 39,198 | ||||||||||||
|
|
|
|
|
|
|
| |||||||||
NET ASSETS | $658,489,046 | $452,718,486 | $253,143,798 | $84,828,432 | ||||||||||||
|
|
|
|
|
|
|
| |||||||||
| NET ASSETS consist of: | ||||||||||||||||
Capital stock | 679,522,978 | 503,135,951 | 261,105,661 | 85,117,705 | ||||||||||||
Accumulated undistributed net investment income/(loss) | (596,305 | ) | (81,842 | ) | 908,126 | 29,485 | ||||||||||
Accumulated undistributed net realized loss on investments and foreign currency transactions | (78,593,801 | ) | (66,566,598 | ) | (30,026,483 | ) | (5,874,912 | ) | ||||||||
Net unrealized appreciation on investments and translation of assets and liabilities denominated in foreign currency | 58,156,174 | 16,230,975 | 21,156,494 | 5,556,154 | ||||||||||||
|
|
|
|
|
|
|
| |||||||||
Net Assets | $658,489,046 | $452,718,486 | $253,143,798 | $84,828,432 | ||||||||||||
|
|
|
|
|
|
|
| |||||||||
Shares Outstanding | 22,129,052 | 19,647,204 | 3,220,245 | 4,595,477 | ||||||||||||
Net asset value, offering price and redemption price per share | $29.76 | $23.04 | $78.61 | $18.46 | ||||||||||||
(1) Cost of Investments | ||||||||||||||||
Unaffiliated issuers | $594,754,528 | $435,140,142 | $2,815,794 | $1,171,529 | ||||||||||||
Affiliated issuers | — | — | 229,120,408 | 78,084,826 | ||||||||||||
|
|
|
|
|
|
|
| |||||||||
(2) Cost of foreign currency | $965,989 | — | — | — | ||||||||||||
|
|
|
|
|
|
|
| |||||||||
The accompanying notes to financial statements are an integral part of this statement.
18
Table of Contents
NEW COVENANT FUNDS
For the Six Months Ended December 31, 2011
(Unaudited)
| Growth Fund | Income Fund | Balanced Growth Fund | Balanced Income Fund | |||||||||||||
| INVESTMENT INCOME: | ||||||||||||||||
Dividend income | ||||||||||||||||
Unaffiliated issuers | $6,514,796 | $— | $— | $— | ||||||||||||
Affiliated issuers | — | — | 2,938,819 | 1,322,731 | ||||||||||||
Less: Foreign withholding tax | (160,130 | ) | — | — | — | |||||||||||
Interest income | 20 | 8,132,891 | 5 | 2 | ||||||||||||
Securities Lending Income, net | 36,774 | 4,426 | — | — | ||||||||||||
|
|
|
|
|
|
|
| |||||||||
Total Investment Income | 6,391,460 | 8,137,317 | 2,938,824 | 1,322,733 | ||||||||||||
|
|
|
|
|
|
|
| |||||||||
| EXPENSES: | ||||||||||||||||
Investment advisory | 2,875,674 | 1,470,588 | — | — | ||||||||||||
Shareholder servicing fees | 276 | 70 | 357 | 119 | ||||||||||||
Transfer agent | 48,092 | 36,144 | 57,180 | 25,124 | ||||||||||||
Accounting | 79,828 | 56,680 | 16,072 | 5,388 | ||||||||||||
Administration | 71,332 | 47,880 | 27,108 | 9,336 | ||||||||||||
Custodian | 47,644 | 3,312 | 15 | 44 | ||||||||||||
Chief compliance officer | 13,208 | 8,736 | 4,996 | 1,716 | ||||||||||||
Legal | 56,056 | 35,932 | 21,036 | 7,400 | ||||||||||||
Printing & Mailing | 14,268 | 10,480 | 18,416 | 8,748 | ||||||||||||
Other | 73,360 | 58,752 | 36,172 | 26,184 | ||||||||||||
|
|
|
|
|
|
|
| |||||||||
TOTAL EXPENSES | 3,279,738 | 1,728,574 | 181,352 | 84,059 | ||||||||||||
|
|
|
|
|
|
|
| |||||||||
NET INVESTMENT INCOME | 3,111,722 | 6,408,743 | 2,757,472 | 1,238,674 | ||||||||||||
|
|
|
|
|
|
|
| |||||||||
| REALIZED AND UNREALIZED GAIN/(LOSS) ON INVESTMENTS AND FOREIGN CURRENCY TRANSACTIONS: | ||||||||||||||||
Net realized gain/(loss) on investments from sales of: | ||||||||||||||||
Unaffiliated issuers | 19,226,139 | 2,681,312 | — | — | ||||||||||||
Affiliated issuers | — | — | (828,917 | ) | (443,235 | ) | ||||||||||
Foreign currency transactions | (4,824 | ) | — | — | — | |||||||||||
Change in net unrealized appreciation on investments and foreign currency transactions | (78,428,928 | ) | 4,529,698 | (12,061,505 | ) | (2,076,176 | ) | |||||||||
|
|
|
|
|
|
|
| |||||||||
Net gain/(loss) on Investments | (59,207,613 | ) | 7,211,010 | (12,890,422 | ) | (2,519,411 | ) | |||||||||
|
|
|
|
|
|
|
| |||||||||
NET INCREASE/(DECREASE) IN NET ASSETS RESULTING FROM OPERATIONS | $(56,095,891 | ) | $13,619,753 | $(10,132,950 | ) | $(1,280,737 | ) | |||||||||
|
|
|
|
|
|
|
| |||||||||
The accompanying notes are an integral part of these financial statements.
19
Table of Contents
statements of changes in net assets
NEW COVENANT FUNDS
|
| |||||||||||||||
| Growth Fund | Income Fund | |||||||||||||||
| For the period ended December 31, 2011 (Unaudited) | For the year ended June 30, 2011 | For the period ended December 31, 2011 (Unaudited) | For the year ended June 30, 2011 | |||||||||||||
| OPERATIONS: | ||||||||||||||||
Net investment income | $3,111,722 | $5,500,991 | $6,408,743 | $12,188,416 | ||||||||||||
Net realized gain on investment and foreign currency transactions | 19,221,315 | 62,366,578 | 2,681,312 | 3,918,432 | ||||||||||||
Change in net unrealized appreciation on investments and translation of assets and liabilities in foreign currency | (78,428,928 | ) | 115,171,998 | 4,529,698 | 860,696 | |||||||||||
|
|
|
|
|
|
|
| |||||||||
Net increase/(decrease) in net assets resulting from operations | (56,095,891 | ) | 183,039,567 | 13,619,753 | 16,967,544 | |||||||||||
|
|
|
|
|
|
|
| |||||||||
| DISTRIBUTIONS: | ||||||||||||||||
From net investment Income | (4,023,491 | ) | (5,337,270 | ) | (9,716,120 | ) | (11,860,430 | ) | ||||||||
Return of capital | — | — | — | — | ||||||||||||
|
|
|
|
|
|
|
| |||||||||
Total Distributions | (4,023,491 | ) | (5,337,270 | ) | (9,716,120 | ) | (11,860,430 | ) | ||||||||
|
|
|
|
|
|
|
| |||||||||
| CAPITAL STOCK TRANSACTIONS: | ||||||||||||||||
Proceeds from shares issued | 23,698,263 | 16,985,124 | 20,801,059 | 81,373,019 | ||||||||||||
Proceeds from distributions reinvested | 327,695 | 427,024 | 696,393 | 795,820 | ||||||||||||
Cost of shares redeemed | (27,050,441 | ) | (98,404,338 | ) | (27,819,058 | ) | (33,875,599 | ) | ||||||||
|
|
|
|
|
|
|
| |||||||||
Net increase/(decrease) from capital stock transactions | (3,024,483 | ) | (80,992,190 | ) | (6,321,606 | ) | 48,293,240 | |||||||||
|
|
|
|
|
|
|
| |||||||||
Total Increase/(Decrease) in Net Assets | (63,143,865 | ) | 96,710,107 | (2,417,973 | ) | 53,400,354 | ||||||||||
|
|
|
|
|
|
|
| |||||||||
| NET ASSETS: | ||||||||||||||||
Beginning of period | 721,632,911 | 624,922,804 | 455,136,459 | 401,736,105 | ||||||||||||
|
|
|
|
|
|
|
| |||||||||
End of period | $658,489,046 | $721,632,911 | $452,718,486 | $455,136,459 | ||||||||||||
|
|
|
|
|
|
|
| |||||||||
Accumulated undistributed net investment income/(loss) | $(596,305 | ) | $315,464 | $(81,842 | ) | $3,225,535 | ||||||||||
|
|
|
|
|
|
|
| |||||||||
| CAPITAL SHARE TRANSACTIONS: | ||||||||||||||||
Shares sold | 833,754 | 580,434 | 903,966 | 3,575,364 | ||||||||||||
Issued to shareholders in reinvestment of dividends | 11,534 | 13,977 | 30,329 | 35,229 | ||||||||||||
Shares redeemed | (899,926 | ) | (3,300,351 | ) | (1,207,205 | ) | (1,490,289 | ) | ||||||||
|
|
|
|
|
|
|
| |||||||||
Net increase/(decrease) from capital stock transactions | (54,638 | ) | (2,705,940 | ) | (272,910 | ) | 2,120,304 | |||||||||
|
|
|
|
|
|
|
| |||||||||
The accompanying notes are an integral part of these financial statements.
20
Table of Contents
statements of changes in net assets
NEW COVENANT FUNDS
|
| |||||||||||||||
| Balanced Growth Fund | Balanced Income Fund | |||||||||||||||
| For the period ended December 31, 2011 (Unaudited) | For the year ended June 30, 2011 | For the period ended December 31, 2011 (Unaudited) | For the year ended June 30, 2011 | |||||||||||||
| OPERATIONS: | ||||||||||||||||
Net investment income | $2,757,472 | $3,263,544 | $1,238,674 | $1,498,170 | ||||||||||||
Net realized gain/(loss) on investment and foreign currency transactions | (828,917 | )(1) | (934,585 | )(1) | (443,235 | )(1) | 342,006 | (1) | ||||||||
Change in net unrealized appreciation on investments and translation of assets and liabilities in foreign currency | (12,061,505 | ) | 44,185,018 | (2,076,176 | ) | 9,161,781 | ||||||||||
|
|
|
|
|
|
|
| |||||||||
Net increase/(decrease) in net assets resulting from operations | (10,132,950 | ) | 46,513,977 | (1,280,737 | ) | 11,001,957 | ||||||||||
|
|
|
|
|
|
|
| |||||||||
| DISTRIBUTIONS: | ||||||||||||||||
From net investment Income | (1,994,200 | ) | (3,263,544 | ) | (1,238,216 | ) | (1,498,170 | ) | ||||||||
Return of capital | — | (2,190 | ) | — | (11,222 | ) | ||||||||||
|
|
|
|
|
|
|
| |||||||||
Total Distributions | (1,994,200 | ) | (3,265,734 | ) | (1,238,216 | ) | (1,509,392 | ) | ||||||||
|
|
|
|
|
|
|
| |||||||||
| CAPITAL STOCK TRANSACTIONS: | ||||||||||||||||
Proceeds from shares issued | 7,429,416 | 18,650,705 | 2,210,742 | 5,500,475 | ||||||||||||
Proceeds from distributions reinvested | 1,577,715 | 2,591,379 | 799,279 | 984,674 | ||||||||||||
Cost of shares redeemed | (15,050,171 | ) | (30,680,463 | ) | (7,793,556 | ) | (8,883,560 | ) | ||||||||
|
|
|
|
|
|
|
| |||||||||
Net (decrease) from capital stock transactions | (6,043,040 | ) | (9,438,379 | ) | (4,783,535 | ) | (2,398,411 | ) | ||||||||
|
|
|
|
|
|
|
| |||||||||
Total Increase/(Decrease) in Net Assets | (18,170,190 | ) | 33,809,864 | (7,302,488 | ) | 7,094,154 | ||||||||||
|
|
|
|
|
|
|
| |||||||||
| NET ASSETS: | ||||||||||||||||
Beginning of period | 271,313,988 | 237,504,124 | 92,130,920 | 85,036,766 | ||||||||||||
|
|
|
|
|
|
|
| |||||||||
End of period | $253,143,798 | $271,313,988 | $84,828,432 | $92,130,920 | ||||||||||||
|
|
|
|
|
|
|
| |||||||||
Accumulated undistributed net investment income | $908,126 | $144,854 | $29,485 | $29,027 | ||||||||||||
|
|
|
|
|
|
|
| |||||||||
| CAPITAL SHARE TRANSACTIONS: | ||||||||||||||||
Shares sold | 96,256 | 235,655 | 97,666 | 301,020 | ||||||||||||
Issued to shareholders in reinvestment of dividends | 20,828 | 32,728 | 65,298 | 53,690 | ||||||||||||
Shares redeemed | (192,258 | ) | (391,875 | ) | (424,219 | ) | (483,596 | ) | ||||||||
|
|
|
|
|
|
|
| |||||||||
Net (decrease) from capital stock transactions | (75,174 | ) | (123,492 | ) | (261,255 | ) | (128,886 | ) | ||||||||
|
|
|
|
|
|
|
| |||||||||
| (1) | Represents realized gains (losses) from investment transactions with affiliates |
The accompanying notes are an integral part of these financial statements.
21
Table of Contents
NEW COVENANT FUNDS
| For a Fund share outstanding throughout the period | ||||||||||||||||||||||||
| Growth Fund | ||||||||||||||||||||||||
| For the period ended December 31, 2011(1) | For the year ended June 30, 2011 | For the year ended June 30, 2010 | For the year ended June 30, 2009 | For the year ended June 30, 2008 | For the year ended June 30, 2007 | |||||||||||||||||||
Net Asset Value, Beginning of Period | $32.53 | $25.11 | $22.68 | $31.95 | $38.90 | $32.76 | ||||||||||||||||||
|
|
|
|
|
|
|
|
|
|
|
| |||||||||||||
| INVESTMENT ACTIVITIES: | ||||||||||||||||||||||||
Net investment income | 0.14 | 0.24 | 0.21 | 0.29 | 0.26 | 0.26 | ||||||||||||||||||
Net realized and unrealized gain/(loss) on investments and foreign currency transactions | (2.73 | ) | 7.41 | 2.43 | (9.29 | ) | (4.98 | ) | 6.17 | |||||||||||||||
|
|
|
|
|
|
|
|
|
|
|
| |||||||||||||
Total from investment activities | (2.59 | ) | 7.65 | 2.64 | (9.00 | ) | (4.72 | ) | 6.43 | |||||||||||||||
|
|
|
|
|
|
|
|
|
|
|
| |||||||||||||
| DIVIDENDS | ||||||||||||||||||||||||
Net investment income | (0.18 | ) | (0.23 | ) | (0.18 | ) | (0.25 | ) | (0.24 | ) | (0.29 | ) | ||||||||||||
Net realized gains | — | — | — | — | (1.97 | ) | — | |||||||||||||||||
Tax return of capital | — | — | (0.03 | ) | (0.02 | ) | (0.02 | ) | — | |||||||||||||||
|
|
|
|
|
|
|
|
|
|
|
| |||||||||||||
Total dividends | (0.18 | ) | (0.23 | ) | (0.21 | ) | (0.27 | ) | (2.23 | ) | (0.29 | ) | ||||||||||||
|
|
|
|
|
|
|
|
|
|
|
| |||||||||||||
Change in net asset value per share | (2.77 | ) | 7.42 | 2.43 | (9.27 | ) | (6.95 | ) | 6.14 | |||||||||||||||
|
|
|
|
|
|
|
|
|
|
|
| |||||||||||||
Net Asset Value, End of Period | $29.76 | $32.53 | $25.11 | $22.68 | $31.95 | $38.90 | ||||||||||||||||||
|
|
|
|
|
|
|
|
|
|
|
| |||||||||||||
Total Return | (7.93 | )% | 30.54 | % | 11.54 | % | (28.16 | )% | (12.61 | )% | 19.68 | % | ||||||||||||
| SUPPLEMENTAL DATA AND RATIOS: | ||||||||||||||||||||||||
Net assets, end of period | $658,489 | $721,633 | $624,923 | $598,209 | $836,086 | $1,033,536 | ||||||||||||||||||
Ratio of net expenses to average net assets | 0.99 | % | 1.08 | % | 1.19 | % | 1.12 | % | 1.10 | % | 1.08 | % | ||||||||||||
Ratio of net expenses to average net assets, excluding waivers | 0.99 | % | 1.12 | % | 1.29 | % | 1.30 | % | 1.29 | % | 1.28 | % | ||||||||||||
Ratio of net investment income to average net assets | 0.94 | % | 0.78 | % | 0.68 | % | 1.15 | % | 0.73 | % | 0.73 | % | ||||||||||||
Ratio of net investment income to average net assets, excluding waivers | 0.94 | % | 0.73 | % | 0.57 | % | 0.97 | % | 0.54 | % | 0.53 | % | ||||||||||||
Portfolio turnover rate | 27 | % | 44 | % | 81 | % | 94 | % | 65 | % | 65 | % | ||||||||||||
| (1) | Unaudited |
The accompanying notes are an integral part of these financial statements.
22
Table of Contents
financial highlights
NEW COVENANT FUNDS
| For a Fund share outstanding throughout the period | ||||||||||||||||||||||||
| Income Fund | ||||||||||||||||||||||||
| For the period ended December 31, 2011(2) | For the year ended June 30, 2011 | For the year ended June 30, 2010 | For the year ended June 30, 2009 | For the year ended June 30, 2008 | For the year ended June 30, 2007 | |||||||||||||||||||
Net Asset Value, Beginning of Period | $22.85 | $22.57 | $20.93 | $23.73 | $24.52 | $24.28 | ||||||||||||||||||
|
|
|
|
|
|
|
|
|
|
|
| |||||||||||||
| INVESTMENT ACTIVITIES: | ||||||||||||||||||||||||
Net investment income | 0.33 | 0.62 | 0.81 | 1.11 | 1.16 | 1.12 | ||||||||||||||||||
Net realized and unrealized gain/(loss) on investments and foreign currency transactions | 0.36 | 0.27 | 1.62 | (2.79 | ) | (0.81 | ) | 0.25 | ||||||||||||||||
|
|
|
|
|
|
|
|
|
|
|
| |||||||||||||
Total from investment activities | 0.69 | 0.89 | 2.43 | (1.68 | ) | 0.35 | 1.37 | |||||||||||||||||
|
|
|
|
|
|
|
|
|
|
|
| |||||||||||||
| DIVIDENDS | ||||||||||||||||||||||||
Net investment income | (0.50 | ) | (0.61 | ) | (0.79 | ) | (1.12 | ) | (1.14 | ) | (1.13 | ) | ||||||||||||
Net realized gains | — | — | — | — | — | — | ||||||||||||||||||
Tax return of capital | — | — | — | — | — | — | (1) | |||||||||||||||||
|
|
|
|
|
|
|
|
|
|
|
| |||||||||||||
Total dividends | (0.50 | ) | (0.61 | ) | (0.79 | ) | (1.12 | ) | (1.14 | ) | (1.13 | ) | ||||||||||||
|
|
|
|
|
|
|
|
|
|
|
| |||||||||||||
Change in net asset value per share | 0.19 | 0.28 | 1.64 | (2.80 | ) | (0.79 | ) | 0.24 | ||||||||||||||||
|
|
|
|
|
|
|
|
|
|
|
| |||||||||||||
Net Asset Value, End of Period | $23.04 | $22.85 | $22.57 | $20.93 | $23.73 | $24.52 | ||||||||||||||||||
|
|
|
|
|
|
|
|
|
|
|
| |||||||||||||
Total Return | 3.03 | % | 4.00 | % | 11.72 | % | (6.90 | )% | 1.36 | % | 5.65 | % | ||||||||||||
SUPPLEMENTAL DATA AND RATIOS: | ||||||||||||||||||||||||
Net assets, end of period | $452,718 | $455,136 | $401,736 | $373,446 | $496,325 | $537,345 | ||||||||||||||||||
Ratio of net expenses to average net assets | 0.76 | % | 0.83 | % | 0.87 | % | 0.86 | % | 0.85 | % | 0.84 | % | ||||||||||||
Ratio of net expenses to average net assets, excluding waivers | 0.76 | % | 0.89 | % | 1.03 | % | 1.02 | % | 1.01 | % | 1.01 | % | ||||||||||||
Ratio of net investment income to average net assets | 2.82 | % | 2.76 | % | 3.68 | % | 5.15 | % | 4.70 | % | 4.49 | % | ||||||||||||
Ratio of net investment income to average net assets, excluding waivers | 2.82 | % | 2.70 | % | 3.52 | % | 4.99 | % | 4.54 | % | 4.32 | % | ||||||||||||
Portfolio turnover rate | 13 | % | 38 | % | 76 | % | 230 | % | 170 | % | 258 | % | ||||||||||||
| (1) | Less than $0.005. | |
| (2) | Unaudited |
The accompanying notes are an integral part of these financial statements.
23
Table of Contents
financial highlights
NEW COVENANT FUNDS
| For a Fund share outstanding throughout the period | ||||||||||||||||||||||||
| Balanced Growth Fund | ||||||||||||||||||||||||
| For the period ended December 31, 2011(2) | For the year ended June 30, 2011 | For the year ended June 30, 2010 | For the year ended June 30, 2009 | For the year ended June 30, 2008 | For the year ended June 30, 2007 | |||||||||||||||||||
Net Asset Value, Beginning of Period | $82.33 | $69.47 | $63.31 | $82.49 | $90.86 | $81.30 | ||||||||||||||||||
|
|
|
|
|
|
|
|
|
|
|
| |||||||||||||
| INVESTMENT ACTIVITIES: | ||||||||||||||||||||||||
Net investment income | 0.85 | 0.99 | 1.11 | 1.70 | 1.83 | 1.83 | ||||||||||||||||||
Net realized and unrealized gain/(loss) on investments and foreign currency transactions | (3.96 | ) | 12.86 | 6.16 | (18.25 | ) | (8.37 | ) | 9.56 | |||||||||||||||
|
|
|
|
|
|
|
|
|
|
|
| |||||||||||||
Total from investment activities | (3.11 | ) | 13.85 | 7.27 | (16.55 | ) | (6.54 | ) | 11.39 | |||||||||||||||
|
|
|
|
|
|
|
|
|
|
|
| |||||||||||||
| DIVIDENDS | ||||||||||||||||||||||||
Net investment income | (0.61 | ) | (0.99 | ) | (1.06 | ) | (1.69 | ) | (1.83 | ) | (1.83 | ) | ||||||||||||
Net realized gains | — | — | — | (0.93 | ) | — | — | |||||||||||||||||
Tax return of capital | — | — | (1) | (0.05 | ) | (0.01 | ) | — | — | |||||||||||||||
|
|
|
|
|
|
|
|
|
|
|
| |||||||||||||
Total dividends | (0.61 | ) | (0.99 | ) | (1.11 | ) | (2.63 | ) | (1.83 | ) | (1.83 | ) | ||||||||||||
|
|
|
|
|
|
|
|
|
|
|
| |||||||||||||
Change in net asset value per share | (3.72 | ) | 12.86 | 6.16 | (19.18 | ) | (8.37 | ) | 9.56 | |||||||||||||||
|
|
|
|
|
|
|
|
|
|
|
| |||||||||||||
Net Asset Value, End of Period | $78.61 | $82.33 | $69.47 | $63.31 | $82.49 | $90.86 | ||||||||||||||||||
|
|
|
|
|
|
|
|
|
|
|
| |||||||||||||
Total Return | (3.74 | )% | 19.99 | % | 11.43 | % | (19.96 | )% | (7.26 | )% | 14.11 | % | ||||||||||||
SUPPLEMENTAL DATA AND RATIOS: | ||||||||||||||||||||||||
Net assets, end of period | $253,144 | $271,314 | $237,504 | $221,070 | $305,294 | $353,344 | ||||||||||||||||||
Ratio of net expenses to average net assets | 0.14 | % | 0.18 | % | 0.23 | % | 0.13 | % | 0.15 | % | 0.12 | % | ||||||||||||
Ratio of net expenses to average net assets, excluding waivers | 0.14 | % | 0.26 | % | 0.40 | % | 0.37 | % | 0.39 | % | 0.37 | % | ||||||||||||
Ratio of net investment income to average net assets | 2.16 | % | 1.25 | % | 1.56 | % | 2.56 | % | 2.07 | % | 2.11 | % | ||||||||||||
Ratio of net investment income to average net assets, excluding waivers | 2.16 | % | 1.16 | % | 1.39 | % | 2.32 | % | 1.83 | % | 1.86 | % | ||||||||||||
Portfolio turnover rate | 7 | % | 8 | % | 7 | % | 7 | % | 17 | % | 7 | % | ||||||||||||
| (1) | Less than $0.005. | |
| (2) | Unaudited |
The accompanying notes are an integral part of these financial statements.
24
Table of Contents
financial highlights
NEW COVENANT FUNDS
| For a Fund share outstanding throughout the period | ||||||||||||||||||||||||
| Balanced Income Fund | ||||||||||||||||||||||||
| For the period ended December 31, 2011(2) | For the year ended June 30, 2011 | For the year ended June 30, 2010 | For the year ended June 30, 2009 | For the year ended June 30, 2008 | For the year ended June 30, 2007 | |||||||||||||||||||
Net Asset Value, Beginning of Period | $18.97 | $17.06 | $15.66 | $19.01 | $20.40 | $18.99 | ||||||||||||||||||
|
|
|
|
|
|
|
|
|
|
|
| |||||||||||||
| INVESTMENT ACTIVITIES: | ||||||||||||||||||||||||
Net investment income | 0.27 | 0.31 | 0.38 | 0.56 | 0.60 | 0.59 | ||||||||||||||||||
Net realized and unrealized gain/(loss) on investments and foreign currency transactions | (0.51 | ) | 1.91 | 1.39 | (3.35 | ) | (1.39 | ) | 1.41 | |||||||||||||||
|
|
|
|
|
|
|
|
|
|
|
| |||||||||||||
Total from investment activities | (0.24 | ) | 2.22 | 1.77 | (2.79 | ) | (0.79 | ) | 2.00 | |||||||||||||||
|
|
|
|
|
|
|
|
|
|
|
| |||||||||||||
| DIVIDENDS | ||||||||||||||||||||||||
Net investment income | (0.27 | ) | (0.31 | ) | (0.36 | ) | (0.55 | ) | (0.60 | ) | (0.59 | ) | ||||||||||||
Net realized gains | — | — | — | — | — | — | ||||||||||||||||||
Tax return of capital | — | — | (1) | (0.01 | ) | (0.01 | ) | — | — | (1) | ||||||||||||||
|
|
|
|
|
|
|
|
|
|
|
| |||||||||||||
Total dividends | (0.27 | ) | (0.31 | ) | (0.37 | ) | (0.56 | ) | (0.60 | ) | (0.59 | ) | ||||||||||||
|
|
|
|
|
|
|
|
|
|
|
| |||||||||||||
Change in net asset value per share | (0.51 | ) | 1.91 | 1.40 | (3.35 | ) | (1.39 | ) | 1.41 | |||||||||||||||
|
|
|
|
|
|
|
|
|
|
|
| |||||||||||||
Net Asset Value, End of Period | $18.46 | $18.97 | $17.06 | $15.66 | $19.01 | $20.40 | ||||||||||||||||||
|
|
|
|
|
|
|
|
|
|
|
| |||||||||||||
Total Return | (1.25 | )% | 13.07 | % | 11.31 | % | (14.60 | )% | (3.95 | )% | 10.65 | % | ||||||||||||
SUPPLEMENTAL DATA AND RATIOS: | ||||||||||||||||||||||||
Net assets, end of period | $84,828 | $92,131 | $85,037 | $78,665 | $102,657 | $121,855 | ||||||||||||||||||
Ratio of net expenses to average net assets | 0.19 | % | 0.22 | % | 0.24 | % | 0.16 | % | 0.20 | % | 0.15 | % | ||||||||||||
Ratio of net expenses to average net assets, excluding waivers | 0.19 | % | 0.30 | % | 0.40 | % | 0.40 | % | 0.44 | % | 0.40 | % | ||||||||||||
Ratio of net investment income to average net assets | 2.86 | % | 1.65 | % | 2.17 | % | 3.47 | % | 2.97 | % | 2.95 | % | ||||||||||||
Ratio of net investment income to average net assets, excluding waivers | 2.86 | % | 1.57 | % | 2.01 | % | 3.23 | % | 2.73 | % | 2.70 | % | ||||||||||||
Portfolio turnover rate | 2 | % | 8 | % | 7 | % | 10 | % | 10 | % | 7 | % | ||||||||||||
| (1) | Less than $0.005. | |
| (2) | Unaudited |
The accompanying notes are an integral part of these financial statements.
25
Table of Contents
NEW COVENANT FUNDS
December 31, 2011 (Unaudited)
1. Organization
New Covenant Funds (the “Trust”), an open-end, diversified management investment company, was organized as a Delaware statutory trust on September 30, 1998. It currently consists of four investment funds: New Covenant Growth Fund (“Growth Fund”), New Covenant Income Fund (“Income Fund”), New Covenant Balanced Growth Fund (“Balanced Growth Fund”), and New Covenant Balanced Income Fund (“Balanced Income Fund”), (individually, a “Fund,” and collectively, the “Funds”). The Funds commenced operations on July 1, 1999. The Trust’s authorized capital consists of an unlimited number of shares of beneficial interest of $0.001 par value. The Funds’ investment adviser is One Compass Advisors, a wholly owned subsidiary of the Presbyterian Church (U.S.A.) Foundation (the “Adviser”).
The objectives of the Funds are as follows:
| Growth Fund | Long-term capital appreciation. Dividend income, if any, will be incidental. | |
| Income Fund | High level of current income with preservation of capital. | |
| Balanced Growth Fund | Capital appreciation with less risk than would be present in a portfolio of only common stocks. | |
| Balanced Income Fund | Current income and long-term growth of capital. | |
2. Significant Accounting Policies
The preparation of financial statements in conformity with accounting principles generally accepted in the United States (“GAAP”) requires management to make estimates and assumptions that affect the reported amounts of assets and liabilities and disclosure of contingent assets and liabilities at the date of the financial statements and the reported amounts of income and expenses during the reporting period. Actual results could differ from those estimates. The following is a summary of the significant accounting policies consistently followed by the Funds in the preparation of their financial statements. The policies are in conformity with GAAP.
Portfolio Valuation: Fund investments are recorded at market value. Portfolio securities listed on a domestic or foreign exchange are valued at the last sale price on the day of valuation or, if there was no sale that day, at the mean of the last reported bid and ask prices as of the close of trading. Equity securities traded on NASDAQ use the official closing price. Equity securities which are traded in the over-the-counter market only, but which are not included on NASDAQ, are valued at the mean between the last preceding bid and ask prices. Debt securities with a remaining maturity of sixty days or more are valued by a pricing service using valuation methods such as matrix pricing as well as market transactions and dealer quotations. Debt securities with a remaining maturity of less than sixty days are valued at amortized cost, which approximates market value. Open-end funds are valued at net asset value. Closed-end funds and exchange-traded funds are valued at market value. All other assets and securities with no readily determinable market values are valued using procedures adopted by the Board of Trustees. Factors used in determining fair value include, but are not limited to: type of security or asset, fundamental analytical data relating to the investment in the security, evaluation of the forces that influence the market in which the security is purchased and sold, and information as to any transactions or offers with respect to the security. As of December 31, 2011, the Funds did not hold any securities for which market quotations were not readily available.
Foreign securities traded outside the United States are generally valued as of the time their trading is complete, which is usually different from the close of the New York Stock Exchange (“NYSE”). Occasionally, events affecting the value of such securities may occur between such times and the close of the NYSE that will not be reflected in the security’s market value. If events materially affecting the value of such securities occur during such period, these securities will be valued at their fair value according to procedures adopted by the Board of Trustees. All securities and other assets of a Fund initially expressed in foreign currencies will be converted to U.S. dollar values at the foreign exchange rate every business day, generally at 4:00 PM ET.
Valuation adjustments may be applied to certain common and preferred stocks that are solely traded on a foreign exchange to account for the market movement between the close of the foreign market and the close of the NYSE. These securities are generally valued using pricing service providers that consider the correlation of the trading patterns of the foreign security to the intraday trading in the U.S. markets for investments. Securities using these valuation adjustments are categorized as Level 2 of the fair value hierarchy.
As of December 31, 2011, the Growth Fund had securities with market values of $95,374,001 that represents 14.48% of the Fund’s net assets that were fair valued using these valuation adjustments.
In May 2011, the Financial Accounting Standards Board (“FASB”) issued Accounting Standards Update (“ASU”) No. 2011-04 Amendments to Achieve Common Fair Value Measurement and Disclosure Requirements in U.S. GAAP and IFRSs. ASU No. 2011-04 amends ASC 820, Fair Value Measurements and Disclosures to require additional disclosures regarding fair value measurements.
26
Table of Contents
notes to financial statements
NEW COVENANT FUNDS
December 31, 2011 (Unaudited)
Effective for fiscal years beginning after December 15, 2011, and for interim periods within those fiscal years, entities will need to disclose the following:
| 1) | the amounts of any transfers between Level 1 and Level 2 and the reasons for those transfers, and |
| 2) | for Level 3 fair value measurements, quantitative information about the significant unobservable inputs used, a description of the entity’s valuation processes, and a narrative description of the sensitivity of the fair value measurement to changes in the unobservable inputs and the interrelationship between inputs. |
Management is currently evaluating the impact ASU No. 2011-04 will have on the Funds’ financial statement disclosures.
The Funds follow a fair value hierarchy that distinguishes between market data obtained from independent sources (observable inputs) and each Fund’s own market assumptions (unobservable inputs). These inputs are used in determining the value of each Fund’s investments and are summarized in the following fair value hierarchy:
Level 1 — Quoted prices in active markets for identical securities.
Level 2 — Other significant observable inputs (including quoted prices for similar securities, interest rates, current discount rates, prepayment speeds, credit quality, yields for comparable securities, and trading volume).
Level 3 — Significant unobservable inputs (including the Fund’s own assumptions in determining the fair value of investments).
The inputs or methodology used for valuing securities are not an indication of the risk associated with investing in those securities.
The following is a summary of the inputs used, as of December 31, 2011, in valuing each Fund’s investments carried at fair value:
| Growth Fund | Level 1 | Level 2 | Level 3 | Total Market Value | ||||||||||||
Equity | ||||||||||||||||
Consumer Discretionary | $64,198,124 | $10,028,729 | $— | $74,226,853 | ||||||||||||
Consumer Staples | 59,949,228 | 11,195,265 | — | 71,144,493 | ||||||||||||
Energy | 59,831,797 | 12,200,245 | — | 72,032,042 | ||||||||||||
Financials | 73,991,752 | 17,136,448 | — | 91,128,200 | ||||||||||||
Health Care | 72,776,463 | 4,084,070 | — | 76,860,533 | ||||||||||||
Industrials | 42,457,874 | 20,155,324 | — | 62,613,198 | ||||||||||||
Information Technology | 115,126,851 | 10,192,998 | — | 125,319,849 | ||||||||||||
Materials | 31,334,292 | 10,380,922 | — | 41,715,214 | ||||||||||||
Telecommunication Services | 10,845,871 | — | — | 10,845,871 | ||||||||||||
Utilities | 21,076,535 | — | — | 21,076,535 | ||||||||||||
Total Equity | $551,588,787 | $95,374,001 | $— | $646,962,788 | ||||||||||||
Short-Term Investments | $5,987,056 | $— | $— | $5,987,056 | ||||||||||||
Total Investment in Securities | $557,575,843 | $95,374,001 | $— | $652,949,844 | ||||||||||||
| Income Fund | Level 1 | Level 2 | Level 3 | Total Market Value | ||||||||||||
Fixed Income | ||||||||||||||||
U.S. Government Agencies | $— | $210,243,838 | $— | $210,243,838 | ||||||||||||
Corporate Bonds | — | 109,575,137 | — | 109,575,137 | ||||||||||||
Non-Agency Mortgage Backed Securities | — | 42,950,943 | — | 42,950,943 | ||||||||||||
U.S. Treasury Obligations | — | 44,010,558 | — | 44,010,558 | ||||||||||||
Asset-Backed Securities | — | 24,369,170 | — | 24,369,170 | ||||||||||||
Municipal Bonds | — | 1,727,745 | — | 1,727,745 | ||||||||||||
Foreign Government Agency Issues | — | 1,020,408 | — | 1,020,408 | ||||||||||||
Other Agency Securities | — | 2,286,283 | — | 2,286,283 | ||||||||||||
Total Fixed Income | $— | $436,184,082 | $— | $436,184,082 | ||||||||||||
Short-Term Investments | $15,187,035 | $— | $— | $15,187,035 | ||||||||||||
Total Investment in Securities | $15,187,035 | $436,184,082 | $— | $451,371,117 | ||||||||||||
27
Table of Contents
notes to financial statements
NEW COVENANT FUNDS
December 31, 2011 (Unaudited)
| Balanced Growth Fund | Level 1 | Level 2 | Level 3 | Total Market Value | ||||||||||||
Equity | ||||||||||||||||
Investment Companies | $250,276,902 | $— | $— | $250,276,902 | ||||||||||||
Total Equity | $250,276,902 | $— | $— | $250,276,902 | ||||||||||||
Short-Term Investments | $2,815,794 | $— | $— | $2,815,794 | ||||||||||||
Total Investment in Securities | $253,092,696 | $— | $— | $253,092,696 | ||||||||||||
| Balanced Income Fund | Level 1 | Level 2 | Level 3 | Total Market Value | ||||||||||||
Equity | ||||||||||||||||
Investment Companies | $83,640,980 | $— | $— | $83,640,980 | ||||||||||||
Total Equity | $83,640,980 | $— | $— | $83,640,980 | ||||||||||||
Short-Term Investments | $1,171,529 | $— | $— | $1,171,529 | ||||||||||||
Total Investment in Securities | $84,812,509 | $— | $— | $84,812,509 | ||||||||||||
The following transfer schedule indicates the differences in the fair value hierarchy at December 31, 2011 compared to June 30, 2011:
Fair Value Transfers
New Covenant Growth Fund
Transfers into Level 1 | $ | 1,360,388 | ||
Transfers out of Level 1 | (95,374,001 | ) | ||
Net Transfers into Level 1 | $ | (94,013,613 | ) | |
Transfers into Level 2 | $ | 95,374,001 | ||
Transfers out of Level 2 | (1,360,388 | ) | ||
Net Transfers out of Level 2 | $ | 94,013,613 | ||
Transfers were made out of Level 2 due to securities trading on an exchange. Transfers were made out of Level 1 due to securities being fair valued by a pricing service provider.
There were no transfers between Levels for the New Covenant Income Fund, New Covenant Balanced Growth Fund and New Covenant Balanced Income Fund.
Transfers between Levels are recognized at the end of the reporting period.
Securities Transactions and Investment Income: During the period, security transactions are accounted for no later than one business day following the trade date. For financial reporting purposes, however, security transactions are accounted for on trade date on the last business day of the reporting period. Securities sold are determined on a specific identification basis. Interest income is recognized on the accrual basis and includes, where applicable, the amortization of premium or accretion of discount for both financial reporting and tax purposes. Dividend income is recorded on the ex-dividend date. Gains or losses realized on sales of securities are determined by comparing the identified cost of the security lot sold with the net sales proceeds.
Foreign Currency Translation: The books and records of the Funds are maintained in U.S. dollars. Investment valuation and other assets and liabilities initially expressed in foreign currencies are converted each business day into U.S. dollars based upon current exchange rates. Purchases and sales of foreign investments and income and expenses are converted into U.S. dollars based upon exchange rates prevailing on the respective dates of such transactions. That portion of unrealized gains or losses on investments due to fluctuations in foreign currency exchange rates is not separately disclosed. The Funds report gains and losses on foreign currency related transactions as realized and unrealized gains and losses for financial reporting purposes, whereas such gains and losses are treated as ordinary income or loss for U.S. federal income tax purposes.
Loans of Portfolio Securities: The Growth Fund and the Income Fund may lend their securities pursuant to a securities lending agreement (“Lending Agreement”) with JPMorgan Chase Bank, N.A. (“JPMorgan”). Security loans made pursuant to the Lending Agreement are required at all times to be secured by collateral valued at least equal to 102% of the market value of the securities loaned. Cash collateral received is invested by JPMorgan pursuant to the terms of the Lending Agreement. All such investments are made at the risk of the Funds and, as such, the Funds are liable for investment losses. To the extent a loan is
28
Table of Contents
notes to financial statements
NEW COVENANT FUNDS
December 31, 2011 (Unaudited)
secured by non-cash collateral, the borrower is required to pay a loan premium. Non-cash collateral received cannot be sold or repledged. Net income earned on the investment of cash collateral and loan premiums received on non-cash collateral are allocated between JPMorgan and the Funds in accordance with the Lending Agreement.
As of December 31, 2011 the Growth Fund and Income Fund did not participate in securities lending.
Repurchase Agreements: The Funds may enter into repurchase agreements which are secured by obligations of the U.S. government with a bank, broker-dealer or other financial institution. Each repurchase agreement is at least 102% collateralized and marked-to-market. However, in the event of default or bankruptcy by the counterparty to the repurchase agreement, realization of the collateral may by subject to certain costs, losses or delays. As of December 31, 2011, none of the Funds held repurchase agreements.
In April 2011, the FASB issued ASU No. 2011-03 Reconsideration of Effective Control for Repurchase Agreements. ASU No. 2011-03 amends ASC 860, Transfers and Servicing in relation to the accounting for repurchase agreements and similar agreements that both entitle and obligate a transferor to repurchase or redeem financial assets before their maturity. ASU No. 2011-03 modifies the criteria for determining effective control of transferred assets and as a result certain agreements may now be accounted for as secured borrowings. ASU No. 2011-03 is effective prospectively for new transfers and existing transactions that are modified in the first interim or annual period beginning on or after December 15, 2011. At this time, management is evaluating the implications of this change and its impact on the financial statements has not been determined.
Forward Commitments, When-Issued Securities and Delayed-Delivery Transactions: The Growth Fund and the Income Fund may purchase or sell securities on a when-issued or delayed-delivery basis and make contracts to purchase or sell securities for a fixed price at a future date beyond customary settlement time. Debt securities are often issued on that basis. No income will accrue on securities purchased on a when-issued or delayed-delivery basis until the securities are delivered. Securities purchased or sold on a when-issued, delayed-delivery or forward-commitment basis involve a risk of loss if the value of the security to be purchased declines prior to settlement date. Although the Funds would generally purchase securities on a when-issued, delayed-delivery or forward-commitment basis with the intention of acquiring the securities, the Funds may dispose of such securities prior to settlement if the Adviser or applicable sub-adviser deems it appropriate to do so. The Funds will normally realize a capital gain or loss in connection with these transactions.
When the Funds purchase securities on a when-issued, delayed-delivery or forward-commitment basis, the Funds will maintain cash, U.S. government securities or other liquid portfolio securities having a value (determined daily) at least equal to the amount of the Funds’ purchase commitments. In the case of a forward commitment to sell portfolio securities, the custodian will hold the portfolio securities in a segregated account while the commitment is outstanding. These procedures are designed to ensure that the Funds will maintain sufficient assets at all times to cover their obligations under when-issued purchases, forward commitments and delayed-delivery transactions.
Dividends and Distributions to Shareholders: Dividends from net investment income of all Funds except the Income Fund are declared and paid quarterly. The Income Fund dividends from net investment income are declared daily and paid monthly. For all Funds, all net realized long-term or short-term capital gains, if any, will be declared and distributed at least annually.
Income dividends and capital gain distributions are determined in accordance with income tax regulations, which may differ from GAAP. These differences are primarily due to differing treatments of income, gains and losses on various investment securities held by a Fund, timing differences in the recognition of income, gains and losses and differing characterizations of distributions made by the Fund.
These “book/tax” differences are either considered temporary or permanent in nature. To the extent these differences are permanent in nature, such amounts are reclassified within the composition of net assets based on their federal tax-basis treatment; temporary differences do not require reclassifications. To the extent that distributions exceed net investment income and net realized gains for tax purposes, they are reported as returns of capital.
| Accumulated Net Realized Gain (Loss) | Undistributed Net Investment Income (Loss) | Paid-In Capital | ||||||||||
Growth Fund | $(281,611 | ) | $266,680 | $14,931 | ||||||||
Income Fund | (1,886,702 | ) | 1,886,701 | 1 | ||||||||
Balanced Growth Fund | 20,644 | (18,454 | ) | (2,190 | ) | |||||||
Balanced Income Fund | 5,687 | 5,534 | (11,221 | ) | ||||||||
Federal Income Taxes: It is each Fund’s intention to continue to qualify annually as a regulated investment company by complying with the appropriate provisions of sub-chapter M of the Internal Revenue Code of 1986, as amended. Accordingly, no provision for federal income tax has been made.
29
Table of Contents
notes to financial statements
NEW COVENANT FUNDS
December 31, 2011 (Unaudited)
The Funds have reviewed the tax positions taken on federal income tax returns for each of the three open tax years and as of December 31, 2011, and have determined that no provision for income tax is required in the Funds’ financial statements. Foreign securities held by a Fund may be subject to foreign taxation on dividend and interest income received. Foreign taxes, if any, are recorded based on tax regulations and rates that exist in the foreign markets in which the Funds invest.
Allocation of Expenses: Expenses directly attributable to a Fund are charged directly to that Fund, while expenses which are attributable to more than one Fund of the Trust are allocated among the respective Funds based upon relative net assets or some other reasonable method.
3. Investment Advisory and Other Agreements
The Trust, on behalf of each Fund, has entered into an Investment Advisory Agreement with the Adviser. Under the Agreement, the Adviser is responsible for managing the Funds’ investments as well as furnishing the Funds with certain administrative services. Prior to January 1, 2011, the Growth Fund paid the Adviser a monthly fee at the annual rate of 0.99% of the Growth Fund’s average daily net assets and the Income Fund paid the Adviser a monthly fee at the annual rate of 0.75% of the Income Fund’s average daily net assets. Effective January 1, 2011 the Adviser receives an annual advisory fee of 0.87% for the Growth Fund and 0.65% for the Income Fund. The Adviser does not receive advisory fees for the Balanced Growth and Balanced Income Funds (the “Balanced Funds”). The Adviser has entered into Sub-Advisory Agreements with seven Sub-Advisors to assist in the selection and management of the Growth Fund’s and Income Fund’s investment securities. It is the responsibility of the Sub-Advisers, under the direction of the Adviser, to make day-to-day investment decisions for these Funds. The Adviser, not the Funds, pays each Sub-Adviser a quarterly fee for their services. The Adviser pays the Sub-Adviser’s fee directly from its own advisory fees. The sub-advisory fees are based on the assets of a Fund for which the Sub-Adviser is responsible for making investment decisions.
The following are the Sub-Advisers for the Growth Fund: Baillie Gifford Overseas, Ltd., Sustainable Growth Advisers, LP., Sound Shore Management Inc., TimesSquare Capital Management and Brockhouse & Cooper International, Inc.
The following are the Sub-Advisers for the Income Fund: EARNEST Partners, LLC and Robert W. Baird & Company, Incorporated.
The Trust employs a Chief Compliance Officer (“CCO”) who receives a portion of her compensation from the Trust as approved by the Board of Trustees, as well as reimbursement of out-of-pocket expenses. The CCO is also an employee of the Adviser. For the period ended December 31, 2011, the Growth Fund, the Income Fund, the Balanced Growth Fund, and the Balanced Income Fund were allocated a portion of the CCO’s compensation of $13,208, $8,736, $4,996 and $1,716, respectively.
The Trust is a party to Shareholder Services Agreements pursuant to which each Fund is authorized to make payments to certain entities which may include investment advisors, banks, trust companies and other types of organizations (“Authorized Service Providers”) for providing administrative services with respect to shares of the Funds attributable to or held in the name of the Authorized Service Provider for its clients or other parties with whom they have a servicing relationship. Under the terms of the Shareholder Services Agreements, each Fund is authorized to pay monthly an Authorized Service Provider (which until January 1, 2011, could include affiliates of the Funds) a shareholder services fee at the rate of 0.25% on an annual basis of the average daily net assets of the shares of the Fund attributable to or held in the name of the Authorized Service Provider for providing certain administrative services to Fund shareholders with whom the Authorized Service Provider has a servicing relationship. From July 1, 2010 through December 31, 2010, the Adviser waived all its investment advisory fees payable to it by the Income Fund to the extent of the amount paid in Shareholder Service fees by the Income Fund to any Affiliated Authorized Service Provider under the Shareholder Services Agreements. From July 1, 2010 through December 31, 2010, the Adviser waived up to 0.17% on an annual basis of the average daily net assets for the Growth Fund, the Balanced Growth Fund and the Balanced Income Fund. Effective January 1, 2011, the Funds no longer paid shareholder servicing fees to affiliates of the Adviser and the Adviser discontinued waiving any of its investment advisory fees.
The Trust has entered into servicing agreements with U.S. Bancorp Fund Services, LLC (“USBFS”), an indirect, wholly-owned subsidiary of U.S. Bancorp. Under the servicing agreements, USBFS provides transfer agency, administrative and fund accounting services to the Funds. Under the terms of the Transfer Agency Agreement, USBFS is entitled to account based fees and annual fund level fees, as well as reimbursement of out-of-pocket expenses incurred in providing transfer agency services. Under the Fund Accounting Agreement, USBFS is entitled to a fee computed at an annual rate of 0.02% of the Trust’s average daily net assets for the first $500,000,000, 0.01% for $500,000,001 to $1,000,000,000, and 0.0075% over $1,000,000,000. Under the Administration Agreement, USBFS is entitled to a fee computed at an annual rate of 0.03% of the Trust’s average daily net assets for the first $500,000,000, 0.02% for $500,000,001 to $1,000,000,000, and 0.01% over $1,000,000,000.
The Trust issues shares of the Funds pursuant to a Distribution Agreement with Quasar Distributors, LLC (the “Distributor”), an affiliate of USBFS. The Funds do not pay the Distributor in its capacity as principal distributor.
30
Table of Contents
notes to financial statements
NEW COVENANT FUNDS
December 31, 2011 (Unaudited)
The Trust has a Custodian Agreement with JPMorgan Chase Bank, N.A.
No officer, trustee or employee of the Trust, USBFS, or any affiliate thereof, except the CCO, receives any compensation from the Funds for serving as a Trustee or officer of the Trust. The Funds reimburse expenses incurred by the Trustees and officers of the Trust in attending Board and Committee meetings.
A summary of each Balanced Fund’s investment in the Growth Fund and Income Fund for the period ended December 31, 2011, is as follows:
| Share Activity | ||||||||||||||||||||||||||||
| Fund | Balance June 30, 2011 | Purchases | Sales | Balance December 31, 2011 | Realized Gain (Loss) | Income | Value December 31, 2011 | |||||||||||||||||||||
| Balanced Growth Fund | ||||||||||||||||||||||||||||
Growth Fund | 5,219,460 | 395,552 | 344,147 | 5,270,865 | $194,835 | $969,984 | $156,860,928 | |||||||||||||||||||||
Income Fund | 4,300,801 | 285,667 | 528,433 | 4,058,035 | (1,023,752 | ) | 1,968,835 | 93,415,974 | ||||||||||||||||||||
| Balanced Income Fund | ||||||||||||||||||||||||||||
Growth Fund | 1,089,427 | 54,055 | 51,323 | 1,092,159 | (35,382 | ) | 198,049 | 32,502,638 | ||||||||||||||||||||
Income Fund . . . . . . . . . . . . . . . . . . . . . . . | 2,424,652 | — | 203,178 | 2,221,474 | (407,853 | ) | 1,124,682 | 51,138,342 | ||||||||||||||||||||
4. Purchases and Sales of Securities
The cost of purchases and proceeds from sales of securities, excluding U.S. government and other short-term investments, for the period ended December 31, 2011, were as follows:
| Fund | Purchases (excluding Short-Term U.S. Government Securities) | Sales (excluding Short-Term Investments & U.S. Government Securities) | Purchases of U.S. Government Securities | Sales of U.S. Government | ||||||||||||
Growth Fund | $177,634,285 | $(175,772,152 | ) | $— | $— | |||||||||||
Income Fund | 13,738,013 | (16,091,916 | ) | 63,968,048 | (40,028,378 | ) | ||||||||||
Balanced Growth Fund | 17,718,267 | (22,613,292 | ) | — | — | |||||||||||
Balanced Income Fund . . . . . .. | 1,528,331 | (6,210,286 | ) | — | — | |||||||||||
5. Risk Factors
The performance of a Fund’s investment in non-U.S. companies and in companies operating internationally or in foreign countries will depend principally on economic conditions in their product markets, the securities markets where their securities are traded, and currency exchange rates. These risks are present because of uncertainty in future exchange rates back into U.S. dollars and possible political instability, which could affect foreign financial markets and local economies. There are also risks related to social and economic developments abroad, as well as risks resulting from the differences between the regulations to which U.S. and foreign issuers and markets are subject.
The Funds will not invest more than 15% of the value of their net assets in securities that are illiquid because of restrictions on transferability or other reasons. Repurchase agreements with deemed maturities in excess of seven days are subject to this 15% limit. The Funds may purchase securities which are not registered under the Securities Act of 1933 (the “Securities Act”) but which can be sold to “qualified institutional buyers” in accordance with Rule 144A under the Securities Act. In some cases, such securities are classified as “illiquid securities;” however, any such security will not be considered illiquid so long as it is determined by the Adviser, under guidelines approved by the Board of Trustees, that an adequate trading market exists for that security. This investment practice could have the effect of increasing the level of illiquidity in a Fund during any period that qualified institutional buyers become uninterested in purchasing these restricted securities.
The Income Fund may invest a limited amount of assets in debt securities which are rated below investment grade (hereinafter referred to as “lower-rated securities”) or which are unrated but deemed equivalent to those rated below investment grade by the portfolio managers. The lower the ratings of such debt securities, the greater their risks. These debt instruments generally offer a higher current yield than that available from higher-grade issues, and typically involve greater risks. The yields on lower-rated securities will fluctuate over time. In general, prices of all bonds rise when interest rates fall and fall when interest rates rise. Lower-rated securities are subject to adverse changes in general economic conditions and to changes in the financial condition of their issuers. During periods of economic downturn or rising interest rates, issuers of these instruments may experience financial stress that could adversely affect their ability to make payments of principal and interest, and increase the possibility of default.
31
Table of Contents
notes to financial statements
NEW COVENANT FUNDS
December 31, 2011 (Unaudited)
The Balanced Funds invest their assets primarily in the Growth Fund and the Income Fund. By investing primarily in shares of these Funds, shareholders of the Balanced Funds indirectly pay a portion of the operating expenses, management fees and brokerage costs of the underlying Funds as well as their own operating expenses. Thus, shareholders of the Balanced Funds may indirectly pay slightly higher total operating expenses and other costs than they would pay by directly owning shares of the Growth Fund and Income Fund. Total fees and expenses to be borne by investors in either Balanced Fund will depend on the portion of the Funds’ assets invested in the Growth Fund and in the Income Fund. A change in the asset allocation of either Balanced Fund could increase or reduce the fees and expenses actually borne by investors in that Fund. The Balanced Funds are also subject to rebalancing risk. Rebalancing activities, while undertaken to maintain a Fund’s investment risk-to-reward ratio, may cause the Fund to under-perform other funds with similar investment objectives. For the Balanced Growth Fund, it is possible after rebalancing from equities into a greater percentage of fixed-income securities, that equities will outperform fixed-income investments. For the Balanced Income Fund, it is possible that after rebalancing from fixed-income securities into a greater percentage of equity securities, that fixed-income securities will outperform equity investments. The performance of the Balanced Growth Fund and the Balanced Income Fund depends on the performance of the underlying Funds in which they invest.
6. Distribution Information
Income and long-term capital gain distributions are determined in accordance with federal income tax regulations, which may differ from GAAP.
The tax character of distributions paid during the years ended June 30, 2011 and June 30, 2010 were as follows:
| Distributions Paid From | ||||||||||||||||||||||||||||||||||||||||
| Ordinary Income | Net Long Term Capital Gains | Total Taxable Deductions | Return of Capital | Total Distributions Paid | ||||||||||||||||||||||||||||||||||||
| 2011 | 2010 | 2011 | 2010 | 2011 | 2010 | 2011 | 2010 | 2011 | 2010 | |||||||||||||||||||||||||||||||
Growth Fund | $5,337,270 | $4,672,796 | $— | $— | $5,337,270 | $4,672,796 | $— | $741,060 | $5,337,270 | $5,413,856 | ||||||||||||||||||||||||||||||
Income Fund | 11,860,430 | 13,775,952 | — | — | 11,860,430 | 13,775,952 | — | — | 11,860,430 | 13,775,952 | ||||||||||||||||||||||||||||||
| Balanced GrowthFund | 3,263,544 | 3,614,274 | — | — | 3,263,544 | 3,614,274 | 2,190 | 184,366 | 3,265,734 | 3,798,640 | ||||||||||||||||||||||||||||||
| Balanced Income Fund | 1,498,170 | 1,817,908 | — | — | 1,498,170 | 1,817,908 | 11,222 | 36,554 | 1,509,392 | 1,854,462 | ||||||||||||||||||||||||||||||
7. Federal Income Taxes
As of June 30, 2011, the Funds had available for federal tax purposes unused capital loss carryforwards expiring as follows:
| 2012 | 2013 | 2014 | 2015 | 2016 | 2017 | 2018 | 2019 | Total | ||||||||||||||||||||||||||||
Growth Fund | $— | $— | $— | $— | $— | $(269,987 | ) | $(88,654,006 | ) | $— | $(88,923,993 | ) | ||||||||||||||||||||||||
Income Fund | — | — | — | (4,069,083 | ) | (517,116 | ) | (6,784,158 | ) | (56,670,809 | ) | — | (68,041,166 | ) | ||||||||||||||||||||||
Balanced Growth Fund | — | — | — | — | — | (764,364 | ) | (8,629,985 | ) | (3,097,518 | ) | (12,491,867 | ) | |||||||||||||||||||||||
Balanced Income Fund | (960,990 | ) | (792,155 | ) | — | — | — | (335,058 | ) | (1,962,388 | ) | — | (4,050,591 | ) | ||||||||||||||||||||||
During the year ended June 30, 2011, the Growth Fund, the Income Fund and the Balanced Income Fund utilized $61,311,102, $3,195,517 and $266,821 of capital loss carryforwards to reduce the amount of taxable capital gains.
Under tax law, certain capital and foreign currency losses realized after October 31, and within the taxable year may be deferred and treated as occurring on the first business day of the following fiscal year. For the year ended June 30, 2011, the Funds deferred to July 1, 2011, post-October losses of:
| Post-October Capital Losses | Post-October Currency Losses | |||||||
Growth Fund | $— | — | ||||||
Income Fund | 960,120 | — | ||||||
Balanced Growth Fund | 2,869,356 | — | ||||||
Balanced Income Fund | — | — | ||||||
32
Table of Contents
notes to financial statements
NEW COVENANT FUNDS
December 31, 2011 (Unaudited)
As of June 30, 2011, the components of accumulated earnings/(deficit) on a tax basis were as follows:
| Undistributed Ordinary Income | Undistributed Long-Term Capital Gains | Accumulated Earnings | Accumulated Capital and Other Losses | Unrealized Appreciation/ Depreciation* | Total Accumulated Earnings/ (Deficit) | |||||||||||||||||||
Growth Fund | $509,991 | $— | $509,991 | $(88,869,431 | ) | $127,444,890 | $39,085,450 | |||||||||||||||||
Income Fund | 3,225,535 | — | 3,225,535 | (69,001,286 | ) | 11,454,653 | (54,321,098 | ) | ||||||||||||||||
| Balanced Growth Fund | — | — | — | (15,361,223 | ) | 19,526,510 | 4,165,287 | |||||||||||||||||
| Balanced Income Fund | — | — | — | (4,050,591 | ) | 6,280,271 | 2,229,680 | |||||||||||||||||
| * | The difference between the book-basis and tax basis unrealized appreciation (depreciation) is attributable primarily to: tax deferral of losses on wash sales, passive foreign investment companies (“PFICs”) and the difference between book and tax amortization methods for premium and market discount, and the return of capital adjustments from real estate investment trusts. |
At June 30, 2011, the cost, gross unrealized appreciation and gross unrealized depreciation on securities, for federal income tax purposes, were as follows:
| Tax Cost | Tax Unrealized Appreciation | Tax Unrealized (Depreciation) | Net Unrealized Appreciation (Depreciation) | |||||||||||||
Growth Fund | $605,122,424 | $150,810,664 | $(23,365,774 | ) | $127,444,890 | |||||||||||
Income Fund | 441,605,274 | 14,487,799 | (3,033,146 | ) | 11,454,653 | |||||||||||
Balanced Growth Fund | 252,024,606 | 38,656,756 | (19,130,246 | ) | 19,526,510 | |||||||||||
Balanced Income Fund | 85,875,356 | 11,391,758 | (5,111,487 | ) | 6,280,271 | |||||||||||
8. Subsequent Events
In preparing the financial statements as of December 31, 2011, management considered the impact of subsequent events through the date of issuance of potential recognition or disclosure in these financial statements. In October 2011, the Board of Trustees of the Trust was informed by the Adviser that the Adviser no longer intends to serve as the investment adviser to the Funds based on the Adviser’s decision to cease providing mutual fund advisory services. The Board has therefore taken action to select a successor investment adviser. At a meeting of the Board held on November 19, 2011, the Board voted to select SEI Investments Management Corporation (“SIMC”) to serve as investment adviser to the Funds, subject to the approval of the shareholders of the Funds. A special meeting of the shareholders of the Funds (the “Special Meeting”) will therefore be held at which shareholders will be asked to approve an Investment Advisory Agreement between the Trust and SIMC. At the Special Meeting, shareholders will also be asked to elect several new Trustees of the Trust since all but one of the current Trustees will be resigning from the Board. Each of the proposed new Trustees currently serve as a Trustee of other investment companies managed and advised by SIMC and its affiliates.
9. Related Party Transactions
As of December 31, 2011, the Presbyterian Church (U.S.A.) Foundation, an affiliate of the Funds, owned 60.35% and 55.07% of the outstanding shares of the Growth and Income Funds, respectively.
10. Accounting Pronouncements
On December 22, 2010, the Regulated Investment Company Modernization Act of 2010 (the “Act”) was enacted, which changed various technical rules governing the tax treatment of regulated investment companies. The changes are generally effective for taxable years beginning after the date of enactment. One of the more prominent changes addresses capital loss carryforwards. Under the Act, each Fund will be permitted to carry forward capital losses incurred in taxable years beginning after the date of enactment for an unlimited period. However, any losses incurred during those future taxable years will be required to be utilized prior to the losses incurred in pre-enactment taxable years, which carry an expiration date. As a result of this ordering rule, pre-enactment capital loss carryforwards may be more likely to expire unused. Additionally, post-enactment capital loss carryforwards will retain their character as either short-term or long-term capital losses rather than being considered all short-term as permitted under previous regulation.
33
Table of Contents
NEW COVENANT FUNDS
December 31, 2011 (Unaudited)
Approval of New Sub-Advisory Agreement for the New Covenant Growth Fund
During the semi-annual period ended December 31, 2011, the Board of Trustees was called upon to take action with respect to a new Sub-Advisory Agreement relating to the Growth Fund in accordance with applicable provisions of the Investment Company Act of 1940, as amended (the “1940 Act”). As described more fully below, the Board approved a Sub-Advisory Agreement (the “New Sub-Advisory Agreement”) with Sustainable Growth Advisers, L.P. (“SGA”) at a meeting of the Board held on August 21, 2011 (the “Meeting”).
The relevant provisions of the 1940 Act specifically provide that it is the duty of the Board to request and evaluate such information as the Board determines is reasonably necessary to allow the Board to properly consider the adoption of any new sub-advisory agreements with respect to a Fund, and it is the duty of the Adviser and any sub-advisers to furnish the Trustees with such information as is responsive to their request. Accordingly, in determining whether to approve the New Sub-Advisory Agreement, the Board of Trustees requested, and the Adviser and SGA provided, information and data relevant to the Board’s consideration.
In connection with their review of the New Sub-Advisory Agreement, the Trustees considered, in addition to performance information with respect to SGA presented at the Meeting, SGA’s experience in serving as an investment adviser to another Socially Responsible Investing client and the fees charged by SGA to other clients as compared to the fees SGA receives from the Adviser. The Board did not consider information as to the profitability of the New Sub-Advisory Agreement to SGA because the fees payable to SGA had been negotiated at arms length and would be paid by the Adviser, although the Board did consider the impact on the Adviser of the reduction in the fee payable to SGA as compared to the fee payable to the firm that SGA was replacing, which would result in an increase in the level of profitability to the Adviser in connection with its management of the Growth Fund. Based upon their review and consideration of these factors and other matters deemed relevant by the Board in reaching an informed business judgment, the Board of Trustees, including a majority of the Independent Trustees, concluded that the terms of the New Sub-Advisory Agreement were fair and reasonable in light of the services to be provided and the Board therefore determined to approve the New Sub-Advisory Agreement, contingent upon the completion of a compliance report from the Trust’s Chief Compliance Officer (“CCO”), based on her review of SGA and its Rule 38a-1 compliance program. The CCO completed this review and reported to the Board at a special meeting held on October 19, 2011. As a result of the Board’s determination, SGA became a sub-adviser to the Growth Fund effective as of October 19, 2011.
In reaching their conclusion with respect to the approval of the New Sub-Advisory Agreement, the Trustees did not identify any one single factor as being controlling; rather, the Trustees took note of a combination of factors that influenced their decision-making process. Among other things, the Trustees considered the nature, quality and extent of the services to be provided by SGA to the Growth Fund and SGA’s prior investment performance. As part of their deliberations, the Trustees also considered and relied upon information about the Growth Fund that had been provided to them throughout the past year in connection with their regular Board meetings at which they engage in the ongoing oversight of the Growth Fund and its operations. During this process the Independent Trustees were counseled by their own independent legal counsel (as such term is defined in the rules under the 1940 Act).
34
Table of Contents
supplemental data
NEW COVENANT FUNDS
December 31, 2011 (Unaudited)
Proxy Voting Policy and Proxy Voting Records
A description of the policies and procedures that the Trust uses to determine how to vote proxies related to portfolio securities is available (i) without charge, upon request, by calling 800-858-6127 and (ii) on the Securities and Exchange Commission’s website at http://www.sec.gov. Information regarding how each Fund voted proxies related to securities held during the most recent 12 month period ended June 30 is (i) available without charge, upon request, by calling 800-858-6127; (ii) on the Funds’ website at http://www.newcovenantfunds.com and (iii) on the Securities and Exchange Commission’s website at http://www.sec.gov.
Form N-Q Disclosure
The Trust files its complete schedules of portfolio holdings with the SEC for the first and third quarters of each fiscal year on Form N-Q. The Trust’s Form N-Q is available on the SEC’s website at http://www.sec.gov. The Trust’s Form N-Q may be reviewed and copied at the Commission’s Public Reference Room in Washington, DC, and information on the operation of the Public Reference Room may be obtained by calling 1-800-SEC-0330. This information is also available, without charge, by calling toll-free 1-877-835-4531.
Additional Fund Information - Hypothetical Cost of Investing
As a shareholder of the New Covenant Funds, you incur ongoing costs, including management fees and other Fund expenses. This example is intended to help you understand your ongoing costs (in dollars) of investing in the New Covenant Funds and to compare these costs with the ongoing costs of investing in other mutual funds.
The example is based on an investment of $1,000 invested at the beginning of the period and held for the entire period from July 1, 2011 through December 31, 2011.
Actual Expenses
The table below provides information about actual account values and actual expenses. You may use the information below, together with the amount you invested, to estimate the expenses that you paid over the period. Simply divide your account value by $1,000 (for example, an $8,600 account value divided by $1,000 = 8.6), then multiply the result by the number in the table under the heading entitled “Expenses Paid During Period” to estimate the expenses you paid on your account during this period.
| Beginning account value 07/01/11 | Ending account value 12/31/11 | Expenses paid during the period* 07/1/11 - 12/31/11 | Expense Ratio During Period** 07/1/11 - 12/31/11 | |||||||||||||
Growth Fund | $1,000.00 | $920.70 | $4.78 | 0.99 | % | |||||||||||
Income Fund | 1,000.00 | 1,030.30 | 3.88 | 0.76 | % | |||||||||||
Balanced Growth Fund | 1,000.00 | 962.60 | 0.69 | 0.14 | % | |||||||||||
Balanced Income Fund | 1,000.00 | 987.50 | 0.95 | 0.19 | % | |||||||||||
Hypothetical Example for Comparison Purposes
The table below provides information about hypothetical account values and hypothetical expenses based on each of the New Covenant Funds’ actual expense ratios and an assumed rate of return of 5% per year before expenses, which is not the Fund’s actual return. The hypothetical account values and expenses may not be used to estimate the actual ending account balance or expenses you paid for the period. You may use this information to compare this 5% hypothetical example with the 5% hypothetical examples that appear in the shareholder reports of other funds.
| Beginning account value 07/01/11 | Ending account value 12/31/11 | Expenses paid during the period* 07/1/11 - 12/31/11 | Expense Ratio During Period** 07/1/11 - 12/31/11 | |||||||||||||
Growth Fund | $1,000.00 | $1,020.16 | $5.03 | 0.99 | % | |||||||||||
Income Fund | 1,000.00 | 1,021.32 | 3.86 | 0.76 | % | |||||||||||
Balanced Growth Fund | 1,000.00 | 1,024.43 | 0.71 | 0.14 | % | |||||||||||
Balanced Income Fund | 1,000.00 | 1,024.18 | 0.97 | 0.19 | % | |||||||||||
| * | Expenses are equal to the average account value times the Fund’s annualized expense ratio (reflecting fee waivers in effect) multiplied by 184/366 (to reflect the one-half year period) |
| ** | Annualized |
35
Table of Contents

200 East Twelfth Street
Jeffersonville, IN 47130
This report is authorized for distribution only if preceded by a current prospectus. Shares of New Covenant Funds are distributed by Quasar Distributors, LLC.
Annual/Semi-Annual Report to Shareholders
These reports include financial statements and information about the portfolio of investments for each Fund. The Trust’s Annual Report includes a discussion of the market conditions and investment strategies that significantly affected each Fund’s performance during its last fiscal year.
Statement of Additional Information (SAI)
The SAI contains more detailed information on all aspects of the Funds. It has been filed with the Securities and Exchange Commission and is legally considered to be a part of the prospectus. To request a free copy of the current Annual or Semi-Annual Report, SAI, or to request other information about the Funds, you can visit www.NewCovenantFunds.com or write or call:
New Covenant Funds
Box 701
Milwaukee, WI 53201-0701
877-835-4531
Text-only versions of Fund documents can be viewed online or downloaded from the SEC’s EDGAR database at http://www.sec.gov.
You may review and copy the SAI and other information about the Funds by visiting SEC’S Public Reference Room in Washington, D.C. You can obtain information about the Public Reference Room by calling the SEC at 202-551-8090. Copies of this information also may be obtained, upon payment of a duplicating fee, by electronic request at publicinfo@sec.gov, or by writing to the Public Reference Section of the SEC, Washington, D.C. 20549-0102.
Table of Contents
Item 2. Code of Ethics.
Not applicable for semi-annual reports.
Item 3. Audit Committee Financial Expert.
Not applicable for semi-annual reports.
Item 4. Principal Accountant Fees and Services.
Not applicable for semi-annual reports.
Item 5. Audit Committee of Listed Registrants.
Not applicable to registrants who are not listed issuers (as defined in Rule 10A-3 under the Securities Exchange Act of 1934).
Item 6. Investments.
| (a) | Schedule of Investments is included as part of the report to shareholders filed under Item 1 of this Form. |
| (b) | Not Applicable. |
Item 7. Disclosure of Proxy Voting Policies and Procedures for Closed-End Management Investment Companies.
Not applicable to open-end investment companies.
Item 8. Portfolio Managers of Closed-End Management Investment Companies.
Not applicable to open-end investment companies.
Item 9. Purchases of Equity Securities by Closed-End Management Investment Company and Affiliated Purchasers.
Not applicable to open-end investment companies.
Item 10. Submission of Matters to a Vote of Security Holders.
Not applicable.
Item 11. Controls and Procedures.
| (a) | The Registrant’s President and Treasurer have reviewed the Registrant’s disclosure controls and procedures (as defined in Rule 30a-3(c) under the Investment Company Act of 1940 |
2
Table of Contents
| (the “Act”)) as of a date within 90 days of the filing of this report, as required by Rule 30a-3(b) under the Act and Rules 13a-15(b) or 15d-15(b) under the Securities Exchange Act of 1934. Based on their review, such officers have concluded that the disclosure controls and procedures are effective in ensuring that information required to be disclosed in this report is appropriately recorded, processed, summarized and reported and made known to them by others within the Registrant and by the Registrant’s service provider. |
| (b) | There were no changes in the Registrant’s internal control over financial reporting (as defined in Rule 30a-3(d) under the Act) that occurred during the second fiscal quarter of the period covered by this report that has materially affected, or is reasonably likely to materially affect, the Registrant’s internal control over financial reporting. |
Item 12. Exhibits.
| (a) | (1) Any code of ethics or amendment thereto, that is the subject of the disclosure required by Item 2, to the extent that the registrant intends to satisfy Item 2 requirements through filing an exhibit. Incorporated by reference to the Registrant’s Form N-CSR filed September 03, 2009. |
(2) A separate certification for each principal executive and principal financial officer pursuant to Section 302 of the Sarbanes-Oxley Act of 2002. Filed herewith.
(3) Any written solicitation to purchase securities under Rule 23c-1 under the Act sent or given during the period covered by the report by or on behalf of the registrant to 10 or more persons. Not applicable to open-end investment companies.
| (b) | Certifications pursuant to Section 906 of the Sarbanes-Oxley Act of 2002. Furnished herewith. |
3
Table of Contents
SIGNATURES
Pursuant to the requirements of the Securities Exchange Act of 1934 and the Investment Company Act of 1940, the registrant has duly caused this report to be signed on its behalf by the undersigned, thereunto duly authorized.
| (Registrant) | New Covenant Funds |
| By (Signature and Title)* | /s/ Timothy P. Clark | |||
| Timothy P. Clark, President | ||||
| Date | 2/16/2012 | |||
Pursuant to the requirements of the Securities Exchange Act of 1934 and the Investment Company Act of 1940, this report has been signed below by the following persons on behalf of the registrant and in the capacities and on the dates indicated.
| By (Signature and Title)* | /s/ Timothy P. Clark | |||
| Timothy P. Clark, President | ||||
| Date | 2/16/2012 | |||
| By (Signature and Title)* | /s/ Jason Hadler | |||
| Jason Hadler, Treasurer | ||||
| Date | 2/17/2012 | |||
4