UNITED STATES
SECURITIES AND EXCHANGE COMMISSION
Washington, D.C. 20549
FORM N-CSR
CERTIFIED SHAREHOLDER REPORT OF REGISTERED MANAGEMENT
INVESTMENT COMPANIES
Investment Company Act file number: | | 811- 09101 |
| |
Exact name of registrant as specified in charter: | | Dryden Tax Managed Funds |
| |
Address of principal executive offices: | | Gateway Center 3 100 Mulberry Street Newark, New Jersey 07102 |
| |
Name and address of agent for service: | | Marguerite E. H. Morrison Gateway Center 3 100 Mulberry Street Newark, New Jersey 07102 |
| |
Registrant’s telephone number, including area code: | | 973-367-7525 |
| |
Date of fiscal year end: | | October 31, 2003 |
| |
Date of reporting period: | | October 31, 2003 |
Item 1 – Reports to Stockholders
[SHAREHOLDER REPORT TO BE INSERTED HERE IN THE EDGAR VERSION]
Dryden Large-Cap Core Equity Fund
Formerly known as Dryden Tax-Managed Equity Fund
|
| OCTOBER 31, 2003 | | ANNUAL REPORT |

FUND TYPE
Large-capitalization stock
OBJECTIVE
Long-term after-tax growth of capital
This report is not authorized for distribution to prospective investors unless preceded or accompanied by a current prospectus.
The views expressed in this report and information about the Fund’s portfolio holdings are for the period covered by this report and are subject to change thereafter.
JennisonDryden is a service mark of The Prudential Insurance Company of America.

Dear Shareholder,
December 16, 2003
As you may know, the mutual fund industry recently has been the subject of much media attention. There has been press coverage of Prudential, and recently, administrative complaints were filed against Prudential Securities* and some of its former brokers and branch managers in Massachusetts. As president of your Fund, I’d like to provide you with an update on the issues as they pertain to JennisonDryden mutual funds.
State and federal authorities have requested information regarding trading practices from many mutual fund companies across the nation. Our fund family has been cooperating with inquiries it has received, and at the same time, Prudential Financial, Inc. has been conducting its own internal review. This review encompasses the policies, systems, and procedures of our fund family, Prudential Financial’s investment units and its proprietary distribution channels, including the former Prudential Securities. The review also includes mutual fund trading activity by investment professionals who manage our funds.
Market timing
Prudential Investments LLC, the Fund’s investment manager, has actively discouraged disruptive market timing, and for years, our mutual fund prospectuses have identified and addressed this issue. Prudential Investments has established operating policies and procedures that are designed to detect and deter frequent trading activities that would be disruptive to the management of our mutual fund portfolios, and has rejected numerous orders placed by market timers in the past.
* Prudential Investments LLC, the manager of JennisonDryden mutual funds, and Prudential Investment Management Services LLC, the distributor of the funds, are part of the Investment Management segment of Prudential Financial, Inc. and are separate legal entities from the entity formerly known as Prudential Securities Incorporated, a retail brokerage firm. In February 2003, Prudential Financial and Wachovia Corporation announced they were combining their retail brokerage forces. The transaction was completed in July 2003. Wachovia Corporation has a 62% interest in the new firm, which is now known as Wachovia Securities LLC, and Prudential Financial owns the remaining 38%.
Late trading
The Securities and Exchange Commission requires that orders to purchase or redeem mutual fund shares be received either by the fund or by an intermediary (such as a broker, financial adviser, or 401(k) record keeper) before the time at which the fund calculates its net asset value (normally 4:00 p.m., Eastern time) if they are to receive that day’s price. The policies of our mutual funds do not make and have not made allowances for the practice known as “late trading”.
For more than 40 years we have offered investors quality investment products, financial guidance, and responsive customer service. Today we remain committed to this heritage and to the highest ethical principles in our investment practices.
Sincerely,

Judy A. Rice, President
Dryden Large-Cap Core Equity Fund
| Dryden Tax-Managed Funds/Dryden Large-Cap Core Equity Fund | | 1 |
Your Fund’s Performance
Fund Objective
The investment objective of the Dryden Large-Cap Core Equity Fund (the Fund) is long-term after-tax growth of capital. There can be no assurance that the Fund will achieve its investment objective.
|
| Cumulative Total Returns1 as of 10/31/03 | |
| | | One Year | | | Three Years | | | Since Inception2 | |
Class A | | 21.57 | % | | –23.69 | % | | –5.30 | % |
|
Class B | | 20.55 | | | –25.43 | | | –8.50 | |
|
Class C | | 20.55 | | | –25.43 | | | –8.50 | |
|
Class Z | | 21.70 | | | –23.16 | | | –4.10 | |
|
S&P 500 Index3 | | 20.79 | | | –22.97 | | | –9.31 | |
|
Lipper Large-Cap Core Funds Avg.4 | | 17.78 | | | –28.14 | | | –12.85 | |
|
| | | | | | | | | | |
|
| Average Annual Total Returns1 as of 9/30/03 | |
| | | One Year | | | Three Years | | | Since Inception2 | |
Class A | | 17.63 | % | | –12.13 | % | | –3.50 | % |
|
Class B | | 18.04 | | | –12.16 | | | –3.33 | |
|
Class B—Return After Taxes on Distribution | | 18.04 | | | –12.16 | | | –3.33 | |
|
Class B—Return After Taxes on Distribution and Sale of Fund Shares | | 11.73 | | | –9.46 | | | –2.63 | |
|
Class C | | 20.82 | | | –11.56 | | | –3.33 | |
|
Class Z | | 24.28 | | | –10.36 | | | –2.13 | |
|
S&P 500 Index3 | | 24.37 | | | –10.13 | | | –3.28 | |
|
Lipper Large-Cap Core Funds Avg.4 | | 20.86 | | | –12.31 | | | –4.18 | |
|
Past performance is not indicative of future results. Principal value and investment return will fluctuate so that an investor’s shares, when redeemed, may be worth more or less than their original cost. 1Source: Prudential Investments LLC and Lipper Inc. The cumulative total returns do not take into account applicable sales charges. The average annual total returns do take into account applicable sales charges. Without the distribution and service (12b-1) fee waiver of 0.05% for Class A shares annually, the returns would have been lower. The Fund charges a maximum front-end sales charge of 5% for Class A shares in most circumstances, and a 12b-1 fee of up to 0.30% annually. In some circumstances, Class A shares may not be subject to a front-end sales charge, but may be subject to a 1% contingent deferred sales charge (CDSC) for the first year. Class B shares are subject to a declining CDSC of 5%, 4%, 3%, 2%, 1%, and 1% for the first six years respectively after purchase, and a 12b-1 fee of 1% annually. Approximately seven years after purchase, Class B shares will automatically convert to Class A shares on a quarterly basis. Class C shares are subject to a front-end sales charge of 1%, a CDSC of 1% for shares redeemed within 18 months of purchase, and a 12b-1 fee of 1% annually. Class Z shares are not subject to a sales charge or 12b-1 fee. After-tax returns are calculated using the historical highest individual federal marginal income tax rates, and do not reflect the impact of state and local taxes. Actual after-tax returns depend on an investor’s tax situation and may differ from those shown. After-tax returns shown are not relevant to investors who hold their Fund shares through tax-deferred arrangements such as 401(k) plans or individual retirement accounts. After-tax returns are shown only for Class B shares. After-tax returns for other
| 2 | | Visit our website at www.jennisondryden.com |
share classes will vary due to differing sales charges and expenses. Past performance, before and after taxes, does not mean that the Fund will achieve similar results in the future. 2Inception date: 3/3/99. 3The Standard & Poor’s 500 Composite Stock Price Index (S&P 500 Index) is an unmanaged index of 500 stocks of large U.S. companies. It gives a broad look at how stock prices in the United States have performed. 4The Lipper Large-Cap Core Funds Average (Lipper Average) represents returns based on an average return of all funds in the Lipper Large-Cap Core Funds category for the periods noted. Funds in the Lipper Average invest at least 75% of their equity assets in companies with market capitalizations (on a three-year weighted basis) greater than 300% of the dollar-weighted median market capitalization of the middle 1,000 securities of the S&P SuperComposite 1500 Index. Lipper Large-Cap Core funds have wide latitude in the companies in which they invest. These funds typically have a below-average price-to-earnings ratio, price-to-book ratio, and three-year sales-per-share growth value compared to the S&P 500 Index. Investors cannot invest directly in an index. The returns for the S&P 500 Index and the Lipper Average would be lower if they included the effects of sales charges, operating expenses of a mutual fund, or taxes. Returns for the Lipper Average reflect the deduction of operating expenses, but not sales charges or taxes.
| |
| Five Largest Holdings expressed as a percentage of net assets as of 10/31/03 | | | |
Microsoft Corp., Computer Software & Services | | 3.0 | % |
|
Intel Corp., Semiconductors | | 3.0 | |
|
Wal-Mart Stores, Inc., Multiline Retail | | 2.7 | |
|
Citigroup, Inc., Financial Services | | 2.5 | |
|
General Electric Co., Industrial Conglomerates | | 2.5 | |
|
Holdings are subject to change.
| |
| Five Largest Industries expressed as a percentage of net assets as of 10/31/03 | | | |
Financial Services | | 11.9 | % |
|
Pharmaceuticals | | 8.2 | |
|
Computer Software & Services | | 6.0 | |
|
Banking | | 5.4 | |
|
Semiconductors | | 4.7 | |
|
Industry weightings are subject to change.
| Dryden Tax-Managed Funds/Dryden Large-Cap Core Equity Fund | | 3 |
Investment Adviser’s Report
Our quantitative tax-managed investment discipline
Quantitative methods. We use quantitative methods to select individual securities. This means that we rate the attractiveness of a stock with formulas that include its price, the company’s earnings, earnings growth, and a number of other variables. Our security selections are based upon objective data rather than judgments about companies’ business prospects. Usually, stocks of both fast- and slow-growing companies (the latter are often called value stocks) are represented in the Fund’s portfolio. We have found that no single group of selection criteria identifies winners and losers equally well within each style. Therefore, we apply different selection criteria to growth and value stocks.
We strive to keep the Fund’s return (before the deduction of Fund expenses) within a range of about plus or minus two percentage points of the return of the S&P 500 Index. We construct a portfolio that satisfies our risk control and tax management objectives while emphasizing highly rated stocks. We incorporate risk controls to limit the Fund’s deviations from the S&P 500 universe on many factors—such as industry profile or market capitalization (the value of the overall equity in the firm)—that can affect stock returns.
Tax management. We seek to reduce your tax liability while increasing the value of your investment. Changes in the market value of stocks in the Fund affect its net asset value and return, but have no tax consequences until the gain or loss is “locked in” by the sale of the shares. This is called “realizing” the gain or loss. We review our portfolio daily for stocks that have fallen in value. When appropriate, we may sell some of these shares to realize capital losses and search for stocks with a similar risk profile to purchase as substitutes. We try to maintain a tax-loss carry-forward—a net realized loss that can be subtracted from future gains.
Analysis of the period’s return
Over the Fund’s reporting period, the S&P 500 Index rose 20.79%, rebounding from three years of negative returns. The Fund’s Class A shares returned 21.57% (excluding sales charges), outperforming its benchmark by 0.78 percentage points.
During the Fund’s reporting period, the stocks that our methods rated high performed better than stocks that our methods rated low. The Fund’s high-growth stocks performed particularly well, notably positions in Cisco Systems (+87% for the 12 months ended October 31, 2003), Genentech (+140%), and Citrix Systems (+233%).
| 4 | | Visit our website at www.jennisondryden.com |
During the period, the Fund had, on average, more high-growth stocks than the benchmark S&P 500 Index and more stocks of companies whose capitalization levels were below the average capitalization of companies in the S&P 500 Index. Stocks with these high-growth and low-capitalization characteristics performed particularly well over this reporting period, so these overweights added to the Fund’s return.
Dryden Large-Cap Core Equity Fund Management Team
The Portfolio of Investments following this report shows the size of the Fund’s positions at period-end.
| Dryden Tax-Managed Funds/Dryden Large-Cap Core Equity Fund | | 5 |
This Page Intentionally Left Blank
Financial Statements
|
| OCTOBER 31, 2003 | | ANNUAL REPORT |
Dryden Large-Cap Core Equity Fund
Portfolio of Investments
as of October 31, 2003
| Shares | | Description | | Value (Note 1) |
| | | | | | |
LONG-TERM INVESTMENTS 99.6% | | | |
| |
COMMON STOCKS | | | |
| |
CONSUMER DISCRETIONARY 13.3% | | | |
| |
Auto & Truck 1.6% | | | |
|
| 11,400 | | AutoNation, Inc.(a) | | $ | 213,180 |
| 3,700 | | Dana Corp. | | | 60,236 |
| 93,400 | | Ford Motor Co.(b) | | | 1,132,942 |
| 34,700 | | General Motors Corp.(b) | | | 1,480,649 |
| 8,200 | | Gentex Corp.(b) | | | 320,210 |
| 2,800 | | Harley-Davidson, Inc.(b) | | | 132,748 |
| | | | |
|
|
| | | | | | 3,339,965 |
| |
Consumer Products 0.4% | | | |
|
| 13,800 | | Eastman Kodak Co. | | | 337,134 |
| 2,600 | | Fossil, Inc.(a) | | | 70,200 |
| 2,600 | | Kellwood Co. | | | 97,162 |
| 11,100 | | Mattel, Inc.(b) | | | 214,896 |
| 1,000 | | V.F. Corp. | | | 42,450 |
| | | | |
|
|
| | | | | | 761,842 |
| |
Hotels, Restaurants & Leisure 0.5% | | | |
|
| 800 | | Argosy Gaming Co.(a) | | | 19,040 |
| 8,900 | | Aztar Corp.(a)(b) | | | 185,832 |
| 1,400 | | Jack in the Box, Inc.(a) | | | 25,466 |
| 3,800 | | McDonald’s Corp. | | | 95,038 |
| 2,800 | | P.F. Chang’s China Bistro, Inc.(a) | | | 136,472 |
| 2,600 | | Papa John’s International, Inc.(a)(b) | | | 68,406 |
| 3,800 | | Park Place Entertainment Corp.(a) | | | 36,480 |
| 4,900 | | Station Casinos, Inc. | | | 145,775 |
| 10,000 | | Yum! Brands, Inc.(a) | | | 341,400 |
| | | | |
|
|
| | | | | | 1,053,909 |
| |
Housing Construction 0.7% | | | |
|
| 15,100 | | KB HOME | | | 1,034,199 |
| 4,700 | | Pulte Homes, Inc. | | | 406,597 |
| 4,500 | | WCI Communities, Inc.(a) | | | 98,100 |
| | | | |
|
|
| | | | | | 1,538,896 |
| |
Internet & Catalog Retail | | | |
|
| 300 | | Coldwater Creek, Inc.(a) | | | 3,714 |
See Notes to Financial Statements.
| 8 | | Visit our website at www.jennisondryden.com |
| Shares | | Description | | Value (Note 1) |
| | | | | | |
Media 3.4% | | | |
|
| 25,900 | | Clear Channel Communications, Inc.(b) | | $ | 1,057,238 |
| 14,300 | | Comcast Corp. (Class A)(a) | | | 485,056 |
| 68,000 | | Disney (Walt) Co.(b) | | | 1,539,520 |
| 7,100 | | Gannett Co., Inc. | | | 597,181 |
| 4,400 | | Knight-Ridder, Inc.(b) | | | 322,608 |
| 95,400 | | Time Warner, Inc.(a) | | | 1,458,666 |
| 1,900 | | Tribune Co. | | | 93,195 |
| 40,400 | | Viacom, Inc. (Class B) | | | 1,610,748 |
| | | | |
|
|
| | | | | | 7,164,212 |
| |
Multiline Retail 3.6% | | | |
|
| 1,400 | | Dollar General Corp. | | | 31,458 |
| 11,500 | | Federated Department Stores, Inc.(b) | | | 546,825 |
| 1,300 | | Kohl’s Corp.(a)(b) | | | 72,891 |
| 39,700 | | Limited Brands | | | 698,720 |
| 7,050 | | Rent-A-Center, Inc.(a) | | | 220,383 |
| 200 | | Sears, Roebuck & Co.(b) | | | 10,526 |
| 10,400 | | The May Department Stores Co.(b) | | | 290,784 |
| 1,400 | | Vans, Inc.(a) | | | 15,722 |
| 99,000 | | Wal-Mart Stores, Inc. | | | 5,836,050 |
| | | | |
|
|
| | | | | | 7,723,359 |
| |
Specialty Retail 3.1% | | | |
|
| 6,400 | | Bed Bath & Beyond, Inc.(a) | | | 270,336 |
| 25,300 | | Best Buy Co., Inc.(a) | | | 1,475,243 |
| 12,600 | | Coach, Inc.(a)(b) | | | 446,922 |
| 2,200 | | Concord Camera Corp.(a) | | | 28,248 |
| 10,900 | | Electronics Boutique Holdings Corp.(a) | | | 310,105 |
| 4,200 | | Harman International Industries, Inc. | | | 538,440 |
| 9,900 | | Hasbro, Inc. | | | 215,820 |
| 56,300 | | Home Depot, Inc. | | | 2,087,041 |
| 6,500 | | Liz Claiborne, Inc. | | | 239,785 |
| 10,000 | | Lowe’s Companies, Inc.(b) | | | 589,300 |
| 2,300 | | Marvel Enterprises, Inc.(a)(b) | | | 67,735 |
| 3,150 | | Pacific Sunwear of California, Inc.(a)(b) | | | 72,733 |
| 700 | | PETsMART, Inc. | | | 17,927 |
| 4,500 | | The Gap, Inc. | | | 85,860 |
| 8,200 | | The Yankee Candle Co., Inc.(a) | | | 229,436 |
| | | | |
|
|
| | | | | | 6,674,931 |
See Notes to Financial Statements.
| Dryden Tax-Managed Funds/Dryden Large-Cap Core Equity Fund | | 9 |
Portfolio of Investments
as of October 31, 2003 Cont’d.
| Shares | | Description | | Value (Note 1) |
| | | | | | |
CONSUMER STAPLES 7.7% | | | |
| |
Beverages 3.1% | | | |
|
| 36,300 | | Anheuser-Busch Cos., Inc. | | $ | 1,788,138 |
| 48,800 | | Coca-Cola Co. | | | 2,264,320 |
| 46,100 | | Pepsi Bottling Group, Inc. (The) | | | 1,027,569 |
| 600 | | PepsiAmericas, Inc. | | | 8,988 |
| 33,360 | | PepsiCo, Inc. | | | 1,595,275 |
| | | | |
|
|
| | | | | | 6,684,290 |
| |
Cosmetics & Soaps 2.6% | | | |
|
| 6,500 | | Avon Products, Inc.(b) | | | 441,740 |
| 1,500 | | Chattem, Inc.(a) | | | 22,005 |
| 2,000 | | Clorox Co. | | | 90,600 |
| 2,300 | | Colgate-Palmolive Co. | | | 122,337 |
| 15,000 | | Kimberly-Clark Corp. | | | 792,150 |
| 26,400 | | Procter & Gamble Co. | | | 2,594,856 |
| 46,100 | | The Gillette Co. | | | 1,470,590 |
| | | | |
|
|
| | | | | | 5,534,278 |
| |
Food & Drug Retailing 0.4% | | | |
|
| 14,900 | | Albertson’s, Inc. | | | 302,321 |
| 17,300 | | Kroger Co. (The)(a)(b) | | | 302,577 |
| 1,800 | | Safeway, Inc.(a) | | | 37,980 |
| 200 | | Sysco Corp. | | | 6,732 |
| 26,600 | | Winn-Dixie Stores, Inc.(b) | | | 215,194 |
| | | | |
|
|
| | | | | | 864,804 |
| |
Food Products 0.5% | | | |
|
| 6,900 | | General Mills, Inc. | | | 309,465 |
| 7,300 | | H.J. Heinz Co. | | | 257,909 |
| 1,800 | | International Multifoods Corp.(a) | | | 40,158 |
| 9,400 | | Kellogg Co. | | | 311,422 |
| 1,200 | | Sara Lee Corp. | | | 23,916 |
| 4,348 | | Tyson Foods, Inc. (Class A)(b) | | | 62,046 |
| | | | |
|
|
| | | | | | 1,004,916 |
| |
Tobacco 1.1% | | | |
|
| 25,400 | | Altria Group, Inc. | | | 1,181,100 |
| 22,800 | | R.J. Reynolds Tobacco Holdings, Inc.(b) | | | 1,095,084 |
| 600 | | Vector Group Ltd. | | | 9,450 |
| | | | |
|
|
| | | | | | 2,285,634 |
See Notes to Financial Statements.
| 10 | | Visit our website at www.jennisondryden.com |
| Shares | | Description | | Value (Note 1) |
| | | | | | |
ENERGY 5.0% | | | |
| |
Oil & Gas Exploration/Production 2.3% | | | |
|
| 2,300 | | Amerada Hess Corp. | | $ | 118,726 |
| 8,400 | | Anadarko Petroleum Corp.(b) | | | 366,408 |
| 2,400 | | Baker Hughes, Inc. | | | 67,824 |
| 1,600 | | BJ Services Co.(a) | | | 52,496 |
| 5,400 | | Burlington Resources, Inc.(b) | | | 262,656 |
| 26,100 | | ConocoPhillips | | | 1,491,615 |
| 14,500 | | Devon Energy Corp. | | | 703,250 |
| 400 | | Helmerich & Payne, Inc. | | | 10,604 |
| 11,500 | | Kinder Morgan, Inc. | | | 615,825 |
| 400 | | Marathon Oil Corp. | | | 11,828 |
| 17,500 | | Nabors Industries Ltd.(a) | | | 661,500 |
| 1,600 | | Occidental Petroleum Corp. | | | 56,416 |
| 7,600 | | Schlumberger Ltd. | | | 356,972 |
| 8,500 | | Tesoro Petroleum Corp.(a) | | | 96,900 |
| 2,100 | | TETRA Technologies, Inc.(a) | | | 47,481 |
| 2,600 | | Unit Corp.(a) | | | 50,414 |
| | | | |
|
|
| | | | | | 4,970,915 |
| |
Petroleum & Coal 2.7% | | | |
|
| 14,645 | | ChevronTexaco Corp. | | | 1,088,124 |
| 125,709 | | Exxon Mobil Corp. | | | 4,598,435 |
| | | | |
|
|
| | | | | | 5,686,559 |
| |
FINANCIALS 21.6% | | | |
| |
Banking 5.4% | | | |
|
| 43,400 | | Bank of America Corp. | | | 3,286,682 |
| 12,200 | | BB&T Corp. | | | 471,774 |
| 18,130 | | FleetBoston Financial Corp. | | | 732,271 |
| 5,900 | | Golden West Financial Corp. | | | 592,537 |
| 2,800 | | Huntington Bancshares, Inc. | | | 60,648 |
| 31,900 | | New York Community Bancorp, Inc.(b) | | | 1,154,780 |
| 14,600 | | PNC Financial Services Group | | | 782,122 |
| 7,900 | | Popular, Inc. | | | 355,500 |
| 2,800 | | Regions Financial Corp. | | | 102,900 |
| 10,500 | | SouthTrust Corp. | | | 334,425 |
| 4,300 | | SunTrust Banks, Inc.(b) | | | 288,401 |
| 52,091 | | U.S. Bancorp | | | 1,417,917 |
| 200 | | Union Planters Corp. | | | 6,654 |
| 32,800 | | Wells Fargo & Co. | | | 1,847,296 |
See Notes to Financial Statements.
| Dryden Tax-Managed Funds/Dryden Large-Cap Core Equity Fund | | 11 |
Portfolio of Investments
as of October 31, 2003 Cont’d.
| Shares | | Description | | Value (Note 1) |
| 1,300 | | Zions Bancorp. | | $ | 79,677 |
| | | | |
|
|
| | | | | | 11,513,584 |
| |
Financial Services 11.9% | | | |
|
| 600 | | A.G. Edwards, Inc. | | | 24,300 |
| 1,400 | | Affiliated Managers Group, Inc.(a) | | | 101,500 |
| 1,000 | | Allied Capital Corp.(b) | | | 24,850 |
| 16,500 | | American Express Co. | | | 774,345 |
| 46,400 | | Bank One Corp. | | | 1,969,680 |
| 113,800 | | Citigroup, Inc. | | | 5,394,120 |
| 2,600 | | Countrywide Credit Industries, Inc.(b) | | | 273,312 |
| 4,600 | | Deluxe Corp. | | | 185,702 |
| 300 | | Doral Financial Corp. | | | 15,150 |
| 8,600 | | Fannie Mae | | | 616,534 |
| 8,200 | | Federated Investors, Inc. (Class B) | | | 226,730 |
| 500 | | First Tennessee National Corp. | | | 22,680 |
| 17,400 | | Goldman Sachs Group, Inc. (The) | | | 1,633,860 |
| 73,620 | | J.P. Morgan Chase & Co. | | | 2,642,958 |
| 13,100 | | John Hancock Financial Services, Inc. | | | 463,085 |
| 15,100 | | Lehman Brothers Holdings, Inc. | | | 1,087,200 |
| 8,300 | | MBNA Corp. | | | 205,425 |
| 19,700 | | Merrill Lynch & Co., Inc. | | | 1,166,240 |
| 6,400 | | Moody’s Corp. | | | 370,112 |
| 18,900 | | Morgan Stanley | | | 1,037,043 |
| 31,300 | | National City Corp. | | | 1,022,258 |
| 6,800 | | New Century Financial Corp.(b) | | | 252,144 |
| 27,900 | | SLM Corp. | | | 1,092,564 |
| 8,100 | | The Bear Stearns Cos., Inc. | | | 617,625 |
| 47,000 | | Wachovia Corp.(d) | | | 2,155,890 |
| 42,975 | | Washington Mutual, Inc. | | | 1,880,156 |
| | | | |
|
|
| | | | | | 25,255,463 |
| |
Insurance 4.1% | | | |
|
| 4,000 | | ACE Ltd. | | | 144,000 |
| 2,500 | | AFLAC, Inc.(b) | | | 91,200 |
| 25,000 | | Allstate Corp. | | | 987,500 |
| 1,000 | | American Financial Group, Inc. | | | 22,270 |
| 47,996 | | American International Group, Inc. | | | 2,919,597 |
| 400 | | AmerUs Group Co.(b) | | | 15,100 |
| 2,200 | | Brown & Brown, Inc. | | | 66,990 |
| 27,600 | | MetLife, Inc. | | | 866,640 |
| 500 | | Odyssey Re Holdings Corp. | | | 10,490 |
| 1,000 | | Old Republic International Corp. | | | 35,940 |
See Notes to Financial Statements.
| 12 | | Visit our website at www.jennisondryden.com |
| Shares | | Description | | Value (Note 1) |
| | | | | | |
| 35,500 | | Principal Financial Group, Inc. | | $ | 1,112,925 |
| 15,000 | | SAFECO Corp. | | | 550,500 |
| 2,700 | | St. Paul Cos., Inc. (The) | | | 102,951 |
| 97,800 | | Travelers Property Casualty Corp. (Class B) | | | 1,600,986 |
| 9,900 | | UnumProvident Corp. | | | 162,063 |
| | | | |
|
|
| | | | | | 8,689,152 |
| |
Real Estate Investment Trusts 0.2% | | | |
|
| 16,200 | | Equity Office Properties Trust | | | 453,762 |
| 2,900 | | National Health Investors, Inc. | | | 61,625 |
| | | | |
|
|
| | | | | | 515,387 |
| |
HEALTHCARE 13.6% | | | |
| |
Biotechnology 1.3% | | | |
|
| 600 | | Affymetrix, Inc.(a) | | | 15,378 |
| 39,180 | | Amgen, Inc.(a) | | | 2,419,757 |
| 6,500 | | Celgene Corp.(a) | | | 270,985 |
| 1,000 | | Cephalon, Inc.(a) | | | 46,960 |
| | | | |
|
|
| | | | | | 2,753,080 |
| |
Healthcare Equipment & Supplies 2.5% | | | |
|
| 24,200 | | Becton, Dickinson & Co. | | | 884,752 |
| 4,500 | | Boston Scientific Corp.(a)(b) | | | 304,740 |
| 5,200 | | C.R. Bard, Inc. | | | 416,260 |
| 11,600 | | Cytyc Corp.(a) | | | 149,988 |
| 6,200 | | Gen-Probe, Inc.(a) | | | 165,974 |
| 13,600 | | Guidant Corp. | | | 693,736 |
| 500 | | Hillenbrand Industries, Inc.(b) | | | 29,765 |
| 400 | | McKesson Corp.(b) | | | 12,108 |
| 14,100 | | Medtronic, Inc. | | | 642,537 |
| 400 | | PSS World Medical, Inc.(a) | | | 3,728 |
| 800 | | Respironics, Inc.(a) | | | 33,352 |
| 23,800 | | Stryker Corp.(b) | | | 1,930,418 |
| | | | |
|
|
| | | | | | 5,267,358 |
| | | | | | |
| |
Healthcare Providers & Services 1.6% | | | |
|
| 11,100 | | AdvancePCS(a) | | | 571,317 |
| 5,900 | | Aetna, Inc. | | | 338,719 |
| 15,300 | | Anthem, Inc.(a)(b) | | | 1,046,979 |
| 3,600 | | Bally Total Fitness Holding Corp.(a) | | | 23,976 |
| 400 | | First Health Group Corp.(a) | | | 9,764 |
| 12,500 | | Humana, Inc.(a) | | | 253,625 |
See Notes to Financial Statements.
| Dryden Tax-Managed Funds/Dryden Large-Cap Core Equity Fund | | 13 |
Portfolio of Investments
as of October 31, 2003 Cont’d.
| Shares | | Description | | Value (Note 1) |
| 5,000 | | LifePoint Hospitals, Inc.(a) | | $ | 128,550 |
| 11,100 | | Lincare Holdings, Inc.(a)(b) | | | 432,234 |
| 300 | | UnitedHealth Group, Inc. | | | 15,264 |
| 800 | | Universal Health Services, Inc. (Class B)(a) | | | 37,640 |
| 6,900 | | WellPoint Health Networks, Inc.(a) | | | 613,410 |
| | | | |
|
|
| | | | | | 3,471,478 |
| |
Pharmaceuticals 8.2% | | | |
|
| 24,100 | | Abbott Laboratories | | | 1,027,142 |
| 22,400 | | Baxter International, Inc. | | | 595,392 |
| 75,600 | | Bristol-Myers Squibb Co. | | | 1,917,972 |
| 2,600 | | IMS Health, Inc. | | | 61,178 |
| 73,504 | | Johnson & Johnson(b) | | | 3,699,456 |
| 8,400 | | Ligand Pharmaceuticals, Inc. (Class B)(a) | | | 115,752 |
| 10,000 | | Lilly Eli & Co. | | | 666,200 |
| 71,100 | | Merck & Co., Inc. | | | 3,146,175 |
| 138,435 | | Pfizer, Inc. | | | 4,374,546 |
| 41,300 | | Wyeth | | | 1,822,982 |
| | | | |
|
|
| | | | | | 17,426,795 |
| |
INDUSTRIALS 11.8% | | | |
| |
Aerospace/Defense 1.9% | | | |
|
| 1,800 | | General Dynamics Corp. | | | 150,660 |
| 1,900 | | Herley Industries, Inc.(a) | | | 35,910 |
| 3,200 | | Honeywell International, Inc. | | | 97,952 |
| 19,800 | | Lockheed Martin Corp. | | | 917,928 |
| 16,200 | | Northrop Grumman Corp. | | | 1,448,280 |
| 16,900 | | United Technologies Corp. | | | 1,431,261 |
| | | | |
|
|
| | | | | | 4,081,991 |
| |
Airlines 0.1% | | | |
|
| 7,500 | | ExpressJet Holdings, Inc.(a)(b) | | | 114,750 |
| |
Building Products 0.4% | | | |
|
| 32,100 | | Masco Corp. | | | 882,750 |
| | | | | | |
| |
Business Services 1.1% | | | |
|
| 11,625 | | Apollo Group, Inc. (Class A)(a) | | | 738,536 |
| 49,500 | | Cendant Corp.(a)(b) | | | 1,011,285 |
| 22,900 | | Convergys Corp.(a) | | | 367,774 |
| 3,300 | | Paychex, Inc. | | | 128,436 |
| 1,200 | | The Corporate Executive Board Co.(a) | | | 61,212 |
| | | | |
|
|
| | | | | | 2,307,243 |
See Notes to Financial Statements.
| 14 | | Visit our website at www.jennisondryden.com |
| Shares | | Description | | Value (Note 1) |
Data Processing/Management 0.3% | | | |
|
| 2,600 | | Acxiom Corp.(a) | | $ | 41,340 |
| 400 | | Automatic Data Processing, Inc. | | | 15,096 |
| 13,600 | | First Data Corp.(b) | | | 485,520 |
| 4,600 | | Mercury Computer Systems, Inc.(a) | | | 98,946 |
| | | | |
|
|
| | | | | | 640,902 |
| |
Diversified Manufacturing Operations 0.7% | | | |
|
| 5,400 | | Crane Co. | | | 151,740 |
| 12,900 | | Danaher Corp.(b) | | | 1,068,765 |
| 1,100 | | Roper Industries, Inc. | | | 54,362 |
| 5,400 | | Trinity Industries, Inc. | | | 137,430 |
| | | | |
|
|
| | | | | | 1,412,297 |
| |
Electrical Equipment 0.6% | | | |
|
| 5,800 | | Acuity Brands, Inc. | | | 124,700 |
| 200 | | Encore Wire Corp.(a) | | | 3,372 |
| 31,400 | | Energizer Holdings, Inc.(a)(b) | | | 1,155,520 |
| | | | |
|
|
| | | | | | 1,283,592 |
| |
Financial/Business Services 0.4% | | | |
|
| 18,900 | | Block (H&R), Inc.(b) | | | 890,001 |
| 2,200 | | John H. Harland Co. | | | 59,906 |
| | | | |
|
|
| | | | | | 949,907 |
| |
Industrial Conglomerates 4.3% | | | |
|
| 24,900 | | 3M Co. | | | 1,963,863 |
| 182,200 | | General Electric Co. | | | 5,285,622 |
| 94,200 | | Tyco International Ltd.(b) | | | 1,966,896 |
| | | | |
|
|
| | | | | | 9,216,381 |
| | | | | | |
| |
Machinery 0.3% | | | |
|
| 5,700 | | Caterpillar, Inc. | | | 417,696 |
| 4,100 | | Graco, Inc. | | | 156,210 |
| | | | |
|
|
| | | | | | 573,906 |
| |
Miscellaneous Basic Industry | | | |
|
| 2,100 | | HON INDUSTRIES, Inc. | | | 86,100 |
| |
Railroads 0.1% | | | |
|
| 2,600 | | Union Pacific Corp. | | | 162,760 |
See Notes to Financial Statements.
| Dryden Tax-Managed Funds/Dryden Large-Cap Core Equity Fund | | 15 |
Portfolio of Investments
as of October 31, 2003 Cont’d.
| Shares | | Description | | Value (Note 1) |
Schools 0.2% | | | |
|
| 2,900 | | Education Management Corp.(a) | | $ | 183,222 |
| 2,100 | | ITT Educational Services, Inc.(a)(b) | | | 104,580 |
| 1,200 | | Sylvan Learning Systems, Inc.(a) | | | 33,960 |
| | | | |
|
|
| | | | | | 321,762 |
| |
Transportation 1.4% | | | |
|
| 4,000 | | FedEx Corp. | | | 303,040 |
| 21,400 | | J.B. Hunt Transport Services, Inc.(a)(b) | | | 543,132 |
| 9,000 | | Ryder System, Inc. | | | 270,000 |
| 26,600 | | United Parcel Service, Inc. (Class B)(b) | | | 1,929,032 |
| | | | |
|
|
| | | | | | 3,045,204 |
| |
INFORMATION TECHNOLOGY 18.2% | | | |
| |
Communications Equipment 2.3% | | | |
|
| 213,100 | | Cisco Systems, Inc.(a) | | | 4,470,838 |
| 200 | | Inet Technologies, Inc.(a) | | | 2,690 |
| 2,400 | | Plantronics, Inc.(a)(b) | | | 66,744 |
| 7,700 | | Polycom, Inc.(a) | | | 154,231 |
| 3,800 | | UTStarcom, Inc.(a) | | | 119,700 |
| | | | |
|
|
| | | | | | 4,814,203 |
| |
Computers 3.7% | | | |
|
| 38,300 | | Dell, Inc.(a)(b) | | | 1,383,396 |
| 53,150 | | Hewlett-Packard Co. | | | 1,185,776 |
| 48,000 | | International Business Machines Corp. | | | 4,295,040 |
| 11,900 | | Lexmark International, Inc.(a)(b) | | | 875,959 |
| 5,300 | | Seagate Technology, Inc.(a) | | | 0 |
| 24,000 | | Sun Microsystems, Inc.(a) | | | 95,040 |
| | | | |
|
|
| | | | | | 7,835,211 |
| | | | | | |
| |
Computer Software & Services 6.0% | | | |
|
| 900 | | Advent Software, Inc.(a) | | | 16,479 |
| 300 | | BARRA, Inc.(a) | | | 11,400 |
| 32,000 | | Citrix Systems, Inc.(a) | | | 808,960 |
| 1,000 | | Computer Associates International, Inc.(b) | | | 23,520 |
| 4,700 | | DST Systems, Inc.(a) | | | 177,754 |
| 5,200 | | Electronic Arts, Inc.(a) | | | 515,008 |
| 600 | | Electronics for Imaging, Inc.(a)(b) | | | 16,260 |
| 88,500 | | EMC Corp.(a)(b) | | | 1,224,840 |
| 21,900 | | Intuit, Inc.(a) | | | 1,094,562 |
See Notes to Financial Statements.
| 16 | | Visit our website at www.jennisondryden.com |
| Shares | | Description | | Value (Note 1) |
| 700 | | Keane, Inc.(a) | | $ | 9,198 |
| 241,300 | | Microsoft Corp. | | | 6,309,995 |
| 185,400 | | Oracle Corp.(a) | | | 2,217,384 |
| 1,300 | | Symantec Corp.(a) | | | 86,645 |
| 34,000 | | Xerox Corp.(a)(b) | | | 357,000 |
| | | | |
|
|
| | | | | | 12,869,005 |
| |
Electronic Components 0.8% | | | |
|
| 1,500 | | Mentor Graphics Corp.(a) | | | 25,125 |
| 35,100 | | Texas Instruments, Inc. | | | 1,015,092 |
| 18,400 | | Waters Corp.(a) | | | 578,312 |
| | | | |
|
|
| | | | | | 1,618,529 |
| |
Internet 0.6% | | | |
|
| 30,700 | | Yahoo!, Inc.(a) | | | 1,341,590 |
| |
IT Consulting & Services 0.1% | | | |
|
| 5,000 | | CDW Corp. | | | 300,250 |
| 200 | | Digital Insight Corp.(a) | | | 4,196 |
| | | | |
|
|
| | | | | | 304,446 |
| |
Semiconductors 4.7% | | | |
|
| 49,800 | | Altera Corp.(a) | | | 1,007,454 |
| 2,400 | | Amkor Technology, Inc.(a) | | | 45,240 |
| 10,600 | | Analog Devices, Inc.(a)(b) | | | 469,898 |
| 7,500 | | Cypress Semiconductor Corp.(a)(b) | | | 160,950 |
| 190,200 | | Intel Corp. | | | 6,286,110 |
| 33,600 | | Linear Technology Corp.(b) | | | 1,431,696 |
| 14,200 | | Micron Technology, Inc.(a)(b) | | | 203,628 |
| 17,900 | | PMC-Sierra, Inc.(a) | | | 325,243 |
| | | | |
|
|
| | | | | | 9,930,219 |
| | | | | | |
| |
MATERIALS 2.3% | | | |
| |
Chemicals 0.6% | | | |
|
| 300 | | Cytec Industries, Inc.(a) | | | 10,473 |
| 7,200 | | Hercules, Inc.(a)(b) | | | 75,240 |
| 40,600 | | Monsanto Co.(b) | | | 1,017,030 |
| 2,200 | | OM Group, Inc.(a) | | | 39,380 |
| 13,000 | | RPM International, Inc. | | | 187,850 |
| | | | |
|
|
| | | | | | 1,329,973 |
See Notes to Financial Statements.
| Dryden Tax-Managed Funds/Dryden Large-Cap Core Equity Fund | | 17 |
Portfolio of Investments
as of October 31, 2003 Cont’d.
| Shares | | Description | | Value (Note 1) |
Containers & Packaging 0.5% | | | |
|
| 3,000 | | Ball Corp. | | $ | 168,600 |
| 42,700 | | Pactiv Corp.(a) | | | 941,535 |
| | | | |
|
|
| | | | | | 1,110,135 |
| |
Metals & Mining 0.9% | | | |
|
| 8,000 | | Alcoa, Inc. | | | 252,560 |
| 35,900 | | Newmont Mining Corp. | | | 1,571,702 |
| | | | |
|
|
| | | | | | 1,824,262 |
| |
Paper & Packaging 0.3% | | | |
|
| 28,100 | | Louisiana-Pacific Corp.(a) | | | 534,462 |
| |
TELECOMMUNICATION SERVICES 4.1% | | | |
| |
Diversified Telecommunication Services 2.8% | | | |
|
| 300 | | ALLTEL Corp. | | | 14,181 |
| 48,400 | | AT&T Corp.(b) | | | 899,756 |
| 85,500 | | BellSouth Corp. | | | 2,249,505 |
| 27,669 | | SBC Communications, Inc. | | | 663,503 |
| 28,500 | | Sprint Corp. (Fon Group)(b) | | | 456,000 |
| 50,796 | | Verizon Communications, Inc. | | | 1,706,745 |
| | | | |
|
|
| | | | | | 5,989,690 |
| |
Wireless Telecommunication Services 1.3% | | | |
|
| 126,500 | | AT&T Wireless Services, Inc.(a) | | | 917,125 |
| 3,100 | | Crown Castle International Corp.(a) | | | 39,246 |
| 69,300 | | Nextel Communications, Inc. (Class A)(a)(b) | | | 1,677,060 |
| 1,600 | | Nextel Partners, Inc. (Class A)(a) | | | 19,232 |
| | | | |
|
|
| | | | | | 2,652,663 |
| | | | | | |
| |
UTILITIES 2.0% | | | |
| |
Electric Utilities 1.4% | | | |
|
| 20,200 | | Alliant Energy Corp.(b) | | | 486,012 |
| 1,200 | | Dominion Resources, Inc. | | | 73,920 |
| 41,000 | | Edison International(a)(b) | | | 808,110 |
| 18,288 | | Exelon Corp. | | | 1,160,374 |
| 3,100 | | FirstEnergy Corp. | | | 106,609 |
| 11,200 | | PPL Corp. | | | 447,104 |
| | | | |
|
|
| | | | | | 3,082,129 |
| |
Gas Utilities 0.6% | | | |
|
| 13,800 | | NiSource, Inc.(b) | | | 285,798 |
See Notes to Financial Statements.
| 18 | | Visit our website at www.jennisondryden.com |
| Shares | | Description | | Value (Note 1) | |
| 7,300 | | Praxair, Inc. | | $ | 507,934 | |
| 13,600 | | Sempra Energy | | | 378,080 | |
| | | | |
|
|
|
| | | | | | 1,171,812 | |
| |
Water Utilities | | | | |
|
| 600 | | American States Water Co. | | | 14,700 | |
| | | | |
|
|
|
| | | Total long-term investments (cost $181,939,240) | | | 211,687,095 | |
| | | | |
|
|
|
SHORT-TERM INVESTMENTS 18.2% | | | | |
| |
Mutual Fund 18.0% | | | | |
|
| | | Dryden Core Investment Fund - Taxable Money Market Series(c) | | | | |
| 38,316,354 | | (cost $38,316,354; Note 3) | | | 38,316,354 | |
Principal Amount (000) | | | |
| |
Repurchase Agreement 0.2% | | | | |
|
| | | Joint Repurchase Agreement Account, 1.07%, 11/3/03 | | | | |
| $ 303 | | (cost $303,000; Note 6) | | | 303,000 | |
| | | | |
|
|
|
| | | Total short-term investments
(cost $38,619,354) | | | 38,619,354 | |
| | | | |
|
|
|
| | | Total Investments 117.8%
(cost $220,558,594; Note 5) | | | 250,306,449 | |
| | | Liabilities in excess of other assets (17.8%) | | | (37,732,707 | ) |
| | | | |
|
|
|
| | | Net Assets 100% | | $ | 212,573,742 | |
| | | | |
|
|
|
| (a) | Non-income producing security. |
| (b) | Securities, or portion thereof, on loan, see Note 4. |
| (c) | Represents security purchased with cash collateral received for securities on loan; see Note 4. |
See Notes to Financial Statements.
| Dryden Tax-Managed Funds/Dryden Large-Cap Core Equity Fund | | 19 |
Statement of Assets and Liabilities
as of October 31, 2003
Assets | | | | |
|
Investments, at value, including securities on loan of $36,694,040 (cost $220,558,594) | | $ | 250,306,449 | |
Receivable for investments sold | | | 4,235,816 | |
Dividends and interest receivable | | | 271,098 | |
Receivable for Fund shares sold | | | 200,509 | |
Prepaid expenses and other assets | | | 2,104 | |
| | |
|
|
|
Total assets | | | 255,015,976 | |
| | |
|
|
|
| |
Liabilities | | | | |
|
Payable to broker for collateral for securities on loan (Note 4) | | | 38,164,559 | |
Payable for investments purchased | | | 3,570,836 | |
Payable for Fund shares reacquired | | | 246,389 | |
Accrued expenses | | | 200,179 | |
Distribution fee payable | | | 140,744 | |
Management fee payable | | | 116,454 | |
Payable to custodian | | | 3,073 | |
| | |
|
|
|
Total liabilities | | | 42,442,234 | |
| | |
|
|
|
| |
Net Assets | | $ | 212,573,742 | |
| | |
|
|
|
Net assets were comprised of: | | | | |
Shares of beneficial interest, at par | | $ | 23,008 | |
Paid-in capital in excess of par | | | 264,606,250 | |
| | |
|
|
|
| | | | 264,629,258 | |
Accumulated net realized loss on investments | | | (81,803,371 | ) |
Net unrealized appreciation on investments | | | 29,747,855 | |
| | |
|
|
|
| |
Net assets, October 31, 2003 | | $ | 212,573,742 | |
| | |
|
|
|
See Notes to Financial Statements.
| 20 | | Visit our website at www.jennisondryden.com |
Class A | | | |
|
Net asset value and redemption price per share | | | |
($51,026,466 ÷ 5,390,508 shares of beneficial interest issued and outstanding) | | $ | 9.47 |
Maximum sales charge (5% of offering price) | | | .50 |
| | |
|
|
Maximum offering price to public | | $ | 9.97 |
| | |
|
|
| |
Class B | | | |
|
Net asset value, offering price and redemption price per share | | | |
($99,237,091 ÷ 10,844,156 shares of beneficial interest issued and outstanding) | | $ | 9.15 |
| | |
|
|
| |
Class C | | | |
|
Net asset value and redemption price per share | | | |
($55,112,367 ÷ 6,022,517 shares of beneficial interest issued and outstanding) | | $ | 9.15 |
Sales charge (1% of offering price) | | | .09 |
| | |
|
|
Offering price to public | | $ | 9.24 |
| | |
|
|
| |
Class Z | | | |
|
Net asset value, offering price and redemption price per share | | | |
($7,197,818 ÷ 750,515 shares of beneficial interest issued and outstanding) | | $ | 9.59 |
| | |
|
|
See Notes to Financial Statements.
| Dryden Tax-Managed Funds/Dryden Large-Cap Core Equity Fund | | 21 |
Statement of Operations
Year Ended October 31, 2003
Net Investment Loss | | | | |
|
Income | | | | |
Dividends (net of foreign withholding taxes of $377) | | $ | 3,390,284 | |
Income from securities loaned, net | | | 16,831 | |
Interest | | | 7,640 | |
| | |
|
|
|
Total income | | | 3,414,755 | |
| | |
|
|
|
| |
Expenses | | | | |
Management fee | | | 1,328,551 | |
Distribution fee—Class A | | | 122,031 | |
Distribution fee—Class B | | | 959,249 | |
Distribution fee—Class C | | | 526,744 | |
Transfer agent’s fees and expenses | | | 245,000 | |
Custodian’s fees and expenses | | | 166,000 | |
Reports to shareholders | | | 66,000 | |
Registration fees | | | 40,000 | |
Audit fee | | | 28,000 | |
Legal fees and expenses | | | 25,000 | |
Trustees’ fees | | | 16,000 | |
Miscellaneous | | | 6,921 | |
| | |
|
|
|
Total expenses | | | 3,529,496 | |
| | |
|
|
|
Net investment loss | | | (114,741 | ) |
| | |
|
|
|
| |
Realized And Unrealized Gain (Loss) On Investments | | | | |
|
Net realized loss on investment transactions | | | (9,589,709 | ) |
Net change in unrealized appreciation on investments | | | 48,262,756 | |
| | |
|
|
|
Net gain on investments | | | 38,673,047 | |
| | |
|
|
|
Net Increase In Net Assets Resulting From Operations | | $ | 38,558,306 | |
| | |
|
|
|
See Notes to Financial Statements.
| 22 | | Visit our website at www.jennisondryden.com |
Statement of Changes in Net Assets
| |
| | | Year Ended October 31,
| |
| | | 2003 | | | 2002 | |
Increase (Decrease) In Net Assets | | | | | | | | |
|
Operations | | | | | | | | |
Net investment loss | | $ | (114,741 | ) | | $ | (639,251 | ) |
Net realized loss on investments | | | (9,589,709 | ) | | | (10,832,007 | ) |
Net change in unrealized appreciation (depreciation) on investments | | | 48,262,756 | | | | (26,433,361 | ) |
| | |
|
|
| |
|
|
|
Net increase (decrease) in net assets resulting from operations | | | 38,558,306 | | | | (37,904,619 | ) |
| | |
|
|
| |
|
|
|
| | |
Fund share transactions (net of share conversions) (Note 7) | | | | | | | | |
Net proceeds from shares sold | | | 15,961,594 | | | | 25,809,770 | |
Cost of shares reacquired | | | (52,411,251 | ) | | | (90,556,074 | ) |
| | |
|
|
| |
|
|
|
Net decrease in net assets from Fund share transactions | | | (36,449,657 | ) | | | (64,746,304 | ) |
| | |
|
|
| |
|
|
|
Total increase (decrease) | | | 2,108,649 | | | | (102,650,923 | ) |
| | |
Net Assets | | | | | | | | |
|
Beginning of year | | | 210,465,093 | | | | 313,116,016 | |
| | |
|
|
| |
|
|
|
End of year | | $ | 212,573,742 | | | $ | 210,465,093 | |
| | |
|
|
| |
|
|
|
See Notes to Financial Statements.
| Dryden Tax-Managed Funds/Dryden Large-Cap Core Equity Fund | | 23 |
Notes to Financial Statements
Dryden Large-Cap Core Equity Fund (the “Fund”), formerly known as Dryden Tax-Managed Equity Fund, is a series of Dryden Tax-Managed Funds (the “Trust”), which is registered under the Investment Company Act of 1940 as a diversified, open-end management investment company. The Trust was incorporated as a business trust in Delaware on September 18, 1998. The Fund commenced investment operations on March 3, 1999.
The Fund’s investment objective is to seek long-term after-tax growth of capital. It invests in a portfolio of equity-related securities, such as common stock and convertible securities of U.S. companies.
Note 1. Accounting Policies
The following is a summary of significant accounting policies followed by the Fund in the preparation of its financial statements.
Securities Valuation: Securities listed on a securities exchange are valued at the last sale price on such exchange on the day of valuation or, if there was no sale on such day, at the mean between the last reported bid and asked prices, or at the last bid price on such day in the absence of an asked price. Securities traded via Nasdaq are valued at the official closing price as provided by Nasdaq. Securities that are actively traded in the over-the-counter market, including listed securities for which the primary market is believed by Prudential Investments LLC (“PI” or “Manager”), in consultation with the subadviser, to be over-the-counter, are valued at market value using prices provided by an independent pricing agent or principal market maker. Futures contracts and options thereon traded on a commodities exchange or board of trade are valued at the last sale price at the close of trading on such exchange or board of trade or, if there was no sale on the applicable commodities exchange or board of trade on such day, at the mean between the most recently quoted prices on such exchange or board of trade or at the last bid price in the absence of an asked price. Prices may be obtained from independent pricing services which use information provided by market makers or estimates of market values obtained from yield data relating to investments or securities with similar characteristics. Securities for which reliable market quotations are not readily available, or whose values have been affected by events occurring after the close of the security’s foreign market and before the fund’s normal pricing time, are valued at fair value in accordance with Board of Trustees’ approved fair valuation procedures.
Investments in mutual funds are valued at their net asset value as of the close of the New York Stock Exchange on the date of valuation.
| 24 | | Visit our website at www.jennisondryden.com |
Short-term securities which mature in 60 days or less are valued at amortized cost, which approximates market value. The amortized cost method includes valuing a security at its cost on the date of purchase and thereafter assuming a constant amortization to maturity of the difference between the principal amount due at maturity and cost. Short-term securities which mature in more than 60 days are valued at current market quotations.
Repurchase Agreements: In connection with transactions in repurchase agreements with United States financial institutions, it is the Fund’s policy that its custodian or designated subcustodians under triparty repurchase agreements, as the case may be, take possession of the underlying collateral securities, the value of which exceeds the principal amount of the repurchase transaction including accrued interest. To the extent that any repurchase transaction exceeds one business day, the value of the collateral is marked to market on a daily basis to ensure the adequacy of the collateral. If the seller defaults and the value of the collateral declines or if bankruptcy proceedings are commenced with respect to the seller of the security, realization of the collateral by the Fund may be delayed or limited.
Securities Lending: The Fund may lend its portfolio securities to broker-dealers. The loans are secured by collateral at least equal at all times to the market value of the securities loaned. Loans are subject to termination at the option of the borrower or the Fund. Upon termination of the loan, the borrower will return to the lender securities identical to the loaned securities. Should the borrower of the securities fail financially, the Fund has the right to repurchase the securities using the collateral in the open market. The Fund recognizes income, net of any rebate and securities lending agent fees, for lending its securities in the form of fees or interest on the investment of any cash received as collateral. The Fund also continues to receive interest and dividends or amounts equivalent thereto, on the securities loaned and recognizes any unrealized gain or loss in the market price of the securities loaned that may occur during the term of the loan.
Securities Transactions and Net Investment Income: Securities transactions are recorded on the trade date. Realized gains or losses on sales of securities are calculated on an identified cost basis. Dividend income is recorded on the ex-dividend date and interest income, including amortization of premium and accretion of discount on debt securities, as required, is recorded on an accrual basis. Expenses are recorded on an accrual basis which may require the use of certain estimates by management.
Net investment income or loss (other than distribution fees which are charged directly to the respective class) and unrealized and realized gains or losses are allocated daily
| Dryden Tax-Managed Funds/Dryden Large-Cap Core Equity Fund | | 25 |
Notes to Financial Statements
Cont’d
to each class of shares based upon the relative proportion of net assets of each class at the beginning of the day.
Dividends and Distributions: The Fund expects to pay dividends of net investment income and distributions of net realized capital gains, if any, annually. Dividends and distributions to shareholders, which are determined in accordance with federal income tax regulations and which may differ from generally accepted accounting principles, are recorded on the ex-dividend date.
Taxes: For federal income tax purpose, it is the Fund’s policy to continue to meet the requirements of the Internal Revenue Code applicable to regulated investment companies and to distribute all of its taxable net investment income and capital gains, if any, to shareholders. Therefore, no federal income tax provision is required.
Withholding taxes on foreign dividends are recorded net of reclaimable amounts, at the time related income is earned.
Note 2. Agreements
The Trust has a management agreement for the Fund with PI. Pursuant to this agreement, PI has responsibility for all investment advisory services and supervises the subadvisor’s performance of such services. PI has entered into a subadvisory agreement with Prudential Investment Management, Inc. (“PIM”). The subadvisory agreement provides that PIM furnishes investment advisory services in connection with the management of the Fund. PI pays for the services of PIM, the cost of compensation of officers of the Fund, occupancy and certain clerical and bookkeeping costs of the Fund. The Fund bears all other costs and expenses.
The management fee paid to PI is computed daily and payable monthly at an annual rate of .65 of 1% of the average daily net assets of the Fund up to and including $500 million and .60 of 1% of such assets in excess of $500 million.
The Trust has a distribution agreement with Prudential Investment Management Services LLC (“PIMS”), which acts as the distributor of the Class A, Class B, Class C and Class Z shares of the Fund. The Fund compensates PIMS for distributing and servicing the Fund’s Class A, Class B and Class C shares, pursuant to plans of distribution (the “Class A, B and C Plans”), regardless of expenses actually incurred. The distribution fees are accrued daily and payable monthly. No distribution or service fees are paid to PIMS as distributor of the Class Z shares of the Fund.
| 26 | | Visit our website at www.jennisondryden.com |
Pursuant to the Class A, B and C Plans, the Fund compensates PIMS for distribution-related activities at an annual rate of up to .30 of 1%, 1% and 1%, of the average daily net assets of the Class A, B and C shares, respectively. For the year ended October 31, 2003, PIMS contractually agreed to limit such fees to .25 of 1% of the average daily net assets of the Class A shares.
PIMS has advised the Fund that it received approximately $59,600 and $24,800 in front-end sales charges resulting from sales of Class A and Class C shares, respectively, during the year ended October 31, 2003. From these fees, PIMS paid such sales charges to affiliated broker-dealers, which in turn paid commissions to salespersons and incurred other distribution costs.
PIMS has advised the Fund that for the year ended October 31, 2003, it received approximately $271,500 and $3,300 in contingent deferred sales charges imposed upon certain redemptions by Class B and Class C shareholders, respectively.
PI, PIM and PIMS are indirect, wholly-owned subsidiaries of Prudential Financial, Inc. (“Prudential”).
The Fund, along with other affiliated registered investment companies (the “Funds”), is a party to a syndicated credit agreement (“SCA”) with a group of banks. The SCA provides for a commitment of $800 million and allows the Funds to increase the commitment to $1 billion, if necessary. Interest on any borrowings will be incurred at market rates. The Funds pay a commitment fee of .08 of 1% of the unused portion of the SCA. The commitment fee is accrued and paid quarterly and is allocated to the Funds pro rata, based on net assets. The purpose of the SCA is to serve as an alternative source of funding for capital share redemptions. The expiration date of the SCA was May 2, 2003. On May 2, 2003, the SCA was renewed under the same terms and conditions (“May 2003 renewal”). The expiration date of the May 2003 renewal is April 30, 2004. The Fund did not borrow any amounts pursuant to the SCA during the year ended October 31, 2003.
Note 3. Other Transactions with Affiliates
Prudential Mutual Fund Services LLC (“PMFS”), an affiliate of PI and an indirect, wholly-owned subsidiary of Prudential, serves as the Fund’s transfer agent. During the year ended October 31, 2003, the Fund incurred fees of approximately $188,900 for the services of PMFS. As of October 31, 2003, approximately $14,700 of such fees
| Dryden Tax-Managed Funds/Dryden Large-Cap Core Equity Fund | | 27 |
Notes to Financial Statements
Cont’d
were due to PMFS. Transfer agent fees and expenses in the Statement of Operations include certain out-of-pocket expenses paid to non-affiliates, where applicable.
The Fund pays networking fees to affiliated and unaffiliated broker/dealers. These networking fees are payments made to broker/dealers that clear mutual fund transactions through a national clearing system. The Fund incurred approximately $39,800 in total networking fees, of which the amount relating to the services of Wachovia Securities, LLC (“Wachovia”) and Prudential Securities, Inc. (“PSI”), affiliates of PI, was approximately $37,700 for the year ended October 31, 2003. Effective July 1, 2003, Prudential and Wachovia Corp. formed a joint venture (“Wachovia Securities, LLC”) whereby Prudential and Wachovia Corp. combined their brokerage business with Prudential holding a minority interest. Prior to July 1, 2003, PSI was an indirect, wholly-owned subsidiary of Prudential. As of October 31, 2003, approximately $3,000 of such fees were due to Wachovia. These amounts are included in transfer agent’s fees and expenses in the Statement of Operations.
PSI was the securities lending agent for the Fund. Effective July 1, 2003, PIM became the Fund’s securities lending agent. For the year ended October 31, 2003, PSI and PIM have been compensated approximately $2,800 and $2,800 for these services, respectively.
The Fund invests in the Taxable Money Market Series ( the “Portfolio”), a portfolio of the Dryden Core Investment Fund, formerly Prudential Core Investment Fund, pursuant to an exemptive order received from the Securities and Exchange Commission. The Portfolio is a money market mutual fund registered under the Investment Company Act of 1940, as amended, and managed by PI. During the year ended October 31, 2003, the Fund earned income of approximately $1,400 and $16,800, by investing its excess cash and collateral received from securities lending respectively.
Note 4. Portfolio Securities
Purchases and sales of investment securities, other than short-term investments, for the year ended October 31, 2003 were $139,846,704 and $176,147,884 respectively.
As of October 31, 2003, the Fund had securities on loan with an aggregate market value of $36,694,040. The Fund received $38,164,559 in cash collateral for securities
| 28 | | Visit our website at www.jennisondryden.com |
on loan which was used to purchase highly liquid short-term investments in accordance with the Fund’s securities lending procedures.
Note 5. Distributions and Tax Information
Distributions to shareholders, which are determined in accordance with federal income tax regulations and which may differ from generally accepted accounting principals, are recorded on the ex-dividend date. In order to present undistributed net investment income (loss) and accumulated net realized gains (losses) on the Statement of Assets and Liabilities that more closely represent their tax character, certain adjustments have been made to paid-in-capital in excess of par, undistributed net investment income (loss) and accumulated net realized gain (loss) on investments. For the year ended October 31, 2003, the adjustments were to decrease net investment loss and decrease paid-in-capital in excess of par by $114,741 due to a net operating loss. Net investment income, net realized gains and net assets were not affected by this change.
The United States federal income tax basis of the Fund’s investments and the net unrealized appreciation as of October 31, 2003 were as follows:
Tax Basis of Investments
| | Appreciation
| | Depreciation
| | Total Net Unrealized
Appreciation
|
| $222,522,690 | | $35,331,360 | | $7,547,601 | | $27,783,759 |
The difference between book basis and tax basis is primarily attributable to deferred losses on wash sales.
As of October 31, 2003, the Fund had a capital loss carryforward for tax purposes of approximately $79,839,300 of which $11,454,800 expires in 2007, $9,748,400 expires in 2008, $38,550,400 expires in 2009, $10,888,600 expires in 2010 and $9,197,100 expires in 2011. Accordingly, no capital gains distribution is expected to be paid to shareholders until net gains have been realized in excess of such carryforward.
For the years ended October 31, 2003 and October 31, 2002, the Fund had no distributable earnings on a tax basis.
| Dryden Tax-Managed Funds/Dryden Large-Cap Core Equity Fund | | 29 |
Notes to Financial Statements
Cont’d
Note 6. Joint Repurchase Agreement Account
The Fund, along with other affiliated registered investment companies, transfers uninvested cash balances into a single joint account, the daily aggregate balance of which is invested in one or more repurchase agreements collateralized by U.S. Treasury or federal agency obligations. As of October 31, 2003, the Fund had a .13% undivided interest in the repurchase agreements in the joint account. The undivided interest for the Fund represents $303,000 in the principal amount. As of such date, each repurchase agreement in the joint account and the collateral therefore were as follows:
Bear Stearns Securities Corp., 1.07%, in the principal amount of $77,172,000, repurchase price $77,178,881, due 11/03/03. The value of the collateral including accrued interest was $78,717,519.
Goldman Sachs & Co., 1.07%, in the principal amount of $77,173,000, repurchase price $77,179,881, due 11/03/03. The value of the collateral including accrued interest was $78,716,461.
Greenwich Capital Markets, Inc., 1.07% in the principal amount of $77,172,000, repurchase price $77,178,881, due 11/03/03. The value of the collateral including accrued interest was $78,719,220.
Note 7. Capital
The Fund offers Class A, Class B, Class C and Class Z shares. Class A shares are sold with a front-end sales charge of up to 5%. In some limited circumstances, Class A shares may not be subject to a front-end sales charge, but may be subject to a 1% contingent deferred sales charge for the first year. Class B shares are sold with a contingent deferred sales charge which declines from 5% to zero depending upon the period of time the shares are held. Class C shares are sold with a front-end sales charge of 1% and a contingent deferred sales charge of 1% during the first 18 months. Class B shares will automatically convert to Class A shares on a quarterly basis approximately seven years after purchase. A special exchange privilege is also available for shareholders who qualify to purchase Class A shares at net asset value. Class Z shares are not subject to any sales or redemption charge and are offered exclusively for sale to a limited group of investors.
The Fund has authorized an unlimited number of shares of beneficial interest at $.001 par value. As of October 31, 2003, PI owned 2,500 shares each of Class A, Class B, Class C and Class Z shares.
| 30 | | Visit our website at www.jennisondryden.com |
Transactions in shares of beneficial interest were as follows:
Class A
| | Shares
| | | Amount
| |
Year ended October 31, 2003: | | | | | | | |
Shares sold | | 623,442 | | | $ | 5,195,495 | |
Shares reacquired | | (1,784,191 | ) | | | (14,912,577 | ) |
| | |
|
| |
|
|
|
Net increase (decrease) in shares outstanding before conversion | | (1,160,749 | ) | | | (9,717,082 | ) |
Shares issued upon conversion from Class B | | 224,963 | | | | 1,841,157 | |
| | |
|
| |
|
|
|
Net increase (decrease) in shares outstanding | | (935,786 | ) | | $ | (7,875,925 | ) |
| | |
|
| |
|
|
|
Year ended October 31, 2002: | | | | | | | |
Shares sold | | 942,582 | | | $ | 8,696,498 | |
Shares reacquired | | (2,197,498 | ) | | | (19,895,961 | ) |
| | |
|
| |
|
|
|
Net increase (decrease) in shares outstanding before conversion | | (1,254,916 | ) | | | (11,199,463 | ) |
Shares issued upon conversion from Class B | | 209,776 | | | | 1,917,286 | |
| | |
|
| |
|
|
|
Net increase (decrease) in shares outstanding | | (1,045,140 | ) | | $ | (9,282,177 | ) |
| | |
|
| |
|
|
|
Class B
| | . | | | | |
Year ended October 31, 2003: | | | | | | | |
Shares sold | | 519,245 | | | $ | 4,151,406 | |
Shares reacquired | | (2,585,010 | ) | | | (20,645,538 | ) |
| | |
|
| |
|
|
|
Net increase (decrease) in shares outstanding before conversion | | (2,065,765 | ) | | | (16,494,132 | ) |
Shares reacquired upon conversion into Class A | | (231,772 | ) | | | (1,841,157 | ) |
| | |
|
| |
|
|
|
Net increase (decrease) in shares outstanding | | (2,297,537 | ) | | $ | (18,335,289 | ) |
| | |
|
| |
|
|
|
Year ended October 31, 2002: | | | | | | | |
Shares sold | | 934,863 | | | $ | 8,538,664 | |
Shares reacquired | | (4,115,380 | ) | | | (35,438,243 | ) |
| | |
|
| |
|
|
|
Net increase (decrease) in shares outstanding before conversion | | (3,180,517 | ) | | | (26,899,579 | ) |
Shares reacquired upon conversion into Class A | | (214,507 | ) | | | (1,917,286 | ) |
| | |
|
| |
|
|
|
Net increase (decrease) in shares outstanding | | (3,395,024 | ) | | $ | (28,816,865 | ) |
| | |
|
| |
|
|
|
Class C
| | | | | | |
Year ended October 31, 2003: | | | | | | | |
Shares sold | | 526,929 | | | $ | 4,212,155 | |
Shares reacquired | | (1,671,770 | ) | | | (13,323,480 | ) |
| | |
|
| |
|
|
|
Net increase (decrease) in shares outstanding | | (1,144,841 | ) | | $ | (9,111,325 | ) |
| | |
|
| |
|
|
|
Year ended October 31, 2002: | | | | | | | |
Shares sold | | 627,747 | | | $ | 5,684,101 | |
Shares reacquired | | (3,116,279 | ) | | | (27,051,397 | ) |
| | |
|
| |
|
|
|
Net increase (decrease) in shares outstanding | | (2,488,532 | ) | | $ | (21,367,296 | ) |
| | |
|
| |
|
|
|
| Dryden Tax-Managed Funds/Dryden Large-Cap Core Equity Fund | | 31 |
Notes to Financial Statements
Cont’d
Class Z
| | Shares
| | | Amount
| |
Year ended October 31, 2003: | | | | | | | |
Shares sold | | 293,413 | | | $ | 2,402,538 | |
Shares reacquired | | (427,547 | ) | | | (3,529,656 | ) |
| | |
|
| |
|
|
|
Net increase (decrease) in shares outstanding | | (134,134 | ) | | $ | (1,127,118 | ) |
| | |
|
| |
|
|
|
Year ended October 31, 2002: | | | | | | | |
Shares sold | | 309,414 | | | $ | 2,890,507 | |
Shares reacquired | | (899,808 | ) | | | (8,170,473 | ) |
| | |
|
| |
|
|
|
Net increase (decrease) in shares outstanding | | (590,394 | ) | | $ | (5,279,966 | ) |
| | |
|
| |
|
|
|
| 32 | | Visit our website at www.jennisondryden.com |
Financial Highlights
|
| OCTOBER 31, 2003 | | ANNUAL REPORT |
Dryden Large-Cap Core Equity Fund
Financial Highlights
| |
| | | Class A
| |
| | | Year Ended
October 31, 2003 | |
|
Per Share Operating Performance: | | | | |
Net Asset Value, Beginning Of Period | | $ | 7.79 | |
| | |
|
|
|
Income From Investment Operations: | | | | |
Net investment income | | | 0.04 | |
Net realized and unrealized gain (loss) on investment transactions | | | 1.64 | |
| | |
|
|
|
Total from investment operations | | | 1.68 | |
| | |
|
|
|
Net asset value, end of period | | $ | 9.47 | |
| | |
|
|
|
Total Return(b): | | | 21.57 | % |
Ratios/Supplemental Data: | | | | |
Net assets, end of period (000) | | $ | 51,026 | |
Average net assets (000) | | $ | 48,812 | |
Ratios to average net assets: | | | | |
Expenses, including distribution and service (12b-1) fees(f) | | | 1.19 | % |
Expenses, excluding distribution and service (12b-1) fees | | | 0.94 | % |
Net investment income | | | 0.48 | % |
For Class A, B, C and Z shares: | | | | |
Portfolio turnover rate(g) | | | 69 | % |
| (a) | Commencement of investment operations. |
| (b) | Total return does not consider the effects of sales loads. Total return is calculated assuming a purchase of shares on the first day and a sale on the last day of each period reported and includes reinvestment of dividends and distributions. Total returns for periods of less than a full year are not annualized. |
| (d) | Based on average shares outstanding during the period. |
| (e) | Less than $.005 per share. |
| (f) | The distributor of the Fund contractually agreed to limit its distribution and service (12b-1) fees to .25 of 1% of the average net assets of Class A shares. |
| (g) | Portfolio turnover for periods of less than one full year is not annualized. |
See Notes to Financial Statements.
| 34 | | Visit our website at www.jennisondryden.com |
|
| Class A | |
|
| Year Ended October 31, | | | March 3, 1999(a) Through October 31, 1999(d) | |
| |
| 2002(d) | | | 2001(d) | | | 2000(d) | | |
|
| | | |
| $ | 9.06 | | | $ | 12.41 | | | $ | 11.27 | | | $ | 10.00 | |
|
|
| |
|
|
| |
|
|
| |
|
|
|
| | | |
| | 0.03 | | | | 0.02 | | | | — | (e) | | | 0.01 | |
| | (1.30 | ) | | | (3.37 | ) | | | 1.14 | | | | 1.26 | |
|
|
| |
|
|
| |
|
|
| |
|
|
|
| | (1.27 | ) | | | (3.35 | ) | | | 1.14 | | | | 1.27 | |
|
|
| |
|
|
| |
|
|
| |
|
|
|
| $ | 7.79 | | | $ | 9.06 | | | $ | 12.41 | | | $ | 11.27 | |
|
|
| |
|
|
| |
|
|
| |
|
|
|
| | (14.02 | )% | | | (26.99 | )% | | | 10.12 | % | | | 12.70 | % |
| | | |
| $ | 49,310 | | | $ | 66,778 | | | $ | 92,685 | | | $ | 78,169 | |
| $ | 62,399 | | | $ | 81,887 | | | $ | 91,064 | | | $ | 66,701 | |
| | | |
| | 1.16 | % | | | 1.10 | % | | | 1.09 | % | | | 1.23 | %(c) |
| | 0.91 | % | | | 0.85 | % | | | 0.84 | % | | | 0.98 | %(c) |
| | 0.32 | % | | | 0.15 | % | | | 0.03 | % | | | 0.09 | %(c) |
| | | |
| | 69 | % | | | 73 | % | | | 94 | % | | | 67 | % |
See Notes to Financial Statements.
| Dryden Tax-Managed Funds/Dryden Large-Cap Core Equity Fund | | 35 |
Financial Highlights
Cont’d.
| |
| | | Class B
| |
| | | Year Ended
October 31, 2003 | |
|
Per Share Operating Performance: | | | | |
Net Asset Value, Beginning Of Period | | $ | 7.59 | |
| | |
|
|
|
Income/Loss From Investment Operations: | | | | |
Net investment loss | | | (0.02 | ) |
Net realized and unrealized gain (loss) on investment transactions | | | 1.58 | |
| | |
|
|
|
Total from investment operations | | | 1.56 | |
| | |
|
|
|
Net asset value, end of period | | $ | 9.15 | |
| | |
|
|
|
Total Return(b): | | | 20.55 | % |
Ratios/Supplemental Data: | | | | |
Net assets, end of period (000) | | $ | 99,237 | |
Average net assets (000) | | $ | 95,925 | |
Ratios to average net assets: | | | | |
Expenses, including distribution and service (12b-1) fees | | | 1.94 | % |
Expenses, excluding distribution and service (12b-1) fees | | | 0.94 | % |
Net investment loss | | | (0.27 | )% |
| (a) | Commencement of investment operations. |
| (b) | Total return does not consider the effects of sales loads. Total return is calculated assuming a purchase of shares on the first day and a sale on the last day of each period reported and includes reinvestment of dividends and distributions. Total returns for periods of less than a full year are not annualized. |
| (d) | Based on average shares outstanding during the period. |
See Notes to Financial Statements.
| 36 | | Visit our website at www.jennisondryden.com |
|
| Class B | |
|
| Year Ended October 31, | | | March 3, 1999(a) Through
October 31, 1999(d) | |
| |
| 2002(d) | | | 2001(d) | | | 2000(d) | | |
|
| | | |
| $ | 8.89 | | | $ | 12.27 | | | $ | 11.22 | | | $ | 10.00 | |
|
|
| |
|
|
| |
|
|
| |
|
|
|
| | | |
| | (0.04 | ) | | | (0.06 | ) | | | (0.09 | ) | | | (0.05 | ) |
| | (1.26 | ) | | | (3.32 | ) | | | 1.14 | | | | 1.27 | |
|
|
| |
|
|
| |
|
|
| |
|
|
|
| | (1.30 | ) | | | (3.38 | ) | | | 1.05 | | | | 1.22 | |
|
|
| |
|
|
| |
|
|
| |
|
|
|
| $ | 7.59 | | | $ | 8.89 | | | $ | 12.27 | | | $ | 11.22 | |
|
|
| |
|
|
| |
|
|
| |
|
|
|
| | (14.62 | )% | | | (27.55 | )% | | | 9.36 | % | | | 12.20 | % |
| | | |
| $ | 99,771 | | | $ | 147,021 | | | $ | 214,700 | | | $ | 175,129 | |
| $ | 132,783 | | | $ | 184,943 | | | $ | 205,175 | | | $ | 144,221 | |
| | | |
| | 1.91 | % | | | 1.85 | % | | | 1.84 | % | | | 1.98 | %(c) |
| | 0.91 | % | | | 0.85 | % | | | 0.84 | % | | | 0.98 | %(c) |
| | (0.43 | )% | | | (0.60 | )% | | | (0.72 | )% | | | (0.67 | )%(c) |
See Notes to Financial Statements.
| Dryden Tax-Managed Funds/Dryden Large-Cap Core Equity Fund | | 37 |
Financial Highlights
Cont’d.
| |
| | | Class C
| |
| | | Year Ended
October 31, 2003 | |
|
Per Share Operating Performance: | | | | |
Net Asset Value, Beginning Of Period | | $ | 7.59 | |
| | |
|
|
|
Income/Loss From Investment Operations: | | | | |
Net investment loss | | | (0.02 | ) |
Net realized and unrealized gain (loss) on investment transactions | | | 1.58 | |
| | |
|
|
|
Total from investment operations | | | 1.56 | |
| | |
|
|
|
Net asset value, end of period | | $ | 9.15 | |
| | |
|
|
|
Total Return(b): | | | 20.55 | % |
Ratios/Supplemental Data: | | | | |
Net assets, end of period (000) | | $ | 55,112 | |
Average net assets (000) | | $ | 52,674 | |
Ratios to average net assets: | | | | |
Expenses, including distribution and service (12b-1) fees | | | 1.94 | % |
Expenses, excluding distribution and service (12b-1) fees | | | 0.94 | % |
Net investment loss | | | (0.27 | )% |
| (a) | Commencement of investment operations. |
| (b) | Total return does not consider the effects of sales loads. Total return is calculated assuming a purchase of shares on the first day and a sale on the last day of each period reported and includes reinvestment of dividends and distributions. Total returns for periods of less than a full year are not annualized. |
| (d) | Based on average shares outstanding during the period. |
See Notes to Financial Statements.
| 38 | | Visit our website at www.jennisondryden.com |
|
| Class C | |
|
| Year Ended October 31, | | | March 3, 1999(a) Through October 31, 1999(d) | |
| |
| 2002(d) | | | 2001(d) | | | 2000(d) | | |
|
| | | |
| $ | 8.89 | | | $ | 12.27 | | | $ | 11.22 | | | $ | 10.00 | |
|
|
| |
|
|
| |
|
|
| |
|
|
|
| | | |
| | (0.04 | ) | | | (0.06 | ) | | | (0.09 | ) | | | (0.05 | ) |
| | (1.26 | ) | | | (3.32 | ) | | | 1.14 | | | | 1.27 | |
|
|
| |
|
|
| |
|
|
| |
|
|
|
| | (1.30 | ) | | | (3.38 | ) | | | 1.05 | | | | 1.22 | |
|
|
| |
|
|
| |
|
|
| |
|
|
|
| $ | 7.59 | | | $ | 8.89 | | | $ | 12.27 | | | $ | 11.22 | |
|
|
| |
|
|
| |
|
|
| |
|
|
|
| | (14.62 | )% | | | (27.55 | )% | | | 9.36 | % | | | 12.20 | % |
| | | |
| $ | 54,415 | | | $ | 85,848 | | | $ | 131,554 | | | $ | 110,895 | |
| $ | 75,295 | | | $ | 109,346 | | | $ | 126,881 | | | $ | 91,235 | |
| | | |
| | 1.91 | % | | | 1.85 | % | | | 1.84 | % | | | 1.98 | %(c) |
| | 0.91 | % | | | 0.85 | % | | | 0.84 | % | | | 0.98 | %(c) |
| | (0.43 | )% | | | (0.60 | )% | | | (0.72 | )% | | | (0.67 | )%(c) |
See Notes to Financial Statements.
| Dryden Tax-Managed Funds/Dryden Large-Cap Core Equity Fund | | 39 |
Financial Highlights
Cont’d
| |
| | | Class Z
| |
| | | Year Ended October 31, 2003 | |
|
Per Share Operating Performance: | | | | |
Net Asset Value, Beginning Of Period | | $ | 7.88 | |
| | |
|
|
|
Income From Investment Operations: | | | | |
Net investment income | | | 0.07 | |
Net realized and unrealized gain (loss) on investment transactions | | | 1.64 | |
| | |
|
|
|
Total from investment operations | | | 1.71 | |
| | |
|
|
|
Net asset value, end of period | | $ | 9.59 | |
| | |
|
|
|
Total Return(b): | | | 21.70 | % |
Ratios/Supplemental Data: | | | | |
Net assets, end of period (000) | | $ | 7,198 | |
Average net assets (000) | | $ | 6,981 | |
Ratios to average net assets: | | | | |
Expenses, including distribution and service (12b-1) fees | | | 0.94 | % |
Expenses, excluding distribution and service (12b-1) fees | | | 0.94 | % |
Net investment income | | | 0.73 | % |
| (a) | Commencement of investment operations. |
| (b) | Total return is calculated assuming a purchase of shares on the first day and a sale on the last day of each period reported and includes reinvestment of dividends and distributions. Total returns for periods of less than a full year are not annualized. |
| (d) | Based on average shares outstanding during the period. |
See Notes to Financial Statements.
| 40 | | Visit our website at www.jennisondryden.com |
|
| Class Z | |
|
| Year Ended October 31, | | | March 3, 1999(a) Through October 31, 1999(d) | |
| |
| 2002(d) | | | 2001(d) | | | 2000(d) | | |
|
| | | |
| $ | 9.13 | | | $ | 12.48 | | | $ | 11.30 | | | $ | 10.00 | |
|
|
| |
|
|
| |
|
|
| |
|
|
|
| | | |
| | 0.05 | | | | 0.04 | | | | 0.03 | | | | 0.02 | |
| | (1.30 | ) | | | (3.39 | ) | | | 1.15 | | | | 1.28 | |
|
|
| |
|
|
| |
|
|
| |
|
|
|
| | (1.25 | ) | | | (3.35 | ) | | | 1.18 | | | | 1.30 | |
|
|
| |
|
|
| |
|
|
| |
|
|
|
| $ | 7.88 | | | $ | 9.13 | | | $ | 12.48 | | | $ | 11.30 | |
|
|
| |
|
|
| |
|
|
| |
|
|
|
| | (13.69 | )% | | | (26.84 | )% | | | 10.44 | % | | | 13.00 | % |
| | | |
| $ | 6,969 | | | $ | 13,469 | | | $ | 18,167 | | | $ | 13,653 | |
| $ | 11,218 | | | $ | 18,523 | | | $ | 17,464 | | | $ | 12,627 | |
| | | |
| | 0.91 | % | | | 0.85 | % | | | 0.84 | % | | | 0.98 | %(c) |
| | 0.91 | % | | | 0.85 | % | | | 0.84 | % | | | 0.98 | %(c) |
| | 0.55 | % | | | 0.39 | % | | | 0.28 | % | | | 0.35 | %(c) |
See Notes to Financial Statements.
| Dryden Tax-Managed Funds/Dryden Large-Cap Core Equity Fund | | 41 |
Report of Independent Auditors
To the Board of Trustees and Shareholders of
Dryden Large-Cap Core Equity Fund
In our opinion, the accompanying statement of assets and liabilities, including the portfolio of investments, and the related statements of operations and of changes in net assets and the financial highlights present fairly, in all material respects, the financial position of Dryden Large-Cap Core Equity Fund, formerly Prudential Tax-Managed Equity Fund, (the “Fund”) at October 31, 2003, the results of its operations for the year then ended, the changes in its net assets for each of the two years in the period then ended and the financial highlights for each of the periods presented, in conformity with accounting principles generally accepted in the United States of America. These financial statements and financial highlights (hereafter referred to as “financial statements”) are the responsibility of the Fund’s management; our responsibility is to express an opinion on these financial statements based on our audits. We conducted our audits of these financial statements in accordance with auditing standards generally accepted in the United States of America, which require that we plan and perform the audit to obtain reasonable assurance about whether the financial statements are free of material misstatement. An audit includes examining, on a test basis, evidence supporting the amounts and disclosures in the financial statements, assessing the accounting principles used and significant estimates made by management, and evaluating the overall financial statement presentation. We believe that our audits, which included confirmation of securities at October 31, 2003 by correspondence with the custodian and brokers, provide a reasonable basis for our opinion.
PricewaterhouseCoopers LLP
New York, New York
December 22, 2003
| 42 | | Visit our website at www.jennisondryden.com |
Supplemental Proxy Information
(Unaudited)
Meetings of the Fund’s shareholders were held on July 17, 2003 and August 21, 2003, respectively. The meetings were held for the following purposes:
1. To approve the election of ten (10) trustees to the Board of Trustees, as follows:
| | • | | Douglas H. McCorkindale |
The result of the July 17, 2003 proxy solicitation on the preceding matter was:
Matter
| | Votes For
| | Votes Against
| | Votes Withheld
| | Abstentions
|
David E.A. Carson | | 22,459,184 | | — | | 169,326 | | — |
Robert E. La Blanc | | 22,464,062 | | — | | 164,448 | | — |
Robert F. Gunia | | 22,462,192 | | — | | 166,318 | | — |
Douglas H.
McCorkindale | | 22,469,511 | | — | | 158,999 | | — |
Stephen P. Munn* | | 22,468,788 | | — | | 159,722 | | — |
Richard A. Redeker | | 22,468,621 | | — | | 159,889 | | — |
Judy A. Rice | | 22,466,168 | | — | | 162,342 | | — |
Robin B. Smith | | 22,461,905 | | — | | 166,605 | | — |
Stephen Stoneburn | | 22,470,038 | | — | | 158,472 | | — |
Clay T. Whitehead | | 22,468,350 | | — | | 160,160 | | — |
* Mr. Munn resigned effective November 30, 2003.
2. To approve amendments to the Fund’s Declaration of Trust.
The result of the August 21, 2003 proxy solicitation on the preceding matter was:
Matter
| | Votes For
| | Votes Against
| | Abstentions
|
Amendments to the Fund’s Declaration of Trust | | 6,802,101 | | 250,645 | | 230,701 |
| Dryden Tax-Managed Funds/Dryden Large-Cap Core Equity Fund | | 43 |
Management of the Fund
(Unaudited)
Information pertaining to the Trustees of the Fund is set forth below. Trustees who are not deemed to be “interested persons” of the Fund, as defined in the 1940 Act are referred to as “Independent Trustees.” Trustees who are deemed to be “interested persons” of the Fund are referred to as “Interested Trustees.” “Fund Complex”† consists of the Fund and any other investment companies managed by PI.
Independent Trustees2
David E.A. Carson (69), Trustee since 20033
Oversees 99 portfolios in Fund complex
Principal occupations (last 5 years): Director (January 2000 to May 2000), Chairman (January 1999 to December 1999), Chairman and Chief Executive Officer (January 1998 to December 1998) and President, Chairman and Chief Executive Officer (1983-1997) of People’s Bank.
Other Directorships held:4 Director of United Illuminating and UIL Holdings (utility company), since 1993.
Robert E. La Blanc (69), Trustee since 20033
Oversees 119 portfolios in Fund complex
Principal occupations (last 5 years): President (since 1981) of Robert E. La Blanc Associates, Inc. (telecommunications); formerly General Partner at Salomon Brothers and Vice-Chairman of Continental Telecom; Trustee of Manhattan College.
Other Directorships held:4 Director of Storage Technology Corporation (since 1979) (technology), Chartered Semiconductor Manufacturing, Ltd. (since 1998); Titan Corporation (electronics) (since 1995), Computer Associates International, Inc. (since 2002) (software company); FiberNet Telecom Group, Inc. (since 2003) (telecom company); Director (since April 1999) of the High Yield Plus Fund, Inc.
Douglas H. McCorkindale (64), Trustee since 19983
Oversees 101 portfolios in Fund complex
Principal occupations (last 5 years): Chairman (since February 2001), Chief Executive Officer (since June 2000) and President (since September 1997) of Gannett Co. Inc. (publishing and media); formerly Vice Chairman (March 1984-May 2000) of Gannett Co., Inc.
Other Directorships held:4 Director of Gannett Co. Inc., Director of Continental Airlines, Inc. (since May 1993); Director of Lockheed Martin Corp. (aerospace and defense) (since May 2001); Director of The High Yield Plus Fund, Inc. (since 1996).
Richard A. Redeker (60), Trustee since 19983
Oversees 102 portfolios in Fund complex
Principal occupations (last 5 years): Management Consultant; formerly employee of Prudential Investments (October 1996-December 1998); Director of Invesmart, Inc. (since 2001) and Director of Penn Tank Lines, Inc. (since 1999).
Other Directorships held:4 None.
| 44 | | Visit our website at www.jennisondryden.com |
Robin B. Smith (64), Trustee since 19983
Oversees 109 portfolios in Fund complex
Principal occupations (last 5 years): Chairman of the Board (since January 2003) of Publishers Clearing House (direct marketing), formerly Chairman and Chief Executive Officer (August 1996-January 2003) of Publishers Clearing House.
Other Directorships held:4 Director of BellSouth Corporation (since 1992).
Stephen Stoneburn (60), Trustee since 20033
Oversees 107 portfolios in Fund complex
Principal occupations (last 5 years): President and Chief Executive Officer (since June 1996) of Quadrant Media Corp. (a publishing company); formerly President (June 1995-June 1996) of Argus Integrated Media, Inc.; Senior Vice President and Managing Director (January 1993-1995) of Cowles Business Media and Senior Vice President of Fairchild Publications, Inc. (1975-1989).
Other Directorships held:4 None
Clay T. Whitehead (64), Trustee since 19983
Oversees 106 portfolios in Fund complex
Principal occupations (last 5 years): President (since 1983) of National Exchange Inc. (new business development firm).
Other Directorships held:4 Director (since 2000) of the High Yield Plus Fund, Inc.
Interested Trustees1
Judy A. Rice (55), President since 2003 and Trustee since 20003
Oversees 109 portfolios in Fund complex
Principal occupations (last 5 years): President, Chief Executive Officer, Chief Operating Officer and Officer-in-Charge (since 2003) of PI; Director, Officer-in-Charge, President, Chief Executive Officer and Chief Operating Officer (since May 2003) of American Skandia Advisory Services, Inc. and American Skandia Investment Services, Inc.; Director, Officer-in-Charge, President, Chief Executive Officer (since May 2003) of American Skandia Fund Services, Inc.; Vice President (since February 1999) of Prudential Investment Management Services LLC; President, Chief Executive Officer and Officer-in-Charge (since April 2003) of Prudential Mutual Fund Services LLC; formerly various positions to Senior Vice President (1992-1999) of Prudential Securities; and various positions to Managing Director (1975-1992) of Salomon Smith Barney; Member of Board of Governors of the Money Management Institute.
Other Directorships held:4 None
Robert F. Gunia (56), Vice President and Trustee since 19983
Oversees 189 portfolios in Fund complex
Principal occupations (last 5 years): Chief Administrative Officer (since June 1999) of PI; Executive Vice President and Treasurer (since January 1996) of PI; President (since April 1999) of Prudential Investment Management Services LLC (PIMS); Corporate Vice President (since September 1997) of The Prudential Insurance Company of America (Prudential); Director, Executive Vice President and Chief Administrative Officer (since May 2003) of American Skandia Investment Services, Inc., American Skandia Advisory Services, Inc. and American Skandia Fund Services, Inc.; President (since April 1999) of Prudential Investment Management Services LLC; Executive Vice President (since March 1999) and Treasurer (since May 2000) of Prudential Mutual Fund Services LLC; formerly Senior Vice President (March 1987-May 1999) of Prudential Securities.
| Dryden Tax-Managed Funds/Dryden Large-Cap Core Equity Fund | | 45 |
Other Directorships held:4 Vice President and Director (since May 1989) and Treasurer (since 1999) of The Asia Pacific Fund, Inc.
Information pertaining to the Officers of the Fund is set forth below.
Officers2
Marguerite E.H. Morrison (47), Chief Legal Officer since 2003 and Assistant Secretary since 20023
Principal occupations (last 5 years): Vice President and Chief Legal Officer—Mutual Funds and Unit Investment Trust (since August 2000) of Prudential; Senior Vice President and Secretary (since April 2003) of PI; Senior Vice President and Secretary (since May 2003) of American Skandia Investment Services, Inc., American Skandia Advisory Services, Inc. and American Skandia Fund Services, Inc.; Vice President and Assistant Secretary of PIMS (since October 2001), previously Senior Vice President and Assistant Secretary (February 2001-April 2003) of PI, Vice President and Associate General Counsel (December 1996-February 2001) of PI.
Maryanne Ryan (39), Anti-Money Laundering Compliance Officer since 20023
Principal occupations (last 5 years): Vice President, Prudential (since November 1998), First Vice President, Prudential Securities (March 1997-May 1998); Anti-Money Laundering Compliance Officer (since 2003) of American Skandia Investment Services, Inc., American Skandia Advisory Services, Inc. and American Skandia Marketing, Inc.
Grace C. Torres (44), Treasurer and Principal Financial and Accounting Officer since 19983
Principal occupations (last 5 years): Senior Vice President (since January 2000) of PI, Senior Vice President and Assistant Treasurer (since May 2003) of American Skandia Investment Services, Inc. and American Skandia Advisory Services, Inc.; formerly First Vice President (December 1996-January 2000) of PI and First Vice President (March 1993-1999) of Prudential Securities.
| 1 | “Interested” Trustee, as defined in the 1940 Act, by reason of employment with the Manager, (Prudential Investments LLC or PI), the Subadviser (Prudential Investment Management, Inc. or PIM) or the Distributor (Prudential Investment Management Services LLC or PIMS). |
| 2 | Unless otherwise noted, the address of the Trustees and Officers is c/o: Prudential Investments LLC, Gateway Center Three, 100 Mulberry Street, Newark, NJ 07102. |
| 3 | There is no set term of office for Trustees and Officers. The Independent Trustees have adopted a retirement policy, which calls for the retirement of Trustees on December 31 of the year in which they reach the age of 75. The table shows the individuals length of service as Trustee and/or Officer. |
| 4 | This includes only directorships of companies requested to register, or file reports with the SEC under the Securities and Exchange Act of 1934 (that is, “public companies”) or other investment companies registered under the 1940 Act. |
| † | The Fund Complex consists of all investment companies managed by PI. The Funds for which PI serves as manager include JennisonDryden Mutual Funds, Strategic Partners Funds, American Skandia Advisor Funds, Inc., The Prudential Variable Contract Accounts 2, 10, 11, The Target Portfolio Trust, The Prudential Series Fund, Inc., American Skandia Trust, and Prudential’s Gibraltar Fund. |
Additional information about the Fund’s Trustees is included in the Fund’s Statement of Additional Information which is available without charge, upon request, by calling (800) 521-7466 or (732) 482-7555 (Calling from outside the U.S.)
| 46 | | Visit our website at www.jennisondryden.com |
Growth of a $10,000 Investment
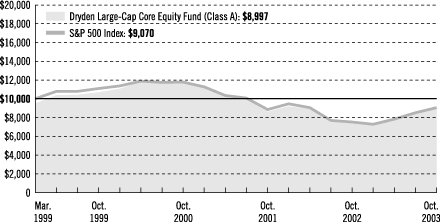
|
| Average Annual Total Returns (With Sales Charges) as of 10/31/03 | |
| | | One Year | | | Three Years | | | Since Inception | |
Class A | | 15.49 | % | | –10.17 | % | | –2.24 | % |
|
Class B | | 15.55 | | | –10.23 | | | –2.10 | |
|
Class C | | 18.36 | | | –9.62 | | | –2.10 | |
|
Class Z | | 21.70 | | | –8.41 | | | –0.89 | |
|
| | | | | | | | | | |
|
| Average Annual Total Returns (Without Sales Charge) as of 10/31/03 | |
| | | One Year | | | Three Years | | | Since Inception | |
Class A | | 21.57 | % | | –8.62 | % | | –1.16 | % |
|
Class B | | 20.55 | | | –9.32 | | | –1.89 | |
|
Class C | | 20.55 | | | –9.32 | | | –1.89 | |
|
Class Z | | 21.70 | | | –8.41 | | | –0.89 | |
|
Past performance is not indicative of future results. Principal value and investment return will fluctuate so that an investor’s shares, when redeemed, may be worth more or less than their original cost. Source: Prudential Investments LLC and Lipper Inc. Inception date: 3/3/99.
The graph compares a $10,000 investment in the Dryden Large-Cap Core Equity Fund (Class A shares) with a similar investment in the S&P 500 Index by portraying the initial account values at the commencement of operations of Class A shares (March 3, 1999) and the account values at the end of the current fiscal year (October 31, 2003) as measured on a quarterly basis. For purposes of the graph, and unless otherwise indicated, it has been assumed that (a) the maximum applicable front-end sales charge was deducted from the initial $10,000 investment in Class A shares; (b) all recurring fees (including management fees) were deducted; and (c) all dividends and distributions were reinvested. The line graph provides information for Class A shares only. As indicated in the tables provided earlier, performance for Class B, C, and Z shares will vary due to the differing charges and expenses applicable to each share class (as indicated in the following paragraphs).
| Visit our website at www.jennisondryden.com | | |
Without a distribution and service (12b-1) fee waiver of 0.05% for Class A shares through October 31, 2003, the returns shown in the graph and for Class A shares in the tables would have been lower.
The S&P 500 Index is an unmanaged index of 500 stocks of large U.S. companies. It gives a broad look at how stock prices in the United States have performed. The S&P 500 Index’s total returns include the reinvestment of all dividends, but do not include the effects of sales charges, operating expenses of a mutual fund, or taxes. These returns would be lower if they included the effects of sales charges, operating expenses, or taxes. The securities that comprise the S&P 500 Index may differ substantially from the securities in the Fund. The S&P 500 Index is not the only index that may be used to characterize performance of large-capitalization stock funds. Other indexes may portray different comparative performance. Investors cannot invest directly in an index.
The Fund charges a maximum front-end sales charge of 5% for Class A shares in most circumstances, and a 12b-1 fee of up to 0.30% annually. In some circumstances, Class A shares may not be subject to a front-end sales charge, but may be subject to a 1% contingent deferred sales charge (CDSC) for the first year. Class B shares are subject to a declining CDSC of 5%, 4%, 3%, 2%, 1%, and 1% respectively for the first six years after purchase and a 12b-1 fee of 1% annually. Approximately seven years after purchase, Class B shares will automatically convert to Class A shares on a quarterly basis. Class C shares are subject to a front-end sales charge of 1%, a CDSC of 1% for shares redeemed within 18 months of purchase, and a 12b-1 fee of 1% annually. The returns in the graph and the tables do not reflect the deduction of taxes that a shareholder would pay on Fund distributions or following the redemption of Fund shares.
| | | Dryden Tax-Managed Funds/Dryden Large-Cap Core Equity Fund |
| | |
| n MAIL | | n TELEPHONE | | n WEBSITE |
Gateway Center Three 100 Mulberry Street Newark, NJ 07102 | | (800) 225-1852 | | www.jennisondryden.com |
| TRUSTEES |
David E.A. Carson•Robert F. Gunia•Robert E. La Blanc•Douglas H. McCorkindale•
Richard A. Redeker•Judy A. Rice•Robin B. Smith•Stephen D. Stoneburn•Clay T. Whitehead |
| |
| OFFICERS |
Judy A. Rice, President•Robert F. Gunia, Vice President•Grace C. Torres, Treasurer and Principal
Financial and Accounting Officer•Marguerite E.H. Morrison, Chief Legal Officer and Assistant Secretary•
Maryanne Ryan, Anti-Money Laundering Compliance Officer |
| MANAGER | | Prudential Investments LLC | | Gateway Center Three
100 Mulberry Street
Newark, NJ 07102 |
|
| INVESTMENT ADVISOR | | Prudential Investment
Management, Inc. | | Gateway Center Two
100 Mulberry Street
Newark, NJ 07102 |
|
| DISTRIBUTOR | | Prudential Investment
Management Services LLC | | Gateway Center Three
14th Floor
100 Mulberry Street
Newark, NJ 07102 |
|
| CUSTODIAN | | State Street Bank
and Trust Company | | One Heritage Drive
North Quincy, MA 02171 |
|
| TRANSFER AGENT | | Prudential Mutual Fund
Services LLC | | PO Box 8098
Philadelphia, PA 19101 |
|
| INDEPENDENT AUDITORS | | PricewaterhouseCoopers LLP | | 1177 Avenue of the
Americas
New York, NY 10036 |
|
| FUND COUNSEL | | Sullivan & Cromwell LLP | | 125 Broad Street
New York, NY 10004 |
| | |
| Dryden Large-Cap Core Equity Fund | | | | |
| Share Class | | | | A | | B | | C | | Z | | |
| | | | | | |
Nasdaq | | | | PTMAX | | PTMBX | | PTMCX | | PTEZX | | |
CUSIP | | | | 26248W106 | | 26248W205 | | 26248W304 | | 26248W403 | | |
| | | | | | | | | | | | | |
Mutual Funds:
| ARE NOT INSURED BY THE FDIC OR ANY FEDERAL GOVERNMENT AGENCY | | MAY LOSE VALUE | | ARE NOT A DEPOSIT OF OR GUARANTEED BY ANY BANK OR ANY BANK AFFILIATE |
| | | |
| Dryden Large-Cap Core Equity Fund | | | | | | |
| | | Share Class | | A | | B | | C | | Z | | |
| | | | | | |
| | | Nasdaq | | PTMAX | | PTMBX | | PTMCX | | PTEZX | | |
| | | CUSIP | | 26248W106 | | 26248W205 | | 26248W304 | | 26248W403 | | |
| | | | | | | | | | | | | |
MF187E IFS-AO86507
Item 2 – Code of Ethics – See Exhibit (a)
As of the end of the period covered by this report, the registrant has adopted a code of ethics (the “Section 406 Standards for Investment Companies — Ethical Standards for Principal Executive and Financial Officers”) that applies to the registrant’s Principal Executive Officer and Principal Financial Officer; the registrant’s Principal Financial Officer also serves as the Principal Accounting Officer.
The registrant hereby undertakes to provide any person, without charge, upon request, a copy of the code of ethics. To request a copy of the code of ethics, contact the registrant at (973) 367-7525, and ask for a copy of the Section 406 Standards for Investment Companies – Ethical Standards for Principal Executive and Financial Officers.
Item 3 – Audit Committee Financial Expert –
Stephen Munn had been designated as the Fund’s Audit Committee Financial Expert, however, he resigned as a Director of the Fund effective November 30, 2003 and the Fund’s board is in the process of selecting a new designee.
Item 4 – Principal Accountant Fees and Services – Not required in this filing
Item 5 – Reserved
Item 6 – Reserved
Item 7 – Disclosure of Proxy Voting Policies and Procedures for Closed-End Management Investment Companies – Not required in this filing
Item 8 – Reserved
Item 9 – Controls and Procedures
(a) It is the conclusion of the registrant’s principal executive officer and principal financial officer that the effectiveness of the registrant’s current disclosure controls and procedures (such disclosure controls and procedures having been evaluated within 90 days of the date of this filing) provide reasonable assurance that the information required to be disclosed by the registrant has been recorded, processed, summarized and reported within the time period specified in the Commission’s rules and forms and that the information required to be disclosed by the registrant has been accumulated and communicated to the registrant’s principal executive officer and principal financial officer in order to allow timely decisions regarding required disclosure.
(b) There have been no significant changes in the registrant’s internal controls or in other factors that could significantly affect these controls subsequent to the date of their evaluation, including any corrective actions with regard to significant deficiencies and material weaknesses.
Item 10 – Exhibits
| | (a) | Code of Ethics – Attached hereto |
| | (b) | Certifications pursuant to Sections 302 and 906 of the Sarbanes-Oxley Act – Attached hereto |
SIGNATURES
Pursuant to the requirements of the Securities Exchange Act of 1934 and the Investment Company Act of 1940, the registrant has duly caused this report to be signed on its behalf by the undersigned, thereunto duly authorized.
(Registrant) | | Dryden Tax Managed Funds |
| |
By (Signature and Title)* | | /s/ Marguerite E. H. Morrison
|
| | | Marguerite E. H. Morrison |
| | | Assistant Secretary |
| |
Date | | December 22, 2003 |
Pursuant to the requirements of the Securities Exchange Act of 1934 and the Investment Company Act of 1940, this report has been signed below by the following persons on behalf of the registrant and in the capacities and on the dates indicated.
By (Signature and Title)* | | /s/ Judy A. Rice
|
| | | Judy A. Rice |
| | | President and Principal Executive Officer |
| |
Date | | December 22, 2003 |
| |
By (Signature and Title)* | | /s/ Grace C. Torres
|
| | | Grace C. Torres |
| | | Treasurer and Principal Financial Officer |
| |
Date | | December 22, 2003 |
|
| |
| * | Print the name and title of each signing officer under his or her signature. |