Exhibit 99
PRESS RELEASE
| | | |
FOR IMMEDIATE RELEASE: | | October 17, 2008 |
For Further Information: | | Mark S. Allio, Chairman, President and CEO |
| | | Phone: 330.576.1334 |
| | | Fax: 330.666.7959 |
CENTRAL FEDERAL CORPORATION ANNOUNCES INCREASED EARNINGS
FOR THE THREE AND NINE MONTHS ENDED SEPTEMBER 30, 2008
Fairlawn, Ohio — October 17, 2008 — Central Federal Corporation (Nasdaq: CFBK) announced that net income for the quarter ended September 30, 2008 increased $768,000 and totaled $285,000, or $.07 per diluted share, compared to a net loss of ($483,000) or ($.11) per diluted share, for the quarter ended September 30, 2007.
Net income for the nine months ended September 30, 2008 increased $947,000 and totaled $633,000, or $.15 per diluted share, compared to a net loss of ($314,000) or ($.07) per diluted share, for the nine months ended September 30, 2007.
The net loss for the quarter and nine months ended September 30, 2007 was primarily due to a $511,000, or $.12 per diluted share for the quarter and $.11 per diluted share for the nine month period, after-tax cost of an arbitration loss and lease termination expense.
Highlights
| • | | Net income for the third quarter of 2008 was 27% higher than the second quarter of 2008, and 130% higher than the first quarter of 2008. |
| |
| • | | Net interest income increased 15% during the third quarter of 2008 compared to the third quarter of 2007, and increased 16% for the nine months ended September 30, 2008 compared to the nine months ended September 30, 2007. |
| |
| • | | Net interest margin increased to 3.47% for the third quarter of 2008 from 3.15% for the third quarter of 2007, and increased to 3.36% for the nine months ended September 30, 2008 from 3.17% for the nine months ended September 30, 2007. |
| |
| • | | The efficiency ratio improved to 76.42% for the third quarter of 2008 from 120.65% for the third quarter of 2007, and improved to 78.91% for the nine months ended September 30, 2008 from 101.11% for the nine months ended September 30, 2007. |
| |
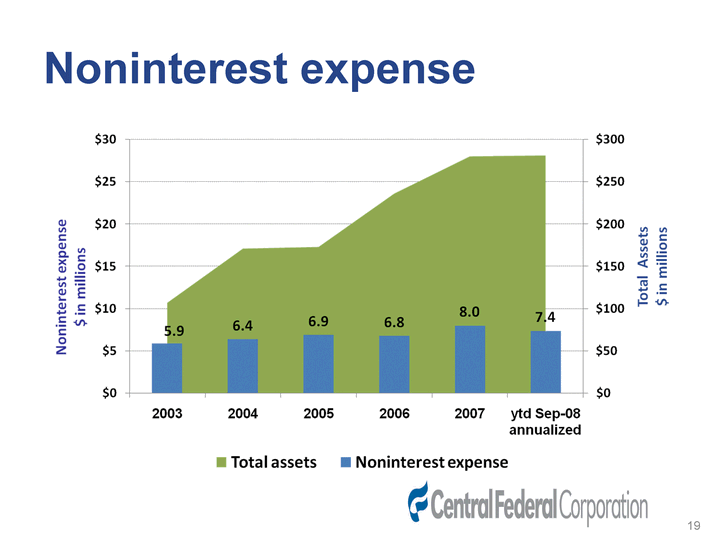
| • | | The ratio of noninterest expense to average assets improved to 2.66% in the third quarter of 2008 from 3.84% in the third quarter of 2007, and improved to 2.68% in the nine months ended September 30, 2008 from 3.30% in the nine months ended September 30, 2007. |
| |
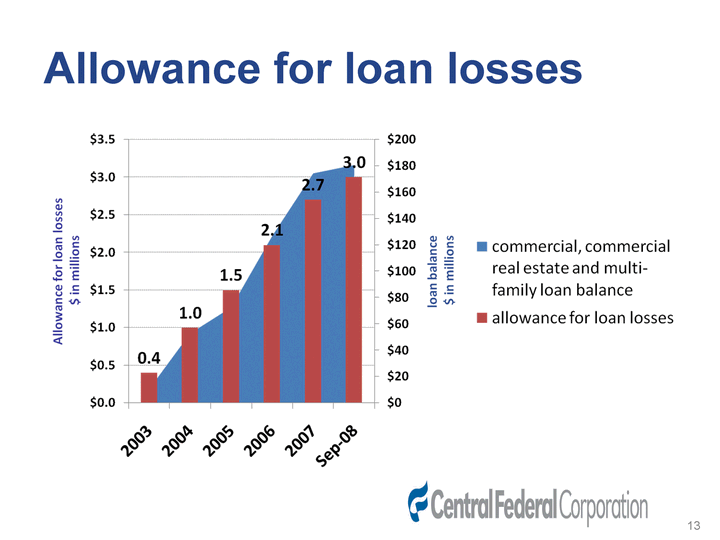
| • | | CFBank continues to provide for loan losses in response to current economic conditions and their effect on the loan portfolio. The ratio of the allowance for loan losses to total loans totaled 1.30% at September 30, 2008 compared to 1.15% at December 31, 2007. Nonperforming loans remained low at 0.85% of total loans at September 30, 2008 compared to 0.21% of total loans at December 31, 2007. |
4
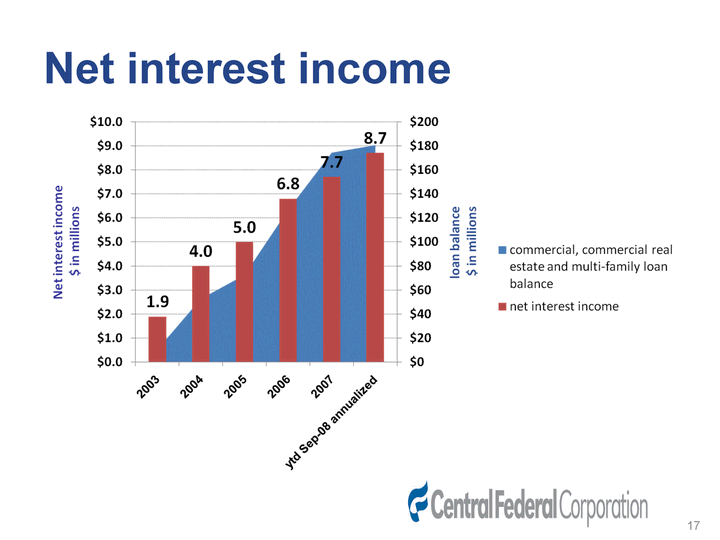
Net interest income
Net interest income increased $292,000, or 14.7%, to $2.3 million for the quarter ended September 30, 2008 compared to $2.0 million for the quarter ended September 30, 2007. The increase was due to a decline in the average cost of interest-bearing liabilities to 3.17% in the third quarter of 2008 from 4.68% in the third quarter of 2007. The decline in the cost of interest-bearing liabilities resulted in a 28.9% decrease in interest expense. Interest income decreased 10.3% due to a decline in the average yield on interest-earning assets to 6.36% in the third quarter of 2008 from 7.38% in the third quarter of 2007. The decline in income caused by the lower yield on interest-earning assets was partially offset by a $10.5 million increase in average interest-earning assets for the quarter ended September 30, 2008 compared to the quarter ended September 30, 2007.
Net interest income increased $908,000, or 16.1%, to $6.5 million for the nine months ended September 30, 2008 compared to $5.6 million for the nine months ended September 30, 2007. The increase was due to a decline in the average cost of interest-bearing liabilities to 3.44% for the nine months ended September 30, 2008 from 4.52% for the nine months ended September 30, 2007. The decline in the average cost of interest-bearing liabilities resulted in a 15.2% decrease in interest expense. Interest income decreased 1.5% primarily due to a decline in the average yield on interest earning assets to 6.49% for the nine months ended September 30, 2008 from 7.21% for the nine months ended September 30, 2007. The decrease in income caused by the lower yield was partially offset by a $23.1 million increase in average interest-earning assets for the nine months ended September 30, 2008 compared to the nine months ended September 30, 2007.
During 2007, the management of CFBank, through its asset/liability strategies, positioned liabilities to be more sensitive to a reduction in short-term interest rates. The reductions in the Federal Funds rate, the prime rate and other market interest rates, beginning in September 2007, resulted in larger decreases in funding costs than in asset yields. The decline in funding costs positively impacted net interest margin in both the quarter and nine months ended September 30, 2008. Net interest margin improved to 3.47% during the quarter ended September 30, 2008, from 3.15% during the quarter ended September 30, 2007. Net interest margin improved to 3.36% during the nine months ended September 30, 2008, from 3.17% during the nine months ended September 30, 2007. Due to the low level of short term market rates, management has extended the terms of some liabilities to protect net interest margin in the event of a rise in interest rates, however future downward pressure on margins is possible given the current economic environment.
Noninterest income
Noninterest income totaled $176,000 for the quarter ended September 30, 2008, compared to $164,000 for the quarter ended September 30, 2007. Noninterest income totaled $584,000 for the nine months ended September 30, 2008, compared to $579,000 for the nine months ended September 30, 2007. Noninterest income for both the quarter and nine months ended September 30, 2008 included higher income from service charges on deposit accounts and net gains on the sale of securities. Net gains on sales of loans were lower in both the quarter and nine months ended September 30, 2008, due to fewer mortgage loan originations in the current year periods.
Provision for loan losses
Provisions for loan losses are provided in relation to loan growth, portfolio composition, current economic conditions and trends, and ascertainable credit risk information available. The provision totaled $183,000 in the quarter ended September 30, 2008 compared to $293,000 in the quarter ended September 30, 2007. The provision totaled $667,000 for the nine months ended September 30, 2008 compared to $435,000 for the nine months ended September 30, 2007. The increase in the provision during the nine months ended September 30, 2008 was due to an increase in nonperforming loans and loan charge-offs.
5
Nonperforming loans increased $1.5 million and totaled $2.0 million, or 0.85% of total loans, at September 30, 2008 compared to $488,000, or 0.21% of total loans, at December 31, 2007. The increase in nonperforming loans was due to one commercial loan, totaling $645,000, and three multi-family loans to one borrower, totaling $1.3 million, which were past due and on nonaccrual status at September 30, 2008. The amount of the allowance for loan losses specifically allocated to nonperforming loans totaled $394,000 at September 30, 2008. Management believes the remaining nonperforming loan balances are adequately secured by the underlying collateral at this time, however future additions may be necessary based on factors discussed below.
Net charge-offs totaled $306,000, or 0.18% on an annualized basis of average loans, for the nine months ended September 30, 2008 compared to a net recovery of $39,000, or .03% on an annualized basis of average loans, for the nine months ended September 20, 3007. Current period charge-offs related to home equity lines of credit and single-family mortgage loans.
The ratio of the allowance for loan losses to total loans was 1.30% at September 30, 2008 compared to 1.15% at December 31, 2007.
The Company believes that the allowance for loan losses is adequate to absorb probable incurred credit losses in the loan portfolio at September 30, 2008; however, future additions to the allowance may be necessary based on factors such as changes in client business performance, economic conditions, and changes in real estate values. Management continues to diligently monitor credit quality in the existing portfolio and analyzes potential loan opportunities carefully in order to manage credit risk.
Noninterest expense
Noninterest expense for the quarter ended September 30, 2008 totaled $1.9 million compared to $2.6 million in the prior year quarter, which included $774,000 related to an arbitration loss and lease termination expense. The ratio of noninterest expense to average assets improved to 2.66% in the third quarter of 2008 compared to 3.84% in the prior year quarter. The efficiency ratio improved to 76.42% in the quarter ended September 30, 2008 from 120.65% in the prior year quarter.
Noninterest expense for the nine months ended September 30, 2008 totaled $5.6 million compared to noninterest expense of $6.3 million in the prior year period. The ratio of noninterest expense to average assets improved to 2.68% in the nine months ended September 30, 2008 compared to 3.30% in the prior year period. The efficiency ratio improved to 78.91% during the nine months ended September 30, 2008 from 101.11% during the prior year period.
Balance sheet activity
Assets totaled $280.8 million at September 30, 2008 and increased $1.2 million, or 0.4%, from $279.6 million at December 31, 2007. The increase was primarily due to an increase in overnight cash investments and loans, partially offset by a decrease in the balance of securities available for sale, which resulted from sales, maturities and repayments.
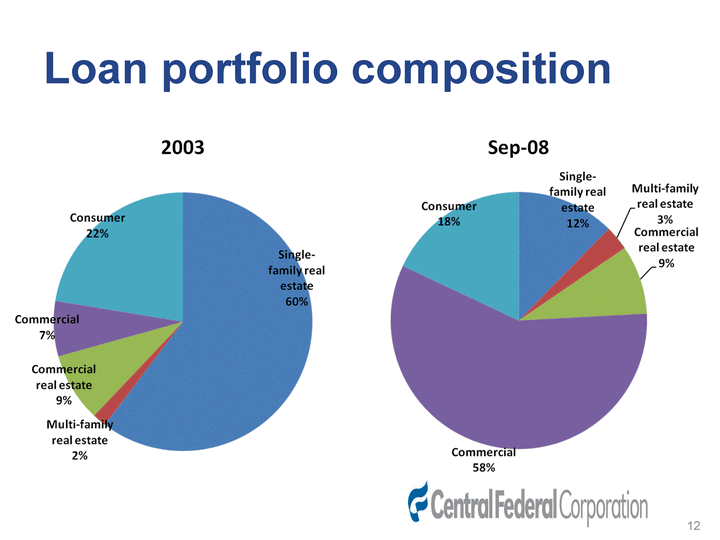
Net loans totaled $231.8 million at September 30, 2008 and increased $1.3 million, or 0.6%, from $230.5 million at December 31, 2007. Commercial, commercial real estate and multi-family loans totaled $180.2 million at September 30, 2008 and increased $6.3 million, or 3.6%, from $173.9 million at December 31, 2007. Consumer loans totaled $26.8 million at September 30, 2008 and decreased $1.4 million, or 5.1%, from $28.2 million at December 31, 2007. The decrease in consumer loan balances was primarily due to repayments on auto loans. Mortgage loans totaled $27.8 million at September 30, 2008, and decreased $3.2 million, or 10.2%, from $31.0 million at December 31, 2007, primarily due to prepayments.
6
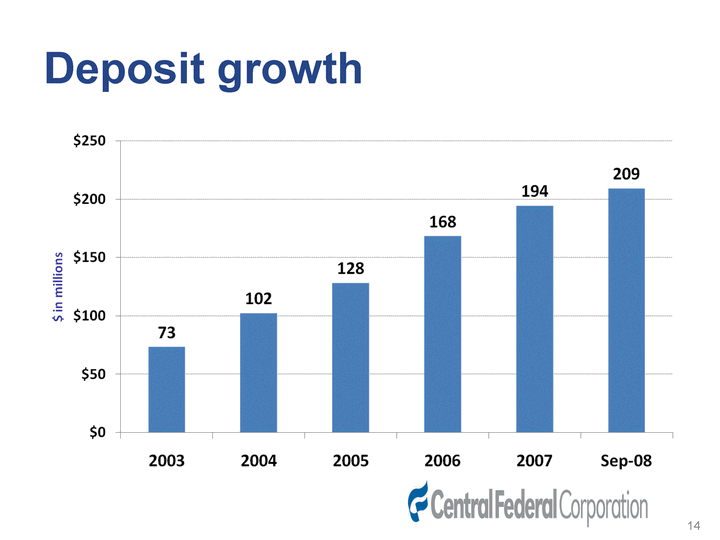
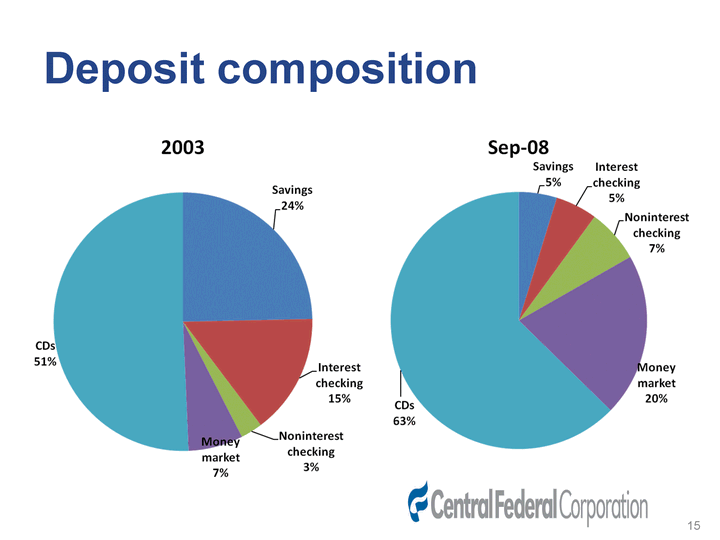
Deposits totaled $209.4 million at September 30, 2008 and increased $15.1 million, or 7.8%, from $194.3 million at December 31, 2007. The increase in deposits was due to growth in certificate of deposit accounts, which increased $17.1 million during the nine months ended September 30, 2008. CFBank is a participant in the Certificate of Deposit Account Registry Service (“CDARS”) which allows the Bank to provide customers full FDIC insurance on certificate of deposit balances up to $50 million. Customer balances in the CDARS program increased $24.1 million during the nine months ended September 30, 2008.
FHLB advances totaled $38.2 million at September 30, 2008 and decreased $11.3 million, or 22.8%, compared to $49.5 million at December 31, 2007. FHLB advances were repaid with funds from the increase in deposits.
Shareholders’ equity totaled $25.8 million at September 30, 2008 and decreased $1.6 million, or 5.7%, compared to $27.4 million at December 31, 2007. The decrease in equity was due to the repurchase of 365,000 shares of CFBK stock, which totaled $1.6 million, and dividends paid to shareholders, offset by net income.
About Central Federal Corporation and CFBank
Central Federal Corporation is the holding company for CFBank, a federally chartered savings association formed in Ohio in 1892. CFBank has four full-service banking offices in Fairlawn, Calcutta, Wellsville and Worthington, Ohio. Additional information about CFBank’s banking services and the Company is available atwww.CFBankOnline.com.
Forward-Looking Information
Certain statements contained in this earnings release which are not statements of historical fact constitute forward-looking statements within the meaning of the Private Securities Litigation Reform Act of 1995. Words such as “believes,” “anticipates,” “expects,” “intends,” “targeted” and similar expressions are intended to identify forward-looking statements, but are not the exclusive means of identifying those statements. Forward-looking statements involve risks and uncertainties. Actual results may differ materially from those predicted by the forward-looking statements because of various factors and possible events, including: (i) changes in political, economic or other factors such as inflation rates, recessionary or expansive trends, and taxes; (ii) competitive pressures; (iii) fluctuations in interest rates; (iv) the level of defaults and prepayments on loans made by CFBank; (v) unanticipated litigation, claims or assessments; (vi) fluctuations in the cost of obtaining funds to make loans; and (vii) regulatory changes. Further information on these risk factors is included in the Company’s filings with the Securities and Exchange Commission. Forward-looking statements speak only as of the date on which they are made and the Company undertakes no obligation to update any forward-looking statement to reflect events or circumstances after the date on which the statement is made to reflect unanticipated events.
7
| | | | | | | | | | | | | | | | | | | | | | | | | |
| Consolidated Statements of Operations | | Three months ended | | | | | | | Nine months ended | | | | |
| ($ in thousands, except share data) | | September 30, | | | | | | | September 30, | | | | |
| (unaudited) | | 2008 | | | 2007 | | | % change | | | 2008 | | | 2007 | | | % change | |
| Total interest income | | $ | 4,168 | | | $ | 4,645 | | | | -10 | % | | $ | 12,627 | | | $ | 12,813 | | | | -1 | % |
| Total interest expense | | | 1,895 | | | | 2,664 | | | | -29 | % | | | 6,091 | | | | 7,185 | | | | -15 | % |
| | | | | | | | | | | | | | | | | | | | | |
| Net interest income | | | 2,273 | | | | 1,981 | | | | 15 | % | | | 6,536 | | | | 5,628 | | | | 16 | % |
| | | | | | | | | | | | | | | | | | | | | | | | | |
| Provision for loan losses | | | 183 | | | | 293 | | | | -38 | % | | | 667 | | | | 435 | | | | 53 | % |
| | | | | | | | | | | | | | | | | | | | | |
| Net interest income after provision for loan losses | | | 2,090 | | | | 1,688 | | | | 24 | % | | | 5,869 | | | | 5,193 | | | | 13 | % |
| | | | | | | | | | | | | | | | | | | | | | | | | |
| Noninterest income | | | | | | | | | | | | | | | | | | | | | | | | |
| Service charges on deposit accounts | | | 91 | | | | 78 | | | | 17 | % | | | 260 | | | | 203 | | | | 28 | % |
| Net gain on sales of loans | | | 33 | | | | 35 | | | | -6 | % | | | 130 | | | | 207 | | | | -37 | % |
| Net gain on sale of securities | | | 10 | | | | — | | | | n/m | | | | 54 | | | | — | | | | n/m | |
| Other | | | 42 | | | | 51 | | | | -18 | % | | | 140 | | | | 169 | | | | -17 | % |
| | | | | | | | | | | | | | | | | | | | | |
| Noninterest income | | | 176 | | | | 164 | | | | 7 | % | | | 584 | | | | 579 | | | | 1 | % |
| | | | | | | | | | | | | | | | | | | | | | | | | |
| Noninterest expense | | | | | | | | | | | | | | | | | | | | | | | | |
| Salaries and employee benefits | | | 991 | | | | 1,617 | | | | -39 | % | | | 3,036 | | | | 3,631 | | | | -16 | % |
| Occupancy and equipment | | | 105 | | | | 200 | | | | -48 | % | | | 323 | | | | 442 | | | | -27 | % |
| Data processing | | | 131 | | | | 135 | | | | -3 | % | | | 421 | | | | 418 | | | | 1 | % |
| Franchise taxes | | | 73 | | | | 73 | | | | 0 | % | | | 239 | | | | 211 | | | | 13 | % |
| Professional fees | | | 160 | | | | 101 | | | | 58 | % | | | 325 | | | | 294 | | | | 11 | % |
| Director fees | | | 34 | | | | 37 | | | | -8 | % | | | 102 | | | | 112 | | | | -9 | % |
| Postage, printing and supplies | | | 32 | | | | 39 | | | | -18 | % | | | 127 | | | | 132 | | | | -4 | % |
| Advertising and promotion | | | 12 | | | | 80 | | | | -85 | % | | | 39 | | | | 176 | | | | -78 | % |
| Telephone | | | 23 | | | | 24 | | | | -4 | % | | | 67 | | | | 77 | | | | -13 | % |
| Loan expenses | | | 6 | | | | 3 | | | | 100 | % | | | 14 | | | | 10 | | | | 40 | % |
| Foreclosed assets, net | | | (18 | ) | | | (48 | ) | | | -63 | % | | | (10 | ) | | | (38 | ) | | | -74 | % |
| Depreciation | | | 167 | | | | 168 | | | | -1 | % | | | 518 | | | | 465 | | | | 11 | % |
| Other | | | 148 | | | | 159 | | | | -7 | % | | | 375 | | | | 346 | | | | 8 | % |
| | | | | | | | | | | | | | | | | | | | | |
| Noninterest expense | | | 1,864 | | | | 2,588 | | | | -28 | % | | | 5,576 | | | | 6,276 | | | | -11 | % |
| | | | | | | | | | | | | | | | | | | | | | | | | |
| Income (loss) before income taxes | | | 402 | | | | (736 | ) | | | n/m | | | | 877 | | | | (504 | ) | | | n/m | |
| Income tax expense (benefit) | | | 117 | | | | (253 | ) | | | n/m | | | | 244 | | | | (190 | ) | | | n/m | |
| | | | | | | | | | | | | | | | | | | | | |
| Net income (loss) | | $ | 285 | | | $ | (483 | ) | | | n/m | | | $ | 633 | | | $ | (314 | ) | | | n/m | |
| | | | | | | | | | | | | | | | | | | | | |
| | | | | | | | | | | | | | | | | | | | | | | | | |
Share Data | | | | | | | | | | | | | | | | | | | | | | | | |
| Basic earnings (loss) per share | | $ | 0.07 | | | $ | (0.11 | ) | | | n/m | | | $ | 0.15 | | | $ | (0.07 | ) | | | n/m | |
| Diluted earnings (loss) per share | | $ | 0.07 | | | $ | (0.11 | ) | | | n/m | | | $ | 0.15 | | | $ | (0.07 | ) | | | n/m | |
| Cash dividends per share | | $ | 0.05 | | | $ | 0.05 | | | | | | | $ | 0.15 | | | $ | 0.23 | | | | | |
| Average shares outstanding — basic | | | 4,082,000 | | | | 4,417,040 | | | | | | | | 4,241,499 | | | | 4,483,419 | | | | | |
| Average shares outstanding — diluted | | | 4,082,000 | | | | 4,417,040 | | | | | | | | 4,243,026 | | | | 4,483,419 | | | | | |
| |
|
| |
| n/m — not meaningful | | | | | | | | | | | | | | | | | | | | | | | | |
8
| | | | | | | | | | | | | | | | | | | | | |
| Consolidated Statements of Financial Condition | | | | | | | | | | | | | | | |
| ($ in thousands) | | September 30, | | | June 30, | | | March 31, | | | December 31, | | | September 30, | |
| (unaudited) | | 2008 | | | 2008 | | | 2008 | | | 2007 | | | 2007 | |
Assets | | | | | | | | | | | | | | | | | | | | |
| Cash and cash equivalents | | $ | 7,601 | | | $ | 3,607 | | | $ | 6,914 | | | $ | 3,894 | | | $ | 3,559 | |
| Securities available for sale | | | 25,323 | | | | 26,182 | | | | 27,607 | | | | 28,398 | | | | 28,927 | |
| Loans held for sale | | | 549 | | | | 1,805 | | | | 1,965 | | | | 457 | | | | 721 | |
| Loans | | | | | | | | | | | | | | | | | | | | |
| Mortgages | | | 27,844 | | | | 30,766 | | | | 30,944 | | | | 30,998 | | | | 30,618 | |
| Commercial, commercial real estate and multi-family | | | 180,191 | | | | 176,696 | | | | 169,649 | | | | 173,916 | | | | 164,740 | |
| Consumer | | | 26,796 | | | | 26,308 | | | | 26,884 | | | | 28,245 | | | | 28,885 | |
| | | | | | | | | | | | | | | | |
| Total loans | | | 234,831 | | | | 233,770 | | | | 227,477 | | | | 233,159 | | | | 224,243 | |
| Less allowance for loan losses | | | (3,045 | ) | | | (2,947 | ) | | | (2,729 | ) | | | (2,684 | ) | | | (2,584 | ) |
| | | | | | | | | | | | | | | | |
| Loans, net | | | 231,786 | | | | 230,823 | | | | 224,748 | | | | 230,475 | | | | 221,659 | |
| Federal Home Loan Bank stock | | | 2,109 | | | | 2,081 | | | | 2,054 | | | | 1,963 | | | | 1,963 | |
| Loan servicing rights | | | 123 | | | | 134 | | | | 146 | | | | 157 | | | | 172 | |
| Foreclosed assets, net | | | — | | | | 123 | | | | — | | | | 86 | | | | 109 | |
| Premises and equipment, net | | | 5,304 | | | | 5,404 | | | | 5,544 | | | | 5,717 | | | | 5,834 | |
| Bank owned life insurance | | | 3,863 | | | | 3,832 | | | | 3,798 | | | | 3,769 | | | | 3,742 | |
| Deferred tax asset | | | 1,709 | | | | 1,865 | | | | 1,777 | | | | 1,995 | | | | 2,181 | |
| Accrued interest receivable and other assets | | | 2,388 | | | | 2,766 | | | | 1,841 | | | | 2,671 | | | | 2,391 | |
| | | | | | | | | | | | | | | | |
| | | $ | 280,755 | | | $ | 278,622 | | | $ | 276,394 | | | $ | 279,582 | | | $ | 271,258 | |
| | | | | | | | | | | | | | | | |
| | | | | | | | | | | | | | | | | | | | | |
Liabilities and Shareholders’ Equity | | | | | | | | | | | | | | | | | | | | |
| Deposits | | | | | | | | | | | | | | | | | | | | |
| Noninterest bearing | | $ | 14,238 | | | $ | 13,458 | | | $ | 12,166 | | | $ | 12,151 | | | $ | 12,040 | |
| Interest bearing | | | 195,189 | | | | 185,485 | | | | 174,192 | | | | 182,157 | | | | 174,450 | |
| | | | | | | | | | | | | | | | |
| Total deposits | | | 209,427 | | | | 198,943 | | | | 186,358 | | | | 194,308 | | | | 186,490 | |
| Federal Home Loan Bank advances | | | 38,200 | | | | 46,775 | | | | 55,150 | | | | 49,450 | | | | 50,175 | |
| Advances by borrowers for taxes and insurance | | | 79 | | | | 94 | | | | 71 | | | | 154 | | | | 85 | |
| Accrued interest payable and other liabilities | | | 2,064 | | | | 1,689 | | | | 2,109 | | | | 3,136 | | | | 2,274 | |
| Subordinated debentures | | | 5,155 | | | | 5,155 | | | | 5,155 | | | | 5,155 | | | | 5,155 | |
| | | | | | | | | | | | | | | | |
| Total liabilities | | | 254,925 | | | | 252,656 | | | | 248,843 | | | | 252,203 | | | | 244,179 | |
| | | | | | | | | | | | | | | | | | | | | |
| Shareholders’ equity | | | 25,830 | | | | 25,966 | | | | 27,551 | | | | 27,379 | | | | 27,079 | |
| | | | | | | | | | | | | | | | |
| | | $ | 280,755 | | | $ | 278,622 | | | $ | 276,394 | | | $ | 279,582 | | | $ | 271,258 | |
| | | | | | | | | | | | | | | | |
9
| | | | | | | | | | | | | | | | | | | | | | | | | | | | | |
| Consolidated Financial Highlights | | At or for the three months ended | | At or for the nine months ended |
| ($ in thousands except per share data) | | September 30, | | June 30, | | March 31, | | December 31, | | September 30, | | September 30, |
| (unaudited) | | 2008 | | 2008 | | 2008 | | 2007 | | 2007 | | 2008 | | 2007 |
Earnings | | | | | | | | | | | | | | | | | | | | | | | | | | | | |
| Net interest income | | $ | 2,273 | | | $ | 2,219 | | | $ | 2,044 | | | $ | 2,100 | | | $ | 1,981 | | | $ | 6,536 | | | $ | 5,628 | |
| Provision for loan losses | | $ | 183 | | | $ | 260 | | | $ | 224 | | | $ | 104 | | | $ | 293 | | | $ | 667 | | | $ | 435 | |
| Noninterest income | | $ | 176 | | | $ | 217 | | | $ | 191 | | | $ | 149 | | | $ | 164 | | | $ | 584 | | | $ | 579 | |
| Noninterest expense | | $ | 1,864 | | | $ | 1,866 | | | $ | 1,846 | | | $ | 1,721 | | | $ | 2,588 | | | $ | 5,576 | | | $ | 6,276 | |
| Net income (loss) | | $ | 285 | | | $ | 224 | | | $ | 124 | | | $ | 297 | | | $ | (483 | ) | | $ | 633 | | | $ | (314 | ) |
| Basic earnings (loss) per share | | $ | 0.07 | | | $ | 0.05 | | | $ | 0.03 | | | $ | 0.07 | | | $ | (0.11 | ) | | $ | 0.15 | | | $ | (0.07 | ) |
| Diluted earnings (loss) per share | | $ | 0.07 | | | $ | 0.05 | | | $ | 0.03 | | | $ | 0.07 | | | $ | (0.11 | ) | | $ | 0.15 | | | $ | (0.07 | ) |
| | | | | | | | | | | | | | | | | | | | | | | | | | | | | |
Performance Ratios (annualized) | | | | | | | | | | | | | | | | | | | | | | | | | | | | |
| Return on average assets | | | 0.41 | % | | | 0.32 | % | | | 0.18 | % | | | 0.43 | % | | | (0.72 | %) | | | 0.30 | % | | | (0.16 | %) |
| Return on average equity | | | 4.43 | % | | | 3.43 | % | | | 1.79 | % | | | 4.34 | % | | | (7.04 | %) | | | 3.18 | % | | | (1.48 | %) |
| Average yield on interest-earning assets | | | 6.36 | % | | | 6.33 | % | | | 6.77 | % | | | 7.27 | % | | | 7.38 | % | | | 6.49 | % | | | 7.21 | % |
| Average rate paid on interest-bearing liabilities | | | 3.17 | % | | | 3.20 | % | | | 3.96 | % | | | 4.46 | % | | | 4.68 | % | | | 3.44 | % | | | 4.52 | % |
| Average interest rate spread | | | 3.19 | % | | | 3.13 | % | | | 2.81 | % | | | 2.81 | % | | | 2.70 | % | | | 3.05 | % | | | 2.69 | % |
| Net interest margin, fully taxable equivalent | | | 3.47 | % | | | 3.43 | % | | | 3.18 | % | | | 3.24 | % | | | 3.15 | % | | | 3.36 | % | | | 3.17 | % |
| Efficiency ratio | | | 76.42 | % | | | 77.27 | % | | | 83.45 | % | | | 76.52 | % | | | 120.65 | % | | | 78.91 | % | | | 101.11 | % |
| Noninterest expense to average assets | | | 2.66 | % | | | 2.70 | % | | | 2.68 | % | | | 2.48 | % | | | 3.84 | % | | | 2.68 | % | | | 3.30 | % |
| | | | | | | | | | | | | | | | | | | | | | | | | | | | | |
Capital | | | | | | | | | | | | | | | | | | | | | | | | | | | | |
| Equity to total assets at end of period | | | 9.20 | % | | | 9.32 | % | | | 9.97 | % | | | 9.79 | % | | | 9.98 | % | | | 9.20 | % | | | 9.98 | % |
| Tangible equity to tangible assets | | | 9.20 | % | | | 9.32 | % | | | 9.97 | % | | | 9.79 | % | | | 9.98 | % | | | 9.20 | % | | | 9.98 | % |
| Book value per share | | $ | 6.30 | | | $ | 6.19 | | | $ | 6.17 | | | $ | 6.17 | | | $ | 6.11 | | | $ | 6.30 | | | $ | 6.11 | |
| Tangible book value per share | | $ | 6.30 | | | $ | 6.19 | | | $ | 6.17 | | | $ | 6.17 | | | $ | 6.11 | | | $ | 6.30 | | | $ | 6.11 | |
| Period-end market value per share | | $ | 3.50 | | | $ | 3.74 | | | $ | 4.50 | | | $ | 3.86 | | | $ | 5.48 | | | $ | 3.50 | | | $ | 5.48 | |
| Dividends declared per common share | | $ | 0.05 | | | $ | 0.05 | | | $ | 0.05 | | | $ | 0.05 | | | $ | 0.05 | | | $ | 0.15 | | | $ | 0.23 | |
| Period-end common shares outstanding | | | 4,102,662 | | | | 4,192,662 | | | | 4,467,662 | | | | 4,434,787 | | | | 4,434,787 | | | | 4,102,662 | | | | 4,434,787 | |
| Average basic shares outstanding | | | 4,082,000 | | | | 4,298,000 | | | | 4,429,487 | | | | 4,421,255 | | | | 4,417,040 | | | | 4,241,499 | | | | 4,483,419 | |
| Average diluted shares outstanding | | | 4,082,000 | | | | 4,302,154 | | | | 4,429,913 | | | | 4,421,255 | | | | 4,417,040 | | | | 4,243,026 | | | | 4,483,419 | |
| | | | | | | | | | | | | | | | | | | | | | | | | | | | | |
Asset Quality | | | | | | | | | | | | | | | | | | | | | | | | | | | | |
| Nonperforming loans | | $ | 2,007 | | | $ | 1,972 | | | $ | 1,623 | | | $ | 488 | | | $ | 196 | | | $ | 2,007 | | | $ | 196 | |
| Nonperforming loans to total loans | | | 0.85 | % | | | 0.84 | % | | | 0.71 | % | | | 0.21 | % | | | 0.09 | % | | | 0.85 | % | | | 0.09 | % |
| Nonperforming assets to total assets | | | 0.71 | % | | | 0.75 | % | | | 0.59 | % | | | 0.21 | % | | | 0.11 | % | | | 0.71 | % | | | 0.11 | % |
| Allowance for loan losses to total loans | | | 1.30 | % | | | 1.26 | % | | | 1.20 | % | | | 1.15 | % | | | 1.15 | % | | | 1.30 | % | | | 1.15 | % |
| Allowance for loan losses to nonperforming loans | | | 151.72 | % | | | 149.44 | % | | | 168.15 | % | | | 5.50 | % | | | 1318.37 | % | | | 151.72 | % | | | 1318.37 | % |
| Net charge-offs (recoveries) | | $ | 86 | | | $ | 41 | | | $ | 179 | | | $ | 3 | | | $ | (18 | ) | | $ | 306 | | | $ | (39 | ) |
| Annualized net charge-offs (recoveries) to average loans | | | 0.15 | % | | | 0.07 | % | | | 0.32 | % | | | 0.01 | % | | | -0.03 | % | | | 0.18 | % | | | -0.03 | % |
| | | | | | | | | | | | | | | | | | | | | | | | | | | | | |
Average Balances | | | | | | | | | | | | | | | | | | | | | | | | | | | | |
| Loans | | $ | 233,444 | | | $ | 229,051 | | | $ | 226,893 | | | $ | 227,943 | | | $ | 218,917 | | | $ | 229,796 | | | $ | 202,779 | |
| Assets | | $ | 280,093 | | | $ | 276,438 | | | $ | 275,811 | | | $ | 277,094 | | | $ | 269,763 | | | $ | 277,447 | | | $ | 253,749 | |
| Shareholders’ equity | | $ | 25,729 | | | $ | 26,133 | | | $ | 27,677 | | | $ | 27,363 | | | $ | 27,453 | | | $ | 26,513 | | | $ | 28,281 | |
10

| Loan portfolio composition |
| Allowance for loan losses |
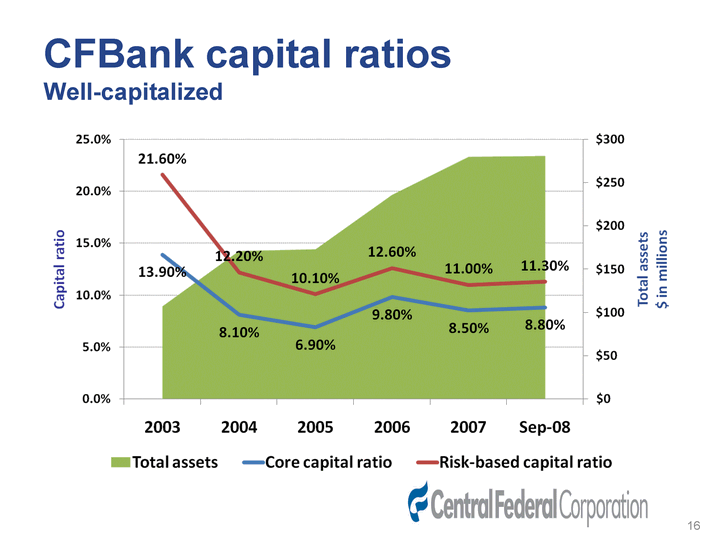
| CFBank capital ratios Well-capitalized |
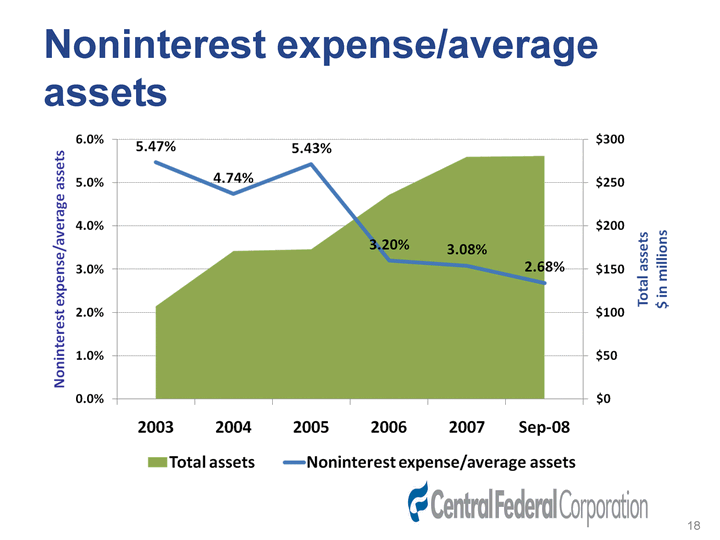
| Noninterest expense/average assets |