PRESENTATION 2015 Performance Highlights Growth & Earnings Opportunities Enhancing Shareholder Value. Financial & Operating Highlights
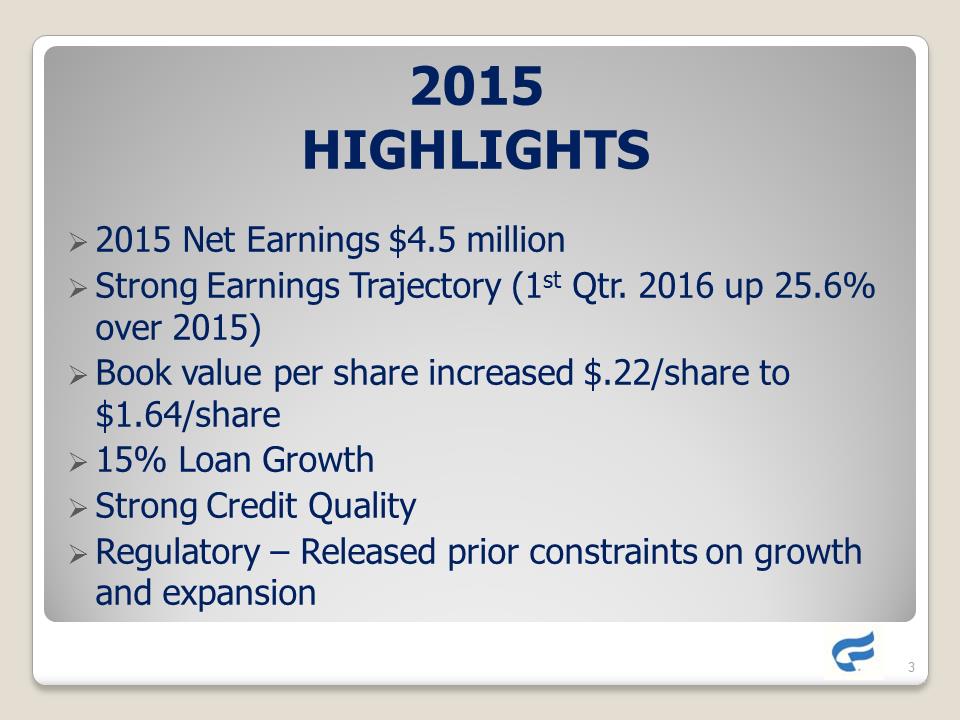
2015 HIGHLIGHTS 2015 Net Earnings of $4.5 million. Strong Earnings Trajectory by 1stQtr. 2016 up 25.6% over 2015.Book value per share increased $.22/share to $1.64/share 15% Loan Growth Strong Credit Quality .Regulatory Released prior constraints on growth and expansion
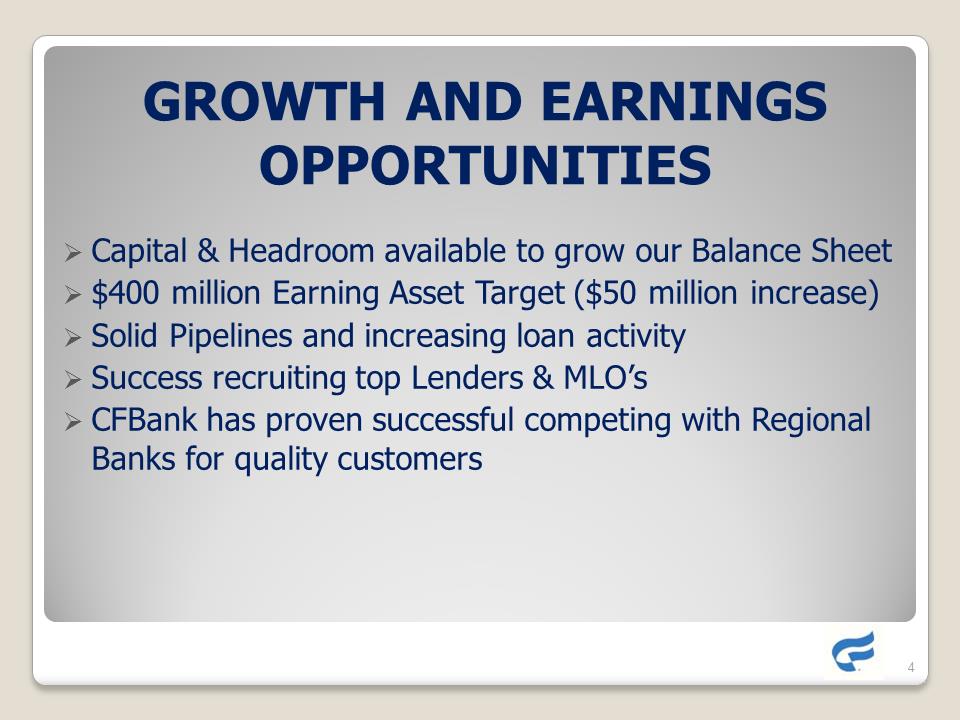
GROWTH AND EARNINGS OPPORTUNITIES. Capital & Headroom available to grow our Balance Sheet. $400 million Earning Asset Target ($50 million increase).Solid Pipelines and increasing loan activity. Success recruiting top Lenders & MLO’s. CFBank has proven successful competing with Regional Banks for quality customers
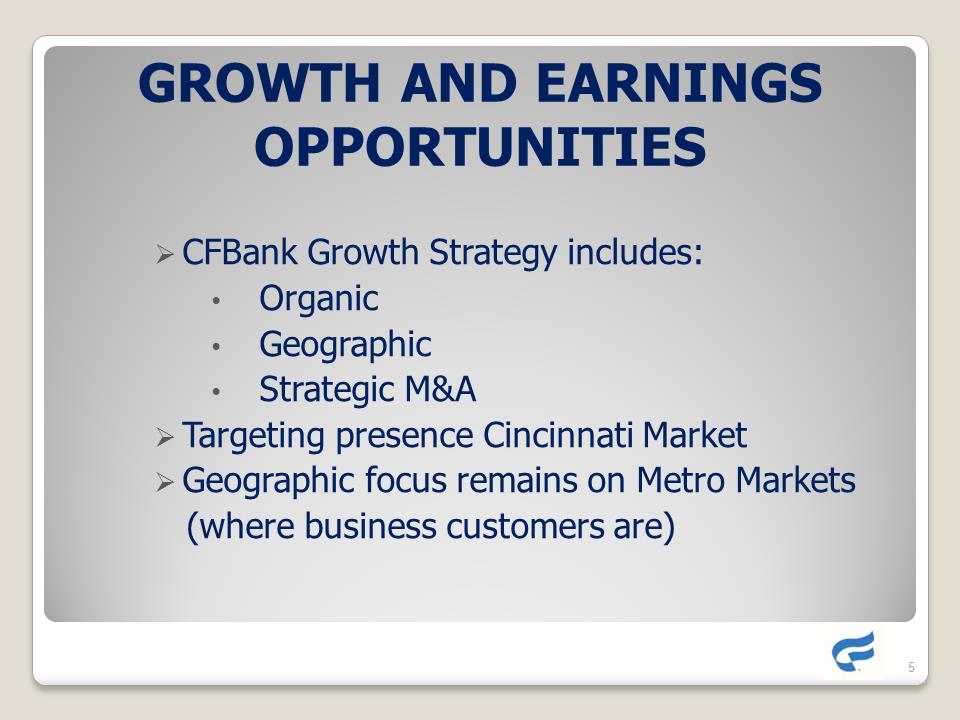
GROWTH AND EARNINGS OPPORTUNITIES. CFBank Growth Strategy includes Organic Geographic Stategic M&A. Targeting presence Cincinnati Market Geographic focus remains on Metro Markets (where business customers are)
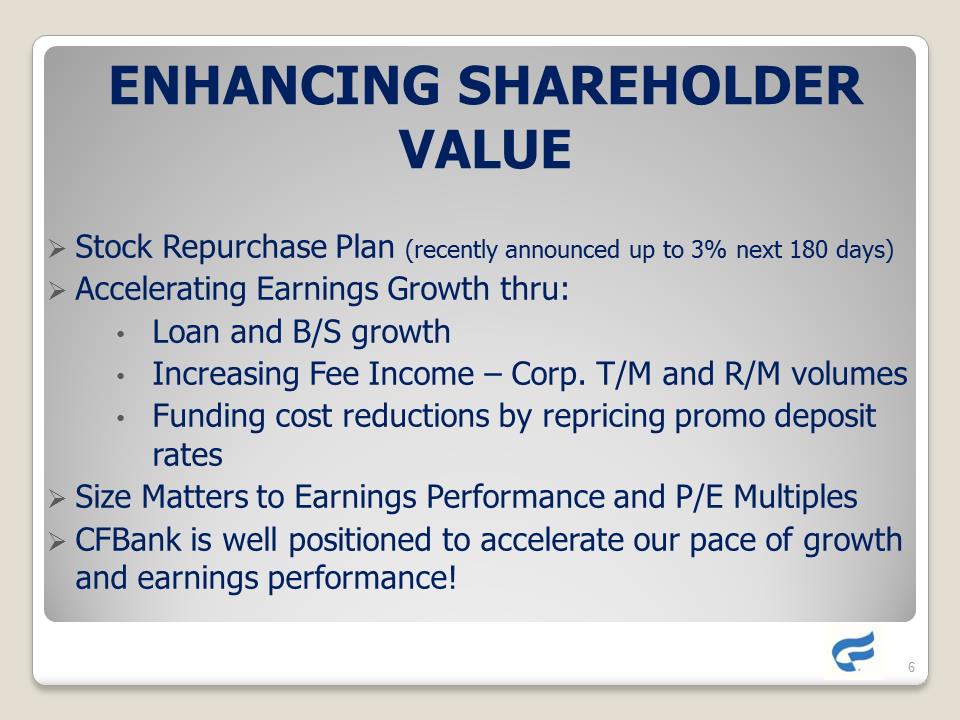
ENHANCING SHAREHOLDER VALUE. Stock Repurchase Plan (recently announced up to 3% next 180 days).Accelerating Earnings Growth thru: Loan and B/S growth Increasing Fee Income –Corp. T/M and R/M volumes Funding cost reductions by repricing promo deposit rates. Size Matters to Earnings Performance and P/E Multiples. CFBank is well positioned to accelerate our pace of growth and earnings performance!
FINANCIAL HIGHLIGHTS John Helmsdoerfer, EVP & CFO
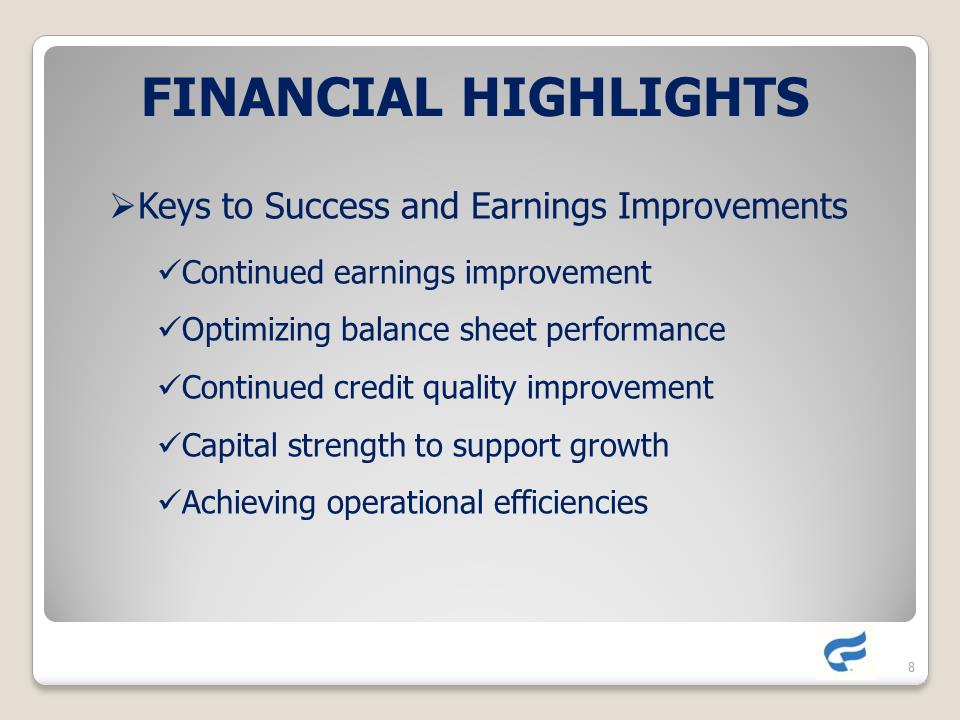
FINANCIAL HIGHLIGHTS Keys to Success and Earnings Improvements Continued earnings improvement Optimizing balance sheet performance Continued credit quality improvement Capital strength to support growth Achieving operational efficiencies
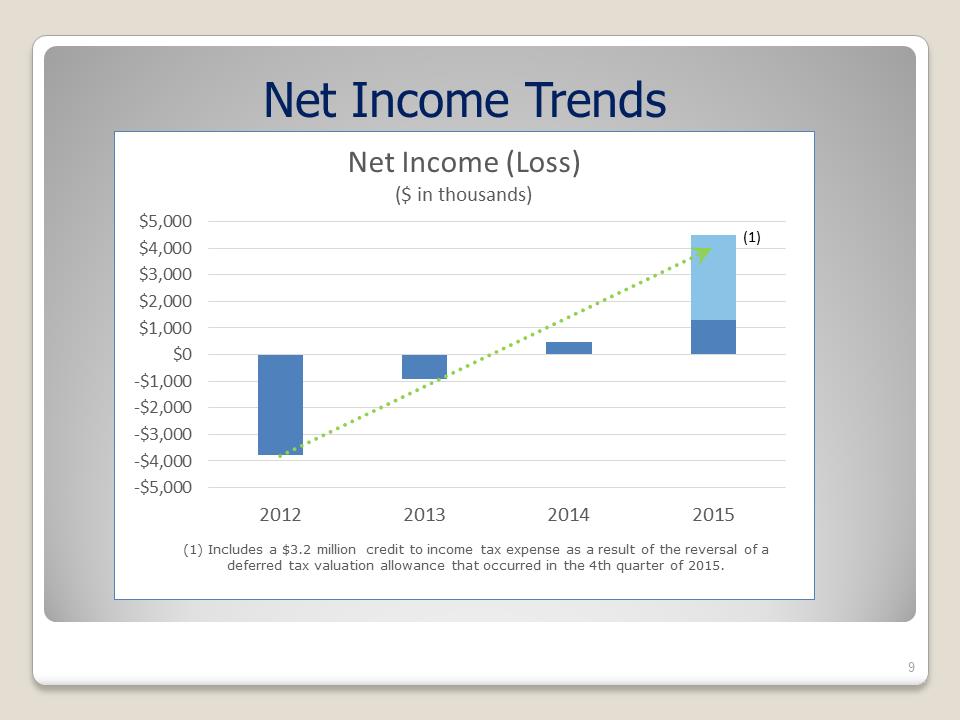
Net Income Trends Net Income (Loss) ($ in thousands) Includes a $3.2 million credit to income tax expense as a result of the reversal of a deferred tax valuation allowance that occurred in the 4th quarter of 2015.
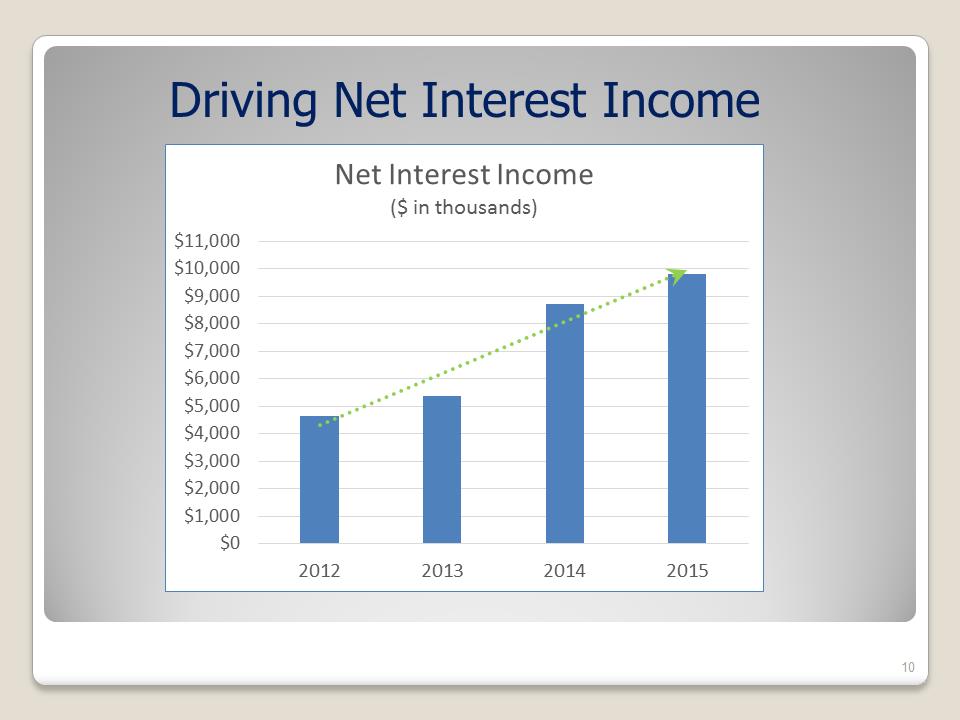
Driving Net Interest Income Net Interest Income ($ in thousands)
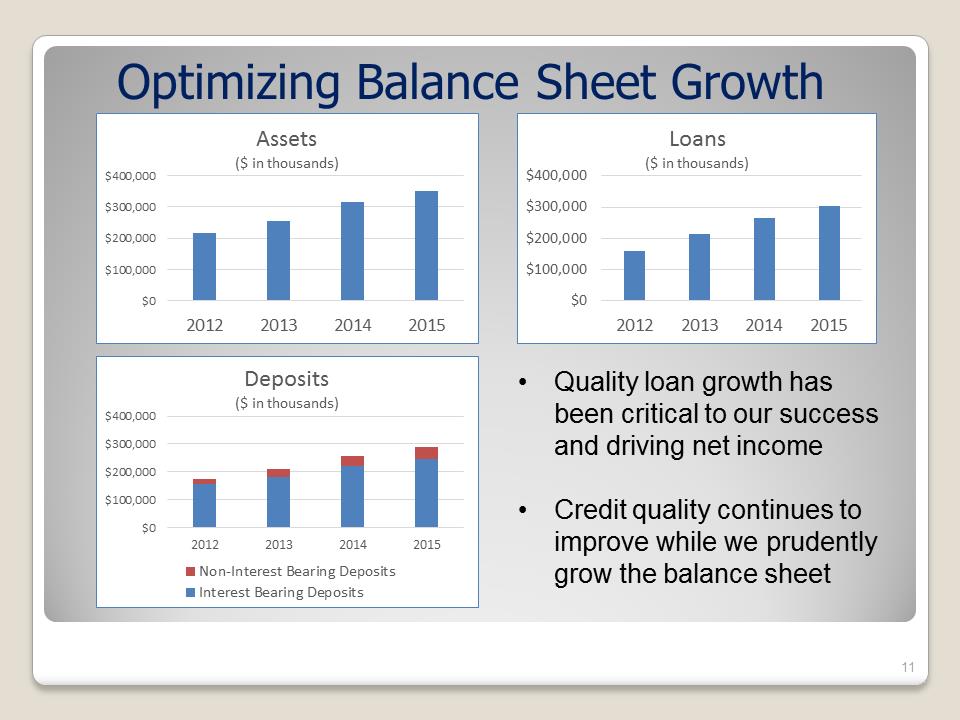
Optimizing Balance Sheet Growth Quality loan growth has been critical to our success and driving net income Credit quality continues to improve while we prudently grow the balance sheet Loans ($ in thousands) Deposits ($ in thousands) Non-Interest Bearing Deposits Interest Bearing Deposits Assets ($ in thousands)
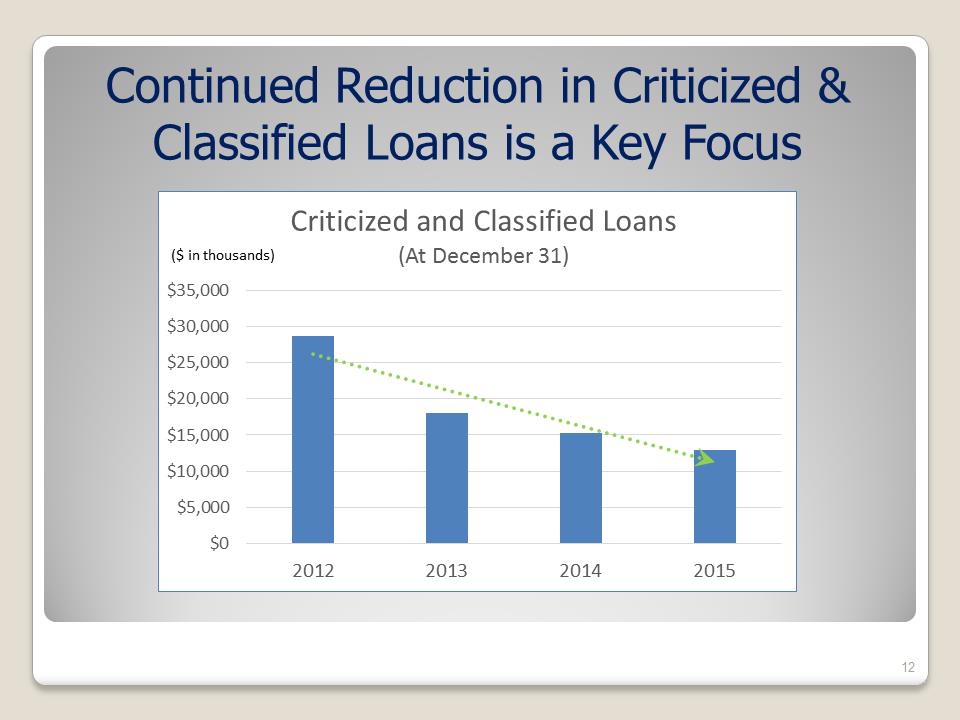
Continued Reduction in Criticized & Classified Loans is a Key Focus Criticized and Classified Loans (At December 31) ($ in thousands)
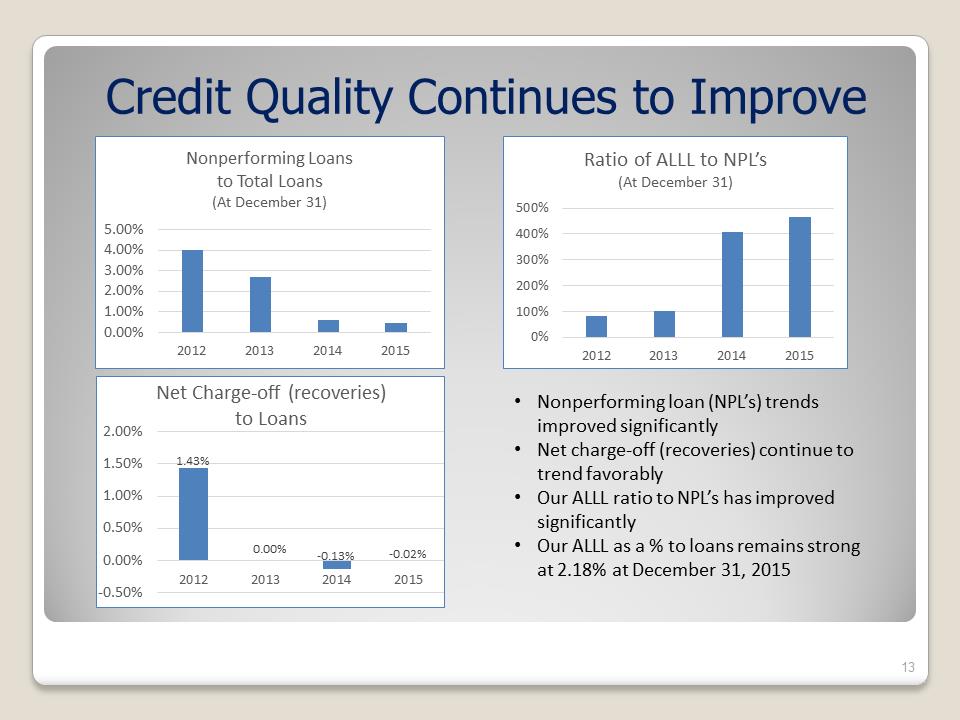
Credit Quality Continues to Improve Nonperforming loan (NPL’s) trends improved significantly •Net charge-off (recoveries) continue to trend favorably Our ALLL ratio to NPL’s has improved significantly Our ALLL as a % to loans remains strong at 2.18% at December 31, 2015Nonperforming Loans to Total Loans (At December 31) Net Charge-off (recoveries) to Loans Ratio of ALLL to NPL’s (At December 31)
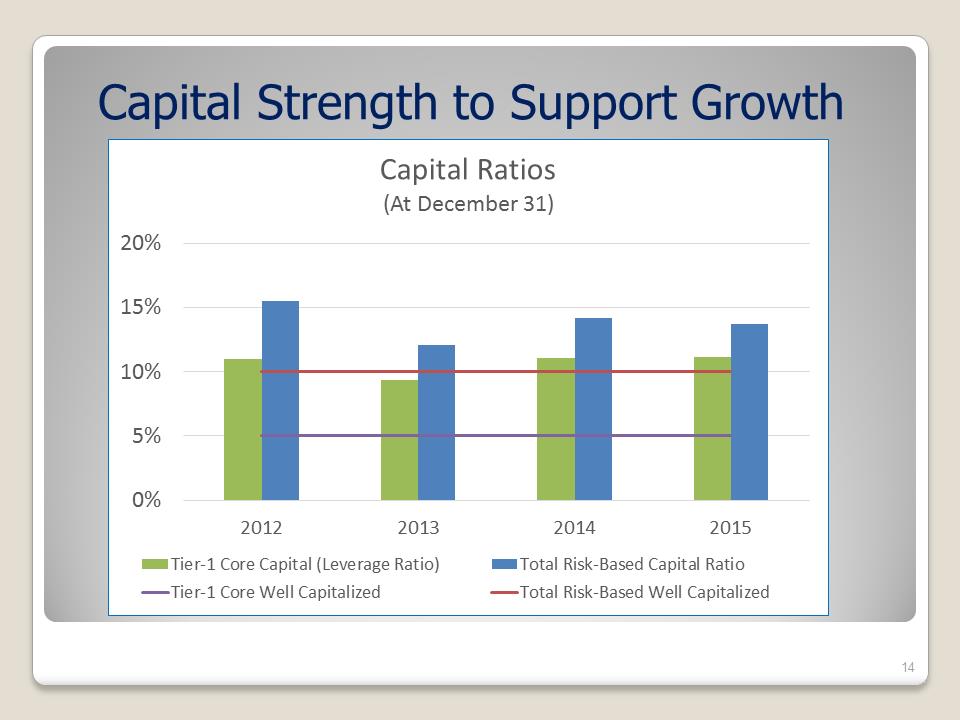
Capital Strength to Support Growth Capital Ratios (At December 31) Tier-1 Core Capital (Leverage Ratio) Total Risk-Based Capital RatioTier-1 Core Well Capitalized Total Risk-Based Well Capitalized
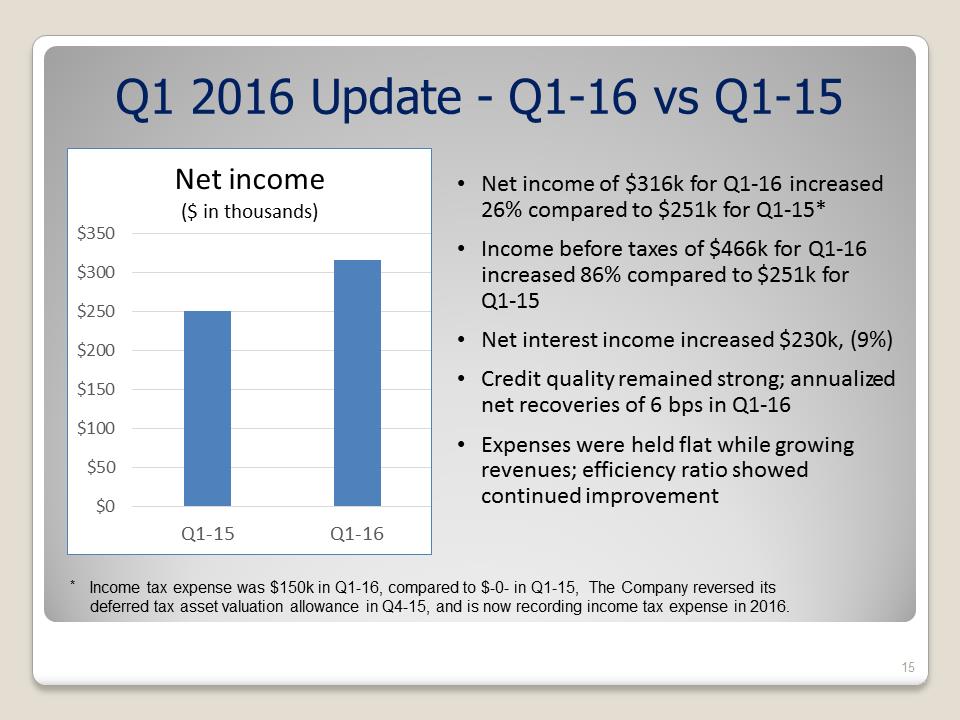
Q1 2016 Update -Q1-16 vs Q1-15•Net income of $316k for Q1-16 increased 26%compared to $251k for Q1-15 Income before taxes of $466k for Q1-16 increased 86% compared to $251k for Q1-15 Net interest income increased $230k, (9%) Credit quality remained strong; annualized net recoveries of 6 bps in Q1-16 Expenses were held flat while growing revenues; efficiency ratio showed continued improvement Net income ($ in thousands) Income tax expense was $150k in Q1-16, compared to $-0-in Q1-15, The Company reversed its deferred tax asset valuation allowance in Q4-15, and is now recording income tax expense in 2016.
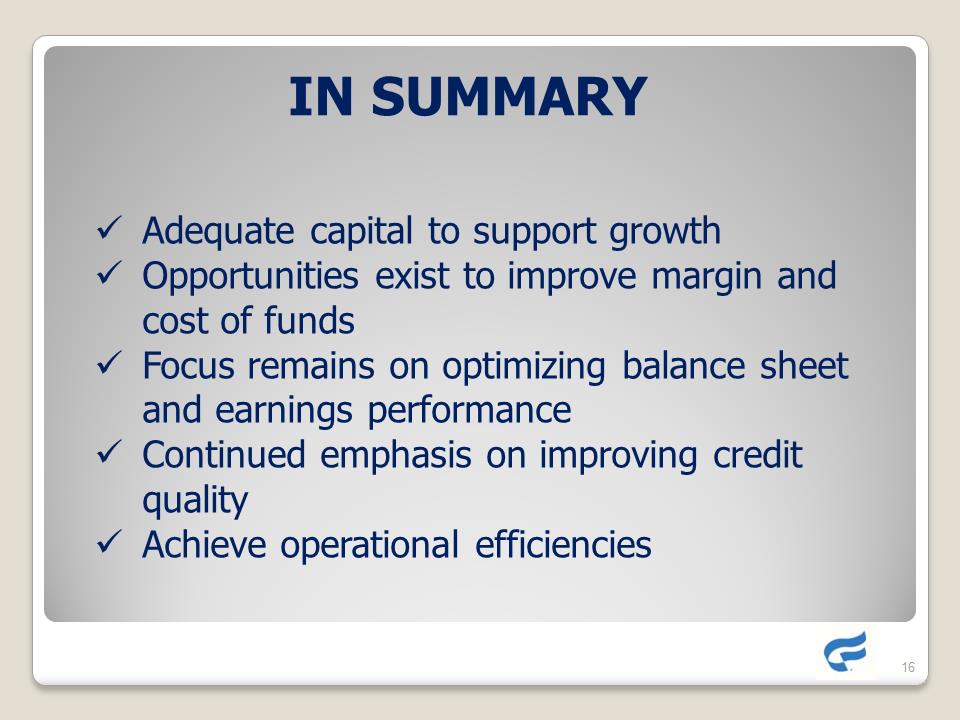
IN SUMMARY Adequate capital to support growth. Opportunities exist to improve margin and cost of funds. Focus remains on optimizing balance sheet and earnings performance. Continued emphasis on improving credit quality. Achieve operational efficiencies

Thank you!


