UNITED STATES
SECURITIES AND EXCHANGE COMMISSION
Washington, D.C. 20549
____________________________________________________________________________________________________________________________________________________________________________________________________________________________________________________________________________________________________________________________________________________________________________________________________________________________________________________________________________________________
Form 10-K
____________________________________________________________________________________________________________________________________________________________________________________________________________________________________________________________________________________________________________________________________________________________________________________________________________________________________________________________________________________________
x ANNUAL REPORT PURSUANT TO SECTION 13 OR 15(d) OF THE SECURITIES EXCHANGE ACT OF 1934
For the fiscal year ended December 31, 2024
OR
o TRANSITION REPORT PURSUANT TO SECTION 13 OR 15(d) OF THE SECURITIES EXCHANGE ACT OF 1934
Commission File Number: 001-14625 (Host Hotels & Resorts, Inc.)
0-25087 (Host Hotels & Resorts, L.P.)
____________________________________________________________________________________________________________________________________________________________________________________________________________________________________________________________________________________________________________________________________________________________________________________________________________________________________________________________________________________________
HOST HOTELS & RESORTS, INC.
HOST HOTELS & RESORTS, L.P.
(Exact Name of Registrant as Specified in Its Charter)
____________________________________________________________________________________________________________________________________________________________________________________________________________________________________________________________________________________________________________________________________________________________________________________________________________________________________________________________________________________________
| | | | | | | | |
| Maryland (Host Hotels & Resorts, Inc.) | | 53-0085950 (Host Hotels & Resorts, Inc.) |
| Delaware (Host Hotels & Resorts, L.P.) | | 52-2095412 (Host Hotels & Resorts, L.P.) |
| (State or Other Jurisdiction of Incorporation or Organization) | | (I.R.S. Employer Identification No.) |
| 4747 Bethesda Ave, Suite 1300 Bethesda, Maryland | | 20814 |
| (Address of Principal Executive Offices) | | (Zip Code) |
(240) 744-1000
(Registrant’s Telephone Number, Including Area Code)
Securities registered pursuant to Section 12(b) of the Act:
| | | | | | | | | | | | | | | | | | | | |
| | Title of Each Class | | Trading Symbol | | Name of Each Exchange on Which Registered |
| Host Hotels & Resorts, Inc. | | Common Stock, $.01 par value (699,106,842 shares outstanding as of February 21, 2025) | | HST | | The Nasdaq Stock Market LLC |
| Host Hotels & Resorts, L.P. | | None | | None | | None |
Securities registered pursuant to Section 12(g) of the Act:
Host Hotels & Resorts, Inc. None
Host Hotels & Resorts, L.P. Units of limited partnership interest 693,582,918 units outstanding as of February 21, 2025)
Indicate by check mark if the registrant is a well-known seasoned issuer, as defined in Rule 405 of the Securities Act.
Host Hotels & Resorts, Inc. Yes x No o
Host Hotels & Resorts, L.P. Yes o No x
Indicate by check mark if the registrant is not required to file reports pursuant to Section 13 or Section 15(d) of the Act.
Host Hotels & Resorts, Inc. Yes o No x
Host Hotels & Resorts, L.P. Yes o No x
Indicate by check mark whether the registrant: (1) has filed all reports required to be filed by Section 13 or 15(d) of the Securities Exchange Act of 1934 during the preceding 12 months (or for such shorter period that the registrant was required to file such reports), and (2) has been subject to such filing requirements for the past 90 days.
Host Hotels & Resorts, Inc. Yes x No o
Host Hotels & Resorts, L.P. Yes x No o
Indicate by check mark whether the registrant has submitted electronically every Interactive Data File required to be submitted pursuant to Rule 405 of Regulation S-T (§ 232.405 of this chapter) during the preceding 12 months (or for such shorter period that the registrant was required to submit such files).
Host Hotels & Resorts, Inc. Yes x No o
Host Hotels & Resorts, L.P. Yes x No o
Indicate by check mark whether the registrant is a large accelerated filer, an accelerated filer, a non-accelerated filer, a smaller reporting company, or an emerging growth company. See the definitions of “large accelerated filer,” “accelerated filer,” “smaller reporting company” and “emerging growth company” in Rule 12b-2 of the Exchange Act.:
Host Hotels & Resorts, Inc. | | | | | | | | | | | |
| Large accelerated filer | x | Accelerated filer | o |
| Non-accelerated filer | o | Smaller reporting company | o |
| | Emerging growth company | o |
Host Hotels & Resorts, L.P.
| | | | | | | | | | | |
| Large accelerated filer | o | Accelerated filer | o |
| Non-accelerated filer | x | Smaller reporting company | o |
| | Emerging growth company | o |
If an emerging growth company, indicate by check mark if the registrant has elected not to use the extended transition period for complying with any new or revised financial accounting standards provided pursuant to Section 13(a) of the Exchange Act. o
Indicate by check mark whether the registrant has filed a report on and attestation to its management’s assessment of the effectiveness of its internal control over financial reporting under Section 404(b) of the Sarbanes-Oxley Act (15 U.S.C. 7262(b)) by the registered public accounting firm that prepared or issued its audit report. x
If securities are registered pursuant to Section 12(b) of the Act, indicate by check mark whether the financial statements of the registrant included in the filing reflect the correction of an error to previously issued financial statements.
Host Hotels & Resorts, Inc. o
Host Hotels & Resorts, L.P. o
Indicate by check mark whether any of those error corrections are restatements that required a recovery analysis of incentive-based compensation received by any of the registrant’s executive officers during the relevant recovery period pursuant to §240.10D-1(b).
Host Hotels & Resorts, Inc. o
Host Hotels & Resorts, L.P. o
Indicate by check mark whether the registrant is a shell company (as defined in Rule 12b-2 of the Exchange Act).
Host Hotels & Resorts, Inc. Yes o No x
Host Hotels & Resorts, L.P. Yes o No x
The aggregate market value of common shares held by non-affiliates of Host Hotels & Resorts, Inc. (based on the closing sale price on the NASDAQ Stock Market) on June 28, 2024 was $12,458,130,843.
Documents Incorporated by Reference
Portions of Host Hotels & Resorts, Inc.’s definitive proxy statement to be filed with the Securities and Exchange Commission and delivered to stockholders in connection with its annual meeting of stockholders to be held on May 14, 2025 are incorporated by reference into Part III of this Form 10-K.
| | | | | | | | | | | | | | | | | | | | |
| Auditor Name: KPMG LLP | | Auditor Location: McLean, VA | | Audit Firm ID: 185 | |
EXPLANATORY NOTE
This report combines the annual reports on Form 10-K for the fiscal year ended December 31, 2024 of Host Hotels & Resorts, Inc. and Host Hotels & Resorts, L.P. Unless stated otherwise or the context otherwise requires, references to “Host Inc.” mean Host Hotels & Resorts, Inc., a Maryland corporation, and references to “Host L.P.” mean Host Hotels & Resorts, L.P., a Delaware limited partnership, and its consolidated subsidiaries. We use the terms “we” or “our” or “the company” to refer to Host Inc. and Host L.P. together, unless the context indicates otherwise. We use the term Host Inc. to specifically refer to Host Hotels & Resorts, Inc. and the term Host L.P. to specifically refer to Host Hotels & Resorts, L.P. (and its consolidated subsidiaries) in cases where it is important to distinguish between Host Inc. and Host L.P. Host Inc. owns properties and conducts operations through Host L.P., of which Host Inc. is the sole general partner and of which it holds approximately 99% of the partnership interests (“OP units”) as of December 31, 2024. The remaining partnership interests are owned by various unaffiliated limited partners. As the sole general partner of Host L.P., Host Inc. has the exclusive and complete responsibility for Host L.P.’s day-to-day management and control.
We believe combining the annual reports on Form 10-K of Host Inc. and Host L.P. into this single report results in the following benefits:
•enhances investors’ understanding of Host Inc. and Host L.P. by enabling investors to view the business as a whole in the same manner as management views and operates the business;
•eliminates duplicative disclosure and provides a more streamlined presentation, since a substantial portion of our disclosure applies to both Host Inc. and Host L.P.; and
•creates time and cost efficiencies through the preparation of one combined report instead of two separate reports.
Management operates Host Inc. and Host L.P. as one enterprise. The management of Host Inc. consists of the same members who direct the management of Host L.P. The executive officers of Host Inc. are appointed by Host Inc.’s board of directors, but are employed by Host L.P. Host L.P. employs everyone who works for Host Inc. or Host L.P. As general partner with control of Host L.P., Host Inc. consolidates Host L.P. for financial reporting purposes, and Host Inc. does not have significant assets other than its investment in Host L.P. Therefore, the assets and liabilities of Host Inc. and Host L.P. are the same on their respective financial statements.
There are a few differences between Host Inc. and Host L.P., which are reflected in the disclosure in this report. We believe it is important to understand the differences between Host Inc. and Host L.P. in the context of how Host Inc. and Host L.P. operate as an interrelated consolidated company. Host Inc. is a real estate investment trust, or REIT, and its only material asset is its ownership of partnership interests of Host L.P. As a result, Host Inc. does not conduct business itself, other than acting as the sole general partner of Host L.P., and issuing public equity from time to time, the proceeds of which are contributed to Host L.P. in exchange for OP units. Host Inc. itself does not issue any indebtedness and does not guarantee the debt or obligations of Host L.P. Host L.P. holds substantially all of our assets and holds the ownership interests in our joint ventures. Host L.P. conducts the operations of the business and is structured as a limited partnership with no publicly traded equity. Except for net proceeds from public equity issuances by Host Inc., Host L.P. generates the capital required by our business through Host L.P.’s operations, by Host L.P.’s direct or indirect incurrence of indebtedness, or through the issuance of OP units.
The substantive difference between the filings of Host Inc. and Host L.P. is that Host Inc. is a REIT with public stock, while Host L.P. is a partnership with no publicly traded equity. In the financial statements, this difference primarily is reflected in the equity (or partners’ capital for Host L.P.) section of the consolidated balance sheets and in the consolidated statements of equity (or partners’ capital) and in the consolidated statements of operations and comprehensive income with respect to the manner in which income is allocated to non-controlling interests. Income allocable to the holders of approximately 1% of the OP units is reflected as income allocable to non-controlling interests at Host Inc. and within net income at Host L.P. Also, earnings per share generally will be slightly less than the earnings per OP unit, as each Host Inc. common share is the equivalent of .97895 OP units (instead of 1 OP unit). Apart from these differences, the financial statements of Host Inc. and Host L.P. are nearly identical.
To help investors understand the differences between Host Inc. and Host L.P., this report presents the following separate sections or portions of sections for each of Host Inc. and Host L.P.:
•Part II Item 5 - Market for Registrant’s Common Stock, Related Stockholder Matters and Issuer Purchases of Equity Securities for Host Inc. / Market for Registrant’s Common Units, Related Unitholder Matters and Issuer Purchases of Equity Securities for Host L.P.;
•Part II Item 7 - Management’s Discussion and Analysis of Financial Condition and Results of Operations is combined, except for a separate discussion of material differences, if any, in the liquidity and capital resources between Host Inc. and Host L.P.;
•Part II Item 7A - Quantitative and Qualitative Disclosures about Market Risk is combined, except for separate discussions of material differences, if any, between Host Inc. and Host L.P.; and
•Part II Item 8 - Financial Statements and Supplementary Data. While the financial statements themselves are presented separately, the notes to the financial statements generally are combined, except for separate discussions of differences between equity of Host Inc. and capital of Host L.P.
This report also includes separate Item 9A. Controls and Procedures sections and separate Exhibit 31 and 32 certifications for each of Host Inc. and Host L.P. in order to establish that the Chief Executive Officer and the Chief Financial Officer of Host Inc. and the Chief Executive Officer and the Chief Financial Officer of Host Inc. as the general partner of Host L.P. have made the requisite certifications and that Host Inc. and Host L.P. are compliant with Rule 13a-15 or Rule 15d-15 of the Securities Exchange Act of 1934 and 18 U.S.C. §1350.
HOST HOTELS & RESORTS, INC. AND HOST HOTELS & RESORTS, L.P.
PART I
Forward-Looking Statements
Our disclosure and analysis in this 2024 Annual Report on Form 10-K and in Host Inc.’s 2024 Annual Report to Stockholders contain some forward-looking statements that set forth anticipated results based on management’s plans and assumptions. From time to time, we also provide forward-looking statements in other materials we release to the public. Such statements give our current expectations or forecasts of future events; they do not relate strictly to historical or current facts. We have tried, wherever possible, to identify each such statement by using words such as “anticipate,” “estimate,” “expect,” “project,” “intend,” “plan,” “believe,” “will,” “target,” “forecast” and similar expressions in connection with any discussion of future operating or financial performance. In particular, these forward-looking statements include those relating to future actions, future acquisitions or dispositions, future capital expenditures plans, future performance or results of current and anticipated expenses, interest rates, foreign exchange rates or the outcome of contingencies, such as legal proceedings or insurance gains/losses.
We cannot guarantee that any future results discussed in any forward-looking statements will be realized, although we believe that we have been prudent in our plans and assumptions. Achievement of future results is subject to risks, uncertainties and potentially inaccurate assumptions, including those discussed in Item 1A. “Risk Factors.” Should known or unknown risks or uncertainties materialize, or should underlying assumptions prove inaccurate, actual results could differ materially from past results and those results anticipated, estimated or projected. You should bear this in mind as you consider forward-looking statements.
We undertake no obligation to publicly update forward-looking statements, whether because of new information, future events or otherwise. You are advised, however, to consult any additional disclosures we make or related subjects in our reports on Form 10-Q and Form 8-K that we file with the Securities and Exchange Commission (“SEC”). Also note that, in our risk factors, we provide a cautionary discussion of risks, uncertainties and possibly inaccurate assumptions relevant to our business. These are factors that, individually or in the aggregate, we believe could cause our actual results to differ materially from past results and those results anticipated, estimated or projected. We note these factors for investors as permitted by the Private Securities Litigation Reform Act of 1995. It is not possible to predict or identify all such risk factors. Consequently, you should not consider the discussion of risk factors to be a complete discussion of all the potential risks or uncertainties that could affect our business.
Item 1. Business
We are the largest publicly traded lodging REIT, with a geographically diverse portfolio of luxury and upper upscale hotels. As of February 21, 2025, our consolidated lodging portfolio consists of 81 primarily luxury and upper-upscale hotels containing approximately 43,400 rooms, with substantially all located in the United States (five of the hotels are located outside of the U.S. in Brazil and Canada). In addition, we own non-controlling interests in seven domestic and one international joint ventures that focus on the lodging industry, see " - Other Real Estate Interests" for a further description.
Host Inc. was incorporated as a Maryland corporation in 1998 and operates as a self-managed and self-administered REIT. Host Inc. owns hotels and conducts operations through Host L.P., of which Host Inc. is the sole general partner and of which it holds approximately 99% of the partnership interests (“OP units”) as of December 31, 2024. The remaining partnership interests are owned by various unaffiliated limited partners. Host Inc. has the exclusive and complete responsibility for Host L.P.’s day-to-day management and control.
Business Strategy
Our goal is to be the preeminent owner of high-quality lodging real estate in growing markets in the U.S. and to generate superior long-term risk adjusted returns for our stockholders throughout all phases of the lodging cycle through a combination of appreciation in asset values, growth in earnings and the payment of dividends. The pillars of our strategy to achieve this objective and elevate our growth profile include:
•Geographically diverse portfolio of hotels in the U.S. - Own a diversified portfolio of hotels in the U.S. in major urban and resort destinations. Target markets with diverse demand generators, high barriers to entry, favorable supply and demand dynamics and attractive long-term projected RevPAR growth;
•Strong scale and integrated platform - Utilize our scale to create value through enterprise analytics, asset management and capital investment initiatives, while aiding external growth by leveraging scale as a competitive advantage to acquire assets befitting our strategy. Allocate and recycle capital to seek returns that exceed our cost of capital and actively return capital to stockholders;
•Investment grade balance sheet - Maintain a strong and flexible capital structure that allows us to execute our strategy throughout all phases of the lodging cycle; and
•Employer of choice and responsible corporate citizen - Align our organizational structure with our business objectives to be an employer of choice and a responsible corporate citizen.
Geographically Diverse Portfolio
We seek to have a geographically diversified portfolio in major markets and premier resort destinations in the U.S. We primarily focus on acquisitions and, occasionally, new development opportunities to enhance our portfolio. While we have historically targeted acquisitions in the top 25 U.S. markets, we also consider hotels in other markets, which we believe have high growth potential and diverse demand generators. We focus generally on the following types of assets:
•Resorts in destination locations with limited supply growth. These assets feature superior amenities and unique experiential offerings;
•Convention destination hotels that are group oriented in urban and resort markets. These assets feature extensive and high-quality meeting facilities and often are connected to prominent convention centers; and
•High-end urban hotels that are positioned in prime locations and possess multiple demand drivers for both business and leisure travelers.
As one of the largest owners of Marriott and Hyatt hotels, our hotels primarily are operated under brand names that are among the most respected and widely recognized in the lodging industry. Within these brands, we have focused predominantly on the upper-upscale and luxury chain scales, as we believe these have a broad appeal for both individual and group leisure and business customers. In addition, we own several unbranded or soft-branded hotels that appeal to distinctive customer profiles in certain submarkets.
Strong Scale and Integrated Platform
Enterprise Analytics Platform. Due to the scale of our asset management and business intelligence platform, we believe we are in a unique position to implement value-added real estate decisions and to assist our managers in improving operating performance and profitability. The size and composition of our portfolio and our affiliation with most of the leading brands and operators in the industry allow our enterprise analytics team to benchmark similar hotels and identify revenue-enhancement opportunities and cost efficiencies that can maximize the operating performance, long-term profitability and value of our real estate. We perform independent underwriting of return on investment (“ROI”) projects and potential acquisitions, as well as revenue management analysis of ancillary revenue opportunities. Our goal is to continue to differentiate our hotels within their competitive markets, drive operating performance and enhance the overall value of our real estate through the following:
•Enhance operating performance and profitability by using our business intelligence system to benchmark and monitor hotel performance and cost controls.
•Drive revenue growth by conducting detailed strategic reviews with our managers on markets and business mix to assist them in developing the appropriate group/transient mix, online presence to address a broad customer base, and market share targets for each hotel.
•Work with leading brands, such as Marriott and Hyatt, to take advantage of their worldwide presence and lodging infrastructure. We also have a selection of hotels managed by independent operators where we believe these operators have more flexibility to drive revenues and control costs to maximize profits.
•Improve asset value through the extension or purchase of ground leases or the restructuring of management agreements to increase contract flexibility.
Disciplined Capital Allocation. Guided by a disciplined approach to capital allocation, we are equipped to make investment decisions that seek to deliver the greatest value and returns to stockholders. Our goal is to allocate capital to enhance and improve our portfolio, while balancing the importance of prudently returning capital to stockholders.
For 2025, we will continue our disciplined approach to capital allocation and intend to take advantage of our strong balance sheet and overall scale. We are constantly evaluating potential acquisitions of iconic upper-upscale and luxury properties that we believe have sustainable competitive advantages. Similarly, we intend to continue our capital recycling program with strategic and opportunistic dispositions. This may include the sale of assets where we believe the potential for growth is constrained or hotels with significant capital expenditure requirements that we do not believe would generate an adequate return.
We may acquire additional properties or dispose of properties through various structures, including transactions involving single assets, portfolios, joint ventures, mergers and acquisitions of the securities or assets of other REITs or distributions of hotels to our stockholders. We anticipate that any acquisitions may be funded by, or through a combination of, proceeds from the sales of hotels, equity offerings of Host Inc., issuances of OP units by Host L.P., incurrence of debt, available cash or advances under our credit facility. We note, however, that the nature and supply of these assets make acquisitions inherently difficult to predict. For these reasons, we can make no assurances that we will be successful in purchasing any one or more hotels that we are reviewing currently, or may in the future review, bid on or negotiate to buy.
We also seek to create and mine value from our existing portfolio through value enhancement initiatives and ROI projects. We believe these investments provide a significant opportunity to achieve returns well in excess of our cost of capital. We work closely with our managers to attempt to schedule these projects to minimize operational disruption and environmental impact. Value enhancement initiatives seek to maximize the value of real estate within our existing portfolio through its highest and best use. These projects may include hotel expansion, timeshare, office space or condominium units on excess land, redevelopment or expansion of existing retail space, and the acquisition of development entitlements. ROI projects are designed to improve the positioning of our hotels within their markets and competitive set. These projects include extensive renovations, including guest rooms, lobbies, food and beverage outlets; expansions and/or extensive renovation of ballroom and meeting rooms; major mechanical system upgrades; and green building initiatives and certifications. Also included are projects focused on increasing space profitability or lowering net operating costs, such as converting unprofitable or underutilized space into meeting space, adding guestrooms, and implementing energy and water conservation measures such as LED lighting, high-efficiency mechanical, electrical and plumbing equipment and fixtures, solar power, energy management systems, guestroom water efficient fixtures, and building automation systems.
Renewal and replacement capital expenditures are designed to maintain the quality and competitiveness of our hotels. Typically, renovations occur at intervals of approximately seven to ten years, but the timing may vary based on the type of property, function of area being renovated, hotel occupancy and other factors. These renovations generally are divided into the following types: soft goods, case goods, bathroom and architectural and engineering systems. Soft goods include items such as carpeting, textiles and wall finishes, which may require more frequent updates to maintain brand quality standards. Case goods include dressers, desks, couches, restaurant and meeting room tables and chairs, which generally are not replaced as frequently. Bathroom renovations include the refurbishment or replacement of tile, vanity, lighting and plumbing fixtures. Architectural and engineering systems include the physical plant of the hotel, including the roof, elevators/escalators, façade, heating, ventilation, and air conditioning and fire systems. We also execute capital expenditure projects to further increase the resilience of our hotels, including replacements and restorations of exterior walls, doors and windows, roofs, grounds, relocated/elevated critical equipment and distributed energy systems.
Throughout the lodging cycle, to the extent that we are unable to find appropriate investment opportunities that meet our return requirements, we will focus on returning capital to stockholders through dividends or common stock repurchases. Significant factors we review to determine the level and timing of the returns to stockholders include our current stock price compared to our determination of the underlying value of our assets, current and forecast operating results and the completion of hotel sales.
Investment Grade Balance Sheet
Our goal is to maintain a flexible capital structure that allows us to execute our strategy throughout the lodging cycle. To maintain its qualification as a REIT, Host Inc. is required to distribute 90% of its taxable income (other than net
capital gain) to its stockholders each year and, as a result, generally relies on external sources of capital, as well as cash from operations, to finance growth.
Management believes that a strong balance sheet is a key competitive advantage that affords us a lower cost of debt and positions us for external growth. While we may issue debt at any time, we will target a net debt-to-earnings before interest, taxes, depreciation and amortization (“EBITDA”) ratio, (or “Leverage Ratio,” as defined in our credit facility) that allows us to maintain an investment grade rating on our senior unsecured debt. We believe an investment grade rating will give us the most consistent access to capital throughout the business cycle.
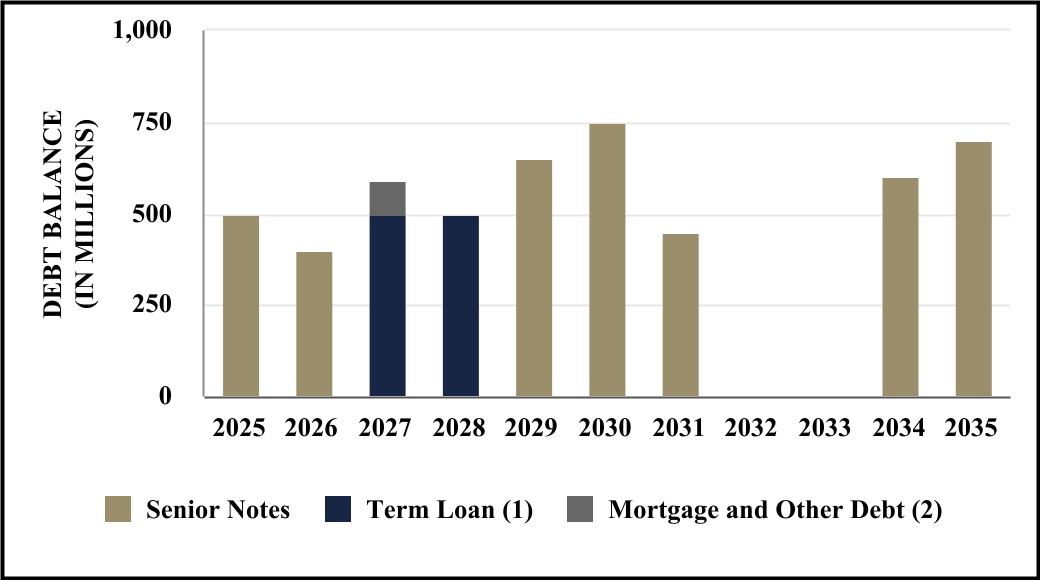
We seek to structure our debt profile to maintain financial flexibility and a staggered maturity schedule with access to different forms of financing, consisting primarily of senior notes and exchangeable debentures, as well as mortgage debt. Generally, we look to minimize the number of assets that are encumbered by mortgage debt, minimize near-term maturities and maintain a staggered maturity schedule. Depending on market conditions, we also may utilize variable rate debt which can provide greater protection during a decline in the lodging industry.
Corporate Responsibility
We are committed to creating long-term value through investing responsibly in our business, environment, people and community. Our Corporate Responsibility ("CR") program is centered around the concept of responsible investment—an overarching strategy that guides our focus and actions across our three main themes of Environmental Stewardship, Social Responsibility and Governance.
We believe that a disciplined and proactive approach to addressing critical environmental, social and governance (ESG) topics enables us to create long-term value for our stockholders and helps us to optimize our portfolio and human capital investments, while maintaining our position as a global sustainability leader. Our management approach is driven by people, culture, policies, targets and performance monitoring to improve the value from our investments of time, talent and financial resources. This approach directly supports Host’s business strategy and goals.
•Environmental Stewardship: We are investing in solutions that conserve and restore natural capital to assist us in mitigating climate change and biodiversity impacts with the goal of achieving best-in-class returns.
•Social Responsibility: We are committed to advancing health, well-being and opportunity for all of our stakeholders, including investors, employees, partners and communities.
•Governance: Our responsible investment strategies are guided by executive and board-level oversight, our EPIC values of Excellence, Partnership, Integrity and Community, our ethical standards, and a disciplined approach to risk management and sustainable value creation.
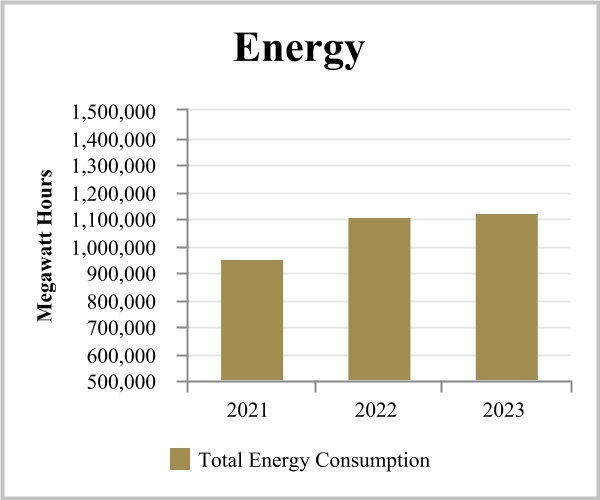
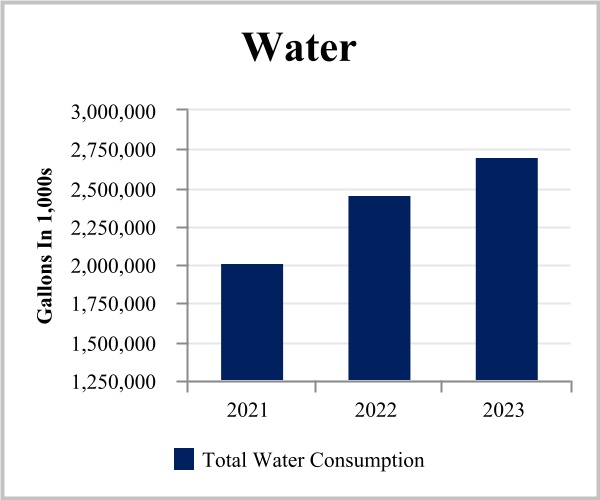
The Real Estate Sustainability Accounting Standard issued by the Sustainability Accounting Standards Board (“SASB”) (now maintained by the International Sustainability Standards Board under the International Financial Reporting Standards Foundation) outlines the disclosure topics and accounting metrics for the real estate industry. The energy and water management metrics that best correlate with our industry include total energy consumed (“Total Energy Consumption”) and total water withdrawn (“Total Water Consumption”). The energy and water data we use is collected and reviewed by third parties who compile the data from property utility statements.
The charts below detail our third-party verified Total Energy Consumption and Total Water Consumption for 2021 through 2023, the last three fiscal years for which data is available(1). The increase in Total Water Consumption from 2022 to 2023 reflects an increase in occupancy at our hotels, while Total Energy Consumption remained level due to efficiency investments. The increases in both Total Water Consumption and Total Energy Consumption from 2021 to 2022 reflect the recovery of business at our hotels following the COVID-19 pandemic:
___________
(1)Energy and water metrics relate to our consolidated hotels owned for the entire year presented.
Our latest Corporate Responsibility Report, which was issued in July 2024, details our CR program and responsible investment strategy; along with our environmental, social and governance performance and our 2030 environmental and social targets that serve as the interim milestone in our roadmap to achieve our aspirational vision of becoming a net positive company by 2050. The Corporate Responsibility Report also includes Task Force on Climate-Related Financial Disclosures (TCFD) and full SASB disclosures, as well as an EEO-1 report. The contents of our Corporate Responsibility Report are not incorporated by reference into this Form 10-K and do not form a part of this Form 10-K.
The Lodging Industry
The lodging industry in the United States consists of private and public entities that operate in a diversified market under a variety of brand names. The lodging industry has several key participants:
•Owners—own the hotel and typically enter into an agreement for an independent third party to manage the hotel. These hotels may be branded and operated under the manager’s brand or branded under a franchise agreement and operated by the franchisee or by an independent hotel manager. The hotels also may be operated as an independent hotel by an independent hotel manager.
•Owner/Managers—own the hotel and operate the property with their own management team. These hotels may be branded under a franchise agreement, operated as an independent hotel or operated under the owner’s brand. We are prohibited from operating and managing hotels by applicable REIT rules.
•Franchisors—own a brand or brands and strive to grow their revenues by expanding the number of hotels in their franchise system. Franchisors provide their hotels with brand recognition, marketing support and centralized reservation systems for the franchised hotels.
•Franchisor/Managers—own a brand or brands and operate hotels on behalf of the hotel owner or franchisee.
•Managers—operate hotels on behalf of the hotel owner, but do not, themselves, own a brand. The hotels may be operated under a franchise agreement or as an independent hotel.
The hotel manager is responsible for the day-to-day operations of the hotel, including the employment of hotel staff, the determination of room rates, the development of sales and marketing plans, the preparation of operating and capital expenditures budgets and the preparation of financial reports for the owner. The hotel manager typically receives fees based on the revenues and profitability of the hotel.
Supply and Demand. Our industry is influenced by the cyclical relationship between the supply of and demand for hotel rooms. Lodging demand growth typically is related to the vitality of the overall economy, in addition to local
market factors that stimulate travel to specific destinations. Trends in economic indicators such as gross domestic product (“GDP”) growth, business investment, corporate profits and employment growth are key indicators of the relative strength of lodging demand. Lodging demand also will be affected by changes to international travel patterns.
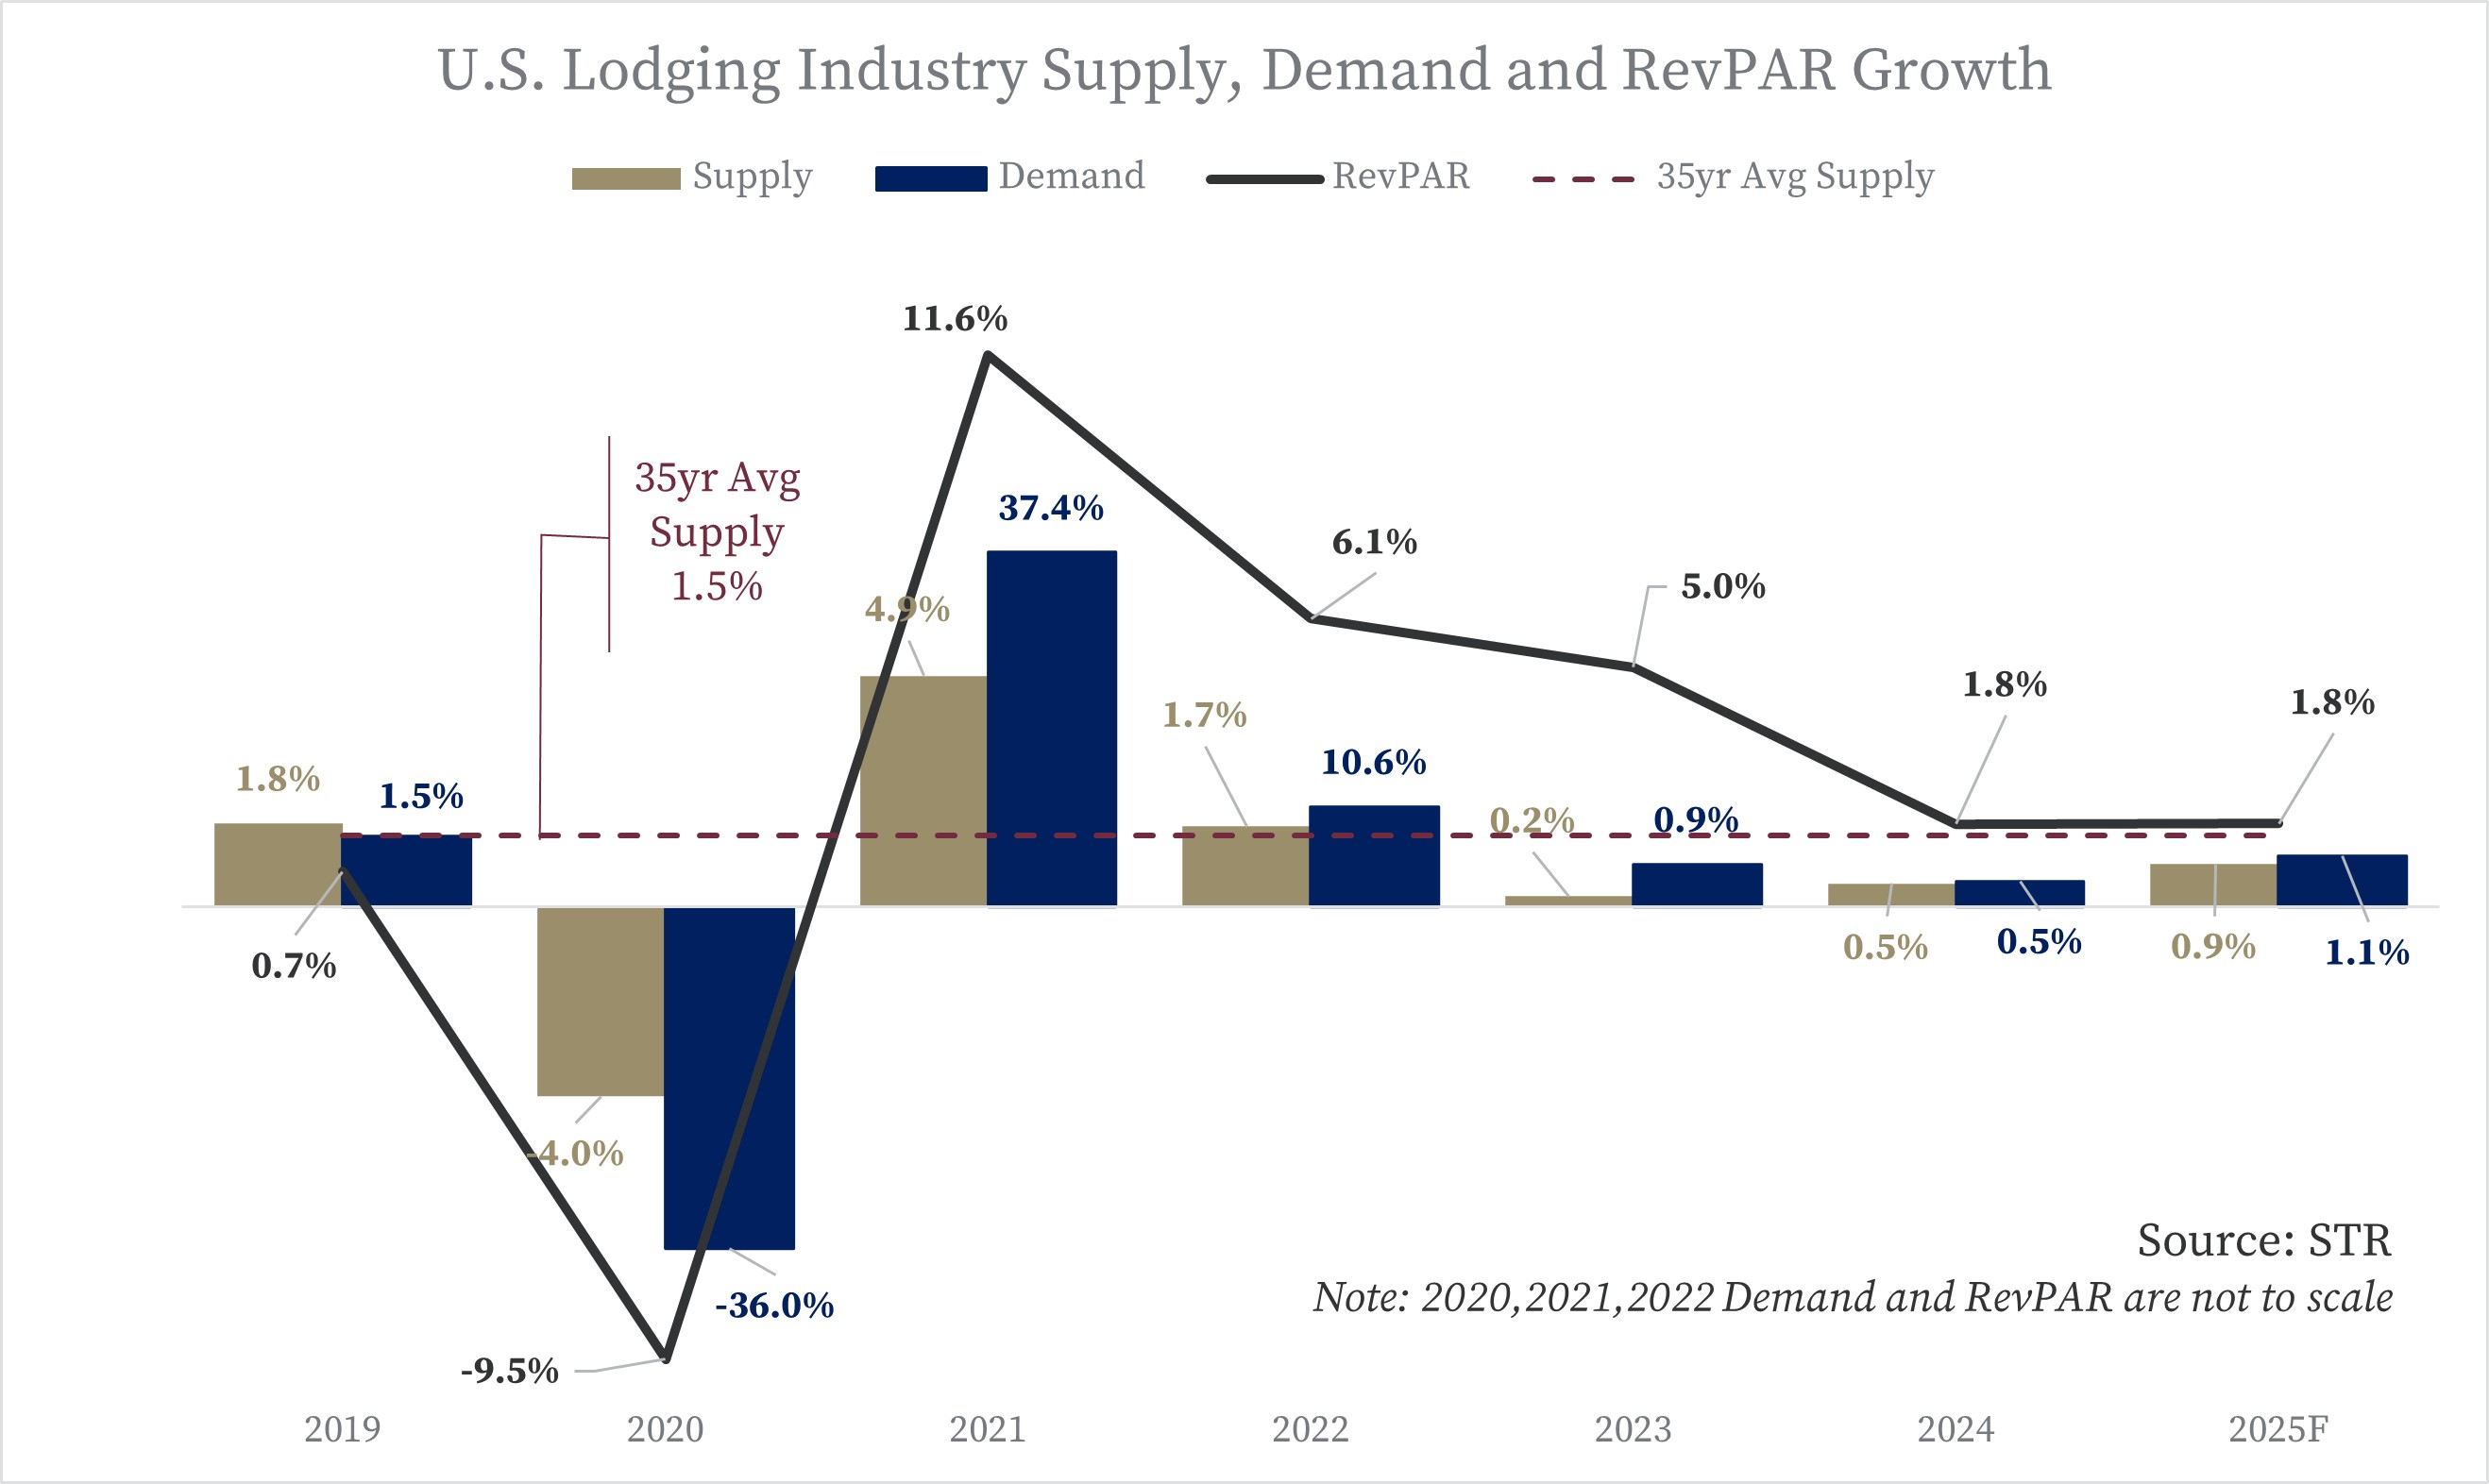
Lodging supply growth generally is driven by overall lodging demand, as extended periods of strong demand growth tend to encourage new development. However, the rate of supply growth also is influenced by several additional factors, including the availability of capital, interest rates, construction costs and unique market considerations. The relatively long lead-time required to complete the development of hotels makes supply growth easier to forecast than demand growth but increases the volatility of the cyclical behavior of the lodging industry, as new supply may be planned during an upcycle but may open for business in a weaker economy. Therefore, as illustrated in the charts below for the U.S. lodging industry, at different points in the cycle, demand growth may accelerate when supply growth is very low, or supply may accelerate while demand growth is slowing. Online short-term rentals are a source of non-traditional supply for the industry, in both urban and resort destinations, including as a flexible option for apartment buildings and vacation homes. Though not reported through official industry statistics, the impact on the hotel industry and the availability of these outlets is more variable than typical changes in supply from hotel construction and tends to be very market specific. Local legislation has the potential to limit supply growth for these online short-term rentals in many top markets, though the growth of professional management for legal rentals remains a key trend.
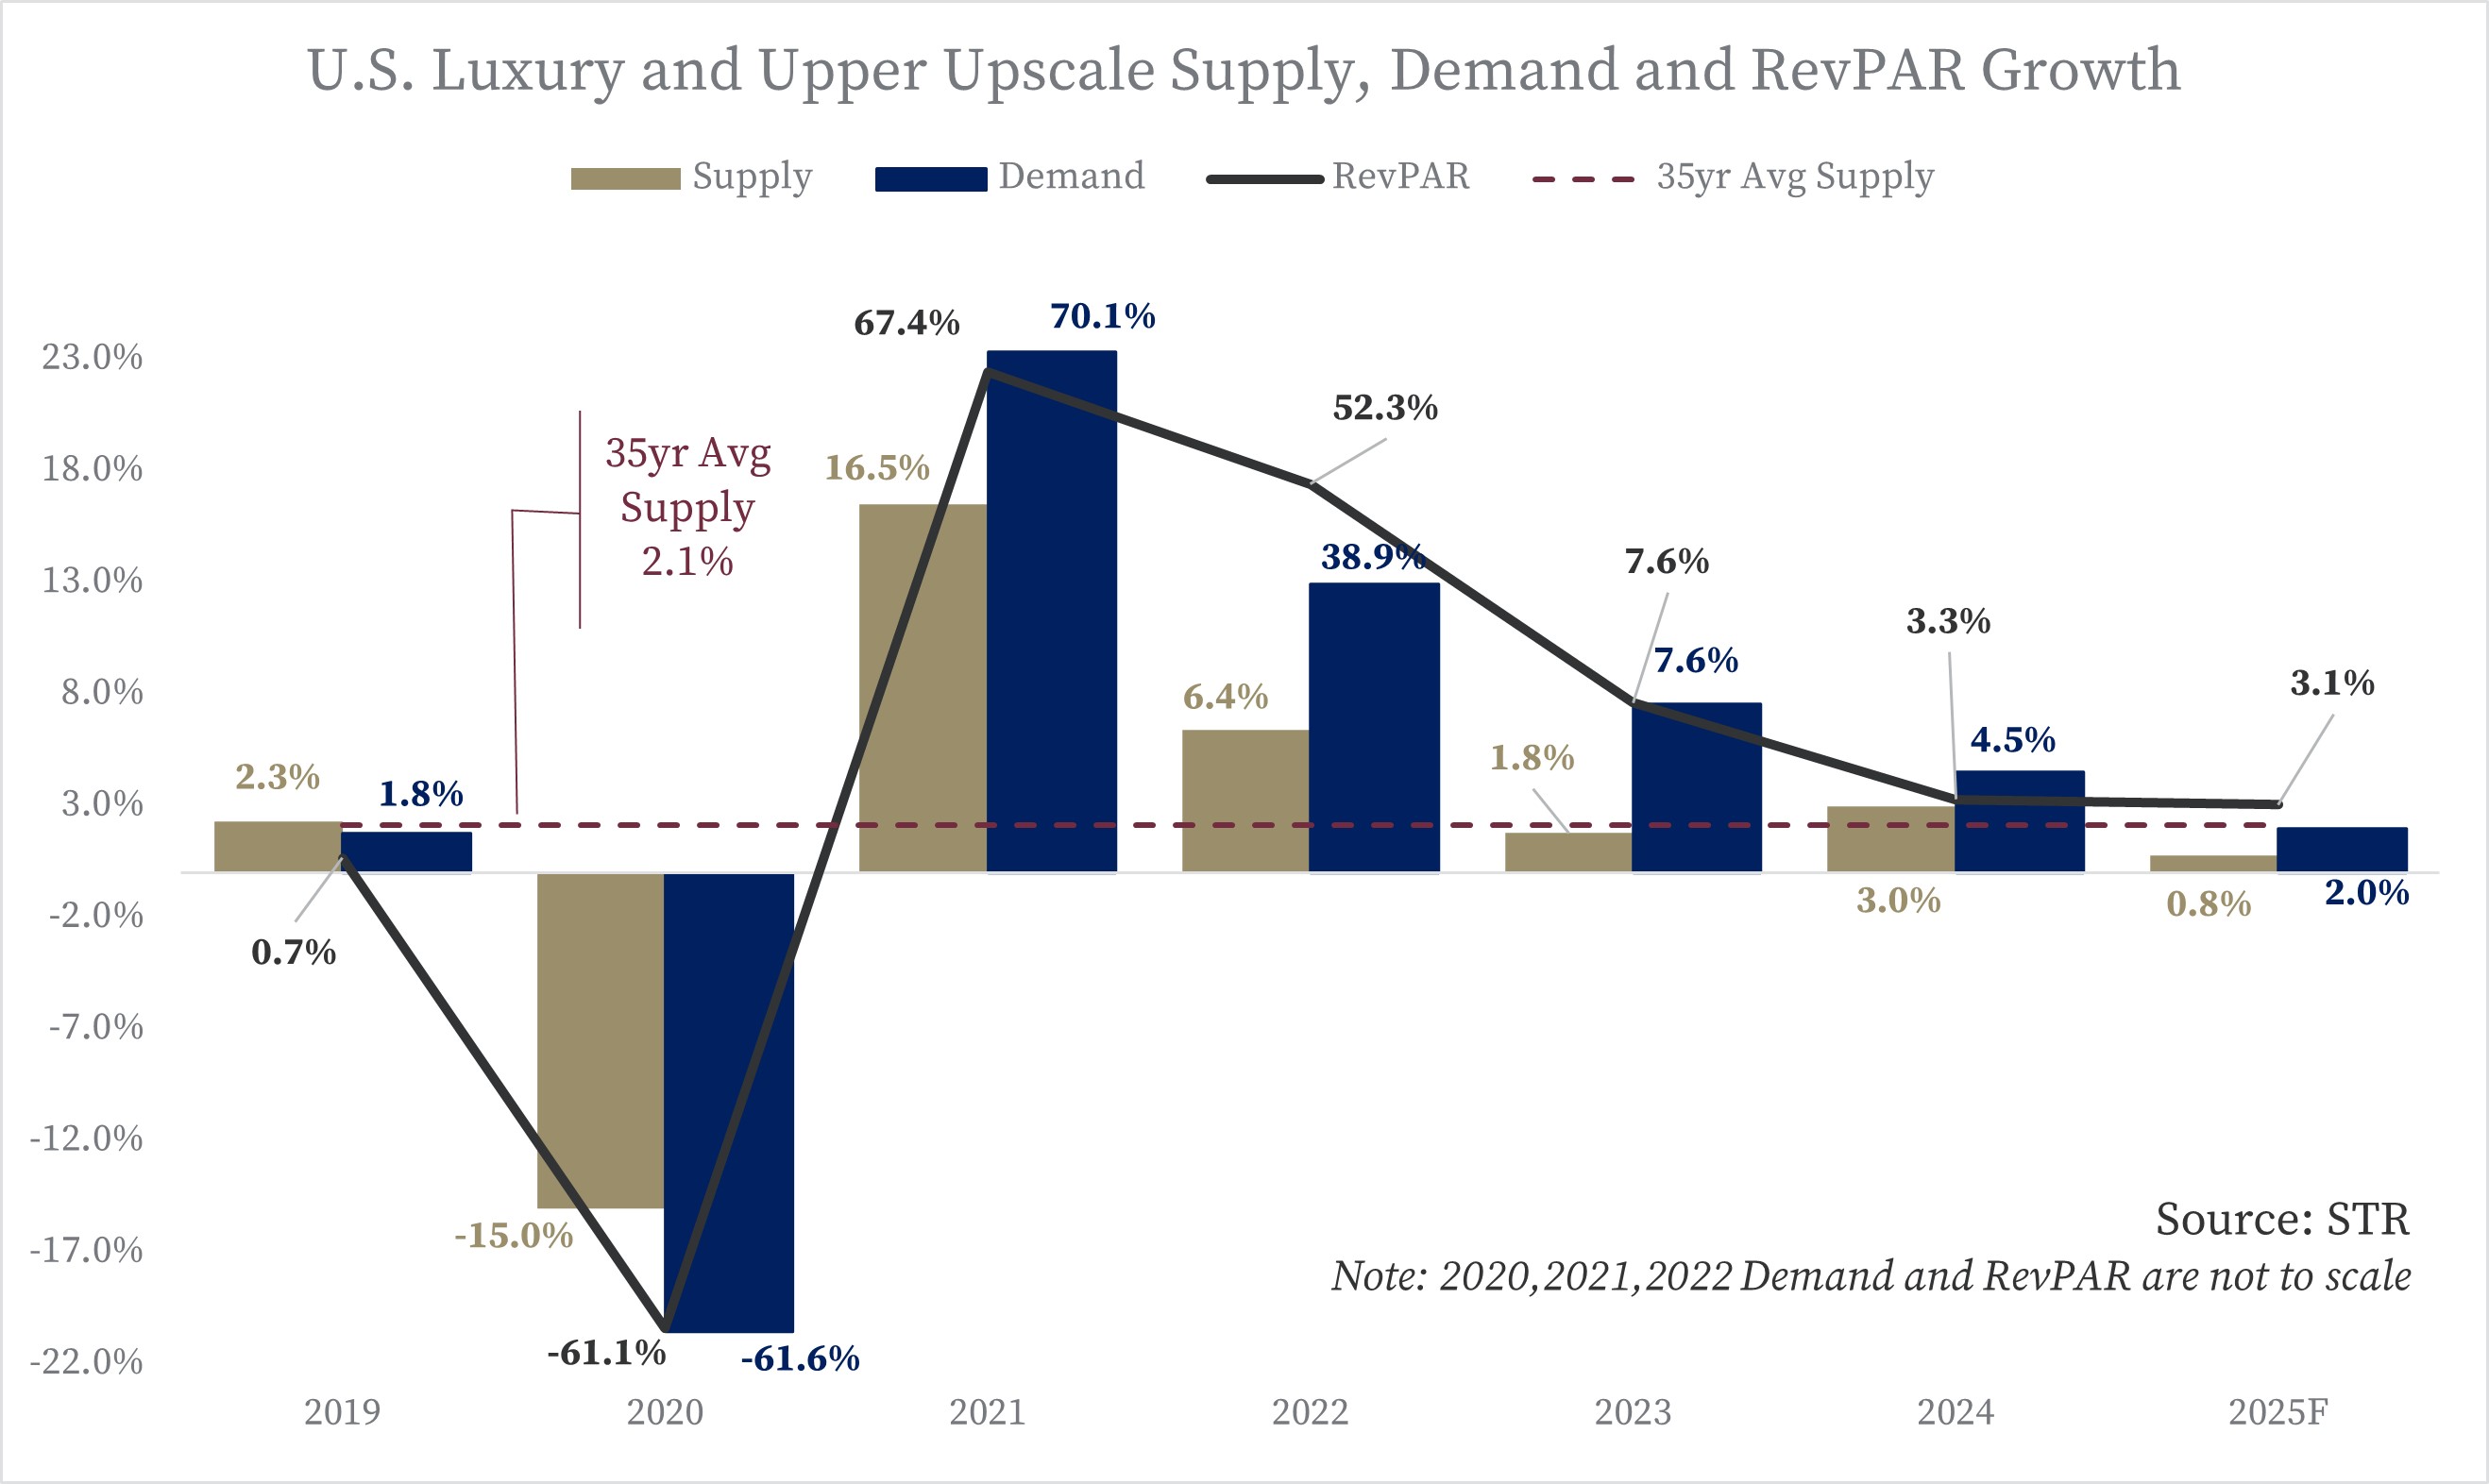
Our portfolio primarily consists of upper upscale and luxury hotels and, accordingly, its performance is best understood in comparison to the luxury and upper upscale categories rather than the entire industry. The charts below detail the historical supply, demand and revenue per available room (“RevPAR”) growth for the U.S. lodging industry and for the U.S. luxury and upper upscale categories for 2019 to 2024.
U.S. Lodging Industry Supply, Demand and RevPAR Growth
U.S. Luxury and Upper Upscale Supply, Demand and RevPAR Growth
Our Customers. Our customers fall into three broad groups: transient business, group business and contract business. Similar to the majority of the lodging industry, we further categorize business within these broad groups based on characteristics they have in common as follows:
Transient business broadly represents individual business and/or leisure travelers. Our hotels attract both business and leisure travelers; therefore, our hotels' performance as it relates to transient demand is driven by trends related to both of these customer types. The four key subcategories of rates offered to the transient business group are:
•Retail: This is the benchmark rate that a hotel publishes and offers to the public. It typically is the rate charged to travelers that do not have access to negotiated or discounted rates. It includes the “rack rate,” which typically is applied to rooms during high demand periods and is the highest rate category available. Retail room rates will fluctuate more freely depending on anticipated demand levels (e.g., seasonality and weekday vs. weekend stays).
•Non-Qualified Discount: This category includes special rates offered by the hotels, including packages, advance-purchase discounts and promotional offers. It also includes rooms booked through online travel agencies (OTAs).
•Special Corporate: This is a negotiated rate offered to companies and organizations that provide significant levels of room night demand to the hotel or to hotel brands generally. These rates typically are negotiated annually at a discount to the anticipated retail rate. In addition, this category includes rates offered at the prevailing per diem for approved government travel.
•Qualified Discount: This category encompasses all discount programs, such as AAA and AARP discounts, rooms booked through wholesale channels, frequent guest program redemptions, and promotional rates and packages offered by a hotel.
Group business represents clusters of guestrooms booked together, usually with a minimum of 10 rooms. The three key sub-categories of the group business category are:
•Association: group business related to national and regional association meetings and conventions.
•Corporate: group business related to corporate meetings (e.g., product launches, training programs, contract negotiations, and presentations).
•Other: group business predominately related to social, military, education, religious, fraternal and youth and amateur sports teams, otherwise known as SMERF business.
Contract business refers to blocks of rooms sold to a specific company for an extended period at significantly discounted rates. Airline crews are typical generators of contract demand for our airport hotels. Contract rates may be utilized by hotels that are in markets that are experiencing consistently lower levels of demand.
Managers and Operational Agreements
All our hotels are managed by third parties pursuant to management or operating agreements, with some of such hotels also subject to separate franchise or license agreements addressing matters pertaining to operations under the designated brand. Under these agreements, the managers have sole responsibility and exclusive authority for all activities necessary for the day-to-day operation of the hotels, including establishing room rates, securing and processing reservations, procuring inventories, supplies and services, providing periodic inspection and consultation visits to the hotels by the managers’ technical and operational experts and promoting and publicizing the hotels. The managers employ all managerial and other employees for the hotels, review hotel operations with a focus on improving revenues and managing expenses, review the maintenance of the hotels, prepare reports, budgets and projections, and provide other administrative and accounting support services to the hotels. These support services include planning and policy services, divisional financial services, product planning and development, employee staffing and training, corporate executive management and certain in-house legal services. We have certain approval rights over budgets, capital expenditures, significant leases and contractual commitments, and various other matters.
General Terms and Provisions – Agreements governing our hotels that are managed by brand owners (Marriott, Hyatt, Hilton, Four Seasons, 1 Hotels and AccorHotels) typically include the terms described below:
•Term and fees for operational services. The initial term of our management and operating agreements generally is 10 to 25 years, with one or more renewal terms at the option of the manager. The majority of our management agreements condition the manager’s right to exercise options for specified renewal terms upon the satisfaction of specified economic performance criteria. The manager typically receives compensation in the form of a base management fee, which is calculated as a percentage (generally 2-3%) of annual gross revenues, and an incentive management fee, which typically is calculated as a percentage (generally 10-20%) of operating profit after the owner has received a priority return on its investment in the hotel. In the case of our hotels operating under the W®, Westin®, Luxury Collection® and St. Regis® brands and managed by Marriott following its acquisition of Starwood Hotels & Resorts Worldwide, Inc. on September 23, 2016 (collectively, the “Starwood Hotels”), the base management fee is only 1% of annual gross revenues, but that amount is supplemented by license fees payable under a separate license agreement (as described below).
•License services. In the case of the Starwood Hotels, operations are governed by separate license agreements addressing matters pertaining to the designated brand, including rights to use trademarks, service marks and logos, matters relating to compliance with certain brand standards and policies, and the provision of certain system programs and centralized services. Although the term of these license agreements generally is coterminous with the corresponding operating agreements, the license agreements contemplate the potential for continued brand affiliation even in the event of a termination of the operating agreement (for instance, in the event the hotel is operated by an independent operator). Licensors receive compensation in the form of license fees (generally 5% of gross revenues attributable to room sales and 2% of gross revenues attributable to food and beverage sales), which amounts supplement the lower base management fee of 1% of gross revenues received by Marriott under the operating agreements, as noted above.
•Chain or system programs and services. Managers are required to provide chain or system programs and services generally that are furnished on a centralized basis. Such services include the development and operation of certain computer systems and reservation services, regional or other centralized management and administrative services, marketing and sales programs and services, training and other personnel services, and other centralized or regional services as may be determined to be more efficiently performed on a centralized, regional or group basis rather than on an individual hotel basis. Costs and expenses incurred in providing these chain or system programs and services generally are allocated on a cost reimbursement basis among all hotels managed by the manager or its affiliates or that otherwise benefit from these services.
•Working capital and fixed asset supplies. We are required to maintain working capital for each hotel and to fund the cost of certain fixed asset supplies (for example, linen, china, glassware, silver and uniforms). We also are responsible for providing funds to meet the cash needs for hotel operations if at any time the
funds available from working capital are insufficient to meet the financial requirements of the hotels. For certain hotels, the working capital accounts which would otherwise be maintained by the managers for each of such hotels are maintained on a pooled basis, with managers being authorized to make withdrawals from such pooled account as otherwise contemplated with respect to working capital in accordance with the provisions of the management or operating agreements.
•Furniture, fixtures and equipment replacements. We are required to provide the managers with all furniture, fixtures and equipment (“FF&E”) necessary for the operation of the hotels (including funding any required FF&E replacements). On an annual basis, the managers prepare budgets for FF&E to be acquired and certain routine repairs and maintenance to be performed in the next year and an estimate of the necessary funds, which budgets are subject to our review and approval. For purposes of funding such expenditures, a specified percentage (typically 4-5%) of the gross revenues of each hotel is deposited by the manager into an escrow or reserve account in our name, to which the manager has access. For certain hotels, we have negotiated flexibility with the manager that reduces the funding commitment required as follows:
◦For certain of our Marriott-managed hotels, we have entered into an agreement with Marriott to allow for such expenditures to be funded from one pooled reserve account, rather than periodic reserve fund contributions being deposited into separate reserve accounts at each of the subject hotels, with the minimum required balance maintained on an ongoing basis in that pooled reserve account being significantly less than the amount that would have been maintained otherwise in such separate hotel reserve accounts. Upon sale, a hotel-level reserve account would be funded (either by the purchaser or by us, as the seller) in the full amount of the reserve balance associated with the subject hotel.
◦For certain of the Starwood Hotels, periodic reserve fund contributions, which otherwise would be deposited into reserve accounts maintained by managers at each hotel, are distributed to us and we are responsible for providing funding of expenditures which otherwise would be funded from reserve accounts for each of the subject hotels. Upon sale, a hotel-level reserve account would be funded in the amount of the subject hotel’s pro rata share, if any, of the consolidated pooled reserve balance.
•Building alterations, improvements and renewals. The managers are required to prepare an annual estimate of the expenditures necessary for major repairs, alterations, improvements, renewals and replacements to the structural, mechanical, electrical, heating, ventilating, air conditioning, plumbing and elevators of each hotel, along with alterations and improvements to the hotel as are required, in the manager’s reasonable judgment, to keep the hotel in a competitive, efficient and economical operating condition that is consistent with brand standards. We generally have approval rights over such budgets and expenditures, which we review and approve based on our manager’s recommendations and on our judgment. Expenditures for these major repairs and improvements affecting the hotel building typically are funded directly by owners, although our agreements with Marriott in respect of the Starwood Hotels contemplate that certain such expenditures also may be funded from the FF&E reserve account.
•Treatment of additional owner funding. As additional owner funding becomes necessary, either for expenditures generally funded from the FF&E replacement funds, or for any major repairs or improvements to the hotel building which may be required to be funded directly by owners, most of our agreements provide for an economic benefit to us through an impact on the calculation of incentive management fees payable to our managers. One approach frequently utilized at some of our Marriott-managed hotels (excluding the Starwood Hotels) is to provide such owner funding through loans which are repaid, with interest, from operational revenues, with the repayment amounts reducing operating profit available for payment of incentive management fees. Another approach that is used at the Starwood Hotels, as well as with certain capital expenditures projects at some of our other hotels, is to treat such owner funding as an increase to our investment in the hotel, resulting in an increase to the owner’s priority return with a corresponding reduction to the amount of operating profit available for payment of incentive management fees. For the hotels that are subject to the pooled arrangement described above, the amount of any additional FF&E reserve account funding is allocated to each of such hotels on a pro rata basis, determined with reference to the net operating income of each hotel and the total net operating income of all such pooled hotels for the most recent operating year.
•Territorial protections. Certain management and operating agreements impose restrictions for a specified period which limit the manager and its affiliates from owning, operating or licensing a hotel of the same brand within a specified area. The area restrictions vary with each hotel, from city blocks in urban areas to up to a multi-mile radius from the hotel in other areas.
•Sale of the hotel. Subject to specific agreements as to certain hotels (see below under “Special Termination Rights”), we generally are limited in our ability to sell, lease or otherwise transfer such hotels by the requirement that the transferee assumes the related management agreements and meets specified other conditions, including the condition that the transferee not be a competitor of the manager.
•Performance Termination Rights. In addition to any right to terminate that may arise as a result of a default by the manager, most of our management and operating agreements include reserved rights for us to terminate on the basis of the manager’s failure to meet certain performance-based metrics, typically including a specified threshold return on the owner’s investment in the hotel, along with a failure of the hotel to achieve a specified RevPAR performance threshold established with reference to other competitive hotels in the market. Typically, such performance-based termination rights arise in the event the manager fails to achieve these specified performance thresholds over a consecutive two-year period and are subject to the manager’s ability to “cure” and avoid termination by payment to us of specified deficiency amounts (or, in some instances, waiver of the right to receive specified future management fees). We have agreed in the past, and may agree in the future, to waive certain of these termination rights in exchange for consideration from a manager or its affiliates, which consideration may include cash compensation or amendments to management agreements.
•Special Termination Rights. In addition to any performance-based or other termination rights set forth in our management and operating agreements, we have specific negotiated termination rights as to certain management and operating agreements. While the brand affiliation of a hotel may increase its value, the ability to dispose of a property unencumbered by a management agreement, or even brand affiliation, also can increase the value for prospective purchasers. These termination rights can take several different forms, including termination of agreements upon sale that leave the property unencumbered by any agreement; termination upon sale provided that the property continues to be operated under a license or franchise agreement with continued brand affiliation; or termination without sale or other conditions, which may require the payment of a fee.
In addition to hotels managed by brand owners, we have both branded hotels and non-branded hotels operated by independent managers. Our management agreements with independent managers, while similar in operational scope to agreements with our brand managers, typically have shorter initial terms, no renewal rights, more flexible termination rights, and more limited system-wide services. However, while we have additional flexibility with respect to these operators, certain of those hotels remain subject to underlying franchise or licensing agreements. These franchise or licensing agreements allow us to engage independent managers to operate our hotels under the applicable brand names and to participate in the brands’ reservation and loyalty-rewards systems. Under these agreements, we pay the brand owners a franchise or licensing fee equal to a specified percentage of gross room revenues, as well as other system fees and reimbursements. In addition, we are obligated to maintain applicable brand standards at our franchised hotels.
Operating Structure
Host Inc. operates through an umbrella partnership structure in which substantially all its assets are owned by Host L.P., of which Host Inc. is the sole general partner and holds approximately 99% of the OP units as of December 31, 2024. A REIT is a corporation that has elected to be treated as a REIT under the Internal Revenue Code of 1986, as amended (the “Code”), and that meets certain ownership, organizational and operating requirements set forth under the Code. In general, by payments of dividends to stockholders, a REIT is permitted to reduce or eliminate federal income taxes at the corporate level. Each OP unit owned by unaffiliated limited partners other than Host Inc. is redeemable, at the option of the limited partner, for an amount of cash equal to the market value of one share of Host Inc. common stock multiplied by the current conversion factor of 1.021494. Host Inc. has the right to acquire any OP unit offered for redemption directly from the limited partner in exchange for 1.021494 shares of Host Inc. common stock instead of Host L.P. redeeming such OP unit for cash. Additionally, for every share of common stock issued by Host Inc., Host L.P. will issue 0.97895 OP units to Host Inc. in exchange for the consideration received from the issuance of the common stock. As of December 31, 2024, unaffiliated limited partners owned 9.2 million OP units, which were convertible into 9.4 million Host Inc. common shares.
Assuming that all OP units held by unaffiliated limited partners were converted into common shares, there would have been 708.5 million common shares of Host Inc. outstanding at December 31, 2024.
Our operating structure is as follows:
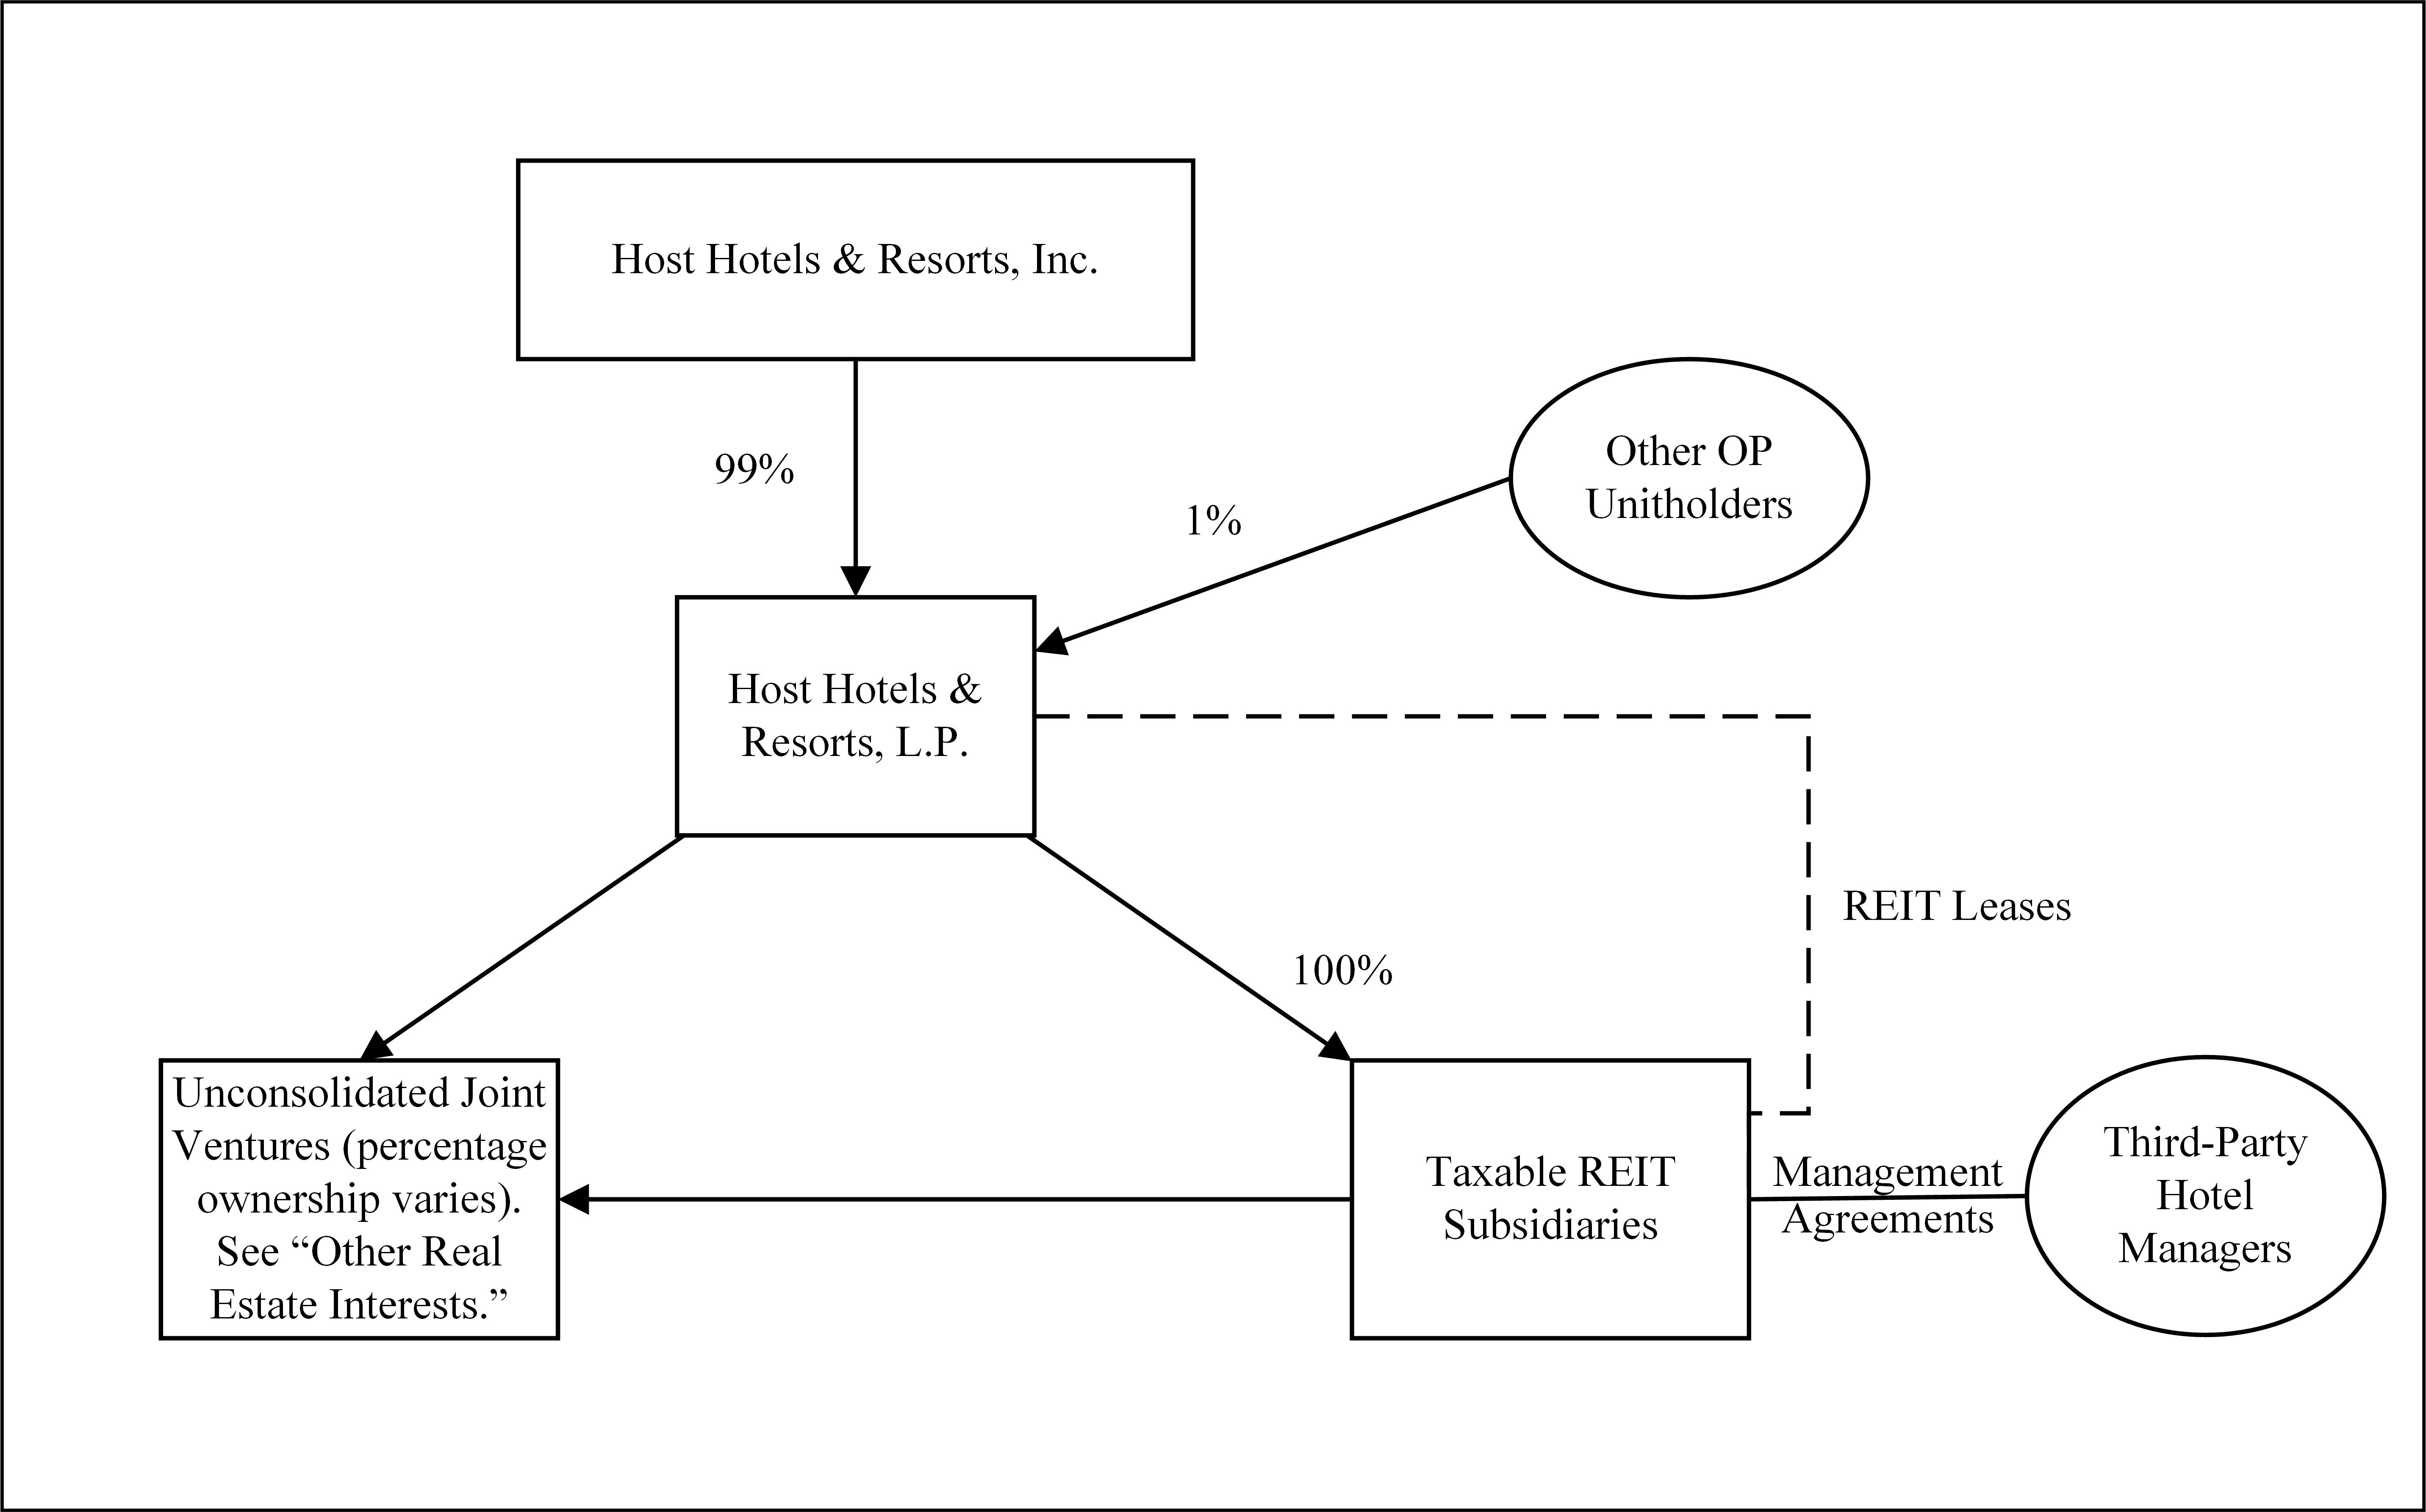
As a REIT, certain tax laws limit the amount of “non-qualifying” income that Host Inc. and Host L.P. can earn, including income derived directly from the operation of hotels. As a result, we lease substantially all our consolidated hotels to certain of our subsidiaries designated as taxable REIT subsidiaries (“TRS”) for federal income tax purposes. Our TRS are subject to federal and state corporate income tax and are not limited as to the amount of non-qualifying income they can generate, but they are limited in terms of their value as a percentage of the total value of our assets. Our TRS enter into agreements with third parties to manage the operations of the hotels. Our TRS also may own assets engaging in activities that produce non-qualifying income, such as the development of timeshare or condominium units and the generation of asset management fees, subject to certain restrictions. The difference between the hotels’ net operating cash flow and the aggregate rents paid to Host L.P. is retained or incurred by our TRS as taxable income or loss. Accordingly, the net effect of the TRS leases is that a portion of the net operating cash flow from our hotels is subject to federal, state and, if applicable, foreign corporate income tax.
Our Consolidated Hotel Portfolio
As of February 21, 2025, we owned a portfolio of 81 hotels, of which 76 are in the United States and five are located in Brazil and Canada. Our consolidated hotels located outside the United States collectively have approximately 1,500 rooms. Approximately 2% of our revenues in 2024, 2% of our revenues in 2023 and 1% of our revenues in 2022 were attributed to the operations of these five foreign hotels.
The lodging industry is viewed as consisting of six different categories, each of which caters to a discrete set of customer tastes and needs: luxury, upper upscale, upscale, upper midscale, midscale and economy. Our portfolio primarily consists of luxury and upper upscale properties, which are operated under internationally recognized brand names such as Marriott, Westin, Ritz-Carlton, Hyatt, Four Seasons and Hilton. Our portfolio also includes hotels referred to as “soft-branded” that are associated with a major brand chain, but maintain a unique identity that is customized towards a particular customer profile or authentic location.
Revenues earned at our hotels consist of three broad categories: rooms, food and beverage, and other revenues. While approximately 60% of our revenues in 2024 were generated from rooms sales, the majority of our properties feature a variety of amenities that help drive demand and profitability. Our hotels typically include meeting and banquet facilities, a variety of restaurants and lounges, swimming pools, exercise facilities and/or spas, gift shops and parking facilities, the combination of which enable them to serve business, leisure and group travelers.
Our consolidated portfolio includes 29 hotels that have more than 500 rooms. The average age of our properties is 37 years, although substantially all of them have benefited from significant renovations or major additions, as well as
regularly scheduled renewal and replacement expenditures and other capital improvements. In our consolidated portfolio, approximately 88% of our hotels, by room count, are managed by their own brand managers, and 12% are managed by independent managers as a franchise or as an independent brand.
By Brand. The following table details our consolidated hotel portfolio by brand as of February 21, 2025:
| | | | | | | | | | | | | | | | | | | | |
| Brand | | Number
of Hotels | | Rooms | | Percentage of Revenues ⁽¹⁾ |
| Marriott: | | | | | | |
| Marriott | | 26 | | 19,038 | | 36.8 | % |
| Ritz-Carlton | | 6 | | 2,367 | | 10.2 | % |
| Autograph Collection | | 1 | | 223 | | 0.3 | % |
| Tribute Portfolio | | 1 | | 173 | | 0.4 | % |
| JW Marriott | | 4 | | 1,909 | | 3.5 | % |
| AC Hotels | | 1 | | 165 | | 0.2 | % |
| W | | 1 | | 424 | | 0.6 | % |
| St. Regis | | 1 | | 232 | | 0.4 | % |
| Luxury Collection | | 1 | | 645 | | 3.5 | % |
| Westin | | 8 | | 3,972 | | 7.7 | % |
| Sheraton | | 1 | | 370 | | 0.4 | % |
| Total Marriott | | 51 | | 29,518 | | 64.0 | % |
| Hyatt: | | | | | | |
| Alila | | 1 | | 59 | | 0.7 | % |
| Andaz | | 1 | | 320 | | 1.7 | % |
| Grand Hyatt | | 4 | | 3,638 | | 7.0 | % |
| Hyatt Place | | 1 | | 426 | | 0.7 | % |
| Hyatt Regency | | 6 | | 3,866 | | 7.5 | % |
| Total Hyatt | | 13 | | 8,309 | | 17.6 | % |
| Hilton: | | | | | | |
| Curio | | 2 | | 591 | | 1.6 | % |
| Hilton | | 1 | | 223 | | 0.2 | % |
| Embassy Suites | | 2 | | 961 | | 1.5 | % |
| Total Hilton | | 5 | | 1,775 | | 3.3 | % |
| AccorHotels: | | | | | | |
| Swissôtel | | 1 | | 662 | | 1.0 | % |
| Fairmont | | 1 | | 450 | | 2.3 | % |
| ibis | | 1 | | 256 | | 0.1 | % |
| Novotel | | 1 | | 149 | | 0.1 | % |
| Total AccorHotels | | 4 | | 1,517 | | 3.5 | % |
| 1 Hotel | | 3 | | 882 | | 4.7 | % |
| Four Seasons | | 2 | | 569 | | 4.8 | % |
| Other/Independent | | 3 | | 819 | | 2.1 | % |
| | | 81 | | 43,389 | | 100.0 | % |
___________
(1)Based on our 2024 revenues; no individual hotel contributed more than 6% of total revenues in 2024. Hotels that are not considered upper upscale or luxury constitute approximately 1% of our revenues.
By Location. The following table details the locations and numbers of rooms at our consolidated hotels as of February 21, 2025:
| | | | | | | | | | | | | | | | | | | | |
| Location | | Rooms | | Location | | Rooms |
| Arizona | | | | Hawaii | | |
| AC Hotel Scottsdale North | | 165 | | Andaz Maui at Wailea Resort | | 320 |
| The Phoenician, A Luxury Collection Resort, Scottsdale | | 645 | | Fairmont Kea Lani, Maui | | 450 |
| The Westin Kierland Resort & Spa | | 735 | | Hyatt Place Waikiki Beach | | 426 |
| California | | | | Hyatt Regency Maui Resort and Spa | | 810 |
| Alila Ventana Big Sur | | 59 | | The Ritz-Carlton O'ahu, Turtle Bay | | 450 |
| Axiom Hotel | | 152 | | Illinois | | |
| Coronado Island Marriott Resort & Spa ⁽¹⁾ | | 300 | | Embassy Suites by Hilton Chicago Downtown Magnificent Mile | | 455 |
| Grand Hyatt San Francisco | | 669 | | Swissôtel Chicago | | 662 |
| Hyatt Regency San Francisco Airport | | 790 | | The Westin Chicago River North | | 445 |
| Manchester Grand Hyatt San Diego ⁽¹⁾ | | 1,628 | | Louisiana | | |
| Marina del Rey Marriott ⁽¹⁾ | | 370 | | New Orleans Marriott | | 1,333 |
| Marriott Marquis San Diego Marina ⁽¹⁾ | | 1,366 | | Maryland | | |
| San Francisco Marriott Fisherman's Wharf | | 285 | | Gaithersburg Marriott Washingtonian Center | | 284 |
| San Francisco Marriott Marquis ⁽¹⁾ | | 1,500 | | Massachusetts | | |
| Santa Clara Marriott ⁽¹⁾ | | 766 | | Boston Marriott Copley Place ⁽¹⁾ | | 1,145 |
| The Ritz-Carlton, Marina del Rey ⁽¹⁾ | | 304 | | The Westin Waltham Boston | | 351 |
| The Westin South Coast Plaza, Costa Mesa ⁽²⁾ | | 393 | | Minnesota | | |
| Colorado | | | | Minneapolis Marriott City Center | | 585 |
| Denver Marriott Tech Center | | 605 | | New Jersey | | |
| Denver Marriott West ⁽¹⁾ | | 305 | | Newark Liberty International Airport Marriott ⁽¹⁾ | | 591 |
| The Westin Denver Downtown | | 432 | | Sheraton Parsippany Hotel | | 370 |
| Florida | | | | New York | | |
| 1 Hotel South Beach | | 433 | | 1 Hotel Central Park | | 234 |
| Baker's Cay Resort Key Largo, Curio Collection by Hilton | | 200 | | New York Marriott Downtown | | 515 |
| Four Seasons Resort Orlando at Walt Disney World® Resort | | 444 | | New York Marriott Marquis | | 1,971 |
| Hyatt Regency Coconut Point Resort and Spa | | 462 | | Ohio | | |
| Miami Marriott Biscayne Bay | | 605 | | The Westin Cincinnati ⁽¹⁾ | | 456 |
| Orlando World Center Marriott | | 2,004 | | Pennsylvania | | |
| Tampa Airport Marriott ⁽¹⁾ | | 298 | | Philadelphia Airport Marriott ⁽¹⁾ | | 419 |
| The Don CeSar | | 348 | | The Logan Philadelphia, Curio Collection by Hilton | | 391 |
| The Ritz-Carlton, Amelia Island | | 446 | | Tennessee | | |
| The Ritz-Carlton, Naples | | 474 | | 1 Hotel Nashville | | 215 |
| The Ritz-Carlton Naples, Tiburón | | 295 | | Embassy Suites by Hilton Nashville Downtown | | 506 |
| The Singer Oceanfront Resort, Curio Collection by Hilton | | 223 | | Texas | | |
| Georgia | | | | Hotel Van Zandt | | 319 |
| The Alida, Savannah, a Tribute Portfolio Hotel | | 173 | | Houston Airport Marriott at George Bush Intercontinental ⁽¹⁾⁽³⁾ | | 573 |
| Grand Hyatt Atlanta in Buckhead | | 439 | | Houston Marriott Medical Center/Museum District ⁽¹⁾ | | 398 |
| JW Marriott Atlanta Buckhead | | 371 | | Hyatt Regency Austin | | 448 |
| | | | | | | | | | | | | | | | | | | | |
| Texas (cont.) | | | | Washington, D.C. (cont.) | | |
| JW Marriott Houston by The Galleria | | 516 | | JW Marriott Washington, DC | | 777 |
| San Antonio Marriott Rivercenter ⁽¹⁾ | | 1,000 | | The Westin Georgetown, Washington D.C. | | 269 |
| San Antonio Marriott Riverwalk | | 512 | | Washington Marriott at Metro Center | | 459 |
| The Laura Hotel, Houston Downtown, Autograph Collection | | 223 | | Wyoming | | |
| The St. Regis Houston | | 232 | | Four Seasons Resort and Residences Jackson Hole | | 125 |
| Virginia | | | | Brazil | | |
| Hyatt Regency Reston | | 518 | | ibis Rio de Janeiro Parque Olimpico | | 256 |
| The Ritz-Carlton, Tysons Corner ⁽¹⁾ | | 398 | | JW Marriott Hotel Rio de Janeiro | | 245 |
| Washington | | | | Novotel Rio de Janeiro Parque Olimpico | | 149 |
| The Westin Seattle | | 891 | | Canada | | |
| W Seattle | | 424 | | Calgary Marriott Downtown Hotel | | 388 |
| Washington, D.C. | | | | Marriott Downtown at CF Toronto Eaton Centre ⁽¹⁾ | | 461 |
| Grand Hyatt Washington | | 902 | | Total | | 43,389 |
| Hyatt Regency Washington on Capitol Hill | | 838 | | | | |
| | | | | | |
___________
(1)The land on which this hotel is built is leased from a third party under one or more lease agreements.
(2)The land, building and improvements are leased from a third party under a long-term lease agreement.
(3)This property is not wholly owned.
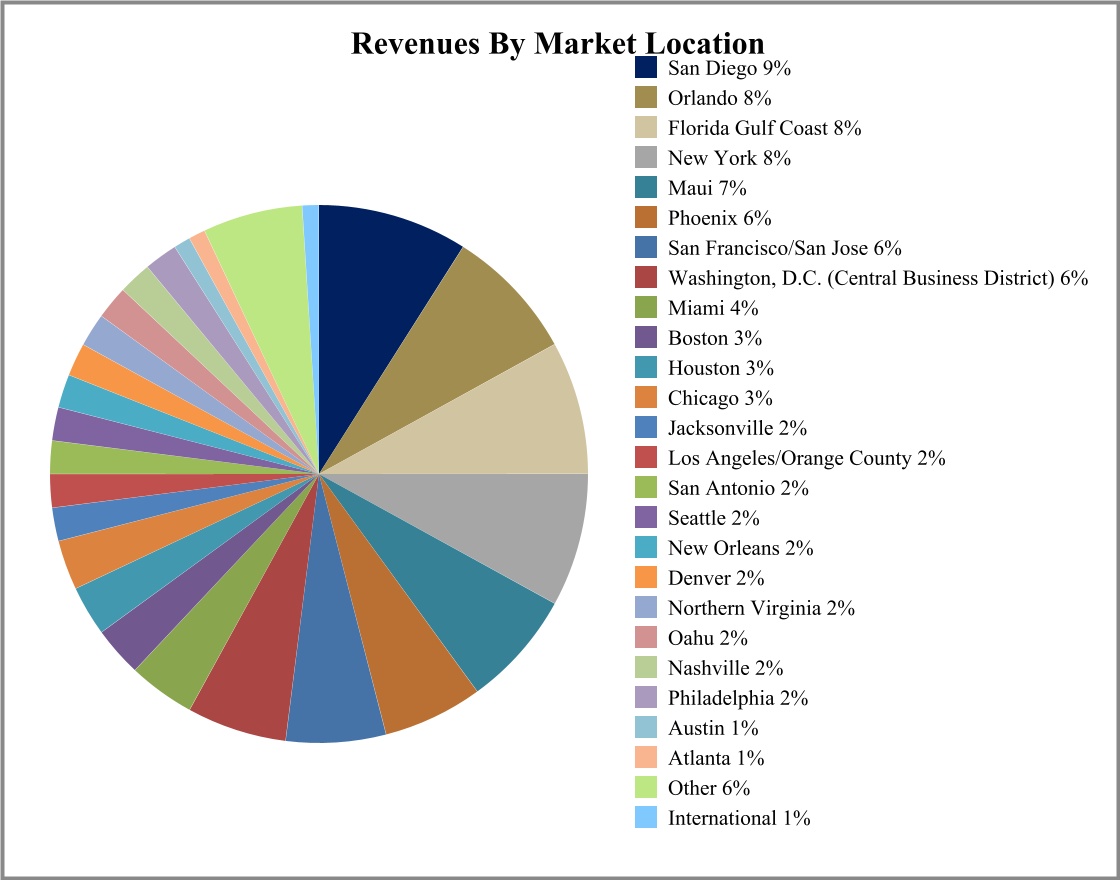
By Market Location: With our geographically diverse portfolio, no individual market represents more than 9% of total revenues. The following chart summarizes the composition of our consolidated hotels as of February 21, 2025 by each market location based on its percentage of 2024 revenues:
Other Real Estate Interests
We own non-controlling interests in several entities that, as of February 21, 2025, owned, or owned an interest in, 40 properties and a vacation ownership development. Due to the ownership structure and economic or participating rights of our partners, we do not consolidate the operations of the properties owned by these entities and they are included in equity in earnings in our consolidated results of operations. Our investments in these entities include the following:
Noble Joint Venture. While our primary focus is the upper-upscale and luxury chain scales, we also seek opportunities to elevate our growth profile through investment in select service hotels, extended stay hotels and new development deals. Accordingly, in 2022, we entered into definitive agreements with Noble Investment Group, LLC, a leading private hospitality asset manager in the upscale, select service and extended stay chain scales, and certain other entities and persons related to Noble Investment Group, LLC, to acquire a minority equity interest in Noble Management Holdings, LLC and Noble Investment Holdings, LLC representing 49% of (a) the net fee income of the Noble Investment Group business in respect of existing and future Noble Investment Group funds and other revenue-based activities, (b) 40% of the gross carried interest earned on the funds formed after closing, and (c) proceeds earned by the general partner on commitments to future funds. As part of our investment, we have made a $211.5 million capital commitment to Noble Hospitality Fund V, L.P. ("Noble Fund V"), which represents a 21.15% ownership interest in the fund. As of December 31, 2024, we have funded $72 million to Noble Fund V. Additionally, through a co-investment of the fund, we have committed an additional $30 million of which we have funded $13 million. Noble Fund V and the co-investment currently own 30 select service and extended stay hotels and ten land sites to be developed.
Beginning in 2026, upon certain triggers being met, we have the ability to acquire up to 100% of Noble Management Holdings, LLC and Noble Investment Holdings, LLC. To the extent certain triggers are met and we have not exercised our call right, Noble Investment Group, LLC has a one-time ability, but not the obligation, to exercise its put
right to cause us to purchase up to an additional 26% of Noble Management Holdings, LLC and Noble Investment Holdings, LLC.
Maui Joint Venture. We own a 67% interest in a joint venture with an affiliate of HV Global Group, a subsidiary of Marriott Vacations Worldwide Corporation, that owns a 131-unit vacation ownership development in Maui, Hawaii adjacent to our Hyatt Regency Maui Resort & Spa.
Hyatt Place Joint Venture. We own a 50% interest in a joint venture with White Lodging Services that owns the 255-room Hyatt Place Nashville Downtown in Tennessee. In August 2024, the joint venture completed an amendment and restatement of its $60 million mortgage loan agreement, extending its maturity to August 2, 2029. The loan is non-recourse to us.
Harbor Beach Joint Venture. We own a 49.9% interest in a joint venture with R/V-C Association that owns the 650-room Fort Lauderdale Marriott Harbor Beach Resort & Spa in Florida. The joint venture has a $158 million mortgage loan outstanding on the hotel that is non-recourse to us. Additional advances up to $27 million are available until December 31, 2025 to fund capital expenditures.
Asia/Pacific Joint Venture. We have a 25% interest in a joint venture with RECO Hotels JV Private Limited, an affiliate of the Government of Singapore Investment Corporation Pte Ltd. The agreement may be terminated by either partner at any time, which would trigger the liquidation of the joint venture. The commitment period for equity contributions to the joint venture has expired. Certain funding commitments remain, however, related to its existing investments in India.
As of December 31, 2024, this joint venture has invested approximately $109 million (of which our share is $27 million) in a separate joint venture in India with Accor S.A. and InterGlobe Enterprises Limited, in which it holds a 36% interest. This joint venture owns seven hotels and an office building in Delhi, Bangalore and Chennai, India, totaling approximately 1,718 rooms. The hotels are managed by AccorHotels under the Pullman, ibis and Novotel brands.
For additional information see Part II Item 8. “Financial Statements and Supplementary Data – Note 4. Investments in Affiliates.” Competition
The lodging industry is highly competitive. Competition often is specific to individual markets and is based on several factors, including location, brand, guest facilities and amenities, level of service, room rates and the quality of accommodations. The lodging industry is viewed as consisting of six different categories, each of which caters to a discrete set of customer tastes and needs: luxury, upper upscale, upscale, upper midscale, midscale and economy. The classification of a hotel is based on lodging industry standards, which take into consideration many factors, such as guest facilities and amenities, level of service and quality of accommodations. Most of our hotels operate in urban and resort markets either as luxury properties under such brand names as 1 Hotels®, Alila®, Andaz®, Fairmont®, Four Seasons®, Grand Hyatt®, JW Marriott®, Ritz-Carlton®, St. Regis®, The Don Cesar®, The Luxury Collection® and W®, or as upper upscale properties under such brand names as Autograph Collection®, Curio – A Collection by Hilton®, Embassy Suites by Hilton ®, Hilton®, Hyatt Regency®, Marriott®, Marriott Marquis®, Sheraton®, Swissôtel®, Tribute Portfolio® and Westin®.1 While our hotels compete primarily with other hotels in the luxury and upper upscale category, they also may compete with hotels in other lower-tier categories. A recent source of supply for the lodging industry has been the rapid growth of online short-term rentals, including as a flexible option for apartment buildings. Our hotels also may compete with these short-term rentals in certain markets. In addition, many management contracts for our hotels do not prohibit our managers from converting, franchising or developing other hotels in our markets. As a result, our hotels compete with other hotels that our managers may own, invest in, manage or franchise.
We also compete with other REITs and other public and private investors for the acquisition of new properties and investment opportunities as we attempt to position our portfolio to best take advantage of changes in markets and travel patterns of our customers.
1 This annual report contains registered trademarks that are the exclusive property of their respective owners, which are companies other than us. None of the owners of these trademarks, their affiliates or any of their respective officers, directors, agents or employees has or will have any responsibility or liability for any information contained in this annual report.
Seasonality
Our hotel sales traditionally have experienced moderate seasonality, which varies based on the individual hotel and the region. Hotel sales for our consolidated portfolio were approximately 26%, 26%, 23% and 25% for the first, second, third and fourth calendar quarters, respectively, in 2024.
Environmental, Governmental and Regulatory Matters
Under various federal, state and local environmental laws, ordinances and regulations, a current or previous owner or operator of real property may be liable for the costs of removal or remediation of hazardous or toxic substances. These laws may impose liability whether or not the owner or operator knew of, or was responsible for, the presence of such hazardous or toxic substances. In addition, certain environmental laws and common law principles could be used to impose liability for the release of hazardous or toxic materials, and third parties may seek recovery from owners or operators of real properties for personal injury associated with exposure to released hazardous or toxic materials. Environmental laws also may impose restrictions on the way property may be used or businesses may be operated, and these restrictions may require corrective or other expenditures. In connection with our current or prior ownership or operation of hotels, we potentially may be liable for various environmental costs or liabilities. Although currently we are not aware of any material environmental claims pending or threatened against us, we can offer no assurance that a material environmental claim will not be asserted against us in the future.
Our hotels also are subject to various other forms of regulation, including Title III of the Americans with Disabilities Act (“ADA”), building codes and regulations pertaining to fire and life safety. Under the ADA, all public accommodations are required to meet certain federal rules related to access and use by disabled persons and we have in the past and may in the future incur capital expenditures to make our hotels accessible. These and other building laws and regulations may be changed from time to time, or new regulations adopted, resulting in additional costs of compliance, including potential litigation. A determination that we are not in compliance with these laws and regulations could result in a court order to bring the hotel into compliance, the imposition of civil penalties in cases brought by the Justice Department or an award of attorneys’ fees to private litigants. Compliance with these laws and regulations could require substantial capital expenditures.
Human Capital Resources
As of February 21, 2025, we had 165 employees, all of whom work in the United States, including our regional office in Miami. The current average tenure of our employees is approximately 14 years, and the voluntary and total turnover rates in 2024 were 2% and 5%, respectively. Our human capital objectives include encouraging individual contributions, reinforcing Host’s EPIC values and culture, maximizing employee engagement and retention and minimizing organizational disruption through succession action plans. Our employees are given the opportunity to participate in training and education programs such as external training, professional certifications, executive and leadership coaching, continuing education and professional memberships. Additionally, all employees receive annual performance reviews that incorporate our EPIC values and our competencies, which include adaptability, communication, teamwork and complete thinking. We encourage regular and ongoing feedback tied to performance and career development. In order to ensure that we are meeting our human capital objectives, we conduct employee surveys to obtain feedback on various topics, informing how we execute on specific programs.
Our CEO is a part of the CEO Action for Diversity & Inclusion initiative to continue to advance diversity and inclusion within our workplace, along with our formal diversity and inclusion initiative. We also provide unconscious bias training to our employees. As of December 31, 2024, our total workforce consists of 43% men and 57% women, with 46% of management positions held by women. Our workforce also consists of 38% minorities, with 21% of management positions held by minorities.
The number of employees referenced above does not include the hotel employees of our three hotels in Brazil, which, while technically Host employees, are under the direct supervision and control of our third-party hotel manager in Brazil. The employees at all of our U.S. and Canadian hotels are employees of our third-party hotel managers, who are responsible for hiring and maintaining employees.
Although we do not manage employees at our consolidated hotels, we still are subject to many of the costs and risks generally associated with the hotel labor force. Employees of our third-party hotel managers at 18 of our hotels, representing approximately 26% of our total room count, are covered by collective bargaining agreements that are subject
to review and renewal on a regular basis. For a discussion of these relationships, see Part I Item 1A. “Risk Factors—We are subject to risks associated with the employment of hotel personnel, particularly with hotels that employ unionized labor.” None of Host’s employees are covered by collective bargaining agreements. Where to Find Additional Information
The address of our principal executive office is 4747 Bethesda Ave, Suite 1300, Bethesda, Maryland, 20814. Our phone number is (240) 744-1000. We maintain an internet website at: www.hosthotels.com. Through our website, we make available free of charge as soon as reasonably practicable after they are filed electronically with, or furnished to, the SEC, our annual reports on Form 10-K, quarterly reports on Form 10-Q, current reports on Form 8-K and amendments to those reports filed or furnished pursuant to Section 13(a) or 15(d) of the Securities Exchange Act of 1934, as amended (the “Exchange Act”). The SEC also maintains an Internet site that contains reports, proxy and information statements, and other information regarding issuers at http://www.sec.gov.
Our website also is a key source of important information about us. We routinely post to the Investor Relations section of our website important information about our business, our operating results and our financial condition and prospects, including, for example, information about material acquisitions and dispositions, our earnings releases and certain supplemental financial information to our earnings releases. We also post to our website copies of investor presentations, which contain important information about us, and we update those presentations periodically. The website has a Corporate Governance page in the Our Company section that includes, among other things, copies of our Bylaws, our Code of Business Conduct and Ethics, our Corporate Governance Guidelines and the charters for each standing committee of Host Inc.’s Board of Directors, which currently include the Audit Committee, the Culture and Compensation Committee and the Nominating, Governance and Corporate Responsibility Committee. Copies of these charters and policies, Host Inc.’s Bylaws and Host L.P.’s partnership agreement also are available in print to stockholders and unitholders upon request to Host Hotels & Resorts, Inc., 4747 Bethesda Ave, Suite 1300, Bethesda, Maryland, 20814, Attn: Secretary. Please note that the information contained on our website is not incorporated by reference in, or considered to be a part of, any document, unless expressly incorporated by reference therein.
Item 1A. Risk Factors
For an enterprise as large and complex as we are, a wide range of factors could materially affect future results and performance. The statements in this section describe the major risks to our business and should be considered carefully. In addition, these statements constitute our cautionary statements under the Private Securities Litigation Reform Act of 1995.
Financial Risks and Risks of Operation
Our revenues and the value of our hotels are subject to conditions affecting the lodging industry.
The performance of the lodging industry traditionally has been affected by the strength of the general economy and, specifically, growth in gross domestic product. Because lodging industry demand typically follows the general economy, the lodging industry is highly cyclical, which contributes to potentially large fluctuations in our financial condition and our results of operations. Changes in travel patterns of both business and leisure travelers, particularly during periods of economic contraction or low levels of economic growth, may create difficulties for the industry over the long-term and adversely affect our results of operations. In addition, the majority of our hotels are classified as luxury or upper upscale and generally target business and high-end leisure travelers. In periods of economic difficulties, certain business and leisure travelers may seek to reduce travel costs by limiting travel or seeking to reduce the cost of their trips. Consequently, our hotels may be more susceptible to a decrease in revenues during an economic downturn, as compared to hotels in other categories that have lower room rates. Other circumstances affecting the lodging industry which may affect our performance and the forecasts we make include:
•the effect on lodging demand of changes in national and local economic and business conditions, including concerns about U.S. economic growth and the potential for an economic recession in the United States or globally, the recent high level of inflation, elevated interest rates, global economic prospects, consumer confidence and the value of the U.S. dollar;
•factors that may shape public perception of travel to a particular location, including natural disasters, such as the Maui wildfires in 2023 and Southern California wildfires in 2025, adverse weather events, such as Hurricane Ian in 2022 and Hurricanes Helene and Milton in 2024, or extreme precipitation, pandemics and other public health crises, such as the COVID-19 pandemic, or the occurrence or potential
occurrence of terrorist attacks, all of which will affect occupancy rates at our hotels and the demand for hotel products and services;
•risks that U.S. immigration policies and border closings, visa processing times, travel restrictions or advisories, changes in energy prices or changes in foreign exchange rates will suppress international travel to the United States generally or decrease the labor pool, and risks that international U.S. outbound travel may remain elevated relative to historic levels;
•the impact of geopolitical developments outside the U.S., such as large-scale wars or international conflicts, slowing global growth, or trade tensions and proposed tariffs between the United States and its trading partners such as China, all of which could affect global travel and lodging demand within the United States or result in supply chain disruptions;
•volatility in global financial and credit markets, which could materially adversely affect U.S. and global economic conditions, business activity, and lodging demand as well as negatively impact our ability to obtain financing and increase our borrowing costs;
•future U.S. governmental action to address budget deficits through reductions in spending and similar austerity measures, as well as the impact of potential U.S. government shutdowns, all of which could materially adversely affect U.S. economic conditions, business activity, credit availability and borrowing costs;
•operating risks associated with the hotel business, including the effect of labor stoppages or strikes, increasing operating or labor costs, including increased labor costs in the recent inflationary environment, the ability of our managers to adequately staff our hotels as a result of shortages in labor, severance and furlough payments to hotel employees or changes in workplace rules that affect labor costs;
•the ability of our hotels to compete effectively against other lodging businesses in the highly competitive markets in which we operate in areas such as access, location, quality of accommodations and room rate structures;
•changes in the desirability of the geographic regions of the hotels in our portfolio or in the travel patterns of hotel customers;
•changes in taxes and governmental regulations that influence or set wages, hotel employee health care costs, prices, interest rates or construction and maintenance procedures and costs; and
•decreases in the frequency of business travel that may result from hybrid or remote work environments and other changes to business operations, such as alternatives to in-person meetings, including virtual meetings hosted online or over private teleconferencing networks.
In addition, the U.S. economy experienced high rates of inflation from 2021 to 2023, which increased our operating expenses due to higher wages and costs. The rate of inflation may remain elevated in the future, resulting in further increases to our operating expenses. Moreover, our interest expense has increased due to higher interest rates on the senior notes we issued in 2024 as well as on our variable rate debt. Although the short-term nature of hotel bookings generally allows our managers to compensate to a certain extent for inflationary effects by increasing room rates at our hotels, sustained inflation could have a negative impact on the demand for lodging. Moreover, an inflationary environment can increase the costs of hotel renovations and the purchasing power of our cash resources can decline, which can have an adverse impact on our business or financial results.
We cannot assure you that adverse changes in the general economy or other circumstances that affect the lodging industry will not have an adverse effect on the hotel revenues or earnings at our hotels. Our efforts to mitigate the risks associated with these adverse changes may not be successful and our business and growth could be adversely affected. A reduction in our revenues or earnings because of the above risks may reduce our working capital, impact our long-term business strategy and impact the value of our assets and our ability to meet certain covenants in our existing debt agreements. In addition, we may incur impairment expense in the future, which expense will affect negatively our results of operations. We can provide no assurance that any impairment expense recognized will not be material to our results of operations.
In addition to general economic conditions affecting the lodging industry, new hotel room supply is an important factor that can affect the lodging industry’s performance and overbuilding has the potential to further exacerbate the negative impact of an economic downturn. Room rates and occupancy, and thus RevPAR, tend to increase when demand growth exceeds supply growth. A reduction or slowdown in the growth of lodging demand or increased growth in lodging
supply could result in returns that are substantially below expectations or result in losses which could materially and adversely affect our revenues and profitability as well as limit or slow our future growth.
We depend on external sources of capital for future growth; therefore, any disruption to our ability to access capital at times, and on terms reasonably acceptable to us, may affect adversely our business and results of operations.
Since we have elected REIT status, Host Inc. must finance its growth and fund debt repayments largely with external sources of capital because it is required to pay dividends to its stockholders in an amount equal to at least 90% of its taxable income (other than net capital gain) each year to qualify as a REIT. Our ability to access external capital could be hampered by several factors, many of which are outside of our control, including:
•price volatility, dislocations and liquidity disruptions in the U.S. and global equity and credit markets;
•changes in market perception of our growth potential, including rating agency downgrades by Moody’s Investors Service, Standard & Poor’s Ratings Services or Fitch Ratings; if our credit ratings were to be downgraded, our access to capital and the cost of debt financing could be further negatively impacted, particularly if we were downgraded to below an investment grade rating;
•decreases in our current or estimated future earnings or decreases or fluctuations in the market price of the common stock of Host Inc.;
•increases in interest rates; and
•the terms of our existing indebtedness, which would restrict our incurrence of additional debt if we were to fall below required covenant levels.
The occurrence of any of the above factors, individually or in combination, could prevent us from being able to obtain the external capital we require on terms that are acceptable to us, or at all, which could have a material adverse effect on (i) our ability to finance our future growth and acquire hotels, (ii) our ability to meet our anticipated requirements for working capital, debt service and capital expenditures, and (iii) our results of operations and financial condition. Potential consequences of disruptions in U.S. and global equity and credit markets could include the need to seek alternative sources of capital with less attractive terms, such as more restrictive covenants, shorter maturity and higher costs, which would have an adverse effect on our financial condition and liquidity.
We operate in a highly competitive industry.
The lodging industry is highly competitive. Our principal competitors are other owners and investors in upper upscale and luxury full-service hotels, including other lodging REITs. Our hotels face strong competition for individual guests, group reservations and conference business from major hospitality chains with well-established and recognized brands, as well as from other smaller hotel chains, independent and local hotel owners and operators. Our hotels compete for customers primarily based on brand name recognition and reputation, as well as location, room rates, property size and availability of rooms and conference space, quality of the accommodations, customer satisfaction, amenities and the ability to earn and redeem loyalty program points. New hotel construction adds to supply, creating new competitors, in some cases without corresponding increases in demand for hotel rooms. Our competitors may have similar or greater commercial and financial resources, which allow them to improve their hotels in ways that affect our ability to compete for guests effectively and adversely affect our revenues and profitability as well as limit or slow our future growth. We also compete for hotel acquisitions with others that have similar investment objectives to ours. This competition could limit the number of investment opportunities that we find suitable for our business. It also may increase the bargaining power of hotel owners seeking to sell to us, making it more difficult for us to acquire new hotels on attractive terms or on the terms contemplated in our business plan.
Internet reservation channels remain a source of competition that could adversely affect our business. While a percentage of hotel rooms for individual or “transient” customers are booked through internet travel intermediaries, the brands we work with have enacted strategies to drive consumers directly to their website or reservation platform, although there can be no assurances that those strategies will be successful. Search engines (including generative AI search) and peer-to-peer inventory sources also provide online travel services that compete with our hotels. If bookings shift to higher cost distribution channels, including these internet travel intermediaries, it could materially impact our profitability. Internet travel intermediaries may also target group and convention business, which could divert such business and materially adversely affect our revenues and profitability.
There are inherent risks with investments in real estate, including their relative illiquidity.
Investments in real estate are inherently illiquid and generally cannot be sold quickly. For this reason, we cannot predict whether we will be able to sell any hotel that we desire to sell for the price or on terms acceptable to us, or the length of time needed to find a willing purchaser and to close on the sale of a hotel. Therefore, we may not be able to vary the composition of our portfolio promptly in response to changing economic, financial and investment conditions or dispose of hotels at opportune times or on favorable terms, which may adversely affect our cash flows and our ability to pay dividends to stockholders. In addition, real estate ownership is subject to various risks, including:
•government regulations relating to real estate ownership or operations, including tax, environmental, zoning and eminent domain laws;
•loss in value of real estate due to changes in market conditions or the area in which it is located or losses in value due to changes in tax laws or increased property tax assessments;
•potential civil liability for accidents or other occurrences on owned or leased properties;
•the ongoing need for owner-funded capital improvements and expenditures in order to maintain or upgrade hotels;
•periodic total or partial closures due to renovations and facility improvements; and
•force majeure events, such as earthquakes, hurricanes, floods or wildfires, which may result in an uninsured loss or a loss in excess of insured limits.
We have significant indebtedness and may incur additional indebtedness.
As of December 31, 2024, we and our subsidiaries had total indebtedness of approximately $5.1 billion. Our indebtedness requires us to commit a significant portion of our annual cash flow from operations to debt service payments, which reduces the availability of our cash flow to fund working capital, capital expenditures, expansion efforts, dividends and distributions and other general corporate needs. Additionally, our substantial indebtedness could:
•make it more difficult for us to satisfy our obligations with respect to our indebtedness;
•limit our ability in the future to undertake refinancings of our debt or to obtain financing for expenditures, acquisitions, development or other general corporate needs on terms and conditions acceptable to us, if at all; or
•affect adversely our ability to compete effectively or operate successfully under adverse economic conditions.
If our cash flow and working capital are not sufficient to fund our expenditures or service our indebtedness, we will be required to raise additional funds through sales of common or preferred OP units of Host L.P. or common or preferred stock of Host Inc., the incurrence of additional permitted indebtedness by Host L.P. or sales of our assets. We cannot make any assurances that any of these sources of funds will be available to us or, if available, will be on terms that we would find acceptable or in amounts sufficient to meet our obligations or fulfill our business plan.
The terms of our indebtedness place restrictions on us and on our subsidiaries, and these restrictions reduce our operational flexibility and create default risks.
We are, and may in the future become, party to agreements and instruments that place restrictions on us and on our subsidiaries. For instance, the covenants in the documents governing the terms of our senior notes and our credit facility restrict, among other things, our ability to:
•incur additional indebtedness in excess of certain thresholds and without satisfying certain financial metrics; and
•pay dividends on classes and series of Host Inc. capital stock and pay distributions on Host L.P.’s classes of units or make stock repurchases without satisfying certain financial metrics concerning leverage, fixed charge coverage and unsecured interest coverage.
The restrictive covenants in our senior notes and credit facility may reduce our flexibility in conducting our operations and limit our ability to engage in activities that may be in our long-term best interest. Failure to comply with these restrictive covenants could result in an event of default that, if not cured or waived, could result in the acceleration of
all or a substantial portion of our indebtedness. For a detailed description of the covenants and restrictions imposed by the documents governing our indebtedness, see Part II Item 7. “Management’s Discussion and Analysis of Financial Condition and Results of Operations—Financial Condition.”
Our expenses may not decrease if our revenues decrease.
Many of the expenses associated with owning and operating hotels, such as debt-service payments, property taxes, insurance, utilities, and employee wages and benefits, are relatively inflexible. They do not necessarily decrease directly with a reduction in revenues at the hotels and may be subject to increases that are not tied to the performance of our hotels or the increase in the rate of inflation generally. Additionally, certain costs, such as wages, benefits and insurance, may exceed the rate of inflation in any given period. In the event of a significant decrease in demand, our hotel managers may not be able to reduce the size of hotel work forces in order to decrease wages and benefits. Our managers also may be unable to offset any fixed or increased expenses with higher room rates. Any of our efforts to reduce operating costs also could adversely affect the future growth of our business and the value of our hotels.
Our acquisition of hotels may have a significant effect on our business, liquidity, financial condition and/or results of operations.
We routinely are actively engaged in the process of identifying, analyzing and negotiating possible transactions for acquiring hotels. We cannot provide any assurances that we will be successful in consummating future acquisitions on favorable terms or that we will realize the benefits that we anticipate from such acquisitions. Our failure to realize the intended benefits from one or more acquisitions could have a significant adverse effect on our business, liquidity, financial condition and/or results of operations. These adverse effects may occur because the performance of the hotel does not support the additional indebtedness and related interest expense that we incurred as a result of the acquisition. In addition, hotels and entities that we have acquired, or may in the future acquire, may be subject to unknown or contingent liabilities for which we may have no recourse, or only limited recourse, against the sellers. In general, the representations and warranties provided in the transaction agreements may not survive long enough for us to become aware of such liabilities and to seek recourse against our sellers, and indemnification covering representations and warranties often is limited and subject to various materiality thresholds, a significant deductible or an aggregate cap on losses. As a result, there is no guarantee that we will recover any amounts with respect to losses due to breaches by the sellers of their representations and warranties.
We may not achieve the value we anticipate from new hotel developments or value enhancement projects at our existing hotels.
We currently are, and in the future may be, involved in the development or redevelopment of hotels, timeshare units or other alternate uses of portions of our existing hotels, including the development of retail, office, condominium or apartments, and including through joint ventures. There are risks inherent in any new development, including:
•We may not obtain the zoning, occupancy and other required governmental permits and authorizations necessary to complete the development. A delay in receiving these approvals could affect adversely the returns we expect to receive.
•Any new construction involves the possibility of construction delays and cost overruns that may increase project costs, including increased costs due to shortages of supplies as a result of supply chain disruptions.
•Defects in design or construction may result in delays and additional costs to remedy the defect or require a portion of a hotel to be closed during the period required to remedy the defect.
•We may not be able to meet the loan covenants in any indebtedness obtained to fund the new development, creating default risks.
•Risks related to changes in economic and market conditions between development commencement and property stabilization.
Any of the above factors could affect adversely our ability to complete the developments on schedule and consistent with the scope that currently is contemplated, or to achieve the intended value of these projects.
We do not control our hotel operations, and we are dependent on the managers of our hotels.
To maintain our status as a REIT, we are not permitted to operate or manage any of our hotels. As a result, we, through our taxable REIT subsidiaries, have entered into management agreements with third-party managers to operate our hotels. For this reason, we are unable to directly implement strategic business decisions with respect to the daily operation and marketing of our hotels, such as decisions with respect to the setting of room rates, food and beverage pricing and certain similar matters. Although we consult with our hotel operators with respect to strategic business plans, the hotel operators are under no obligation to implement any of our recommendations with respect to these matters. While we monitor the hotel managers’ performance, we have limited recourse under our management agreements if we believe that the hotel managers are not performing adequately. The cash flow from our hotels may be affected adversely if our managers fail to provide quality services and amenities or if they or their affiliates fail to maintain a quality brand name. Because our management agreements are long-term in nature, we also may not be able to terminate these agreements if we believe the manager is not performing adequately.
From time to time, we have had, and continue to have, disputes with the managers of our hotels over their performance and compliance with the terms of our management agreements. If we are unable to reach a satisfactory resolution to these disputes through discussions and negotiations, we may choose to litigate the dispute or submit the matter to third-party dispute resolution. Failure by our hotel managers to fully perform the duties agreed to in our management agreements or the failure of our managers to adequately manage the risks associated with hotel operations could affect adversely our results of operations.
In addition, our hotel managers or their affiliates manage, and in some cases own, have invested in, or provided credit support or operating guarantees, to hotels that compete with our hotels, all of which may result in conflicts of interest. As a result, our hotel managers have in the past made, and may in the future make, decisions regarding competing lodging facilities that are not or would not be in our best interest. Furthermore, our management agreements for our brand managed properties generally have provisions that can restrict our ability to sell, lease or otherwise transfer our hotels, unless the transferee is not a competitor of the manager and the transferee assumes the related management agreements and meets other specified conditions. Our ability to finance or sell our hotels, depending upon the structure of the transactions, may require the manager’s consent. Similarly, decisions with respect to the repositioning of a hotel, such as the outsourcing of food and beverage outlets, also may require the manager’s consent.
The hotels managed by Marriott International account for most of our revenues and operating income. Adverse developments in Marriott’s business and affairs or financial condition could have a material adverse effect on us.
Approximately 64% of our hotels (as measured by 2024 revenues) are managed or franchised by Marriott International. We rely on Marriott’s personnel, expertise, technical resources and information systems, proprietary information, good faith and judgment to manage and maintain our hotel operations efficiently, effectively, profitably and in compliance with the terms, responsibilities and duties of our management agreements and all applicable laws and regulations. Any adverse developments in Marriott’s business and affairs or financial condition could impair its ability to manage our hotels and could have a material adverse effect on us.
We are subject to risks associated with the employment of hotel personnel, particularly with hotels that employ unionized labor.
Our third-party managers are responsible for hiring, maintaining and managing the labor force at each of our hotels. We do not directly employ or manage employees at our consolidated hotels (other than employing, but not managing, directing or supervising, the employees at our three hotels in Brazil). However, we remain subject to many of the costs and risks generally associated with the hotel labor force, particularly at those hotels with unionized labor. From time to time, hotel operations may be disrupted because of strikes, lockouts, public demonstrations or other negative actions and publicity. In 2025, our operators will negotiate collective bargaining agreements at hotels in Honolulu, Maui, and Washington, D.C. In addition, collective bargaining agreements for the hotel engineering employees in San Francisco, Seattle and Orange County will also be negotiated in 2025. Those negotiations potentially could result in disruptions in operations and additional costs. We also may incur increased legal costs and indirect labor costs because of disputes involving our third-party managers and their labor force. The resolution of labor disputes or re-negotiated labor contracts could lead to increased labor costs, which is a significant component of our hotel operating costs, either by increases in wages or benefits or by changes in work rules that raise hotel operating costs. As we are not the employer nor bound by any collective bargaining agreement, we do not negotiate with any labor organization, and it is the responsibility of each hotel’s manager to enter into such labor contracts. Our ability, if any, to have any meaningful impact on the outcome of
these negotiations is restricted by and dependent on the management agreement covering a specific hotel and we may have little or no ability to control the outcome of these negotiations.
We may be deemed to be a joint employer with our third-party hotel managers under certain new laws, rules and regulations.
As noted above, we do not directly employ or manage employees at our consolidated hotels, and our third-party managers are responsible for hiring and managing the labor force at our hotels. Recent legislative proposals introduced in certain states and local jurisdictions have included provisions requiring that hotel owners be deemed an employer of workers at our hotels. Changes in laws or regulations relating to the employer relationship that result in a determination that we are a “joint employer” with our hotel operators could subject us to liability for employment-related and other liabilities of our hotel operators and could cause us to incur other costs that have a material adverse effect on our business, financial condition and results of operations.
Our hotels have an ongoing need for renovations and potentially significant capital expenditures in order to remain competitive in the marketplace, to maintain brand standards or to comply with applicable laws or regulations. The timing and costs of such renovations or improvements may result in reduced operating performance during construction and may not improve the return on these investments.
We need to make capital expenditures to remain competitive with other hotels, to maintain the economic value of our hotels and to comply with applicable laws and regulations. We also are required by our hotel management agreements to make agreed upon capital expenditures to our hotels. The timing of these improvements can affect hotel performance, particularly if the improvements require closure of a significant number of rooms or other features of the hotels, such as ballrooms, meeting space and restaurants. These capital improvements reduce the availability of cash for other purposes and are subject to cost overruns and delays. In addition, because we depend on external sources of capital, we may not have the necessary funds to invest and, if we fail to maintain our hotels in accordance with brand standards set by our managers, they may terminate the management agreement. Moreover, we may not necessarily realize a significant, or any, improvement in the performance of the hotels at which we make these investments.
A large proportion of our hotels are located in a limited number of large urban cities and, accordingly, we could be disproportionately harmed by adverse changes to these markets or events impacting these markets.
Hotels in the following cities and states represented approximately 66% of our 2024 revenues: New York, Washington, D.C., San Diego, San Francisco, Phoenix, Florida and Hawaii. An economic downturn, an increase in hotel supply in these cities and markets, natural disasters, weather events, terrorist attacks, health epidemics, or similar events in any one of these cities and markets likely would cause a decline in hotel demand and adversely affect occupancy rates, the financial performance of our hotels in these cities and markets and our overall results of operations. For example, lodging demand in Maui, one of our largest markets by revenues, has been significantly impacted by the wildfires that occurred in August 2023, and the effect on lodging demand is expected to continue in 2025. In addition, during the COVID-19 pandemic, large urban markets with enhanced restrictions on social gatherings, such as New York and San Francisco where we have a significant number of hotel rooms, were disproportionately impacted by the decline in lodging demand. Additionally, a majority of our hotels in Florida were affected by Hurricane Ian in 2022 and a significant number were affected by Hurricanes Helene and Milton in September and October 2024, respectively. The threat of terrorism also may negatively impact hotel occupancy and average daily rate, due to resulting disruptions in business and leisure travel patterns and concerns about travel safety. Hotels in major metropolitan areas, such as the major cities that represent our largest markets, may be particularly adversely affected due to concerns about travel safety.
We may acquire or develop hotels in joint ventures with third parties that could result in conflicts.
We have made investments in joint ventures, such as our 2022 joint venture with Noble Investment Group, LLC, and are exploring further investment or development opportunities. We may, from time to time, invest as a co-venturer in other entities owning hotels instead of purchasing them directly. We also may sell interests in existing hotels or existing entities to a third party as part of forming a joint venture with the third party. Investments in joint ventures may involve risks not present were a third party not involved, including the possibility that partners or co-venturers might become bankrupt or fail to fund their share of required capital contributions. Co-venturers may control or share control over the operations of a joint venture. Actions by a co-venturer also could subject the hotels to additional risks because our co-venturer might have economic or business interests or goals that are inconsistent with our interests or goals. Disputes
between us and our partners or co-venturers may result in litigation that would increase our expenses and may negatively impact hotel operations.
Some potential losses are not covered by insurance.
We carry insurance coverage for property, business interruption, terrorism, and other risks with respect to all our hotels and other properties. We also carry, or in certain instances cause our hotel managers to carry, general liability insurance with respect to all our hotels and other properties. Certain coverages related to hotel managers’ employer status, such as worker's compensation, are insured under the hotel manager’s policies. These policies offer coverage features and insured limits that we believe are customary for similar types of properties. Generally, our “all-risk” property policies provide coverage that is available on a per-occurrence basis and that, for each occurrence, has an overall limit, as well as various sub-limits, on the insurance proceeds we can receive. Sub-limits exist for certain types of claims, such as service interruption, debris removal, expediting costs, landscaping replacement, and certain natural disasters such as earthquakes, floods and hurricanes, and may be subject to annual aggregate coverage limits. The dollar amounts of these sub-limits are significantly lower than the dollar amounts of the overall coverage limit. In this regard, hotels in certain of our markets, including California, Florida, Hawaii, Houston, New Orleans and Seattle, are particularly susceptible to damage from natural disasters and the applicable sub-limits are significantly lower than the total value of the hotels we own in these markets and other states where natural disasters are possible. Recovery under the applicable policies also is subject to substantial deductibles, either fixed or as a percentage of total insured value, self-insurance retentions, or insurance issued by a "captive insurer" affiliated with Host Inc. There is no assurance that this insurance, where maintained, will fully fund the re-building or restoration of a hotel that is impacted by an earthquake, hurricane, wildfire or other natural disaster, or a terrorism event, or will fully fund the income lost as a result of the damage. Intensifying natural disasters, including climate change and extreme weather events, coupled with the current economic climate have directly affected the availability of insurance, increased premiums and deductibles, and reduced amounts that insurers are willing to underwrite. As a result, we may need to self-insure more of our exposures and look for alternative means of risk transfer in order to mitigate increasing insurance costs.
Our property insurance policies also provide that all claims from each of our properties resulting from a particular insurable occurrence must be combined for purposes of evaluating whether the aggregate limits and sub-limits provided in our policies have been exceeded. Therefore, if an insurable occurrence affects more than one of our hotels, the claims from each affected hotel will be added together to determine whether the aggregate limit or sub-limits, depending on the type of claim, have been reached. Each affected hotel may only receive a proportional share of the amount of insurance proceeds provided for under the policy if the total value of the loss exceeds the aggregate limits available. For example, if a hurricane were to cause widespread damage in Florida, claims from each of our hotels would be aggregated against the policy limit or sub-limit and could exceed the applicable limit or sub-limit. We may incur losses in excess of insured limits, and we may be even less likely to receive complete coverage for risks that affect multiple properties, such as earthquakes, hurricanes, or certain types of terrorism because the claims will be added together against the policy limit or sub-limit. We are still evaluating the business interruption impact, including related insurance coverage, to our Florida hotels caused by Hurricanes Helene and Milton in September and October 2024, respectively, as further discussed in "Item 8. Financial Statements and Supplementary Data – Note 17. Legal Proceedings, Guarantees and Contingencies.”
In addition, there are other risks relating to property insurance, such as certain environmental hazards, that may be deemed to fall completely outside the general coverage of our policies or may be uninsurable or too expensive to justify coverage. Also, insurance coverage for war, infectious disease, and nuclear, biological, chemical and radiological perils is extremely limited. We also may encounter challenges with an insurance provider regarding whether it will pay a particular claim that we believe to be covered under our policy, which may require litigation. Should a loss in excess of insured limits or an uninsured loss occur, or should we be unsuccessful in obtaining coverage from an insurance carrier, we could lose all or a part of the capital we have invested in a hotel, as well as its anticipated future revenues.
We face the risk of material data breaches and disruptions of our managers’ or our own information technology systems, or the information technology systems of third parties on which we or our managers rely, which could materially adversely affect our business and results.
Our third-party hotel managers are dependent on information technology networks and systems, including the internet, to access, process, transmit and store proprietary and customer information. These complex networks include reservation systems, vacation exchange systems, hotel management systems, customer databases, call centers, administrative systems, and third-party vendor systems. These systems require the collection and retention of large volumes of personally identifiable information of hotel guests, including credit card numbers and passport numbers. Our
hotel managers may store and process such customer information as well as proprietary information both on systems located at the hotels that we own and other hotels that they operate and manage, their corporate locations and at third-party owned facilities, including, for example, in a third-party hosted cloud environment. These information networks and systems are vulnerable to numerous and evolving cybersecurity risks that threaten the confidentiality, integrity and availability of systems and information such as system, network or internet failures; computer hacking or operational disruption (e.g., due to ransomware); cyber-terrorism; viruses, worms or other malicious software programs; social engineering (e.g., phishing); employee error, negligence, malfeasance or fraud; and misconfigurations, "bugs" or other known or unknown vulnerabilities in software and hardware.
These threats can be introduced in any number of ways, including through third parties accessing our hotel managers’ information networks and systems or by exploiting vulnerabilities in third-party software, technologies, tools, services or systems. The risks from these cyber threats are significant. Marriott International, the manager of a majority of our hotels, experienced a material data security breach involving the unauthorized access to the Starwood guest reservation database between 2014 and 2018. The UK Information Commissioner's Office has fined Marriott £18.4 million. Marriott settled a multistate state attorneys' general investigation, pursuant to which it agreed to pay a $52 million fine and take various measures to protect data. Marriott also settled with the Federal Trade Commission and agreed to take measures to protect data. Marriott remains subject to other lawsuits and investigations arising around the world. Marriott has also experienced other, lesser data breaches since 2018 as well. No assurances can be made as to the outcome of these data breach lawsuits or investigations.
We rely on the security systems of our managers to maintain hotel operations and to protect proprietary and hotel customer information. Any compromise of our managers’ or their critical third-party networks could result in a material disruption to our managers’ operations due to disruption in fulfilling guest reservations, delayed bookings or sales, lost guest reservations, or compromises to information. Any of these events could, in turn, result in disruption of the operations of the hotels that we own that are managed by them, increased costs (e.g., to comply with regulatory requirements or to remediate systems), potential litigation (including class actions), and regulatory enforcement and liability. All our major hotel management companies and a majority of our third-party operators maintain insurance against cyber threats. However, these policies provide varying limits and are subject to sub-limits for certain types of claims, and it is not expected that these policies will provide a total recovery of all potential losses. In addition, public disclosure, or loss of customer or proprietary information, such as the data breaches disclosed by Marriott in November 2018, may result in damage to the manager’s reputation and a loss of confidence among hotel guests and result in reputational harm for the hotels owned by us and managed by them, which may have a material adverse effect on our future business, financial condition and results of operations.
In addition to the information technologies and systems of our managers used to operate our hotels, we have our own corporate technologies and systems that are used to access, store, transmit, and manage or support a variety of our business processes and proprietary information. There can be no assurance that the security measures we, our managers or third-party providers have taken to protect systems and information will be fully implemented, complied with or effective in detecting or preventing failures, inadequacies or interruptions in system services or that system security will not be breached through physical or electronic break-ins, computer viruses, and attacks by hackers or insiders. This is particularly so because cyberattack methodologies change frequently and are often not recognized until launched. We, our managers and third-party providers may be unable to identify, investigate or remediate cyber events or incidents because attackers are increasingly using sophisticated techniques and tools (including artificial intelligence (AI) and machine learning) that can avoid detection, circumvent security controls, and even remove or obfuscate forensic evidence. Further, we and third parties, including our third-party managers, continue to adopt AI, which poses new security challenges. The introduction of AI, particularly generative AI, may also result in new or expanded risks and liabilities, including due to enhanced governmental or regulatory scrutiny, litigation, copyright infringement, compliance issues, ethical concerns, security risks relating to private and/or confidential information, as well as other factors that could adversely affect our business, reputation, and financial results. If we or our third-party managers experience an actual or perceived breach or a privacy or security incident because of the use of generative AI, we may lose valuable intellectual property and confidential information, and our reputation, or the reputation of our third-party managers, and the public perception of the effectiveness of our security measures could be harmed. The use of AI can also lead to unintended consequences, including generating content that appears correct but is factually inaccurate, misleading or otherwise flawed, or that results in unintended biases and discriminatory outcomes, which could harm our reputation (or the reputation of our third-party managers) and business and expose us to risks related to inaccuracies or errors in the output of such technologies.
Disruptions in service, system shutdowns and security breaches in the information technologies and systems we, our managers or third-party providers maintain, including unauthorized access to or disclosure of confidential information,
could have a material adverse effect on our business or financial reporting, subject us to liability claims or regulatory penalties, which amounts could be significant, as the SEC and other regulators have increased their focus on companies' cybersecurity vulnerabilities and risks, and increase the costs of compliance and remediation. We currently maintain cyber insurance, which includes coverage for third-party liability (damages and settlements to third parties) and first-party loss (costs incurred by us in response to a network security or privacy event). However, as with our operator’s coverage, our policy is subject to limits and sub-limits for certain types of claims, and we do not expect that this policy will cover all the losses that we could experience from these exposures.
In addition, data privacy and cybersecurity rules, regulations and industry standards are rapidly evolving. Evolving U.S. privacy and security laws, such as the California Consumer Privacy Act and similar laws being enacted or already in force in other states, are imposing significant requirements on companies and, in the California Consumer Privacy Act's case, providing a private right of action with statutory damages available to plaintiffs for certain types of data breaches. Failure to comply with current and future laws, industry standards and other legal obligations or any security incident resulting in operational disruptions and/or the unauthorized access to, or acquisition, release or transfer of personal information may result in governmental enforcement actions, litigation, fines and penalties and adverse publicity and could cause a material adverse effect on both the managers of our hotels and our business, results of operations and reputation. We and our managers also may be required to invest significant resources to comply with regulatory requirements, to enhance our information security controls, and to investigate and remediate any security vulnerabilities.
Applicable REIT laws may restrict certain business activities.
As a REIT, each of Host Inc. and its subsidiary REIT is subject to various restrictions on the types of revenues it can earn, assets it can own and activities in which it can engage. Business activities that could be restricted by applicable REIT laws include, but are not limited to, developing alternative uses of real estate and the ownership of hotels that are not leased to a taxable REIT subsidiary (“TRS”), including the development and/or sale of timeshare or condominium units or the related land parcels. Due to these restrictions, we anticipate that we will continue to conduct certain business activities, including, but not limited to, those mentioned above, in one or more of our TRS. Our TRS are taxable as C corporations and are subject to federal, state, local, and, if applicable, foreign taxation on their taxable income.
We face possible risks associated with natural disasters and the physical effects of climate change.
We are subject to the risks associated with natural disasters and the physical effects of climate change, including more frequent or severe storms, droughts, hurricanes, flooding, earthquakes, wildfires, power shortages or outages and extreme temperatures, any of which could have a material adverse effect on our hotels, operations and business including, but not limited to, by damaging properties, by increasing the costs associated with our properties, or by decreasing the attractiveness of certain locations. For example, lodging demand in Maui, one of our largest markets by revenues, has been significantly impacted by the wildfires that occurred in August 2023, and a majority of our hotels in Florida were affected by Hurricane Ian in 2022 and a significant number of our hotels were affected by Hurricanes Helene and Milton in September and October 2024, respectively. Over time, our coastal markets are expected to continue to experience increases in storm intensity and rising sea levels causing damage to our hotels. As a result, we could become subject to significant losses and/or repair costs that may or may not be fully covered by insurance. Other markets such as Arizona may experience prolonged variations in temperature or precipitation that may limit access to the water needed to operate our hotels or significantly increase energy costs, which may subject those hotels to additional regulatory burdens, such as limitations on water usage or stricter energy efficiency standards. Climate change also may affect our business by increasing the cost of (or making unavailable) property insurance on terms we find acceptable in areas vulnerable to such events, increasing operating costs at our hotels, such as the cost of water or energy, and requiring us to expend funds as we seek to repair and protect our hotels against such risks. In addition, changes in government legislation and regulation on climate change could result in increased capital expenditures to improve the energy efficiency of our properties. There can be no assurance that climate change will not have a material adverse effect on our hotels, operations or business.
Risks of Ownership of Host Inc.’s Common Stock
There are limitations on the acquisition of Host Inc. common stock and changes in control.
Host Inc.’s charter and bylaws, the partnership agreement of Host L.P., and the Maryland General Corporation Law (the “MGCL”) contain a number of provisions, the exercise or existence of which could delay, defer or prevent a
transaction or a change in control that might involve a premium price for Host Inc.’s stockholders or Host L.P.’s unitholders, including the following:
•Restrictions on transfer and ownership of Host Inc.’s stock. To assist in maintaining Host Inc.’s qualification as a REIT for federal income tax purposes, Host Inc.’s charter prohibits ownership, directly or by attribution, by any person or persons acting as a group, of more than 9.8% in value or number, whichever is more restrictive, of shares of Host Inc.’s outstanding common stock, preferred stock or any other class or series of stock, each considered as a separate class or series for this purpose. Together, these limitations are referred to as the “ownership limit.” Stock acquired or held in violation of the ownership limit will be transferred automatically to a trust for the benefit of a designated charitable beneficiary, and the intended acquirer of the stock in violation of the ownership limit will not be entitled to vote those shares of stock or to receive the economic benefits of owning shares of Host Inc.’s stock in excess of the ownership limit. A transfer of shares of Host Inc.’s stock to a person who, as a result of the transfer, violates the ownership limit also may be void under certain circumstances.
•Removal of members of the Board of Directors. Host Inc.’s charter provides that, except for any directors who may be elected by holders of a class or series of capital stock other than common stock, directors may be removed only for cause and only by the affirmative vote of stockholders holding at least two-thirds of all the votes entitled to be cast for the election of directors. Any vacancy resulting from the removal of a director by the stockholders may be filled by the affirmative vote of holders of at least two-thirds of the votes entitled to be cast for the election of directors.
•Preferred shares; classification or reclassification of unissued shares of capital stock without stockholder approval. Host Inc.’s Board of Directors has the authority, without a vote of stockholders, to classify or reclassify any unissued shares of stock into other classes or series of stock, and to establish the terms, preferences, conversion or other rights, voting powers, restrictions, limitations as to dividends and other distributions, qualifications and terms or conditions of redemption for each class or series. Host Inc.’s Board of Directors may give the holders of any class or series of stock terms, preferences, powers and rights, including voting rights, senior to the rights of holders of existing stock.
•Certain provisions of the MGCL may have the effect of inhibiting a third party from acquiring Host Inc., including:
◦“business combination” provisions that, subject to limitations, prohibit certain business combinations between a corporation and an “interested stockholder” (defined generally as any person who beneficially owns 10% or more of the voting power of the corporation’s then outstanding shares of voting stock) or an affiliate of any interested stockholder for five years after the most recent date on which the stockholder becomes an interested stockholder, and thereafter imposes two super-majority stockholder voting requirements on these combinations; and
◦“control share” provisions providing that holders of “control shares” of a corporation (defined as voting shares of stock that, if aggregated with all other shares of stock owned or controlled by the acquirer, would entitle the acquirer to exercise one of three increasing ranges of voting power in electing directors) acquired in a “control share acquisition” have no voting rights except to the extent approved by the stockholders by the affirmative vote of at least two-thirds of all of the votes entitled to be cast on the matter, excluding all interested shares.
Host Inc. is subject to the Maryland business combination statute. Our bylaws contain a provision exempting us from the control share provisions of the MGCL. There can be no assurance that this bylaw provision exempting us from the control share provisions will not be amended or eliminated at any time in the future.
•Certain charter amendments. Host Inc.’s charter contains provisions relating to restrictions on transfer and ownership of Host Inc.’s stock, fixing the size of the Board of Directors within the range set forth in the charter, removal of directors, the filling of vacancies, exculpation and indemnification of directors, calling special stockholder meetings and certain other provisions, all of which may be amended only by a resolution adopted by the Board of Directors and approved by Host Inc.’s stockholders holding two-thirds of the votes entitled to be cast on the matter. These provisions may make it more difficult to amend Host Inc.’s charter to alter the provisions described herein that could delay, defer or prevent a transaction or a change in control or the acquisition of Host Inc. common stock, without the approval of the Board of Directors.
Federal Income Tax Risks
Adverse tax consequences would occur if Host Inc. or its subsidiary REIT fails to qualify as a REIT.
We believe that each of Host Inc. and its subsidiary REIT has been organized and has operated in such a manner as to qualify as a REIT under the Code, commencing with its taxable year beginning January 1, 1999, and April 11, 2006, respectively, and both currently intend to continue to operate and qualify as a REIT during future years. As the requirements for qualification and taxation as a REIT are extremely complex and interpretations of the federal income tax laws governing qualification and taxation as a REIT are limited, no assurance can be provided that Host Inc. currently qualifies as a REIT or will continue to qualify as a REIT or that Host Inc.’s subsidiary REIT qualifies as a REIT or will continue to qualify as a REIT. If our subsidiary REIT were to fail to qualify as a REIT, it is possible that Host Inc. would fail to qualify as a REIT unless it (or the subsidiary REIT) could avail itself of certain relief provisions. If Host Inc. or its subsidiary REIT were to fail to qualify as a REIT, and any available relief provisions do not apply, the non-qualifying REIT would not be allowed to take a deduction for dividends paid to its stockholders in computing its taxable income, and it would be subject to federal and state corporate income tax on its taxable income. Any such corporate income tax liability could be substantial and would reduce the non-qualifying REIT’s cash available for, among other things, operations and dividends to its stockholders. In addition, if Host Inc. were to fail to qualify as a REIT, it would not be required to pay dividends to its stockholders. Moreover, unless entitled to statutory relief, the non-qualifying REIT could not qualify as a REIT for the four taxable years following the year during which REIT qualification was lost.
To qualify as a REIT, each of Host Inc. and our subsidiary REIT is required to satisfy the requirements of several asset and gross income tests. Our ability to satisfy the asset tests depends upon our analysis of the characterization and fair market values of our assets, some of which are not susceptible to a precise determination of fair market value, and for which we will not obtain independent appraisals. Our compliance with the REIT asset and gross income tests requirements also depends upon our ability to successfully manage the composition of our gross income and assets on an ongoing basis. Accordingly, there can be no assurance that the U.S. Internal Revenue Service (the “IRS”) will not contend that our hotel leases, interests in subsidiaries, or interests in the securities of other issuers will not cause a violation of the REIT gross income and asset tests requirements.
Any determination that Host Inc. or its subsidiary REIT does not qualify as a REIT will have a material adverse effect on our results of operations and could reduce materially the value of Host Inc.’s common stock. The additional corporate income tax liability of Host Inc. or the subsidiary REIT for the year, or years, in which it does not qualify as a REIT would reduce its cash flow available for investment, debt service or dividends to its stockholders. Furthermore, the entity not qualifying as a REIT no longer would be required to pay dividends to its stockholders as a condition to REIT qualification, and any dividends paid to stockholders would be taxable as C corporation dividends to the extent of its current and accumulated earnings and profits. This means that, if Host Inc. were to fail to qualify as a REIT, Host Inc.’s stockholders currently taxed as individuals would be taxed on dividends at capital gain tax rates and Host Inc.’s corporate stockholders generally would be entitled to the dividends received deduction with respect to such dividends, subject in each case to applicable limitations under the Code. Host Inc.’s failure to qualify as a REIT also would cause an event of default under Host L.P.’s credit facility, which default could lead to an acceleration of the amounts due thereunder, which, in turn, would constitute an event of default under Host L.P.’s outstanding debt securities.
If our hotel managers do not qualify as “eligible independent contractors,” or if our hotels are not “qualified lodging facilities,” each of Host Inc. and our subsidiary REIT will fail to qualify as a REIT.
Each hotel with respect to which our TRS pays rent must be a “qualified lodging facility.” A “qualified lodging facility” is a hotel, motel, or other establishment more than one-half of the dwelling units in which are used on a transient basis, including customary amenities and facilities, provided that no wagering activities are conducted at or in connection with such facility by any person who is engaged in the business of accepting wagers and who legally is authorized to engage in such business at or in connection with such facility. We believe that all the hotels leased to our TRS are qualified lodging facilities. However, the REIT provisions of the Code provide only limited guidance for making determinations of whether a leased hotel is considered a qualified lodging facility, and there can be no assurance that our leased hotels will be so considered in all cases.
If our hotel managers do not qualify as “eligible independent contractors,” Host Inc. and our subsidiary REIT likely will fail to qualify as a REIT for federal income tax purposes. Each of the hotel management companies that enters into a management contract with our TRS must qualify as an “eligible independent contractor” under the REIT rules in order for the rent paid to Host Inc. and its subsidiary REIT by our TRS to be qualifying gross income for the REIT gross
income tests requirements. Among other requirements, in order to qualify as an eligible independent contractor, a hotel manager cannot own more than 35% of our outstanding shares (by value) and no person or group of persons can own more than 35% of our outstanding shares and the ownership interests of the hotel manager, taking into account only owners of more than 5% of our shares and, with respect to ownership interests in such hotel managers that are publicly traded, only owners of more than 5% of such ownership interests. Complex ownership attribution rules apply for purposes of these 35% ownership thresholds. Although we monitor ownership of our shares by our hotel managers and their owners, and certain provisions of our charter are designed to prevent ownership of our shares in violation of these rules, there can be no assurance that these ownership limits will not be exceeded.
The size of our TRS is limited, and our transactions with our TRS will cause us to be subject to a 100% excise tax on certain income or deductions if such transactions are not conducted on arm’s-length terms.
A REIT may own up to 100% of the equity interests of an entity that is a regular C corporation for federal income tax purposes if the entity is a TRS. A TRS may own assets and earn gross income that would not be considered as qualifying assets or as qualifying gross income if owned or earned directly by a REIT, including revenues from hotel operations. Both the REIT and its C corporation subsidiary must jointly elect to treat such C corporation subsidiary as a TRS. A C corporation of which a TRS directly or indirectly owns more than 35% of the voting power or value of its stock or securities automatically will be treated as a TRS. No more than 20% of the total value of a REIT’s assets may consist of stock or securities of one or more TRS.
Our TRS will pay federal corporate income tax and applicable state and local corporate income tax and, if applicable, foreign corporate income tax on its taxable income. The after-tax net income of our TRS will be available for distribution to us as a taxable dividend to the extent of its current and accumulated earnings and profits, but it is not required to be so distributed. We believe that the aggregate value of the stock and securities of our TRS has been and will continue to be less than 20% of the total value of our assets (including our TRS stock and securities). Furthermore, we monitor the value of our investments in our TRS for the purpose of ensuring compliance with this 20% requirement. There can be no assurance, however, that we will be able to comply with the 20% value limitation discussed above.
Rent paid to Host Inc. and its subsidiary REIT by our TRS cannot be based on its net income or profits for such rents to qualify as “rents from real property.” We receive “percentage rent” from our TRS that is calculated based on the gross revenues of the hotels subject to leases - not based on net income or profits of such hotels. If the IRS determines that the rent paid pursuant to our leases with our TRS are excessive, the deductibility thereof by the TRS may be challenged, and we could be subject to a 100% excise tax on “re-determined rent” or “re-determined deductions” to the extent that such rent exceeds an arm’s-length amount. We believe that our rent and other transactions between our REITs and their TRS are based on arm’s-length amounts and reflect normal business practices, but there can be no assurance that the IRS will agree with our belief.
Despite the REIT status of each of Host Inc. and its subsidiary REIT, we remain subject to various taxes.
Notwithstanding Host Inc.’s status as a REIT, Host Inc. and certain of its subsidiaries (including our subsidiary REIT) are subject to federal, state, local and foreign corporate taxes on their net income, gross receipts, net worth, and property, in certain cases. Host L.P. is obligated under its partnership agreement to pay all such taxes (and any related interest and penalties) incurred by Host Inc.
Legislative or other actions affecting REITs could have a negative effect on us.
New legislation, treasury regulations, administrative interpretations or court decisions could change significantly the tax laws with respect to an entity’s qualification as a REIT or the federal income tax consequences of its REIT qualification.
Risks Relating to Redemption of OP Units
A holder who offers its OP units for redemption may have adverse tax consequences.
A limited partner who elects to redeem its OP units will be treated for federal and state income tax purposes as having sold the OP units, resulting in a taxable event to such limited partner. The gain or loss recognized by the limited partner is measured by the difference between the amount realized and the tax basis of the OP units redeemed (which tax basis includes the amount of the qualified nonrecourse liabilities of Host L.P. allocated to the redeemed OP units). It is
possible that the amount of gain and/or the tax liability related thereto that the limited partner recognizes and pays could exceed the value of the common stock or cash received from the redemption of its OP units.
General Risk Factors
Shares of Host Inc.’s common stock that are or become available for sale could affect the share price of Host Inc.’s common stock.
We have in the past issued and may in the future issue additional shares of common stock to raise the capital necessary to finance hotel acquisitions, fund capital expenditures, refinance debt or for other corporate purposes. Sales of a substantial number of shares of Host Inc.’s common stock, or the perception that sales could occur, could affect adversely prevailing market prices for Host Inc.’s common stock. In addition, limited partners of Host L.P. who redeem their OP units and receive, at Host Inc.’s election, shares of Host Inc. common stock will be able to sell those shares freely. As of December 31, 2024, there are approximately 9.2 million Host L.P. OP units outstanding that are owned by third parties and that are redeemable, which represents approximately 1% of all outstanding OP units. Further, shares of Host Inc.’s common stock have been and will be issued or reserved for issuance from time to time under our employee benefit plans. We currently maintain two stock-based compensation plans: (i) the comprehensive stock and cash incentive plan, and (ii) an employee stock purchase plan. At December 31, 2024, there were approximately 22 million shares of Host Inc.’s common stock reserved and available for issuance under the comprehensive stock plan and employee stock purchase plan.
An increase in interest rates would increase the interest costs on our credit facility and on our floating rate indebtedness and could impact adversely our ability to refinance existing indebtedness or to sell assets.
Interest payments for borrowings on our credit facility and the mortgages on certain properties are based on floating rates. As a result, an increase in interest rates will reduce our cash flow available for other corporate purposes, including investments in our portfolio. As of December 31, 2024, approximately 20% of our debt is subject to floating interest rates. Elevated interest rates also could limit our ability to refinance existing indebtedness when it matures and increase interest costs on any indebtedness that is refinanced. We may from time to time enter into agreements such as floating-to-fixed interest rate swaps, caps, floors and other hedging contracts in order to fully or partially hedge against the cash flow effects of changes in interest rates for floating rate debt. These agreements expose us to the risk that other parties to the agreements will not perform or that the agreements will be unenforceable. In addition, an increase in interest rates could decrease the amount third parties are willing to pay for our hotels, thereby limiting our ability to dispose of them as part of our business strategy.
Compliance with the Americans with Disabilities Act and other government regulations can be costly.
Our hotels are subject to various forms of regulation, including Title III of the Americans with Disabilities Act (“ADA”), building codes and regulations pertaining to fire and life safety. Under the ADA, all public accommodations are required to meet certain federal rules related to access and use by disabled persons and we incur capital expenditures to make our hotels accessible. In addition, we have committed to provide, and certain local laws and contracts between our hotel managers and hotel workers’ unions require our hotels to provide, our managers’ employees with safety devices, sometimes known as “panic buttons.” We fund the capital necessary to ensure that employees at our hotels will be equipped with these safety devices. These and other laws and regulations may be changed from time-to-time, or new regulations adopted, resulting in additional costs of compliance, including potential litigation. A determination that we are not in compliance with these laws and regulations could result in a court order to bring the hotel into compliance, imposition of civil penalties in cases brought by the Justice Department, or an award of attorneys’ fees to private litigants. Compliance with these laws and regulations could require substantial capital expenditures. Any increased costs could have a material adverse effect on our business, financial condition or results of operations. In addition, the operations of our foreign hotels are subject to a variety of United States and international laws and regulations, including the United States Foreign Corrupt Practices Act and other anti-corruption laws, but we cannot assure that we will continue to be found to be operating in compliance with, or be able to detect violations of, any such laws or regulations.
Litigation judgments or settlements could have a significant adverse effect on our financial condition.
We are involved in various legal proceedings in the ordinary course of business and are defending these claims vigorously; however, no assurances can be given as to the outcome of any pending legal proceedings. We believe, based on currently available information, that the results of current proceedings, in the aggregate, will not have a material adverse effect on our financial condition, but might be material to our operating results for any period, depending, in part, upon the
quantum of our operating results for such period. We also could become the subject of future claims by the operators of our hotels, individuals or companies who use our hotels, our investors, our joint venture partners or regulating entities and these claims could have a significant adverse effect on our financial condition and results of operations.
Environmental liabilities are possible and can be costly.
Our hotels are subject to requirements and potential liabilities under various foreign and U.S. federal, state and local environmental laws, ordinances and regulations. Unidentified environmental liabilities could arise and have a material adverse effect on our financial condition and performance. Additionally, even after we have sold a hotel, we may be liable for environmental liabilities attributable to events that occurred during our ownership. Federal, state and local laws and regulations relating to the protection of the environment may require a current or previous owner or operator of real estate to investigate and remediate hazardous or toxic substances or petroleum product releases at the property. The owner or operator may be required to pay a governmental entity or third parties for property damage, and for investigation and remediation costs incurred by the parties in connection with the contamination. These laws typically impose clean-up responsibility and liability without regard to whether the owner or operator knew of or caused the presence of the contaminants. Even if more than one person may have been responsible for the contamination, each person covered by the environmental laws may be held responsible for all the clean-up costs incurred. In addition, third parties may sue the owner or operator of a site for damages and costs resulting from environmental contamination emanating from that site. Environmental laws also govern the presence, maintenance and removal of toxic or hazardous substances. These laws require that owners or operators of buildings properly manage and maintain these substances and notify and train those who may come into contact with them and undertake special precautions. These laws may impose fines and penalties on building owners or operators who fail to comply with these requirements and may allow third parties to seek recovery from owners or operators for personal injury associated with exposure to toxic or hazardous materials.
An increased focus on metrics and reporting related to corporate responsibility, specifically related to environmental, social and governance ("ESG") factors, may impose additional costs and expose us to new risks.
ESG evaluations, including ESG scores and ratings, are important to some investors and other stakeholders and may impact the price of our securities and business practices. Investors may focus on, and consider a company's ESG-related business practices, scores and reporting when choosing to allocate their capital in making investment decisions, including if they invest in our securities. Investors, customers, business partners and other stakeholders, as well as regulators and other groups, are increasingly focusing on ESG and sustainability commitments and performance. Further, the criteria used in these ratings systems change frequently, and we cannot guarantee that we will be able to score well as criteria change. Failure to participate in certain of the third-party ratings systems, failure to score well in those ratings systems or failure to provide certain ESG disclosures could result in reputational harm when investors or others compare us against similar companies in our industry and could cause certain investors to be unwilling to invest in our stock, which could adversely impact our ability to raise capital. At the same time, some stakeholders and regulators have expressed or pursued contrary views, legislation, and investment expectations with respect to ESG ratings and commitments, including the enactment or proposal of "anti-ESG" legislation or policies, which may expose us to additional legal or reputational risks based upon our ESG commitments and disclosures.
In addition, the adoption of increased government regulations, changes in Federal, state and local legislation and regulations and changes in investor preference related to ESG and similar matters may result in changes to our business practices, including increasing expenses or capital expenditures. Other impacts related to ESG matters may include the costs of compliance with new or existing regulations, standards or reporting requirements regarding the environmental impacts of our business, such as the SEC's proposed climate change disclosure rule.
Item 1B. Unresolved Staff Comments
We have received no written comments regarding our periodic or current reports from the staff of the Securities and Exchange Commission that remain unresolved.
Item 1C. Cybersecurity
Risk Management and Strategy
We have developed and implemented a cybersecurity risk management program intended to protect the confidentiality, integrity and availability of our critical systems and information. We design and assess our program using
components of the National Institute of Standards and Technology Cybersecurity Framework ("NIST CSF"). This does not imply that we meet any particular technical standards, specifications, or requirements, but rather that we use the NIST CSF as a guide to help us identify, assess, and manage cybersecurity risks relevant to our business.
Our cybersecurity risk management program is integrated into our overall enterprise risk management program and shares common methodologies, reporting channels and governance processes that apply across the enterprise risk management program to other legal, compliance, strategic, operational, and financial risk areas. Our cybersecurity risk management program is led by our senior vice president of information technology who has over 25 years of information technology experience that includes application development, information technology infrastructure, security, business continuity, and engineering. He holds a master's degree in computer science and a bachelor of engineering in electrical engineering. Our vice president of cybersecurity reports to the senior vice president of information technology and has over 25 years of operations and security experience backed by an undergraduate degree in computer management and various technology and security certifications. Our vice president of cybersecurity is responsible for the day-to-day assessment and management of cybersecurity risk. Our cybersecurity risk management program includes the following key components, which allows the management team to stay informed about and monitor the prevention, detection, mitigation and remediation of key cybersecurity risks and incidents:
•implementing technologies to proactively monitor vulnerabilities and reduce risk, maintaining security policies and standards, and regularly updating our response planning and protocols;
•maintaining business continuity, contingency and recovery plans, including a cybersecurity incident response plan that includes procedures for responding to cybersecurity incidents;
•retaining a third-party cybersecurity provider for emergency incident response services;
•annual assessments of our cybersecurity risk management program by a third-party security firm, as well as semi-annual vulnerability assessments and penetration testing by external service providers;
•cybersecurity awareness training for employees as well as senior management, including quarterly refresher training; and
•annual cybersecurity assessments of certain third-party service providers with access to our employee data.
Our cybersecurity risk management program and processes, as described in this section, do not encompass the information technology systems of our third-party managers. As a REIT, we are required to retain third-party managers to run all operational aspects of our hotels, and our hotel managers are dependent on information technology networks and systems that they procure and manage directly or through their own third-party service providers, to access, process, transmit and store proprietary and hotel customer information. We do not have access to these systems or to hotel customer information, and we rely on the security programs, processes and systems of our managers to protect hotel operations and customer information from cybersecurity threats.
As of February 21, 2025, we have not identified risks from known cybersecurity threats, including as a result of any prior cybersecurity incidents, that have materially affected or are reasonably likely to materially affect us, including our operations, business strategy, results of operations, or financial condition. While we have not been materially affected by known cybersecurity threats affecting the Company, we and our hotel managers continue to face risks from cybersecurity threats that, if realized, could materially adversely affect us in the future. For more information on the risks related to cybersecurity threats, including threats faced by our hotel managers, see Part I, Item 1A. "Risk Factors — We face the risk of material data breaches and disruptions of our managers’ or our own information technology systems, or the information technology systems of third parties on which we or our managers rely, which could materially adversely affect our business and results.” Governance
Our Board considers cybersecurity risk as part of its risk oversight function and has delegated to the Audit Committee oversight of cybersecurity and other information technology risks. The Audit Committee oversees management's implementation of our cybersecurity risk management program. The Audit Committee receives semi-annual updates on topics related to information security and cyber risks and readiness from our management team, including our senior vice president of information technology. Management updates the Audit Committee, as necessary, regarding any
significant cybersecurity incidents. The Audit Committee reports to the full Board regarding its activities, including information security and cybersecurity risks, which are presented to the full Board at least annually as part of the Board's oversight of enterprise risk management.
Item 2. Properties
See Part I, Item 1. “Business—Our Consolidated Hotel Portfolio” above for a discussion of our hotels. Item 3. Legal Proceedings
We are involved in various legal proceedings in the ordinary course of business, including, but not limited to, disputes involving hotel-level contracts, employment litigation, compliance with laws, such as the Americans with Disabilities Act, tax disputes and other general matters. We or our operators are defending these claims vigorously; however, no assurances can be given as to the outcome of any pending legal proceedings. We believe, based on currently available information, that the results of such proceedings, in the aggregate, will not have a material adverse effect on our financial condition, but might be material to our operating results for any period, depending, in part, upon the operating results for such period. We record a liability when a loss is considered probable and the amount can be reasonably estimated. For more information, see Note 17 in Item 8. – Financial Statements and Supplementary Data. Item 4. Mine Safety Disclosures
None.
INFORMATION ABOUT OUR EXECUTIVE OFFICERS
In the following table, we set forth certain information regarding those persons currently serving as executive officers of Host Inc. as of February 21, 2025. As a partnership, Host L.P. does not have executive officers.
| | | | | | | | | | | | | | |
| Name and Title | | Age | | Business Experience Prior to Becoming an
Executive Officer of Host Inc. |
Richard E. Marriott Chairman of the Board | | 86 | | Richard E. Marriott joined our company in 1965 and has served in various executive capacities. In 1979, Mr. Marriott was elected to the board of directors. In 1984, he was elected executive vice president, and in 1986, he was elected vice chairman of the board of directors. In 1993, Mr. Marriott was elected chairman of the board. |
James F. Risoleo President, Chief Executive Officer and Director | | 69 | | James F. Risoleo joined our company in 1996 as senior vice president for acquisitions. He has served in various capacities with the company, including executive vice president and chief investment officer, managing director of the company's European and west coast investment activities, and culminating in his service as president and chief executive officer beginning in January 2017. |
Sourav Ghosh Executive Vice President and Chief Financial Officer | | 48 | | Sourav Ghosh joined our company in 2009 as vice president of business intelligence & portfolio strategy. In 2017, he became the head of strategy & analytics and in 2020 he became chief financial officer. |
Julie P. Aslaksen Executive Vice President, General Counsel and Secretary | | 50 | | Julie P. Aslaksen joined our company in November 2019 as executive vice president, general counsel and secretary. Prior to joining our company, Ms. Aslaksen served as vice president and general counsel at General Dynamics Information Technology ("GDIT") from 2017 to 2019. Prior to her role at GDIT, Ms. Aslaksen spent 14 years with General Dynamics Corporation, where she most recently served as staff vice president, deputy general counsel and assistant secretary. |
Michael E. Lentz Executive Vice President Development, Design & Construction | | 61 | | Michael E. Lentz joined our company in March 2016 as managing director, global development, design and construction. In February 2019, he was promoted to executive vice president, development, design and construction. Prior to joining us, Mr. Lentz was senior vice president of global development for Las Vegas Sands Corp. from 2011 to 2016 and before that was with Walt Disney Imagineering for 20 years, culminating in his service as vice president of project development. |
Joseph C. Ottinger Senior Vice President, Corporate Controller | | 48 | | Joseph C. Ottinger joined our company in August 1999, where he has held a series of financial reporting positions with increasing responsibilities. In 2012, he was promoted to vice president, financial reporting and became assistant controller in 2017. On January 1, 2021, Mr. Ottinger began serving as senior vice president, corporate controller. |
Mari Sifo Executive Vice President, Chief Human Resources Officer | | 43 | | Mari Sifo joined our company as executive vice president, chief human resources officer in November 2022. Prior to joining our company, she was the chief human resources and communications officer for SWM International from 2018 to 2022; senior director, human resources at CP Kelco from 2015 to 2018; and human resources, director at Mondelez International from 2014 to 2015. |
Nathan S. Tyrrell Executive Vice President, Chief Investment Officer | | 52 | | Nathan S. Tyrrell joined our finance department in 2005. He became treasurer in February 2010. In 2015, he was named managing director of investment activities for the east coast, and in 2017 he was named executive vice president, chief investment officer. |
PART II
Item 5. Market for Registrant’s Common Stock, Related Stockholder Matters and Issuer Purchases of Equity Securities for Host Inc.
Host Inc.’s common stock is listed on the Nasdaq Stock Market and trades under the symbol “HST.”
As of February 21, 2025, there were 14,537 holders of record of Host Inc.’s common stock. However, because many of the shares of our common stock are held by brokers and other institutions on behalf of stockholders, we believe that there are considerably more beneficial owners of our common stock than record holders. As of February 21, 2025, there were 996 limited partners of Host L.P. (in addition to Host Inc.). OP units are redeemable for cash, or, at our election, for Host Inc. common stock.
Stockholder Return Performance
The following graph compares the five-year cumulative total stockholder return on the common stock of Host Inc. against the cumulative total returns of the Standard & Poor’s Corporation Composite 500 Index and the National Association of Real Estate Investment Trust (“NAREIT”) Lodging Index. The graph assumes an initial investment of $100 in the common stock of Host Inc. and in each of the indices, and also assumes the reinvestment of dividends.
Comparison of Five-Year Cumulative Stockholder Returns 2019 – 2024
| | | | | | | | | | | | | | | | | | | | | | | | | | | | | | | | | | | |
| 2019 | | 2020 | | 2021 | | 2022 | | 2023 | | 2024 |
| Host Hotels & Resorts, Inc. | $ | 100.00 | | | $ | 80.25 | | | $ | 95.39 | | | $ | 90.99 | | | $ | 116.04 | | | $ | 109.66 | |
| NAREIT Lodging Index | $ | 100.00 | | | $ | 76.40 | | | $ | 90.32 | | | $ | 76.50 | | | $ | 94.80 | | | $ | 92.90 | |
| S&P 500 Index | $ | 100.00 | | | $ | 118.40 | | | $ | 152.39 | | | $ | 124.79 | | | $ | 157.59 | | | $ | 197.02 | |
This performance graph shall not be deemed “filed” for purposes of Section 18 of the Securities Exchange Act of 1934, as amended, or incorporated by reference into any filing of Host Inc. or Host L.P. (or any of their respective subsidiaries) under the Securities Act of 1933, as amended, except as shall be expressly set forth by specific reference in such filing.
Fourth Quarter 2024 Host Inc. Purchases of Equity Securities
On August 3, 2022, the Board of Directors authorized a $1 billion share repurchase program. The common stock may be purchased from time to time depending upon market conditions, and repurchases may be made in the open market
or through private transactions or by other means, including principal transactions with various financial institutions, accelerated share repurchases, forwards, options and similar transactions, and through one or more trading plans designed to comply with Rule 10b5-1 under the Securities Act of 1934, as amended. The program does not obligate us to repurchase any specific number of shares or any specific dollar amount and may be suspended at any time at our discretion, see “Management’s Discussion and Analysis of Financial Condition and Results of Operations – Financial Condition.”
| | | | | | | | | | | | | | | | | | | | | | | | | | |
| Period | | Total Number of Host Inc. Common
Shares Purchased | | Average Price Paid
per Common Share | | Total Number of Common Shares Purchased as Part of Publicly
Announced Plans or Programs | | Approximate Dollar Value of Common Shares that May Yet Be Purchased
Under the Plans or Programs (in millions) |
| October 1, 2024 - October 31, 2024 | | — | | $ | — | | | — | | $ | 685 | |
| November 1, 2024 - November 30, 2024 | | — | | — | | | — | | 685 | |
| December 1, 2024 - December 31, 2024 | | — | | — | | | — | | 685 | |
| Total | | — | | $ | — | | | — | | $ | 685 | |
Item 5. Market for Registrant’s Common OP Units, Related Unitholder Matters and Issuer Purchases of Equity Securities for Host L.P.
There is no established public trading market for our common OP units and transfers of common OP units are restricted by the terms of Host L.P.’s partnership agreement. The number of holders of record of Host L.P.’s common OP units on February 21, 2025 was 996. The number of outstanding common OP units as of February 21, 2025 was 693,582,918, of which 684,404,669 were owned by Host Inc.
Fourth Quarter 2024 Host L.P. Purchases of Equity Securities
| | | | | | | | | | | | | | | | | | | | | | | | | | |
| Period | | Total Number of Host L.P. Common OP Units Purchased | | Average Price Paid per Common OP Unit | | Total Number of OP Units Purchased as Part of Publicly Announced Plans or Programs | | Approximate Dollar Value of OP Units that May Yet Be Purchased Under the Plans or Programs (in millions) |
| October 1, 2024 - October 31, 2024 | | 8,991 | * | 1.021494 shares of Host Hotels & Resorts, Inc. common stock | | — | | — | |
| November 1, 2024 - November 30, 2024 | | 50,960 | * | 1.021494 shares of Host Hotels & Resorts, Inc. common stock | | — | | — | |
| December 1, 2024 - December 31, 2024 | | 10,460 | * | 1.021494 shares of Host Hotels & Resorts, Inc. common stock | | — | | — | |
| Total | | 70,411 | | | | — | | — | |
___________*Reflects common OP units offered for redemption by limited partners in exchange for shares of Host Inc.’s common stock.
Item 6. Reserved
Item 7. Management’s Discussion and Analysis of Financial Condition and Results of Operations
The following discussion should be read in conjunction with the consolidated financial statements and related notes included elsewhere in this report. This discussion focuses on our financial condition and results of operations for the year ended December 31, 2024 as compared to the year ended December 31, 2023. For a discussion and analysis of the year ended December 31, 2023 compared to the same period in 2022, please refer to Management’s Discussion and Analysis of Financial Condition and Results of Operations included in Part II Item 7 of our Annual Report on Form 10‑K for the year ended December 31, 2023, filed with the SEC on February 28, 2024.
Overview
Host Inc. operates as a self-managed and self-administered REIT that owns hotels and conducts operations through Host L.P., of which Host Inc. is the sole general partner and of which it holds approximately 99% of its common OP units as of December 31, 2024. The remainder of Host L.P.’s common OP units are owned by various unaffiliated limited partners. Host Inc. has the exclusive and complete responsibility for Host L.P.’s day-to-day management and control.
Host Inc. is the largest lodging REIT in NAREIT’s composite index and one of the largest owners of luxury and upper upscale hotels. As of February 21, 2025, we own 81 hotels in the United States, Canada and Brazil and have minority ownership interests in an additional 40 hotels through joint ventures in the United States and in India. These hotels are operated primarily under brand names that are among the most respected and widely recognized in the lodging industry. Most of our hotels are located in central business districts of major cities, near airports and in resort/conference destinations.
Our customers fall into three broad groups: transient business, group business and contract business, which accounted for approximately 60%, 36%, and 4%, respectively, of our 2024 room sales. For a discussion of our customer categories, see “Item 1 Business – Our Customers”.
Understanding Our Performance
Our Revenues and Expenses. Our hotels are operated by third-party managers under long-term agreements, pursuant to which they typically earn base and incentive management fees based on the levels of revenues and profitability of each hotel. We provide operating funds, or working capital, which the managers use to purchase inventory and to pay wages, utilities, property taxes and other hotel-level expenses. We generally receive a cash distribution from our hotel managers each month, which distribution reflects hotel-level sales less property-level operating expenses (excluding depreciation).
Operations from our domestic portfolio account for approximately 98% of our total revenues and 2% relate to our five hotels in Canada and Brazil. The following table presents the components of our hotel revenues as a percentage of our total revenue:
| | | | | |
| % of 2024 Revenues |
•Rooms revenues. Occupancy and average daily room rate are the major drivers of rooms revenues. The business mix of the hotel (group versus transient and retail versus discount business) is a significant driver of room rates. | 60 | % |
•Food and beverage revenues. Food & beverage revenues consist of revenues from group functions, which may include banquet revenues and audio and visual revenues, as well as outlet revenues from the restaurants and lounges at our hotels. | 30 | % |
•Other revenues. Occupancy, the nature of the hotel (e.g., resort) and its price point are the main drivers of other ancillary revenues, such as attrition and cancelation fees, resort and destination fees, parking, golf courses, spas, entertainment and other guest services. This category also includes other rental revenues. | 10 | % |
Hotel operating expenses represent approximately 99.7% of our total operating costs and expenses. The following table presents the components of our hotel operating expenses as a percentage of our total operating costs and expenses:
| | | | | |
| % of 2024 Operating Costs and Expenses |
•Rooms expenses. These costs include housekeeping, reservation systems, room supplies, laundry services and front desk costs. Occupancy is the major driver of rooms expenses. These costs can increase based on increases in salaries and wages, as well as on the level of service and amenities that are provided. | 18 | % |
•Food and beverage expenses. These expenses primarily include food, beverage and the associated labor costs and will correlate closely with food and beverage revenues. Group functions with banquet sales and audio and visual components generally will have lower overall costs as a percentage of revenues than outlet sales. | 24 | % |
•Other departmental and support expenses. These expenses include labor and other costs associated with other ancillary revenues, such as parking, golf courses, spas, entertainment and other guest services, as well as labor and other costs associated with administrative departments, allocated brand costs, sales and marketing, repairs and minor maintenance and utility costs. | 29 | % |
•Management fees. Base management fees are computed as a percentage of gross revenues. Incentive management fees generally are paid when operating profits exceed certain thresholds. | 5 | % |
•Other property-level expenses. These expenses consist primarily of real and personal property taxes, ground rent, equipment rent and property insurance. Many of these expenses are relatively inflexible and do not necessarily change based on changes in revenues at our hotels. | 9 | % |
•Depreciation and amortization expense. This is a non-cash expense that changes primarily based on the acquisition and disposition of hotels and the amounts of historical capital expenditures. This component also can include impairment expense. | 15 | % |
The expense components listed above are based on those presented in our consolidated statements of operations. It also is worth noting that wage and benefit costs are spread among various line items. Taken separately, these costs represent approximately 57% of our rooms, food and beverage, and other departmental and support expenses.
Key Performance Indicators. The following key performance indicators commonly are used in the hospitality industry and we believe provide useful information to management and investors in order to compare our performance with the performance of other lodging REITs:
•hotel occupancy is a volume indicator based on the percentage of available room nights that are sold;
•average daily rate (“ADR”) is a price indicator calculated by dividing rooms revenues by the number of rooms sold;
•revenues per available room (“RevPAR”) is used to evaluate hotel operations. RevPAR is defined as the product of the average daily room rate charged and the average daily occupancy achieved. RevPAR does not include food and beverage, parking, or other guest service revenues generated by the hotel. Although RevPAR does not include these ancillary revenues, it is considered a key indicator of core revenues for many hotels; and
•total revenues per available room (“Total RevPAR”) is a summary measure of hotel results calculated by dividing the sum of rooms, food and beverage and other ancillary services revenues by room nights available to guests for the period. It includes ancillary revenues that are not included in the calculation of RevPAR.
RevPAR changes that are driven by occupancy have different implications on overall revenue levels, as well as incremental operating profit, than do changes that are driven by average room rate. For example, increases in occupancy at a hotel will lead to increases in rooms revenues and ancillary revenues, such as food and beverage revenues, as well as additional incremental costs (including housekeeping services, utilities and room amenity costs). RevPAR increases due to higher room rates, however, will not result in additional room-related costs, except those charged as a percentage of revenues. As a result, changes in RevPAR driven by increases or decreases in average room rates have a greater effect on profitability than do changes in RevPAR caused by occupancy levels.
We also evaluate the performance of our business through certain non-GAAP financial measures. Each of these non-GAAP financial measures should be considered by investors as supplemental measures to GAAP performance measures such as total revenues, operating profit, net income and earnings per share. We provide a more detailed discussion of these non-GAAP financial measures, how management uses such measures to evaluate our financial condition and operating performance and a discussion of certain limitations of such measures in “—Non-GAAP Financial Measures.” Our non-GAAP financial measures include:
•NAREIT Funds From Operations (“FFO”) and Adjusted FFO per diluted share. We use NAREIT FFO and Adjusted FFO per diluted share as supplemental measures of company-wide profitability. NAREIT adopted FFO to promote an industry-wide measure of REIT operating performance. We also adjust NAREIT FFO for gains and losses on extinguishment of debt, certain acquisition costs, litigation gains or losses outside the ordinary course of business and severance costs outside the ordinary course of business.
•Comparable hotel EBITDA. Hotel EBITDA measures property-level results before debt service, depreciation and corporate-level expenses (as this is a property level measure) and is a supplemental measure of aggregate property-level profitability. We use comparable hotel EBITDA and associated margins to evaluate the profitability of our comparable hotels.
•EBITDA, EBITDAre and Adjusted EBITDAre. Earnings before interest expense, income taxes, depreciation and amortization (“EBITDA”) is a supplemental measure of our operating performance and facilitates comparisons between us and other lodging REITs, hotel owners who are not REITs and other capital-intensive companies. NAREIT adopted EBITDA for real estate (“EBITDAre”) in order to promote an industry-wide measure of REIT operating performance. We also adjust EBITDAre for property insurance gains and property damage losses, certain acquisition costs, litigation gains or losses outside the ordinary course of business and severance costs outside the ordinary course of business (“Adjusted EBITDAre”).
Summary of 2024 Operating Results
The following table reflects certain line items from our audited consolidated statements of operations and the significant operating statistics for the two years ended December 31, 2024 (in millions, except per share and hotel statistics):
| | | | | | | | | | | | | | | | | |
| Historical Income Statement Data: | | | | | |
| 2024 | | 2023 | | Change |
| Total revenues | $ | 5,684 | | | $ | 5,311 | | | 7.0 | % |
| Net income | 707 | | | 752 | | | (6.0 | %) |
| Operating profit | 875 | | | 827 | | | 5.8 | % |
| Operating profit margin under GAAP | 15.4 | % | | 15.6 | % | | (20) | bps |
EBITDAre ⁽¹⁾ | $ | 1,726 | | | $ | 1,632 | | | 5.8 | % |
Adjusted EBITDAre ⁽¹⁾ | 1,656 | | | 1,629 | | | 1.7 | % |
| | | | | |
| Diluted earnings per common share | $ | 0.99 | | | $ | 1.04 | | | (4.8 | %) |
NAREIT FFO per diluted share ⁽¹⁾ | 1.97 | | | 1.92 | | | 2.6 | % |
Adjusted FFO per diluted share ⁽¹⁾ | 1.97 | | | 1.92 | | | 2.6 | % |
| | | | | | | | | | | | | | | | | |
| Comparable Hotel Data: | | | | | |
| 2024 Comparable Hotels ⁽¹⁾ |
| 2024 | | 2023 | | Change |
Comparable hotel revenues ⁽¹⁾ | $ | 5,546 | | | $ | 5,418 | | | 2.4 | % |
Comparable hotel EBITDA ⁽¹⁾ | 1,622 | | | 1,617 | | | 0.3 | % |
Comparable hotel EBITDA margin ⁽¹⁾ | 29.2 | % | | 29.8 | % | | (60) | bps |
Comparable hotel Total RevPAR ⁽¹⁾ | $ | 355.88 | | | $ | 348.70 | | | 2.1 | % |
Comparable hotel RevPAR ⁽¹⁾ | 216.06 | | | 214.15 | | | 0.9 | % |
___________
(1)EBITDAre, Adjusted EBITDAre, NAREIT FFO per diluted share and Adjusted FFO per diluted share and comparable hotel operating results (including hotel revenues and hotel EBITDA and margins) are non-GAAP financial measures within the meaning of the rules of the SEC. See “Non-GAAP Financial Measures” and “Comparable Hotel Operating Statistics and Results” for more information on these measures, including why we believe these supplemental measures are useful, reconciliations to the most directly comparable GAAP measure, and the limitations on the use of these supplemental measures. Additionally, comparable hotel results and statistics are based on 78 comparable hotels as of December 31, 2024 and include adjustments for non-comparable hotels, dispositions and acquisitions. See "Comparable Hotel RevPAR Overview" for results of the portfolio based on our ownership period, without these adjustments.
Revenues
Total revenues increased $373 million, or 7.0%, compared to 2023, benefiting from the 2024 acquisitions of the 1 Hotel Nashville and Embassy Suites by Hilton Nashville Downtown, 1 Hotel Central Park and The Ritz-Carlton O'ahu, Turtle Bay and also the results of The Ritz-Carlton, Naples, which was closed in the first half of 2023 as a result of Hurricane Ian. However, this was partially offset by the closure of The Don CeSar for the fourth quarter of 2024 following the impacts of Hurricanes Helene and Milton. In addition, continued growth in group business, building on its recovery in 2023, drove improvements in food and beverage revenues. Comparable hotel RevPAR increased 0.9%, compared to 2023, due to an increase in average room rates, as occupancy remained flat, reflecting continued strong group demand, tempered by continued imbalance in outbound travel from the U.S. compared to international inbound travel and the slow recovery in Maui following the August 2023 wildfires. In 2024, performance at our Maui hotels impacted comparable hotel RevPAR by approximately 160 basis points for the full year.
Comparable hotel Total RevPAR increased 2.1% for the year due primarily to improvements in food and beverage revenues driven by the strength in group business, as well as strong spa and other ancillary revenues. The growth was led by our Denver, Nashville and Northern Virginia markets with increases of 13.2%, 12.9% and 10.3%, respectively, compared to 2023, through a combination of rate and occupancy growth, driven by strong group demand. Our hotels in Jacksonville and New Orleans also outperformed our portfolio with comparable hotel Total RevPAR increases of 7.2% and 7.1%, respectively. These strong performances were offset by comparable hotel Total RevPAR declines at our Atlanta and San Francisco/San Jose markets of 9.4% and 5.3%, respectively. The declines were driven primarily by a decrease in business travel and short-term transient demand, with Atlanta also affected by disruption from renovations. In addition, comparable hotel Total RevPAR at our Maui market declined by 11.0% due to the continuing impacts of the August 2023 Maui wildfires (see “Statement of Operations Results and Trends”).
Operating Profit
As expected, we faced higher wages and inflationary pressures compared to 2023. This, coupled with Maui performance, led to an operating profit margin (calculated based on GAAP operating profit as a percentage of GAAP revenues) decline of 20 basis points to 15.4% in 2024, compared to 15.6% in 2023, despite an increase in net gains on insurance settlements. Operating profit margins under GAAP are also significantly affected by several items, including acquisitions, dispositions, depreciation expense and corporate expenses. Our comparable hotel EBITDA margins, which exclude these items, declined 60 basis points to 29.2% for the year, down from 29.8% in 2023 due to the trends discussed above.
Net Income, Adjusted EBITDAre and Adjusted FFO per Diluted Share
Net income for Host Inc. was $707 million, a decrease of $45 million, or 6.0%, from the prior year, reflecting the decrease in gains on asset sales of $71 million and an increase in interest expense of $24 million, partially offset by an increase in net gains on insurance settlements of $24 million. These results led to a 4.8% decrease in diluted earnings per common share for Host Inc. to $0.99. Adjusted EBITDAre, which excludes gain on sale of assets and interest expense, among other items, increased 1.7% to $1,656 million as a result of operations from our acquisitions and the resumption of
operations at The Ritz-Carlton, Naples, which was closed during the first half of 2023, despite a $43 million decrease in business interruption gains. Adjusted FFO per diluted share increased 2.6% to $1.97 in 2024, reflecting the increase in Adjusted EBITDAre as well as the impact of share repurchases in 2024 and 2023.
The trends and transactions described above for Host Inc. affected similarly the operating results for Host L.P., as the only significant difference between the Host Inc. and Host L.P. statements of operations relates to the treatment of income attributable to the unaffiliated limited partners of Host L.P.
2025 Outlook
Throughout 2024, group business at our properties continued to improve and group revenue on the books remains strong for 2025. Average rates remained elevated at our resorts compared to pre-pandemic levels, although they have moderated from post-pandemic highs. However, further growth has been hampered by the slow recovery from the wildfires in Maui, one of our largest markets by revenues, and the slower post-pandemic recovery of the San Francisco market. These trends are expected to continue into 2025.
On the macroeconomic front, the U.S. economy remained resilient during 2024 with real U.S. GDP growth of 2.8%, as unemployment remained at low levels and business investment grew at a robust 3.7%. U.S. lodging demand is correlated to changes in gross domestic product (GDP) and business investment, although the recovery of the industry post-pandemic has lagged that of the economy. Inflation moderated substantially during the year but remains a concern for 2025, with fewer rate cuts expected in the coming year. In addition, the new administration has brought heightened uncertainty due to anticipated changes to trade policy, tax policy and government spending. Other risks to economic growth remain, including geopolitical instability throughout the globe, high interest rates and volatile oil prices. As a result, leading indicators point toward slower economic growth in 2025. As of February 2025, Blue Chip Economic Indicators consensus projects real U.S. GDP growth of 2.2%, reflecting a deceleration from 2024. Business investment growth is also anticipated to slow over the coming year, averaging 2.3%, down from 3.7% in 2024.
Hotel supply growth is anticipated to remain below the historical average, although we expect to see above-average growth in a few markets where our hotels are located, such as Nashville and Austin. Supply chain challenges have resulted in project delays across the U.S., and a tight lending environment has created construction financing challenges for future projects. We anticipate that the construction pipeline will remain modest until macroeconomic uncertainty moderates and interest rates decline further.
Based on the trends noted, we expect comparable hotel RevPAR growth for the full year 2025 will be between 0.5% and 2.5%. In addition, we expect margins to decline in comparison to 2024, driven by higher wages and benefits, including increases driven by new union contracts in certain cities, as well as growth in insurance and real estate taxes.
As discussed above, the current outlook for the lodging industry remains uncertain, reflecting varying analyst assumptions surrounding the impact of higher interest rates, inflation, the recovery in Maui and escalating geopolitical conflicts. Therefore, there can be no assurances as to lodging demand performance for any number of reasons, including, but not limited to, the slow recovery in Maui or deteriorating macroeconomic conditions. For more information on the risks that can affect our future results, see Part I, Item 1A. “Risk Factors.” Strategic Initiatives
For 2025, we intend to continue our disciplined approach to capital allocation to strengthen our portfolio and to deliver stockholder value through multiple levers, which may include, over time, acquiring hotels or investing in our portfolio. We intend to take advantage of our strong capital position and overall scale to acquire upper-upscale and luxury properties, through single asset or portfolio acquisitions, that we believe have sustainable competitive advantages to drive long-term value to the extent favorable pricing opportunities arise. At the same time, we will opportunistically sell hotels when market conditions permit. We also continue to critically analyze our portfolio to seek to take advantage of the inherent value of our real estate for its highest and best use.
Acquisitions. During 2024, we completed the following acquisitions:
•the 215-room 1 Hotel Nashville and 506-room Embassy Suites by Hilton Nashville Downtown for $530 million;
•the 234-room 1 Hotel Central Park for $265 million; and
•the 450-room Turtle Bay Resort, including a 49-acre land parcel entitled for development, for a total purchase price of $680 million, which is net of $45 million in key money received from Marriott International as part of an agreement to transition management to Marriott and convert the property to The Ritz-Carlton brand. The property has been renamed The Ritz-Carlton O'ahu, Turtle Bay.
Capital Projects. We continue to pursue opportunities to enhance asset value through select capital improvements, including projects that are designed to increase the eco-efficiency of our hotels, incorporate elements of sustainable design and replace aging equipment and systems with more efficient technology. During 2024, we spent approximately $548 million on capital expenditures, of which $260 million represented return on investment (“ROI”) capital expenditures, $252 million represented renewal and replacement projects and $36 million was for hurricane restoration work. This included completing the final steps of our restoration efforts following Hurricane Ian of bringing the permanent central energy plant online at The Ritz-Carlton, Naples. For all properties impacted by Hurricane Ian, we estimate the total property reconstruction and remediation costs, including significant enhancements, was approximately $315 million, of which approximately 30% related to remediation costs. In 2024, we reached a final settlement with our insurance providers on covered costs related to damage and disruption caused by Hurricane Ian, which totaled $308 million. In total, $99 million of the insurance receipts were recognized as a gain on business interruption. Another major capital project completed during the year was the repositioning renovations at The Singer Oceanfront Resort, Curio Collection by Hilton, including rooms, public space, and food and beverage outlets.
In addition, hotels within certain regions are subject to environmental and weather-related events, including hurricanes, wildfires, floods, rising sea levels, mudslides, earthquakes, and other natural perils. To mitigate some of these physical risks, we execute capital expenditure projects, including replacements and restorations of exterior walls, doors and windows, roofs, grounds, relocated/elevated critical equipment and distributed energy systems to further increase the resilience of our hotels. A portion of our capital expenditures for 2024 include these types of projects, which we expect to continue in future years. While the number of projects and overall cost varies from year to year, on average approximately 6% our capital expenditures have related to these types of projects over the past six years. The enhanced resilience projects implemented during the reconstruction of The Ritz-Carlton, Naples were successful in minimizing damage to the resort during the two hurricanes that made landfall in 2024; however, no assurances can be made as to whether these enhanced resiliency projects will be successful in mitigating the damage from future environmental and weather-related events, especially as the frequency and severity of these events are expected to increase over time.
In collaboration with Hyatt, we initiated a transformational capital program in 2023 at six properties in our portfolio, the Grand Hyatt Atlanta in Buckhead, Grand Hyatt Washington, Manchester Grand Hyatt San Diego, Hyatt Regency Austin, Hyatt Regency Washington on Capitol Hill, and Hyatt Regency Reston. These investments are intended to position the targeted hotels to compete better in their respective markets while seeking to enhance long-term performance. During 2024, we spent approximately $155 million on this program, which is included in ROI capital projects. The total investment is expected to be approximately $550 million to $600 million, two-thirds of which we were planning to invest as part of our capital plan over the next few years. We expect to invest between $125 million and $200 million per year on this program. Hyatt has agreed to provide additional priority returns on the agreed upon investments and operating profit guarantees totaling $40 million to offset expected business disruptions. We received approximately $9 million of the operating profit guarantees in 2024 from Hyatt and expect to receive approximately $27 million in 2025.
For 2025, we expect total capital expenditures of $580 million to $670 million, consisting of ROI projects of approximately $270 million to $315 million, renewal and replacement expenditures of $240 million to $275 million, and $70 million to $80 million for the restoration work from the damage caused by Hurricanes Helene and Milton. The ROI projects include approximately $170 million to $180 million for the Hyatt transformational capital program.
Also in 2023, we announced and broke ground on a project to develop and sell 40 fee-simple condominiums on a five-acre development parcel to be Four Seasons-branded and managed residences at the Four Seasons Resort Orlando at Walt Disney World® Resort. Construction of the mid-rise building is expected to be completed in the fourth quarter of 2025 and the villas are expected to complete in the first half of 2026. In 2024, we spent $64 million in development costs for this project and began marketing the units, resulting in buyer commitments for nearly one-third of the units. For 2025, the development costs for this project are expected to be $75 million to $85 million.
Financing transactions. On April 1, 2024, we repaid $400 million of 3⅞% Series G senior notes at maturity.
On May 10, 2024, we issued $600 million of 5.700% Series K senior notes for proceeds of $584 million, net of original issue discount, underwriting fees and expenses. The net proceeds from this issuance were used to repay all
outstanding amounts then outstanding under the revolver portion of our credit facility. The Series K senior notes have been designated as green bonds, and an amount equal to the net proceeds was allocated to finance and/or refinance one or more eligible green projects.
On August 12, 2024, we issued $700 million of 5.500% Series L senior notes for proceeds of $683 million, net of
original issue discount, underwriting fees and expenses. The net proceeds from this issuance were used in part to repay all $525 million of borrowings then outstanding under the revolver portion of our credit facility, including amounts borrowed in connection with the acquisitions of The Ritz-Carlton O'ahu, Turtle Bay and 1 Hotel Central Park.
We believe that our ability to maintain an investment grade balance sheet and well-laddered maturity schedule is an important factor in our investment strategy. As of December 31, 2024, we have a debt balance of $5.1 billion, our weighted average interest rate is 4.7%, and our weighted average debt maturity is 5.2 years.
For a detailed discussion, see “—Liquidity and Capital Resources.” For a detailed discussion of our significant debt activities, see Part II Item 8. “Financial Statements and Supplementary Data – Note 5. Debt” in the Notes to Consolidated Financial Statements.
Share Repurchase and Dividends. In 2024, we repurchased 6.3 million shares at an average price of $16.99 per share, exclusive of commissions, for a total of $107 million, under our share repurchase program. As of December 31, 2024, we have $685 million available for repurchase under the program.
During 2024, Host Inc.'s Board of Directors declared dividends totaling $0.90 per share on its common stock, including a fourth quarter special dividend of $0.10 per share. Accordingly, Host L.P. made distributions of $0.9193446 per unit with respect to its common OP units for 2024. On February 19, 2025, we announced a regular quarterly cash dividend of $0.20 per share on our common stock. The dividend will be paid on April 15, 2025 to stockholders of record on March 31, 2025. The amount of any future dividends will be based on our policy of distributing, over time, 100% of our taxable income and will be determined by Host Inc.’s Board of Directors.
There can be no assurances that any future dividends will match or exceed those set forth above for any number of reasons, including a decline in operations or an increase in liquidity needs. We believe that we have sufficient liquidity and access to the capital markets in order to fund our capital expenditures programs and to take advantage of investment opportunities.
Results of Operations
The following table reflects certain line items from our audited consolidated statements of operations for the two years ended December 31, 2024 (in millions, except percentages):
| | | | | | | | | | | | | | | | | |
| 2024 | | 2023 | | Change |
| Total revenues | $ | 5,684 | | | $ | 5,311 | | | 7.0 | % |
| Operating costs and expenses: | | | | | |
Property-level costs ⁽¹⁾ | 4,796 | | | 4,438 | | | 8.1 | |
| Corporate and other expenses | 123 | | | 132 | | | (6.8) | |
| Net gain on insurance settlements | 110 | | | 86 | | | 27.9 | |
| Operating profit | 875 | | | 827 | | | 5.8 |
| Interest expense | 215 | | | 191 | | | 12.6 | |
| Other gains | — | | | 71 | | | (100.0) | |
| Provision for income taxes | 14 | | | 36 | | | (61.1) |
| | | | | |
| Host Inc.: | | | | | |
| Net income attributable to non-controlling interests | 10 | | | 12 | | | (16.7) |
| Net income attributable to Host Inc. | 697 | | | 740 | | | (5.8) |
| | | | | |
| Host L.P.: | | | | | |
| Net income attributable to non-controlling interests | 1 | | | 1 | | | — | |
| Net income attributable to Host L.P. | 706 | | | 751 | | | (6.0) |
___________
(1)Amounts represent total operating costs and expenses from our audited consolidated statements of operations, less corporate and other expenses and net gain on insurance settlements.
Statement of Operations Results and Trends
Operations improved in 2024 compared to 2023, reflecting (i) the operations of our recent acquisitions, including 1 Hotel Nashville and Embassy Suites by Hilton Nashville Downtown acquired in April 2024, 1 Hotel Central Park acquired in July 2024, and The Ritz-Carlton O'ahu, Turtle Bay acquired in July 2024 (collectively, the "2024 Acquisitions"); (ii) strong group business which led to improvements in food and beverage revenues, and (iii) the resumption of operations at The Ritz-Carlton, Naples, which was closed during the first half of 2023 as a result of Hurricane Ian. The improvements were partially offset by a slow recovery in Maui and the closures of Alila Ventana Big Sur, which closed at the end of March 2024 and reopened on May 22, 2024, following the collapse of a portion of Highway 1 in California, and The Don CeSar, which closed on September 25, 2024 and remains closed due to Hurricanes Helene and Milton.
The following table presents revenues in accordance with GAAP and includes all consolidated hotels for the two years ended December 31, 2024 (in millions, except percentages):
| | | | | | | | | | | | | | | | | |
| 2024 | | 2023 | | Change |
| Revenues: | | | | | |
| Rooms | $ | 3,426 | | | $ | 3,244 | | | 5.6 | % |
| Food and beverage | 1,716 | | | 1,582 | | | 8.5 | % |
| Other | 542 | | | 485 | | | 11.8 | % |
| Total revenues | $ | 5,684 | | | $ | 5,311 | | | 7.0 | % |
Rooms. Total rooms revenues increased $182 million, or 5.6%, in 2024, reflecting the operations of the 2024 Acquisitions and the reopening of The Ritz-Carlton, Naples. Rooms revenues at our comparable hotels increased $40 million, or 1.2%, driven by an increase in average room rates compared to 2023.
Food and beverage. Total food and beverage ("F&B") revenues increased $134 million, or 8.5%, in 2024, due to the 2024 Acquisitions and the reopening of The Ritz-Carlton, Naples. Comparable F&B revenues increased $57 million, or 3.6%, driven by improvements in banquet and audio-visual revenues at resort and convention hotels as group demand remained strong throughout the year.
Other revenues. Total other revenues increased $57 million, or 11.8%, in 2024, driven by results from the 2024 Acquisitions and the reopening of The Ritz-Carlton, Naples. Other revenues at our comparable hotels increased $31 million, or 6.2%, primarily due to strong spa and other ancillary revenues.
Property-level Operating Expenses
The following table presents consolidated property-level operating expenses in accordance with GAAP and includes all consolidated hotels for the two years ended December 31, 2024 (in millions, except percentages):
| | | | | | | | | | | | | | | | | |
| 2024 | | 2023 | | Change |
| Expenses: | | | | | |
| Rooms | $ | 849 | | | $ | 787 | | | 7.9 | % |
| Food and beverage | 1,137 | | | 1,042 | | | 9.1 | % |
| Other departmental and support expenses | 1,383 | | | 1,280 | | | 8.0 | % |
| Management fees | 254 | | | 249 | | | 2.0 | % |
| Other property-level expenses | 411 | | | 383 | | | 7.3 | % |
| Depreciation and amortization | 762 | | | 697 | | | 9.3 | % |
| Total property-level operating expenses | $ | 4,796 | | | $ | 4,438 | | | 8.1 | % |
Our operating costs and expenses, which consist of both fixed and variable components, are affected by several factors. Rooms expenses are affected mainly by occupancy, which drives costs related to items such as housekeeping, reservation systems, room supplies, laundry services and front desk costs. Food and beverage expenses correlate closely with food and beverage revenues and are affected by occupancy and the mix of business between banquet, audio-visual and outlet sales. However, the most significant expense for the rooms, food and beverage, and other departmental and support expenses is wages and employee benefits, which comprise approximately 57% of these expenses in any given year. During 2024, these expenses increased approximately 5% compared to 2023, primarily due to an overall increase in general wage rates and benefits. Wage and benefit rate inflation is expected to be approximately 6% in 2025.
Other property-level expenses consist of property taxes, the amounts and structure of which are highly dependent on local jurisdiction taxing authorities, and property and general liability insurance, all of which do not necessarily increase or decrease based on similar changes in revenues at our hotels.
The increases in expenses for rooms, food and beverage, other departmental and support, and management fees were generally due to the corresponding increases in revenues due to the 2024 Acquisitions, the reopening of The Ritz-Carlton, Naples, and also reflected increased expenses at our comparable hotels primarily due to increased wages and benefits, as follows:
Rooms. Rooms expenses increased $62 million, or 7.9%, in 2024. Our comparable hotels rooms expenses increased $33 million, or 4.1%, in 2024, driven by an overall increase in wage rates. Wages and benefits represented approximately 67% of our 2024 and 2023 rooms expenses.
Food and beverage. F&B expenses increased $95 million, or 9.1%, in 2024. For our comparable hotels, F&B expenses increased $41 million, or 3.9%, in 2024. Overall, F&B costs as a percentage of revenues remained consistent year over year. Wages and benefits represented approximately 69% of our 2024 and 2023 F&B expenses.
Other departmental and support expenses. Other departmental and support expenses increased $103 million, or 8.0%, in 2024. On a comparable hotel basis, other departmental and support expenses increased $62 million, or 3.2%. These increases were primarily due to higher wage expense. Wages and benefits represented approximately 41% of our 2024 and 2023 other departmental and support expenses.
Management fees. Total management fees increased $5 million, or 2.0%, in 2024. Base management fees, which generally are calculated as a percentage of total revenues, increased $10 million, or 6.7%, compared to 2023. At our comparable hotels, base management fees increased $6 million, or 3.8%, for 2024. Incentive management fees, which generally are based on the amount of operating profit at each hotel after we receive a priority return on our investment, decreased $5 million, primarily due to the closure of The Don CeSar, and the decrease at our comparable hotels of $3 million, or 2.8%, which was due to renovations at certain properties.
Other property-level expenses. These expenses generally do not vary significantly based on occupancy and include expenses such as property taxes and insurance. Other property-level expenses increased $28 million, or 7.3%, in 2024, due to increases in property insurance premiums and property taxes. Other property-level expenses at our comparable hotels increased $12 million, or 3.1%, in 2024. Other property-level expenses were partially offset by the receipt of operating profit guarantees from Marriott and Hyatt under the transformational capital programs in both 2024 and 2023.
Other Income and Expenses
Corporate and other expenses. Corporate and other expenses include the following items (in millions):
| | | | | | | | | | | |
| Year ended December 31, |
| 2024 | | 2023 |
| | | |
| General and administrative costs | $ | 93 | | | $ | 85 | |
| Non-cash stock-based compensation expense | 24 | | 30 | |
| Litigation accruals | 6 | | 17 | |
| Total | $ | 123 | | | $ | 132 | |
General and administrative costs primarily consist of wages and benefits, travel, corporate insurance, legal fees, audit fees, building rent and systems costs. The overall decrease in corporate and other expenses for the year ended December 31, 2024 is primarily due to a decrease in litigation accruals, partially offset by an increase in systems costs and other administrative fees.
Net gain on insurance settlements. The following table details our gain on insurance settlements for property damage and business interruption, net of property damage and remediation losses, related to Hurricanes Ian, Helene and Milton, the Maui wildfires and other weather events (in millions):
| | | | | | | | | | | |
| Year ended December 31, |
| 2024 | | 2023 |
| Property damage | | | |
| Hurricanes Helene/Milton | (6) | | | — | |
| Hurricane Ian | 72 | | 3 | |
| Other | 4 | | — | |
| Business interruption | | | |
| Hurricane Ian | 19 | | 80 | |
| Maui wildfires | 21 | | — | |
| Other | — | | 3 | |
| Net gain on insurance settlements | $ | 110 | | | $ | 86 | |
Interest expense. Interest expense increased $24 million, or 12.6%, in 2024 as compared to 2023, primarily due to higher outstanding debt balances during 2024 as we issued additional senior notes to fund our 2024 Acquisitions. The following table presents certain components of interest expense (in millions):
| | | | | | | | | | | |
| Year ended December 31, |
| 2024 | | 2023 |
Cash interest expense ⁽¹⁾ | $ | 205 | | | $ | 178 | |
| Non-cash interest expense | 10 | | | 9 | |
Cash debt extinguishment costs ⁽¹⁾ | — | | | 3 | |
| Non-cash debt extinguishment costs | — | | | 1 | |
| Total interest expense | $ | 215 | | | $ | 191 | |
___________
(1)Total cash interest expense paid was $172 million and $183 million in 2024 and 2023, respectively, which includes an increase (decrease) due to the change in accrued interest of $(33) million and $2 million for 2024 and 2023, respectively.
Other gains. The following table presents the gains recognized on the sale of assets and other (in millions):
| | | | | | | | | | | |
| Year ended December 31, |
| 2024 | | 2023 |
| The Camby, Autograph Collection | $ | — | | | $ | 69 | |
| | | |
| | | |
| | | |
| Other | — | | | 2 | |
| $ | — | | | $ | 71 | |
Equity in earnings of affiliates. Equity in earnings of affiliates increased $1 million, or 16.7%, in 2024, reflecting increased earnings from our investment in the Noble joint venture, partially offset by a $6 million loss for our share of an inventory impairment expense recorded by our Maui timeshare joint venture.
Provision for income taxes. We lease substantially all our properties to consolidated subsidiaries designated as TRS for U.S. federal income tax purposes. Taxable income or loss generated/incurred by the TRS primarily represents hotel-level operations and the aggregate rent paid to Host L.P. by the TRS, on which we record an income tax provision or benefit. In 2024 and 2023, we recorded an income tax provision of $14 million and $36 million, respectively, due primarily to the profitability of hotel operations retained by the TRS, including $40 million and $83 million of business interruption insurance gains recorded in 2024 and 2023, respectively. The 2024 tax provision was partially offset by the recognition of an income tax benefit due to federal income tax credits resulting from the installation of a co-generation plant at one of our properties. As a result of legislation enacted by the CARES Act in 2020, a portion of the 2020 domestic net operating loss was carried back to 2017-2019 in order to procure a refund of U.S. federal corporate income taxes previously paid. The remaining portion of the 2020 net operating loss, as well as the entire 2021 net operating loss incurred by our TRS, may be carried forward indefinitely, subject to an annual limit on the use thereof equal to 80% of annual taxable income. See also Part II Item 8. “Financial Statements and Supplementary Data – Note 7. Income Taxes” for a discussion of our income taxes.
Comparable Hotel RevPAR Overview
We discuss operating results for our hotels on a comparable hotel basis. Comparable hotels are those properties that we consolidate as of the reporting periods being compared. Comparable hotels do not include the results of hotels sold or classified as held-for-sale, hotels that have sustained substantial property damage or business interruption, or hotels that have undergone large-scale capital projects, in each case requiring closures lasting one month or longer during the reporting periods being compared. We believe this provides investors with a better understanding of underlying growth trends for our current portfolio, without impact from properties that experienced closures. We have removed The Don CeSar, Alila Ventana Big Sur, and The Ritz-Carlton, Naples from our comparable operations for the year ended December 31, 2024 due to closures. See “Comparable Hotel Operating Statistics and Results” below for more information on how we determine our comparable hotels. Beginning in third quarter of 2024, we have separated the Oahu and Maui markets.
We also include, following the comparable hotels results by geographic location, the same operating statistics presentation on an actual basis, which includes results for our portfolio for the time period of our ownership, including the
results of non-comparable properties, dispositions through their date of disposal and acquisitions beginning as of the date of acquisition. Lastly, we discuss our hotel results by mix of business (i.e., transient, group, or contract).
Hotel Operating Data by Location.
The following table sets forth performance information for our hotels by geographic location as of December 31, 2024 and 2023 on a comparable hotel and actual basis:
Comparable Hotel Results by Location
| | | | | | | | | | | | | | | | | | | | | | | | | | | | | | | | | | | | | | | | | | | | | | | | | | | | | | | | | | | | | | | | | | | | | | | | | | |
| | As of December 31, 2024 | | Year ended December 31, 2024 | | Year ended December 31, 2023 | | | | |
| Location | | No. of
Properties | | No. of
Rooms | | Average
Room Rate | | Average
Occupancy
Percentage | | RevPAR | | Total RevPAR | | Average
Room Rate | | Average
Occupancy
Percentage | | RevPAR | | Total RevPAR | | Percent
Change in
RevPAR | | Percent
Change in
Total RevPAR |
| Maui | | 3 | | 1,580 | | $ | 663.09 | | | 60.1 | % | | $ | 398.83 | | | $ | 641.01 | | | $ | 707.50 | | | 67.4 | % | | $ | 476.56 | | | $ | 720.14 | | | (16.3 | %) | | (11.0 | %) |
Oahu (1) | | 2 | | 876 | | 457.70 | | | 81.2 | % | | 371.85 | | | 576.36 | | | 442.57 | | | 76.4 | % | | 338.25 | | | 544.70 | | | 9.9 | % | | 5.8 | % |
| Miami | | 2 | | 1,038 | | 526.83 | | | 70.2 | % | | 369.84 | | | 641.42 | | | 533.31 | | | 66.9 | % | | 356.86 | | | 624.20 | | | 3.6 | % | | 2.8 | % |
| Jacksonville | | 1 | | 446 | | 517.28 | | | 71.2 | % | | 368.44 | | | 840.68 | | | 503.57 | | | 69.9 | % | | 351.80 | | | 784.10 | | | 4.7 | % | | 7.2 | % |
| New York | | 3 | | 2,720 | | 392.96 | | | 84.6 | % | | 332.63 | | | 463.36 | | | 373.48 | | | 82.6 | % | | 308.54 | | | 436.70 | | | 7.8 | % | | 6.1 | % |
| Phoenix | | 3 | | 1,545 | | 395.73 | | | 70.0 | % | | 276.93 | | | 646.95 | | | 399.79 | | | 71.5 | % | | 285.85 | | | 637.23 | | | (3.1 | %) | | 1.5 | % |
| Nashville | | 2 | | 721 | | 344.36 | | | 79.7 | % | | 274.37 | | | 447.79 | | | 344.85 | | | 74.5 | % | | 256.76 | | | 396.48 | | | 6.9 | % | | 12.9 | % |
| Orlando | | 2 | | 2,448 | | 383.93 | | | 65.1 | % | | 249.76 | | | 528.04 | | | 384.63 | | | 67.9 | % | | 261.32 | | | 521.26 | | | (4.4 | %) | | 1.3 | % |
| Los Angeles/Orange County | | 3 | | 1,067 | | 297.23 | | | 78.1 | % | | 232.13 | | | 350.62 | | | 300.29 | | | 81.7 | % | | 245.49 | | | 360.91 | | | (5.4 | %) | | (2.9 | %) |
| San Diego | | 3 | | 3,294 | | 293.18 | | | 78.9 | % | | 231.22 | | | 433.50 | | | 282.20 | | | 78.4 | % | | 221.29 | | | 414.34 | | | 4.5 | % | | 4.6 | % |
| Florida Gulf Coast | | 3 | | 1,055 | | 321.75 | | | 69.9 | % | | 224.78 | | | 492.13 | | | 321.00 | | | 70.7 | % | | 226.95 | | | 497.52 | | | (1.0 | %) | | (1.1 | %) |
| Boston | | 2 | | 1,496 | | 280.30 | | | 78.1 | % | | 218.97 | | | 287.46 | | | 264.18 | | | 78.2 | % | | 206.66 | | | 275.90 | | | 6.0 | % | | 4.2 | % |
| Washington, D.C. (CBD) | | 5 | | 3,245 | | 288.63 | | | 69.1 | % | | 199.43 | | | 289.57 | | | 276.74 | | | 70.1 | % | | 193.92 | | | 280.31 | | | 2.8 | % | | 3.3 | % |
| Philadelphia | | 2 | | 810 | | 237.00 | | | 80.4 | % | | 190.56 | | | 289.97 | | | 231.94 | | | 79.7 | % | | 184.83 | | | 288.44 | | | 3.1 | % | | 0.5 | % |
| Northern Virginia | | 2 | | 916 | | 258.13 | | | 72.5 | % | | 187.25 | | | 296.74 | | | 243.70 | | | 70.4 | % | | 171.48 | | | 268.97 | | | 9.2 | % | | 10.3 | % |
| Chicago | | 3 | | 1,562 | | 255.54 | | | 70.4 | % | | 180.01 | | | 249.73 | | | 243.59 | | | 68.9 | % | | 167.80 | | | 238.73 | | | 7.3 | % | | 4.6 | % |
| Seattle | | 2 | | 1,315 | | 248.84 | | | 68.3 | % | | 169.99 | | | 230.55 | | | 239.33 | | | 66.8 | % | | 159.81 | | | 218.64 | | | 6.4 | % | | 5.5 | % |
| Austin | | 2 | | 767 | | 256.02 | | | 66.3 | % | | 169.83 | | | 300.41 | | | 269.26 | | | 65.7 | % | | 176.88 | | | 311.25 | | | (4.0 | %) | | (3.5 | %) |
| San Francisco/San Jose | | 6 | | 4,162 | | 241.04 | | | 65.3 | % | | 157.34 | | | 231.55 | | | 251.98 | | | 66.4 | % | | 167.25 | | | 244.44 | | | (5.9 | %) | | (5.3 | %) |
| Houston | | 5 | | 1,942 | | 214.37 | | | 69.6 | % | | 149.28 | | | 208.63 | | | 201.17 | | | 69.4 | % | | 139.51 | | | 195.30 | | | 7.0 | % | | 6.8 | % |
| New Orleans | | 1 | | 1,333 | | 193.96 | | | 71.4 | % | | 138.52 | | | 218.31 | | | 196.29 | | | 68.6 | % | | 134.72 | | | 203.93 | | | 2.8 | % | | 7.1 | % |
| San Antonio | | 2 | | 1,512 | | 216.95 | | | 62.0 | % | | 134.48 | | | 218.75 | | | 215.77 | | | 61.4 | % | | 132.55 | | | 212.13 | | | 1.5 | % | | 3.1 | % |
| Denver | | 3 | | 1,342 | | 199.13 | | | 66.8 | % | | 133.12 | | | 205.67 | | | 192.48 | | | 63.3 | % | | 121.90 | | | 181.72 | | | 9.2 | % | | 13.2 | % |
| Atlanta | | 2 | | 810 | | 202.78 | | | 61.8 | % | | 125.29 | | | 206.10 | | | 190.67 | | | 74.0 | % | | 141.12 | | | 227.52 | | | (11.2 | %) | | (9.4 | %) |
| Other | | 9 | | 3,007 | | 278.09 | | | 65.4 | % | | 181.93 | | | 283.43 | | | 278.61 | | | 63.8 | % | | 177.72 | | | 272.86 | | | 2.4 | % | | 3.9 | % |
| Domestic | | 73 | | 41,009 | | 310.28 | | | 70.7 | % | | 219.29 | | | 362.10 | | | 307.86 | | | 70.7 | % | | 217.73 | | | 355.24 | | | 0.7 | % | | 1.9 | % |
| | | | | | | | | | | | | | | | | | | | | | | | |
| International | | 5 | | 1,499 | | 200.88 | | | 63.4 | % | | 127.43 | | | 184.07 | | | 186.14 | | | 62.4 | % | | 116.16 | | | 168.42 | | | 9.7 | % | | 9.3 | % |
| All Locations | | 78 | | 42,508 | | $ | 306.81 | | | 70.4 | % | | $ | 216.06 | | | $ | 355.88 | | | $ | 304.06 | | | 70.4 | % | | $ | 214.15 | | | $ | 348.70 | | | 0.9 | % | | 2.1 | % |
___________
(1) Prior to our ownership of The Ritz Carlton O'ahu, Turtle Bay, golf revenues were recorded by the property based on gross sales. After our acquisition of the property in July 2024, the golf course operates under a lease agreement, under which we record rental income, resulting in lower total revenues when compared to the periods prior to our ownership.
Results by Location - actual, based on ownership period(1)
| | | | | | | | | | | | | | | | | | | | | | | | | | | | | | | | | | | | | | | | | | | | | | | | | | | | | | | | | | | | | | | | | | | | | | | | | | |
| | As of December 31, | | | | | | | | | | | | | | | | | | | | |
| | 2024 | | 2023 | | Year ended December 31, 2024 | | Year ended December 31, 2023 | | | | |
| Location | | No. of
Properties | | No. of
Properties | | Average
Room Rate | | Average
Occupancy
Percentage | | RevPAR | | Total RevPAR | | Average
Room Rate | | Average
Occupancy
Percentage | | RevPAR | | Total RevPAR | | Percent
Change in
RevPAR | | Percent
Change in
Total RevPAR |
| Maui | | 3 | | 3 | | $ | 663.09 | | | 60.1 | % | | $ | 398.83 | | | $ | 641.01 | | | $ | 707.50 | | | 67.4 | % | | $ | 476.56 | | | $ | 720.14 | | | (16.3 | %) | | (11.0) | % |
| Oahu | | 2 | | 1 | | 345.57 | | | 85.7 | % | | 296.02 | | | 412.98 | | | 209.18 | | | 88.9 | % | | 185.90 | | | 215.50 | | | 59.2 | % | | 91.6 | % |
| Miami | | 2 | | 2 | | 526.83 | | | 70.2 | % | | 369.84 | | | 641.42 | | | 533.31 | | | 66.9 | % | | 356.86 | | | 624.20 | | | 3.6 | % | | 2.8 | % |
| Jacksonville | | 1 | | 1 | | 517.28 | | | 71.2 | % | | 368.44 | | | 840.68 | | | 503.57 | | | 69.9 | % | | 351.80 | | | 784.10 | | | 4.7 | % | | 7.2 | % |
| New York | | 3 | | 2 | | 385.01 | | | 84.9 | % | | 326.69 | | | 453.98 | | | 349.99 | | | 82.7 | % | | 289.53 | | | 412.23 | | | 12.8 | % | | 10.1 | % |
| Phoenix | | 3 | | 3 | | 395.73 | | | 70.0 | % | | 276.93 | | | 646.95 | | | 397.16 | | | 71.7 | % | | 284.75 | | | 628.10 | | | (2.7 | %) | | 3.0 | % |
| Nashville | | 2 | | — | | 355.16 | | | 81.3 | % | | 288.88 | | | 467.80 | | | — | | | — | % | | — | | | — | | | — | % | | — | % |
| Orlando | | 2 | | 2 | | 383.93 | | | 65.1 | % | | 249.76 | | | 528.04 | | | 384.63 | | | 67.9 | % | | 261.32 | | | 521.26 | | | (4.4 | %) | | 1.3 | % |
| Los Angeles/Orange County | | 3 | | 3 | | 297.23 | | | 78.1 | % | | 232.13 | | | 350.62 | | | 300.29 | | | 81.7 | % | | 245.49 | | | 360.91 | | | (5.4 | %) | | (2.9 | %) |
| San Diego | | 3 | | 3 | | 293.18 | | | 78.9 | % | | 231.22 | | | 433.50 | | | 282.20 | | | 78.4 | % | | 221.29 | | | 414.34 | | | 4.5 | % | | 4.6 | % |
| Florida Gulf Coast | | 5 | | 5 | | 467.55 | | | 65.7 | % | | 307.37 | | | 642.56 | | | 388.97 | | | 60.6 | % | | 235.74 | | | 497.91 | | | 30.4 | % | | 29.1 | % |
| Boston | | 2 | | 2 | | 280.30 | | | 78.1 | % | | 218.97 | | | 287.46 | | | 264.18 | | | 78.2 | % | | 206.66 | | | 275.90 | | | 6.0 | % | | 4.2 | % |
| Washington, D.C. (CBD) | | 5 | | 5 | | 288.63 | | | 69.1 | % | | 199.43 | | | 289.57 | | | 276.74 | | | 70.1 | % | | 193.92 | | | 280.31 | | | 2.8 | % | | 3.3 | % |
| Philadelphia | | 2 | | 2 | | 237.00 | | | 80.4 | % | | 190.56 | | | 289.97 | | | 231.94 | | | 79.7 | % | | 184.83 | | | 288.44 | | | 3.1 | % | | 0.5 | % |
| Northern Virginia | | 2 | | 2 | | 258.13 | | | 72.5 | % | | 187.25 | | | 296.74 | | | 243.70 | | | 70.4 | % | | 171.48 | | | 268.97 | | | 9.2 | % | | 10.3 | % |
| Chicago | | 3 | | 3 | | 255.54 | | | 70.4 | % | | 180.01 | | | 249.73 | | | 243.59 | | | 68.9 | % | | 167.80 | | | 238.73 | | | 7.3 | % | | 4.6 | % |
| Seattle | | 2 | | 2 | | 248.84 | | | 68.3 | % | | 169.99 | | | 230.55 | | | 239.33 | | | 66.8 | % | | 159.81 | | | 218.64 | | | 6.4 | % | | 5.5 | % |
| Austin | | 2 | | 2 | | 256.02 | | | 66.3 | % | | 169.83 | | | 300.41 | | | 269.26 | | | 65.7 | % | | 176.88 | | | 311.25 | | | (4.0 | %) | | (3.5 | %) |
| San Francisco/San Jose | | 6 | | 6 | | 241.04 | | | 65.3 | % | | 157.34 | | | 231.55 | | | 251.98 | | | 66.4 | % | | 167.25 | | | 244.44 | | | (5.9 | %) | | (5.3 | %) |
| Houston | | 5 | | 5 | | 214.37 | | | 69.6 | % | | 149.28 | | | 208.63 | | | 201.17 | | | 69.4 | % | | 139.51 | | | 195.30 | | | 7.0 | % | | 6.8 | % |
| New Orleans | | 1 | | 1 | | 193.96 | | | 71.4 | % | | 138.52 | | | 218.31 | | | 196.29 | | | 68.6 | % | | 134.72 | | | 203.93 | | | 2.8 | % | | 7.1 | % |
| San Antonio | | 2 | | 2 | | 216.95 | | | 62.0 | % | | 134.48 | | | 218.75 | | | 215.77 | | | 61.4 | % | | 132.55 | | | 212.13 | | | 1.5 | % | | 3.1 | % |
| Denver | | 3 | | 3 | | 199.13 | | | 66.8 | % | | 133.12 | | | 205.67 | | | 192.48 | | | 63.3 | % | | 121.90 | | | 181.72 | | | 9.2 | % | | 13.2 | % |
| Atlanta | | 2 | | 2 | | 202.78 | | | 61.8 | % | | 125.29 | | | 206.10 | | | 190.67 | | | 74.0 | % | | 141.12 | | | 227.52 | | | (11.2 | %) | | (9.4 | %) |
| Other | | 10 | | 10 | | 308.67 | | | 65.6 | % | | 202.53 | | | 314.00 | | | 313.84 | | | 64.2 | % | | 201.47 | | | 308.08 | | | 0.5 | % | | 1.9 | % |
| Domestic | | 76 | | 72 | | 314.82 | | | 70.4 | % | | 221.71 | | | 368.78 | | | 305.83 | | | 70.2 | % | | 214.78 | | | 352.38 | | | 3.2 | % | | 4.7 | % |
| | | | | | | | | | | | | | | | | | | | | | | | |
| International | | 5 | | 5 | | 200.88 | | | 63.4 | % | | 127.43 | | | 184.07 | | | 186.14 | | | 62.4 | % | | 116.16 | | | 168.42 | | | 9.7 | % | | 9.3 | % |
| All Locations | | 81 | | 77 | | $ | 311.21 | | | 70.2 | % | | $ | 218.41 | | | $ | 362.37 | | | $ | 302.03 | | | 69.9 | % | | $ | 211.27 | | | $ | 345.86 | | | 3.4 | % | | 4.8 | % |
___________(1)Represents the results of the portfolio for the time period of our ownership, including the results of non-comparable properties, dispositions through their date of disposal and acquisitions beginning as of the date of acquisition.
Hotel Sales by Business Mix.
The majority of our customers fall into three broad categories: transient, group and contract business. The information below is derived from business mix results from the 78 comparable hotels owned as of December 31, 2024.
Improvements in 2024 compared to 2023 were primarily driven by an increase in group business, through increases in average rates and occupancy, as our convention and downtown properties continued to benefit from group demand. The growth in group demand was partially offset by a 0.3% decrease in transient revenue, reflecting the impacts of the Maui wildfires and moderating leisure demand.
The following are the results of our transient, group and contract business:
| | | | | | | | | | | | | | | | | |
| Year ended December 31, 2024 |
| Transient business | | Group business | | Contract business |
| Room nights (in thousands) | 5,966 | | | 4,256 | | | 752 | |
| Percentage change in room nights vs. same period in 2023 | (0.3 | %) | | 0.8 | % | | 2.7 | % |
| Rooms Revenues (in millions) | $ | 2,016 | | | $ | 1,196 | | | $ | 155 | |
| Percentage change in rooms revenues vs. same period in 2023 | (0.3 | %) | | 2.7 | % | | 11.5 | % |
Liquidity and Capital Resources
Liquidity and Capital Resources of Host Inc. and Host L.P. The liquidity and capital resources of Host Inc. and Host L.P. are derived primarily from the activities of Host L.P., which generates the capital required by our business from hotel operations, the incurrence of debt, the issuance of OP units or the sale of hotels. Host Inc. is a REIT and its only significant asset is the ownership of general and limited partner interests of Host L.P.; therefore, its financing and investing activities are conducted through Host L.P., except for the issuance of its common and preferred stock. Proceeds from common and preferred stock issuances by Host Inc. are contributed to Host L.P. in exchange for common and preferred OP units. Additionally, funds used by Host Inc. to pay dividends or to repurchase its stock are provided by Host L.P. Therefore, while we have noted those areas in which it is important to distinguish between Host Inc. and Host L.P., we have not included a separate discussion of liquidity and capital resources as the discussion below applies to both Host Inc. and Host L.P.
Overview. We look to maintain a capital structure and liquidity profile with an appropriate balance of cash, debt and equity to provide financial flexibility given the inherent volatility of the lodging industry. We believe this strategy has resulted in a better cost of debt capital, allowing us to complete opportunistic investments and acquisitions and positioning us to manage potential declines in operations throughout the lodging cycle. We have structured our debt profile to maintain a balanced maturity schedule and to minimize the number of assets that are encumbered by mortgage debt. Currently, only one of our consolidated hotels is encumbered by mortgage debt. Over the past several years leading up to the COVID-19 pandemic, we had decreased our leverage as measured by our net debt-to-EBITDA ratio and reduced our debt service obligations, leading to an increase in our fixed charge coverage ratio. As a result, the company was well positioned at the onset of the COVID-19 pandemic with sufficient liquidity and financial flexibility to withstand the severe slowdown in U.S. economic activity and lodging demand brought on by the pandemic. We intend to use available cash in the near term predominantly to fund, and believe that we have sufficient liquidity to fund, corporate expenses, capital expenditures, hotel acquisitions and dividends and remain well positioned to execute additional investment transactions to the extent opportunities arise.
Cash Requirements. We use cash for acquisitions, capital expenditures, debt payments, operating costs, and corporate and other expenses, as well as for dividends and distributions to stockholders and Host L.P. limited partners and stock and OP unit repurchases. Our primary sources of cash include cash from operations, proceeds from the sale of assets, borrowings under our credit facility and debt and equity issuances. In the short term, our cash obligations include $500 million of senior notes due in June 2025. We believe we have sufficient liquidity to repay them at maturity, or we can refinance the notes with our access to capital markets. For our long-term senior note and credit facility obligations, we historically have refinanced these amounts prior to their maturity through the issuance of new senior notes or the entry into new credit facility agreements. Whether we will refinance the June 2025 senior notes upon maturity with new senior notes will depend upon market conditions generally, including the interest rate environment, and our cash requirements. Also, in the short term, our cash obligations include the minimum lease payments on our ground leases, which in 2025 are approximately $31 million, and most of our other operating obligations. In the long term, our ground lease payments are the longest time horizon obligations and currently run up to 100 years. For a summary of our obligations under our ground leases, see Exhibit 99.1 to this Annual Report.
In addition to the liabilities on our consolidated balance sheet, under our capital expenditures program, we have budgeted to spend $580 million to $670 million in 2025. Commitments for capital expenditures generally run less than two years for the life of the project. In the long term, renewal and replacement ("R&R") capital expenditures are designed to maintain the quality and competitiveness of our hotels and typically occur at intervals of seven to ten years. The projects are primarily funded through the FF&E reserves established at each hotel. Average annual R&R spend over the last five years has been $245 million.
Our 2025 capital expenditures budget includes approximately $70 million to $80 million for restoration work at our Florida properties affected by Hurricanes Helene and Milton in 2024, primarily at The Don CeSar, which sustained significant damage and remains closed. We estimate the total property reconstruction and remediation costs from the storms, including resiliency enhancements, for The Don CeSar to be approximately $100 million to $110 million of which approximately 25-30% relates to remediation costs. We believe our insurance coverage will be sufficient to cover the property remediation and reconstruction costs and the near-term loss of business in excess of our deductibles of approximately $20 million, although the timing for the receipt of insurance proceeds remains uncertain.
As part of our investment in our Noble joint venture, we have made a $211.5 million capital commitment to Noble Fund V and an additional capital commitment of $30 million through a related co-investment. As of December 31, 2024, we have funded $72 million and $13 million of these commitments, respectively, with the remaining amounts expected to be paid within the next two years.
As a REIT, Host Inc. is required to pay dividends to its stockholders in an amount equal to at least 90% of its taxable income, excluding net capital gain, on an annual basis. See also Part II Item 8. “Financial Statements and Supplementary Data – Note 17. Legal Proceedings, Guarantees and Contingencies” for a discussion of obligations under contingent liabilities or guarantees and a more detailed description of the damage caused by Hurricanes Helene and Milton.
Capital Resources. As of December 31, 2024, we had $554 million of cash and cash equivalents, $242 million in our FF&E escrow reserve and $1.5 billion available under the revolver portion of our credit facility. In the near term, with the exception of the $500 million Series E senior notes due in June 2025, as described above, we expect to fund our above cash requirements, including our dividends, capital expenditures program, debt service and operating and corporate costs, primarily through hotel operations and our existing cash reserves. Based on our cash balance at December 31, 2024 and our expected cash obligations, we believe we will have sufficient liquidity to meet our near-term obligations. Future acquisitions and/or obligations also may be funded through a draw on the available portion of the revolver under our credit facility, equity issuances, or asset sales.
We depend primarily on external sources of capital to finance future growth, including acquisitions. As a result, the liquidity and debt capacity provided by our credit facility and the ability to issue senior unsecured debt are key components of our capital structure. Our financial flexibility, including our ability to incur debt, pay dividends, make distributions and make investments, is contingent on our ability to maintain compliance with the financial covenants of our credit facility and senior notes, which include, among other things, the allowable amounts of leverage, interest coverage and fixed charges.
The following graph summarizes our aggregate debt maturities as of February 21, 2025:
___________
(1)The first term loan under our credit facility that is due in 2027 has an extension option that would extend maturity of the instrument to 2028, subject to meeting certain conditions, including payment of a fee. The second term loan tranche that is due in 2028 does not have an extension option.
(2)Mortgage and other debt excludes principal amortization of $2 million each year from 2025-2027 for the mortgage loan that matures in 2027.
Given the total amount of our debt and our maturity schedule, we may continue to redeem or repurchase senior notes from time to time, taking advantage of favorable market conditions. In February 2023, Host Inc.’s Board of Directors authorized repurchases of up to $1.0 billion of senior notes other than in accordance with their respective terms, of which the entire amount remains available under this authority. We may purchase senior notes for cash through open market purchases, privately negotiated transactions, a tender offer or, in some cases, through the early redemption of such securities pursuant to their terms. Repurchases of debt will depend on prevailing market conditions, our liquidity requirements, contractual restrictions and other factors. Any retirement before the maturity date will affect earnings and NAREIT FFO per diluted share as a result of the payment of any applicable call premiums and the accelerated expensing of previously deferred and capitalized financing costs. Accordingly, considering our priorities in managing our capital structure and liquidity profile and given prevailing conditions and relative pricing in the capital markets, we may, at any time, subject to applicable securities laws and the requirements of our credit facility and senior notes, be considering, or be in discussions with respect to, the repurchase or issuance of exchangeable debentures and/or senior notes or the repurchase or sale of our common stock. Any such transactions may, subject to applicable securities laws, occur simultaneously.
Two programs currently are in place relating to purchases and sales of our common stock. First, under our common stock repurchase program, common stock may be purchased from time to time depending upon market conditions and may be purchased in the open market or through private transactions or by other means, including principal transactions with various financial institutions, like accelerated share repurchases, forwards, options, and similar transactions and through one or more trading plans designed to comply with Rule 10b5-1 under the Securities Exchange Act of 1934, as amended. The plan does not obligate us to repurchase any specific number or any specific dollar amount of shares and may be suspended at any time at our discretion. In the fourth quarter of 2024, no shares were repurchased. For full year 2024, we repurchased 6.3 million shares at an average price of $16.99 per share, exclusive of commissions, for a total of $107 million. At December 31, 2024, we had $685 million available for repurchase under the program.
Second, on May 31, 2023, we entered into a distribution agreement with J.P. Morgan Securities LLC, BofA Securities, Inc., Goldman Sachs & Co. LLC, Jefferies LLC, Morgan Stanley & Co. LLC, Scotia Capital (USA) Inc., Truist Securities, Inc. and Wells Fargo Securities, LLC, as sales agents pursuant to which Host Inc. may offer and sell, from time to time, shares of Host Inc. common stock having an aggregate offering price of up to $600 million. The sales will be made in transactions that are deemed to be “at the market” offerings under the SEC rules. We may sell shares of Host Inc. common stock under this program from time to time based on market conditions, although we are not under an obligation to sell any shares. We may sell shares when we believe conditions are advantageous and there is a compelling use of proceeds, including to fund future potential acquisitions or other investment opportunities. The agreement also contemplates that, in addition to the offering and sale of shares to or through the sales agents, we may enter into separate forward sale agreements with each of the forward purchasers named in the agreement. No shares were issued in 2023 or 2024. As of December 31, 2024, there was $600 million of remaining capacity under the agreement.
We continue to explore potential acquisitions and dispositions. We anticipate that any such future acquisitions will be funded by cash, debt issuances by Host L.P., equity offerings of Host Inc., issuances of OP units by Host L.P., or proceeds from sales of hotels. Given the nature of these transactions, we can make no assurances that we will be successful in acquiring any one or more hotels that we may review, bid on or negotiate to purchase or that we will be successful in disposing of any one or more of our hotels. We may acquire additional hotels or dispose of hotels through various structures, including transactions involving single assets, portfolios, joint ventures, acquisitions of the securities or assets of other REITs or distributions of hotels to our stockholders.
Sources and Uses of Cash. In 2024, our primary sources of cash included cash from operations and proceeds from debt issuances. Our primary uses of cash during the year consisted of acquisitions, capital expenditures, operating costs, debt repayments, share repurchases and distributions to equity holders. We anticipate that our sources and uses of cash will be similar in 2025.
Cash Provided by Operating Activities. Our net cash provided by operating activities for 2024 was $1,498 million, an increase of $57 million compared to 2023, reflecting the reopening of The Ritz-Carlton, Naples, which was closed for the first half of 2023, as well as operations from our 2024 Acquisitions, partially offset by payments for the development of condo units at Four Seasons Resort Orlando at Walt Disney World® Resort.
Cash Used in Investing Activities. Approximately $2,040 million of cash was used in investing activities during 2024 compared to $183 million in 2023. The increase reflects the significant acquisition and joint venture investment activity in 2024 compared to the disposition-related activity in 2023 as detailed in the charts below. Additionally, cash used in investing activities included $548 million of capital expenditures in 2024, compared to $646 million in 2023. These
amounts include certain internal costs and interest expense associated with our capital expenditures projects that have been capitalized in accordance with GAAP. These capitalized costs were $18 million, $24 million and $20 million for 2024, 2023 and 2022, respectively.
The following tables summarize significant acquisitions, dispositions and investments in affiliates from January 1, 2023 through February 21, 2025 (in millions):
| | | | | | | | | | | | | | | | | |
| Transaction Date | | Description of Transaction | | Investment |
| Acquisitions/Investments | | | | |
| | | | | |
| January - December | 2024 | | Investment in Noble JV | | $ | (52) | |
| July | 2024 | | Acquisition of The Ritz-Carlton O'ahu, Turtle Bay (1) | | (680) | |
| July | 2024 | | Acquisition of 1 Hotel Central Park | | (265) | |
| April | 2024 | | Acquisition of 1 Hotel Nashville and Embassy Suites by Hilton Nashville Downtown | | (530) | |
| | | | | |
| | | | | |
| | | Total acquisitions/investments | | $ | (1,527) | |
___________(1)Investment amount represents a sales price of $725 million net of $45 million of key money received from Marriott International in connection with the conversion of the property to The Ritz-Carlton brand and includes the acquisition of a 49-acre land parcel entitled for development. Investment amount also includes the assumption of $15 million of hotel-level liabilities.
| | | | | | | | | | | | | | | | | | | | | | | |
| Transaction Date | | Description of Transaction | | Net Proceeds⁽¹⁾ | | Sales Price |
| Dispositions | | | | | | | |
| | | | | | | |
| February | 2025 | | Receipt of The Camby, Autograph Collection note receivable⁽²⁾ | | $ | 79 | | | — | |
| November | 2023 | | Receipt of Sheraton New York note receivable⁽³⁾ | | 250 | | | $ | — | |
| September | 2023 | | Receipt of Sheraton Boston note receivable⁽⁴⁾ | | 163 | | | — | |
| March | 2023 | | Disposition of The Camby, Autograph Collection⁽²⁾ | | 36 | | | 110 | |
| | | | | | | |
| | | | | | | |
| | | Total dispositions | | $ | 528 | | | $ | 110 | |
___________(1)Proceeds are net of transfer taxes, other sales costs and FF&E replacement funds deposited directly to the property or hotel manager by the purchaser.
(2)In connection with the sale of The Camby, Autograph Collection, we issued a $72 million loan to the purchaser. The disposition proceeds shown are net of the loan. The loan was repaid in February 2025.
(3)In connection with the sale of the Sheraton New York Times Square Hotel, we extended a $250 million bridge loan to the purchaser. The loan was repaid in November 2023.
(4)In connection with the sale of the Sheraton Boston, we extended a $163 million bridge loan to the purchaser. The loan was repaid in September 2023.
Cash Used in Financing Activities. Net cash used in financing activities was $13 million for 2024, compared to $771 million in 2023. Cash used in financing activities in 2024 and 2023 included the payment of common stock dividends and common stock repurchases, and, in 2024, these were mostly offset by a net issuance of senior notes of $867 million.
We utilized the revolver under our credit facility for various funding needs in 2024 with all borrowings repaid by year end. The following table summarizes other significant debt issuances, net of deferred financing costs and issuance discounts, that have been completed from January 1, 2023 through February 21, 2025 (in millions):
| | | | | | | | | | | | | | | | | |
| Transaction Date | | Description of Transaction | | Net Proceeds |
| Debt Issuances | | | | |
| | | | | |
| August | 2024 | | Issuance of $700 million 5.5% Series L senior notes | | $ | 683 | |
| | | | | |
| May | 2024 | | Issuance of $600 million 5.7% Series K senior notes | | 584 | |
| | | | | |
| | | | Total issuances | | $ | 1,267 | |
The following table presents significant debt repayments, including prepayment premiums, that have been completed from January 1, 2023 through February 21, 2025 (in millions):
| | | | | | | | | | | | | | | | | |
| Transaction Date | | Description of Transaction | | Transaction Amount |
| Debt Repayments | | | | |
| | | | | |
| | | | | |
| April | 2024 | | Repayment of $400 million 3 ⅞% Series G senior notes | | (400) | |
| | | | | |
| | | | | |
| | | | Total cash repayments | | (400) | |
Equity/Capital Transactions. The following table summarizes significant equity transactions that have been completed from January 1, 2023 through February 21, 2025 (in millions):
| | | | | | | | | | | | | | | | | |
| Transaction Date | | Description of Transaction | | Transaction Amount |
| Equity of Host Inc. | | | | |
| | | | | |
| | | | | |
| | | | | |
| January | 2025 | | Dividend payment⁽¹⁾⁽²⁾ | | $ | (210) | |
| January - October | 2024 | | Dividend payments⁽²⁾ | | (737) | |
| May - September | 2024 | | Repurchase of 6.3 million shares of Host Inc. common stock | | (107) | |
| January - December | 2023 | | Repurchase of 11.4 million shares of Host Inc. common stock | | (182) | |
| January - October | 2023 | | Dividend payments⁽²⁾ | | (547) | |
| | | | | |
| | | | | |
| | | | | |
| | | Cash payments on equity transactions | | $ | (1,783) | |
___________
(1)Our dividend payment for the fourth quarter of 2024 was made in January 2025, but was accrued at December 31, 2024.
(2)In connection with the dividend payments, Host L.P. made distributions of $212 million, $748 million and $555 million in 2025, 2024 and 2023, respectively, to its common OP unit holders.
Financial Condition
As of December 31, 2024, our total debt was approximately $5.1 billion, of which 80% carried a fixed rate of interest. Total debt was comprised of the following (in millions):
| | | | | | | | | | | |
| As of December 31, |
| 2024 | | 2023 |
| Series E senior notes, with a rate of 4% due June 2025 | $ | 500 | | | $ | 499 | |
| Series F senior notes, with a rate of 4 ½% due February 2026 | 399 | | | 399 | |
| Series G senior notes, with a rate of 3 ⅞% due April 2024 | — | | | 400 | |
| Series H senior notes, with a rate of 3 ⅜% due December 2029 | 644 | | | 643 | |
| Series I senior notes, with a rate of 3 ½% due September 2030 | 740 | | | 738 | |
| Series J senior notes, with a rate of 2.9% due December 2031 | 442 | | | 441 | |
| Series K senior notes, with a rate of 5.7% due July 2034 | 585 | | | — | |
| Series L senior notes, with a rate of 5.5% due April 2035 | 683 | | | — | |
| Total senior notes | 3,993 | | | 3,120 | |
| Credit facility revolver ⁽¹⁾ | (6) | | | (8) | |
| Credit facility term loan due January 2027 | 499 | | | 499 | |
| Credit facility term loan due January 2028 | 499 | | | 498 | |
| Mortgage and other debt, with an average interest rate of 4.67% at both December 31, 2024 and 2023, maturing through November 2027 | 98 | | | 100 | |
| Total debt | $ | 5,083 | | | $ | 4,209 | |
___________
(1)There were no outstanding credit facility borrowings at December 31, 2024 or 2023. Amount shown represents deferred financing costs related to the credit facility revolver.
Aggregate debt maturities, including principal amortization, at December 31, 2024 are as follows (in millions):
| | | | | | | | | | | | | | | | | |
| Senior notes and credit facility | | Mortgage and Other debt | | Total |
| 2025 | $ | 500 | | | $ | 2 | | | $ | 502 | |
| 2026 | 400 | | | 2 | | | 402 | |
| 2027 | 500 | | | 92 | | | 592 | |
| 2028 | 500 | | | — | | | 500 | |
| 2029 | 650 | | | — | | | 650 | |
| Thereafter | 2,500 | | | — | | | 2,500 | |
| 5,050 | | | 96 | | | 5,146 | |
| Deferred financing costs | (31) | | | — | | | (31) | |
| Unamortized (discounts) premiums, net | (34) | | | 2 | | | (32) | |
| $ | 4,985 | | | $ | 98 | | | $ | 5,083 | |
Senior Notes. On April 1, 2024, we repaid our $400 million 3⅞% Series G senior notes at maturity.
On May 10, 2024, we issued $600 million of 5.700% Series K senior notes in an underwritten public offering for proceeds of $584 million, net of original issue discount, underwriting fees and expenses. The Series K senior notes are due in July 2034, and interest is payable semi-annually in arrears on January 1 and July 1, commencing January 1, 2025. The Series K senior notes were issued as a “green bond,” and we allocated an amount equal to the net proceeds from the sale of the Series K senior notes to finance and/or refinance one or more eligible green projects, including the April 2024 acquisition of the 1 Hotel Nashville and Embassy Suites by Nashville Downtown, each of which has received LEED Silver certification. Following the allocation to eligible green projects, the net proceeds of this issuance were used to repay all $215 million of borrowings that were outstanding under the revolver portion of our credit facility at that time. The Series K senior notes are not redeemable prior to 90 days before the July 1, 2034 maturity date, except at a price equal to 100% of their principal amount plus a make-whole premium and accrued and unpaid interest to the applicable redemption date. The Series K senior notes have covenants similar to all other series of our outstanding senior notes.
On August 12, 2024, we issued $700 million of 5.500% Series L senior notes in an underwritten public offering for proceeds of approximately $683 million, net of original issue discount, underwriting fees and expenses. The Series L senior notes are due in April 2035 and interest is payable semi-annually in arrears on April 15 and October 15 of each year, commencing April 15, 2025. The net proceeds were used in part to repay all $525 million of borrowings then outstanding under the revolver portion of our senior credit facility, including amounts borrowed during the third quarter in connection with the acquisitions of The Ritz-Carlton O’ahu, Turtle Bay and 1 Hotel Central Park. The Series L senior notes are not redeemable prior to 90 days before the April 15, 2035 maturity date, except at a price equal to 100% of their principal amount plus a make-whole premium and accrued and unpaid interest to the applicable redemption date. The Series L senior notes have covenants similar to all other series of our outstanding senior notes.
The following summary is a description of the material provisions of the indenture governing the various senior notes issued by Host L.P. We pay interest on each series of our outstanding senior notes semi-annually in arrears at the respective annual rates indicated on the table above. Under the terms of our senior notes indenture, our senior notes are equal in right of payment with all of Host L.P.’s unsubordinated indebtedness and senior to all subordinated obligations of Host L.P. Currently there are no guarantees provided with respect to the senior notes, but we have agreed that all Host L.P. subsidiaries which guarantee other Host L.P. debt must similarly provide guarantees with respect to the senior notes.
All of our outstanding senior notes at December 31, 2024 were issued after we attained an investment grade rating and have covenants customary for investment grade debt and covenants that are similar to each other series of our senior notes. These covenants are primarily limitations on our ability to incur additional debt. There are no restrictions on our ability to pay dividends.
Under the terms of our senior notes, Host L.P.’s ability to incur debt is subject to restrictions and the satisfaction of various conditions, including the achievement of an EBITDA-to-interest coverage ratio of at least 1.5x by Host L.P. As calculated, this ratio excludes from interest expense items such as call premiums and deferred financing charges that are included in interest expense on Host L.P.’s audited consolidated statement of operations. In addition, the calculation is
based on Host L.P.’s pro forma results for the four prior fiscal quarters, giving effect to certain transactions, such as acquisitions, dispositions and financings, as if they had occurred at the beginning of the period. Other covenants limiting Host L.P.’s ability to incur debt include maintaining total debt of less than 65% of adjusted total assets (using undepreciated real estate book values), maintaining secured debt of less than 40% of adjusted total assets (using undepreciated real estate book values) and maintaining total unencumbered assets of at least 150% of the aggregate principal amount of outstanding unsecured debt of Host L.P. and its subsidiaries. So long as Host L.P. maintains the required level of interest coverage and satisfies these and other conditions in the senior notes indenture, it may incur additional debt.
As of December 31, 2024, we have met the minimum financial covenant levels under our senior notes indentures. The following table summarizes the financial tests contained in the senior notes indenture for our senior notes and our actual credit ratios as of December 31, 2024:
| | | | | | | | | | | |
| Actual Ratio | | Covenant Requirement |
| Unencumbered assets tests | 438 | % | | Minimum ratio of 150% |
| Total indebtedness to total assets | 23 | % | | Maximum ratio of 65% |
| Secured indebtedness to total assets | <1% | | Maximum ratio of 40% |
| EBITDA-to-interest coverage ratio | 7.0x | | Minimum ratio of 1.5x |
Credit Facility. On January 4, 2023, we entered into the sixth amended and restated senior revolving credit and term loan facility, with Bank of America, N.A., as administrative agent, Wells Fargo Bank, N.A. and JPMorgan Chase Bank, N.A. as co-syndication agents, and certain other agents and lenders. The credit facility allows for revolving borrowings in an aggregate principal amount of up to $1.5 billion. The revolver also includes a foreign currency subfacility for Canadian dollars, Australian dollars, Euros, British pounds sterling and, if available to the lenders, Mexican pesos, of up to the foreign currency equivalent of $500 million, subject to a lower amount in the case of Mexican peso borrowings. The credit facility also provides for a term loan facility of $1 billion (which is fully utilized), a subfacility of up to $100 million for swingline borrowings in currencies other than U.S. dollars and a subfacility of up to $100 million for issuances of letters of credit. Host L.P. also has the option to add in the future $500 million of commitments which may be used for additional revolving credit facility borrowings and/or term loans, subject to obtaining additional loan commitments (which we have not currently obtained) and the satisfaction of certain conditions.
The revolving credit facility has an initial scheduled maturity date of January 4, 2027, which date may be extended by up to a year by the exercise of either a 1-year extension option or two 6-month extension options, each of which is subject to certain conditions, including the payment of an extension fee and the accuracy of representations and warranties. One $500 million term loan tranche has an initial maturity date of January 4, 2027, which date may be extended up to a year by the exercise of one 1 -year extension option, which is subject to certain conditions, including the payment of an extension fee; and the second $500 million term loan tranche has a maturity date of January 4, 2028, which date may not be extended.
Neither the revolving credit facility nor the term loans, as applicable, requires any scheduled amortization payments prior to maturity. The term loans are subject to the same terms and conditions as those in the credit facility regarding subsidiary guarantees, operational covenants, financial covenants and events of default (as discussed below).
Guarantees. Similar to our senior note indenture, the credit facility requires all Host L.P. subsidiaries which guaranty Host L.P. senior unsecured debt to similarly guarantee obligations under the credit facility. Currently, there are no such guarantees.
Prepayments. Voluntary prepayments of revolver borrowings and term loans under the credit facility are permitted in whole or in part without premium or penalty.
Financial Covenants. The credit facility contains covenants concerning allowable leverage, fixed charge coverage and unsecured interest coverage. We are permitted to make borrowings and maintain amounts outstanding under the credit facility so long as our ratio of consolidated total debt to consolidated EBITDA (“leverage ratio”) is not in excess of 7.25x, our unsecured coverage ratio is not less than 1.75x and our fixed charge coverage ratio is not less than 1.25x. These calculations are performed based on pro forma results for the prior four fiscal quarters, giving effect to transactions such as acquisitions, dispositions and financings as if they had occurred at the beginning of the period. Under the terms of the credit facility, interest expense excludes items such as the gains and losses on the extinguishment of debt, deferred
financing charges related to the senior notes or the credit facility, and non-cash interest expense, all of which are included in interest expense on our audited consolidated statements of operations. Additionally, total debt used in the calculation of our leverage ratio is based on a “net debt” concept, pursuant to which cash and cash equivalents in excess of $100 million are deducted from our total debt balance.
We are in compliance with all of our financial covenants under the credit facility. The following table summarizes the financial tests contained in the credit facility and our actual credit ratios as of December 31, 2024:
| | | | | | | | | | | |
| Actual Ratio | | Covenant Requirement
for all years |
| Leverage ratio | 2.7x | | Maximum ratio of 7.25x |
| Fixed charge coverage ratio | 5.5x | | Minimum ratio of 1.25x |
| Unsecured interest coverage ratio ⁽¹⁾ | 7.0x | | Minimum ratio of 1.75x |
___________
(1)If at any time our leverage ratio is above 7.0x, our minimum unsecured interest coverage ratio requirement will decrease to 1.50x.
Interest and Fees. The 2023 amendment and restatement also converted the underlying reference rate from LIBOR to SOFR plus a credit spread adjustment of 10 basis points. We pay interest on U.S. dollar revolver borrowings under the credit facility at floating rates equal to SOFR (plus a credit spread adjustment of 10 basis points) plus a margin ranging from 72.5 to 140 basis points (depending on Host L.P.’s unsecured long-term debt rating). We also pay a facility fee on the total $1.5 billion revolver commitment ranging from 12.5 to 30 basis points, depending on our rating and regardless of usage. We also may elect to pay interest on revolver and term loan borrowings using a base rate plus a margin that is similarly determined based on Host L.P.’s unsecured long-term debt rating. The credit facility includes a sustainability pricing adjustment that can result in a change in the interest rate applicable to borrowings. The adjustment can result in an increase or decrease of the interest rate for revolving loans of up to 4 basis points and an increase or decrease of the facility fee of up to 1 basis point. In the case of the term loans, the adjustment can result in an increase or decrease of the interest rate applicable of up to 5 basis points. The adjustments will be determined annually on the basis of an annual audited report of Host L.P.’s performance against targets established in the credit facility for (1) the percentage of our consolidated portfolio with green building certifications and (2) the percentage of electricity used at all our consolidated properties that is generated by renewable resources. Effective June 26, 2024, we achieved a milestone in the progress towards both of our targets, resulting in the maximum benefit of the basis point reduction in the interest rate on borrowings under the credit facility. Based on Host L.P.’s unsecured long-term debt rating as of December 31, 2024, we are able to borrow on the revolver at a rate of adjusted SOFR plus 85 basis points less 4 basis points for meeting sustainability milestones for an all-in rate of 5.25% and pay a facility fee of 19 basis points.
Interest on the term loans consists of floating rates equal to SOFR (plus a credit spread adjustment of 10 basis points) plus a margin ranging from 80 to 160 basis points (depending on Host L.P.’s unsecured long-term debt rating) and adjusted for sustainability pricing. Based on Host L.P.’s long-term debt rating as of December 31, 2024, our applicable margin on SOFR loans under both term loans is 95 basis points, less 5 basis points for meeting sustainability milestones, for an all-in rate of 5.34%.
Other Covenants and Events of Default. The credit facility contains restrictive covenants on customary matters. Certain covenants are less restrictive at any time that our leverage ratio is below 6.0x. At any time that our leverage ratio is below 6.0x, acquisitions, investments, dividends and distributions generally are permitted except where they would result in a breach of the financial covenants, calculated on a pro forma basis. Additionally, the credit facility’s restrictions on the incurrence of debt incorporate the same financial covenant as set forth in our senior notes indenture.
The credit facility also includes usual and customary events of default for facilities of this nature, and provides that, upon the occurrence and continuance of an event of default, payment of all amounts due under the credit facility may be accelerated and the lenders’ commitments may be terminated. In addition, upon the occurrence of certain insolvency or bankruptcy-related events of default, all amounts due under the credit facility automatically will become due and payable and the lenders’ commitments automatically will terminate.
Mortgage Debt, Including Unconsolidated Joint Ventures. At December 31, 2024, we own one consolidated property that is encumbered by mortgage debt. All of our mortgage debt is recourse solely to specific assets, except in instances of fraud, misapplication of funds and other customary recourse provisions. As of December 31, 2024, our mortgage debt has an interest rate of 4.67% and matures in 2027, with principal and interest payments due monthly. We also own non-controlling interests in joint ventures that are not consolidated and that are accounted for under the equity
method. The portion of the mortgage and other debt of these joint ventures attributable to us, based on our ownership percentage thereof, was $240 million at December 31, 2024. The debt of our unconsolidated joint ventures is non-recourse to us.
Distributions/Dividends. Host Inc.’s policy on common dividends generally is to distribute, over time, at least 100% of its taxable income, which primarily is dependent on our results of operations, as well as on tax gains and losses on hotel sales. For the fourth quarter of 2024, Host Inc. paid a regular quarterly cash dividend of $0.20 per share and a special dividend of $0.10 per share on its common stock on January 15, 2025 to stockholders of record as of December 31, 2024. Any future dividend will be subject to approval by Host Inc.’s Board of Directors.
Funds used by Host Inc. to pay dividends are provided by distributions from Host L.P. As of December 31, 2024, Host Inc. is the owner of approximately 99% of Host L.P.’s common OP units. The remaining common OP units are owned by various unaffiliated limited partners. Each OP unit may be offered for redemption by the limited partners for cash or, at the election of Host Inc., Host Inc. common stock based on the then current conversion ratio. The current conversion ratio is 1.021494 shares of Host Inc. common stock for each OP unit.
Investors should consider the 1% non-controlling position of Host L.P. OP units when analyzing dividend payments by Host Inc. to its stockholders, as these holders of OP units share, on a pro rata basis, in amounts being distributed by Host L.P. to holders of its OP units. For example, if Host Inc. paid a $1 per share dividend on its common stock, it would be based on the payment of a $1.021494 per common OP unit distribution by Host L.P. to Host Inc., as well as to the other common OP unitholders.
Counterparty Credit Risk. We are subject to counterparty credit risk, which relates to the ability of counterparties to meet their contractual payment obligations or the potential non-performance of counterparties to deliver contracted commodities or services at the contracted price. We assess the ability of our counterparties to fulfill their obligations to determine the impact, if any, of counterparty bankruptcy or insolvency on our financial condition. We are exposed to credit risk with respect to cash held at various financial institutions and access to our credit facility. We believe our credit exposure in each of these cases is limited, as the credit risk is spread among a diversified group of investment grade financial institutions.
Critical Accounting Estimates
Our consolidated financial statements have been prepared in conformity with U.S. GAAP, which requires management to make estimates and assumptions that affect the reported amount of assets and liabilities at the date of our financial statements and the reported amounts of revenues and expenses during the reporting period. While we do not believe the reported amounts would be materially different, application of these policies involves the exercise of judgment and the use of assumptions as to future uncertainties and, as a result, actual results could differ from these estimates. We evaluate our estimates and judgments, including those related to the impairment of long-lived assets, on an ongoing basis. We base our estimates on experience and on various other assumptions that are believed to be reasonable under the circumstances. All our significant accounting policies are disclosed in the notes to our consolidated financial statements. For a detailed discussion of the critical accounting policies related to impairment testing on our property and equipment and valuation of acquisitions, which require us to exercise our business judgment or make significant estimates, see “Item 8. Financial Statements and Supplementary Data – Note 1. Summary of Significant Accounting Policies”.
Comparable Hotel Operating Statistics and Results
To facilitate a year-to-year comparison of our operations, we present certain operating statistics (i.e., Total RevPAR, RevPAR, average daily rate and average occupancy) and operating results (revenues, expenses, hotel EBITDA and associated margins) for the periods included in our reports on a comparable hotel basis in order to enable our investors to better evaluate our operating performance. We define our comparable hotels as those that: (i) are owned or leased by us as of the reporting date and are not classified as held-for-sale; and (ii) have not sustained substantial property damage or business interruption, or undergone large-scale capital projects, in each case requiring closures lasting one month or longer (as further defined below), during the reporting periods being compared.
We make adjustments to include recent acquisitions to include results for periods prior to our ownership. For these hotels, since the year-over-year comparison includes periods prior to our ownership, the changes will not necessarily correspond to changes in our actual results. Additionally, operating results of hotels that we sell are excluded from the comparable hotel set once the transaction has closed or the hotel is classified as held-for-sale.
The hotel business is capital-intensive and renovations are a regular part of the business. Generally, hotels under renovation remain comparable hotels. A large-scale capital project would cause a hotel to be excluded from our comparable hotel set if it requires the entire property to be closed to hotel guests for one month or longer.
Similarly, hotels are excluded from our comparable hotel set from the date that they sustain substantial property damage or business interruption if it requires the property to be closed to hotel guests for one month or longer. In each case, these hotels are returned to the comparable hotel set when the operations of the hotel have been included in our consolidated results for one full calendar year after the hotel has reopened. Often, related to events that cause property damage and the closure of a hotel, we will collect business interruption insurance proceeds for the near-term loss of business. These proceeds are included in net gain on insurance settlements on our consolidated statements of operations. Business interruption insurance gains covering lost revenues while the property was considered non-comparable also will be excluded from the comparable hotel results.
Of the 81 hotels that we owned as of December 31, 2024, 78 have been classified as comparable hotels. The operating results of the following properties that we owned as of December 31, 2024 are excluded from comparable hotel results for these periods:
•The Don CeSar (business disruption due to Hurricane Helene resulting in closure of the hotel beginning at the end of September 2024);
•Alila Ventana Big Sur (business disruption due to the collapse of a portion of Highway 1, causing closure of the hotel beginning in March 2024, reopened in May 2024);
•The Ritz-Carlton, Naples (business disruption due to Hurricane Ian beginning in September 2022, reopened in July 2023); and
•Sales and marketing expenses related to the development and sale of condominium units on a development parcel adjacent to Four Seasons Resort Orlando at Walt Disney World® Resort.
Foreign Currency Translation
Operating results denominated in foreign currencies are translated using the prevailing exchange rates on the date of the transaction, or monthly based on the weighted average exchange rate for the period. Therefore, hotel statistics and results for non-U.S. properties include the effect of currency fluctuations, consistent with our financial statement presentation.
Non-GAAP Financial Measures
We use certain “non-GAAP financial measures,” which are measures of our historical financial performance that are not calculated and presented in accordance with GAAP, within the meaning of applicable SEC rules. These measures are as follows: (i) EBITDA, EBITDAre and Adjusted EBITDAre as a measure of performance for Host Inc. and Host L.P., (ii) Funds From Operations (“FFO”) and FFO per diluted share (both NAREIT and Adjusted), as a measure of performance for Host Inc., and (iii) comparable hotel operating results, as a measure of performance for Host Inc. and Host L.P.
We calculate EBITDAre and NAREIT FFO per diluted share in accordance with standards established by NAREIT, which may not be comparable to measures calculated by other companies that do not use the NAREIT definition of EBITDAre and FFO or do not calculate FFO per diluted share in accordance with NAREIT guidance. In addition, although EBITDAre and FFO per diluted share are useful measures when comparing our results to other REITs, they may not be helpful to investors when comparing us to non-REITs. We also calculate Adjusted FFO per diluted share and Adjusted EBITDAre, which measures are not in accordance with NAREIT guidance and may not be comparable to measures calculated by other REITs or by other companies. This information should not be considered as an alternative to net income, operating profit, cash from operations or any other operating performance measure calculated in accordance with GAAP. Cash expenditures for various long-term assets (such as renewal and replacement capital expenditures), interest expense (for EBITDA, EBITDAre, and Adjusted EBITDAre purposes only) severance expense related to significant property-level reconfiguration and other items have been, and will be, made and are not reflected in the EBITDA, EBITDAre, Adjusted EBITDAre, NAREIT FFO per diluted share and Adjusted FFO per diluted share presentations. Management compensates for these limitations by separately considering the impact of these excluded items to the extent they are material to operating decisions or assessments of our operating performance. Our consolidated statements of operations and consolidated statements of cash flows include interest expense, capital expenditures, and other excluded items, all of which should be considered when evaluating our performance, as well as the usefulness of our non-GAAP financial measures. Additionally, NAREIT FFO per diluted share, Adjusted FFO per diluted share, EBITDA,
EBITDAre and Adjusted EBITDAre should not be considered as measures of our liquidity or indicative of funds available to fund our cash needs, including our ability to make cash distributions. In addition, NAREIT FFO per diluted share and Adjusted FFO per diluted share do not measure, and should not be used as measures of, amounts that accrue directly to stockholders’ benefit.
Similarly, EBITDAre, Adjusted EBITDAre, NAREIT FFO and Adjusted FFO per diluted share include adjustments for the pro rata share of our equity investments and NAREIT FFO and Adjusted FFO include adjustments for non-controlling partners in consolidated partnerships. Our equity investments consist of interests ranging from 11% to 67% in eight domestic and international partnerships that own a total of 40 properties and a vacation ownership development. Due to the voting rights of the outside owners, we do not control and, therefore, do not consolidate these entities. The non-controlling partners in consolidated partnerships primarily consist of the approximate 1% interest in Host L.P. held by unaffiliated limited partners and a 15% interest held by an unaffiliated limited partner in one hotel for which we do control the entity and, therefore, consolidate its operations. These pro rata results for NAREIT FFO and Adjusted FFO per diluted share, EBITDAre and Adjusted EBITDAre are calculated as set forth below. Readers should be cautioned that the pro rata results presented in these measures for consolidated partnerships (for NAREIT FFO and Adjusted FFO per diluted share) and equity investments may not accurately depict the legal and economic consequences of our investments in these entities. The following discussion defines these terms and presents why we believe they are useful measures of our performance.
EBITDA, EBITDAre and Adjusted EBITDAre
EBITDA
Earnings before Interest Expense, Income Taxes, Depreciation and Amortization (“EBITDA”) is a commonly used measure of performance in many industries. Management believes EBITDA provides useful information to investors regarding our results of operations because it helps us and our investors evaluate the ongoing operating performance of our properties after removing the impact of our capital structure (primarily interest expense) and our asset base (primarily depreciation and amortization). Management also believes the use of EBITDA facilitates comparisons between us and other lodging REITs, hotel owners that are not REITs and other capital-intensive companies. Management uses EBITDA to evaluate property-level results and as one measure in determining the value of acquisitions and dispositions and, like FFO and Adjusted FFO per diluted share, it is widely used by management in the annual budget process and for compensation programs.
EBITDAre and Adjusted EBITDAre
We present EBITDAre in accordance with NAREIT guidelines, as defined in its September 2017 white paper “Earnings Before Interest, Taxes, Depreciation and Amortization for Real Estate,” to provide an additional performance measure to facilitate the evaluation and comparison of our results with other REITs. NAREIT defines EBITDAre as net income (calculated in accordance with GAAP) excluding interest expense, income tax, depreciation and amortization, gains or losses on disposition of depreciated property (including gains or losses on change of control), impairment expense for depreciated property and of investments in unconsolidated affiliates caused by a decrease in value of depreciated property in the affiliate, and adjustments to reflect the entity’s pro rata share of EBITDAre of unconsolidated affiliates.
We make additional adjustments to EBITDAre when evaluating our performance because we believe that the exclusion of certain additional items described below provides useful supplemental information to investors regarding our ongoing operating performance. We believe that the presentation of Adjusted EBITDAre, when combined with the primary GAAP presentation of net income, is beneficial to an investor’s understanding of our operating performance. Adjusted EBITDAre also is similar to the measure used to calculate certain credit ratios for our credit facility and senior notes. We adjust EBITDAre for the following items, which may occur in any period, and refer to this measure as Adjusted EBITDAre:
•Property Insurance Gains and Property Damage Losses – We exclude the effect of property insurance gains reflected in our consolidated statements of operations because we believe that including them in Adjusted EBITDAre is not consistent with reflecting the ongoing performance of our assets. In addition, property insurance gains could be less important to investors given that the depreciated asset book value written off in connection with the calculation of the property insurance gain often does not reflect the market value of real estate assets. Similarly, losses from property damage or remediation costs that are not covered through insurance are excluded.
•Acquisition Costs – Under GAAP, costs associated with completed property acquisitions that are considered business combinations are expensed in the year incurred. We exclude the effect of these costs because we believe they are not reflective of the ongoing performance of the Company.
•Litigation Gains and Losses – We exclude the effect of gains or losses associated with litigation recorded under GAAP that we consider outside the ordinary course of business. We believe that including these items is not consistent with our ongoing operating performance.
•Severance Expense – In certain circumstances, we will add back hotel-level severance expenses when we do not believe that such expenses are reflective of the ongoing operation of our properties. Situations that would result in a severance add-back include, but are not limited to: (i) costs incurred as part of a broad-based reconfiguration of the operating model with the specific hotel operator for a portfolio of hotels and (ii) costs incurred at a specific hotel due to a broad-based and significant reconfiguration of a hotel and/or its workforce. We do not add back corporate-level severance costs or severance costs at an individual hotel that we consider to be incurred in the normal course of business.
•Effective January 1, 2025, we will exclude the expense recorded for non-cash stock-based compensation, as it represents a non-cash transaction and the add back is consistent with the calculation of Adjusted EBITDA for our financial covenant ratios under our credit facility and senior notes indentures and consistent with the presentation of Adjusted EBITDAre for the majority of other lodging REIT filers. In 2024, this amount totaled $24 million.
In unusual circumstances, we also may adjust EBITDAre for gains or losses that management believes are not representative of the Company’s current operating performance. The last adjustment of this nature was a 2013 exclusion of a gain from an eminent domain claim.
The following table provides a reconciliation of EBITDA, EBITDAre, and Adjusted EBITDAre to net income, the financial measure calculated and presented in accordance with GAAP that we consider the most directly comparable:
Reconciliation of Net Income to EBITDA, EBITDAre and Adjusted EBITDAre for Host Inc. and Host L.P.
(in millions)
| | | | | | | | | | | |
| Year ended December 31, |
| 2024 | | 2023 |
| Net income⁽¹⁾ | $ | 707 | | | $ | 752 | |
| Interest expense | 215 | | | 191 | |
| Depreciation and amortization | 762 | | | 697 | |
| Income taxes | 14 | | | 36 | |
| EBITDA⁽¹⁾ | 1,698 | | | 1,676 | |
| Gain on dispositions⁽²⁾ | — | | | (70) | |
| Equity investment adjustments: | | | |
| Equity in earnings of affiliates | (7) | | | (6) | |
| Pro rata EBITDAre of equity investments⁽³⁾ | 35 | | | 32 | |
| EBITDAre⁽¹⁾ | 1,726 | | | 1,632 | |
Adjustments to EBITDAre: | | | |
| Net gain on property insurance settlements | (70) | | | (3) | |
| Adjusted EBITDAre⁽¹⁾ | $ | 1,656 | | | $ | 1,629 | |
___________
(1)Net income, EBITDA, EBITDAre, Adjusted EBITDAre, NAREIT FFO and Adjusted FFO for the year ended December 31, 2024 include a loss of $6 million related to inventory impairment expense recorded by our Maui timeshare joint venture, reflected through equity in earnings of affiliates.
(2)Reflects the sale of one hotel in 2023.
(3)Unrealized gains of our unconsolidated investments are not recognized in our EBITDAre, Adjusted EBITDAre, NAREIT FFO or Adjusted FFO until they have been realized by the unconsolidated partnership.
FFO Measures
We present NAREIT FFO and NAREIT FFO per diluted share as non-GAAP measures of our performance in addition to our earnings per share (calculated in accordance with GAAP). We calculate NAREIT FFO per diluted share as our NAREIT FFO (defined as set forth below) for a given operating period, as adjusted for the effect of dilutive securities, divided by the number of fully diluted shares outstanding during such period in accordance with NAREIT guidelines. As noted in NAREIT’s Funds From Operations White Paper – 2018 Restatement, NAREIT defines FFO as net income (calculated in accordance with GAAP) excluding depreciation and amortization related to certain real estate assets, gains and losses from the sale of certain real estate assets, gains and losses from change in control, impairment expense of certain real estate assets and investments and adjustments for consolidated partially-owned entities and unconsolidated affiliates. Adjustments for consolidated partially-owned entities and unconsolidated affiliates are calculated to reflect our pro rata share of the FFO of those entities on the same basis.
We believe that NAREIT FFO per diluted share is a useful supplemental measure of our operating performance and that the presentation of NAREIT FFO per diluted share, when combined with the primary GAAP presentation of earnings per share, provides beneficial information to investors. By excluding the effect of real estate depreciation, amortization, impairment expense and gains and losses from sales of depreciable real estate, all of which are based on historical cost accounting and which may be of lesser significance in evaluating current performance, we believe such measures can facilitate comparisons of operating performance between periods and with other REITs, even though NAREIT FFO per diluted share does not represent an amount that accrues directly to holders of our common stock. Historical cost accounting for real estate assets implicitly assumes that the value of real estate assets diminishes predictably over time. As noted by NAREIT in its Funds From Operations White Paper – 2018 Restatement, the primary purpose for including FFO as a supplemental measure of operating performance of a REIT is to address the artificial nature of historical cost depreciation and amortization of real estate and real estate-related assets mandated by GAAP. For these reasons, NAREIT adopted the FFO metric in order to promote a uniform industry-wide measure of REIT operating performance.
We also present Adjusted FFO per diluted share when evaluating our performance because management believes that the exclusion of certain additional items described below provides useful supplemental information to investors regarding our ongoing operating performance. Management historically has made the adjustments detailed below in evaluating our performance, in our annual budget process and for our compensation programs. We believe that the presentation of Adjusted FFO per diluted share, when combined with both the primary GAAP presentation of earnings per share and FFO per diluted share as defined by NAREIT, provides useful supplemental information that is beneficial to an investor’s understanding of our operating performance. We adjust NAREIT FFO per diluted share for the following items, which may occur in any period, and refer to this measure as Adjusted FFO per diluted share:
•Gains and Losses on the Extinguishment of Debt – We exclude the effect of finance charges and premiums associated with the extinguishment of debt, including the acceleration of the write-off of deferred financing costs from the original issuance of the debt being redeemed or retired and incremental interest expense incurred during the refinancing period. We also exclude the gains on debt repurchases and the original issuance costs associated with the retirement of preferred stock. We believe that these items are not reflective of our ongoing finance costs.
•Acquisition Costs –Under GAAP, costs associated with completed property acquisitions that are considered business combinations are expensed in the year incurred. We exclude the effect of these costs because we believe they are not reflective of the ongoing performance of the Company.
•Litigation Gains and Losses – We exclude the effect of gains or losses associated with litigation recorded under GAAP that we consider to be outside the ordinary course of business. We believe that including these items is not consistent with our ongoing operating performance.
•Severance Expense – In certain circumstances, we will add back hotel-level severance expenses when we do not believe that such expenses are reflective of the ongoing operation of our properties. Situations that would result in a severance add back include, but are not limited to: (i) costs incurred as part of a broad-based reconfiguration of the operating model with the specific hotel operator for a portfolio of hotels and (ii) costs incurred at a specific hotel due to a broad-based and significant reconfiguration of a hotel and/or its workforce. We do not add back corporate-level severance costs or severance costs at an individual hotel that we consider to be incurred in the normal course of business.
•Effective January 1, 2025, we will exclude the expense recorded for non-cash stock-based compensation, as it represents a non-cash transaction and the add back is consistent with the calculation
of Adjusted EBITDA for our financial covenant ratios under our credit facility and senior notes indentures and consistent with the presentation of Adjusted FFO per diluted share for the majority of other lodging REIT filers. In 2024, this amount totaled $24 million.
In unusual circumstances, we also may adjust NAREIT FFO for gains or losses that management believes are not representative of our current operating performance. For example, in 2017, as a result of the reduction of the U.S. federal corporate income tax rate from 35% to 21% by the Tax Cuts and Jobs Act, we remeasured our domestic deferred tax assets as of December 31, 2017 and recorded a one-time adjustment to reduce our deferred tax assets and increase the provision for income taxes by approximately $11 million. We do not consider this adjustment to be reflective of our ongoing operating performance and, therefore, we excluded this item from Adjusted FFO.
The following table provides a reconciliation of the differences between our non-GAAP financial measures, NAREIT FFO and Adjusted FFO (separately and on a per diluted share basis), and net income, the financial measure calculated and presented in accordance with GAAP that we consider most directly comparable:
Host Inc. Reconciliation of Diluted Earnings per Common Share to
NAREIT and Adjusted Funds From Operations per Diluted Share
(in millions, except per share amount)
| | | | | | | | | | | |
| Year ended December 31, |
| 2024 | | 2023 |
| Net income⁽¹⁾ | $ | 707 | | | $ | 752 | |
| Less: Net income attributable to non-controlling interests | (10) | | | (12) | |
| Net income attributable to Host Inc. | 697 | | | 740 | |
| Adjustments: | | | |
| Gain on dispositions⁽²⁾ | — | | | (70) | |
| Net gain on property insurance settlements | (70) | | | (3) | |
| Depreciation and amortization | 760 | | | 695 | |
| Equity investment adjustments: | | | |
| Equity in earnings of affiliates | (7) | | | (6) | |
| Pro rata FFO of equity investments⁽³⁾ | 17 | | | 20 | |
| Consolidated partnership adjustments: | | | |
| FFO adjustments for non-controlling partnerships | (1) | | | (1) | |
| FFO adjustments for non-controlling interests of Host L.P. | (9) | | | (9) | |
| NAREIT FFO⁽¹⁾ | 1,387 | | | 1,366 | |
| Adjustments to NAREIT FFO: | | | |
| Loss on debt extinguishment | — | | | 4 | |
| Adjusted FFO⁽¹⁾ | $ | 1,387 | | | $ | 1,370 | |
| | | |
For calculation on a per share basis:⁽4⁾ | | | |
| | | |
| | | |
| | | |
| Diluted weighted average shares outstanding - EPS, NAREIT FFO and Adjusted FFO | 704.0 | | | 712.8 | |
| Diluted earnings per common share | $ | 0.99 | | | $ | 1.04 | |
| NAREIT FFO per diluted share | $ | 1.97 | | | $ | 1.92 | |
| Adjusted FFO per diluted share | $ | 1.97 | | | $ | 1.92 | |
\__________
(1-3)Refer to the corresponding footnote on the Reconciliation of Net Income to EBITDA, EBITDAre and Adjusted EBITDAre for Host Inc. and Host L.P.
(4)Diluted earnings per common share, NAREIT FFO per diluted share and Adjusted FFO per diluted share are adjusted for the effects of dilutive securities. Dilutive securities may include shares granted under comprehensive stock plans, preferred OP units held by non-controlling limited partners and other non-controlling interests that have the option to convert their limited partner interests to common OP units. No effect is shown for securities if they are anti-dilutive.
Comparable Hotel Property Level Operating Results
We present certain operating results for our hotels, such as hotel revenues, expenses, food and beverage profit, and EBITDA (and the related margins), on a comparable hotel, or "same store," basis as supplemental information for our investors. Our comparable hotel results present operating results for our hotels without giving effect to dispositions or properties that experienced closures due to renovations or property damage, as discussed in “Comparable Hotel Operating Statistics and Results” above. We present comparable hotel EBITDA to help us and our investors evaluate the ongoing operating performance of our comparable hotels after removing the impact of our capital structure (primarily interest expense) and our asset base (primarily depreciation and amortization expense). Corporate-level costs and expenses also are removed to arrive at property-level results. We believe these property-level results provide investors with supplemental information about the ongoing operating performance of our comparable hotels. Comparable hotel results are presented both by location and for our properties in the aggregate. We eliminate from our comparable hotel level operating results severance costs related to broad-based and significant property-level reconfiguration that is not considered to be within the normal course of business, as we believe this elimination provides useful supplemental information that is beneficial to an investor’s understanding of our ongoing operating performance. We also eliminate depreciation and amortization expense because, even though depreciation and amortization expense are property-level expenses, these non-cash expenses, which are based on historical cost accounting for real estate assets, implicitly assume that the value of real estate assets diminishes predictably over time. As noted earlier, because real estate values historically have risen or fallen with market conditions, many real estate industry investors have considered presentation of historical cost accounting for operating results to be insufficient.
Because of the elimination of corporate-level costs and expenses, gains or losses on disposition, certain severance expenses and depreciation and amortization expense, the comparable hotel operating results we present do not represent our total revenues, expenses, operating profit or net income and should not be used to evaluate our performance as a whole. Management compensates for these limitations by separately considering the impact of these excluded items to the extent they are material to operating decisions or assessments of our operating performance. Our consolidated statements of operations include such amounts, all of which should be considered by investors when evaluating our performance.
We present these hotel operating results on a comparable hotel basis because we believe that doing so provides investors and management with useful information for evaluating the period-to-period performance of our hotels and facilitates comparisons with other hotel REITs and hotel owners. In particular, these measures assist management and investors in distinguishing whether increases or decreases in revenues and/or expenses are due to growth or decline of operations at comparable hotels (which represent the vast majority of our portfolio) or from other factors. While management believes that presentation of comparable hotel results is a supplemental measure that provides useful information in evaluating our ongoing performance, this measure is not used to allocate resources or to assess the operating performance of each of our hotels, as these decisions are based on data for individual hotels and are not based on comparable hotel results in the aggregate. For these reasons, we believe comparable hotel operating results, when combined with the presentation of GAAP operating profit, revenues and expenses, provide useful information to investors and management.
The following table presents certain operating results and statistics for our comparable hotel results for the periods presented herein:
Comparable Hotel Results for Host Inc. and Host L.P.
(in millions, except hotel statistics)
| | | | | | | | | | | |
| Year ended December 31, |
| 2024 | | 2023 |
| Number of hotels | 78 | | 78 |
| Number of rooms | 42,508 | | 42,508 |
| Change in comparable hotel Total RevPAR | 2.1 | % | | — | |
| Change in comparable hotel RevPAR | 0.9 | % | | — | |
| Operating profit margin⁽¹⁾ | 15.4 | % | | 15.6 | % |
| Comparable hotel EBITDA margin⁽¹⁾ | 29.2 | % | | 29.8 | % |
| Food and beverage profit margin⁽¹⁾ | 33.7 | % | | 34.1 | % |
| Comparable hotel food and beverage profit margin⁽¹⁾ | 33.7 | % | | 33.9 | % |
| | | |
| Net income | $ | 707 | | | $ | 752 | |
| Depreciation and amortization | 762 | | | 697 | |
| Interest expense | 215 | | | 191 | |
| Benefit (provision) for income taxes | 14 | | | 36 | |
| Gain on sale of property and corporate level income/expense | (8) | | | (23) | |
| Property transaction adjustments⁽²⁾ | 42 | | | 87 | |
| Non-comparable hotel results, net⁽³⁾ | (110) | | | (123) | |
| Comparable hotel EBITDA | $ | 1,622 | | | $ | 1,617 | |
___________
(1)Profit margins are calculated by dividing the applicable operating profit by the related revenue amount. GAAP profit margins are calculated using amounts presented in the consolidated statements of operations. Comparable hotel margins are calculated using amounts presented in the following tables, which include reconciliations to the applicable GAAP results:
| | | | | | | | | | | | | | | | | | | | | | | | | | | | | | | | | | | | | | | | | | | | | | | | | | | | | | | | | | | |
| Year ended December 31, 2024 | | Year ended December 31, 2023 |
| | | Adjustments | | | | | | Adjustments | | |
| GAAP Results | | Property transaction
adjustments⁽²⁾ | | Non-comparable hotel
results, net ⁽³⁾ | | Depreciation and corporate
level items | | Comparable hotel Results | | GAAP Results | | Property transaction
adjustments⁽²⁾ | | Non-comparable hotel
results, net ⁽³⁾ | | Depreciation and corporate
level items | | Comparable hotel Results |
| Revenues | | | | | | | | | | | | | | | | | | | |
| Room | $ | 3,426 | | | $ | 93 | | | $ | (152) | | | $ | — | | | $ | 3,367 | | | $ | 3,244 | | | $ | 186 | | | $ | (103) | | | $ | — | | | $ | 3,327 | |
| Food and beverage | 1,716 | | | 39 | | | (108) | | | — | | | 1,647 | | | 1,582 | | | 73 | | | (65) | | | — | | | 1,590 | |
| Other | 542 | | | 22 | | | (32) | | | — | | | 532 | | | 485 | | | 40 | | | (24) | | | — | | | 501 | |
| Total revenues | 5,684 | | | 154 | | | (292) | | | — | | | 5,546 | | | 5,311 | | | 299 | | | (192) | | | — | | | 5,418 | |
| Expenses | | | | | | | | | | | | | | | | | | | |
| Room | 849 | | | 23 | | | (29) | | | — | | | 843 | | | 787 | | | 44 | | | (21) | | | — | | | 810 | |
| Food and beverage | 1,137 | | | 32 | | | (76) | | | — | | | 1,093 | | | 1,042 | | | 59 | | | (49) | | | — | | | 1,052 | |
| Other | 2,048 | | | 57 | | | (96) | | | — | | | 2,009 | | | 1,912 | | | 109 | | | (74) | | | — | | | 1,947 | |
| Depreciation and amortization | 762 | | | — | | | — | | | (762) | | | — | | | 697 | | | — | | | — | | | (697) | | | — | |
| Corporate and other expenses | 123 | | | — | | | — | | | (123) | | | — | | | 132 | | | — | | | — | | | (132) | | | — | |
| Net gain on insurance settlements | (110) | | | — | | | 19 | | | 70 | | | (21) | | | (86) | | | — | | | 75 | | | 3 | | | (8) | |
| Total expenses | 4,809 | | | 112 | | | (182) | | | (815) | | | 3,924 | | | 4,484 | | | 212 | | | (69) | | | (826) | | | 3,801 | |
| Operating Profit - Comparable hotel EBITDA | $ | 875 | | | $ | 42 | | | $ | (110) | | | $ | 815 | | | $ | 1,622 | | | $ | 827 | | | $ | 87 | | | $ | (123) | | | $ | 826 | | | $ | 1,617 | |
(2) Property transaction adjustments represent the following items: (i) the elimination of results of operations of hotels sold or held-for-sale as of December 31, 2024, which operations are included in our consolidated statements of operations as continuing operations, and (ii) the addition of results for periods prior to our ownership for hotels acquired as of December 31, 2024.
(3) Non-comparable hotel results, net, includes the following items: (i) the results of operations of our non-comparable hotels, which operations are included in our consolidated statements of operations as continuing operations, and (ii) gains on business interruption proceeds covering lost revenues while the property was considered non-comparable.
Item 7A. Quantitative and Qualitative Disclosures about Market Risk
All information in this section applies to both Host Inc. and Host L.P.
Interest Rate Sensitivity
Our future income, cash flows and fair values with respect to financial instruments are dependent upon prevailing market interest rates. Market risk refers to the risk of loss from adverse changes in market prices and interest rates. We have no derivative financial instruments that are held for trading purposes. We use derivative financial instruments to manage, or hedge, interest rate risks. As of February 21, 2025, we do not have any interest rate derivatives outstanding.
The interest payments on 80% of our debt are fixed in nature. Valuations for mortgage debt and the credit facility are determined based on expected future payments, discounted at risk-adjusted rates. The senior notes are valued based on quoted market prices. If market rates of interest on our variable rate debt increase or decrease by 100 basis points, interest expense would increase or decrease, respectively, our earnings and cash flows by approximately $10 million in 2025. The table below presents scheduled maturities and related weighted average interest rates by expected maturity dates (in millions, except percentages):
| | | | | | | | | | | | | | | | | | | | | | | | | | | | | | | | | | | | | | | | | | | | | | | |
| Expected Maturity Date | | | | |
| 2025 | | 2026 | | 2027 | | 2028 | | 2029 | | Thereafter | | Total | | Fair Value |
| Liabilities | | | | | | | | | | | | | | | |
| Debt: | | | | | | | | | | | | | | | |
Fixed rate ⁽¹⁾ | $ | 495 | | | $ | 396 | | | $ | 85 | | | $ | (7) | | | $ | 643 | | | $ | 2,479 | | | $ | 4,091 | | | $ | 3,929 | |
| Average interest rate | 4.6 | % | | 4.6 | % | | 4.6 | % | | 4.6 | % | | 4.6 | % | | 4.9 | % | | | | |
| | | | | | | | | | | | | | | |
Variable rate ⁽¹⁾ | $ | (4) | | | $ | (4) | | | $ | 500 | | | $ | 500 | | | $ | — | | | $ | — | | | $ | 992 | | | $ | 1,000 | |
Average interest rate ⁽²⁾ | 5.3 | % | | 5.3 | % | | 5.3 | % | | 5.3 | % | | — | % | | — | % | | | | |
| Total debt | | | | | | | | | | | | | $ | 5,083 | | | $ | 4,929 | |
___________
(1)The amounts are net of unamortized discounts, premiums and deferred financing costs; therefore, negative amounts prior to maturity represent the amortization of original issue discounts and deferred financing costs.
(2)The interest rate for our floating rate payments is based on the rate in effect as of December 31, 2024. No adjustments are made for forecast changes in the rate.
Exchange Rate Sensitivity
We have currency exchange risk because of our hotel ownership in Brazil and Canada and our minority investment in a joint venture in India. We may utilize several strategies to mitigate the exposure of currency exchange risk for our portfolio, including (i) utilizing local currency denominated debt (including foreign currency draws on our credit facility), (ii) entering into forward or option foreign currency purchase contracts, or (iii) investing through partnership and joint venture structures. For 2024 and 2023, revenues from our consolidated foreign operations were $101 million and $92 million, respectively, or approximately 2%, of our total revenues.
In the third quarter of 2024, three foreign currency forward purchase contracts matured, with a total notional amount of CAD 99 million ($74 million), and we received $1.4 million in the aggregate upon settlement of these contracts. In replacement of the maturing contracts, we entered into two new foreign currency forward purchase contracts with the same total notional amount of CAD 99 million ($73 million), which will mature in August 2025. The foreign currency exchange agreements into which we have entered strictly are to hedge foreign currency risk and are not for trading purposes. As of December 31, 2024, the fair value of these contracts was $3.3 million. These contracts are marked-to-market with changes in fair value recorded to other comprehensive income (loss) for contracts designated as a hedge of a net investment in a foreign operation, and through net income for contracts acting as a natural hedge of intercompany
loans. The foreign currency forward sale contracts are valued based on the forward yield curve of the foreign currency to U.S. dollar forward exchange rate on the date of measurement. Pursuant to these contracts, we will sell the foreign currency amount, as applicable, and receive the U.S. dollar amount on the forward sale date. We also evaluate counterparty credit risk when we calculate the fair value of the derivatives.
Item 8. Financial Statements and Supplementary Data
The following financial information is included on the pages indicated:
Host Hotels & Resorts, Inc. & Host Hotels & Resorts, L.P.
| | | | | |
| Page |
| |
| |
| Financial Statements of Host Hotels & Resorts, Inc.: | |
| |
| |
| |
| |
| |
| Financial Statements of Host Hotels & Resorts, L.P.: | |
| |
| |
| |
| |
| |
| |
Report of Independent Registered Public Accounting Firm
To the Stockholders and Board of Directors
Host Hotels & Resorts, Inc.:
Opinion on the Consolidated Financial Statements
We have audited the accompanying consolidated balance sheets of Host Hotels & Resorts, Inc. and subsidiaries (the Company) as of December 31, 2024 and 2023, the related consolidated statements of operations, comprehensive income, equity, and cash flows for each of the years in the three-year period ended December 31, 2024, and the related notes and financial statement schedule III (collectively, the consolidated financial statements). In our opinion, the consolidated financial statements present fairly, in all material respects, the financial position of the Company as of December 31, 2024 and 2023, and the results of its operations and its cash flows for each of the years in the three-year period ended December 31, 2024, in conformity with U.S. generally accepted accounting principles.
We also have audited, in accordance with the standards of the Public Company Accounting Oversight Board (United States) (PCAOB), the Company’s internal control over financial reporting as of December 31, 2024, based on criteria established in Internal Control – Integrated Framework (2013) issued by the Committee of Sponsoring Organizations of the Treadway Commission, and our report dated February 26, 2025 expressed an unqualified opinion on the effectiveness of the Company’s internal control over financial reporting.
Basis for Opinion
These consolidated financial statements are the responsibility of the Company’s management. Our responsibility is to express an opinion on these consolidated financial statements based on our audits. We are a public accounting firm registered with the PCAOB and are required to be independent with respect to the Company in accordance with the U.S. federal securities laws and the applicable rules and regulations of the Securities and Exchange Commission and the PCAOB.
We conducted our audits in accordance with the standards of the PCAOB. Those standards require that we plan and perform the audit to obtain reasonable assurance about whether the consolidated financial statements are free of material misstatement, whether due to error or fraud. Our audits included performing procedures to assess the risks of material misstatement of the consolidated financial statements, whether due to error or fraud, and performing procedures that respond to those risks. Such procedures included examining, on a test basis, evidence regarding the amounts and disclosures in the consolidated financial statements. Our audits also included evaluating the accounting principles used and significant estimates made by management, as well as evaluating the overall presentation of the consolidated financial statements. We believe that our audits provide a reasonable basis for our opinion.
Critical Audit Matters
The critical audit matters communicated below are matters arising from the current period audit of the consolidated financial statements that were communicated or required to be communicated to the audit committee and that: (1) relate to accounts or disclosures that are material to the consolidated financial statements and (2) involved our especially challenging, subjective, or complex judgments. The communication of critical audit matters does not alter in any way our opinion on the consolidated financial statements, taken as a whole, and we are not, by communicating the critical audit matters below, providing separate opinions on the critical audit matters or on the accounts or disclosures to which they relate.
Evaluation of hotel properties for impairment
As discussed in Notes 1 and 3 to the consolidated financial statements, property and equipment, less accumulated depreciation and amortization as of December 31, 2024, was $10,906 million. The Company assesses its property and equipment, primarily comprised of hotel properties, for impairment when events or changes in circumstances occur that indicate the carrying value may not be recoverable. If such events or changes in circumstances are identified, the Company performs a recoverability analysis to compare the carrying amount of the hotel property to its expected undiscounted future cash flows over its remaining useful life.
We identified the evaluation of hotel properties for impairment as a critical audit matter. Subjective auditor judgment was required to assess the events or changes in circumstances that the Company used to evaluate its expected hold period. In addition, subjective auditor judgment was required to evaluate the key assumptions used by the Company in the recoverability analysis for a certain hotel property. The key assumptions included the undiscounted future cash flows and
the expected hold period of this hotel property. Additionally, the audit effort associated with the evaluation of the undiscounted future cash flows for this hotel property required specialized skills and knowledge.
The following are the primary procedures we performed to address this critical audit matter. We evaluated the design and tested the operating effectiveness of certain internal controls over the impairment process. This included controls over the identification and assessment of expected hold periods for certain hotel properties and over the undiscounted future cash flows used by the Company in the recoverability analysis for a certain hotel property. We evaluated the expected hold periods, by:
● inquiring of management and obtaining written representations regarding potential property disposal plans, if any
● reading minutes of the meetings of the Company’s board of directors
● inquiring about the Company’s plans with those in the organization who are responsible for, and have authority over, potential disposition activities
● comparing management’s assessment of properties with potential shortened expected hold periods to information obtained from those in the organization responsible for disposition activity, and
● inspecting listings from external sources of real estate properties for sale by the Company.
Evaluation of the fair value of land acquired in real estate asset acquisitions
As discussed in Notes 1 and 12 to the consolidated financial statements, the Company acquired the 1 Hotel Nashville and Embassy Suites by Hilton Nashville Downtown, 1 Hotel Central Park and Turtle Bay Resort for approximately $530 million, $265 million and $680 million, respectively, during the year ended December 31, 2024. The Company determined the acquisitions to be asset acquisitions and allocated the acquisition cost to the individual assets acquired based on their relative fair values as of the acquisition date.
We identified the evaluation of the fair value of land acquired in these real estate asset acquisitions as a critical audit matter. Subjective auditor judgment and specialized skills and knowledge were required to evaluate the Company’s key assumptions used in the determination of the fair value of land acquired in the real estate asset acquisitions. Specifically, the key assumptions used in such determinations included the identification and weighting of comparable market sales transactions.
The following are the primary procedures we performed to address this critical audit matter. We evaluated the design and tested the operating effectiveness of certain internal controls over the Company’s asset acquisition process, including controls related to the determination of the fair value of land acquired. This included controls related to the identification of the population of comparable market sales transactions and weighting of such transactions. We involved valuation professionals with specialized skills and knowledge, who assisted in:
•evaluating the Company’s identified comparable market sales transactions by comparing third-party evidence of comparable market sales transactions independently obtained from industry sources, including information about the transaction prices and features of the comparable market sales transactions and
•evaluating the weighting of comparable market sales transactions by assessing the characteristics of such transactions.
/s/ KPMG LLP
We have served as the Company’s auditor since 2002.
McLean, Virginia
February 26, 2025
Report of Independent Registered Public Accounting Firm
To the Stockholders and Board of Directors
Host Hotels & Resorts, Inc.:
Opinion on Internal Control Over Financial Reporting
We have audited Host Hotels & Resorts, Inc. and subsidiaries' (the Company) internal control over financial reporting as of December 31, 2024, based on criteria established in Internal Control – Integrated Framework (2013) issued by the Committee of Sponsoring Organizations of the Treadway Commission. In our opinion, the Company maintained, in all material respects, effective internal control over financial reporting as of December 31, 2024, based on criteria established in Internal Control – Integrated Framework (2013) issued by the Committee of Sponsoring Organizations of the Treadway Commission.
We also have audited, in accordance with the standards of the Public Company Accounting Oversight Board (United States) (PCAOB), the consolidated balance sheets of the Company as of December 31, 2024 and 2023, the related consolidated statements of operations, comprehensive income, equity, and cash flows for each of the years in the three-year period ended December 31, 2024, and the related notes and financial statement schedule III (collectively, the consolidated financial statements), and our report dated February 26, 2025 expressed an unqualified opinion on those consolidated financial statements.
Basis for Opinion
The Company’s management is responsible for maintaining effective internal control over financial reporting and for its assessment of the effectiveness of internal control over financial reporting, included in the accompanying Management's Report on Internal Control over Financial Reporting. Our responsibility is to express an opinion on the Company’s internal control over financial reporting based on our audit. We are a public accounting firm registered with the PCAOB and are required to be independent with respect to the Company in accordance with the U.S. federal securities laws and the applicable rules and regulations of the Securities and Exchange Commission and the PCAOB.
We conducted our audit in accordance with the standards of the PCAOB. Those standards require that we plan and perform the audit to obtain reasonable assurance about whether effective internal control over financial reporting was maintained in all material respects. Our audit of internal control over financial reporting included obtaining an understanding of internal control over financial reporting, assessing the risk that a material weakness exists, and testing and evaluating the design and operating effectiveness of internal control based on the assessed risk. Our audit also included performing such other procedures as we considered necessary in the circumstances. We believe that our audit provides a reasonable basis for our opinion.
Definition and Limitations of Internal Control Over Financial Reporting
A company’s internal control over financial reporting is a process designed to provide reasonable assurance regarding the reliability of financial reporting and the preparation of financial statements for external purposes in accordance with generally accepted accounting principles. A company’s internal control over financial reporting includes those policies and procedures that (1) pertain to the maintenance of records that, in reasonable detail, accurately and fairly reflect the transactions and dispositions of the assets of the company; (2) provide reasonable assurance that transactions are recorded as necessary to permit preparation of financial statements in accordance with generally accepted accounting principles, and that receipts and expenditures of the company are being made only in accordance with authorizations of management and directors of the company; and (3) provide reasonable assurance regarding prevention or timely detection of unauthorized acquisition, use, or disposition of the company’s assets that could have a material effect on the financial statements.
Because of its inherent limitations, internal control over financial reporting may not prevent or detect misstatements. Also, projections of any evaluation of effectiveness to future periods are subject to the risk that controls may become inadequate because of changes in conditions, or that the degree of compliance with the policies or procedures may deteriorate.
/s/ KPMG LLP
McLean, Virginia
February 26, 2025
Report of Independent Registered Public Accounting Firm
To the Partners of Host Hotels & Resorts, L.P. and Board of Directors of Host Hotels & Resorts, Inc.
Opinion on the Consolidated Financial Statements
We have audited the accompanying consolidated balance sheets of Host Hotels & Resorts, L.P. and subsidiaries (the Partnership) as of December 31, 2024 and 2023, the related consolidated statements of operations, comprehensive income, capital, and cash flows for each of the years in the three-year period ended December 31, 2024, and the related notes and financial statement schedule III (collectively, the consolidated financial statements). In our opinion, the consolidated financial statements present fairly, in all material respects, the financial position of the Partnership as of December 31, 2024 and 2023, and the results of its operations and its cash flows for each of the years in the three-year period ended December 31, 2024, in conformity with U.S. generally accepted accounting principles.
Basis for Opinion
These consolidated financial statements are the responsibility of the Partnership’s management. Our responsibility is to express an opinion on these consolidated financial statements based on our audits. We are a public accounting firm registered with the Public Company Accounting Oversight Board (United States) (PCAOB) and are required to be independent with respect to the Partnership in accordance with the U.S. federal securities laws and the applicable rules and regulations of the Securities and Exchange Commission and the PCAOB.
We conducted our audits in accordance with the standards of the PCAOB. Those standards require that we plan and perform the audit to obtain reasonable assurance about whether the consolidated financial statements are free of material misstatement, whether due to error or fraud. The Partnership is not required to have, nor were we engaged to perform, an audit of its internal control over financial reporting. As part of our audits, we are required to obtain an understanding of internal control over financial reporting but not for the purpose of expressing an opinion on the effectiveness of the Partnership’s internal control over financial reporting. Accordingly, we express no such opinion.
Our audits included performing procedures to assess the risks of material misstatement of the consolidated financial statements, whether due to error or fraud, and performing procedures that respond to those risks. Such procedures included examining, on a test basis, evidence regarding the amounts and disclosures in the consolidated financial statements. Our audits also included evaluating the accounting principles used and significant estimates made by management, as well as evaluating the overall presentation of the consolidated financial statements. We believe that our audits provide a reasonable basis for our opinion.
Critical Audit Matters
The critical audit matters communicated below are matters arising from the current period audit of the consolidated financial statements that were communicated or required to be communicated to the audit committee and that: (1) relate to accounts or disclosures that are material to the consolidated financial statements and (2) involved our especially challenging, subjective, or complex judgments. The communication of critical audit matters does not alter in any way our opinion on the consolidated financial statements, taken as a whole, and we are not, by communicating the critical audit matters below, providing separate opinions on the critical audit matters or on the accounts or disclosures to which they relate.
Evaluation of hotel properties for impairment
As discussed in Notes 1 and 3 to the consolidated financial statements, property and equipment, less accumulated depreciation and amortization as of December 31, 2024, was $10,906 million. The Partnership assesses its property and equipment, primarily comprised of hotel properties, for impairment when events or changes in circumstances occur that indicate the carrying value may not be recoverable. If such events or changes in circumstances are identified, the Partnership performs a recoverability analysis to compare the carrying amount of the hotel property to its expected undiscounted future cash flows over its remaining useful life.
We identified the evaluation of hotel properties for impairment as a critical audit matter. Subjective auditor judgment was required to assess the events or changes in circumstances that the Partnership used to evaluate its expected hold period. In addition, subjective auditor judgment was required to evaluate the key assumptions used by the Partnership in the recoverability analysis for a certain hotel property. The key assumptions included the undiscounted future cash flows and the expected hold period of this hotel property. Additionally, the audit effort associated with the evaluation of the undiscounted future cash flows for this hotel property required specialized skills and knowledge.
The following are the primary procedures we performed to address this critical audit matter. We evaluated the design and tested the operating effectiveness of certain internal controls over the impairment process. This included controls over the identification and assessment of expected hold periods for certain hotel properties and over the undiscounted future cash
flows used by the Partnership in the recoverability analysis for a certain hotel property. We evaluated the expected hold periods, by:
● inquiring of management and obtaining written representations regarding potential property disposal plans, if any
● reading minutes of the meetings of Host Hotels & Resorts, Inc.’s board of directors
● inquiring about the Partnership’s plans with those in the organization who are responsible for, and have authority over, potential disposition activities
● comparing management’s assessment of properties with potential shortened expected hold periods to information obtained from those in the organization responsible for disposition activity, and
● inspecting listings from external sources of real estate properties for sale by the Partnership.
Evaluation of the fair value of land acquired in real estate asset acquisitions
As discussed in Notes 1 and 12 to the consolidated financial statements, the Partnership acquired the 1 Hotel Nashville and Embassy Suites by Hilton Nashville Downtown, 1 Hotel Central Park and Turtle Bay Resort for approximately $530 million, $265 million and $680 million, respectively, during the year ended December 31, 2024. The Partnership determined the acquisitions to be asset acquisitions and allocated the acquisition cost to the individual assets acquired based on their relative fair values as of the acquisition date.
We identified the evaluation of the fair value of land acquired in these real estate asset acquisitions as a critical audit matter. Subjective auditor judgment and specialized skills and knowledge were required to evaluate the Partnership’s key assumptions used in the determination of the fair value of land acquired in the real estate asset acquisitions. Specifically, the key assumptions used in such determinations included the identification and weighting of comparable market sales transactions.
The following are the primary procedures we performed to address this critical audit matter. We evaluated the design and tested the operating effectiveness of certain internal controls over the Partnership’s asset acquisition process, including controls related to the determination of the fair value of land acquired. This included controls related to the identification of the population of comparable market sales transactions and weighting of such transactions. We involved valuation professionals with specialized skills and knowledge, who assisted in:
•evaluating the Partnership’s identified comparable market sales transactions by comparing third-party evidence of comparable market sales transactions independently obtained from industry sources, including information about the transaction prices and features of the comparable market sales transactions and
•evaluating the weighting of comparable market sales transactions by assessing the characteristics of such transactions.
/s/ KPMG LLP
We have served as the Partnership’s auditor since 2002.
McLean, Virginia
February 26, 2025
HOST HOTELS & RESORTS, INC. AND SUBSIDIARIES
CONSOLIDATED BALANCE SHEETS
December 31, 2024 and 2023
(in millions, except per share amounts)
| | | | | | | | | | | | | | |
| | December 31, 2024 | | December 31, 2023 |
| | | | |
| ASSETS |
| Property and equipment, net | | $ | 10,906 | | | $ | 9,624 | |
| Right-of-use assets | | 559 | | | 550 | |
| | | | |
| Due from managers | | 36 | | | 128 | |
| Advances to and investments in affiliates | | 166 | | | 126 | |
| Furniture, fixtures and equipment replacement fund | | 242 | | | 217 | |
| Notes receivable | | 79 | | | 72 | |
| Other | | 506 | | | 382 | |
| Cash and cash equivalents | | 554 | | | 1,144 | |
| Total assets | | $ | 13,048 | | | $ | 12,243 | |
| | | | |
| LIABILITIES, NON-CONTROLLING INTERESTS AND EQUITY |
| Debt | | | | |
| Senior notes | | $ | 3,993 | | | $ | 3,120 | |
| Credit facility, including the term loans of $998 and $997, respectively | | 992 | | | 989 | |
| Mortgage and other debt | | 98 | | | 100 | |
| Total debt | | 5,083 | | | 4,209 | |
| Lease liabilities | | 560 | | | 563 | |
| Accounts payable and accrued expenses | | 351 | | | 408 | |
| Due to managers | | 54 | | | 64 | |
| | | | |
| Other | | 223 | | | 173 | |
| Total liabilities | | 6,271 | | | 5,417 | |
| | | | |
| Redeemable non-controlling interests - Host Hotels & Resorts, L.P. | | 165 | | | 189 | |
| | | | |
| Host Hotels & Resorts, Inc. stockholders’ equity: | | | | |
| Common stock, par value $0.01, 1,050 million shares authorized, 699.1 million shares and 703.6 million shares issued and outstanding, respectively | | 7 | | | 7 | |
| Additional paid-in capital | | 7,462 | | | 7,535 | |
| Accumulated other comprehensive loss | | (83) | | | (70) | |
| Deficit | | (777) | | | (839) | |
| Total equity of Host Hotels & Resorts, Inc. stockholders | | 6,609 | | | 6,633 | |
| Non-redeemable non-controlling interests—other consolidated partnerships | | 3 | | | 4 | |
| Total equity | | 6,612 | | | 6,637 | |
| Total liabilities, non-controlling interests and equity | | $ | 13,048 | | | $ | 12,243 | |
See Notes to Consolidated Financial Statements.
75
HOST HOTELS & RESORTS, INC. AND SUBSIDIARIES
CONSOLIDATED STATEMENTS OF OPERATIONS
Years Ended December 31, 2024, 2023 and 2022
(in millions, except per common share amounts)
| | | | | | | | | | | | | | | | | |
| 2024 | | 2023 | | 2022 |
| REVENUES | | | | | |
| Rooms | $ | 3,426 | | | $ | 3,244 | | | $ | 3,014 | |
| Food and beverage | 1,716 | | | 1,582 | | | 1,418 | |
| Other | 542 | | | 485 | | | 475 | |
| Total revenues | 5,684 | | | 5,311 | | | 4,907 | |
| EXPENSES | | | | | |
| Rooms | 849 | | | 787 | | | 727 | |
| Food and beverage | 1,137 | | | 1,042 | | | 928 | |
| Other departmental and support expenses | 1,383 | | | 1,280 | | | 1,181 | |
| Management fees | 254 | | | 249 | | | 217 | |
| Other property-level expenses | 411 | | | 383 | | | 325 | |
| Depreciation and amortization | 762 | | | 697 | | | 664 | |
| Corporate and other expenses | 123 | | | 132 | | | 107 | |
| Net gain on insurance settlements | (110) | | | (86) | | | (17) | |
| Total operating costs and expenses | 4,809 | | | 4,484 | | | 4,132 | |
| OPERATING PROFIT | 875 | | | 827 | | | 775 | |
| Interest income | 54 | | | 75 | | | 30 | |
| Interest expense | (215) | | | (191) | | | (156) | |
| Other gains | — | | | 71 | | | 17 | |
| Equity in earnings of affiliates | 7 | | | 6 | | | 3 | |
| INCOME BEFORE INCOME TAXES | 721 | | | 788 | | | 669 | |
| Provision for income taxes | (14) | | | (36) | | | (26) | |
| NET INCOME | 707 | | | 752 | | | 643 | |
| Less: Net income attributable to non-controlling interests | (10) | | | (12) | | | (10) | |
| NET INCOME ATTRIBUTABLE TO HOST HOTELS & RESORTS, INC. | $ | 697 | | | $ | 740 | | | $ | 633 | |
| Basic earnings per common share | $ | 0.99 | | | $ | 1.04 | | | $ | 0.89 | |
| Diluted earnings per common share | $ | 0.99 | | | $ | 1.04 | | | $ | 0.88 | |
See Notes to Consolidated Financial Statements.
76
HOST HOTELS & RESORTS, INC. AND SUBSIDIARIES
CONSOLIDATED STATEMENTS OF COMPREHENSIVE INCOME
Years Ended December 31, 2024, 2023 and 2022
(in millions)
| | | | | | | | | | | | | | | | | |
| 2024 | | 2023 | | 2022 |
| | | | | |
| NET INCOME | $ | 707 | | | $ | 752 | | | $ | 643 | |
| OTHER COMPREHENSIVE INCOME, NET OF TAX | | | | | |
| Foreign currency translation and other comprehensive income (loss) of unconsolidated affiliates | (17) | | | 6 | | | (2) | |
| Change in fair value of derivative instruments | 3 | | | (1) | | | 2 | |
| Amounts reclassified from other comprehensive income | 1 | | | — | | | 1 | |
| OTHER COMPREHENSIVE INCOME (LOSS), NET OF TAX | (13) | | | 5 | | | 1 | |
| COMPREHENSIVE INCOME | 694 | | | 757 | | | 644 | |
| Less: Comprehensive income attributable to non-controlling interests | (10) | | | (12) | | | (10) | |
| COMPREHENSIVE INCOME ATTRIBUTABLE TO HOST HOTELS & RESORTS, INC. | $ | 684 | | | $ | 745 | | | $ | 634 | |
See Notes to Consolidated Financial Statements.
77
HOST HOTELS & RESORTS, INC. AND SUBSIDIARIES
CONSOLIDATED STATEMENTS OF EQUITY
Years Ended December 31, 2024, 2023 and 2022
(in millions) | | | | | | | | | | | | | | | | | | | | | | | | | | | | | | | | | | | | | | | | | | | | | | | | | | |
Common Shares Outstanding | | | | Common Stock | | Additional Paid-in Capital | | Accumulated Other Comprehensive Loss | | Retained Deficit | | Non-redeemable non-controlling Interests of Other Consolidated Partnerships | | Total Equity | | Redeemable non-controlling Interests of Host Hotels & Resorts, L.P. |
| 714.1 | | Balance, December 31, 2021 | | $ | 7 | | | $ | 7,702 | | | $ | (76) | | | $ | (1,192) | | | $ | 5 | | | $ | 6,446 | | | $ | 126 | |
| — | | Net income | | — | | | — | | | — | | | 633 | | | 1 | | | 634 | | | 9 | |
| — | | Other changes in ownership | | — | | | 16 | | | — | | | — | | | — | | | 16 | | | (17) | |
| — | | Foreign currency translation and other comprehensive income (loss) of unconsolidated affiliates | | — | | | — | | | (2) | | | — | | | — | | | (2) | | | — | |
| — | | Change in fair value of derivative instruments | | — | | | — | | | 2 | | | — | | | — | | | 2 | | | — | |
| — | | Amounts reclassified from Other Comprehensive Income | | — | | | — | | | 1 | | | — | | | — | | | 1 | | | — | |
| | | | | | | | | | | | | | | | |
| 0.7 | | Comprehensive stock and employee stock purchase plans | | — | | | 21 | | | — | | | — | | | — | | | 21 | | | — | |
| — | | Common stock dividends | | — | | | — | | | — | | | (380) | | | — | | | (380) | | | — | |
| — | | Common OP unit issuances | | — | | | — | | | — | | | — | | | — | | | — | | | 56 | |
| 0.3 | | Redemptions of limited partner interests for common stock | | — | | | 5 | | | — | | | — | | | — | | | 5 | | | (5) | |
| | | | | | | | | | | | | | | | |
| — | | Distributions to non-controlling interests | | — | | | — | | | — | | | — | | | (1) | | | (1) | | | (5) | |
| | | | | | | | | | | | | | | | |
| (1.7) | | Repurchase of common stock | | — | | | (27) | | | — | | | — | | | — | | | (27) | | | — | |
| 713.4 | | Balance, December 31, 2022 | | $ | 7 | | | $ | 7,717 | | | $ | (75) | | | $ | (939) | | | $ | 5 | | | $ | 6,715 | | | $ | 164 | |
| — | | Net income | | — | | | — | | | — | | | 740 | | | 1 | | | 741 | | | 11 | |
| — | | Other changes in ownership | | — | | | (30) | | | — | | | — | | | — | | | (30) | | | 31 | |
| — | | Foreign currency translation and other comprehensive income (loss) of unconsolidated affiliates | | — | | | — | | | 6 | | | — | | | — | | | 6 | | | — | |
| — | | Change in fair value of derivative instruments | | — | | | — | | | (1) | | | — | | | — | | | (1) | | | — | |
| | | | | | | | | | | | | | | | |
| | | | | | | | | | | | | | | | |
| 1.1 | | Comprehensive stock and employee stock purchase plans | | — | | | 22 | | | — | | | — | | | — | | | 22 | | | — | |
| — | | Common stock dividends | | — | | | — | | | — | | | (640) | | | — | | | (640) | | | — | |
| | | | | | | | | | | | | | | | |
| 0.5 | | Redemptions of limited partner interests for common stock | | — | | | 8 | | | — | | | — | | | — | | | 8 | | | (8) | |
| | | | | | | | | | | | | | | | |
| — | | Distributions to non-controlling interests | | — | | | — | | | — | | | — | | | (2) | | | (2) | | | (9) | |
| | | | | | | | | | | | | | | | |
| (11.4) | | Repurchase of common stock | | — | | | (182) | | | — | | | — | | | — | | | (182) | | | — | |
| 703.6 | | Balance, December 31, 2023 | | $ | 7 | | | $ | 7,535 | | | $ | (70) | | | $ | (839) | | | $ | 4 | | | $ | 6,637 | | | $ | 189 | |
| — | | Net income | | — | | | — | | | — | | | 697 | | | 1 | | | 698 | | | 9 | |
| — | | Other changes in ownership | | — | | | 20 | | | — | | | — | | | (1) | | | 19 | | | (19) | |
| — | | Foreign currency translation and other comprehensive income (loss) of unconsolidated affiliates | | — | | | — | | | (17) | | | — | | | — | | | (17) | | | — | |
| — | | Change in fair value of derivative instruments | | — | | | — | | | 3 | | | — | | | — | | | 3 | | | — | |
| — | | Amounts reclassified from Other Comprehensive Income | | — | | | — | | | 1 | | | — | | | — | | | 1 | | | — | |
| | | | | | | | | | | | | | | | |
| 1.5 | | Comprehensive stock and employee stock purchase plans | | — | | | 8 | | | — | | | — | | | — | | | 8 | | | — | |
| — | | Common stock dividends | | — | | | — | | | — | | | (635) | | | — | | | (635) | | | — | |
| | | | | | | | | | | | | | | | |
| 0.3 | | Redemptions of limited partner interests for common stock | | — | | | 6 | | | — | | | — | | | — | | | 6 | | | (6) | |
| | | | | | | | | | | | | | | | |
| — | | Distributions to non-controlling interests | | — | | | — | | | — | | | — | | | (1) | | | (1) | | | (8) | |
| | | | | | | | | | | | | | | | |
| (6.3) | | Repurchase of common stock | | — | | | (107) | | | — | | | — | | | — | | | (107) | | | — | |
| 699.1 | | Balance, December 31, 2024 | | $ | 7 | | | $ | 7,462 | | | $ | (83) | | | $ | (777) | | | $ | 3 | | | $ | 6,612 | | | $ | 165 | |
See Notes to Consolidated Financial Statements.
78
HOST HOTELS & RESORTS, INC. AND SUBSIDIARIES
CONSOLIDATED STATEMENTS OF CASH FLOWS
Years Ended December 31, 2024, 2023, and 2022
(in millions)
| | | | | | | | | | | | | | | | | |
| 2024 | | 2023 | | 2022 |
| OPERATING ACTIVITIES | | | | | |
| Net income | $ | 707 | | | $ | 752 | | | $ | 643 | |
| Adjustments to reconcile net income to net cash provided by operating activities: | | | | | |
| Depreciation and amortization | 762 | | | 697 | | | 664 | |
| Amortization of finance costs, discounts and premiums, net | 10 | | | 9 | | | 10 | |
| Loss on extinguishment of debt | — | | | 4 | | | — | |
| Non-cash stock-based compensation expense | 24 | | | 30 | | | 26 | |
| Deferred income taxes | 8 | | | 26 | | | 20 | |
| Other gains | — | | | (71) | | | (17) | |
| Gain on property insurance settlement | (70) | | | (3) | | | (6) | |
| Equity in earnings of affiliates | (7) | | | (6) | | | (3) | |
| Change in due from/to managers | 69 | | | (40) | | | 15 | |
| Distributions from investments in affiliates | 18 | | | 31 | | | 30 | |
| Property insurance proceeds - remediation costs | 4 | | | 101 | | | — | |
| Payments for inventory costs | (64) | | | (15) | | | — | |
| Changes in other assets | (9) | | | (3) | | | 20 | |
| Changes in other liabilities | 46 | | | (71) | | | 14 | |
| Net cash provided by operating activities | 1,498 | | | 1,441 | | | 1,416 | |
| | | | | |
| INVESTING ACTIVITIES | | | | | |
| Proceeds from sales of assets, net | — | | | 34 | | | 236 | |
| Proceeds from (issuance of) loan receivable | (7) | | | 413 | | | — | |
| Return of investments in affiliates | 1 | | | 5 | | | — | |
| Advances to and investments in affiliates | (56) | | | (25) | | | (60) | |
| Acquisitions | (1,504) | | | — | | | (301) | |
| Capital expenditures: | | | | | |
| Renewals and replacements | (288) | | | (451) | | | (197) | |
| Return on investment | (260) | | | (195) | | | (307) | |
| | | | | |
| Property insurance proceeds | 74 | | | 36 | | | 11 | |
| Net cash used in investing activities | (2,040) | | | (183) | | | (618) | |
| | | | | |
| FINANCING ACTIVITIES | | | | | |
| Financing costs | (12) | | | (10) | | | (1) | |
| Issuances of debt | 1,279 | | | — | | | — | |
| Draws on credit facility | 890 | | | — | | | — | |
| | | | | |
| Repayment of credit facility | (890) | | | — | | | (683) | |
| Repurchase/redemption of senior notes | (400) | | | — | | | — | |
| Mortgage debt and other prepayments and scheduled maturities | (2) | | | (7) | | | (2) | |
| Debt extinguishment costs | — | | | (3) | | | — | |
| Common stock repurchases | (107) | | | (182) | | | (27) | |
| | | | | |
| | | | | |
| | | | | |
| | | | | |
| | | | | |
| | | | | |
| Dividends on common stock | (737) | | | (547) | | | (150) | |
| | | | | |
| | | | | |
| | | | | |
| | | | | |
| | | | | |
| Distributions and payments to non-controlling interests | (12) | | | (10) | | | (3) | |
| | | | | |
| | | | | |
| Other financing activities | (22) | | | (12) | | | (8) | |
| Net cash used in financing activities | (13) | | | (771) | | | (874) | |
| Effects of exchange rate changes on cash held | (10) | | | 2 | | | (3) | |
| NET INCREASE (DECREASE) IN CASH AND CASH EQUIVALENTS AND RESTRICTED CASH | (565) | | | 489 | | | (79) | |
| CASH AND CASH EQUIVALENTS AND RESTRICTED CASH, BEGINNING OF PERIOD | 1,363 | | | 874 | | | 953 | |
| CASH AND CASH EQUIVALENTS AND RESTRICTED CASH, END OF PERIOD | $ | 798 | | | $ | 1,363 | | | $ | 874 | |
See Notes to Consolidated Financial Statements.
79
HOST HOTELS & RESORTS, INC. AND SUBSIDIARIES
CONSOLIDATED STATEMENTS OF CASH FLOWS (continued)
Years Ended December 31, 2024, 2023, and 2022
(in millions)
Supplemental disclosure of cash flow information (in millions):
The following table provides a reconciliation of cash, cash equivalents, and restricted cash reported on the balance sheet to the amount shown on the statements of cash flows:
| | | | | | | | | | | | | | | | | |
| 2024 | | 2023 | | 2022 |
| Cash and cash equivalents | $ | 554 | | | $ | 1,144 | | | $ | 667 | |
| Restricted cash (included in other assets) | 2 | | | 2 | | | 7 | |
| Cash included in furniture, fixtures and equipment replacement fund | 242 | | | 217 | | | 200 | |
| Total cash and cash equivalents and restricted cash shown in the statements of cash flows | $ | 798 | | | $ | 1,363 | | | $ | 874 | |
Supplemental schedule of noncash investing and financing activities:
During 2024, 2023, and 2022, Host Inc. issued approximately 0.3 million, 0.5 million and 0.3 million shares of common stock, respectively, upon the conversion of Host L.P. units, or OP units, held by non-controlling interests valued at $6 million, $8 million and $5 million, respectively.
During 2023, the intent for a land parcel adjacent to the Four Seasons Resort Orlando at Walt Disney World® Resort changed from "held for use" to "used for the development of inventory". As a result, we have reclassified $30 million from property and equipment to other assets.
On January 20, 2022, we entered into definitive agreements with Noble Investment Group, LLC, and certain other entities and persons related to Noble Investment Group, LLC, pursuant to which we made an investment in a joint venture with Noble Investment Group. In connection with the investment, Host L.P. issued approximately 3.2 million OP units valued at approximately $56 million.
In connection with the sales of The Camby, Autograph Collection in March 2023, the Sheraton Boston Hotel in February 2022 and the Sheraton New York Times Square Hotel in April 2022, we issued bridge loans to the buyers for $72 million, $163 million and $250 million, respectively. The proceeds received from the sales are net of the loans.
In 2024 and 2022, non-cash consideration for the acquisitions of The Ritz-Carlton O'ahu, Turtle Bay and Four Seasons Resort and Residences Jackson Hole included the assumption of hotel level liabilities of approximately $15 million and $19 million, respectively, consisting primarily of obligations to provide future services due to advance deposits.
See Notes to Consolidated Financial Statements.
80
HOST HOTELS & RESORTS, L.P. AND SUBSIDIARIES
CONSOLIDATED BALANCE SHEETS
December 31, 2024 and 2023
(in millions)
| | | | | | | | | | | | | | |
| | December 31, 2024 | | December 31, 2023 |
| | | | |
| ASSETS |
| Property and equipment, net | | $ | 10,906 | | | $ | 9,624 | |
| Right-of-use assets | | 559 | | | 550 | |
| | | | |
| Due from managers | | 36 | | | 128 | |
| Advances to and investments in affiliates | | 166 | | | 126 | |
| Furniture, fixtures and equipment replacement fund | | 242 | | | 217 | |
| Notes receivable | | 79 | | | 72 | |
| Other | | 506 | | | 382 | |
| Cash and cash equivalents | | 554 | | | 1,144 | |
| Total assets | | $ | 13,048 | | | $ | 12,243 | |
| | | | |
| LIABILITIES, LIMITED PARTNERSHIP INTERESTS OF THIRD PARTIES AND CAPITAL |
| Debt | | | | |
| Senior notes | | $ | 3,993 | | | $ | 3,120 | |
| Credit facility, including the term loans of $998 and $997, respectively | | 992 | | | 989 | |
| Mortgage and other debt | | 98 | | | 100 | |
| Total debt | | 5,083 | | | 4,209 | |
| Lease liabilities | | 560 | | | 563 | |
| Accounts payable and accrued expenses | | 351 | | | 408 | |
| Due to managers | | 54 | | | 64 | |
| | | | |
| Other | | 223 | | | 173 | |
| Total liabilities | | 6,271 | | | 5,417 | |
| | | | |
| Limited partnership interests of third parties | | 165 | | | 189 | |
| | | | |
| Host Hotels & Resorts, L.P. capital: | | | | |
| General partner | | 1 | | | 1 | |
| Limited partner | | 6,691 | | | 6,702 | |
| Accumulated other comprehensive loss | | (83) | | | (70) | |
| Total Host Hotels & Resorts, L.P. capital | | 6,609 | | | 6,633 | |
| Non-controlling interests—consolidated partnerships | | 3 | | | 4 | |
| Total capital | | 6,612 | | | 6,637 | |
| Total liabilities, limited partnership interests of third parties and capital | | $ | 13,048 | | | $ | 12,243 | |
See Notes to Consolidated Financial Statements.
81
HOST HOTELS & RESORTS, L.P. AND SUBSIDIARIES
CONSOLIDATED STATEMENTS OF OPERATIONS
Years Ended December 31, 2024, 2023 and 2022
(in millions, except per common unit amounts)
| | | | | | | | | | | | | | | | | |
| 2024 | | 2023 | | 2022 |
| REVENUES | | | | | |
| Rooms | $ | 3,426 | | | $ | 3,244 | | | $ | 3,014 | |
| Food and beverage | 1,716 | | | 1,582 | | | 1,418 | |
| Other | 542 | | | 485 | | | 475 | |
| Total revenues | 5,684 | | | 5,311 | | | 4,907 | |
| EXPENSES | | | | | |
| Rooms | 849 | | | 787 | | | 727 | |
| Food and beverage | 1,137 | | | 1,042 | | | 928 | |
| Other departmental and support expenses | 1,383 | | | 1,280 | | | 1,181 | |
| Management fees | 254 | | | 249 | | | 217 | |
| Other property-level expenses | 411 | | | 383 | | | 325 | |
| Depreciation and amortization | 762 | | | 697 | | | 664 | |
| Corporate and other expenses | 123 | | | 132 | | | 107 | |
| Net gain on insurance settlements | (110) | | | (86) | | | (17) | |
| Total operating costs and expenses | 4,809 | | | 4,484 | | | 4,132 | |
| OPERATING PROFIT | 875 | | | 827 | | | 775 | |
| Interest income | 54 | | | 75 | | | 30 | |
| Interest expense | (215) | | | (191) | | | (156) | |
| Other gains | — | | | 71 | | | 17 | |
| Equity in earnings of affiliates | 7 | | | 6 | | | 3 | |
| INCOME BEFORE INCOME TAXES | 721 | | | 788 | | | 669 | |
| Provision for income taxes | (14) | | | (36) | | | (26) | |
| NET INCOME | 707 | | | 752 | | | 643 | |
| Less: Net income attributable to non-controlling interests | (1) | | | (1) | | | (1) | |
| NET INCOME ATTRIBUTABLE TO HOST HOTELS & RESORTS, L.P. | $ | 706 | | | $ | 751 | | | $ | 642 | |
| Basic earnings per common unit | $ | 1.01 | | | $ | 1.07 | | | $ | 0.91 | |
| Diluted earnings per common unit | $ | 1.01 | | | $ | 1.06 | | | $ | 0.90 | |
See Notes to Consolidated Financial Statements.
82
HOST HOTELS & RESORTS, L.P. AND SUBSIDIARIES
CONSOLIDATED STATEMENTS OF COMPREHENSIVE INCOME
Years Ended December 31, 2024, 2023 and 2022
(in millions)
| | | | | | | | | | | | | | | | | |
| 2024 | | 2023 | | 2022 |
| NET INCOME | $ | 707 | | | $ | 752 | | | $ | 643 | |
| OTHER COMPREHENSIVE INCOME, NET OF TAX | | | | | |
| Foreign currency translation and other comprehensive income (loss) of unconsolidated affiliates | (17) | | | 6 | | | (2) | |
| Change in fair value of derivative instruments | 3 | | | (1) | | | 2 | |
| Amounts reclassified from other comprehensive income | 1 | | | — | | | 1 | |
| OTHER COMPREHENSIVE INCOME (LOSS), NET OF TAX | (13) | | | 5 | | | 1 | |
| COMPREHENSIVE INCOME | 694 | | | 757 | | | 644 | |
| Less: Comprehensive income attributable to non-controlling interests | (1) | | | (1) | | | (1) | |
| COMPREHENSIVE INCOME ATTRIBUTABLE TO HOST HOTELS & RESORTS, L.P. | $ | 693 | | | $ | 756 | | | $ | 643 | |
See Notes to Consolidated Financial Statements.
83
HOST HOTELS & RESORTS, L.P. AND SUBSIDIARIES
CONSOLIDATED STATEMENTS OF CAPITAL
Years Ended December 31, 2024, 2023, and 2022
(in millions) | | | | | | | | | | | | | | | | | | | | | | | | | | | | | | | | | | | | | | | | | | | | |
Common OP Units Outstanding | | | | General Partner | | Limited Partner | | Accumulated Other Comprehensive Loss | | Non-controlling Interests of Consolidated Partnerships | | Total Capital | | Limited Partnership Interests of Third Parties |
| 699.0 | | Balance, December 31, 2021 | | $ | 1 | | | $ | 6,516 | | | $ | (76) | | | $ | 5 | | | $ | 6,446 | | | $ | 126 | |
| — | | Net income | | — | | | 633 | | | — | | | 1 | | | 634 | | | 9 | |
| — | | Other changes in ownership | | — | | | 16 | | | — | | | — | | | 16 | | | (17) | |
| — | | Foreign currency translation and other comprehensive income (loss) of unconsolidated affiliates | | — | | | — | | | (2) | | | — | | | (2) | | | — | |
| — | | Change in fair value of derivative instruments | | — | | | — | | | 2 | | | — | | | 2 | | | — | |
| — | | Amounts reclassified from Other Comprehensive Income | | — | | | — | | | 1 | | | — | | | 1 | | | — | |
| — | | Common OP unit issuances | | — | | | — | | | — | | | — | | | — | | | 56 | |
| 0.7 | | Units issued to Host Inc. for the comprehensive stock and employee stock purchase plans | | — | | | 21 | | | — | | | — | | | 21 | | | — | |
| — | | Distributions on common OP units | | — | | | (380) | | | — | | | — | | | (380) | | | (5) | |
| 0.3 | | Redemptions of limited partner interests for common stock | | — | | | 5 | | | — | | | — | | | 5 | | | (5) | |
| | | | | | | | | | | | | | |
| — | | Distributions to non-controlling interests | | — | | | — | | | — | | | (1) | | | (1) | | | — | |
| | | | | | | | | | | | | | |
| (1.6) | | Repurchase of common OP units | | — | | | (27) | | | — | | | — | | | (27) | | | — | |
| 698.4 | | Balance, December 31, 2022 | | $ | 1 | | | $ | 6,784 | | | $ | (75) | | | $ | 5 | | | $ | 6,715 | | | $ | 164 | |
| — | | Net income | | — | | | 740 | | | — | | | 1 | | | 741 | | | 11 | |
| — | | Other changes in ownership | | — | | | (30) | | | — | | | — | | | (30) | | | 31 | |
| — | | Foreign currency translation and other comprehensive income (loss) of unconsolidated affiliates | | — | | | — | | | 6 | | | — | | | 6 | | | — | |
| — | | Change in fair value of derivative instruments | | — | | | — | | | (1) | | | — | | | (1) | | | — | |
| | | | | | | | | | | | | | |
| | | | | | | | | | | | | | |
| 1.1 | | Units issued to Host Inc. for the comprehensive stock and employee stock purchase plans | | — | | | 22 | | | — | | | — | | | 22 | | | — | |
| — | | Distributions on common OP units | | — | | | (640) | | | — | | | — | | | (640) | | | (9) | |
| 0.5 | | Redemptions of limited partner interests for common stock | | — | | | 8 | | | — | | | — | | | 8 | | | (8) | |
| | | | | | | | | | | | | | |
| — | | Distributions to non-controlling interests | | — | | | — | | | — | | | (2) | | | (2) | | | — | |
| | | | | | | | | | | | | | |
| (11.2) | | Repurchase of common OP units | | — | | | (182) | | | — | | | — | | | (182) | | | — | |
| 688.8 | | Balance, December 31, 2023 | | $ | 1 | | | $ | 6,702 | | | $ | (70) | | | $ | 4 | | | $ | 6,637 | | | $ | 189 | |
| — | | Net income | | — | | | 697 | | | — | | | 1 | | | 698 | | | 9 | |
| — | | Other changes in ownership | | — | | | 20 | | | — | | | (1) | | | 19 | | | (19) | |
| — | | Foreign currency translation and other comprehensive income (loss) of unconsolidated affiliates | | — | | | — | | | (17) | | | — | | | (17) | | | — | |
| — | | Change in fair value of derivative instruments | | — | | | — | | | 3 | | | — | | | 3 | | | — | |
| — | | Amounts reclassified from Other Comprehensive Income | | — | | | — | | | 1 | | | — | | | 1 | | | — | |
| | | | | | | | | | | | | | |
| 1.5 | | Units issued to Host Inc. for the comprehensive stock and employee stock purchase plans | | — | | | 8 | | | — | | | — | | | 8 | | | — | |
| — | | Distributions on common OP units | | — | | | (635) | | | — | | | — | | | (635) | | | (8) | |
| 0.3 | | Redemptions of limited partner interests for common stock | | — | | | 6 | | | — | | | — | | | 6 | | | (6) | |
| | | | | | | | | | | | | | |
| — | | Distributions to non-controlling interests | | — | | | — | | | — | | | (1) | | | (1) | | | — | |
| | | | | | | | | | | | | | |
| (6.2) | | Repurchase of common OP units | | — | | | (107) | | | — | | | — | | | (107) | | | — | |
| 684.4 | | Balance, December 31, 2024 | | $ | 1 | | | $ | 6,691 | | | $ | (83) | | | $ | 3 | | | $ | 6,612 | | | $ | 165 | |
See Notes to Consolidated Financial Statements.
84
HOST HOTELS & RESORTS, L.P. AND SUBSIDIARIES
CONSOLIDATED STATEMENTS OF CASH FLOWS
Years Ended December 31, 2024, 2023, and 2022
(in millions) | | | | | | | | | | | | | | | | | |
| 2024 | | 2023 | | 2022 |
| OPERATING ACTIVITIES | | | | | |
| Net income | $ | 707 | | | $ | 752 | | | $ | 643 | |
| Adjustments to reconcile net income to net cash provided by operating activities: | | | | | |
| Depreciation and amortization | 762 | | | 697 | | | 664 | |
| Amortization of finance costs, discounts and premiums, net | 10 | | | 9 | | | 10 | |
| Loss on extinguishment of debt | — | | | 4 | | | — | |
| Non-cash stock-based compensation expense | 24 | | | 30 | | | 26 | |
| Deferred income taxes | 8 | | | 26 | | | 20 | |
| Other gains | — | | | (71) | | | (17) | |
| Gain on property insurance settlement | (70) | | | (3) | | | (6) | |
| Equity in earnings of affiliates | (7) | | | (6) | | | (3) | |
| Change in due from/to managers | 69 | | | (40) | | | 15 | |
| Distributions from investments in affiliates | 18 | | | 31 | | | 30 | |
| Property insurance proceeds - remediation costs | 4 | | | 101 | | | — | |
| Payments for inventory costs | (64) | | | (15) | | | — | |
| Changes in other assets | (9) | | | (3) | | | 20 | |
| Changes in other liabilities | 46 | | | (71) | | | 14 | |
| Net cash provided by operating activities | 1,498 | | | 1,441 | | | 1,416 | |
| | | | | |
| INVESTING ACTIVITIES | | | | | |
| Proceeds from sales of assets, net | — | | | 34 | | | 236 | |
| Proceeds from (issuance of) loan receivable | (7) | | | 413 | | | — | |
| Return of investments in affiliates | 1 | | | 5 | | | — | |
| Advances to and investments in affiliates | (56) | | | (25) | | | (60) | |
| Acquisitions | (1,504) | | | — | | | (301) | |
| Capital expenditures: | | | | | |
| Renewals and replacements | (288) | | | (451) | | | (197) | |
| Return on investment | (260) | | | (195) | | | (307) | |
| | | | | |
| Property insurance proceeds | 74 | | | 36 | | | 11 | |
| Net cash used in investing activities | (2,040) | | | (183) | | | (618) | |
| | | | | |
| FINANCING ACTIVITIES | | | | | |
| Financing costs | (12) | | | (10) | | | (1) | |
| Issuances of debt | 1,279 | | | — | | | — | |
| Draws on credit facility | 890 | | | — | | | — | |
| | | | | |
| Repayment of credit facility | (890) | | | — | | | (683) | |
| Repurchase/redemption of senior notes | (400) | | | — | | | — | |
| Mortgage debt and other prepayments and scheduled maturities | (2) | | | (7) | | | (2) | |
| Debt extinguishment costs | — | | | (3) | | | — | |
| | | | | |
| Repurchase of common OP units | (107) | | | (182) | | | (27) | |
| | | | | |
| | | | | |
| | | | | |
| | | | | |
| | | | | |
| | | | | |
| | | | | |
| | | | | |
| Distributions on common OP units | (748) | | | (555) | | | (152) | |
| | | | | |
| | | | | |
| Distributions and payments to non-controlling interests | (1) | | | (2) | | | (1) | |
| | | | | |
| | | | | |
| Other financing activities | (22) | | | (12) | | | (8) | |
| Net cash used in financing activities | (13) | | | (771) | | | (874) | |
| Effects of exchange rate changes on cash held | (10) | | | 2 | | | (3) | |
| NET INCREASE (DECREASE) IN CASH AND CASH EQUIVALENTS AND RESTRICTED CASH | (565) | | | 489 | | | (79) | |
| CASH AND CASH EQUIVALENTS AND RESTRICTED CASH, BEGINNING OF PERIOD | 1,363 | | | 874 | | | 953 | |
| CASH AND CASH EQUIVALENTS AND RESTRICTED CASH, END OF PERIOD | $ | 798 | | | $ | 1,363 | | | $ | 874 | |
See Notes to Consolidated Financial Statements.
85
HOST HOTELS & RESORTS, L.P. AND SUBSIDIARIES
CONSOLIDATED STATEMENTS OF CASH FLOWS (continued)
Years Ended December 31, 2024, 2023, and 2022
(in millions)
Supplemental disclosure of cash flow information (in millions):
The following table provides a reconciliation of cash, cash equivalents, and restricted cash reported on the balance sheet to the amount shown on the statements of cash flows:
| | | | | | | | | | | | | | | | | |
| 2024 | | 2023 | | 2022 |
| Cash and cash equivalents | $ | 554 | | | $ | 1,144 | | | $ | 667 | |
| Restricted cash (included in other assets) | 2 | | | 2 | | | 7 | |
| Cash included in furniture, fixtures and equipment replacement fund | 242 | | | 217 | | | 200 | |
| Total cash and cash equivalents and restricted cash shown in the statements of cash flows | $ | 798 | | | $ | 1,363 | | | $ | 874 | |
Supplemental schedule of noncash investing and financing activities:
During 2024, 2023, and 2022, non-controlling partners converted common operating partnership units (“OP units”) valued at $6 million, $8 million and $5 million, respectively, in exchange for 0.3 million, 0.5 million and 0.3 million shares, respectively, of Host Inc. common stock.
During 2023, the intent for a land parcel adjacent to the Four Seasons Resort Orlando at Walt Disney World® Resort changed from "held for use" to "used for the development of inventory". As a result, we have reclassified $30 million from property and equipment to other assets.
On January 20, 2022, we entered into definitive agreements with Noble Investment Group, LLC, and certain other entities and persons related to Noble Investment Group, LLC, pursuant to which we made an investment in a joint venture with Noble Investment Group. In connection with the investment, Host L.P. issued approximately 3.2 million OP units valued at approximately $56 million.
In connection with the sales of The Camby, Autograph Collection in March 2023, the Sheraton Boston Hotel in February 2022 and the Sheraton New York Times Square Hotel in April 2022, we issued bridge loans to the buyers for $72 million, $163 million and $250 million, respectively. The proceeds received from the sales are net of the loans.
In 2024 and 2022, non-cash consideration for the acquisitions of The Ritz-Carlton O'ahu, Turtle Bay and Four Seasons Resort and Residences Jackson Hole included the assumption of hotel level liabilities of approximately $15 million and $19 million, respectively, consisting primarily of obligations to provide future services due to advance deposits.
See Notes to Consolidated Financial Statements.
86
HOST HOTELS & RESORTS, INC., HOST HOTELS & RESORTS, L.P., AND SUBSIDIARIES
NOTES TO CONSOLIDATED FINANCIAL STATEMENTS
1. Summary of Significant Accounting Policies
Description of Business
Host Hotels & Resorts, Inc. operates as a self-managed and self-administered real estate investment trust, or REIT, with its operations conducted solely through Host Hotels & Resorts, L.P. Host Hotels & Resorts, L.P., a Delaware limited partnership, operates through an umbrella partnership structure, with Host Hotels & Resorts, Inc., a Maryland corporation, as its sole general partner. In the notes to the consolidated financial statements, we use the terms “we” or “our” to refer to Host Hotels & Resorts, Inc. and Host Hotels & Resorts, L.P. together, unless the context indicates otherwise. We also use the term “Host Inc.” to refer specifically to Host Hotels & Resorts, Inc. and the term “Host L.P.” to refer specifically to Host Hotels & Resorts, L.P. in cases where it is important to distinguish between Host Inc. and Host L.P. Host Inc. holds approximately 99% of Host L.P.’s partnership interests, or OP units.
Consolidated Portfolio
As of December 31, 2024, the hotels in our consolidated portfolio are in the following countries:
| | | | | |
| Hotels |
| United States | 76 |
| Brazil | 3 |
| Canada | 2 |
| Total | 81 |
Basis of Presentation and Principles of Consolidation
The accompanying consolidated financial statements include the consolidated accounts of Host Inc., Host L.P. and their subsidiaries and controlled affiliates, including joint ventures and partnerships. We consolidate subsidiaries when we have the ability to control them. For the majority of our hotel and real estate investments, we consider those control rights to be (i) approval or amendment of developments plans, (ii) financing decisions, (iii) approval or amendments of operating budgets, and (iv) investment strategy decisions.
We also evaluate our subsidiaries to determine if they are variable interest entities (“VIEs”). If a subsidiary is a VIE, it is subject to the consolidation framework specifically for VIEs. Typically, the entity that has the power to direct the activities that most significantly impact economic performance consolidates the VIE. We consider an entity to be a VIE if equity investors own an interest therein that does not have the characteristics of a controlling financial interest or if such investors do not have sufficient equity at risk for the entity to finance its activities without additional subordinated financial support. We review our subsidiaries and affiliates at least annually to determine (i) if they should be considered VIEs, and (ii) whether we should change our consolidation determination based on changes in the characteristics thereof.
Five partnerships are considered VIE’s, as the general partner of these partnerships maintains control over the decisions that most significantly impact the partnerships. The first VIE is the operating partnership, Host L.P., which is consolidated by Host Inc., of which Host Inc. is the general partner and holds 99% of the limited partner interests. Host Inc.’s sole significant asset is its investment in Host L.P. and substantially all of Host Inc.’s assets and liabilities represent assets and liabilities of Host L.P. All of Host Inc.’s debt is an obligation of Host L.P. and may be settled only with assets of Host L.P. The consolidated partnership that owns the Houston Airport Marriott at George Bush Intercontinental, of which we are the general partner and hold 85% of the partnership interests, also is a VIE. The total assets of this VIE at December 31, 2024 are $47 million and consist primarily of cash, a right-of-use (“ROU”) asset and property and equipment. Liabilities for the VIE total $26 million and primarily consist of a lease liability and accounts payable. Three unconsolidated partnerships that own hotel properties, of which we hold limited partner interests ranging from 11% - 32%, also are VIEs. The combined carrying amount of our investments in these entities at December 31, 2024 is $77 million and is included in advances to and investments in affiliates. The mortgage debt held by these VIEs is non-recourse to us. See Note 4 - Investments in Affiliates for further information.
HOST HOTELS & RESORTS, INC., HOST HOTELS & RESORTS, L.P., AND SUBSIDIARIES
NOTES TO CONSOLIDATED FINANCIAL STATEMENTS
Use of Estimates in the Preparation of Financial Statements
The preparation of financial statements in conformity with U.S. generally accepted accounting principles, or GAAP, requires management to make estimates and assumptions that affect the reported amounts of assets and liabilities and disclosure of contingent assets and liabilities at the date of the financial statements and the reported amounts of revenues and expenses during the reporting period. Actual results could differ from these estimates.
Cash and Cash Equivalents
We consider all highly liquid investments with a maturity of three months or less at the date of purchase to be cash equivalents.
Property and Equipment
Generally, property and equipment is recorded at cost. For hotels that we develop, cost includes interest, property insurance and real estate taxes incurred during construction. For property and equipment acquired in a business combination, we record the assets acquired based on their fair value as of the acquisition date. Replacements and improvements and finance leases are capitalized, while repairs and maintenance are expensed as incurred.
Properties acquired in an asset acquisition are recorded at cost. The acquisition cost is allocated to land, buildings, improvements, furniture, fixtures and equipment, as well as identifiable intangible and lease assets and liabilities. Acquisition cost is allocated using relative fair values. We evaluate several factors, including weighted market data for similar assets, expected future cash flows discounted at risk adjusted rates, and replacement costs for assets to determine an appropriate exit cost when evaluating the fair values.
We capitalize certain inventory (such as china, glass, silver, and linen) at the time of a hotel opening or acquisition, or when significant inventory is purchased (in conjunction with a major rooms renovation or when the number of rooms or meeting space at a hotel is expanded). These amounts then are amortized over the estimated useful life of three years. Subsequent replacement purchases are expensed when placed in service.
We maintain a furniture, fixtures and equipment replacement fund for renewal and replacement capital expenditures at our hotels, which generally is funded with 5% of property revenues.
Impairment testing. We analyze our consolidated hotels for impairment throughout the year when events or circumstances occur that indicate the carrying amount may not be recoverable. We test for impairment in several situations, including:
•when a hotel has a current or projected loss from operations;
•when management’s intent or ability to hold a property for a period that recovers its carrying value changes, making it more likely than not that a hotel will be sold before the end of its previously estimated useful life and therefore reducing the expected hold period, and the anticipated sales price is at or below the book value; or
•when other events, trends, contingencies or changes in circumstances indicate that a triggering event has occurred and the carrying amount of an asset may not be recoverable.
To the extent that a hotel has a substantial remaining estimated useful life and management does not believe that it is more likely than not that it will be sold prior to the end thereof, it would be unusual for undiscounted cash flows to be insufficient to recover the property’s carrying amount. In the absence of other factors, we assume that the estimated useful life is equal to the remaining GAAP depreciable life because of the continuous property maintenance and improvement capital expenditures required under our management agreements. We adjust our assumptions with respect to the remaining useful life of the property if situations dictate otherwise, such as an expiring ground lease, or that it is more likely than not that the asset will be sold prior to the end of its previously expected useful life. We also consider the effect of regular renewal and replacement capital expenditures on the estimated useful life of our properties, including critical infrastructure, which regularly is maintained and then replaced at the end of its useful life.
In 2024 and 2023, we identified one property that required further consideration of property and market specific conditions or factors to determine if the property was impaired using an undiscounted cash flow analysis. Based on this testing, no impairment was necessary, and no further analysis was required.
HOST HOTELS & RESORTS, INC., HOST HOTELS & RESORTS, L.P., AND SUBSIDIARIES
NOTES TO CONSOLIDATED FINANCIAL STATEMENTS
In 2022, due to the impact of the COVID-19 pandemic on operations, we performed recoverability tests on certain of our properties, which did not result in the impairment of any of our properties.
Classification of Assets as Held for Sale. We will classify a hotel as held for sale when its sale is probable, will be completed within one year and actions to complete the sale are unlikely to change or it is unlikely that the sale will not occur. This policy is consistent with our experience with real estate transactions under which the timing and final terms of a sale frequently are not known until purchase agreements are executed, the buyer has a significant deposit at risk and no financing contingencies exist that could prevent the transaction from being completed in a timely manner. We typically classify hotels as held for sale when all the following conditions are met:
•Host Inc.’s Board of Directors has approved the sale (to the extent that the dollar amount of the sale requires Board approval);
•a binding agreement to sell the property has been signed under which the buyer has deposited a significant amount of nonrefundable cash; and
•no significant financing or legal contingencies exist that could prevent the transaction from being completed in a timely manner.
If these criteria are met, we will cease recording depreciation expense and will record an impairment expense if the fair value less costs to sell is less than the carrying amount of the hotel. We will classify the assets and related liabilities as held for sale on the balance sheet. Gains on sales of properties are recognized at the time of sale or are deferred and recognized as income in subsequent periods as conditions requiring deferral are satisfied or expire without further cost to us.
Discontinued Operations. We generally include the operations of a hotel that was sold or a hotel that has been classified as held for sale in continuing operations, including the gain or loss on the sale, unless the sale represents a strategic shift that will have a major impact on our future operations and financial results.
Asset retirement obligations. We recognize the fair value of any liability for conditional asset retirement obligations, including environmental remediation liabilities, when incurred, which generally is upon acquisition, construction, or development and/or through the normal operation of the asset, if information exists with which to reasonably estimate the fair value of the obligation.
Depreciation and Amortization Expense. We depreciate our property and equipment using the straight-line method. Depreciation expense is based on the estimated useful life of our assets and amortization expense for leasehold improvements is based on the shorter of the lease term or the estimated useful life of the related assets. The useful lives of the assets are based on several assumptions, including cost and timing of capital expenditures to maintain and refurbish the assets, as well as specific market and economic conditions. While management believes its estimates are reasonable, a change in the estimated useful lives could affect depreciation expense and net income or the gain or loss on the sale of any of our hotels.
Non-Controlling Interests
Host Inc.’s treatment of the non-controlling interests of Host L.P. Host Inc. adjusts the non-controlling interests of Host L.P. each period so that the amount presented equals the greater of its carrying amount based on its historical cost or its redemption value. The historical cost is based on the proportional relationship between the historical cost of equity held by our common stockholders relative to that of the unitholders of Host L.P. The redemption value is based on the amount of cash or Host Inc. common stock, at our option, that would be paid to the non-controlling interests of Host L.P. if it were terminated. We have estimated that the redemption value is equivalent to the number of shares issuable upon conversion of the OP units currently owned by unaffiliated limited partners (one OP unit may be exchanged for 1.021494 shares of Host Inc. common stock) valued at the market price of Host Inc. common stock at the balance sheet date. Redeemable non-controlling interests of Host L.P. are classified in the mezzanine section of the balance sheet as they do not meet the requirements for equity classification because the redemption feature requires the delivery of registered shares.
HOST HOTELS & RESORTS, INC., HOST HOTELS & RESORTS, L.P., AND SUBSIDIARIES
NOTES TO CONSOLIDATED FINANCIAL STATEMENTS
The table below details the historical cost and redemption values for the non-controlling interests of Host L.P.:
| | | | | | | | | | | | | | |
| | As of December 31, |
| | 2024 | | 2023 |
| Common OP units outstanding (millions) | | 9.2 | | | 9.5 | |
| Market price per Host Inc. common share | | $ | 17.52 | | | $ | 19.47 | |
| Shares issuable upon conversion of one common OP unit | | 1.021494 | | 1.021494 |
| Redemption value (millions) | | $ | 165 | | | $ | 189 | |
| Historical cost (millions) | | 90 | | | 93 | |
| Book value (millions) ⁽¹⁾ | | 165 | | | 189 | |
_____
(1)The book value recorded is equal to the greater of the redemption value or the historical cost.
Net income is allocated to the non-controlling interests of Host L.P. based on their weighted average ownership percentage during the period. Net income attributable to Host Inc. has been reduced by the amount attributable to non-controlling interests in Host L.P., which totaled $9 million, $11 million and $9 million for 2024, 2023 and 2022, respectively.
Other Consolidated Partnerships. Non-redeemable non-controlling interests - other consolidated partnerships on the consolidated balance sheets consists of the third party partnership interest of one majority-owned partnership.
Investments in Affiliates
Distributions from Investments in Affiliates. We classify the distributions from our equity investments in the statements of cash flows based upon an evaluation of the specific facts and circumstances of each distribution. For example, distributions of cash that were generated by property operations are classified as cash flows from operating activities. However, distributions of cash that were generated by property sales and certain other transactions, such as debt issuances or repayments, are classified as cash flows from investing activities.
Income Taxes
Host Inc. elected to be treated as a REIT effective January 1, 1999 pursuant to the U.S. Internal Revenue Code of 1986, as amended. It is our intention to continue to comply with the REIT qualification requirements and to maintain our qualification for treatment as a REIT. A corporation that elects REIT status and meets certain tax law requirements regarding the distribution of its taxable income to its stockholders as prescribed by applicable tax laws and that complies with certain other requirements (relating primarily to the composition of its assets and the sources of its gross income) generally is not subject to federal and state corporate income taxation on its operating income that is distributed to its stockholders. As a partnership for federal income tax purposes, Host L.P. is not subject to federal income tax. Host L.P. is, however, subject to state, local and foreign income and franchise tax in certain jurisdictions. Additionally, each of the Host L.P. taxable REIT subsidiaries is taxable as a C corporation, and is subject to federal, state and foreign corporate income tax. Our consolidated income tax provision (benefit) includes the income tax provision (benefit) related to the operations of our taxable REIT subsidiaries, and state, local, and foreign income taxes incurred by Host L.P. and its subsidiaries.
Deferred Tax Assets and Liabilities. Pursuant to its partnership agreement, Host L.P. generally is required to reimburse Host Inc. for any tax payments it is required to make. Accordingly, the tax information included herein represents disclosures regarding Host Inc. and its subsidiaries. Deferred tax assets and liabilities are recognized for the estimated future tax consequences attributable to differences between the financial statement carrying amounts of existing assets and liabilities and their respective tax bases, and for net operating loss, general business credit, and capital loss carryovers. Deferred tax assets and liabilities are measured using enacted tax rates in effect for the year in which such amounts are expected to be realized or settled. The effect on deferred tax assets and liabilities from a change in tax rates is recognized in earnings in the period when the new rate is enacted. However, deferred tax assets are recognized only to the extent that it is more likely than not that they will be realized based on consideration of available evidence, including future reversals of existing taxable temporary differences, future projected taxable income and tax planning strategies.
GAAP prescribes a recognition threshold and measurement attribute for the financial statement recognition and measurement of a tax position taken in a tax return. We must determine whether it is “more-likely-than-not” that a tax
HOST HOTELS & RESORTS, INC., HOST HOTELS & RESORTS, L.P., AND SUBSIDIARIES
NOTES TO CONSOLIDATED FINANCIAL STATEMENTS
position will be sustained upon examination, including resolution of any related appeals or litigation processes, based on the technical merits of the position. Once it is determined that a position meets the more-likely-than-not recognition threshold, the position is measured at the largest amount of benefit that is greater than 50% likely of being realized upon settlement to determine the amount of benefit to recognize in the financial statements. This accounting standard applies to all tax positions related to income taxes. We recognize any accrued interest related to unrecognized tax benefits in interest expense and penalties in operating expenses.
Deferred Charges
Financing costs related to long-term debt are deferred and amortized over the remaining life of the debt using the effective interest method. These costs are presented as a direct deduction from the related long-term debt on the balance sheets.
Foreign Currency Translation
As of December 31, 2024, our foreign operations consist of hotels located in Brazil and Canada, as well as an investment in a joint venture that indirectly owns hotels in India. The financial statements of these hotels and our investments therein are maintained in their functional currency, which generally is the local currency, and their operations are translated to U.S. dollars using the average exchange rates for the period. The assets and liabilities of the hotels and the investments therein are translated to U.S. dollars using the exchange rate in effect at the balance sheet date. The resulting translation adjustments are reflected in other comprehensive income (loss).
Foreign currency transactions are recorded in the functional currency for each applicable foreign entity using the exchange rates prevailing at the dates of the transactions. Assets and liabilities denominated in foreign currencies are remeasured at period end exchange rates. The resulting exchange differences are recorded in other gains (losses) on the accompanying consolidated statements of operations, except when recorded in other comprehensive income (loss) as qualifying net investment hedges.
Accumulated Other Comprehensive Loss
The components of total accumulated other comprehensive loss in the balance sheets are as follows (in millions):
| | | | | | | | | | | | | | |
| | As of December 31, |
| | 2024 | | 2023 |
| Gain on foreign currency forward contracts | | $ | 6 | | | $ | 3 | |
| Loss on interest rate swap cash flow hedges | | — | | | (1) | |
| Foreign currency translation | | (90) | | | (73) | |
| Other comprehensive loss attributable to non-controlling interests | | 1 | | | 1 | |
| Total accumulated other comprehensive loss | | $ | (83) | | | $ | (70) | |
No material amounts were reclassified from accumulated other comprehensive loss in 2024 or 2023.
Revenues
Substantially all of our operating results represent revenues and expenses generated by property-level operations. Payments are due from customers when services are provided to them. Due to the short-term nature of our contracts and the almost concurrent receipt of payment, we have no material unearned revenues at year end. We collect sales, use, occupancy
HOST HOTELS & RESORTS, INC., HOST HOTELS & RESORTS, L.P., AND SUBSIDIARIES
NOTES TO CONSOLIDATED FINANCIAL STATEMENTS
and similar taxes at our hotels, which we present on a net basis (excluded from revenues) on our statements of operations. Revenues are recognized as follows:
| | | | | | | | |
| Income statement line item | | Recognition method |
| Rooms revenues | | Rooms revenues represent revenues from the occupancy of our hotel rooms and are driven by the occupancy and average daily rate charged. Rooms revenues do not include ancillary services or fees charged. The contracts for room stays with customers generally are very short term in duration and revenues are recognized over the course of the hotel stay. |
| Food and beverage revenues | | Food and beverage revenues consist of revenues from group functions, which may include banquet revenues and audio-visual revenues, as well as outlet revenues from the restaurants and lounges at our properties. Revenues are recognized as the services or products are provided. Our hotels may employ third parties to provide certain services, for example, audio and visual services. These contracts are evaluated to determine if the hotel is the principal or the agent in the transaction and we record the revenues as appropriate (i.e., gross vs. net). |
| Other revenues | | Other revenues consist of ancillary revenues at the hotel, including attrition and cancelation fees, golf courses, resort and destination fees, spas, entertainment and other guest services, as well as rental revenues; primarily consisting of leased retail outlets. Other revenues generally are recognized as the services or products are provided. Attrition and cancelation fees are recognized for non-cancelable deposits when the customer provides notification of cancelation or is a no-show for the specified date, whichever comes first. |
Fair Value Measurement
In evaluating the fair value of both financial and non-financial assets and liabilities, GAAP outlines a valuation framework and creates a fair value hierarchy that distinguishes between market assumptions based on market data (“observable inputs”) and a reporting entity’s own assumptions about market data (“unobservable inputs”). Fair value is defined as the price that would be received to sell an asset or paid to transfer a liability at the measurement date in an orderly transaction (an “exit price”). Assets and liabilities are measured using inputs from three levels of the fair value hierarchy. The three levels are as follows:
Level 1 — Inputs are quoted prices (unadjusted) in active markets for identical assets or liabilities that we have the ability to access at the measurement date. An active market is defined as a market in which transactions occur with sufficient frequency and volume to provide pricing on an ongoing basis.
Level 2 — Inputs include quoted prices in active markets for similar assets and liabilities, quoted prices for identical or similar assets or liabilities in markets that are not active (markets with few transactions), inputs other than quoted prices that are observable for the asset or liability (i.e., interest rates, yield curves, etc.), and inputs that are derived principally from or corroborated by observable market data correlation or other means.
Level 3 — Unobservable inputs reflect our assumptions about the pricing of an asset or liability when observable inputs are not available.
Earnings (Loss) Per Common Share (Unit)
Basic earnings per common share (unit) is computed by dividing net income attributable to common stockholders (unitholders) by the weighted average number of shares of Host Inc. common stock or Host L.P. common units outstanding. Diluted earnings per common share (unit) is computed by dividing net income attributable to common
HOST HOTELS & RESORTS, INC., HOST HOTELS & RESORTS, L.P., AND SUBSIDIARIES
NOTES TO CONSOLIDATED FINANCIAL STATEMENTS
stockholders (unitholders), as adjusted for potentially dilutive securities, by the weighted average number of shares of Host Inc. common stock or Host L.P. common units outstanding plus other potentially dilutive securities. Dilutive securities may include shares granted under comprehensive stock plans or the common OP units distributed to Host Inc. to support such shares granted, and other non-controlling interests that have the option to convert their limited partner interests to common OP units. No effect is shown for any securities that are anti-dilutive. There are 9.2 million Host L.P. common units, which are convertible into 9.4 million Host Inc. common shares, that are not included in Host Inc.'s calculation of earnings per share as their effect is not dilutive.
The calculation of Host Inc. basic and diluted earnings per common share is shown below (in millions, except per share amounts):
| | | | | | | | | | | | | | | | | |
| Year ended December 31, |
| 2024 | | 2023 | | 2022 |
| Net income | $ | 707 | | | $ | 752 | | | $ | 643 | |
| Less: Net income attributable to non-controlling interests | (10) | | | (12) | | | (10) | |
| Net income attributable to Host Hotels & Resorts, Inc. | $ | 697 | | | $ | 740 | | | $ | 633 | |
| | | | | |
| Basic weighted average shares outstanding | 702.1 | | | 709.7 | | | 714.7 | |
| Assuming distribution of common shares granted under the comprehensive stock plans, less shares assumed purchased at market | 1.9 | | | 3.1 | | | 2.8 | |
| Diluted weighted average shares outstanding | 704.0 | | | 712.8 | | | 717.5 | |
| Basic earnings per common share | $ | 0.99 | | | $ | 1.04 | | | $ | 0.89 | |
| Diluted earnings per common share | $ | 0.99 | | | $ | 1.04 | | | $ | 0.88 | |
The calculation of Host L.P. basic and diluted earnings per common unit is shown below (in millions, except per unit amounts):
| | | | | | | | | | | | | | | | | |
| Year ended December 31, |
| 2024 | | 2023 | | 2022 |
| Net income | $ | 707 | | | $ | 752 | | | $ | 643 | |
| Less: Net income attributable to non-controlling interests | (1) | | | (1) | | | (1) | |
| Net income attributable to Host Hotels & Resorts, L.P. | $ | 706 | | | $ | 751 | | | $ | 642 | |
| | | | | |
| Basic weighted average units outstanding | 696.7 | | | 704.5 | | | 709.7 | |
| Assuming distribution of common units granted under the comprehensive stock plans, less units assumed purchased at market | 1.9 | | | 3.0 | | | 2.7 | |
| Diluted weighted average units outstanding | 698.6 | | | 707.5 | | | 712.4 | |
| Basic earnings per common unit | $ | 1.01 | | | $ | 1.07 | | | $ | 0.91 | |
| Diluted earnings per common unit | $ | 1.01 | | | $ | 1.06 | | | $ | 0.90 | |
Share-Based Payments
Upon the issuance of Host’s common stock under the compensation plans, Host L.P. will issue to Host Inc. common OP units of an equivalent value. These liabilities are included in the consolidated financial statements for Host Inc. and Host L.P.
We recognize costs resulting from Host Inc.’s share-based payment transactions over their vesting periods. We classify share-based payment awards granted in exchange for employee services either as equity-classified awards or liability-classified awards. Equity-classified awards are measured based on the fair value on the date of grant. Liability-
HOST HOTELS & RESORTS, INC., HOST HOTELS & RESORTS, L.P., AND SUBSIDIARIES
NOTES TO CONSOLIDATED FINANCIAL STATEMENTS
classified awards are remeasured to fair value each reporting period. The plan includes awards that vest over a one-year, two-year and three-year period. For performance-based awards, compensation cost will be recognized during the requisite service period based on the performance condition that is the most likely outcome. No compensation cost is recognized for awards for which employees do not render the requisite services.
Concentrations of Credit Risk
Financial instruments that potentially subject us to significant concentrations of credit risk consist principally of cash and cash equivalents. We are exposed to credit risk with respect to cash held at various financial institutions and access to our credit facility, however, this cash balance is spread among a diversified group of investment grade financial institutions.
Acquisitions and Business Combinations
When acquiring an asset, we determine whether the acquisition is an asset acquisition or a business combination based on whether the fair value of the gross assets acquired is concentrated in a single (group of similar) identifiable assets, resulting in an asset acquisition or, if not, resulting in a business combination. If treated as an asset acquisition, the asset is recorded in accordance with our property and equipment policy and related acquisition costs are capitalized as part of the asset.
In a business combination, we recognize identifiable assets acquired, liabilities assumed, and non-controlling interests at their fair values at the acquisition date based on the exit price (i.e., the price that would be received to sell an asset or paid to transfer a liability in an orderly transaction between market participants at the measurement date). We evaluate several factors, including market data for similar assets, expected cash flows discounted at risk adjusted rates and replacement cost for the assets to determine an appropriate exit cost when evaluating the fair value of our assets and liabilities acquired. Property and equipment are recorded at fair value and such fair value is allocated to land, buildings, improvements, furniture, fixtures and equipment using appraisals and valuations performed by management and independent third parties, and any consideration paid in excess of the net fair value of the identifiable assets and liabilities acquired would be recorded to goodwill. Acquisition-related costs, such as due diligence, legal and accounting fees, are not capitalized or applied in determining the fair value of the acquired assets.
Other items that we evaluate include identifiable intangible assets, lease assets and liabilities and, in a business combination, goodwill. Identifiable intangible assets typically consist of above- and below-market contracts, including ground and retail leases and management and franchise agreements, which are recorded at fair value in a business combination and at its relative fair value in an asset acquisition. These contract values are based on the present value of the difference between contractual amounts to be paid pursuant to the contracts acquired and our estimate of the fair value of terms and conditions for similar contracts measured over the period equal to the remaining non-cancelable term of the contract. Intangible assets and other liabilities are amortized using the straight-line method over the remaining non-cancelable term of the related agreements. Classification of a lease does not change if it is part of an asset acquisition or a business combination. In making estimates of fair values for purposes of allocating purchase price, we may utilize a number of sources that arise in connection with the acquisition or financing of a property and other market data, including third-party appraisals and valuations. In certain situations, and usually only in connection with the acquisition of a foreign hotel, a deferred tax liability is recognized due to the difference between the fair value and the tax basis of the acquired assets at the acquisition date.
Leases
We consider an arrangement to contain a lease if it conveys the right to control the use of an identified asset for a period of time in exchange for compensation. All leases pursuant to which we are the lessee, including operating leases, are recognized as lease assets and lease liabilities on the balance sheet. Right-of-use (“ROU”) assets represent our right to use an underlying asset for the lease term and lease liabilities represent the present value of our fixed payment obligations. Leases with a term of 12 months or less are not recorded on the balance sheet. We use our estimated incremental borrowing rate to determine the present value of our lease obligations at initiation or modification. Our operating leases may require fixed payments, variable payments based on a percentage of revenue or income, or payments equal to the greater of a fixed or variable payment. Variable payments are excluded from the ROU assets and lease liabilities and are recognized in the period in which the obligation is incurred. Operating lease expense is recognized on a straight-line basis over the lease term. Our lease terms include renewal options that we are reasonably certain to exercise, and renewal options controlled by the lessor.
HOST HOTELS & RESORTS, INC., HOST HOTELS & RESORTS, L.P., AND SUBSIDIARIES
NOTES TO CONSOLIDATED FINANCIAL STATEMENTS
Notes Receivable
At December 31, 2024, our notes receivable consists of one outstanding loan issued in connection with a hotel sale. In conjunction with our dispositions, we may issue a loan to the purchaser to facilitate the sale. The loan is collateralized by the corresponding sold hotel and, in the event of a default of the loan, we would seek to enforce our rights against the collateral in accordance with the terms of the loan agreement. The loan is recorded at amortized cost, on an individual asset basis. We recognize interest as it is earned and include accrued interest receivable in other assets on the balance sheets. We individually assess our notes receivable for credit losses quarterly and estimate any credit losses based on an analysis of several factors, primarily the value of the hotel collateral, as well as current economic conditions and historical trends.
Reclassifications
Certain prior year financial statements amounts have been reclassified to conform with the current year presentation.
New Accounting Standards
On January 1, 2024, we adopted ASU No. 2023-07, Segment Reporting (Topic 280): Improvements to Reportable Segment Disclosures. The standard requires additional information to be disclosed with regards to segments, including significant expense categories, identifying the Chief Operating Decision Maker ("CODM"), and additional interim disclosures. The standard also requires that public entities with a single reportable segment disclose all of the required segment disclosures under the previous ASC 280 guidance in addition to the new disclosures required under ASU No. 2023-07. We report on one reportable segment as noted in Note 16 – Geographic and Business Segment Information and additional disclosures were included to comply with the new requirements.
In December 2023, the FASB issued ASU No. 2023-09, Income Taxes (Topic 740): Improvements to Income Tax Disclosures. The standard requires additional disclosures about income taxes, including specific categories in the rate reconciliation and disaggregated information on income taxes paid and income from continuing operations. The standard also eliminates the requirement to disclose an estimated range of the reasonably possible change in unrecognized tax benefits in the next 12 months. We are still evaluating the level of disclosure that will be required. This standard is to be applied on a prospective basis and is effective for annual periods beginning after December 15, 2024, with early adoption permitted.
In November 2024, the FASB issued ASU No. 2024-03, Income Statement - Reporting Comprehensive Income (Subtopic 220-40): Expense Disaggregation Disclosures. The standard requires additional disclosures with more granular information about expenses reported in the income statement. The standard also requires a reporting entity to disaggregate and disclose the nature of certain expense categories, including employee compensation, inventory-related costs, and depreciation, within the financial statement footnotes. We are still evaluating the level of disclosure that will be required. This standard is to be applied either on a prospective or retrospective basis and is effective for annual periods beginning after December 15, 2026, with early adoption permitted.
2. Revenues
Substantially all our operating results represent revenues and expenses generated by property-level operations. Payments are due from customers when services are provided to them. Due to the short-term nature of our contracts and the almost concurrent receipt of payment, we have no material unearned revenue at quarter end. We collect sales, use, occupancy and similar taxes from our customers, which we present on a net basis (excluded from revenues) on our statements of operations.
Disaggregation of Revenues. While we do not consider the following disclosure of hotel revenues by location to consist of reportable segments, we have disaggregated hotel revenues by market location. Our revenues also are presented by country in Note 16 – Geographic and Business Segment Information.
HOST HOTELS & RESORTS, INC., HOST HOTELS & RESORTS, L.P., AND SUBSIDIARIES
NOTES TO CONSOLIDATED FINANCIAL STATEMENTS
By Location. The following table presents hotel revenues for each of the geographic locations in our consolidated hotel portfolio (in millions):
| | | | | | | | | | | | | | | | | | | | |
| | Year ended December 31, |
| Location | | 2024 | | 2023 | | 2022 |
| San Diego | | $ | 523 | | | $ | 498 | | | $ | 446 | |
| Orlando | | 473 | | | 466 | | | 455 | |
| Florida Gulf Coast | | 441 | | | 339 | | | 344 | |
| New York | | 431 | | | 374 | | | 336 | |
| Maui | | 371 | | | 415 | | | 440 | |
| Phoenix | | 366 | | | 366 | | | 378 | |
| San Francisco/San Jose | | 353 | | | 371 | | | 322 | |
| Washington, D.C. (Central Business District) | | 344 | | | 331 | | | 273 | |
| Miami | | 251 | | | 243 | | | 253 | |
| Boston | | 157 | | | 151 | | | 108 | |
| Houston | | 148 | | | 139 | | | 116 | |
| Chicago | | 143 | | | 136 | | | 129 | |
| Jacksonville | | 137 | | | 128 | | | 122 | |
| Los Angeles/Orange County | | 137 | | | 141 | | | 131 | |
| San Antonio | | 121 | | | 117 | | | 114 | |
| Seattle | | 111 | | | 105 | | | 90 | |
| New Orleans | | 107 | | | 99 | | | 96 | |
| Denver | | 101 | | | 89 | | | 80 | |
| Northern Virginia | | 99 | | | 90 | | | 76 | |
| Oahu | | 94 | | | 34 | | | 33 | |
| Nashville | | 88 | | | — | | | — | |
| Philadelphia | | 86 | | | 85 | | | 80 | |
| Austin | | 84 | | | 87 | | | 91 | |
| Atlanta | | 61 | | | 67 | | | 61 | |
| Other | | 356 | | | 348 | | | 262 | |
| Domestic | | 5,583 | | | 5,219 | | | 4,836 | |
| International | | 101 | | | 92 | | | 71 | |
| Total | | $ | 5,684 | | | $ | 5,311 | | | $ | 4,907 | |
3. Property and Equipment
Property and equipment consists of the following (in millions):
| | | | | | | | | | | |
| As of December 31, |
| 2024 | | 2023 |
| Land and land improvements | $ | 2,457 | | | $ | 1,981 | |
| Buildings and leasehold improvements | 15,504 | | | 14,253 | |
| Furniture and equipment | 2,546 | | | 2,331 | |
| Construction in progress | 299 | | | 237 | |
| 20,806 | | | 18,802 | |
| Less accumulated depreciation and amortization | (9,900) | | | (9,178) | |
| $ | 10,906 | | | $ | 9,624 | |
HOST HOTELS & RESORTS, INC., HOST HOTELS & RESORTS, L.P., AND SUBSIDIARIES
NOTES TO CONSOLIDATED FINANCIAL STATEMENTS
The aggregate cost of real estate for federal income tax purposes is approximately $11.5 billion at December 31, 2024.
4. Investments in Affiliates
We own investments in joint ventures for which the equity method of accounting is used. The debt of our joint ventures, if any, is non-recourse to, and not guaranteed by, us, and a default of such debt does not trigger a default under any of our debt instruments. We carry our investments at historical cost which, due to debt restructurings or distributions, may result in a negative investment balance. However, a negative investment balance does not represent a funding obligation for us or for our partners. Investments in affiliates consist of the following (in millions):
| | | | | | | | | | | | | | | | | | | | | | | | | | | | | | | | | | | |
| As of December 31, 2024 |
| Ownership Interests | | Our Investment | | Our Portion of Debt | | Total Debt | | Distributions received in 2024 ⁽¹⁾ | | Assets |
| Asia/Pacific JV | 25 | % | | $ | 10 | | | $ | — | | | $ | — | | | $ | — | | | A 36% interest in seven hotels and an office building in India |
| Maui JV | 67 | % | | 21 | | | 13 | | | 20 | | | 1 | | | 131-unit vacation ownership project in Maui, HI |
| Hyatt Place JV | 50 | % | | (15) | | | 30 | | | 60 | | | 2 | | | One hotel in Nashville, TN |
| Harbor Beach JV | 49.9 | % | | (48) | | | 78 | | | 156 | | | 5 | | | One hotel in Fort Lauderdale, FL |
| Philadelphia Marriott Downtown JV | 11 | % | | (9) | | | 23 | | | 213 | | | 1 | | | One hotel in Philadelphia, PA |
| Noble JV | 21.15 - 49% | | 170 | | | 96 | | | 447 | | | 10 | | | Asset management and general partner of real estate fund; select-service and extended stay hotels in the United States |
| Fifth Wall Ventures | | | 28 | | | — | | | — | | | — | | | Real estate industry technology investment |
| Other investments | | | 9 | | | — | | | — | | | — | | | |
| Total | | | $ | 166 | | | $ | 240 | | | $ | 896 | | | $ | 19 | | | |
| | | | | | | | | | | | | | | | | | | | | | | | | | | | | | | | | | | |
| | As of December 31, 2023 |
| | Ownership Interests | | Our Investment | | Our Portion of Debt | | Total Debt | | Distributions received in 2023 ⁽¹⁾ | | Assets |
| Asia/Pacific JV | 25 | % | | $ | 9 | | | $ | — | | | $ | — | | | $ | — | | | A 36% interest in seven hotels and an office building in India |
| Maui JV | 67 | % | | 28 | | | 16 | | | 23 | | | 8 | | | 131-unit vacation ownership project in Maui, HI |
| Hyatt Place JV | 50 | % | | (15) | | | 30 | | | 60 | | | 2 | | | One hotel in Nashville, TN |
| Harbor Beach JV | 49.9 | % | | (45) | | | 75 | | | 150 | | | 11 | | | One hotel in Fort Lauderdale, FL |
| Philadelphia Marriott Downtown JV⁽²⁾ | 11 | % | | (8) | | | 23 | | | 213 | | | 6 | | | One hotel in Philadelphia, PA |
| Noble JV | 21.15 - 49% | | 121 | | | 64 | | | 300 | | | 7 | | | Asset management and general partner of real estate fund; select-service and extended stay hotels in the United States |
| Fifth Wall Ventures | | | 28 | | | — | | | — | | | 2 | | | Real estate industry technology investment |
| Other investments | | | 8 | | | — | | | — | | | — | | | |
| Total | | | $ | 126 | | | $ | 208 | | | $ | 746 | | | $ | 36 | | | |
______________
(1)Distributions received were funded by cash from operations unless otherwise noted.
(2)Distributions received from Philadelphia Marriott Downtown JV in 2023 include $5 million related to loan refinancing proceeds.
As part of our investment in the Noble JV, we have made a $211.5 million capital commitment to Noble Hospitality Fund V, L.P., which represents a 21.15% ownership interest in the fund. As of December 31, 2024, we have invested $72 million in this fund. Additionally, through a co-investment of the fund, we have committed an additional $30 million of which we have funded $13 million.
HOST HOTELS & RESORTS, INC., HOST HOTELS & RESORTS, L.P., AND SUBSIDIARIES
NOTES TO CONSOLIDATED FINANCIAL STATEMENTS
5. Debt
Debt consists of the following (in millions):
| | | | | | | | | | | |
| As of December 31, |
| 2024 | | 2023 |
| Series E senior notes, with a rate of 4% due June 2025 | $ | 500 | | | $ | 499 | |
| Series F senior notes, with a rate of 4 ½% due February 2026 | 399 | | | 399 | |
| Series G senior notes, with a rate of 3 ⅞% due April 2024 | — | | | 400 | |
| Series H senior notes, with a rate of 3 ⅜% due December 2029 | 644 | | | 643 | |
| Series I senior notes, with a rate of 3 ½% due September 2030 | 740 | | | 738 | |
| Series J senior notes, with a rate of 2.9% due December 2031 | 442 | | | 441 | |
| Series K senior notes, with a rate of 5.7% due July 2034 | 585 | | | — | |
| Series L senior notes, with a rate of 5.5% due April 2035 | 683 | | | — | |
| Total senior notes | 3,993 | | | 3,120 | |
| Credit facility revolver ⁽¹⁾ | (6) | | | (8) | |
| Credit facility term loan due January 2027 | 499 | | | 499 | |
| Credit facility term loan due January 2028 | 499 | | | 498 | |
| Mortgage and other debt, with an average interest rate of 4.67% at both December 31, 2024 and 2023, maturing through November 2027 | 98 | | | 100 | |
| Total debt | $ | 5,083 | | | $ | 4,209 | |
_____________
(1)There were no outstanding credit facility borrowings at December 31, 2024 or 2023. Amount shown represents deferred financing costs related to the credit facility revolver.
Senior Notes
General. Under the terms of our senior notes indenture, our senior notes are equal in right of payment with all our unsubordinated indebtedness and senior to all our subordinated obligations. The face amounts of our senior notes at December 31, 2024 and 2023 were $4.1 billion and $3.2 billion, respectively. The senior notes balances as of December 31, 2024 and 2023 are net of unamortized discounts and deferred financing costs of approximately $57 million and $30 million, respectively. We pay interest on each series of our senior notes semi-annually in arrears at the respective annual rates indicated in the table above.
Under the terms of the senior notes indenture, our ability to incur indebtedness is subject to restrictions and the satisfaction of various conditions. As of December 31, 2024, we are in compliance with all of these covenants.
On April 1, 2024, we repaid our $400 million 3⅞% Series G senior notes at maturity.
On May 10, 2024, we issued $600 million of 5.700% Series K senior notes in an underwritten public offering for proceeds of $584 million, net of original issue discount, underwriting fees and expenses. The Series K senior notes are due in July 2034, and interest is payable semi-annually in arrears on January 1 and July 1, commencing January 1, 2025. The Series K senior notes were issued as a “green bond,” and we allocated an amount equal to the net proceeds from the sale of the Series K senior notes to finance and/or refinance one or more eligible green projects, including the April 2024 acquisition of the 1 Hotel Nashville and Embassy Suites by Nashville Downtown, each of which has received LEED Silver certification. Following the allocation to eligible green projects, the net proceeds of this issuance were used to repay all $215 million of borrowings that were outstanding under the revolver portion of our credit facility at that time. The Series K senior notes are not redeemable prior to 90 days before the July 1, 2034 maturity date, except at a price equal to 100% of their principal amount plus a make-whole premium and accrued and unpaid interest to the applicable redemption date. The Series K senior notes have covenants similar to all other series of our outstanding senior notes.
On August 12, 2024, we issued $700 million of 5.500% Series L senior notes in an underwritten public offering for proceeds of approximately $683 million, net of original issue discount, underwriting fees and expenses. The Series L senior notes are due in April 2035 and interest is payable semi-annually in arrears on April 15 and October 15 of each year,
HOST HOTELS & RESORTS, INC., HOST HOTELS & RESORTS, L.P., AND SUBSIDIARIES
NOTES TO CONSOLIDATED FINANCIAL STATEMENTS
commencing April 15, 2025. The net proceeds were used in part to repay all $525 million of borrowings then outstanding under the revolver portion of our credit facility, including amounts borrowed during the third quarter of 2024 in connection with the acquisitions of The Ritz-Carlton O’ahu, Turtle Bay and 1 Hotel Central Park. The Series L senior notes are not redeemable prior to 90 days before the April 15, 2035 maturity date, except at a price equal to 100% of their principal amount plus a make-whole premium and accrued and unpaid interest to the applicable redemption date. The Series L senior notes have covenants similar to all other series of our outstanding senior notes.
Authorization for Repurchase of Senior Notes. In February 2023, Host Inc.’s Board of Directors authorized repurchases of up to $1 billion of senior notes (other than in accordance with their terms) through February 2026. No repurchases occurred in 2024 under this program.
Credit Facility. On January 4, 2023, we entered into the sixth amended and restated senior revolving credit and term loan facility, with Bank of America, N.A., as administrative agent, Wells Fargo Bank, N.A. and JPMorgan Chase Bank, N.A. as co-syndication agents, and certain other agents and lenders. The credit facility allows for revolving borrowings in an aggregate principal amount of up to $1.5 billion. The revolver also includes a foreign currency subfacility for Canadian dollars, Australian dollars, Euros, British pounds sterling and, if available to the lenders, Mexican pesos, of up to the foreign currency equivalent of $500 million, subject to a lower amount in the case of Mexican peso borrowings. The credit facility also provides for a term loan facility of $1 billion (which is fully utilized), a subfacility of up to $100 million for swingline borrowings in currencies other than U.S. dollars and a subfacility of up to $100 million for issuances of letters of credit. Host L.P. also has the option to add in the future $500 million of commitments which may be used for additional revolving credit facility borrowings and/or term loans, subject to obtaining additional loan commitments (which we have not currently obtained) and the satisfaction of certain conditions.
The revolving credit facility has an initial scheduled maturity date of January 4, 2027, which date may be extended by up to a year by the exercise of either a 1-year extension option or two 6-month extension options, each of which is subject to certain conditions, including the payment of an extension fee and the accuracy of representations and warranties. One $500 million term loan tranche has an initial maturity date of January 4, 2027, which date may be extended up to a year by the exercise of one 1-year extension option, which is subject to certain conditions, including the payment of an extension fee; and the second $500 million term loan tranche has a maturity date of January 4, 2028, which date may not be extended.
The amendment also converted the underlying reference rate from LIBOR to SOFR plus a credit spread adjustment of 10 basis points. We pay interest on U.S. dollar revolver borrowings under the credit facility at floating rates equal to SOFR (plus a credit spread adjustment of 10 basis points) plus a margin ranging from 72.5 to 140 basis points (depending on Host L.P.’s unsecured long-term debt rating). We also pay a facility fee on the total $1.5 billion revolver commitment ranging from 12.5 to 30 basis points, depending on our rating and regardless of usage. The credit facility includes a sustainability pricing adjustment that can result in a change in the interest rate applicable to borrowings. The adjustment can result in an increase or decrease of the interest rate for revolving loans of up to 4 basis points and an increase or decrease of the facility fee of up to 1 basis point. In the case of the term loans, the adjustment can result in an increase or decrease of the interest rate applicable of up to 5 basis points. The adjustments will be determined annually on the basis of an annual audited report of Host L.P.’s performance against targets established in the credit facility for (1) the percentage of our consolidated portfolio with green building certifications and (2) the percentage of electricity used at all our consolidated properties that is generated by renewable resources. Effective June 26, 2024, we achieved a milestone in the progress towards both of our targets, resulting in the maximum benefit of the basis point reduction in the interest rate on borrowings under the credit facility. Based on Host L.P.’s unsecured long-term debt rating as of December 31, 2024, we are able to borrow on the revolver at a rate of adjusted SOFR plus 85 basis points less 4 basis points for meeting sustainability milestones for an all-in rate of 5.25% and pay a facility fee of 19 basis points.
Interest on the term loans consists of floating rates equal to SOFR (plus a credit spread adjustment of 10 basis points) plus a margin ranging from 80 to 160 basis points (depending on Host L.P.’s unsecured long-term debt rating) and adjusted for sustainability pricing. Based on Host L.P.’s long-term debt rating as of December 31, 2024, our applicable margin on SOFR loans under both term loans is 95 basis points less 5 basis points for meeting sustainability milestones, for an all-in rate of 5.34%. We also may elect to pay interest on revolver and term loan borrowings using a base rate plus a margin that is similarly determined based on Host L.P.’s unsecured long-term debt rating.
HOST HOTELS & RESORTS, INC., HOST HOTELS & RESORTS, L.P., AND SUBSIDIARIES
NOTES TO CONSOLIDATED FINANCIAL STATEMENTS
We utilized the revolver under the credit facility for various funding needs in 2024 with all borrowings repaid by year end. As of December 31, 2024, we have $1.5 billion of available capacity under the revolver portion of our credit facility.
Financial Covenants. The credit facility contains covenants concerning allowable leverage, fixed charge coverage and unsecured interest coverage (as defined in our credit facility). We are permitted to borrow and maintain amounts outstanding under the credit facility so long as our ratio of consolidated total debt to consolidated EBITDA (“leverage ratio”) is not in excess of 7.25x, our unsecured coverage ratio is not less than 1.75x and our fixed charge coverage ratio is not less than 1.25x. These calculations are performed based on pro forma results for the prior four fiscal quarters, giving effect to transactions such as acquisitions, dispositions and financings as if they had occurred at the beginning of the period. Under the terms of the credit facility, interest expense excludes items such as gains and losses on the extinguishment of debt, deferred financing costs related to the senior notes or the credit facility, and non-cash interest expense, all of which are or have been included in interest expense on our consolidated statements of operations. Additionally, total debt used in the calculation of our leverage ratio is based on a “net debt” concept, under which cash and cash equivalents in excess of $100 million are deducted from our total debt balance. As of December 31, 2024, we are in compliance with all of these covenants.
Guarantees. The credit facility requires all Host L.P. subsidiaries which guarantee Host L.P. debt to similarly guarantee obligations under the credit facility. Currently, there are no such guarantees.
Other Covenants and Events of Default. The credit facility contains restrictive covenants on customary matters. Certain covenants are less restrictive at any time that our leverage ratio is below 6.0x. At any time that our leverage ratio is below 6.0x, acquisitions, investments and dividends generally are permitted except where they would result in a breach of the financial covenants, calculated on a pro forma basis. Additionally, the credit facility’s restrictions on the incurrence of debt incorporate the same financial covenant as set forth in our senior notes indenture. Our senior notes and credit facility have cross default provisions that would trigger a default under those agreements if we were to have a payment default or an acceleration prior to maturity of other debt of Host L.P. or its subsidiaries. The amount of other debt in default needs to exceed certain thresholds in order to trigger a cross default and the thresholds are greater for secured debt than for unsecured debt. The credit facility also includes usual and customary events of default for facilities of this nature, and provides that, upon the occurrence and continuance of an event of default, payment of all amounts due under the credit facility may be accelerated, and the lenders’ commitments may be terminated. In addition, upon the occurrence of certain insolvency or bankruptcy related events of default, all amounts owed under the credit facility will become due and payable and the lenders’ commitments will terminate.
Mortgage Debt
Our mortgage debt is recourse solely to specific assets, except for environmental liabilities, fraud, misapplication of funds and other customary recourse provisions. As of December 31, 2024, we have mortgage debt secured by one asset, with an interest rate of 4.67%, which mortgage debt matures in November 2027. The loan is amortizing, with principal and interest payable monthly. As of December 31, 2024, we are in compliance with the covenants under our mortgage debt obligation. We made mortgage debt repayments of $2 million in each of 2024 and 2023.
HOST HOTELS & RESORTS, INC., HOST HOTELS & RESORTS, L.P., AND SUBSIDIARIES
NOTES TO CONSOLIDATED FINANCIAL STATEMENTS
Aggregate Debt Maturities
Aggregate debt maturities, including principal amortization, are as follows (in millions):
| | | | | |
| As of December 31, 2024 |
| 2025 | $ | 502 | |
| 2026 | 402 | |
| 2027 | 592 | |
| 2028 | 500 | |
| 2029 | 650 | |
| Thereafter | 2,500 | |
| 5,146 | |
| Deferred financing costs | (31) | |
| Unamortized discounts, net | (32) | |
| Total debt | $ | 5,083 | |
Interest
The following is a reconciliation between interest expense and cash interest paid (in millions):
| | | | | | | | | | | | | | | | | |
| Year ended December 31, |
| 2024 | | 2023 | | 2022 |
| Interest expense | $ | 215 | | | $ | 191 | | | $ | 156 | |
| Amortization of debt premiums/discounts, net | (3) | | | (2) | | | (2) | |
| Amortization of deferred financing costs | (7) | | | (7) | | | (8) | |
| Non-cash losses on debt extinguishment | — | | | (1) | | | — | |
| Change in accrued interest | (33) | | | 2 | | | (4) | |
| Interest paid ⁽¹⁾ | $ | 172 | | | $ | 183 | | | $ | 142 | |
___________
(1)Does not include capitalized interest of $10 million in each of 2024, 2023 and 2022.
6. Equity of Host Inc. and Capital of Host L.P.
Equity of Host Inc.
Host Inc. has authorized 1,050 million shares of common stock, with a par value of $0.01 per share, of which 699.1 million and 703.6 million were outstanding as of December 31, 2024 and 2023, respectively. Fifty million shares of no par value preferred stock are authorized; none of such preferred shares was outstanding as of December 31, 2024 and 2023.
Capital of Host L.P.
As of December 31, 2024, Host Inc. is the owner of approximately 99% of Host L.P.’s common OP units. The remaining common OP units are owned by unaffiliated limited partners. Each common OP unit may be redeemed for cash or, at the election of Host Inc., Host Inc. common stock, based on the conversion ratio of 1.021494 shares of Host Inc. common stock for each OP unit. In exchange for any shares issued by Host Inc., Host L.P. will issue common OP units based on the applicable conversion ratio. As of December 31, 2024 and 2023, Host L.P. had 693.6 million and 698.3 million OP units outstanding, respectively, of which Host Inc. held 684.4 million and 688.8 million, respectively.
Repurchases and Issuances of Common Stock and Common OP Units
On August 3, 2022, Host Inc.'s Board of Directors authorized an increase in our share repurchase program from the existing $371 million remaining under the prior Board authorization to $1 billion. In 2024, we repurchased 6.3 million shares at an average price of $16.99 per share, exclusive of commissions, for a total of $107 million. In 2023, we
HOST HOTELS & RESORTS, INC., HOST HOTELS & RESORTS, L.P., AND SUBSIDIARIES
NOTES TO CONSOLIDATED FINANCIAL STATEMENTS
repurchased 11.4 million shares at an average price of $15.93 per share, exclusive of commissions, for a total of $181 million. As of December 31, 2024, we have $685 million available for repurchase under the program.
On May 31, 2023, we entered into a distribution agreement with J. P. Morgan Securities LLC, BofA Securities, Inc., Goldman Sachs & Co. LLC, Jefferies LLC, Morgan Stanley & Co. LLC, Scotia Capital (USA) Inc., Truist Securities, Inc. and Wells Fargo Securities, LLC, as sales agents pursuant to which Host Inc. may offer and sell, from time to time, shares of Host Inc. common stock having an aggregate offering price of up to $600 million. The sales will be made in transactions that are deemed to be “at the market” offerings under the SEC rules. We may sell shares of Host Inc. common stock under this program from time to time based on market conditions, although we are not under an obligation to sell any shares. The agreement also contemplates that, in addition to the offering and sale of shares to or through the sales agents, we may enter into separate forward sale agreements with each of the forward purchasers named in the agreement. There have been no shares issued in 2024 and 2023. As of December 31, 2024, there was $600 million of remaining capacity under the agreement.
Dividends/Distributions
Host Inc. is required to distribute at least 90% of its annual taxable income, excluding net capital gains, to its stockholders in order to maintain its qualification as a REIT. Funds used by Host Inc. to pay dividends on its common stock are provided by distributions from Host L.P. The amount of any future dividends will be determined by Host Inc.’s Board of Directors.
The dividends that were taxable to our stockholders in 2024 are considered 100.0% ordinary. The dividends that were taxable to our stockholders in 2023 are considered 91.8% ordinary and 8.2% unrecaptured Section 1250 gain. The 2024 and 2023 ordinary dividends are eligible for the 20% deduction provided by Section 199A. The table below presents the amount of common dividends declared per share and common distributions per unit as follows:
| | | | | | | | | | | | | | | | | |
| Year ended December 31, |
| 2024 | | 2023 | | 2022 |
| Common stock | $ | 0.90 | | | $ | 0.90 | | | $ | 0.53 | |
| Common OP units | 0.919 | | | 0.919 | | | 0.541 | |
On February 19, 2025, Host Inc.'s Board of Directors announced a regular quarterly cash dividend of $0.20 per share on its common stock. The dividend will be paid on April 15, 2025 to stockholders of record as of March 31, 2025.
7. Income Taxes
We elected to be taxed as a REIT under Sections 856 through 860 of the Internal Revenue Code commencing with our taxable year beginning January 1, 1999. To continue to qualify as a REIT, we must meet a number of organizational and operational requirements, including a requirement that we distribute at least 90% of our annual taxable income to our stockholders, excluding net capital gain. As a REIT, generally we will not be subject to U.S. federal and state corporate income taxes on that portion of our annual taxable income that is distributed to our stockholders. If we fail to qualify for taxation as a REIT in any taxable year, we will be subject to U.S. federal and state corporate income taxes at regular corporate income tax rates and may not be able to qualify as a REIT for four subsequent taxable years. Even if we qualify to be treated as a REIT, we may be subject to certain state, local and foreign taxes on our income and property, and to U.S. federal and state corporate income and excise taxes on our undistributed taxable income.
HOST HOTELS & RESORTS, INC., HOST HOTELS & RESORTS, L.P., AND SUBSIDIARIES
NOTES TO CONSOLIDATED FINANCIAL STATEMENTS
Set forth below is a table that documents our domestic and foreign income tax attributes at December 31, 2024:
| | | | | | | | | | | | | | | | | | | | |
| Type | | Jurisdiction | | Amount (in millions) | | Tax Year Expiration |
| Net operating loss | | U.S. Federal | | $ | 576 | | | None |
| Capital loss | | U.S. Federal and States | | 2 | | | 2028 |
| Net operating loss | | U.S. States | | 901 | | | Various |
| Net operating loss | | Brazil | | 19 | | | None |
| Net operating loss | | Canada | | 7 | | | Through 2042 |
| Capital loss | | Canada | | 5 | | | None |
| General business credit | | U.S. Federal | | 4 | | | 2044 |
We have recorded a 100% valuation allowance of approximately $5 million against the deferred tax asset related to certain of our foreign capital loss carryovers as of December 31, 2024. We also have recorded a valuation allowance of approximately $5 million against the deferred tax asset related to our accumulated other comprehensive income (“AOCI”) foreign exchange net losses. There was a decrease of our valuation allowance for the year ended December 31, 2024 from the year ended December 31, 2023, of approximately $8 million, due to the expiration of capital losses.
The primary components of our net deferred tax assets are as follows (in millions):
| | | | | | | | | | | |
| As of December 31, |
| 2024 | | 2023 |
| Deferred tax assets | | | |
| Net operating losses, general business credits, and capital loss carryovers | $ | 182 | | | $ | 205 | |
| Investments in domestic affiliates | 1 | | | — | |
| Property and equipment | 2 | | | 3 | |
| Deferred revenue and expenses | 30 | | | 20 | |
| Foreign exchange net losses (AOCI) | 12 | | | 12 | |
| Total gross deferred tax assets | 227 | | | 240 | |
| Less: Valuation allowance | (10) | | | (18) | |
| Total deferred tax assets, net of valuation allowance | $ | 217 | | | $ | 222 | |
| Deferred tax liabilities | | | |
| Investments in domestic affiliates | — | | | (1) | |
| Total gross deferred tax liabilities | — | | | (1) | |
| Net deferred tax assets | $ | 217 | | | $ | 221 | |
We believe that it is more likely than not that the results of future operations will generate sufficient taxable income in order to realize our total deferred tax assets, net of a valuation allowance of $10 million, of $217 million.
Our U.S. and foreign income from continuing operations before income taxes were as follows (in millions):
| | | | | | | | | | | | | | | | | |
| Year ended December 31, |
| 2024 | | 2023 | | 2022 |
| U.S. income | $ | 697 | | | $ | 768 | | | $ | 659 | |
| Foreign income | 24 | | | 20 | | | 10 | |
| Total | $ | 721 | | | $ | 788 | | | $ | 669 | |
HOST HOTELS & RESORTS, INC., HOST HOTELS & RESORTS, L.P., AND SUBSIDIARIES
NOTES TO CONSOLIDATED FINANCIAL STATEMENTS
Income tax provision for continuing operations consists of (in millions):
| | | | | | | | | | | | | | | | | | | | |
| | Year ended December 31, |
| | 2024 | | 2023 | | 2022 |
| Current | —Federal | $ | — | | | $ | 3 | | | $ | 3 | |
| —State | 2 | | | 3 | | | 2 | |
| —Foreign | 4 | | | 4 | | | 1 | |
| | 6 | | | 10 | | | 6 | |
| Deferred | —Federal | 4 | | | 15 | | | 13 | |
| —State | 3 | | | 10 | | | 5 | |
| —Foreign | 1 | | | 1 | | | 2 | |
| | 8 | | | 26 | | | 20 | |
| Income tax provision - continuing operations | $ | 14 | | | $ | 36 | | | $ | 26 | |
The differences between the income tax provision calculated at the statutory U.S. federal corporate income tax rate of 21% and the actual income tax provision recorded for continuing operations are as follows (in millions):
| | | | | | | | | | | | | | | | | |
| Year ended December 31, |
| 2024 | | 2023 | | 2022 |
| | | | | |
| Statutory federal income tax provision | $ | 151 | | | $ | 165 | | | $ | 140 | |
| Adjustment for nontaxable income of Host Inc. | (147) | | | (147) | | | (124) | |
| State income tax provision, net | 5 | | | 13 | | | 7 | |
| | | | | |
| Foreign income tax provision | 5 | | | 5 | | | 3 | |
| Total | $ | 14 | | | $ | 36 | | | $ | 26 | |
Cash taxes activity included a net payment of $11 million and $12 million in 2024 and 2023, respectively, and a net refund of $19 million in 2022.
Our unrecognized tax benefits remained unchanged at $1 million for each of the years ended December 31, 2024 and 2023. All of such uncertain tax position amounts, if recognized, would impact our reconciliation between the income tax provision calculated at the statutory U.S. federal corporate income tax rate of 21% and the actual income tax provision recorded each year.
As of December 31, 2024, the tax years that remain subject to examination by major tax jurisdictions generally include 2021-2024. There were no material interest or penalties recorded for the years ended December 31, 2024, 2023 and 2022.
8. Leases
Taxable REIT Subsidiaries Leases
We lease substantially all our hotels to a wholly owned subsidiary that qualifies as a taxable REIT subsidiary due to the U.S. federal income tax prohibition on the ability of a REIT to derive revenues directly from the operations of a hotel.
Ground Leases
As of December 31, 2024, all or a portion of 19 of our hotels are subject to ground leases, generally with multiple renewal options, all of which are accounted for as operating leases. Payments for ground leases account for approximately 73% of our 2024 minimum lease payments and 96% of our total future minimum lease payments. For lease agreements with scheduled rent increases, we recognize the fixed portion of the lease expense ratably over the term of the lease. As the exercise of the renewal options were determined to be reasonably certain, the payments associated with the renewals have
HOST HOTELS & RESORTS, INC., HOST HOTELS & RESORTS, L.P., AND SUBSIDIARIES
NOTES TO CONSOLIDATED FINANCIAL STATEMENTS
been included in the measurement of the lease liability and ROU asset. Contingent rental payments based on a percentage of sales in excess of stipulated amounts are not included in the measurement of the lease liability and ROU asset but will be recognized as variable lease expense if and when they are incurred. However, certain of these leases contain provisions that increase the minimum lease payments based on an average of the variable lease payments made over the previous years, for which we will reevaluate the lease liability and ROU asset as these payments represent an increase in the minimum payments for the remainder of the lease term. Certain of these leases also contain provisions that increase the minimum lease payments based on an index such as the Consumer Price Index. Such increases are not included in the measurement of the lease liability and ROU asset but will be recognized as variable lease expense if and when they are incurred. The discount rate used to calculate the lease liability and ROU asset is based on our incremental borrowing rate (“IBR”), as the rate implicit in each lease is not readily determinable. To calculate our IBR, we obtained a forward curve using LIBOR swap rates, with terms ranging from one to fifty years, as well as corresponding bond spreads based on the terms of the leases and our credit risk. The resulting discount rates for our ground leases range from 4.3% to 6.2%.
Office Leases and Other
We have office leases for our headquarters office in Bethesda, which expires in 2036, as well as a satellite office in Miami, which lease expires in 2025, with no renewal options.
We also have leases on facilities used in our former restaurant business, all of which we subsequently subleased. These leases and subleases contain one or more renewal options, generally for five- or ten -year periods. The restaurant leases are accounted for as operating leases. Our contingent liability related to these leases is $0.9 million and $1.1 million as of December 31, 2024 and 2023, respectively. We, however, consider the likelihood of any material funding related to these leases to be remote. Our leasing activity also includes leases entered into by our hotels for various types of equipment, which may be accounted for either as operating or finance leases, depending upon the characteristics of the particular lease arrangement. Our finance leases total less than $1 million at December 31, 2024 and 2023.
The following table presents lease cost and other information (in millions):
| | | | | | | | | | | | | | | | | |
| Year ended December 31, |
| 2024 | | 2023 | | 2022 |
| Lease cost | | | | | |
| Operating lease cost | $ | 43 | | | $ | 42 | | | $ | 41 | |
| Variable lease cost | 36 | | | 35 | | | 27 | |
| Sublease income | (1) | | | (1) | | | (1) | |
| Total lease cost | $ | 78 | | | $ | 76 | | | $ | 67 | |
| | | | | |
| Other information | | | | | |
| Operating cash flows used for operating leases | $ | 43 | | | $ | 42 | | | $ | 41 | |
| Weighted-average remaining lease term - operating leases | 46 years | | 46 years | | 47 years |
| Weighted-average discount rate - operating leases | 5.3 | % | | 5.3 | % | | 5.3 | % |
HOST HOTELS & RESORTS, INC., HOST HOTELS & RESORTS, L.P., AND SUBSIDIARIES
NOTES TO CONSOLIDATED FINANCIAL STATEMENTS
The following table presents a reconciliation of the total amount of minimum lease payments, on an undiscounted basis, to the lease liability on the balance sheet as of December 31, 2024 (in millions):
| | | | | | | | | | | | | | | | | |
| As of December 31, 2024 |
| Ground Leases | | Office Leases and Other | | Total |
| Weighted-average discount rate - operating leases | 5.4 | % | | 3.7 | % | | 5.3 | % |
| 2025 | $ | 31 | | | $ | 7 | | | $ | 38 | |
| 2026 | 31 | | | 6 | | | 37 | |
| 2027 | 31 | | | 5 | | | 36 | |
| 2028 | 31 | | | 5 | | | 36 | |
| 2029 | 31 | | | 5 | | | 36 | |
| Thereafter | 1,325 | | | 33 | | | 1,358 | |
| Total undiscounted cash flows | $ | 1,480 | | | $ | 61 | | | $ | 1,541 | |
| | | | | |
| Present values | | | | | |
| Long-term lease liabilities | $ | 511 | | | $ | 49 | | | $ | 560 | |
| Total lease liabilities | $ | 511 | | | $ | 49 | | | $ | 560 | |
| Difference between undiscounted cash flows and discounted cash flows | $ | 969 | | | $ | 12 | | | $ | 981 | |
Minimum payments for the operating leases have not been reduced by aggregate minimum sublease rentals from restaurants of approximately $1.7 million that are payable to us under non-cancelable subleases.
9. Employee Stock Plans
Upon the issuance of Host Inc.’s common stock for stock-based compensation, Host L.P. issues to Host Inc. common OP units of an equivalent value. Accordingly, these awards and related disclosures are included in both Host Inc.’s and Host L.P.’s consolidated financial statements.
Host Inc. maintains two stock-based compensation plans, the Comprehensive Stock and Cash Incentive Plan (the “2024 Comprehensive Plan”), under which Host Inc. may award to participating employees restricted stock units (“RSUs”), and the Employee Stock Purchase Plan. At December 31, 2024, there were approximately 22 million shares of Host Inc.’s common stock reserved and available for issuance under the 2024 Comprehensive Plan.
We recognize costs resulting from share-based payments in our financial statements over their vesting periods. No compensation cost is recognized for awards for which employees do not render the requisite services. We classify share-based payment awards granted in exchange for employee services as either equity-classified or liability-classified awards. Equity-classified awards are measured based on their fair value as of the date of grant. In contrast, liability-classified awards are re-measured to fair value each reporting period.
During 2024, 2023 and 2022, we recorded stock-based compensation expense of approximately $24 million, $30 million and $26 million, respectively. Shares granted in 2024, 2023 and 2022 totaled 2.0 million, 1.8 million and 1.8 million, respectively, while 1.5 million, 2.3 million and 1.5 million shares, respectively, vested during those years.
Senior Executive Plan
During 2024, Host Inc. granted 1.7 million RSU awards under the 2024 Comprehensive Plan, which amount represents the maximum number of RSUs that can be earned during the period of 2024 through 2026 if performance is at the “high” level of achievement and, for time-based awards, the executive remains employed. The RSUs vest over a one, two or three-year period and 2.9 million RSUs were unvested at December 31, 2024. Total unrecognized compensation expense related to unvested RSU awards that vest through 2026 is approximately $19 million.
HOST HOTELS & RESORTS, INC., HOST HOTELS & RESORTS, L.P., AND SUBSIDIARIES
NOTES TO CONSOLIDATED FINANCIAL STATEMENTS
RSU awards
Vesting of RSUs awarded in 2024 is based on (1) continued employment on the vesting date (“Time-Based Award”); (2) the achievement of relative total shareholder return (“TSR”); and (3) our Adjusted EBITDAre performance. Approximately 25% of the RSUs are Time-Based Awards and vest on an annual basis over three years; approximately 37.5% of the RSUs are based on the satisfaction of the TSR compared to the NAREIT Equity Lodging & Resort index that serves as a relevant industry/asset specific measurement to our competitors and vest following a three-year performance period; and the remaining 37.5% are based on Adjusted EBITDAre performance and vest following a three-year performance period. The RSUs granted are considered equity-classified awards. As a result, the fair value of these awards is based on the fair value on the grant date, and such grant date fair value is not adjusted for subsequent movements thereof.
We value the time-based awards using the closing stock price on the grant date multiplied by the percentage of shares expected to be released, which is 100% of the time based awards. We also value the Adjusted EBITDAre awards using the closing stock price on the grant date multiplied by the percentage of shares expected to be released; however, as a result of the Adjusted EBITDAre performance conditions, we reevaluate the percentage based on the probability of meeting the performance conditions each period. We value the TSR awards using the economic theory that is the basis for all valuation models, including Binominal, Black-Scholes, exotic options formulas, and Monte Carlo valuations. We valued the TSR awards with the following assumptions:
| | | | | | | | | | | |
| NAREIT Lodging & Resorts Index |
| 2024 Grant Awards | | 2023 Grant Awards |
| Grant date stock price | $ | 19.23 | | | $ | 18.55 | |
| Volatility | 33.2 | % | | 49.2 | % |
| Beta | 0.845 | | 0.695 |
| Risk-free rate - three year award | 4.16 | % | | 4.08 | % |
In making these assumptions, we base the expected volatility on the historical volatility over three years using daily stock price observations. The beta is calculated by comparing the risk of our stock to the risk of the applicable peer group index, using three years of daily price data. We base the risk-free rate on the Treasury bond yields corresponding to the length of each performance period as reported by the Federal Reserve.
The payout schedule for the TSR awards is as follows, with linear interpolation for points between the 30th and 75th percentiles:
| | | | | | | | |
| TSR Percentile Ranking | | Payout (% of Maximum) |
| At or above 75th percentile | | 100 | % |
| 50th percentile | | 50 | % |
| 30th percentile | | 25 | % |
| Below 30th percentile | | — | % |
HOST HOTELS & RESORTS, INC., HOST HOTELS & RESORTS, L.P., AND SUBSIDIARIES
NOTES TO CONSOLIDATED FINANCIAL STATEMENTS
During 2024, 2023 and 2022, we recorded compensation expense of approximately $21 million, $27 million and $23 million, respectively, related to the RSU awards to senior executives. The following table is a summary of the status of our senior executive plans for the three years ended December 31, 2024:
| | | | | | | | | | | | | | | | | | | | | | | | | | | | | | | | | | | |
| Year ended December 31, |
| 2024 | | 2023 | | 2022 |
| Shares (in millions) | | Fair Value (per share) | | Shares (in millions) | | Fair Value (per share) | | Shares (in millions) | | Fair Value (per share) |
| Balance, at beginning of year | 2.6 | | $ | 17 | | | 3.4 | | $ | 15 | | | 3.2 | | $ | 12 | |
| Granted | 1.7 | | 17 | | | 1.6 | | 16 | | | 1.6 | | 17 | |
Vested (1) | (1.3) | | 18 | | | (2.2) | | 19 | | | (1.3) | | 16 | |
| Forfeited/expired | (0.1) | | 18 | | | (0.2) | | 19 | | | (0.1) | | 16 | |
| Balance, at end of year | 2.9 | | 17 | | | 2.6 | | 17 | | | 3.4 | | 15 | |
Issued in calendar year (1) | 1.2 | | 19 | | | 0.7 | | 16 | | | 0.5 | | 17 | |
___________
(1)Shares that vest at December 31 of each year are issued to the employees in the first quarter of the following year, although the requisite service period is complete. Accordingly, the 1.2 million shares issued in 2024 include shares vested at December 31, 2023, after adjusting for shares withheld to meet employee tax requirements. The shares withheld for employee tax requirements were valued at $18 million, $11 million and $8 million for 2024, 2023 and 2022, respectively.
Other Stock Plans
In addition to the share-based plans described above, we maintain an upper-middle management plan and an employee stock purchase plan. The upper-middle management awards are time-based, equity-classified awards that vest within three-years of the grant date and compensation expense is recognized over the life of the award based on the grant date fair value. Through the employee stock purchase plan, employees can purchase stock at a discount of 10% of the lower of the beginning and ending stock price each quarter. During 2024, 2023 and 2022, we granted a total of 0.3 million shares, 0.2 million shares and 0.2 million shares, respectively, under these two programs and recorded compensation expense of approximately $3 million, $3 million and $3 million, respectively.
10. Profit Sharing and Post-employment Benefit Plans
We contribute to defined contribution plans for the benefit of employees who meet certain eligibility requirements and who elect participation in the plans. The discretionary amount to be matched by us is determined annually by Host Inc.’s Board of Directors. Our liability recorded for this obligation is not material. Payments for these items were not material for the three years ended December 31, 2024.
11. Dispositions
We disposed of one hotel in 2023 and four hotels in 2022, and recorded aggregate gains on sale of approximately $69 million and $18 million, respectively. The gain on sale of assets is included in other gains on the statement of operations. We did not have any dispositions during 2024.
In conjunction with the sale of The Camby, Autograph Collection in 2023, we provided a $72 million loan to the buyer. The loan had an initial interest rate equal to Term SOFR plus 425 basis points and an initial scheduled maturity date of June 10, 2025. An additional $7 million in funding was borrowed for property improvement plan financing. As of December 31, 2024, the outstanding loan was included in Notes Receivable on our balance sheets. Subsequent to year-end, the loan to the buyer was repaid in full.
In connection with the sales of the Sheraton Boston Hotel and Sheraton New York Times Square Hotel in 2022, we provided loans to the buyers for $163 million and $250 million, respectively. These loans were repaid during 2023.
HOST HOTELS & RESORTS, INC., HOST HOTELS & RESORTS, L.P., AND SUBSIDIARIES
NOTES TO CONSOLIDATED FINANCIAL STATEMENTS
12. Acquisitions
During 2024, we acquired the following assets:
•the 215-room 1 Hotel Nashville and 506-room Embassy Suites by Hilton Nashville Downtown for $530 million;
•the 234-room 1 Hotel Central Park for $265 million; and
•the 450-room Turtle Bay Resort, including a 49-acre land parcel entitled for development, for a total purchase price of $680 million, net of key money received from Marriott International as part of an agreement to transition management to Marriott and convert the property to The Ritz-Carlton brand. The property has been renamed The Ritz-Carlton O'ahu, Turtle Bay.
On November 1, 2022, we acquired the 125-room Four Seasons Resort and Residences Jackson Hole for a total purchase price of $315 million.
13. Fair Value Measurements
Other Liabilities
Fair Value of Other Financial Liabilities. We did not elect the fair value measurement option for any of our other financial assets or liabilities. The fair values of our notes receivable, secured debt and our credit facility are determined based on the expected future payments discounted at risk-adjusted rates. Senior notes are valued based on quoted market prices. The fair values of financial instruments not included in this table are estimated to be equal to their carrying amounts. The fair value of certain financial assets and financial liabilities is shown below (in millions):
| | | | | | | | | | | | | | | | | | | | | | | |
| December 31, 2024 | | December 31, 2023 |
| Carrying Amount | | Fair Value | | Carrying Amount | | Fair Value |
| Financial assets | | | | | | | |
| Notes receivable (Level 2) | $ | 79 | | | $ | 80 | | | $ | 72 | | | $ | 73 | |
| Financial liabilities | | | | | | | |
| Senior notes (Level 1) | 3,993 | | | 3,838 | | | 3,120 | | | 2,915 | |
| Credit facility (Level 2) | 992 | | | 1,000 | | | 989 | | | 1,000 | |
| Mortgage debt (Level 2) | 98 | | | 91 | | | 100 | | | 86 | |
As of December 31, 2024, notes receivable consists of one loan issued to the buyer in connection with the sale of The Camby, Autograph Collection. Subsequent to year end, the loan to the buyer was repaid in full.
14. Relationship with Marriott International
We have entered into various agreements with Marriott, including those for the management or franchise of approximately 60% of our hotels (as measured by revenues) and certain limited administrative services.
In 2024, 2023 and 2022, we paid Marriott $180 million, $168 million and $136 million, respectively, of hotel management fees and approximately $8.3 million, $8.1 million, and $7.7 million, respectively, of franchise fees.
15. Hotel Management Agreements and Operating and License Agreements
All of our hotels are managed by third parties pursuant to management or operating agreements, with some of our hotels also being subject to separate license agreements addressing matters pertaining to operations under the designated brand. Hotels managed or franchised by Marriott and Hyatt represent approximately 60% and 17% of our total revenues, respectively. Under these agreements, the managers generally have sole responsibility for all activities necessary for the day-to-day operation of the hotels, including establishing room rates, processing reservations and promoting and publicizing the hotels. The managers also provide all employees for the hotels, prepare reports, budgets and projections, control the working capital, and provide other administrative and accounting support services to the hotels. Costs and
HOST HOTELS & RESORTS, INC., HOST HOTELS & RESORTS, L.P., AND SUBSIDIARIES
NOTES TO CONSOLIDATED FINANCIAL STATEMENTS
expenses incurred by the managers are reimbursed by us. We have approval rights over budgets, capital expenditures, significant leases and contractual commitments, and various other matters.
The initial term of our agreements generally is 10 to 25 years, with one or more renewal terms at the option of the manager. The majority of our agreements condition the manager’s right to exercise options for renewal upon the satisfaction of specified economic performance criteria. The manager typically receives a base management fee, which is calculated as a percentage (generally 2-3%) of annual gross revenues, and an incentive management fee, which typically is calculated as a percentage (generally 10-20%) of operating profit after the owner has received a priority return on its investment. In the case of our hotels operating under the W®, Westin®, Luxury Collection® and St. Regis® brands, the base management fee is 1% of annual gross revenues, but that amount is supplemented by license fees payable to Marriott under a separate license agreement pertaining to the designated brand, including rights to use trademarks, service marks and logos, matters relating to compliance with certain brand standards and policies, and the provision of certain system programs and centralized services. Under the license agreement, Marriott generally receives 5% of gross revenues attributable to room sales and 2% of gross revenues attributable to food and beverage sales in addition to the base management fee.
Pursuant to the agreements, the manager furnishes the hotels with certain chain services, which generally are provided on a central or regional basis to all hotels in the manager’s hotel system. Chain services include central training, advertising and promotion, national reservation systems, computerized payroll and accounting services, and such additional services as needed which may be more efficiently performed on a centralized basis. Costs and expenses incurred in providing such services are allocated among the hotels managed, owned or leased by the manager on a fair and equitable basis. In addition, our managers generally sponsor a guest rewards program, the costs of which are charged to all of the hotels that participate in such program.
We are obligated to provide the manager with sufficient funds, generally 4-5% of the revenues generated at the hotel, to cover the cost of (a) certain non-routine repairs and maintenance to the hotels which normally are capitalized, and (b) replacements and renewals to the hotels’ furniture, fixtures and equipment. Under certain circumstances, we will be required to establish escrow accounts for such purposes under terms outlined in the agreements.
We generally are limited in our ability to sell, lease or otherwise transfer our hotels unless the transferee assumes the related management agreement. However, most agreements include owner rights to terminate on the basis of the manager’s failure to meet certain performance-based metrics. Typically, these criteria are subject to the manager’s ability to ‘cure’ and avoid termination by payment to us of specified deficiency amounts (or, in some instances, waiver of the right to receive specified future management fees).
In addition to any performance-based or other termination rights, we have negotiated specific termination rights related to specific agreements. These termination rights can take a number of different forms, including termination of agreements upon sale that leave the property unencumbered by any agreement; termination upon sale provided that the property continues to be operated under a license or franchise agreement with continued brand affiliation; and termination without sale or other condition, which may require the payment of a fee.
16. Geographic and Business Segment Information
Our chief operating decision maker ("CODM") is our chief executive officer. We consider each one of our hotels to be an operating segment, as we allocate resources and assess operating performance based on individual hotels. All of our hotels meet the aggregation criteria for segment reporting and our other real estate investment activities (primarily our equity method investments, retail spaces and office buildings) are immaterial. As such, we report one segment: hotel ownership. Our consolidated foreign operations consist of hotels in two countries as of December 31, 2024. There were no
HOST HOTELS & RESORTS, INC., HOST HOTELS & RESORTS, L.P., AND SUBSIDIARIES
NOTES TO CONSOLIDATED FINANCIAL STATEMENTS
intersegment sales during the periods presented. The following table presents revenues and long-lived assets for each of the geographical areas in which we operate (in millions):
| | | | | | | | | | | | | | | | | | | | | | | | | | | | | | | | | | | | | | |
| | 2024 | | 2023 | | 2022 |
| | Revenues | | Property and
Equipment, net | | Revenues | | Property and
Equipment, net | | Revenues | | Property and
Equipment, net |
| United States | | $ | 5,583 | | | $ | 10,852 | | | $ | 5,219 | | | $ | 9,556 | | | $ | 4,836 | | | $ | 9,678 | |
| Brazil | | 26 | | | 27 | | | 22 | | | 35 | | | 17 | | | 33 | |
| Canada | | 75 | | | 27 | | | 70 | | | 33 | | | 54 | | | 37 | |
| Total | | $ | 5,684 | | | $ | 10,906 | | | $ | 5,311 | | | $ | 9,624 | | | $ | 4,907 | | | $ | 9,748 | |
The CODM's primary measure of performance for our reportable segment is Earnings Before Interest Expense, Income Taxes, Depreciation and Amortization ("EBITDA"). The CODM uses EBITDA to analyze how profitable a hotel is, including reviewing how each department at the hotel performed, in comparison to budget and in comparison to prior year performance, when making capital allocation decisions. We do not allocate corporate level income and expenses to segments. Our CODM does not use asset book values in assessing performance or allocating resources for our operating segments and therefore this information is not disclosed.
HOST HOTELS & RESORTS, INC., HOST HOTELS & RESORTS, L.P., AND SUBSIDIARIES
NOTES TO CONSOLIDATED FINANCIAL STATEMENTS
The following table presents revenues, significant expenses, and EBITDA for our reportable segment (in millions):
| | | | | | | | | | | | | | | | | | | | | | | | | | | | | | | | | | | | | | |
| | 2024 | | 2023 | | 2022 |
| | Hotel Ownership | | Total | | Hotel Ownership | | Total | | Hotel Ownership | | Total |
| Revenues | | | | | | | | | | | | |
| Rooms | | $ | 3,426 | | | $ | 3,426 | | | $ | 3,244 | | | $ | 3,244 | | | $ | 3,014 | | | $ | 3,014 | |
| Food and beverage | | 1,716 | | | 1,716 | | | 1,582 | | | 1,582 | | | 1,418 | | | 1,418 | |
| Other | | 542 | | | 542 | | | 485 | | | 485 | | | 475 | | | 475 | |
| Total revenues | | 5,684 | | | 5,684 | | | 5,311 | | | 5,311 | | | 4,907 | | | 4,907 | |
| Expenses | | | | | | | | | | | | |
| Rooms | | 849 | | | 849 | | | 787 | | | 787 | | | 727 | | | 727 | |
| Food and beverage | | 1,137 | | | 1,137 | | | 1,042 | | | 1,042 | | | 928 | | | 928 | |
| Other departmental and support expenses | | 1,383 | | | 1,383 | | | 1,280 | | | 1,280 | | | 1,181 | | | 1,181 | |
| Management fees | | 254 | | | 254 | | | 249 | | | 249 | | | 217 | | | 217 | |
| Other property-level expenses | | 411 | | | 411 | | | 383 | | | 383 | | | 325 | | | 325 | |
Other segment items (1) | | (40) | | | (40) | | | (83) | | | (83) | | | (11) | | | (11) | |
| Segment EBITDA | | 1,690 | | | 1,690 | | | 1,653 | | | 1,653 | | | 1,540 | | | 1,540 | |
| Adjustments and reconciling items: | | | | | | | | | | | | |
| Depreciation and amortization | | | | (762) | | | | | (697) | | | | | (664) | |
| Corporate and other expenses | | | | (123) | | | | | (132) | | | | | (107) | |
| Net gain on property insurance settlements | | | | 70 | | | | | 3 | | | | | 6 | |
| Interest income | | | | 54 | | | | | 75 | | | | | 30 | |
| Interest expense | | | | (215) | | | | | (191) | | | | | (156) | |
| Other gains | | | | — | | | | | 71 | | | | | 17 | |
| Equity in earnings of affiliates | | | | 7 | | | | | 6 | | | | | 3 | |
| Provision for income taxes | | | | (14) | | | | | (36) | | | | | (26) | |
| Consolidated Net Income | | | | $ | 707 | | | | | $ | 752 | | | | | $ | 643 | |
| | | | | | | | | | | | |
| Capital Expenditures | | $ | 548 | | | $ | 548 | | | $ | 646 | | | $ | 646 | | | $ | 504 | | | $ | 504 | |
_____________
(1)Other segment items consist of gain on business interruption proceeds. This amount, combined with net gain on property insurance settlements, make up the amount of net gain on insurance settlements on our consolidated statements of operations.
17. Legal Proceedings, Guarantees and Contingencies
Various legal proceedings arise in the ordinary course of our business regarding the operation of our hotels and company matters. To the extent not covered by insurance, these lawsuits generally fall into the following broad categories: disputes involving hotel-level contracts, employment litigation, compliance with laws such as the Americans with Disabilities Act, tax disputes and other general matters. Under our management agreements, our operators have broad latitude to resolve individual hotel-level claims for amounts generally less than $150,000. However, for matters exceeding such threshold, our operators may not settle claims without our consent.
HOST HOTELS & RESORTS, INC., HOST HOTELS & RESORTS, L.P., AND SUBSIDIARIES
NOTES TO CONSOLIDATED FINANCIAL STATEMENTS
Based on our analysis of legal proceedings with which the Company and our hotel managers are currently involved or of which we are aware and the resolution of similar claims in the past, we have recorded immaterial accruals as of December 31, 2024 related to such claims. We have estimated that, in the aggregate, our losses related to these proceedings will not be material. We are not aware of any other matters with a reasonably possible unfavorable outcome for which disclosure of a loss contingency is required. No assurances can be given as to the outcome of any pending legal proceedings.
Hurricane Loss Contingencies
Many of our hotels in Florida were affected by Hurricanes Helene and Milton, which made landfall in September and October 2024, respectively. Due to evacuation mandates and/or loss of commercial power, four of our properties in Florida were temporarily closed, three of which have reopened. The most significant damage sustained during the storms occurred at The Don CeSar, which closed on September 25, 2024, following a mandatory evacuation order prior to the landfall of Hurricane Helene. The Don CeSar sustained extensive damage due to storm surge, which flooded the lower level of the hotel, including the fitness center, two food and beverage ("F&B") outlets, retail outlets and the resort's beach club. Remediation efforts are underway, and we currently expect a phased reopening of the hotel beginning late in the first quarter of 2025. Limited property damage was reported at the other Florida properties within our consolidated portfolio.
We are still evaluating the complete scope of property damage and business interruption loss at our Florida properties. At The Don CeSar, our current estimate of the book value of the property and equipment written off and remediation costs is approximately $51 million, for which we have recorded a corresponding insurance receivable of $51 million. We believe our insurance coverage should be sufficient to cover substantially all of the property damage and the near-term loss of business in excess of our insurance deductibles; therefore, we have not recorded any loss related to The Don CeSar on the consolidated statements of operations as of December 31, 2024. However, for certain of our other properties, we have recorded a loss of $6 million related to property damage and remediation costs for which we will not be filing an insurance claim. The loss is included in net gain on insurance settlements on our consolidated statements of operations as of December 31, 2024.
In September 2022, the majority of our hotels in Florida were affected by Hurricane Ian. The most significant damage sustained during the storm occurred at The Ritz-Carlton, Naples and Hyatt Regency Coconut Point Resort and Spa. The Hyatt Regency Coconut Point reopened to guests in November 2022, with the final phase of reconstruction, the resort's waterpark, completed in June 2023. On July 6, 2023, The Ritz-Carlton, Naples reopened its guestrooms, suites and amenities, including the new tower expansion and completed the final restoration step of bringing the permanent central energy plant online in April 2024. We have received the final total settlement of $308 million of insurance proceeds related to claims resulting from Hurricane Ian. For the years ended December 31, 2024 and 2023, $19 million and $80 million, respectively, was recognized as a gain on business interruption, and $72 million and $3 million, respectively, was recognized as a gain on property insurance, which are both included in net gain on insurance settlements on our consolidated statements of operations.
Maui Wildfires
We recognized $21 million of business interruption proceeds in 2024 representing the final settlement from claims resulting from the August 2023 wildfires in Maui. This is included in net gain on insurance settlements on our consolidated statements of operations. There was no property damage caused by the event.
Tax Indemnification Agreements
Because of certain federal and state income tax considerations of the former owners of two hotels currently owned by Host L.P., we have agreed to restrictions on selling such hotels, or repaying or refinancing mortgage debt, for varying periods. One of these agreements expires in 2028 and the other in 2031.
Item 9. Changes in and Disagreements with Accountants on Accounting and Financial Disclosure
None.
Item 9A. Controls and Procedures
Controls and Procedures (Host Hotels & Resorts, Inc.)
Disclosure Controls and Procedure
Under the supervision and with the participation of our management, including Host Inc.’s Chief Executive Officer and Chief Financial Officer, we have evaluated the effectiveness of our disclosure controls and procedures pursuant to Exchange Act Rule 13a-15(b) as of the end of the period covered by this report. Based on that evaluation, Host Inc.’s Chief Executive Officer and Chief Financial Officer have concluded that these disclosure controls and procedures were effective to provide reasonable assurance that information required to be disclosed by us in reports we file or submit under the Exchange Act is (1) recorded, processed, summarized and reported within the time periods specified in the Securities and Exchange Commission’s rules and forms and (2) accumulated and communicated to our management, including Host Inc.’s Chief Executive Officer and Chief Financial Officer, as appropriate to allow timely decisions regarding required disclosures.
Management's Report on Internal Control over Financial Reporting
Management is responsible for establishing and maintaining adequate internal control over financial reporting for Host Inc. With the participation of Host Inc.’s Chief Executive Officer and Chief Financial Officer, management conducted an evaluation of the effectiveness of our internal control over financial reporting as of December 31, 2024 based on the Internal Control—Integrated Framework (2013) issued by the Committee of Sponsoring Organizations of the Treadway Commission. Based on this evaluation, management concluded that our internal control over financial reporting was effective as of December 31, 2024. There were no changes in our internal control over financial reporting during the quarter ended December 31, 2024 that have materially affected, or are reasonably likely to materially affect, our internal control over financial reporting.
Our independent registered public accounting firm, KPMG LLP, has issued an attestation report on the effectiveness of our internal control over financial reporting of Host Inc., which appears in Item 8. Controls and Procedures (Host Hotels & Resorts, L.P.)
Disclosure Controls and Procedures
Under the supervision and with the participation of our management, including Host Inc.’s Chief Executive Officer and Chief Financial Officer, we have evaluated the effectiveness of our disclosure controls and procedures pursuant to Exchange Act Rule 13a-15(b) as of the end of the period covered by this report. Based on that evaluation, Host Inc.’s Chief Executive Officer and Chief Financial Officer have concluded that these disclosure controls and procedures were effective to provide reasonable assurance that information required to be disclosed by us in reports we file or submit under the Exchange Act is (1) recorded, processed, summarized and reported within the time periods specified in the Securities and Exchange Commission’s rules and forms and (2) accumulated and communicated to our management, including Host Inc.’s Chief Executive Officer and Chief Financial Officer, as appropriate to allow timely decisions regarding required disclosures.
Management's Report on Internal Control over Financial Reporting
Management is responsible for establishing and maintaining adequate internal control over financial reporting for Host L.P. With the participation of Host Inc.’s Chief Executive Officer and Chief Financial Officer, management conducted an evaluation of the effectiveness of our internal control over financial reporting as of December 31, 2024 based on the Internal Control–Integrated Framework (2013) issued by the Committee of Sponsoring Organizations of the Treadway Commission. Based on this evaluation, management concluded that our internal control over financial reporting was effective as of December 31, 2024. There were no changes in our internal control over financial reporting during the quarter ended December 31, 2024 that have materially affected, or are reasonably likely to materially affect, our internal control over financial reporting.
This annual report does not include an attestation report of Host L.P.’s independent registered public accounting firm regarding internal control over financial reporting. Management’s report was not subject to attestation by Host L.P.’s registered public accounting firm pursuant to rules of the Securities and Exchange Commission applicable to “non-accelerated filers.”
Item 9B. Other Information
During the three months ended December 31, 2024, no director or officer of Host Inc. adopted, modified or terminated any "Rule 10b5-1 trading arrangement" or "non-Rule 10b5-1 trading arrangement," as each term is defined in Item 408 of Regulation S-K.
Item 9C. Disclosure Regarding Foreign Jurisdictions that Prevent Inspections
None.
PART III
Certain information called for by Items 10-14 is incorporated by reference from Host Inc.’s 2025 Annual Meeting of Stockholders Notice and Proxy Statement (to be filed pursuant to Regulation 14A not later than 120 days after the close of our fiscal year).
Item 10. Directors, Executive Officers and Corporate Governance
The information required by this item with respect to directors is incorporated by reference to the section of Host Inc.’s definitive Proxy Statement for its 2025 Annual Meeting of Stockholders entitled “Proposal One: Election of Directors.” See Part I. “Information about Our Executive Officers” of this Annual Report for information regarding executive officers. The information required by this item with respect to Audit Committee and Audit Committee Financial Experts is incorporated by reference to the section of Host Inc.’s definitive Proxy Statement for its 2025 Annual Meeting of Stockholders entitled “Corporate Governance and Board Matters.” There have been no material changes to the procedures by which stockholders may recommend nominees to the Board of Directors since our last annual report. If applicable, the information required by this item regarding compliance by our directors and executive officers with Section 16(a) of the Securities and Exchange Act of 1934, as amended, is incorporated by reference to the section of Host Inc.’s definitive Proxy Statement for its 2025 Annual Meeting of Stockholders entitled “Delinquent Section 16(a) Reports.”
We have adopted a Code of Business Conduct and Ethics that applies to all directors and employees, including our Chief Executive Officer, Chief Financial Officer, Corporate Controller and other employees who perform financial or accounting functions. The Code is available at the Corporate Governance section of our website at www.hosthotels.com. A copy of the Code is available in print, free of charge, to stockholders and unitholders upon request to the company at the address set forth in Item 1. of this Annual Report under the section “Business—Where to Find Additional Information.” We intend to satisfy the disclosure requirements under the Securities and Exchange Act of 1934, as amended, regarding an amendment to or waiver from a provision of our Code of Business Conduct and Ethics by posting such information on our web site. We have adopted an Insider Trading Policy Statement that governs the purchase, sale, and/or other dispositions of our securities by directors, officers and employees that is reasonably designed to promote compliance with insider trading laws, rules and regulations and NASDAQ listing standards. A copy of our Insider Trading Policy Statement is filed as Exhibit 19.1 to this report.
Item 11. Executive Compensation
The information required by this item is incorporated by reference to the sections of Host Inc.’s definitive Proxy Statement for its 2025 Annual Meeting of Stockholders entitled: “Compensation Discussion and Analysis,” “Executive Officer Compensation" (except for the section within "Executive Officer Compensation" entitled "Pay versus Performance" which shall not be incorporated by reference), and “Director Compensation”.
Item 12. Security Ownership of Certain Beneficial Owners and Management and Related Stockholder and Unitholder Matters
The information required by this item is incorporated by reference to the sections of Host Inc.’s definitive Proxy Statement for its 2025 Annual Meeting of Stockholders entitled: “Security Ownership of Certain Beneficial Owners and Management” and “Executive Officer Compensation—Securities Authorized for Issuance Under Equity Compensation Plans.”
Item 13. Certain Relationships and Related Transactions, and Director Independence
The information required by this item is incorporated by reference to the sections of Host Inc.’s definitive Proxy Statement for its 2025 Annual Meeting of Stockholders entitled: “Certain Relationships and Related Person Transactions” and “Corporate Governance and Board Matters—Independence of Directors.”
Item 14. Principal Accountant Fees and Services
The information required by this item is incorporated by reference to the section of Host Inc.’s definitive Proxy Statement for its 2025 Annual Meeting of Stockholders entitled “Proposal Two-Ratification of Appointment of Independent Registered Public Accountants – Principal Accountant Fees and Services.”
PART IV
Item 15. Exhibits and Financial Statement Schedules.
(a)LIST OF DOCUMENTS FILED AS PART OF THIS REPORT
(i)FINANCIAL STATEMENTS
All financial statements of the registrants are set forth under Item 8 of this Report on Form 10-K.
(ii)FINANCIAL STATEMENT SCHEDULES
The following financial information is filed herewith on the pages indicated.
Financial Schedules:
| | | | | | | | | | | | | | |
| | | | Page |
| III. | | Real Estate and Accumulated Depreciation. | | |
All other schedules are omitted because they are not applicable or the required information is included in the consolidated financial statements or notes thereto.
(b)EXHIBITS
In reviewing the agreements included as exhibits to this report, please remember they are included to provide you with information regarding their terms and are not intended to provide any other factual or disclosure information about the company, its subsidiaries or other parties to the agreements. The agreements contain representations and warranties by each of the parties to the applicable agreement. These representations and warranties have been made solely for the benefit of the other parties to the applicable agreement and:
•should not in all instances be treated as categorical statements of fact, but rather as a way of allocating the risk to one of the parties if those statements prove to be inaccurate;
•have been qualified by disclosures that were made to the other party in connection with the negotiation of the applicable agreement, which disclosures are not necessarily reflected in the agreement;
•may apply standards of materiality in a way that is different from what may be viewed as material to you or other investors; and
•were made only as of the date of the applicable agreement or such other date or dates as may be specified in the agreement and are subject to more recent developments.
Accordingly, these representations and warranties may not describe the actual state of affairs as of the date they were made or at any other time.
| | | | | | | | | | | |
Exhibit
No. | | Description |
| | | |
| 3. | | Articles of Incorporation and Bylaws |
| | | |
| 3.1 | | |
| | | |
| 3.1A | | |
| | | |
| 3.2 | | |
| |
| 4. | | Instruments Defining Rights of Security Holders |
| | | |
| 4.1 | | See Exhibit 3.1 and 3.2 for provisions of the Articles and Bylaws of Host Hotels & Resorts, Inc. defining the rights of security holders. See Exhibit 3.1A for provisions of the Agreement of Limited Partnership of Host Hotels & Resorts, L.P. defining the rights of security holders. |
| | | |
| 4.2 | | |
| | | |
| 4.3 | | Indenture, dated May 15, 2015, by and between Host Hotels & Resorts, L.P. and The Bank of New York Mellon, as trustee (incorporated by reference to Exhibit 4.1 to Host Hotels & Resorts, Inc., and Host Hotels & Resorts, L.P. Current Report on Form 8-K, filed May 18, 2015). |
| | | |
| 4.4 | | First Supplemental Indenture, dated May 15, 2015, by and between Host Hotels & Resorts, L.P. and The Bank of New York Mellon, as trustee, to the Indenture dated May 15, 2015 (incorporated by reference to Exhibit 4.2 to Host Hotels & Resorts, Inc. and Host Hotels & Resorts, L.P. Current Report on Form 8-K, filed May 18, 2015). |
| | | |
| 4.5 | | Second Supplemental Indenture, dated October 14, 2015, by and between Host Hotels & Resorts, L.P. and The Bank of New York Mellon, as trustee, to the Indenture dated May 15, 2015 (incorporated by reference to Exhibit 4.1 to Host Hotels & Resorts, Inc. and Host Hotels & Resorts, L.P. Current Report on Form 8-K, filed October 14, 2015). |
| | | |
| 4.6 | | Fifth Supplemental Indenture, dated September 26, 2019, by and between Host Hotels & Resorts, L.P. and The Bank of New York Mellon, as trustee, to the Indenture dated May 15, 2015 (incorporated by reference to Exhibit 4.1 to Host Hotels & Resorts, Inc. and Host Hotels & Resorts, L.P. Current Report on Form 8-K filed on September 26, 2019). |
| | | |
| 4.7 | | Sixth Supplemental Indenture, dated August 20, 2020, by and between Host Hotels & Resorts, L.P. and The Bank of New York Mellon, as trustee, to the Indenture dated May 15, 2015 (incorporated by reference to Exhibit 4.1 to Host Hotels & Resorts, Inc. and Host Hotels & Resorts, L.P. Current Report on Form 8-K filed on August 21, 2020). |
| | | |
| 4.8 | | Seventh Supplemental Indenture, dated November 23, 2021, between Host Hotels & Resorts, L.P. and The Bank of New York Mellon, as trustee, to the Indenture dated May 15, 2015 (incorporated by reference to Exhibit 4.1 to Host Hotels & Resorts, Inc. and Host Hotels & Resorts, L.P. Current Report on Form 8-K filed on November 23, 2021). |
| | | |
| 4.9 | | Eighth Supplemental Indenture, dated May 10, 2024, between Host Hotels & Resorts, L.P. and The Bank of New York Mellon, as trustee, to the Indenture dated May 15, 2015 (incorporated by reference to Exhibit 4.1 to Host Hotels & Resorts, Inc. and Host Hotels & Resorts, L.P. Current Report on Form 8-K filed on May 10, 2024). |
| | | |
| 4.10 | | Ninth Supplemental Indenture, dated August 12, 2024, between Host Hotels & Resorts, L.P. and The Bank of New York Mellon, as trustee, to the Indenture dated May 15, 2015 (incorporated by reference to Exhibit 4.1 to Host Hotels & Resorts, Inc. and Host Hotels & Resorts, L.P. Current Report on Form 8-K filed on August 12, 2024). |
| | | |
| 4.11 | | |
| | | |
| 10. | | Material Contracts |
| | | |
| | | | | | | | | | | |
| 10.1 | | |
| | | |
| 10.2 | | Trust Agreement between Wilmington Trust Company and Host Hotels & Resorts, L.P., dated June 1, 2006, relating to the Host Hotels & Resorts, L.P. Executive Deferred Compensation Plan (incorporated by reference to Exhibit 10.2 of Host Hotels & Resorts, Inc. and Host Hotels & Resorts, L.P. Annual Report on Form 10-K for the year ended December 31, 2013, filed on February 25, 2014). |
| | | |
| 10.3 | | |
| | | |
| 10.4 | | |
| | | |
| 10.5 | | |
| | | |
| 10.6 | | |
| | | |
| 10.7 | | |
| | | |
| 10.8 | | Sixth Amended and Restated Credit Agreement, dated as of January 4, 2023, among Host Hotels & Resorts, L.P., Bank of America, N.A., as administrative agent, JPMorgan Chase Bank, N.A. and Wells Fargo Bank, N.A., as co-syndication agents, and various other agents and lenders (incorporated by reference to Exhibit 10.1 to the combined Current Report on Form 8-K of Host Hotels & Resorts, Inc. and Host Hotels & Resorts, L.P., filed on January 5, 2023). |
| | | |
| 10.9 | | Distribution Agreement, dated May 31, 2023, among Host Hotels & Resorts, Inc., J.P. Morgan Securities LLC, BofA Securities, Inc., Goldman Sachs & Co. LLC, Jefferies LLC, Morgan Stanley & Co. LLC, Scotia Capital (USA) Inc., Truist Securities, Inc. and Wells Fargo Securities, LLC, as sales agents and forward sellers, and JPMorgan Chase Bank, National Association, Bank of America, N.A., Goldman Sachs & Co. LLC, Jefferies LLC, Morgan Stanley & Co. LLC, The Bank of Nova Scotia, Truist Bank and Wells Fargo Bank, National Association, as forward purchasers (incorporated by reference to Exhibit 1.1 to the Current Report on Form 8-K of Host Hotels & Resorts, Inc., filed on May 31, 2023). |
| | | |
| 10.10 | | |
| | | |
| 10.11 | | |
| | | |
| 10.12 | | |
| | | |
| 10.13 | | |
| | | |
| 10.14 | | |
| | | |
| 10.15 | | |
| | | |
| | | | | | | | | | | |
| 10.16 | | First Amendment to the Sixth Amended and Restated Credit Agreement, dated as of June 28, 2024, by and between Host Hotels & Resorts, L.P. and Bank of America, N.A., as administrative agent (incorporated by reference to Exhibit 10.16 to Host Hotels & Resorts, Inc. and Host Hotels & Resorts, L.P. Quarterly Report on Form 10-Q, filed on August 2, 2024). |
| | | |
| 19. | | Insider Trading Policies and Procedures | |
| | | |
| 19.1* | | |
| | | |
| 21. | | Subsidiaries | |
| | | |
| 21.1* | | |
| | | |
| 21.2* | | |
| | | |
| 23. | | Consents |
| | | |
| 23* | | |
| | | |
| | |
| | | |
| | |
| | | |
| 31. | | Rule 13a-14(a)/15d-14(a) Certifications |
| | | |
| 31.1* | | |
| | | |
| 31.2* | | |
| | | |
| 31.3* | | |
| | | |
| 31.4* | | |
| | | |
| 32. | | Section 1350 Certifications |
| | | |
| 32.1* | | |
| | | |
| 32.2* | | |
| | | |
| 97. | | Policy Relating to Recovery of Erroneously Awarded Compensation |
| | | |
| 97.1 | | |
| | | |
| 99. | | Additional Exhibit | |
| | | |
| 99.1* | | | |
| | | |
| 101 | | XBRL | |
| | | |
| 101.SCH | | Inline XBRL Taxonomy Extension Schema Document. | Submitted electronically with this report. |
| | | |
| 101.CAL | | Inline XBRL Taxonomy Calculation Linkbase Document. | Submitted electronically with this report. |
| | | |
| 101.DEF | | Inline XBRL Taxonomy Extension Definition Linkbase Document. | Submitted electronically with this report. |
| | | |
| 101.LAB | | Inline XBRL Taxonomy Label Linkbase Document. | Submitted electronically with this report. |
| | | |
| 101.PRE | | Inline XBRL Taxonomy Presentation Linkbase Document. | Submitted electronically with this report. |
| | | |
| 104 | | Cover Page Interactive Data File | (embedded within the Inline XBRL document) submitted under Exhibit 101. |
Attached as Exhibit 101 to this report are the following documents formatted in iXBRL (Inline Extensible Business Reporting Language): (i) the Consolidated Statements of Operations for the Years ended December 31, 2024, 2023 and 2022, respectively, for Host Hotels & Resorts, Inc.; (ii) the Consolidated Balance Sheets at December 31, 2024 and December 31, 2023, respectively, for Host Hotels & Resorts, Inc.; (iii) the Consolidated Statements of Comprehensive
Income for the Years ended December 31, 2024, 2023 and 2022, respectively, for Host Hotels & Resorts, Inc.; (iv) the Consolidated Statements of Equity for the Years ended December 31, 2024, 2023 and 2022, respectively, for Host Hotels & Resorts, Inc.; (v) the Consolidated Statements of Cash Flows for the Years ended December 31, 2024, 2023 and 2022, respectively, for Host Hotels & Resorts, Inc.; (vi) the Consolidated Statements of Operations for the Years ended December 31, 2024, 2023 and 2022, respectively, for Host Hotels & Resorts, L.P.; (vii) the Consolidated Balance Sheets at December 31, 2024 and December 31, 2023, respectively, for Host Hotels & Resorts, L.P.; (viii) the Consolidated Statements of Comprehensive Income for the Years ended December 31, 2024, 2023 and 2022, respectively, for Host Hotels & Resorts, L.P.; (ix) the Consolidated Statements of Capital for the Years ended December 31, 2024, 2023 and 2022, respectively, for Host Hotels & Resorts, L.P.; (x) the Consolidated Statements of Cash Flows for the Years ended December 31, 2024, 2023 and 2022, respectively, for Host Hotels & Resorts, L.P.; and (xi) Notes to the Consolidated Financial Statements that have been detail tagged.
_____________________________________
*Filed or furnished herewith.
†This certificate is being furnished solely to accompany the report pursuant to 18 U.S.C. 1350 and is not being filed for purposes of Section 18 of the Securities Exchange Act of 1934, as amended, and is not to be incorporated by reference into any filing of the Company, whether made before or after the date hereof, regardless of any general incorporation language in such filing.
Item 16. Form 10‑K Summary
None.
SIGNATURES
Pursuant to the requirements of Section 13 or 15(d) of the Securities Exchange Act of 1934, the registrant has duly caused this report to be signed on its behalf by the undersigned, thereunto duly authorized.
| | | | | | | | |
| HOST HOTELS & RESORTS, INC. |
| | |
| Date: February 26, 2025 | By: | /s/ SOURAV GHOSH |
| | Sourav Ghosh Executive Vice President and Chief Financial Officer |
Pursuant to the requirements of the Securities Exchange Act of 1934, this report has been signed below by the following persons on behalf of the registrant and in the capacities and on the dates indicated.
| | | | | | | | | | | | | | |
| Signatures | | Title | | Date |
| | | | |
| /s/ RICHARD E. MARRIOTT | | Chairman of the Board of Directors | | February 26, 2025 |
| Richard E. Marriott | | |
| | | | |
| /s/ JAMES F. RISOLEO | | President, Chief Executive Officer and Director (Principal Executive Officer) | | February 26, 2025 |
| James F. Risoleo | | |
| | | | |
| /s/ SOURAV GHOSH | | Executive Vice President and Chief Financial Officer (Principal Financial Officer) | | February 26, 2025 |
| Sourav Ghosh | | |
| | | | |
| /s/ JOSEPH C. OTTINGER | | Senior Vice President, Corporate Controller (Principal Accounting Officer) | | February 26, 2025 |
| Joseph C. Ottinger | | |
| | | | |
| /s/ MARY L. BAGLIVO | | Director | | February 26, 2025 |
| Mary L. Baglivo | | |
| | | | |
| /s/ HERMAN E. BULLS | | Director | | February 26, 2025 |
| | |
| Herman E. Bulls | | | |
| | Director | | February 26, 2025 |
| /s/ DIANA M. LAING | | |
| Diana M. Laing | | |
| | | | |
| /s/ MARY HOGAN PREUSSE | | Director | | February 26, 2025 |
| Mary Hogan Preusse | | |
| | | | |
| /s/ WALTER C. RAKOWICH | | Director | | February 26, 2025 |
| Walter C. Rakowich | | |
| | | | |
| /s/ GORDON H. SMITH | | Director | | February 26, 2025 |
| Gordon H. Smith | | |
| | | | |
| /s/ A. WILLIAM STEIN | | Director | | February 26, 2025 |
| A. William Stein | | |
SIGNATURES
Pursuant to the requirements of Section 13 or 15(d) of the Securities Exchange Act of 1934, the registrant has duly caused this report to be signed on its behalf by the undersigned, thereunto duly authorized.
| | | | | | | | |
| HOST HOTELS & RESORTS, L.P. |
| | |
| Date: February 26, 2025 | By: | HOST HOTELS & RESORTS, INC., its general partner |
| | |
| By: | /s/ SOURAV GHOSH |
| | Sourav Ghosh Executive Vice President and Chief Financial Officer |
Pursuant to the requirements of the Securities Exchange Act of 1934, this report has been signed below by the following officers and directors of Host Hotels & Resorts, Inc., the general partner of the registrant, and in the capacities and on the dates indicated.
| | | | | | | | | | | | | | |
| Signatures | | Title | | Date |
| | | | |
| /s/ RICHARD E. MARRIOTT | | Chairman of the Board of Directors | | February 26, 2025 |
| Richard E. Marriott | | |
| | | | |
| /s/ JAMES F. RISOLEO | | President, Chief Executive Officer and
Director (Principal Executive Officer) | | February 26, 2025 |
| James F. Risoleo | | |
| | | | |
| /s/ SOURAV GHOSH | | Executive Vice President and Chief Financial Officer (Principal Financial Officer) | | February 26, 2025 |
| Sourav Ghosh | | |
| | | | |
| /s/ JOSEPH C. OTTINGER | | Senior Vice President, Corporate Controller (Principal Accounting Officer) | | February 26, 2025 |
| Joseph C. Ottinger | | |
| | | | |
| /s/ MARY L. BAGLIVO | | Director | | February 26, 2025 |
| Mary L. Baglivo | | |
| | | | |
| /s/ HERMAN E. BULLS | | Director | | February 26, 2025 |
| Herman E. Bulls | | |
| | | | |
| /s/ DIANA M. LAING | | Director | | February 26, 2025 |
| Diana M. Laing | | |
| | | | |
| /s/ MARY HOGAN PREUSSE | | Director | | February 26, 2025 |
| Mary Hogan Preusse | | |
| | | | |
| /s/ WALTER C. RAKOWICH | | Director | | February 26, 2025 |
| Walter C. Rakowich | | |
| | | | |
| /s/ GORDON H. SMITH | | Director | | February 26, 2025 |
| Gordon H. Smith | | |
| | | | |
| /s/ A. WILLIAM STEIN | | Director | | February 26, 2025 |
| A. William Stein | | |
HOST HOTELS & RESORTS, INC., HOST HOTELS & RESORTS, L.P., AND SUBSIDIARIES
REAL ESTATE AND ACCUMULATED DEPRECIATION
December 31, 2024
(in millions)
| | | | | | | | | | | | | | | | | | | | | | | | | | | | | | | | | | | | | | | | | | | | | | | | | | | | | | | | | | | | | | | | | | | | | | | | | | |
| | | | Initial Cost | | | | | | Gross Amount at December 31, 2024 | | | | | | |
| Description | | Debt | | Land | | Buildings &
Improvements | | Subsequent Costs Capitalized, net ⁽¹⁾ | | Foreign
Currency
Adjustment | | Land | | Buildings &
Improvements | | Total | | Accumulated
Depreciation | | Date of
Completion of
Construction | | Date
Acquired | | Depreciation
Life |
| Hotels: | | | | | | | | | | | | | | | | | | | | | | | | |
| 1 Hotel Central Park | | $ | — | | | $ | 98 | | | $ | 149 | | | $ | — | | | $ | — | | | $ | 98 | | | $ | 149 | | | $ | 247 | | | $ | 3 | | | — | | 2024 | | | 29 |
| 1 Hotel South Beach | | — | | | 182 | | | 443 | | | 23 | | | — | | | 182 | | | 466 | | | 648 | | | 98 | | | — | | 2019 | | | 34 |
| AC Hotel Scottsdale North | | — | | | 4 | | | 31 | | | — | | | — | | | 4 | | | 31 | | | 35 | | | 5 | | | 2020 | | | — | | 31 |
| Alila Ventana Big Sur | | — | | | 40 | | | 104 | | | 4 | | | — | | | 40 | | | 108 | | | 148 | | | 13 | | | — | | 2021 | | | 31 |
| Andaz Maui at Wailea Resort | | — | | | 151 | | | 255 | | | 65 | | | — | | | 151 | | | 320 | | | 471 | | | 64 | | | — | | 2018 | | | 38 |
| Axiom Hotel | | — | | | 36 | | | 38 | | | 44 | | | — | | | 36 | | | 82 | | | 118 | | | 33 | | | — | | 2014 | | | 33 |
| Baker's Cay Resort Key Largo, Curio Collection by Hilton | | — | | | 80 | | | 117 | | | 2 | | | — | | | 80 | | | 119 | | | 199 | | | 15 | | | — | | 2021 | | | 33 |
| Boston Marriott Copley Place | | — | | | — | | | 203 | | | 106 | | | — | | | — | | | 309 | | | 309 | | | 182 | | | — | | 2002 | | | 40 |
| Calgary Marriott Downtown Hotel | | — | | | 5 | | | 18 | | | 49 | | | (9) | | | 5 | | | 58 | | | 63 | | | 51 | | | — | | 1996 | | | 40 |
| Coronado Island Marriott Resort & Spa | | — | | | — | | | 53 | | | 62 | | | — | | | — | | | 115 | | | 115 | | | 88 | | | — | | 1997 | | | 40 |
| Denver Marriott Tech Center | | — | | | 6 | | | 26 | | | 87 | | | — | | | 6 | | | 113 | | | 119 | | | 94 | | | — | | 1994 | | | 40 |
| Denver Marriott West | | — | | | — | | | 12 | | | 19 | | | — | | | — | | | 31 | | | 31 | | | 28 | | | — | | 1983 | | | 40 |
| Embassy Suites by Hilton Chicago Downtown Magnificent Mile | | — | | | — | | | 86 | | | 21 | | | — | | | — | | | 107 | | | 107 | | | 63 | | | — | | 2004 | | | 40 |
| Fairmont Kea Lani, Maui | | — | | | 55 | | | 294 | | | 173 | | | — | | | 55 | | | 467 | | | 522 | | | 223 | | | — | | 2004 | | | 40 |
| Four Seasons Resort Orlando at Walt Disney World® Resort | | — | | | 91 | | | 510 | | | 21 | | | — | | | 91 | | | 531 | | | 622 | | | 66 | | | — | | 2021 | | | 37 |
| Four Seasons Resort and Residences Jackson Hole | | — | | | 59 | | | 245 | | | 7 | | | — | | | 59 | | | 252 | | | 311 | | | 20 | | | — | | 2022 | | | 32 |
| Gaithersburg Marriott Washingtonian Center | | — | | | 7 | | | 22 | | | 15 | | | — | | | 7 | | | 37 | | | 44 | | | 31 | | | — | | 1993 | | | 40 |
| Grand Hyatt Atlanta in Buckhead | | — | | | 8 | | | 88 | | | 49 | | | — | | | 8 | | | 137 | | | 145 | | | 88 | | | — | | 1998 | | | 40 |
| Grand Hyatt San Francisco | | — | | | 52 | | | 331 | | | 5 | | | — | | | 52 | | | 336 | | | 388 | | | 79 | | | — | | 2018 | | | 34 |
| Grand Hyatt Washington | | — | | | 154 | | | 247 | | | 82 | | | — | | | 154 | | | 329 | | | 483 | | | 152 | | | — | | 2012 | | | 33 |
| Hotel Van Zandt | | 98 | | | 58 | | | 179 | | | 2 | | | — | | | 58 | | | 181 | | | 239 | | | 18 | | | — | | 2021 | | | 34 |
| Houston Airport Marriott at George Bush Intercontinental | | — | | | — | | | 10 | | | 95 | | | — | | | — | | | 105 | | | 105 | | | 100 | | | — | | 1984 | | | 40 |
| Houston Marriott Medical Center/Museum District | | — | | | — | | | 19 | | | 48 | | | — | | | — | | | 67 | | | 67 | | | 58 | | | — | | 1998 | | | 40 |
| Hyatt Place Waikiki Beach | | — | | | 12 | | | 120 | | | 12 | | | — | | | 12 | | | 132 | | | 144 | | | 52 | | | — | | 2013 | | | 34 |
| Hyatt Regency Austin | | — | | | 19 | | | 139 | | | 3 | | | — | | | 19 | | | 142 | | | 161 | | | 19 | | | — | | 2021 | | | 33 |
| Hyatt Regency Coconut Point Resort and Spa | | — | | | 33 | | | 185 | | | 25 | | | — | | | 33 | | | 210 | | | 243 | | | 50 | | | — | | 2018 | | | 36 |
HOST HOTELS & RESORTS, INC., HOST HOTELS & RESORTS, L.P., AND SUBSIDIARIES
REAL ESTATE AND ACCUMULATED DEPRECIATION (continued)
December 31, 2024
(in millions)
| | | | | | | | | | | | | | | | | | | | | | | | | | | | | | | | | | | | | | | | | | | | | | | | | | | | | | | | | | | | | | | | | | | | | | | | | | |
| | | | Initial Cost | | | | | | Gross Amount at December 31, 2024 | | | | | | |
| Description | | Debt | | Land | | Buildings &
Improvements | | Subsequent Costs Capitalized, net ⁽¹⁾ | | Foreign
Currency
Adjustment | | Land | | Buildings &
Improvements | | Total | | Accumulated
Depreciation | | Date of
Completion of
Construction | | Date
Acquired | | Depreciation
Life |
| Hyatt Regency Maui Resort and Spa | | — | | | 92 | | | 212 | | | 163 | | | — | | | 81 | | | 386 | | | 467 | | | 229 | | | — | | 2003 | | | 40 |
| Hyatt Regency Reston | | — | | | 11 | | | 78 | | | 40 | | | — | | | 12 | | | 117 | | | 129 | | | 79 | | | — | | 1998 | | | 40 |
| Hyatt Regency San Francisco Airport | | — | | | 16 | | | 119 | | | 113 | | | — | | | 20 | | | 228 | | | 248 | | | 170 | | | — | | 1998 | | | 40 |
| Hyatt Regency Washington on Capitol Hill | | — | | | 40 | | | 230 | | | 55 | | | — | | | 40 | | | 285 | | | 325 | | | 157 | | | — | | 2005 | | | 40 |
| JW Marriott Atlanta Buckhead | | — | | | 16 | | | 21 | | | 42 | | | — | | | 16 | | | 63 | | | 79 | | | 47 | | | — | | 1990 | | | 40 |
| JW Marriott Hotel Rio de Janeiro | | — | | | 13 | | | 29 | | | 5 | | | (33) | | | 3 | | | 11 | | | 14 | | | 5 | | | — | | 2010 | | | 40 |
| JW Marriott Houston by The Galleria | | — | | | 4 | | | 26 | | | 60 | | | — | | | 6 | | | 84 | | | 90 | | | 66 | | | — | | 1994 | | | 40 |
| JW Marriott Washington, DC | | — | | | 26 | | | 98 | | | 73 | | | — | | | 26 | | | 171 | | | 197 | | | 129 | | | — | | 2003 | | | 40 |
| Manchester Grand Hyatt San Diego | | — | | | — | | | 548 | | | 79 | | | — | | | — | | | 627 | | | 627 | | | 325 | | | — | | 2011 | | | 35 |
| Marina del Rey Marriott | | — | | | — | | | 13 | | | 48 | | | — | | | — | | | 61 | | | 61 | | | 43 | | | — | | 1995 | | | 40 |
| Marriott Downtown at CF Toronto Eaton Centre | | — | | | — | | | 27 | | | 39 | | | (8) | | | — | | | 58 | | | 58 | | | 46 | | | — | | 1995 | | | 40 |
| Marriott Marquis San Diego Marina | | — | | | — | | | 202 | | | 432 | | | — | | | — | | | 634 | | | 634 | | | 462 | | | — | | 1996 | | | 40 |
| Miami Marriott Biscayne Bay | | — | | | 38 | | | 27 | | | 99 | | | — | | | 38 | | | 126 | | | 164 | | | 76 | | | — | | 1998 | | | 40 |
| Minneapolis Marriott City Center | | — | | | 34 | | | 27 | | | 51 | | | — | | | 35 | | | 77 | | | 112 | | | 65 | | | — | | 1995 | | | 40 |
| Nashville Hotels | | — | | | 60 | | | 438 | | | — | | | — | | | 60 | | | 438 | | | 498 | | | 14 | | | — | | 2024 | | | 24 |
| New Orleans Marriott | | — | | | 16 | | | 96 | | | 165 | | | — | | | 16 | | | 261 | | | 277 | | | 209 | | | — | | 1996 | | | 40 |
| New York Marriott Downtown | | — | | | 19 | | | 79 | | | 56 | | | — | | | 19 | | | 135 | | | 154 | | | 104 | | | — | | 1997 | | | 40 |
| New York Marriott Marquis | | — | | | 49 | | | 552 | | | 169 | | | — | | | 49 | | | 721 | | | 770 | | | 624 | | | — | | 1986 | | | 40 |
| Newark Liberty International Airport Marriott | | — | | | — | | | 30 | | | 50 | | | — | | | — | | | 80 | | | 80 | | | 72 | | | — | | 1984 | | | 40 |
| Orlando World Center Marriott | | — | | | 18 | | | 157 | | | 517 | | | — | | | 29 | | | 663 | | | 692 | | | 417 | | | — | | 1997 | | | 40 |
| Philadelphia Airport Marriott | | — | | | — | | | 42 | | | 26 | | | — | | | — | | | 68 | | | 68 | | | 52 | | | — | | 1995 | | | 40 |
| Rio de Janeiro Parque Olimpico Hotels | | — | | | 21 | | | 39 | | | 1 | | | (39) | | | 7 | | | 15 | | | 22 | | | 6 | | | 2014 | | | — | | 35 |
| San Antonio Marriott Rivercenter | | — | | | — | | | 86 | | | 122 | | | — | | | — | | | 208 | | | 208 | | | 138 | | | — | | 1996 | | | 40 |
| San Antonio Marriott Riverwalk | | — | | | 6 | | | 45 | | | 42 | | | — | | | 6 | | | 87 | | | 93 | | | 71 | | | — | | 1995 | | | 40 |
| San Francisco Marriott Fisherman's Wharf | | — | | | 6 | | | 20 | | | 35 | | | — | | | 6 | | | 55 | | | 61 | | | 47 | | | — | | 1994 | | | 40 |
| San Francisco Marriott Marquis | | — | | | — | | | 278 | | | 212 | | | — | | | — | | | 490 | | | 490 | | | 393 | | | — | | 1989 | | | 40 |
| Santa Clara Marriott | | — | | | — | | | 39 | | | 86 | | | — | | | — | | | 125 | | | 125 | | | 109 | | | — | | 1989 | | | 40 |
| Sheraton Parsippany Hotel | | — | | | 8 | | | 30 | | | 18 | | | — | | | 8 | | | 48 | | | 56 | | | 36 | | | — | | 2006 | | | 40 |
HOST HOTELS & RESORTS, INC., HOST HOTELS & RESORTS, L.P., AND SUBSIDIARIES
REAL ESTATE AND ACCUMULATED DEPRECIATION (continued)
December 31, 2024
(in millions)
| | | | | | | | | | | | | | | | | | | | | | | | | | | | | | | | | | | | | | | | | | | | | | | | | | | | | | | | | | | | | | | | | | | | | | | | | | |
| | | | Initial Cost | | | | | | Gross Amount at December 31, 2024 | | | | | | |
| Description | | Debt | | Land | | Buildings &
Improvements | | Subsequent Costs Capitalized, net ⁽¹⁾ | | Foreign
Currency
Adjustment | | Land | | Buildings &
Improvements | | Total | | Accumulated
Depreciation | | Date of
Completion of
Construction | | Date
Acquired | | Depreciation
Life |
| Swissôtel Chicago | | — | | | 29 | | | 132 | | | 103 | | | — | | | 30 | | | 234 | | | 264 | | | 149 | | | — | | 1998 | | | 40 |
| Tampa Airport Marriott | | — | | | — | | | 9 | | | 30 | | | — | | | — | | | 39 | | | 39 | | | 35 | | | — | | 1971 | | | 40 |
| The Alida, Savannah, a Tribute Portfolio Hotel | | — | | | 6 | | | 96 | | | 1 | | | — | | | 6 | | | 97 | | | 103 | | | 9 | | | — | | 2021 | | | 36 |
| The Don CeSar | | — | | | 46 | | | 158 | | | 13 | | | — | | | 46 | | | 171 | | | 217 | | | 64 | | | — | | 2017 | | | 34 |
| The Laura Hotel | | — | | | 9 | | | 55 | | | 2 | | | — | | | 9 | | | 57 | | | 66 | | | 7 | | | — | | 2021 | | | 33 |
| The Logan | | — | | | 26 | | | 60 | | | 76 | | | — | | | 27 | | | 135 | | | 162 | | | 104 | | | — | | 1998 | | | 40 |
| The Phoenician, A Luxury Collection Resort | | — | | | 59 | | | 307 | | | 130 | | | — | | | 58 | | | 438 | | | 496 | | | 190 | | | — | | 2015 | | | 32 |
| The Ritz-Carlton Naples, Tiburón | | — | | | 22 | | | 10 | | | 108 | | | — | | | 22 | | | 118 | | | 140 | | | 72 | | | 2002 | | | — | | 40 |
| The Ritz-Carlton O'ahu, Turtle Bay | | — | | | 271 | | | 355 | | | 1 | | | — | | | 271 | | | 356 | | | 627 | | | 5 | | | — | | 2024 | | | 32 |
| The Ritz-Carlton, Amelia Island | | — | | | 25 | | | 115 | | | 117 | | | — | | | 25 | | | 232 | | | 257 | | | 150 | | | — | | 1998 | | | 40 |
| The Ritz-Carlton, Marina del Rey | | — | | | — | | | 52 | | | 43 | | | — | | | — | | | 95 | | | 95 | | | 74 | | | — | | 1997 | | | 40 |
| The Ritz-Carlton, Naples | | — | | | 19 | | | 126 | | | 487 | | | — | | | 21 | | | 611 | | | 632 | | | 289 | | | — | | 1996 | | | 40 |
| The Ritz-Carlton, Tysons Corner | | — | | | — | | | 89 | | | 53 | | | — | | | — | | | 142 | | | 142 | | | 98 | | | — | | 1998 | | | 40 |
| The Singer Oceanfront Resort, Curio Collection by Hilton | | — | | | 2 | | | 10 | | | 47 | | | — | | | 2 | | | 57 | | | 59 | | | 31 | | | — | | 1994 | | | 40 |
| The St. Regis Houston | | — | | | 6 | | | 33 | | | 27 | | | — | | | 6 | | | 60 | | | 66 | | | 36 | | | — | | 2006 | | | 40 |
| The Westin Chicago River North | | — | | | 33 | | | 116 | | | 26 | | | — | | | 33 | | | 142 | | | 175 | | | 62 | | | — | | 2010 | | | 40 |
| The Westin Cincinnati | | — | | | — | | | 54 | | | 25 | | | — | | | — | | | 79 | | | 79 | | | 45 | | | — | | 2006 | | | 40 |
| The Westin Denver Downtown | | — | | | — | | | 89 | | | 56 | | | — | | | — | | | 145 | | | 145 | | | 69 | | | — | | 2006 | | | 40 |
| The Westin Georgetown, Washington D.C. | | — | | | 16 | | | 80 | | | 32 | | | — | | | 16 | | | 112 | | | 128 | | | 58 | | | — | | 2006 | | | 40 |
| The Westin Kierland Resort & Spa | | — | | | 100 | | | 280 | | | 55 | | | — | | | 100 | | | 335 | | | 435 | | | 159 | | | — | | 2006 | | | 40 |
| The Westin Seattle | | — | | | 39 | | | 175 | | | 54 | | | — | | | 39 | | | 229 | | | 268 | | | 125 | | | — | | 2006 | | | 40 |
| The Westin South Coast Plaza, Costa Mesa | | — | | | — | | | 46 | | | 25 | | | — | | | — | | | 71 | | | 71 | | | 69 | | | — | | 2006 | | | 40 |
| The Westin Waltham Boston | | — | | | 9 | | | 59 | | | 24 | | | — | | | 9 | | | 83 | | | 92 | | | 48 | | | — | | 2006 | | | 40 |
| W Seattle | | — | | | 11 | | | 125 | | | 15 | | | — | | | 11 | | | 140 | | | 151 | | | 71 | | | — | | 2006 | | | 40 |
| Washington Marriott at Metro Center | | — | | | 20 | | | 24 | | | 38 | | | — | | | 20 | | | 62 | | | 82 | | | 36 | | | — | | 1994 | | | 40 |
| Total hotels: | | 98 | | | 2,391 | | | 10,167 | | | 5,405 | | | (89) | | | 2,378 | | | 15,496 | | | 17,874 | | | 7,939 | | | | | | | |
| Other properties, each less than 5% of total | | — | | | 79 | | | 1 | | | 7 | | | — | | | 79 | | | 8 | | | 87 | | | 2 | | | — | | | Various | | 40 |
| TOTAL | | $ | 98 | | | $ | 2,470 | | | $ | 10,168 | | | $ | 5,412 | | | $ | (89) | | | $ | 2,457 | | | $ | 15,504 | | | $ | 17,961 | | | $ | 7,941 | | | | | | | |
___________
(1)Subsequent costs capitalized are net of impairment expense.
HOST HOTELS & RESORTS, INC., AND SUBSIDIARIES
HOST HOTELS & RESORTS, L.P., AND SUBSIDIARIES
REAL ESTATE AND ACCUMULATED DEPRECIATION
December 31, 2024
(in millions)
Notes:
(A)The change in total cost of properties for the fiscal years ended December 31, 2024, 2023 and 2022 is as follows:
| | | | | | | | |
| Balance, December 31, 2021 | | $ | 15,946 | |
| Additions: | | |
| Acquisitions | | 303 | |
| Capital expenditures and transfers from construction-in-progress | | 314 | |
| Deductions: | | |
| Dispositions and other | | (694) | |
| | |
| | |
| Balance, December 31, 2022 | | 15,869 | |
| Additions: | | |
| | |
| Capital expenditures and transfers from construction-in-progress | | 540 | |
| Deductions: | | |
| Dispositions and other | | (175) | |
| | |
| | |
| Balance, December 31, 2023 | | 16,234 | |
| Additions: | | |
| Acquisitions | | 1,422 | |
| Capital expenditures and transfers from construction-in-progress | | 368 | |
| Deductions: | | |
| Dispositions and other | | (63) | |
| | |
| | |
| Balance, December 31, 2024 | | $ | 17,961 | |
(B)The change in accumulated depreciation and amortization of real estate assets for the fiscal years ended December 31, 2024, 2023 and 2022 is as follows:
| | | | | | | | |
| Balance, December 31, 2021 | | $ | 6,626 | |
| Depreciation and amortization | | 550 | |
| Dispositions and other | | (300) | |
| | |
| Balance, December 31, 2022 | | 6,876 | |
| Depreciation and amortization | | 573 | |
| Dispositions and other | | (102) | |
| | |
| Balance, December 31, 2023 | | 7,347 | |
| Depreciation and amortization | | 619 | |
| Dispositions and other | | (25) | |
| | |
| Balance, December 31, 2024 | | $ | 7,941 | |
(C)The aggregate cost of real estate for federal income tax purposes is approximately $11,505 million at December 31, 2024.
(D)The total cost of properties excludes construction-in-progress assets.