Link to searchable text of slide shown above
Link to searchable text of slide shown above

Link to searchable text of slide shown above

Link to searchable text of slide shown above
Link to searchable text of slide shown above

Link to searchable text of slide shown above

Link to searchable text of slide shown above
Link to searchable text of slide shown above
Link to searchable text of slide shown above

Link to searchable text of slide shown above
Link to searchable text of slide shown above

Link to searchable text of slide shown above

Link to searchable text of slide shown above
Link to searchable text of slide shown above
Link to searchable text of slide shown above

Link to searchable text of slide shown above

Link to searchable text of slide shown above

Link to searchable text of slide shown above
Link to searchable text of slide shown above

Link to searchable text of slide shown above
Link to searchable text of slide shown above
Link to searchable text of slide shown above
Link to searchable text of slide shown above
Link to searchable text of slide shown above
Link to searchable text of slide shown above

Link to searchable text of slide shown above

Link to searchable text of slide shown above
Link to searchable text of slide shown above
Link to searchable text of slide shown above
Link to searchable text of slide shown above
Link to searchable text of slide shown above

Link to searchable text of slide shown above

Link to searchable text of slide shown above
Link to searchable text of slide shown above
Link to searchable text of slide shown above
Link to searchable text of slide shown above
Link to searchable text of slide shown above
Link to searchable text of slide shown above
Link to searchable text of slide shown above

Link to searchable text of slide shown above
Link to searchable text of slide shown above
Link to searchable text of slide shown above

Link to searchable text of slide shown above
Searchable text section of graphics shown above
Filed by UnitedGlobalCom, Inc. pursuant to Rule 425 under the Securities Act of 1933 Subject Company: UGC Europe, Inc. Commission File No. 333-109496 |
|
[GRAPHIC]
UNITED GLOBAL COM
[LOGO]
October 16, 2003
[LOGO] |
Under the Private Securities Litigation Reform Act of 1995:
Certain matters discussed in the following presentation, including those items identified as guidance, are based upon the consummation of previously announced acquisitions and transactions and may contain forward-looking statements that deal with potential future circumstances and developments. The discussion of such matters and subject areas is qualified by the inherent risks and uncertainties surrounding future expectations generally, and such discussion also may materially differ from UGC’s actual future experience involving any one or more such matters and discussion areas. UGC has attempted to identify, in context, certain of the factors that it currently believes may cause actual future experiences and results to differ from UGC’s current expectation in reports filed with the Securities and Exchange Commission.
Please refer to the Company’s website at www.unitedglobal.com under Investor Relations for further information.
Please refer to the Appendix at the end of this presentation, as well as the Company’s Press Release dated August 14, 2003 and SEC filings, for definitions of the following terms which are used herein including: Adjusted EBITDA, Free Cash Flow, Revenue Generating Units (RGUs), and Average Revenue per Unit (ARPU), as well as a GAAP reconciliation of non-GAAP financial measures.
2
• What’s New?
• European Operations
• Financial Update
• Q&A
• Appendix
3
• Largest MSO outside the U.S.
• 9 million RGUs in 15 countries
• Substantial voice and data business –1.5 million RGUs and 40% of revenue
• Significant financial and balance sheet improvement over the last 18 months
• $2.8 billion equity market value
4
• Liberty to purchase controlling interest from Founders
• Increases ownership of UGC to 75%
• Strengthens strategic and operating flexibility
• European subsidiary completes debt restructuring
• Group leverage(1) now below 6.0x
(1) Pro forma for UPC Polska restructuring, see Appendix for summary.
5
Exchange Offer for Minority Interest in UGC Europe, Inc.
UnitedGlobalCom | Public | ||
66.75%(1) | 33.25% | ||
| |||
UGC | |||
| |||
UPC | Corporate | chellomedia | |
• Cable television operations |
| • chello portal | |
|
| • Media & content activities | |
|
| • Investments | |
• Listed on NASDAQ on September 3rd
• Ticker: UGCE
• 50 million shares issued
• Exchange offer launched Oct. 6th at ratio of 9.0 UCOMA shares for each share of UGCE
(1) Final ownership may vary slightly due to potential resolution of general unsecured claims.
6
Strong 2nd Quarter Results
UGC Adjusted EBITDA
[CHART]
7
• Footprint
• Networks
• Products
• Bundling
• Key Initiatives
8
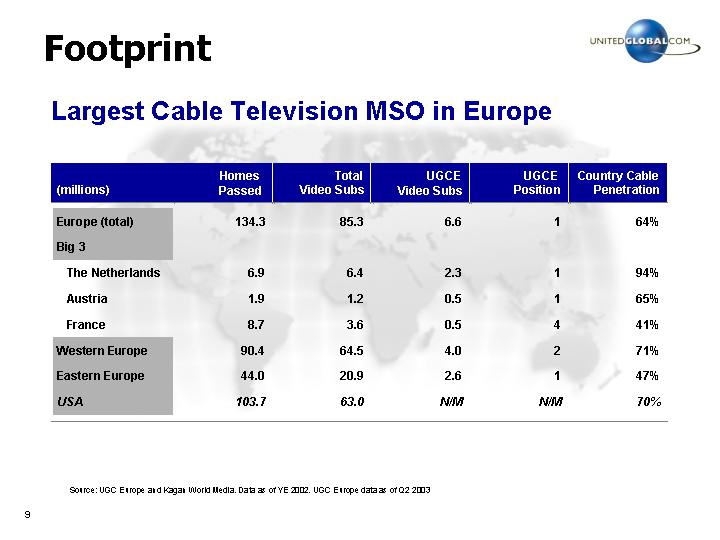
Largest Cable Television MSO in Europe
(millions) |
| Homes |
| Total |
| UGCE |
| UGCE |
| Country Cable |
|
|
|
|
|
|
|
|
|
|
|
|
|
Europe (total) |
| 134.3 |
| 85.3 |
| 6.6 |
| 1 |
| 64 | % |
|
|
|
|
|
|
|
|
|
|
|
|
Big 3 |
|
|
|
|
|
|
|
|
|
|
|
|
|
|
|
|
|
|
|
|
|
|
|
The Netherlands |
| 6.9 |
| 6.4 |
| 2.3 |
| 1 |
| 94 | % |
|
|
|
|
|
|
|
|
|
|
|
|
Austria |
| 1.9 |
| 1.2 |
| 0.5 |
| 1 |
| 65 | % |
|
|
|
|
|
|
|
|
|
|
|
|
France |
| 8.7 |
| 3.6 |
| 0.5 |
| 4 |
| 41 | % |
|
|
|
|
|
|
|
|
|
|
|
|
Western Europe |
| 90.4 |
| 64.5 |
| 4.0 |
| 2 |
| 71 | % |
|
|
|
|
|
|
|
|
|
|
|
|
Eastern Europe |
| 44.0 |
| 20.9 |
| 2.6 |
| 1 |
| 47 | % |
|
|
|
|
|
|
|
|
|
|
|
|
USA |
| 103.7 |
| 63.0 |
| N/M |
| N/M |
| 70 | % |
[GRAPHIC]
Source: UGC Europe and Kagan World Media. Data as of YE 2002. UGC Europe data as of Q2 2003
9
Last Mile Upgrade in Core European Markets Largely Complete:
Upgraded HFC Plant (Mhz)
[CHART]
5.6 Million 2-Way Homes(1)
[CHART]
(1) As of June 30, 2003
10
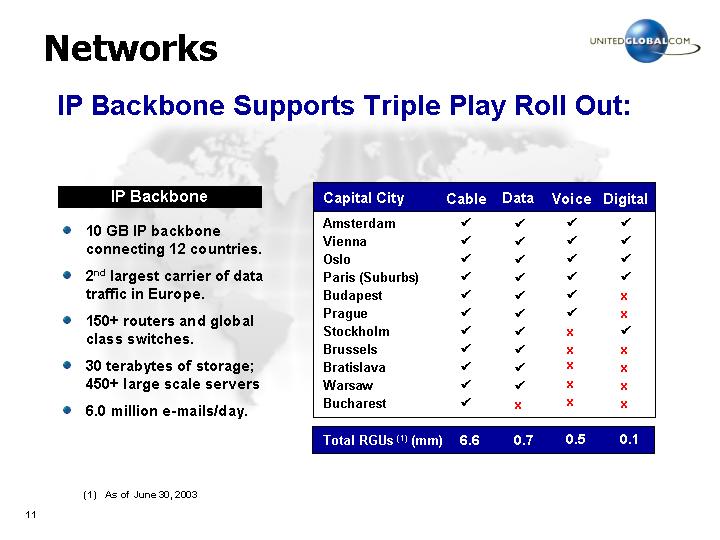
IP Backbone Supports Triple Play Roll Out:
IP Backbone
• 10 GB IP backbone connecting 12 countries.
• 2nd largest carrier of data traffic in Europe.
• 150+ routers and global class switches.
• 30 terabytes of storage; 450+ large scale servers
• 6.0 million e-mails/day.
Capital City |
| Cable |
| Data |
| Voice |
| Digital |
|
Amsterdam |
| ý |
| ý |
| ý |
| ý |
|
Vienna |
| ý |
| ý |
| ý |
| ý |
|
Oslo |
| ý |
| ý |
| ý |
| ý |
|
Paris (Suburbs) |
| ý |
| ý |
| ý |
| ý |
|
Budapest |
| ý |
| ý |
| ý |
| o |
|
Prague |
| ý |
| ý |
| ý |
| o |
|
Stockholm |
| ý |
| ý |
| o |
| ý |
|
Brussels |
| ý |
| ý |
| o |
| o |
|
Bratislava |
| ý |
| ý |
| o |
| o |
|
Warsaw |
| ý |
| ý |
| o |
| o |
|
Bucharest |
| ý |
| o |
| o |
| o |
|
|
|
|
|
|
|
|
|
|
|
Total RGUs (1) (mm) |
| 6.6 |
| 0.7 |
| 0.5 |
| 0.1 |
|
(1) As of June 30, 2003
11
• Service
• 25-35 broadcast and satellite television channels
• Statistics
(000’s) |
| 2000 |
| 2001 |
| 2002 |
| 6/03 |
| ||||
RGUs |
| 6,548 |
| 6,622 |
| 6,633 |
| 6,609 |
| ||||
Pen % |
| 66 | % | 65 | % | 65 | % | 64 | % | ||||
ARPU |
| € | 8.43 |
| € | 8.94 |
| € | 9.11 |
| € | 9.35 |
|
GM % |
| 78 | % | 78 | % | 82 | % | 84 | % | ||||
• Strategy
• Drive rate increases (3%-30% per year)
• Up-sell new services (data, voice, etc)
• Enhance digital offering
12
• Service
• Additional 50+ channels of “pay” TV.
• NVOD, EPG, T-Mail, ITV, digital music
• Statistics
(000’s) |
| 2000 |
| 2001 |
| 2002 |
| 6/03 |
| |||
RGUs |
| 24 |
| 78 |
| 126 |
| 129 |
| |||
Pen % |
| 1 | % | 2 | % | 2 | % | 2 | % | |||
ARPU(1) |
| n.a. |
| € | 13.18 |
| € | 17.03 |
| € | 20.59 |
|
GM % |
| n.a. |
| -160 | % | 8 | % | 23 | % | |||
• Strategy
• Stabilize network; drive down CPE costs
• Secure key content (i.e. movies & sports)
• Re-launch in The Netherlands Fall ‘04
(1) Incremental ARPU above basic rates.
13
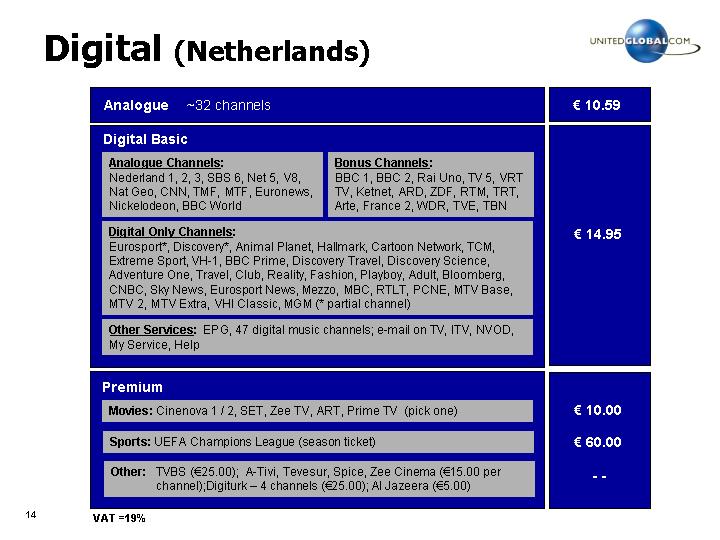
Digital (Netherlands)
Analogue ~32 channels |
| € | 10.59 |
| |
|
|
|
| ||
Digital Basic |
| € | 14.95 |
| |
Analogue Channels: |
|
| |||
Nederland 1, 2, 3, SBS 6, Net 5, V8, Nat Geo, CNN, TMF, MTF, Euronews, Nickelodeon, BBC World |
|
| |||
|
|
| |||
Bonus Channels: |
|
| |||
BBC 1, BBC 2, Rai Uno, TV 5, VRT TV, Ketnet, ARD, ZDF, RTM, TRT, Arte, France 2, WDR, TVE, TBN |
|
| |||
|
|
| |||
Digital Only Channels: |
|
| |||
Eurosport*, Discovery*, Animal Planet, Hallmark, Cartoon Network, TCM, Extreme Sport, VH-1, BBC Prime, Discovery Travel, Discovery Science, Adventure One, Travel, Club, Reality, Fashion, Playboy, Adult, Bloomberg, CNBC, Sky News, Eurosport News, Mezzo, MBC, RTLT, PCNE, MTV Base, MTV 2, MTV Extra, VHI Classic, MGM (* partial channel) |
|
| |||
|
|
| |||
Other Services: EPG, 47 digital music channels; e-mail on TV, ITV, NVOD, My Service, Help |
|
| |||
|
|
|
| ||
Premium |
|
|
| ||
Movies: Cinenova 1 / 2, SET, Zee TV, ART, Prime TV (pick one) |
| € | 10.00 |
| |
|
|
|
| ||
Sports: UEFA Champions League (season ticket) |
| € | 60.00 |
| |
|
|
|
| ||
Other: TVBS (€25.00); A-Tivi, Tevesur, Spice, Zee Cinema (€15.00 per channel);Digiturk — 4 channels (€25.00); Al Jazeera (€5.00) |
| — |
| ||
VAT =19%
14
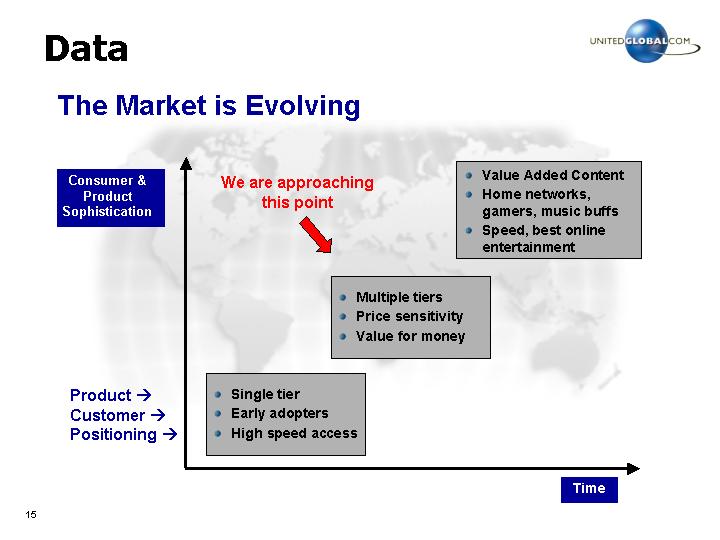
The Market is Evolving
[CHART]
15
• Service
• Europe’s largest cable broadband provider (“chello”)
• Statistics
(000’s) |
| 2000 |
| 2001 |
| 2002 |
| 6/03 |
| ||||
RGUs |
| 343 |
| 524 |
| 676 |
| 723 |
| ||||
Pen % |
| 8 | % | 10 | % | 13 | % | 13 | % | ||||
ARPU |
| € | 29.35 |
| € | 33.78 |
| € | 37.48 |
| € | 38.00 |
|
GM % (1) |
| — |
| — |
| — |
| 96 | % | ||||
• Strategy
• Maintain dominant share vs. ADSL
• Migrate to tiered services by market
• Improve content offer over time
(1) Prior to revenue share from UPC Broadband to chello media (inter company).
16
Speed, Price and Data Limits are Key Product Differentiators Today
Standard access features |
| chello lite |
| chello classic |
| chello plus |
| |||
Subscription fee (€/month) |
| € | 34.95 |
| € | 49.95 |
| € | 79.95 |
|
Modem speed settings down/up (kbps) |
| 300/64 |
| 1500/128 |
| 3000/384 |
| |||
Number of email boxes |
| 1 |
| 1 |
| 3 |
| |||
Webspace (MB) |
| 10 |
| 10 |
| 30 |
| |||
Number of PCs allowed |
| 1 |
| 3 |
| 3 |
| |||
Data Limit (GB/month) |
| 1 |
| 10 |
| 30 |
| |||
Additional access features: |
|
|
|
|
|
|
| |||
Additional email box (€/month) |
| 4.95 |
| 3.95 |
| 2.95 |
| |||
Home Networking subscription (€/month) |
| — |
| 9.95 |
| 5.95 |
| |||
- Hardware lease option (eg. Kit 1) (€/month) |
| — |
| 9.95 |
| 5.95 |
| |||
- Additional optional IP services (€/month) |
| — |
| 4.95 |
| 3.95 |
| |||
Content: |
|
|
|
|
|
|
| |||
Security (eg. McAfee VirusScan) (€/year) |
| € | 42.95 |
| € | 36.90 |
| € | 27.00 |
|
Online games-on-demand (average €/month) |
| — |
| 12.00 |
| 8.00 |
| |||
Adult content (average €/month) |
| — |
| 10.00 |
| 7.00 |
| |||
17
Tiered Services Are Expanding the Market
Weekly Sales (Netherlands)
[CHART]
• chello “lite” sales now represent 45% of total
• chello “classic” sales are steady
• total sales are up 66%
18
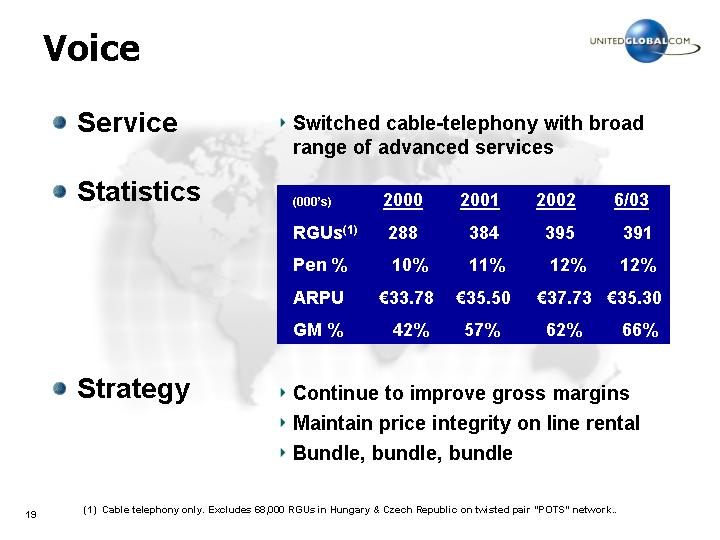
• Service
• Switched cable-telephony with broad range of advanced services
• Statistics
(000’s) |
| 2000 |
| 2001 |
| 2002 |
| 6/03 |
| ||||
RGUs(1) |
| 288 |
| 384 |
| 395 |
| 391 |
| ||||
Pen % |
| 10 | % | 11 | % | 12 | % | 12 | % | ||||
ARPU |
| € | 33.78 |
| € | 35.50 |
| € | 37.73 |
| € | 35.30 |
|
GM % |
| 42 | % | 57 | % | 62 | % | 66 | % | ||||
• Strategy
• Continue to improve gross margins
• Maintain price integrity on line rental
• Bundle, bundle, bundle
(1) Cable telephony only. Excludes 68,000 RGUs in Hungary & Czech Republic on twisted pair “POTS” network..
19
Where are we today?
Data, Voice & Digital Services Only
(thousands)
Austria
Cust’s |
| Svcs |
| RGU’s |
| % |
|
176 |
| 1.0 |
| 176 |
| 66 | % |
90 |
| 2.1 |
| 185 |
| 34 | % |
266 |
| 1.4 |
| 361 |
| 100 | % |
• 34% take 2 or more of services
• 40% of data subs take telephony
• Digital represents big upside
Netherlands
Cust’s |
| Svcs |
| RGU’s |
| % |
|
353 |
| 1.0 |
| 353 |
| 82 | % |
86 |
| 2.1 |
| 177 |
| 18 | % |
439 |
| 1.2 |
| 530 |
| 100 | % |
• 18% take 2 or more services
• 20% of data subs take telephony
• Digital represents big upside
20
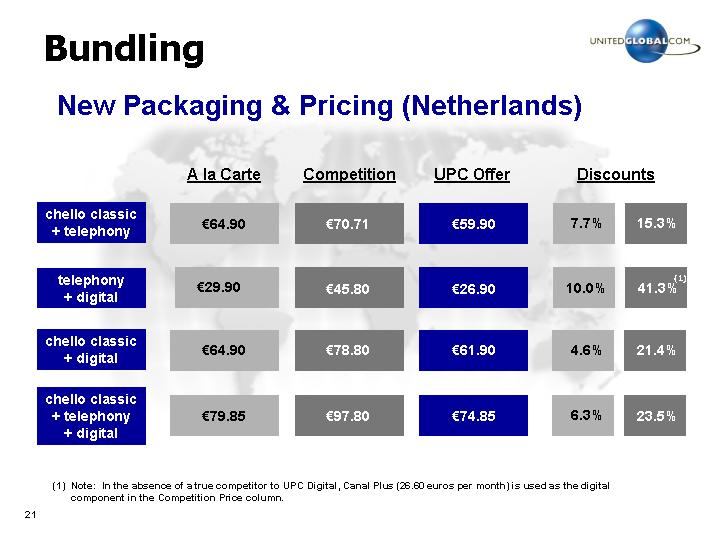
New Packaging & Pricing (Netherlands)
|
| A la Carte |
| Competition |
| UPC Offer |
| Discounts |
| |||||
|
|
|
|
|
|
|
|
|
|
|
| |||
chello classic + telephony |
| € | 64.90 |
| € | 70.71 |
| € | 59.90 |
| 7.7 | % | 15.3 | % |
|
|
|
|
|
|
|
|
|
|
|
| |||
telephony + digital |
| € | 29.90 |
| € | 45.80 |
| € | 26.90 |
| 10.0 | % | 41.3 | %(1) |
|
|
|
|
|
|
|
|
|
|
|
| |||
chello classic + digital |
| € | 64.90 |
| € | 78.80 |
| € | 61.90 |
| 4.6 | % | 21.4 | % |
|
|
|
|
|
|
|
|
|
|
|
| |||
chello classic + telephony + digital |
| € | 79.85 |
| € | 97.80 |
| € | 74.85 |
| 6.3 | % | 23.5 | % |
(1) Note: In the absence of a true competitor to UPC Digital, Canal Plus (26.60 euros per month) is used as the digital component in the Competition Price column.
21
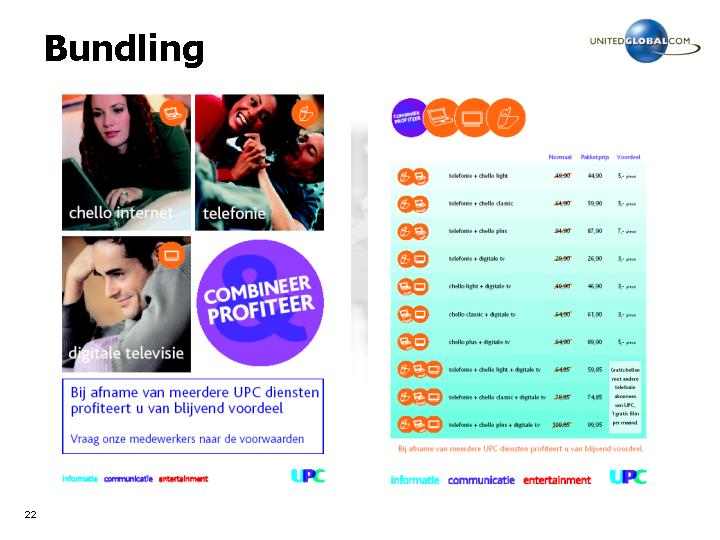
| [GRAPHIC] |
22
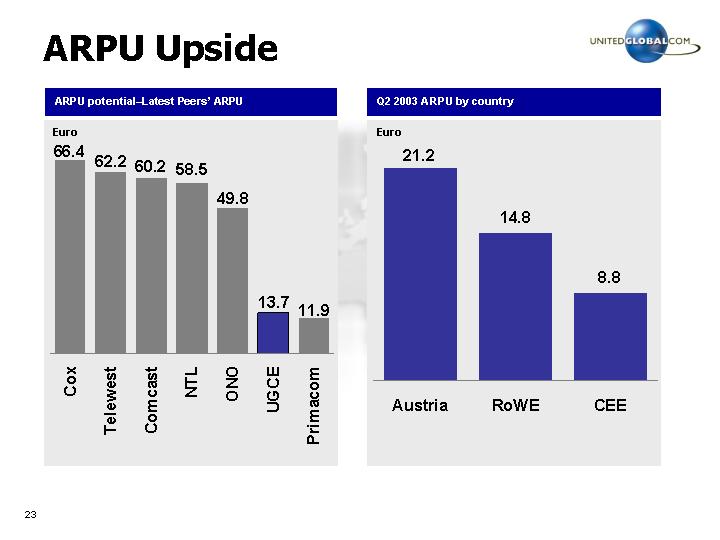
ARPU potential–Latest Peers’ ARPU
[CHART]
Q2 2003 ARPU by country
[CHART]
23
• Additional new services (VOD, Docsis 2.0, VOIP, France HITS)
• Acquisition of content for digital (e.g. Champions League)
• Specific expansion opportunities
• Continued cost reductions where appropriate
24
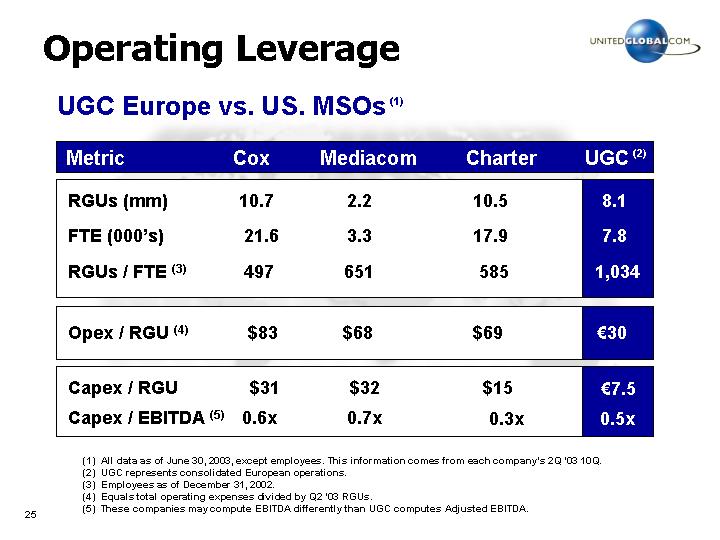
UGC Europe vs. US. MSOs (1)
Metric |
| Cox |
| Mediacom |
| Charter |
| UGC (2) |
| ||||
|
|
|
|
|
|
|
|
|
| ||||
RGUs (mm) |
| 10.7 |
| 2.2 |
| 10.5 |
| 8.1 |
| ||||
|
|
|
|
|
|
|
|
|
| ||||
FTE (000’s) |
| 21.6 |
| 3.3 |
| 17.9 |
| 7.8 |
| ||||
|
|
|
|
|
|
|
|
|
| ||||
RGUs / FTE (3) |
| 497 |
| 651 |
| 585 |
| 1,034 |
| ||||
|
|
|
|
|
|
|
|
|
| ||||
Opex / RGU (4) |
| $ | 83 |
| $ | 68 |
| $ | 69 |
| € | 30 |
|
|
|
|
|
|
|
|
|
|
| ||||
Capex / RGU |
| $ | 31 |
| $ | 32 |
| $ | 15 |
| € | 7.5 |
|
|
|
|
|
|
|
|
|
|
| ||||
Capex / EBITDA (5) |
| 0.6 | x | 0.7 | x | 0.3 | x | 0.5 | x | ||||
(1) All data as of June 30, 2003, except employees. This information comes from each company’s 2Q ‘03 10Q.
(2) UGC represents consolidated European operations.
(3) Employees as of December 31, 2002.
(4) Equals total operating expenses divided by Q2 ‘03 RGUs.
(5) These companies may compute EBITDA differently than UGC computes Adjusted EBITDA.
25
• Revenue opportunity is substantial
• Rate increases
• Broadband data market
• Bundling
• Above average EBITDA growth
• High gross margins
• Efficient cost structure
• Future looks bright
26
• Nationwide network: 1.7m homes, 1.0m upgraded to 2-way
• Largest video provider: 65% market share, 478,000 subscribers
• Second largest telephone provider: 245,000 subscribers
• Rapidly growing broadband provider: 99,000 subscribers
• Un-levered balance sheet: 1.4x Net Debt/EBITDA(1)
• Forecasting over $60 million of EBITDA(2) for 2003
RGUs(1)(‘000s) |
| CP Revenue (mm) |
| CP Adjusted EBITDA (mm) |
|
|
|
|
|
[CHART] |
| [CHART] |
| [CHART] |
(1) As of June 30, 2003, Chile had net debt of approximately $95 million ($123 million syndicated loan) and Q2 2003 YTD Adjusted EBITDA of $68 million (excluding non-cash management fees of $200k per month).
(2) Excludes non-cash management fees of $200k per month.
27
• YTD Financial Results
• Balance Sheet Analysis
• Conclusions
28
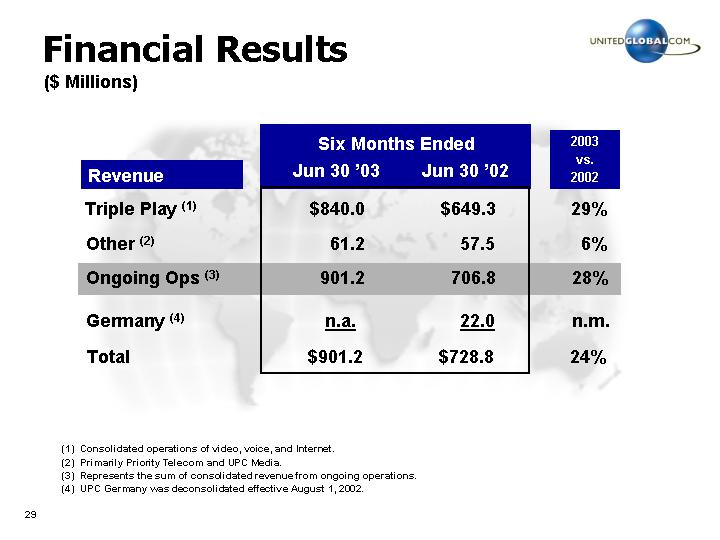
($ Millions)
|
| Six Months Ended |
| 2003 |
| ||||
Revenue |
| Jun 30 ’03 |
| Jun 30 ’02 |
|
| |||
|
|
|
|
|
|
|
| ||
Triple Play (1) |
| $ | 840.0 |
| $ | 649.3 |
| 29 | % |
|
|
|
|
|
|
|
| ||
Other (2) |
| 61.2 |
| 57.5 |
| 6 | % | ||
|
|
|
|
|
|
|
| ||
Ongoing Ops (3) |
| 901.2 |
| 706.8 |
| 28 | % | ||
|
|
|
|
|
|
|
| ||
Germany (4) |
| n.a. |
| 22.0 |
| n.m. |
| ||
|
|
|
|
|
|
|
| ||
Total |
| $ | 901.2 |
| $ | 728.8 |
| 24 | % |
(1) Consolidated operations of video, voice, and Internet.
(2) Primarily Priority Telecom and UPC Media.
(3) Represents the sum of consolidated revenue from ongoing operations.
(4) UPC Germany was deconsolidated effective August 1, 2002.
29
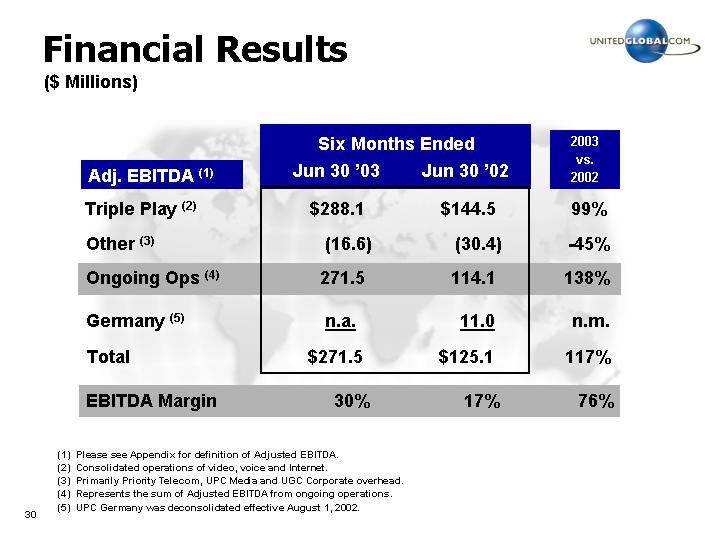
|
|
|
|
|
| 2003 |
| ||
|
| Six Months Ended |
|
| |||||
| Jun 30 ’03 |
| Jun 30 ’02 |
|
| ||||
|
|
|
|
|
|
|
| ||
Triple Play (2) |
| $ | 288.1 |
| $ | 144.5 |
| 99 | % |
|
|
|
|
|
|
|
| ||
Other (3) |
| (16.6 | ) | (30.4 | ) | -45 | % | ||
|
|
|
|
|
|
|
| ||
Ongoing Ops (4) |
| 271.5 |
| 114.1 |
| 138 | % | ||
|
|
|
|
|
|
|
| ||
Germany (5) |
| n.a. |
| 11.0 |
| n.m. |
| ||
|
|
|
|
|
|
|
| ||
Total |
| $ | 271.5 |
| $ | 125.1 |
| 117 | % |
|
|
|
|
|
|
|
| ||
EBITDA Margin |
| 30 | % | 17 | % | 76 | % | ||
(1) Please see Appendix for definition of Adjusted EBITDA.
(2) Consolidated operations of video, voice and Internet.
(3) Primarily Priority Telecom, UPC Media and UGC Corporate overhead.
(4) Represents the sum of Adjusted EBITDA from ongoing operations.
(5) UPC Germany was deconsolidated effective August 1, 2002.
30
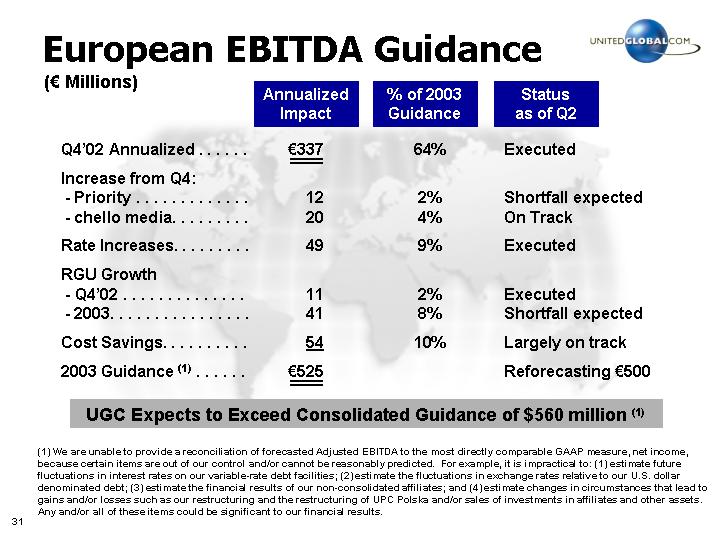
(€ Millions)
|
| Annualized |
| % of 2003 |
| Status |
| |
|
|
|
|
|
|
|
| |
Q4’02 Annualized |
| € | 337 |
| 64 | % | Executed |
|
|
|
|
|
|
|
|
|
|
Increase from Q4: |
|
|
|
|
|
|
| |
- Priority |
| 12 |
| 2 | % | Shortfall expected |
| |
- chello media |
| 20 |
| 4 | % | On Track |
| |
|
|
|
|
|
|
|
| |
Rate Increases |
| 49 |
| 9 | % | Executed |
| |
|
|
|
|
|
|
|
| |
RGU Growth |
|
|
|
|
|
|
| |
- Q4’02 |
| 11 |
| 2 | % | Executed |
| |
- 2003 |
| 41 |
| 8 | % | Shortfall expected |
| |
|
|
|
|
|
|
|
| |
Cost Savings |
| 54 |
| 10 | % | Largely on track |
| |
|
|
|
|
|
|
|
| |
2003 Guidance (1) |
| € | 525 |
|
|
| Reforecasting €500 |
|
UGC Expects to Exceed Consolidated Guidance of $560 million (1)
(1) We are unable to provide a reconciliation of forecasted Adjusted EBITDA to the most directly comparable GAAP measure, net income, because certain items are out of our control and/or cannot be reasonably predicted. For example, it is impractical to: (1) estimate future fluctuations in interest rates on our variable-rate debt facilities; (2) estimate the fluctuations in exchange rates relative to our U.S. dollar denominated debt; (3) estimate the financial results of our non-consolidated affiliates; and (4) estimate changes in circumstances that lead to gains and/or losses such as our restructuring and the restructuring of UPC Polska and/or sales of investments in affiliates and other assets. Any and/or all of these items could be significant to our financial results.
31
Cap Ex Drivers
• Reduced upgrade and new build activity
• Tail-end of IT system development
• Declining CPE costs
• Modems (<$50)
• NIUs (< $250)
• Digital (< $150)
[CHART]
32
($ Millions)
|
|
|
|
|
| 2003 |
| ||
|
| Six Months Ended |
|
| |||||
Free Cash Flow |
| Jun 30 ’03 |
| Jun 30 ’02 |
|
| |||
|
|
|
|
|
|
|
| ||
From Operations(1) |
| $ | 174.7 |
| $ | (246.4 | ) | 171 | % |
|
|
|
|
|
|
|
| ||
Less Capex |
| (132.9 | ) | (189.6 | ) | 30 | % | ||
|
|
|
|
|
|
|
| ||
Free Cash Flow (2) |
| 41.8 |
| $ | (436.0 | ) | 110 | % | |
|
|
|
|
|
|
|
| ||
Ending Cash |
| $ | 370.2 |
| $ | 665.6 |
| -44 | % |
(1) Represents net cash flows from operating activities per the Statement of Cash Flows.
(2) Please see Appendix for definition.
(3) Represents the sum of cash and cash equivalents, restricted cash and short-term liquid investments. UGC Europe has approximately € 400 million of availability under its credit facility.
33
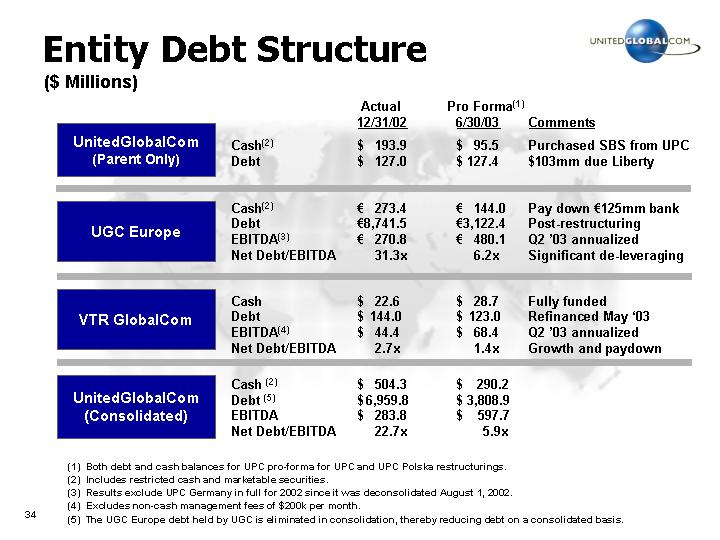
($ Millions)
|
|
|
| Actual |
| Pro Forma(1) |
| Comments |
| ||
|
|
|
|
|
|
|
|
|
| ||
UnitedGlobalCom |
| Cash(2) |
| $ | 193.9 |
| $ | 95.5 |
| Purchased SBS from UPC |
|
| Debt |
| $ | 127.0 |
| $ | 127.4 |
| $103mm due Liberty |
| |
|
|
|
|
|
|
|
|
|
| ||
UGC Europe |
| Cash(2) |
| € | 273.4 |
| € | 144.0 |
| Pay down €125mm bank |
|
| Debt |
| € | 8,741.5 |
| € | 3,122.4 |
| Post-restructuring |
| |
| EBITDA(3) |
| € | 270.8 |
| € | 480.1 |
| Q2 ‘03 annualized |
| |
| Net Debt/EBITDA |
| 31.3 | x | 6.2 | x | Significant de-leveraging |
| |||
|
|
|
|
|
|
|
|
|
| ||
VTR GlobalCom |
| Cash |
| $ | 22.6 |
| $ | 28.7 |
| Fully funded |
|
| Debt |
| $ | 144.0 |
| $ | 123.0 |
| Refinanced May ’03 |
| |
| EBITDA(4) |
| $ | 44.4 |
| $ | 68.4 |
| Q2 ‘03 annualized |
| |
| Net Debt/EBITDA |
| 2.7 | x | 1.4 | x | Growth and paydown |
| |||
|
|
|
|
|
|
|
|
|
| ||
UnitedGlobalCom |
| Cash (2) |
| $ | 504.3 |
| $ | 290.2 |
|
|
|
| Debt (5) |
| $ | 6,959.8 |
| $ | 3,808.9 |
|
|
| |
| EBITDA |
| $ | 283.8 |
| $ | 597.7 |
|
|
| |
| Net Debt/EBITDA |
| 22.7 | x | 5.9 | x |
|
| |||
(1) Both debt and cash balances for UPC pro-forma for UPC and UPC Polska restructurings.
(2) Includes restricted cash and marketable securities.
(3) Results exclude UPC Germany in full for 2002 since it was deconsolidated August 1, 2002.
(4) Excludes non-cash management fees of $200k per month.
(5) The UGC Europe debt held by UGC is eliminated in consolidation, thereby reducing debt on a consolidated basis.
34
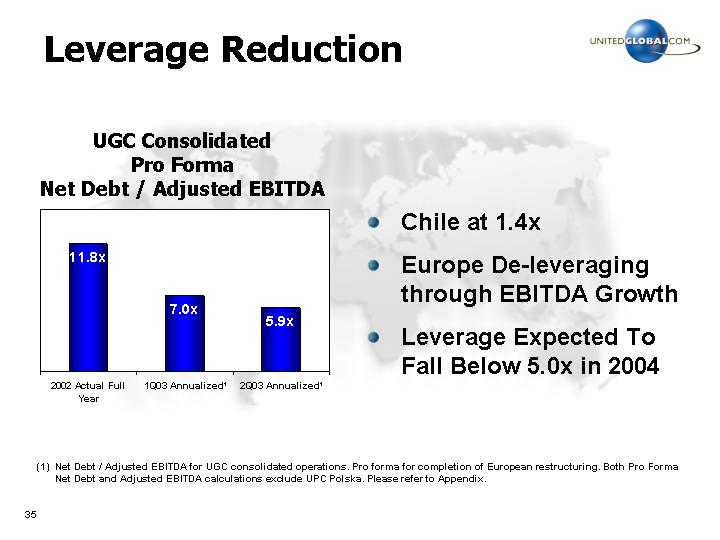
UGC Consolidated
Pro Forma
Net Debt / Adjusted EBITDA
[CHART]
• Chile at 1.4x
• Europe De-leveraging through EBITDA Growth
• Leverage Expected To Fall Below 5.0x in 2004
(1) Net Debt / Adjusted EBITDA for UGC consolidated operations. Pro forma for completion of European restructuring. Both Pro Forma Net Debt and Adjusted EBITDA calculations exclude UPC Polska. Please refer to Appendix.
35
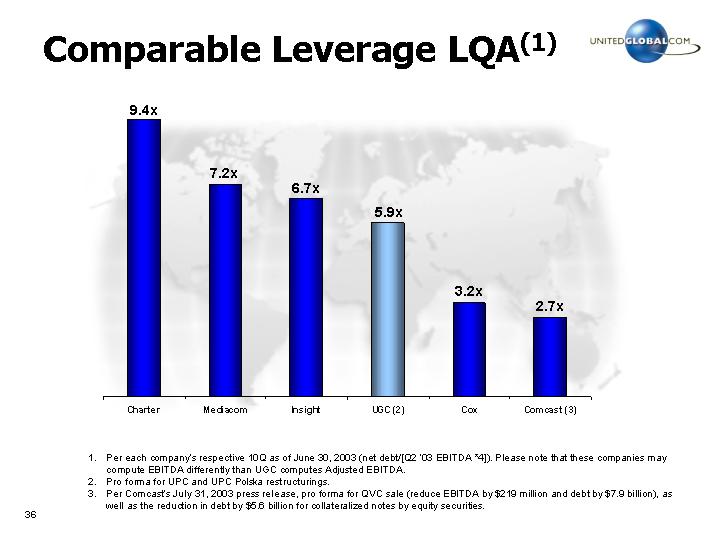
[CHART]
1. Per each company’s respective 10Q as of June 30, 2003 (net debt/[Q2 ‘03 EBITDA *4]). Please note that these companies may compute EBITDA differently than UGC computes Adjusted EBITDA.
2. Pro forma for UPC and UPC Polska restructurings.
3. Per Comcast’s July 31, 2003 press release, pro forma for QVC sale (reduce EBITDA by $219 million and debt by $7.9 billion), as well as the reduction in debt by $5.6 billion for collateralized notes by equity securities.
36
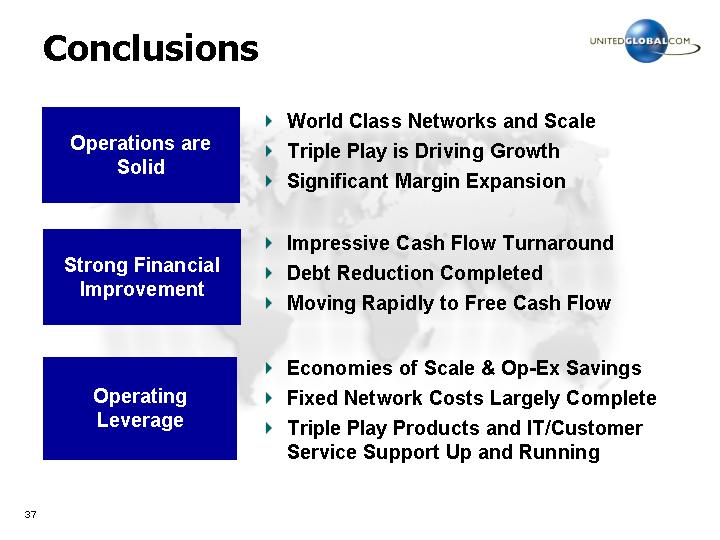
Operations are Solid | • | World Class Networks and Scale |
• | Triple Play is Driving Growth | |
• | Significant Margin Expansion | |
|
|
|
Strong Financial Improvement | • | Impressive Cash Flow Turnaround |
• | Debt Reduction Completed | |
• | Moving Rapidly to Free Cash Flow | |
|
|
|
Operating Leverage | • | Economies of Scale & Op-Ex Savings |
• | Fixed Network Costs Largely Complete | |
• | Triple Play Products and IT/Customer Service Support Up and Running |
37
October 16, 2003
38
Definitions
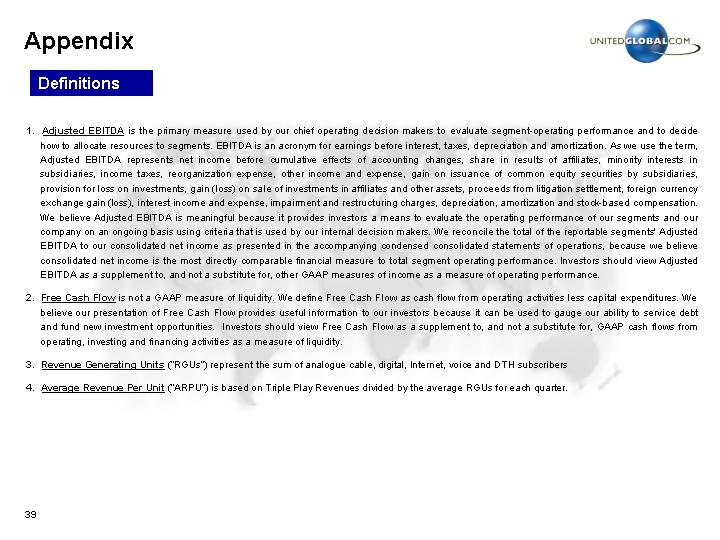
1. Adjusted EBITDA is the primary measure used by our chief operating decision makers to evaluate segment -operating performance and to decide how to allocate resources to segments. EBITDA is an acronym for earnings before interest, taxes, depreciation and amortization. As we use the term, Adjusted EBITDA represents net income before cumulative effects of accounting changes, share in results of affiliates, minority interests in subsidiaries, income taxes, reorganization expense, other income and expense, gain on issuance of common equity securities by subsidiaries, provision for loss on investments, gain (loss) on sale of investments in affiliates and other assets, proceeds from litigation settlement, foreign currency exchange gain (loss), interest income and expense, impairment and restructuring charges, depreciation, amortization and stock-based compensation. We believe Adjusted EBITDA is meaningful because it provides investors a means to evaluate the operating performance of our segments and our company on an ongoing basis using criteria that is used by our internal decision makers. We reconcile the total of the reportable segments’ Adjusted EBITDA to our consolidated net income as presented in the accompanying condensed consolidated statements of operations, because we believe consolidated net income is the most directly comparable financial measure to total segment operating performance. Investors should view Adjusted EBITDA as a supplement to, and not a substitute for, other GAAP measures of income as a measure of operating performance.
2. Free Cash Flow is not a GAAP measure of liquidity. We define Free Cash Flow as cash flow from operating activities less capital expenditures. We believe our presentation of Free Cash Flow provides useful information to our investors because it can be used to gauge our ability to service debt and fund new investment opportunities. Investors should view Free Cash Flow as a supplement to, and not a substitute for, GAAP cash flows from operating, investing and financing activities as a measure of liquidity.
3. Revenue Generating Units (“RGUs”) represent the sum of analogue cable, digital, Internet, voice and DTH subscribers
4. Average Revenue Per Unit (“ARPU”) is based on Triple Play Revenues divided by the average RGUs for each quarter.
39
|
| For the three months ended, |
| ||||||||||
(amounts in thousands) |
| Q2 ‘03 |
| Q1 ‘03 |
| Q2 ‘02 |
| Q1 ‘02 |
| ||||
|
|
|
|
|
|
|
|
|
| ||||
Adjusted EBITDA |
| $ | 149,431 |
| $ | 122,071 |
| $ | 70,372 |
| $ | 54,704 |
|
Loss on disposal of Poland DTH Business(1) |
| (8,000 | ) | — |
| — |
| — |
| ||||
Stock-based compensation |
| (8,275 | ) | (6,111 | ) | (8,648 | ) | (8,709 | ) | ||||
Depreciation & Amortization(2) |
| (211,487 | ) | (194,718 | ) | (172,453 | ) | (165,184 | ) | ||||
Impairment & Restructuring Charges |
| 1,096 |
| — |
| (19,437 | ) | (3,458 | ) | ||||
Operating Income (Loss) |
| (77,235 | ) | (78,758 | ) | (130,166 | ) | (122,647 | ) | ||||
Interest Expense, Net |
| (92,377 | ) | (89,586 | ) | (141,665 | ) | (174,213 | ) | ||||
Foreign currency exchange gain, net |
| 263,451 |
| 150,960 |
| 542,881 |
| (46,365 | ) | ||||
Gain (Loss) on Sale of Investments in affiliates, net |
| 281,483 |
| 121 |
| (12,409 | ) | (503 | ) | ||||
Gain on early extinguishment of debt |
| — |
| 74,401 |
| 365,490 |
| 1,843,292 |
| ||||
Other Income (Expense), net |
| (11,025 | ) | (3,015 | ) | 7,524 |
| (169,739 | ) | ||||
Income before income taxes and other |
| 364,297 |
| 54,123 |
| 631,655 |
| 1,329,825 |
| ||||
Income tax and other, net |
| 257,717 |
| (37,184 | ) | (62,085 | ) | (217,250 | ) | ||||
Income before cumulative effect of acctg. change |
| 622,014 |
| 16,939 |
| 569,570 |
| 1,112,575 |
| ||||
Cumulative effect of change in accounting principle |
| 0 |
| 0 |
| 0 |
| (1,344,722 | ) | ||||
Net Income (Loss) |
| $ | 622,014 |
| $ | 16,939 |
| $ | 569,570 |
| $ | (232,147 | ) |
(1) Stock based compensation includes charges associated with fixed, or non-cash stock options, as well as charges associated with phantom, or cash-based, stock option plans, as more fully disclosed in UGC’s 10Q and 10K.
(2) Represents certain impairment charges. Please refer to UGC’s 10Q as of June 30, 2003 for a summary.
40
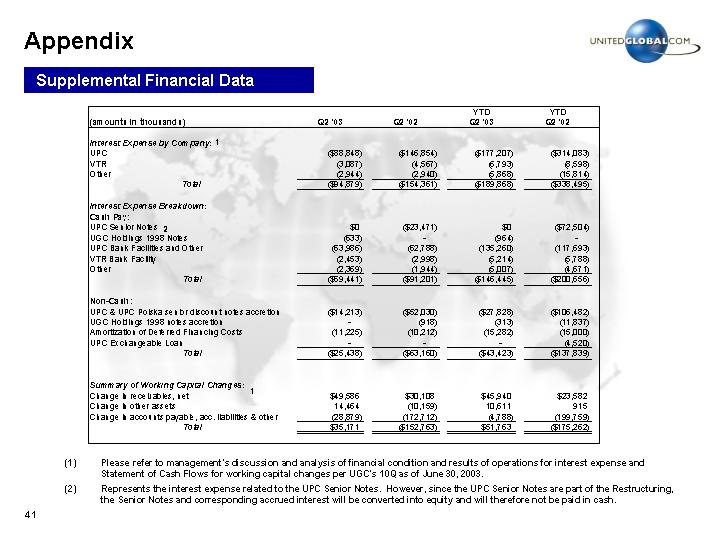
(amounts in thousands) |
| Q2 ‘03 |
| Q2 ‘02 |
| YTD |
| YTD |
| ||||
|
|
|
|
|
|
|
|
|
| ||||
Interest Expense by Company: (1) |
|
|
|
|
|
|
|
|
| ||||
UPC |
| $ | (88,848 | ) | $ | (146,854 | ) | $ | (177,207 | ) | $ | (314,083 | ) |
VTR |
| (3,087 | ) | (4,567 | ) | (6,793 | ) | (8,598 | ) | ||||
Other |
| (2,944 | ) | (2,940 | ) | (5,868 | ) | (15,814 | ) | ||||
Total |
| $ | (94,879 | ) | $ | (154,361 | ) | $ | (189,868 | ) | $ | (338,495 | ) |
|
|
|
|
|
|
|
|
|
| ||||
Interest Expense Breakdown: |
|
|
|
|
|
|
|
|
| ||||
Cash Pay: |
|
|
|
|
|
|
|
|
| ||||
UPC Senior Notes (2) |
| $ | 0 |
| $ | (23,471 | ) | $ | 0 |
| $ | (72,504 | ) |
UGC Holdings 1998 Notes |
| (633 | ) | — |
| (964 | ) | — |
| ||||
UPC Bank Facilities and Other |
| (63,986 | ) | (62,788 | ) | (135,260 | ) | (117,693 | ) | ||||
VTR Bank Facility |
| (2,453 | ) | (2,998 | ) | (5,214 | ) | (5,788 | ) | ||||
Other |
| (2,369 | ) | (1,944 | ) | (5,007 | ) | (4,671 | ) | ||||
Total |
| $ | (69,441 | ) | $ | (91,201 | ) | $ | (146,445 | ) | $ | (200,656 | ) |
|
|
|
|
|
|
|
|
|
| ||||
Non-Cash: |
|
|
|
|
|
|
|
|
| ||||
UPC & UPC Polska senior discount notes accretion |
| $ | (14,213 | ) | $ | (52,030 | ) | $ | (27,828 | ) | $ | (106,482 | ) |
UGC Holdings 1998 notes accretion |
| — |
| (918 | ) | (313 | ) | (11,837 | ) | ||||
Amortization of Deferred Financing Costs |
| (11,225 | ) | (10,212 | ) | (15,282 | ) | (15,000 | ) | ||||
UPC Exchangeable Loan |
| — |
| — |
| — |
| (4,520 | ) | ||||
Total |
| $ | (25,438 | ) | $ | (63,160 | ) | $ | (43,423 | ) | $ | (137,839 | ) |
|
|
|
|
|
|
|
|
|
| ||||
Summary of Working Capital Changes: |
|
|
|
|
|
|
|
|
| ||||
|
|
|
|
|
|
|
|
|
| ||||
Change in receivables, net (1) |
| $ | 49,586 |
| $ | 30,108 |
| $ | 45,940 |
| $ | 23,582 |
|
Change in other assets |
| 14,464 |
| (10,159 | ) | 10,611 |
| 915 |
| ||||
Change in accounts payable, acc. liabilities & other |
| (28,879 | ) | (172,712 | ) | (4,788 | ) | (199,759 | ) | ||||
Total |
| $ | 35,171 |
| $ | (152,763 | ) | $ | 51,763 |
| $ | (175,262 | ) |
(1) Please refer to management’s discussion and analysis of financial condition and results of operations for interest expense and Statement of Cash Flows for working capital changes per UGC’s 10Q as of June 30, 2003.
(2) Represents the interest expense related to the UPC Senior Notes. However, since the UPC Senior Notes are part of the Restructuring, the Senior Notes and corresponding accrued interest will be converted into equity and will therefore not be paid in cash.
41
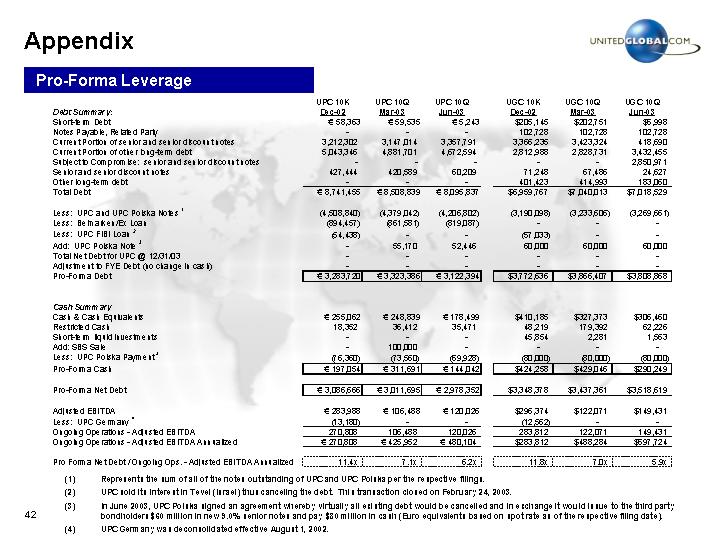
|
| UPC 10K |
| UPC 10Q |
| UPC 10Q |
| UGC 10K |
| UGC 10Q |
| UGC 10Q |
| ||||||
Debt Summary: |
|
|
|
|
|
|
|
|
|
|
|
|
| ||||||
Short-term Debt |
| € | 58,363 |
| € | 59,535 |
| € | 5,243 |
| $ | 205,145 |
| $ | 202,751 |
| $ | 5,998 |
|
Notes Payable, Related Party |
| — |
| — |
| — |
| 102,728 |
| 102,728 |
| 102,728 |
| ||||||
Current Portion of senior and senior discount notes |
| 3,212,302 |
| 3,147,014 |
| 3,357,791 |
| 3,366,235 |
| 3,423,324 |
| 418,690 |
| ||||||
Current Portion of other long-term debt |
| 5,043,346 |
| 4,881,701 |
| 4,672,594 |
| 2,812,988 |
| 2,828,731 |
| 3,432,455 |
| ||||||
Subject to Compromise: senior and senior discount notes |
| — |
| — |
| — |
| — |
| — |
| 2,850,971 |
| ||||||
Senior and senior discount notes |
| 427,444 |
| 420,589 |
| 60,209 |
| 71,248 |
| 67,486 |
| 24,627 |
| ||||||
Other long-term debt |
| — |
| — |
| — |
| 401,423 |
| 414,993 |
| 183,060 |
| ||||||
Total Debt |
| € | 8,741,455 |
| € | 8,508,839 |
| € | 8,095,837 |
| $ | 6,959,767 |
| $ | 7,040,013 |
| $ | 7,018,529 |
|
|
|
|
|
|
|
|
|
|
|
|
|
|
| ||||||
Less: UPC and UPC Polska Notes (1) |
| (4,508,840 | ) | (4,379,042 | ) | (4,206,802 | ) | (3,190,098 | ) | (3,233,606 | ) | (3,269,661 | ) | ||||||
Less: Belmarken/Ex Loan |
| (894,457 | ) | (861,581 | ) | (819,087 | ) | — |
| — |
| — |
| ||||||
Less: UPC FiBI Loan (2) |
| (54,438 | ) | — |
| — |
| (57,033 | ) | — |
| — |
| ||||||
Add: UPC Polska Note (3) |
| — |
| 55,170 |
| 52,446 |
| 60,000 |
| 60,000 |
| 60,000 |
| ||||||
Total Net Debt for UPC @ 12/31/03 |
| — |
| — |
| — |
| — |
| — |
| — |
| ||||||
Adjustment to FYE Debt (no change in cash) |
| — |
| — |
| — |
| — |
| — |
| — |
| ||||||
Pro-Forma Debt |
| € | 3,283,720 |
| € | 3,323,386 |
| € | 3,122,394 |
| $ | 3,772,636 |
| $ | 3,866,407 |
| $ | 3,808,868 |
|
|
|
|
|
|
|
|
|
|
|
|
|
|
| ||||||
Cash Summary |
|
|
|
|
|
|
|
|
|
|
|
|
| ||||||
Cash & Cash Equivalents |
| € | 255,062 |
| € | 248,839 |
| € | 178,499 |
| $ | 410,185 |
| $ | 327,373 |
| $ | 306,460 |
|
Restricted Cash |
| 18,352 |
| 36,412 |
| 35,471 |
| 48,219 |
| 179,392 |
| 62,226 |
| ||||||
Short-term liquid investments |
| — |
| — |
| — |
| 45,854 |
| 2,281 |
| 1,563 |
| ||||||
Add: SBS Sale |
| — |
| 100,000 |
| — |
| — |
| — |
| — |
| ||||||
Less: UPC Polska Payment (3) |
| (76,360 | ) | (73,560 | ) | (69,928 | ) | (80,000 | ) | (80,000 | ) | (80,000 | ) | ||||||
Pro-Forma Cash |
| € | 197,054 |
| € | 311,691 |
| € | 144,042 |
| $ | 424,258 |
| $ | 429,046 |
| $ | 290,249 |
|
|
|
|
|
|
|
|
|
|
|
|
|
|
| ||||||
Pro-Forma Net Debt |
| € | 3,086,666 |
| € | 3,011,695 |
| € | 2,978,352 |
| $ | 3,348,378 |
| $ | 3,437,361 |
| $ | 3,518,619 |
|
|
|
|
|
|
|
|
|
|
|
|
|
|
| ||||||
Adjusted EBITDA |
| € | 283,988 |
| € | 106,488 |
| € | 120,026 |
| $ | 296,374 |
| $ | 122,071 |
| $ | 149,431 |
|
Less: UPC Germany (4) |
| (13,180 | ) | — |
| — |
| (12,562 | ) | — |
| — |
| ||||||
Ongoing Operations - Adjusted EBITDA |
| 270,808 |
| 106,488 |
| 120,026 |
| 283,812 |
| 122,071 |
| 149,431 |
| ||||||
Ongoing Operations - Adjusted EBITDA Annualized |
| € | 270,808 |
| € | 425,952 |
| € | 480,104 |
| $ | 283,812 |
| $ | 488,284 |
| $ | 597,724 |
|
|
|
|
|
|
|
|
|
|
|
|
|
|
| ||||||
Pro Forma Net Debt / Ongoing Ops. - Adjusted EBITDA Annualized |
| 11.4 | x | 7.1 | x | 6.2 | x | 11.8 | x | 7.0 | x | 5.9 | x | ||||||
(1) Represents the sum of all of the notes outstanding of UPC and UPC Polska per the respective filings.
(2) UPC sold its interest in Tevel (Israel) thus canceling the debt. This transaction closed on February 24, 2003.
(3) In June 2003, UPC Polska signed an agreement whereby virtually all existing debt would be cancelled and in exchange it would issue to the third party bondholders $60 million in new 9.0% senior notes and pay $80 million in cash (Euro equivalents based on spot rate as of the respective filing date).
(4) UPC Germany was deconsolidated effective August 1, 2002.
42
UGC filed a Registration Statement on Form S-4 containing a Prospectus relating to the exchange offer and Europe Acquisition, Inc. filed a Schedule TO. UGC EUROPE STOCKHOLDERS AND OTHER INVESTORS ARE URGED TO READ THESE DOCUMENTS (INCLUDING ANY AMENDMENTS OR SUPPLEMENTS TO THESE DOCUMENTS WHEN AVAILABLE) BECAUSE THEY CONTAIN IMPORTANT INFORMATION ABOUT THE TRANSACTION. Investors may obtain these documents free of charge at the SEC’s website at www.sec.gov. In addition, copies of the Prospectus and other related exchange offer documents filed by UGC or Europe Acquisition, Inc. may be obtained free of charge by directing a request to UnitedGlobalCom, Inc., 4643 South Ulster Street, Suite 1300, Denver, Colorado 80237, Attention: Investor Relations Department, telephone: 303-770-4001.
Participants in Solicitation
UGC and its directors and executive officers may be deemed to be participants in the solicitation of proxies from UGC’s stockholders in connection with the special meeting of stockholders to be held to approve the issuance of the Class A Common Stock in the exchange offer and planned merger. Information concerning UGC’s directors and executive officers and their direct and indirect interests i n the transaction is set forth in UGC’s preliminary proxy statement filed with the SEC relating to the special meeting of stockholders and the Prospectus contained in the Registration Statement on Form S-4 filed with the SEC relating to the exchange offer. A definitive proxy statement will be mailed to UGC stockholders when available. Stockholders may obtain these documents (when available) free of charge at the SEC’s website at www.sec.gov. In addition, copies of the definitive proxy statement (when available) may be obtained free of charge by directing a request to UnitedGlobalCom, Inc., 4643 South Ulster Street, Suite 1300, Denver, Colorado 80237, Attention: Investor Relations Department, telephone: 303-770-4001. UGC STOCKHOLDERS SHOULD READ THE PROXY STATEMENT AND OTHER RELEVANT DOCUMENTS CAREFULLY BEFORE MAKING ANY VOTING DECISION BECAUSE IT CONTAINS IMPORTANT INFORMATION.
43