Filed by UnitedGlobalCom, Inc. pursuant to
Rule 425 under the Securities Act of 1933
Subject Company: UGC Europe, Inc.
Commission File No. 333-109496

Link to searchable text of slide shown above

Link to searchable text of slide shown above

Link to searchable text of slide shown above

Link to searchable text of slide shown above

Link to searchable text of slide shown above
Link to searchable text of slide shown above

Link to searchable text of slide shown above
Link to searchable text of slide shown above
Link to searchable text of slide shown above

Link to searchable text of slide shown above
Link to searchable text of slide shown above
Link to searchable text of slide shown above

Link to searchable text of slide shown above
Link to searchable text of slide shown above
Link to searchable text of slide shown above
Link to searchable text of slide shown above

Link to searchable text of slide shown above
Link to searchable text of slide shown above
Link to searchable text of slide shown above
Link to searchable text of slide shown above
Link to searchable text of slide shown above
Link to searchable text of slide shown above
Link to searchable text of slide shown above
Link to searchable text of slide shown above

Link to searchable text of slide shown above

Link to searchable text of slide shown above
Link to searchable text of slide shown above

Link to searchable text of slide shown above
Link to searchable text of slide shown above
Link to searchable text of slide shown above
Link to searchable text of slide shown above
Link to searchable text of slide shown above
Link to searchable text of slide shown above
Searchable text section of graphics shown above
Filed by UnitedGlobalCom, Inc. pursuant to
Rule 425 under the Securities Act of 1933
Subject Company: UGC Europe, Inc.
Commission File No. 333-109496
UBS Securities LLC
31st Annual Media Conference
December 8, 2003
[LOGO] | |
| |
Under the Private Securities Litigation Reform Act of 1995: | |
Certain matters discussed in the following presentation, including those items identified as guidance, are based upon the consummation of previously announced acquisitions and transactions and may contain forward-looking statements that deal with potential future circumstances and developments. The discussion of such matters and subject areas is qualified by the inherent risks and uncertainties surrounding future expectations generally, and such discussion also may materially differ from UGC’s actual future experience involving any one or more such matters and discussion areas. UGC has attempted to identify, in context, certain of the factors that it currently believes may cause actual future experiences and results to differ from UGC’s current expectation in reports filed with the Securities and Exchange Commission.
UGC acknowledges that the “Safe Harbor” for forward looking statements does not apply to the discussion of the exchange offer included herein.
Please refer to the Appendix at the end of this presentation, as well as the Company’s Press Release dated November 13, 2003 and SEC filings, for definitions of the following terms which are used herein including: Adjusted EBITDA, Free Cash Flow, Revenue Generating Units (RGUs), and Average Revenue per Unit (ARPU), as well as a GAAP reconciliation of non-GAAP financial measures.
2
• What’s New?
• European Operations
• Financial Overview
• Q&A
3
• Largest MSO outside the U.S.
• 9 million RGUs in 15 countries
• Substantial voice and data business – 1.6 million RGUs and 40% of revenue
• LTM Revenue $1.8b, EBITDA $530m
• $4.5 billion equity market capitalization (1)
(1) Pro forma for completion of UGC Europe exchange offer.
4
• European Exchange Offer
• For 33% of UGC Europe (UGCE)
• Expected to close before year-end
• Approximately 600 million pro forma shares (1)
• Liberty to Purchase Control Stake
• Expected close early January ‘04
• Pro forma ownership of 55% (1)
• Strengthens strategic relationship
(1) Final share count will depend upon Liberty’s decision to exercise pre-emptive right to 55%, the resolution with third party bondholders of the Old UGC notes in the Old UGC restructuring plan, as well as the public market price of the stock around the time of issuance.
5
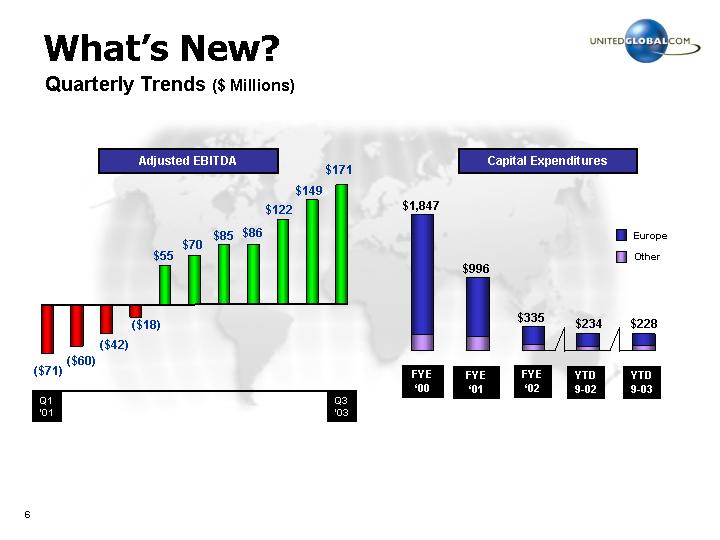
Quarterly Trends ($ Millions)
Adjusted EBITDA
[CHART]
Capital Expenditures
[CHART]
6
• Platform
• Triple Play Services
• Data Case Study
• Where We’re Headed
7
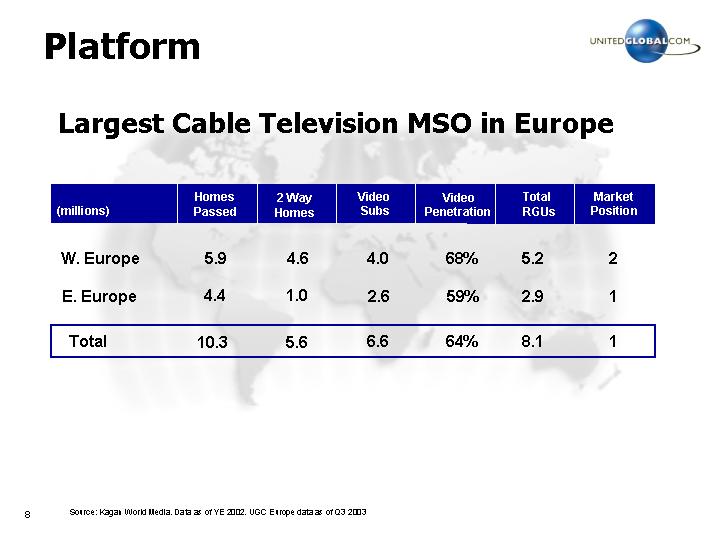
Largest Cable Television MSO in Europe
(millions) |
| Homes |
| 2 Way |
| Video |
| Video |
| Total |
| Market |
|
|
|
|
|
|
|
|
|
|
|
|
|
|
|
W. Europe |
| 5.9 |
| 4.6 |
| 4.0 |
| 68 | % | 5.2 |
| 2 |
|
|
|
|
|
|
|
|
|
|
|
|
|
|
|
E. Europe |
| 4.4 |
| 1.0 |
| 2.6 |
| 59 | % | 2.9 |
| 1 |
|
|
|
|
|
|
|
|
|
|
|
|
|
|
|
Total |
| 10.3 |
| 5.6 |
| 6.6 |
| 64 | % | 8.1 |
| 1 |
|
Source: Kagan World Media. Data as of YE 2002. UGC Europe data as of Q3 2003
8
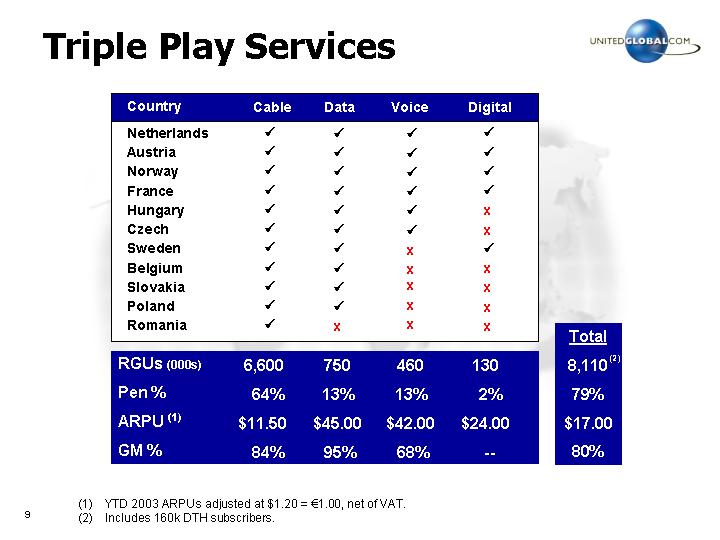
Country |
| Cable |
| Data |
| Voice |
| Digital |
|
|
| |||||
Netherlands |
| ý |
| ý |
| ý |
| ý |
|
|
| |||||
Austria |
| ý |
| ý |
| ý |
| ý |
|
|
| |||||
Norway |
| ý |
| ý |
| ý |
| ý |
|
|
| |||||
France |
| ý |
| ý |
| ý |
| ý |
|
|
| |||||
Hungary |
| ý |
| ý |
| ý |
| o |
|
|
| |||||
Czech |
| ý |
| ý |
| ý |
| o |
|
|
| |||||
Sweden |
| ý |
| ý |
| o |
| ý |
|
|
| |||||
Belgium |
| ý |
| ý |
| o |
| o |
|
|
| |||||
Slovakia |
| ý |
| ý |
| o |
| o |
|
|
| |||||
Poland |
| ý |
| ý |
| o |
| o |
|
|
| |||||
Romania |
| ý |
| o |
| o |
| o |
|
|
| |||||
|
|
|
|
|
|
|
|
|
|
|
| |||||
|
|
|
|
|
|
|
|
|
| Total |
| |||||
RGUs (000s) |
| 6,600 |
| 750 |
| 460 |
| 130 |
| 8,110 | (2) | |||||
Pen % |
| 64 | % | 13 | % | 13 | % | 2 | % | 79 | % | |||||
ARPU (1) |
| $ | 11.50 |
| $ | 45.00 |
| $ | 42.00 |
| $ | 24.00 |
| $ | 17.00 |
|
GM % |
| 84 | % | 95 | % | 68 | % | — |
| 80 | % | |||||
(1) YTD 2003 ARPUs adjusted at $1.20 = €1.00, net of VAT.
(2) Includes 160k DTH subscribers.
9
• Advanced networks, lower upgrade costs
• Less video competition
• DTH not a threat in our core markets
• Low ARPU analogue; good pricing upside
• Higher gross margins
• Digital is an opportunity - not necessity today
• More data competition
• Tiered Services
• Faster dial-up conversion
• Higher gross margins today
10
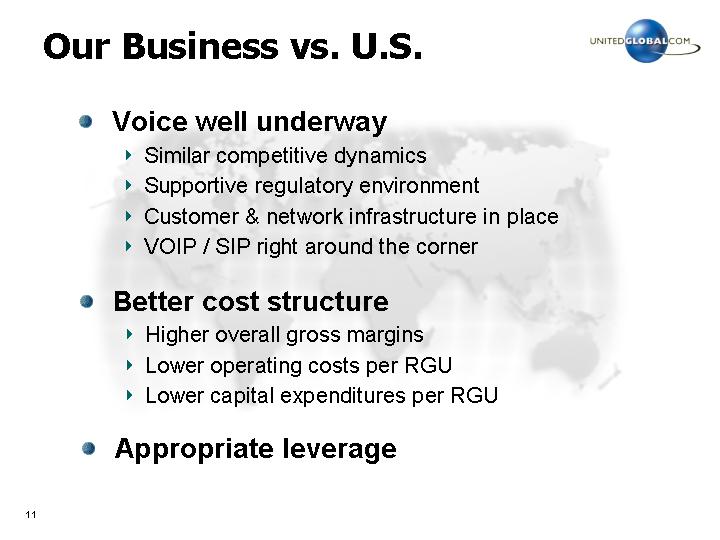
• Similar competitive dynamics
• Supportive regulatory environment
• Customer & network infrastructure in place
• VOIP / SIP right around the corner
• Better cost structure
• Higher overall gross margins
• Lower operating costs per RGU
• Lower capital expenditures per RGU
• Appropriate leverage
11
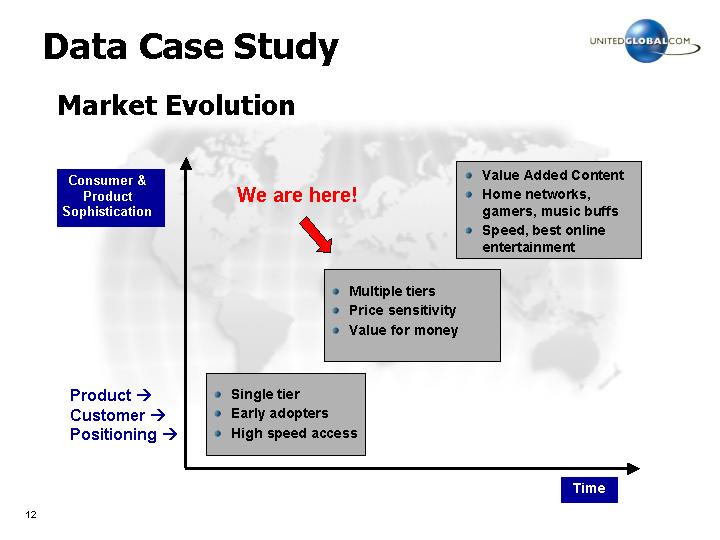
Market Evolution
[CHART]
12
Speed, Price and Data Limits are Key Product Differentiators Today
chello access features (NL) (1) |
| Entry |
| Light |
| Classic |
| Plus |
| Professional |
| |||||
|
|
|
|
|
|
|
|
|
|
|
| |||||
Subscription fee (€/month) |
| € | 22.95 |
| € | 32.95 |
| € | 49.95 |
| € | 79.95 |
| € | 156.00 |
|
Modem speed settings down/up (kbps) |
| 400/64 |
| 768/128 |
| 1500/128 |
| 3000/384 |
| 3000/768 |
| |||||
Number of email boxes |
| 1 |
| 1 |
| 1 |
| 3 |
| 10 |
| |||||
Webspace (MB) |
| 10 |
| 10 |
| 10 |
| 30 |
| 30 |
| |||||
Number of PCs allowed |
| 1 |
| 1 |
| 1 |
| 3 |
| 5 |
| |||||
Data Limit (GB/month) |
| 0.5 |
| 1 |
| 10 |
| 15 |
| 15 |
| |||||
Content offerings: |
|
|
|
|
|
|
|
|
|
|
| |||||
Security McAfee VirusScan (€/pc) |
| € | 55.00 |
| € | 55.00 |
| € | 55.00 |
| € | 55.00 |
| € | 55.00 |
|
- yearly update (€/year) |
| € | 39.95 |
| € | 39.95 |
| € | 39.95 |
| € | 39.95 |
| € | 39.95 |
|
Games-on-demand (average €/month) |
| — |
| — |
| € | 12.00 |
| € | 8.00 |
| — |
| |||
Adult content (average €/month) |
| — |
| — |
| € | 10.00 |
| € | 7.00 |
| — |
| |||
(1) All prices include VAT.
(2) To be launched Q1 2004, final specifications TBD.
13
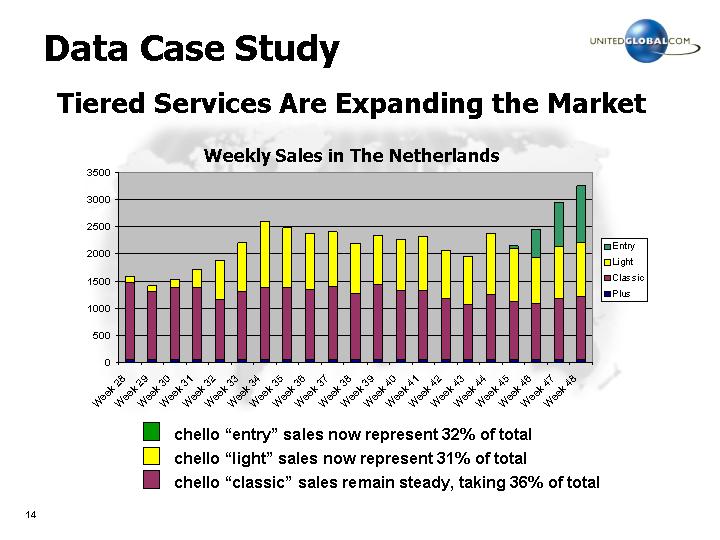
Tiered Services Are Expanding the Market
Weekly Sales in The Netherlands
[CHART]
14
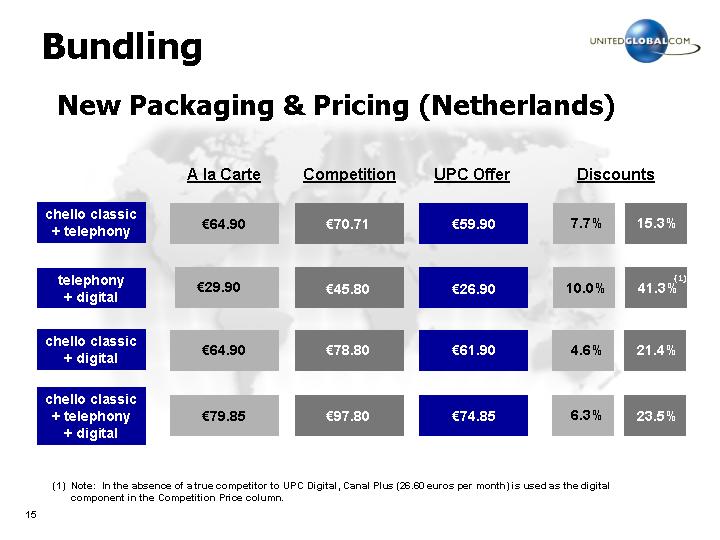
New Packaging & Pricing (Netherlands)
|
| A la Carte |
| Competition |
| UPC Offer |
| Discounts |
| ||||||
|
|
|
|
|
|
|
|
|
|
|
| ||||
chello classic |
|
| € | 64.90 |
| € | 70.71 |
| € | 59.90 |
| 7.7 | % | 15.3 | % |
|
|
|
|
|
|
|
|
|
|
|
|
| |||
telephony |
|
| € | 29.90 |
| € | 45.80 |
| € | 26.90 |
| 10.0 | % | 41.3 | %(1) |
|
|
|
|
|
|
|
|
|
|
|
|
| |||
chello classic |
|
| € | 64.90 |
| € | 78.80 |
| € | 61.90 |
| 4.6 | % | 21.4 | % |
|
|
|
|
|
|
|
|
|
|
|
|
| |||
chello classic |
|
| € | 79.85 |
| € | 97.80 |
| € | 74.85 |
| 6.3 | % | 23.5 | % |
(1) Note: In the absence of a true competitor to UPC Digital, Canal Plus (26.60 euros per month) is used as the digital component in the Competition Price column.
15
16
• Cost Structure is Generally Right
• Less than 1/2 the RGUs per FTE of Cox, Charter
• Good gross margins (average of 80%)
• Improving EBITDA margins (mid 30’s & moving up)
• Largely variable capital spend
• It’s All About Profitable Top-Line Growth
• CATV rate increases
• Data market share
• Expanded voice footprint
• Revamped digital offering
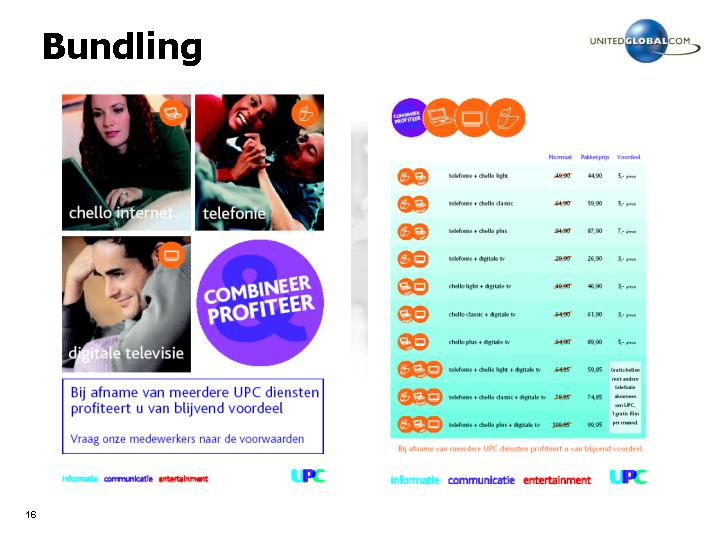
• Bundling
17
• YTD Financial Results
• Leverage Trends & Comparison
• Conclusions
18
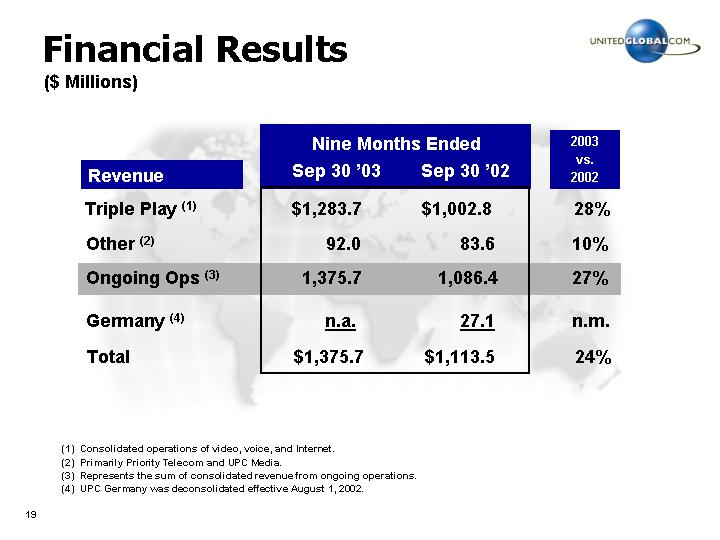
($ Millions)
|
| Nine Months Ended |
| 2003 |
| ||||
Revenue |
| Sep 30 ‘03 |
| Sep 30 ‘02 |
| 2002 |
| ||
|
|
|
|
|
|
|
|
|
|
Triple Play (1) |
| $ | 1,283.7 |
| $ | 1,002.8 |
| 28 | % |
|
|
|
|
|
|
|
|
|
|
Other (2) |
| 92.0 |
| 83.6 |
| 10 | % | ||
|
|
|
|
|
|
|
| ||
Ongoing Ops (3) |
| 1,375.7 |
| 1,086.4 |
| 27 | % | ||
|
|
|
|
|
|
|
| ||
Germany (4) |
| n.a. |
| 27.1 |
| n.m. |
| ||
|
|
|
|
|
|
|
| ||
Total |
| $ | 1,375.7 |
| $ | 1,113.5 |
| 24 | % |
(1) Consolidated operations of video, voice, and Internet.
(2) Primarily Priority Telecom and UPC Media.
(3) Represents the sum of consolidated revenue from ongoing operations.
(4) UPC Germany was deconsolidated effective August 1, 2002.
19
|
| Nine Months Ended |
| 2003 |
| ||||
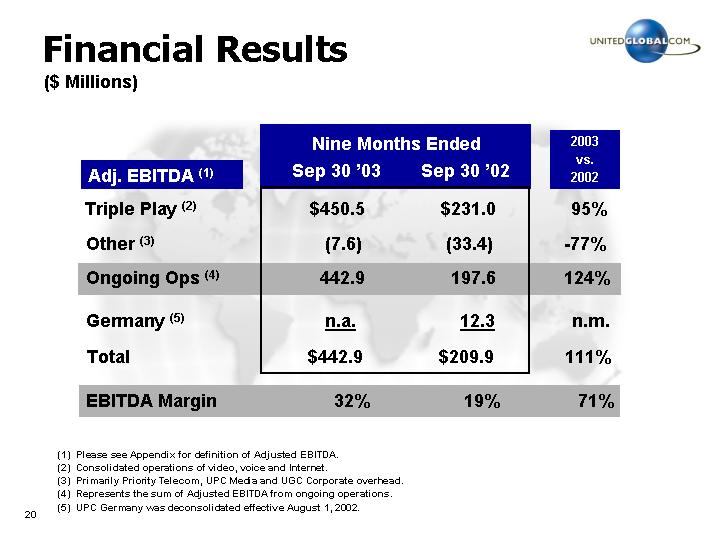
Adj. EBITDA (1) |
| Sep 30 ‘03 |
| Sep 30 ‘02 |
| 2002 |
| ||
|
|
|
|
|
|
|
|
|
|
Triple Play (2) |
| $ | 450.5 |
| $ | 231.0 |
| 95 | % |
|
|
|
|
|
|
|
|
|
|
Other (3) |
| (7.6 | ) | (33.4 | ) | -77 | % | ||
|
|
|
|
|
|
|
| ||
Ongoing Ops (4) |
| 442.9 |
| 197.6 |
| 124 | % | ||
|
|
|
|
|
|
|
| ||
Germany (5) |
| n.a. |
| 12.3 |
| n.m. |
| ||
|
|
|
|
|
|
|
| ||
Total |
| $ | 442.9 |
| $ | 209.9 |
| 111 | % |
|
|
|
|
|
|
|
| ||
EBITDA Margin |
| 32 | % | 19 | % | 71 | % | ||
(1) Please see Appendix for definition of Adjusted EBITDA.
(2) Consolidated operations of video, voice and Internet.
(3) Primarily Priority Telecom, UPC Media and UGC Corporate overhead.
(4) Represents the sum of Adjusted EBITDA from ongoing operations.
(5) UPC Germany was deconsolidated effective August 1, 2002.
20
|
| Nine Months Ended |
| 2003 |
| ||||
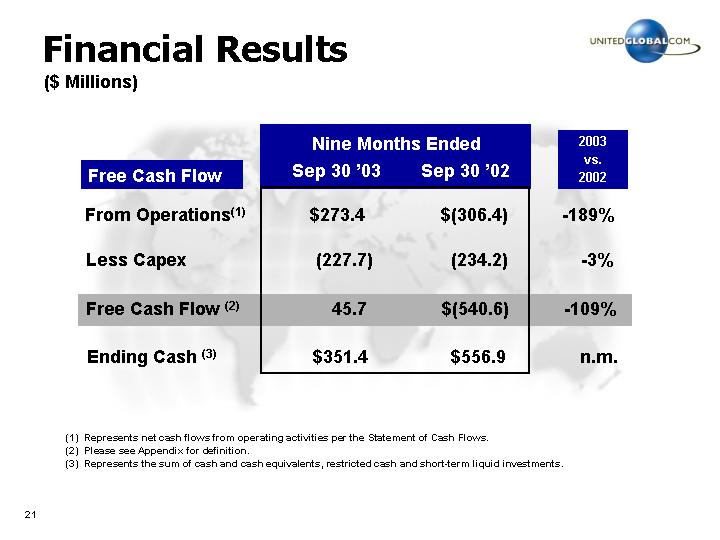
Free Cash Flow |
| Sep 30 ‘03 |
| Sep 30 ‘02 |
| 2002 |
| ||
|
|
|
|
|
|
|
|
|
|
From Operations(1) |
| $ | 273.4 |
| $ | (306.4 | ) | -189 | % |
|
|
|
|
|
|
|
| ||
Less Capex |
| (227.7 | ) | (234.2 | ) | -3 | % | ||
|
|
|
|
|
|
|
| ||
Free Cash Flow (2) |
| 45.7 |
| $ | (540.6 | ) | -109 | % | |
|
|
|
|
|
|
|
| ||
Ending Cash (3) |
| $ | 351.4 |
| $ | 556.9 |
| n.m. |
|
(1) Represents net cash flows from operating activities per the Statement of Cash Flows.
(2) Please see Appendix for definition.
(3) Represents the sum of cash and cash equivalents, restricted cashand short-term liquid investments.
21
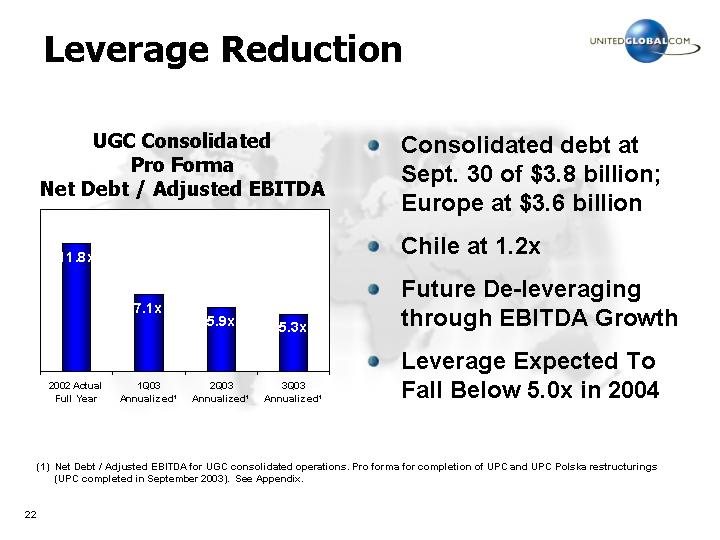
UGC Consolidated
Pro Forma
Net Debt / Adjusted EBITDA
[CHART]
• Consolidated debt at Sept. 30 of $3.8 billion; Europe at $3.6 billion
• Chile at 1.2x
• Future De-leveraging through EBITDA Growth
• Leverage Expected To Fall Below 5.0x in 2004
(1) Net Debt / Adjusted EBITDA for UGC consolidated operations. Pro forma for completion of UPC and UPC Polska restructurings (UPC completed in September 2003). See Appendix.
22
[CHART]
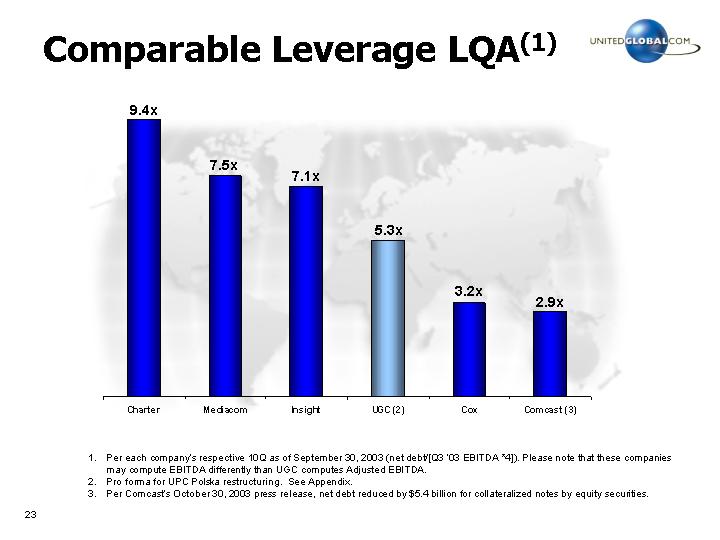
1. Per each company’s respective 10Q as of September 30, 2003 (net debt/[Q3 ‘03 EBITDA *4]). Please note that these companies may compute EBITDA differently than UGC computes Adjusted EBITDA.
2. Pro forma for UPC Polska restructuring. See Appendix.
3. Per Comcast’s October 30, 2003 press release, net debt reduced by $5.4 billion for collateralized notes by equity securities.
23
• Dominant European Cable Player
• World Class Networks and Scale
• Significant Operating Leverage
• Superior Cash Flow Growth Profile
24
[LOGO]
UBS Securities LLC
31st Annual Media Conference
December 8, 2003
25
Definitions
1. Adjusted EBITDA is the primary measure used by our chief operating decision makers to evaluate segment-operating performance and to decide how to allocate resources to segments. ‘‘EBITDA’’ is an acronym for earnings before interest, taxes, depreciation and amortization. As we use the term, Adjusted EBITDA further removes the effects of cumulative effects of accounting changes, share in results of affiliates, minority interests in subsidiaries, reorganization expense, other income and expense, gain on extinguishment of debt, gain (loss) on sale of investments in affiliates and other assets, foreign currency exchange gain (loss), impairment and restructuring charges, and stock-based compensation. We believe Adjusted EBITDA is meaningful because it provides investors a means to evaluate the operating performance of our segments and our company on an ongoing basis using criteria that is used by our internal decision makers. Our internal decision makers believe Adjusted EBITDA is a meaningful measure and is superior to other available GAAP measures because it represents a transparent view of our recurring operating performance and allows management to readily view operating trends, perform analytical comparisons and benchmarking between segments in the different countries in which we operate and identify strategies to improve operating performance. For example, our internal decision makers believe that the inclusion of impairment and restructuring charges within Adjusted EBITDA distorts their ability to efficiently assess and view the core operating trends in our segments. In addition, our internal decision makers believe our measure of Adjusted EBITDA is important because analysts and other investors use it to compare our performance to other companies in our industry. We reconcile the total of the reportable segments’ Adjusted EBITDA to our consolidated net income as presented in the accompanying consolidated statements of operations, because we believe consolidated net income is the most directly comparable financial measure to total segment operating performance. Investors should view Adjusted EBITDA as a supplement to, and not a substitute for, other GAAP measures of income as a measure of operating performance. As discussed above, Adjusted EBITDA excludes, among other items, frequently occurring impairment, restructuring and other charges that would be included in GAAP measures of operating performance.
26
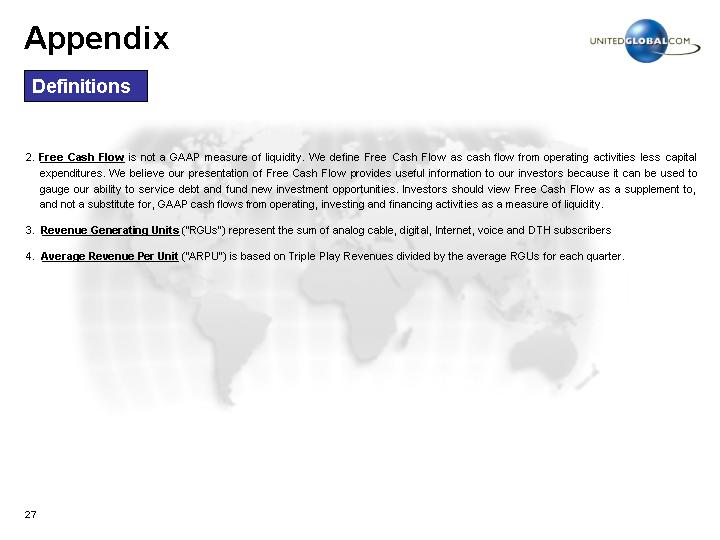
2. Free Cash Flow is not a GAAP measure of liquidity. We define Free Cash Flow as cash flow from operating activities less capital expenditures. We believe our presentation of Free Cash Flow provides useful information to our investors because it can be used to gauge our ability to service debt and fund new investment opportunities. Investors should view Free Cash Flow as a supplement to, and not a substitute for, GAAP cash flows from operating, investing and financing activities as a measure of liquidity.
3. Revenue Generating Units (“RGUs”) represent the sum of analog cable, digital, Internet, voice and DTH subscribers
4. Average Revenue Per Unit (“ARPU”) is based on Triple Play Revenues divided by the average RGUs for each quarter.
27
|
| For the three months ended, |
| |||||||
(amounts in thousands) |
| Q3 ‘03 |
| Q2 ‘03 |
| Q3 ‘02 |
| |||
|
|
|
|
|
|
|
| |||
Adjusted EBITDA |
| $ | 171,366 |
| $ | 149,431 |
| $ | 84,849 |
|
Loss on disposal of Poland DTH Business |
| — |
| (8,000 | ) | — |
| |||
Stock-based compensation (1) |
| (14,261 | ) | (8,275 | ) | (8,261 | ) | |||
Depreciation & Amortization |
| (192,002 | ) | (211,487 | ) | (201,173 | ) | |||
Impairment & Restructuring Charges (2) |
| 459 |
| 1,096 |
| 1,390 |
| |||
Operating Income (Loss) |
| (34,438 | ) | (77,235 | ) | (123,195 | ) | |||
Interest Expense, Net |
| (71,247 | ) | (92,377 | ) | (153,532 | ) | |||
Foreign currency exchange gain, net |
| (276,529 | ) | 263,451 |
| (62,217 | ) | |||
Gain (Loss) on Sale of Investments in affiliates, net |
| (283 | ) | 281,483 |
| 155,754 |
| |||
Gain on early extinguishment of debt |
| 2,109,596 |
| — |
| — |
| |||
Other Income (Expense), net |
| (1,107 | ) | (11,025 | ) | (31,808 | ) | |||
Income before income taxes and other |
| 1,725,992 |
| 364,297 |
| (214,998 | ) | |||
Income tax and other, net |
| 11,117 |
| 257,717 |
| (60,216 | ) | |||
Net Income (Loss) |
| $ | 1,737,109 |
| $ | 622,014 |
| $ | (275,214 | ) |
(1) Stock based compensation includes charges associated with fixed, or non-cash stock options, as well as charges associated with phantom, or cash-based, stock option plans, as more fully disclosed in UGC’s 10Q and 10K.
(2) Represents certain impairment charges. Please refer to UGC’s 10Q as of September 30, 2003 for a summary.
28
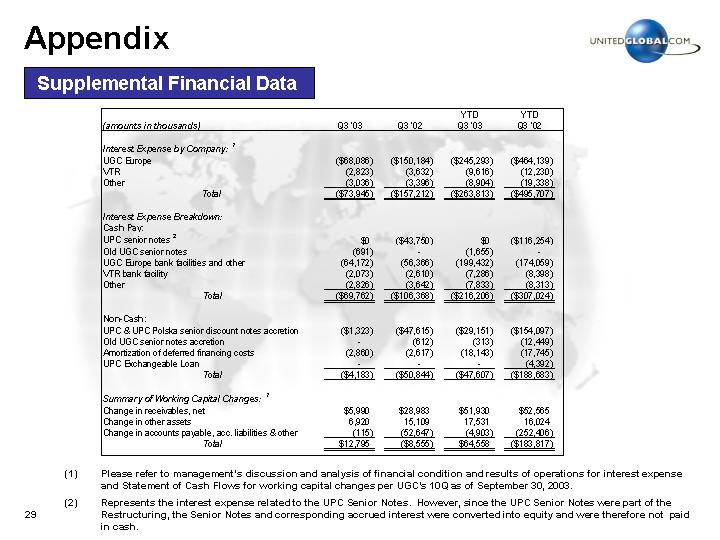
(amounts in thousands) |
| Q3 ‘03 |
| Q3 ‘02 |
| YTD |
| YTD |
| ||||
|
|
|
|
|
|
|
|
|
| ||||
Interest Expense by Company: (1) |
|
|
|
|
|
|
|
|
| ||||
UGC Europe |
| $ | (68,086 | ) | $ | (150,184 | ) | $ | (245,293 | ) | $ | (464,139 | ) |
VTR |
| (2,823 | ) | (3,632 | ) | (9,616 | ) | (12,230 | ) | ||||
Other |
| (3,036 | ) | (3,396 | ) | (8,904 | ) | (19,338 | ) | ||||
Total |
| $ | (73,945 | ) | $ | (157,212 | ) | $ | (263,813 | ) | $ | (495,707 | ) |
|
|
|
|
|
|
|
|
|
| ||||
Interest Expense Breakdown: |
|
|
|
|
|
|
|
|
| ||||
Cash Pay: |
|
|
|
|
|
|
|
|
| ||||
UPC senior notes (2) |
| $ | 0 |
| $ | (43,750 | ) | $ | 0 |
| $ | (116,254 | ) |
Old UGC senior notes |
| (691 | ) | — |
| (1,655 | ) | — |
| ||||
UGC Europe bank facilities and other |
| (64,172 | ) | (56,366 | ) | (199,432 | ) | (174,059 | ) | ||||
VTR bank facility |
| (2,073 | ) | (2,610 | ) | (7,286 | ) | (8,398 | ) | ||||
Other |
| (2,826 | ) | (3,642 | ) | (7,833 | ) | (8,313 | ) | ||||
Total |
| $ | (69,762 | ) | $ | (106,368 | ) | $ | (216,206 | ) | $ | (307,024 | ) |
|
|
|
|
|
|
|
|
|
| ||||
Non-Cash: |
|
|
|
|
|
|
|
|
| ||||
UPC & UPC Polska senior discount notes accretion |
| $ | (1,323 | ) | $ | (47,615 | ) | $ | (29,151 | ) | $ | (154,097 | ) |
Old UGC senior notes accretion |
| — |
| (612 | ) | (313 | ) | (12,449 | ) | ||||
Amortization of deferred financing costs |
| (2,860 | ) | (2,617 | ) | (18,143 | ) | (17,745 | ) | ||||
UPC Exchangeable Loan |
| — |
| — |
| — |
| (4,392 | ) | ||||
Total |
| $ | (4,183 | ) | $ | (50,844 | ) | $ | (47,607 | ) | $ | (188,683 | ) |
|
|
|
|
|
|
|
|
|
| ||||
Summary of Working Capital Changes: (1) |
|
|
|
|
|
|
|
|
| ||||
Change in receivables, net |
| $ | 5,990 |
| $ | 28,983 |
| $ | 51,930 |
| $ | 52,565 |
|
Change in other assets |
| 6,920 |
| 15,109 |
| 17,531 |
| 16,024 |
| ||||
Change in accounts payable, acc. liabilities & other |
| (115 | ) | (52,647 | ) | (4,903 | ) | (252,406 | ) | ||||
Total |
| $ | 12,795 |
| $ | (8,555 | ) | $ | 64,558 |
| $ | (183,817 | ) |
(1) Please refer to management’s discussion and analysis of financial condition and results of operations for interest expense and Statement of Cash Flows for working capital changes per UGC’s 10Q as of September 30, 2003.
(2) Represents the interest expense related to the UPC Senior Notes. However, since the UPC Senior Notes were part of the Restructuring, the Senior Notes and corresponding accrued interest were converted into equity and were therefore not paid in cash.
29
|
| UGC 10K |
| UGC 10Q |
| UGC 10Q |
| UGC 10Q |
| ||||
Debt Summary: |
|
|
|
|
|
|
|
|
| ||||
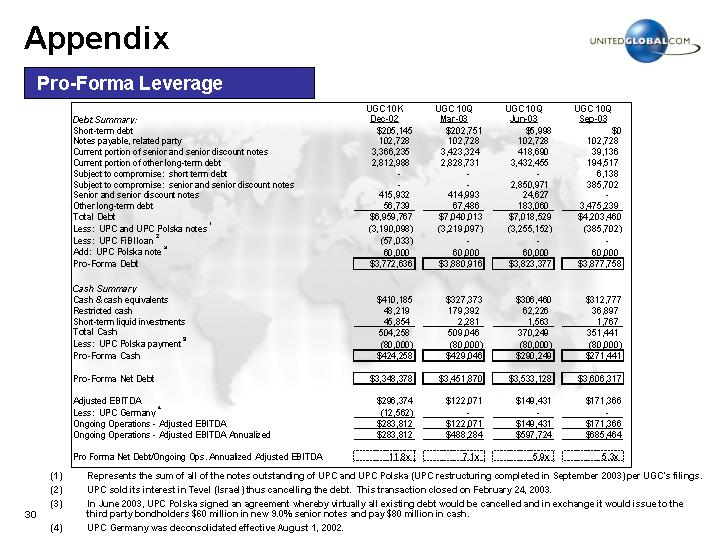
Short-term debt |
| $ | 205,145 |
| $ | 202,751 |
| $ | 5,998 |
| $ | 0 |
|
Notes payable, related party |
| 102,728 |
| 102,728 |
| 102,728 |
| 102,728 |
| ||||
Current portion of senior and senior discount notes |
| 3,366,235 |
| 3,423,324 |
| 418,690 |
| 39,136 |
| ||||
Current portion of other long-term debt |
| 2,812,988 |
| 2,828,731 |
| 3,432,455 |
| 194,517 |
| ||||
Subject to compromise: short term debt |
| — |
| — |
| — |
| 6,138 |
| ||||
Subject to compromise: senior and senior discount notes |
| — |
| — |
| 2,850,971 |
| 385,702 |
| ||||
Senior and senior discount notes |
| 415,932 |
| 414,993 |
| 24,627 |
| — |
| ||||
Other long-term debt |
| 56,739 |
| 67,486 |
| 183,060 |
| 3,475,239 |
| ||||
Total Debt |
| $ | 6,959,767 |
| $ | 7,040,013 |
| $ | 7,018,529 |
| $ | 4,203,460 |
|
Less: UPC and UPC Polska notes (1) |
| (3,190,098 | ) | (3,219,097 | ) | (3,255,152 | ) | (385,702 | ) | ||||
Less: UPC FiBI loan (2) |
| (57,033 | ) | — |
| — |
| — |
| ||||
Add: UPC Polska note (3) |
| 60,000 |
| 60,000 |
| 60,000 |
| 60,000 |
| ||||
Pro-Forma Debt |
| $ | 3,772,636 |
| $ | 3,880,916 |
| $ | 3,823,377 |
| $ | 3,877,758 |
|
|
|
|
|
|
|
|
|
|
| ||||
Cash Summary |
|
|
|
|
|
|
|
|
| ||||
Cash & cash equivalents |
| $ | 410,185 |
| $ | 327,373 |
| $ | 306,460 |
| $ | 312,777 |
|
Restricted cash |
| 48,219 |
| 179,392 |
| 62,226 |
| 36,897 |
| ||||
Short-term liquid investments |
| 45,854 |
| 2,281 |
| 1,563 |
| 1,767 |
| ||||
Total Cash |
| 504,258 |
| 509,046 |
| 370,249 |
| 351,441 |
| ||||
Less: UPC Polska payment (3) |
| (80,000 | ) | (80,000 | ) | (80,000 | ) | (80,000 | ) | ||||
Pro-Forma Cash |
| $ | 424,258 |
| $ | 429,046 |
| $ | 290,249 |
| $ | 271,441 |
|
|
|
|
|
|
|
|
|
|
| ||||
Pro-Forma Net Debt |
| $ | 3,348,378 |
| $ | 3,451,870 |
| $ | 3,533,128 |
| $ | 3,606,317 |
|
|
|
|
|
|
|
|
|
|
| ||||
Adjusted EBITDA |
| $ | 296,374 |
| $ | 122,071 |
| $ | 149,431 |
| $ | 171,366 |
|
Less: UPC Germany (4) |
| (12,562 | ) | — |
| — |
| — |
| ||||
Ongoing Operations - Adjusted EBITDA |
| $ | 283,812 |
| $ | 122,071 |
| $ | 149,431 |
| $ | 171,366 |
|
Ongoing Operations - Adjusted EBITDA Annualized |
| $ | 283,812 |
| $ | 488,284 |
| $ | 597,724 |
| $ | 685,464 |
|
|
|
|
|
|
|
|
|
|
| ||||
Pro Forma Net Debt/Ongoing Ops. Annualized Adjusted EBITDA |
| 11.8 | x | 7.1 | x | 5.9 | x | 5.3 | x | ||||
(1) Represents the sum of all of the notes outstanding of UPC and UPC Polska (UPC restructuring completed in September 2003) per UGC’s filings.
(2) UPC sold its interest in Tevel (Israel) thus cancelling the debt. This transaction closed on February 24, 2003.
(3) In June 2003, UPC Polska signed an agreement whereby virtually all existing debt would be cancelled and in exchange it would issue to the third party bondholders $60 million in new 9.0% senior notes and pay $80 million in cash.
(4) UPC Germany was deconsolidated effective August 1, 2002.
30
|
| UGCE 10K |
| UGCE 10Q |
| UGCE 10Q |
| UGCE 10Q |
| ||||
Debt Summary: |
|
|
|
|
|
|
|
|
| ||||
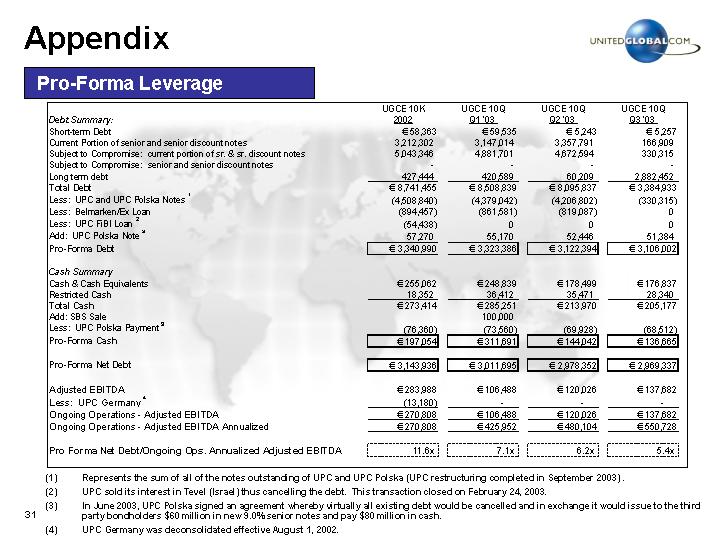
Short-term Debt |
| € | 58,363 |
| € | 59,535 |
| € | 5,243 |
| € | 5,257 |
|
Current Portion of senior and senior discount notes |
| 3,212,302 |
| 3,147,014 |
| 3,357,791 |
| 166,909 |
| ||||
Subject to Compromise: current portion of sr. & sr. discount notes |
| 5,043,346 |
| 4,881,701 |
| 4,672,594 |
| 330,315 |
| ||||
Subject to Compromise: senior and senior discount notes |
| — |
| — |
| — |
| — |
| ||||
Long term debt |
| 427,444 |
| 420,589 |
| 60,209 |
| 2,882,452 |
| ||||
Total Debt |
| € | 8,741,455 |
| € | 8,508,839 |
| € | 8,095,837 |
| € | 3,384,933 |
|
Less: UPC and UPC Polska Notes (1) |
| (4,508,840 | ) | (4,379,042 | ) | (4,206,802 | ) | (330,315 | ) | ||||
Less: Belmarken/Ex Loan |
| (894,457 | ) | (861,581 | ) | (819,087 | ) | 0 |
| ||||
Less: UPC FiBI Loan (2) |
| (54,438 | ) | 0 |
| 0 |
| 0 |
| ||||
Add: UPC Polska Note (3) |
| 57,270 |
| 55,170 |
| 52,446 |
| 51,384 |
| ||||
Pro-Forma Debt |
| € | 3,340,990 |
| € | 3,323,386 |
| € | 3,122,394 |
| € | 3,106,002 |
|
|
|
|
|
|
|
|
|
|
| ||||
Cash Summary |
|
|
|
|
|
|
|
|
| ||||
Cash & Cash Equivalents |
| € | 255,062 |
| € | 248,839 |
| € | 178,499 |
| € | 176,837 |
|
Restricted Cash |
| 18,352 |
| 36,412 |
| 35,471 |
| 28,340 |
| ||||
Total Cash |
| € | 273,414 |
| € | 285,251 |
| € | 213,970 |
| € | 205,177 |
|
Add: SBS Sale |
|
|
| 100,000 |
|
|
|
|
| ||||
Less: UPC Polska Payment (3) |
| (76,360 | ) | (73,560 | ) | (69,928 | ) | (68,512 | ) | ||||
Pro-Forma Cash |
| € | 197,054 |
| € | 311,691 |
| € | 144,042 |
| € | 136,665 |
|
|
|
|
|
|
|
|
|
|
| ||||
Pro-Forma Net Debt |
| € | 3,143,936 |
| € | 3,011,695 |
| € | 2,978,352 |
| € | 2,969,337 |
|
|
|
|
|
|
|
|
|
|
| ||||
Adjusted EBITDA |
| �� | 283,988 |
| € | 106,488 |
| € | 120,026 |
| € | 137,682 |
|
Less: UPC Germany (4) |
| (13,180 | ) | — |
| — |
| — |
| ||||
Ongoing Operations - Adjusted EBITDA |
| € | 270,808 |
| € | 106,488 |
| € | 120,026 |
| € | 137,682 |
|
Ongoing Operations - Adjusted EBITDA Annualized |
| € | 270,808 |
| € | 425,952 |
| € | 480,104 |
| € | 550,728 |
|
|
|
|
|
|
|
|
|
|
| ||||
Pro Forma Net Debt/Ongoing Ops. Annualized Adjusted EBITDA |
| 11.6 | x | 7.1 | x | 6.2 | x | 5.4 | x | ||||
(1) Represents the sum of all of the notes outstanding of UPC and UPC Polska (UPC restructuring completed in September 2003) .
(2) UPC sold its interest in Tevel (Israel) thus cancelling the debt. This transaction closed on February 24, 2003.
(3) In June 2003, UPC Polska signed an agreement whereby virtually all existing debt would be cancelled and in exchange it would issue to the third party bondholders $60 million in new 9.0% senior notes and pay $80 million in cash.
(4) UPC Germany was deconsolidated effective August 1, 2002.
31
Additional Information
UGC filed a Registration Statement on Form S-4 containing a Prospectus relating to the exchange offer and Europe Acquisition, Inc. filed a Schedule TO. UGC EUROPE STOCKHOLDERS AND OTHER INVESTORS ARE URGED TO READ THESE DOCUMENTS (INCLUDING ANY AMENDMENTS OR SUPPLEMENTS TO THESE DOCUMENTS WHEN AVAILABLE) BECAUSE THEY CONTAIN IMPORTANT INFORMATION ABOUT THE TRANSACTION. Investors may obtain these documents free of charge at the SEC’s website at www.sec.gov. In addition, copies of the Prospectus and other related exchange offer documents filed by UGC or Europe Acquisition, Inc. may be obtained free of charge by directing a request to UnitedGlobalCom, Inc., 4643 South Ulster Street, Suite 1300, Denver, Colorado 80237, Attention: Investor Relations Department, telephone: 303-770-4001.
32
[LOGO]
UBS Securities LLC
31st Annual Media Conference
December 8, 2003