Filed by Harrah’s Entertainment, Inc. Pursuant to Rule 425 |
under the Securities Act of 1933 |
and deemed filed pursuant to Rule 14a-12 |
under the Securities Exchange Act of 1934 |
|
Subject Company: Caesars Entertainment, Inc. |
Commission File No.: 001-14573 |
This filing relates to a proposed acquisition (the “Acquisition”) by Harrah’s Entertainment, Inc. (“Harrah’s”) of Caesars Entertainment, Inc. (“Caesars”) pursuant to the terms of an Agreement and Plan of Merger, dated as of July 14, 2004 (the “Merger Agreement”), by and among Harrah’s, Harrah’s Operating Company, Inc. and Caesars. The Merger Agreement is on file with the Securities and Exchange Commission as an exhibit to the Current Report on Form 8-K filed by Harrah’s on July 15, 2004, and is incorporated by reference into this filing.
The following is a series of slides that were presented by Harrah’s to members of the financial analyst community at a presentation on August 5, 2004:
Link to searchable text of slide shown above
Link to searchable text of slide shown above
Link to searchable text of slide shown above
Link to searchable text of slide shown above
Link to searchable text of slide shown above
Link to searchable text of slide shown above

Link to searchable text of slide shown above
Link to searchable text of slide shown above
Link to searchable text of slide shown above
Link to searchable text of slide shown above
Link to searchable text of slide shown above
Link to searchable text of slide shown above

Link to searchable text of slide shown above
Link to searchable text of slide shown above
Link to searchable text of slide shown above
Link to searchable text of slide shown above
Link to searchable text of slide shown above
Link to searchable text of slide shown above
Link to searchable text of slide shown above
Link to searchable text of slide shown above
Link to searchable text of slide shown above
Link to searchable text of slide shown above

Link to searchable text of slide shown above
Link to searchable text of slide shown above
Link to searchable text of slide shown above
Link to searchable text of slide shown above
Link to searchable text of slide shown above

Link to searchable text of slide shown above
Searchable text section of graphics shown above
[GRAPHIC]
[LOGO]
Investor Briefing
August 5, 2004
Agenda
• Review of HET Strategy
• CZR Acquisition
• Transaction Summary
• Strategic Rationale
• Conclusion: Future Priorities
HARRAH’S ENTERTAINMENT, INC.
2
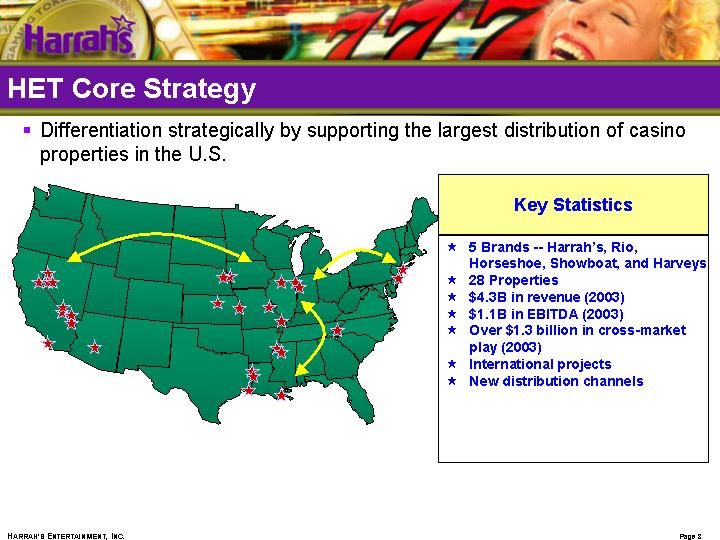
HET Core Strategy
• Differentiation strategically by supporting the largest distribution of casino properties in the U.S.
[GRAPHIC]
Key Statistics
• 5 Brands — Harrah’s, Rio, Horseshoe, Showboat, and Harveys
• 28 Properties
• $4.3B in revenue (2003)
• $1.1B in EBITDA (2003)
• Over $1.3 billion in cross-market play (2003)
• International projects
• New distribution channels
3
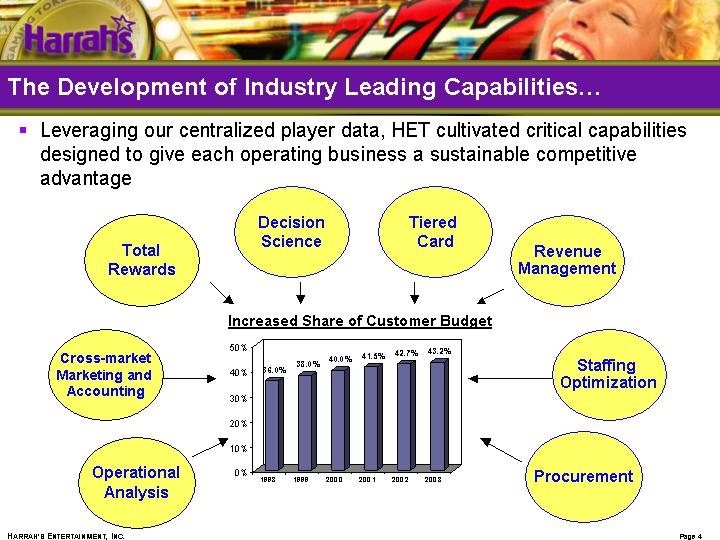
The Development of Industry Leading Capabilities…
• Leveraging our centralized player data, HET cultivated critical capabilities designed to give each operating business a sustainable competitive advantage
Increased Share of Customer Budget
[CHART]
Operational Analysis
Cross-market Marketing and Accounting
Total Rewards
Decision Science
Tiered Card
Revenue Management
Staffing Optimization
Procurement
4
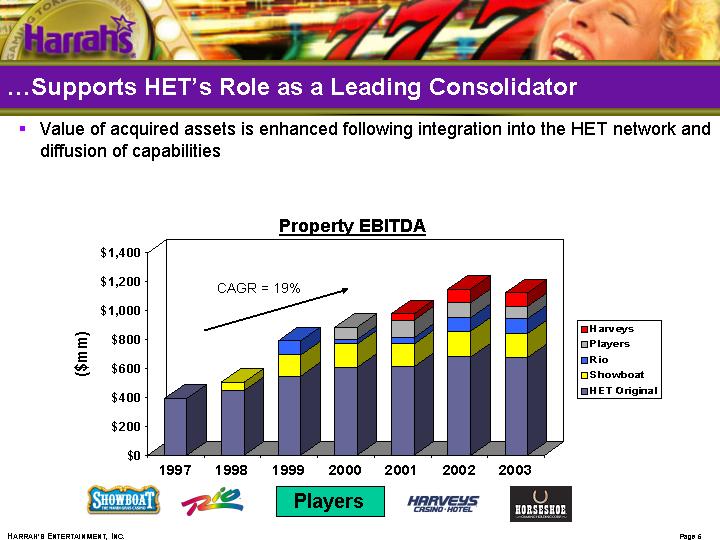
…Supports HET’s Role as a Leading Consolidator
• Value of acquired assets is enhanced following integration into the HET network and diffusion of capabilities
Property EBITDA
[CHART]
[LOGO]
5
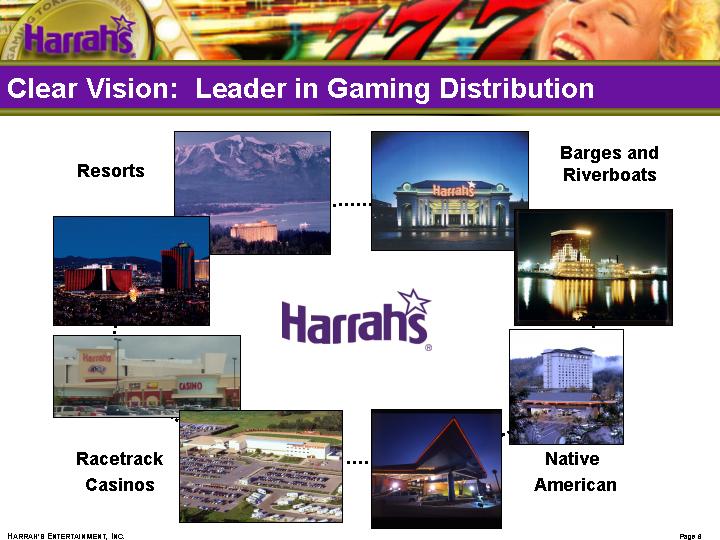
Clear Vision: Leader in Gaming Distribution
[LOGO]
Resorts
[GRAPHIC]
Racetrack Casinos
[GRAPHIC]
Barges and Riverboats
[GRAPHIC]
Native American
[GRAPHIC]
6
Agenda
• Review of HET Strategy
• CZR Acquisition
• Transaction Summary
• Strategic Rationale
• Conclusion: Future Priorities
7
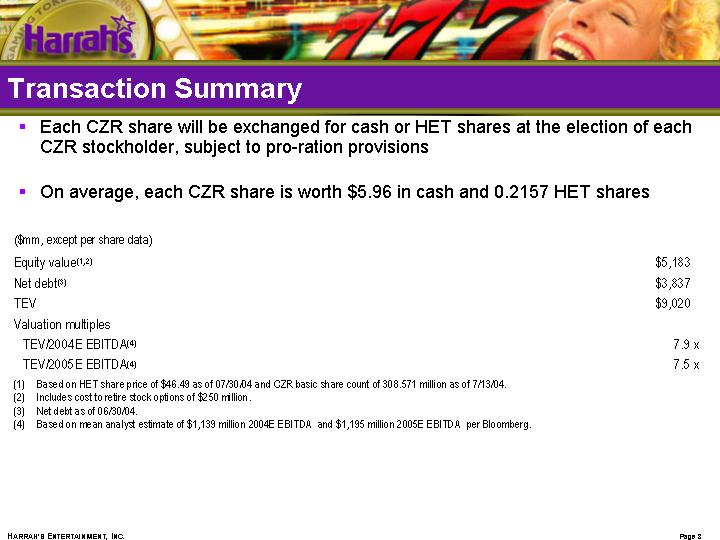
Transaction Summary
• Each CZR share will be exchanged for cash or HET shares at the election of each CZR stockholder, subject to pro-ration provisions
• On average, each CZR share is worth $5.96 in cash and 0.2157 HET shares
($mm, except per share data) |
|
|
| |
|
|
|
| |
Equity value(1),(2) |
| $ | 5,183 |
|
Net debt(3) |
| $ | 3,837 |
|
TEV |
| $ | 9,020 |
|
Valuation multiples |
|
|
| |
TEV/2004E EBITDA(4) |
| 7.9 | x | |
TEV/2005E EBITDA(4) |
| 7.5 | x | |
(1) Based on HET share price of $46.49 as of 07/30/04 and CZR basic share count of 308.571 million as of 7/13/04.
(2) Includes cost to retire stock options of $250 million.
(3) Net debt as of 06/30/04.
(4) Based on mean analyst estimate of $1,139 million 2004E EBITDA and $1,195 million 2005E EBITDA per Bloomberg.
8
Agenda
• Review of HET Strategy
• CZR Acquisition
• Transaction Summary
• Strategic Rationale
• Conclusion: Future Priorities
9
Strategic Rationale
• Combination creates premier distributor of gaming
• Increased exposure to stable regulatory environments
• Access to new markets
• Opportunity to enhance performance through application of HET capabilities to CZR businesses
• Financial strength allows pursuit of complementary growth projects
• Investment grade balance sheet
• Significant free cash flow
10
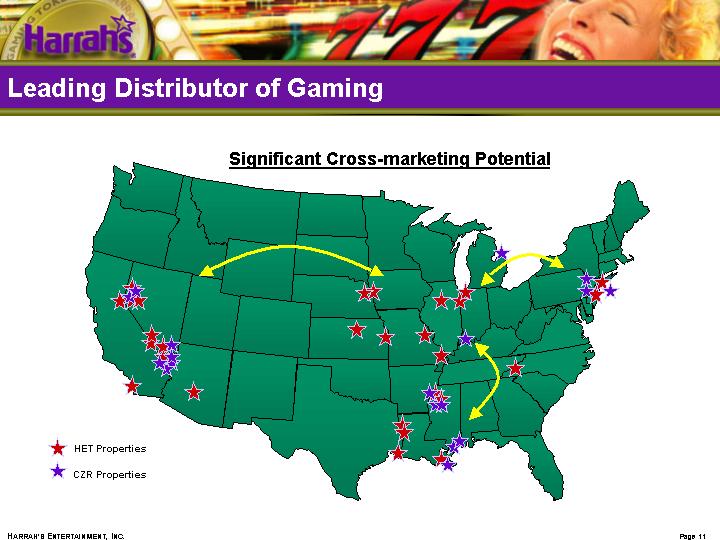
Leading Distributor of Gaming
Significant Cross-marketing Potential
[GRAPHIC]
11
Premier Gaming Brands
Harrah's
Horseshoe
Caesars
12
Las Vegas
• Creates “network within a network”
• Proximity provides revenue and cost synergy potential
• Greater variety of offerings for customer database
• Connection to Las Vegas Convention Center
• Monorail stops at HLV, Flamingo, and Bally’s
• Access to 2.1 million square feet of convention space
• Potential to service f&b, hotel, and casino needs
[GRAPHIC]
13
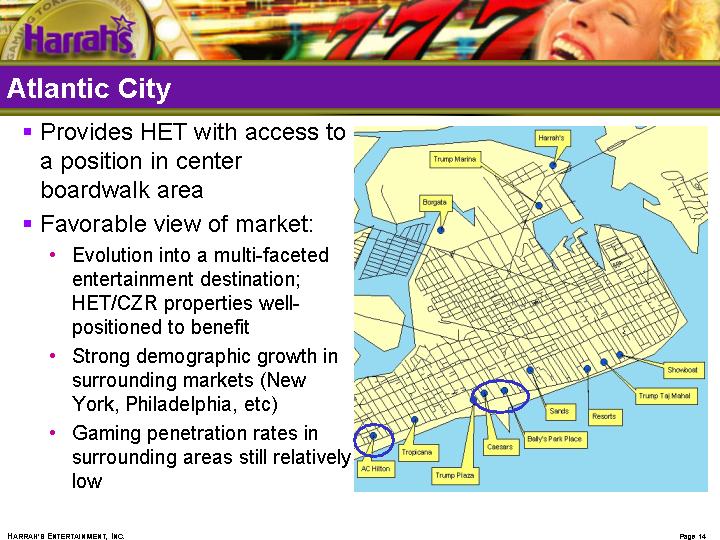
Atlantic City
• Provides HET with access to a position in center boardwalk area
• Favorable view of market:
• Evolution into a multi-faceted entertainment destination; HET/CZR properties well-positioned to benefit
• Strong demographic growth in surrounding markets (New York, Philadelphia, etc)
• Gaming penetration rates in surrounding areas still relatively low
[GRAPHIC]
14
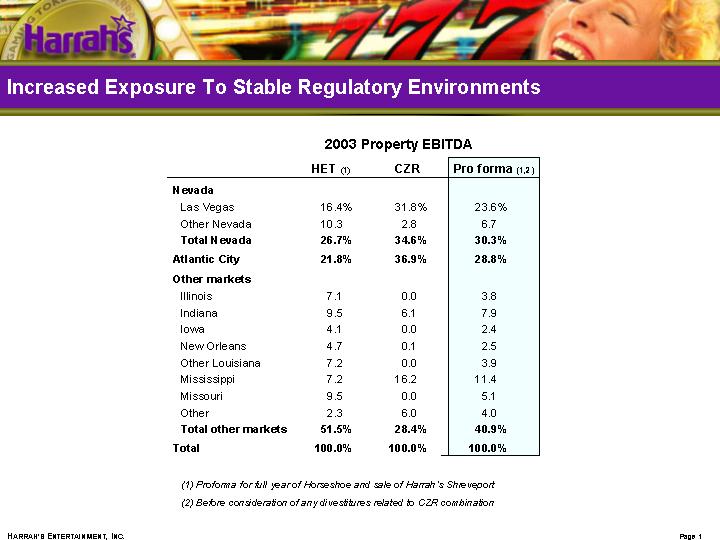
Increased Exposure To Stable Regulatory Environments
2003 Property EBITDA
|
| HET (1) |
| CZR |
| Pro forma (1),(2) |
|
Nevada |
|
|
|
|
|
|
|
Las Vegas |
| 16.4 | % | 31.8 | % | 23.6 | % |
Other Nevada |
| 10.3 |
| 2.8 |
| 6.7 |
|
Total Nevada |
| 26.7 | % | 34.6 | % | 30.3 | % |
|
|
|
|
|
|
|
|
Atlantic City |
| 21.8 | % | 36.9 | % | 28.8 | % |
|
|
|
|
|
|
|
|
Other markets |
|
|
|
|
|
|
|
Illinois |
| 7.1 |
| 0.0 |
| 3.8 |
|
Indiana |
| 9.5 |
| 6.1 |
| 7.9 |
|
Iowa |
| 4.1 |
| 0.0 |
| 2.4 |
|
New Orleans |
| 4.7 |
| 0.1 |
| 2.5 |
|
Other Louisiana |
| 7.2 |
| 0.0 |
| 3.9 |
|
Mississippi |
| 7.2 |
| 16.2 |
| 11.4 |
|
Missouri |
| 9.5 |
| 0.0 |
| 5.1 |
|
Other |
| 2.3 |
| 6.0 |
| 4.0 |
|
Total other markets |
| 51.5 | % | 28.4 | % | 40.9 | % |
|
|
|
|
|
|
|
|
Total |
| 100.0 | % | 100.0 | % | 100.0 | % |
(1) Proforma for full year of Horseshoe and sale of Harrah’s Shreveport
(2) Before consideration of any divestitures related to CZR combination
15
New Markets
• CZR provides access to several new markets:
• MS Gulf Coast
• Detroit (through Windsor)
• Louisville
• New York (potentially)
• New markets are particularly valuable to HET given network nature of business
• Cross market play totaled $1.3B in 2003
16
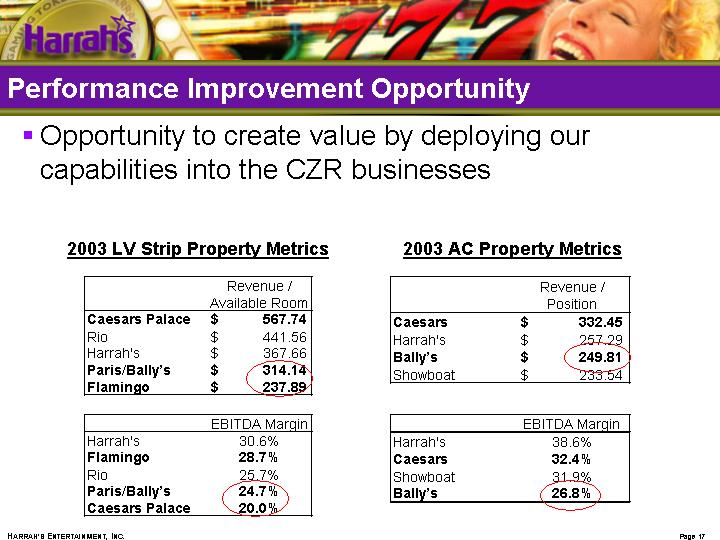
Performance Improvement Opportunity
• Opportunity to create value by deploying our capabilities into the CZR businesses
2003 LV Strip Property Metrics
|
| Revenue / |
| |
Caesars Palace |
| $ | 567.74 |
|
Rio |
| $ | 441.56 |
|
Harrah’s |
| $ | 367.66 |
|
Paris/Bally’s |
| $ | 314.14 |
|
Flamingo |
| $ | 237.89 |
|
|
|
|
| |
|
| EBITDA Margin |
| |
Harrah’s |
| 30.6 | % | |
Flamingo |
| 28.7 | % | |
Rio |
| 25.7 | % | |
Paris/Bally’s |
| 24.7 | % | |
Caesars Palace |
| 20.0 | % | |
2003 AC Property Metrics
|
| Revenue / |
| |
Caesars |
| $ | 332.45 |
|
Harrah’s |
| $ | 257.29 |
|
Bally’s |
| $ | 249.81 |
|
Showboat |
| $ | 233.54 |
|
|
|
|
| |
|
| EBITDA Margin |
| |
Harrah’s |
| 38.6 | % | |
Caesars |
| 32.4 | % | |
Showboat |
| 31.9 | % | |
Bally’s |
| 26.8 | % | |
17
Potential Synergies
• Increase revenue at select properties
• Based on HET’s ability to yield rooms in conjunction with customer database
• At present, HET turns away customers due to limited room supply
• Increase EBITDA margins at select properties
• HET operates at a higher EBITDA margin than CZR on a comparable basis
• Remove a portion of CZR’s unallocated corporate expense
Year 1 Target Synergies: $80 million
18
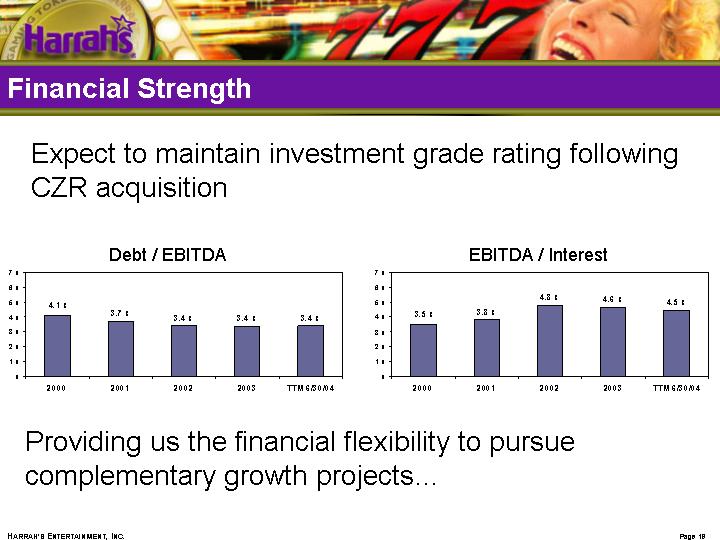
Financial Strength
Expect to maintain investment grade rating following CZR acquisition
Debt / EBITDA
[CHART]
EBITDA / Interest
[CHART]
Providing us the financial flexibility to pursue complementary growth projects…
19
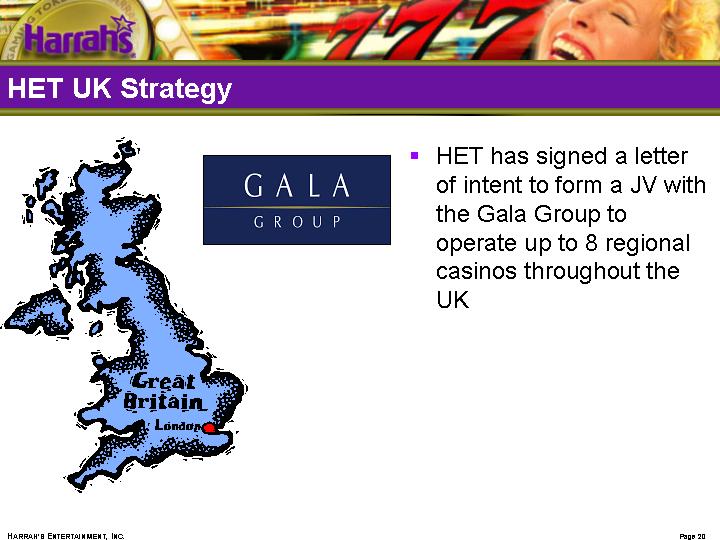
HET UK Strategy
[GRAPHIC]
GALA GROUP
• HET has signed a letter of intent to form a JV with the Gala Group to operate up to 8 regional casinos throughout the UK
20
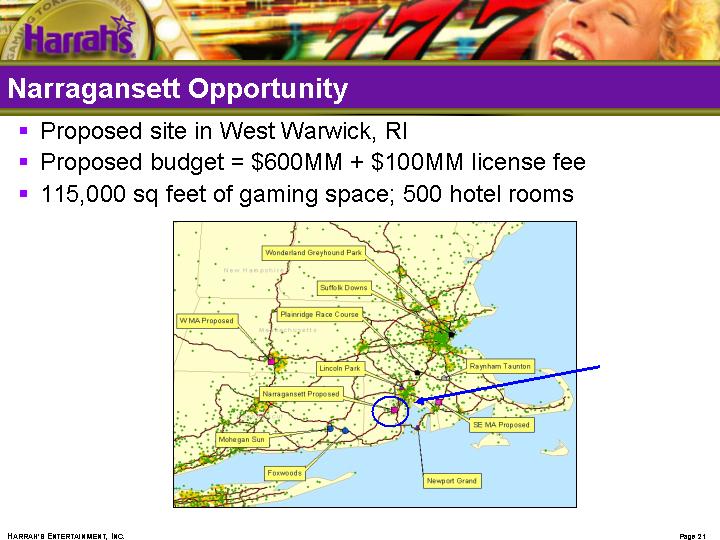
Narragansett Opportunity
• Proposed site in West Warwick, RI
• Proposed budget = $600MM + $100MM license fee
• 115,000 sq feet of gaming space; 500 hotel rooms
[GRAPHIC]
21
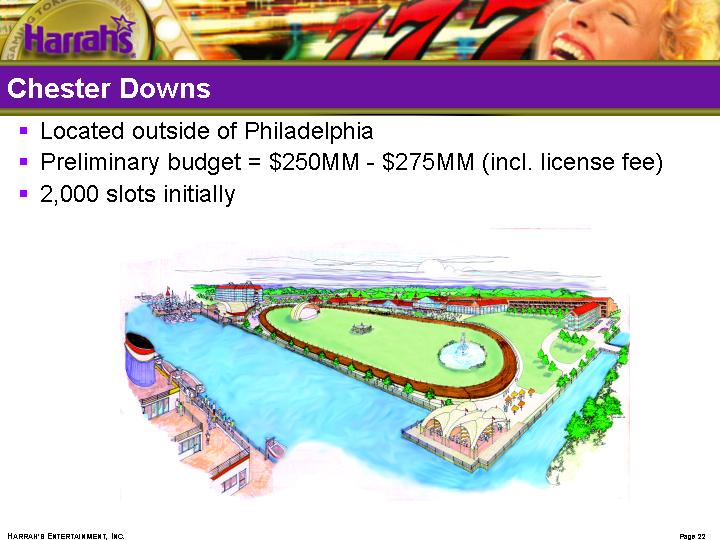
Chester Downs
• Located outside of Philadelphia
• Preliminary budget = $250MM - $275MM (incl. license fee)
• 2,000 slots initially
[GRAPHIC]
22
Innovative Growth Channels
• HET’s core capabilities are the key enablers to innovation in gaming distribution
• First foray: Luckyme.com
[GRAPHIC]
23
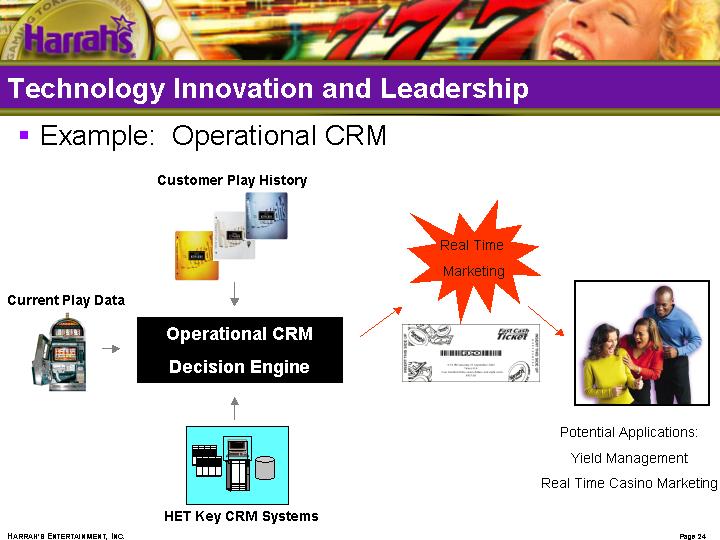
Technology Innovation and Leadership
• Example: Operational CRM
| Customer Play History |
|
|
|
|
|
|
Current Play Data | [GRAPHIC] | Real Time |
|
| |||
| Operational CRM |
|
|
[GRAPHIC] | Decision Engine | [GRAPHIC] | [GRAPHIC] |
|
|
|
|
|
|
| Potential Applications: |
| [GRAPHIC] |
| |
| HET Key CRM Systems |
|
24
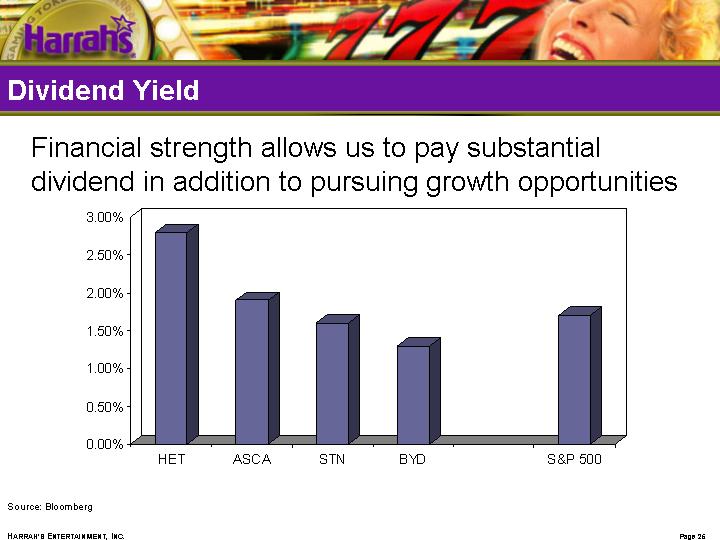
Dividend Yield
Financial strength allows us to pay substantial dividend in addition to pursuing growth opportunities
[CHART]
Source: Bloomberg
25
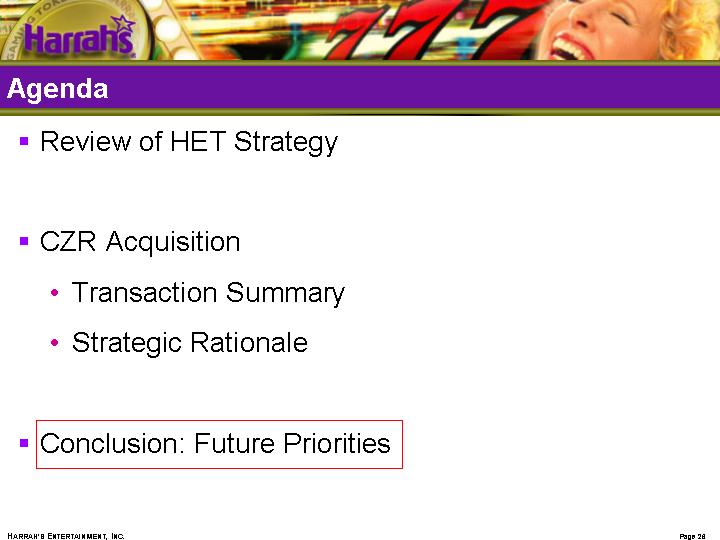
Agenda
• Review of HET Strategy
• CZR Acquisition
• Transaction Summary
• Strategic Rationale
• Conclusion: Future Priorities
26
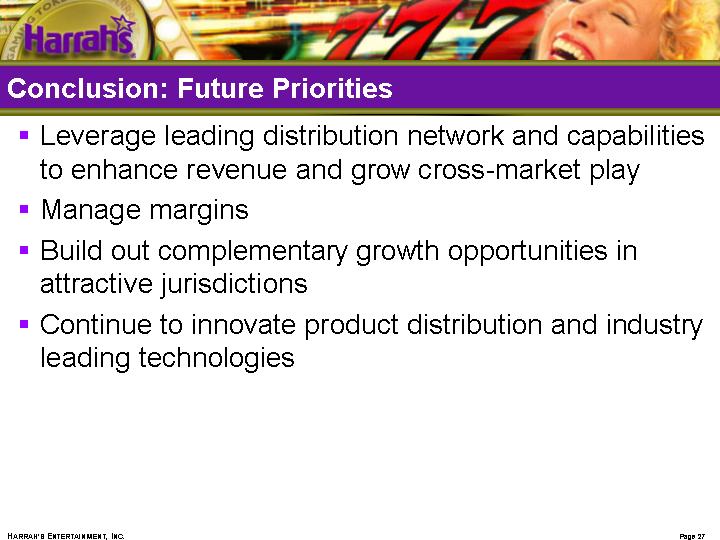
Conclusion: Future Priorities
• Leverage leading distribution network and capabilities to enhance revenue and grow cross-market play
• Manage margins
• Build out complementary growth opportunities in attractive jurisdictions
• Continue to innovate product distribution and industry leading technologies
27
[LOGO]
Additional Information about the Merger and Where to Find It
This document includes “forward-looking statements” intended to qualify for the safe harbor from liability established by the Private Securities Litigation Reform Act of 1995. You can identify these statements by the fact that they do not relate strictly to historical or current facts. These statements contain words such as “may,” “will,” “project,” “might,” “expect,” “believe,” “anticipate,” “intend,” “could,” “would,” “estimate,” “continue” or “pursue,” or the negative or other variations thereof or comparable terminology. In particular, they include statements relating to, among other things, future actions, strategies, future performance, future financial results of Harrah’s and Caesars and Harrah’s anticipated acquisition of Caesars. These forward-looking statements are based on current expectations and projections about future events.
Investors are cautioned that forward-looking statements are not guarantees of future performance or results and involve risks and uncertainties that cannot be predicted or quantified and, consequently, the actual performance or results of Caesars and Harrah’s may differ materially from those expressed or implied by such forward-looking statements. Such risks and uncertainties include, but are not limited to, the following factors as well as other factors described from time to time in our reports filed with the Securities and Exchange Commission (including the sections entitled “Risk Factors” and “Management’s Discussion and Analysis of Financial Condition and Results of Operations” contained therein): financial community and rating agency perceptions of Harrah’s and Caesars’, the effects of economic, credit and capital
market conditions on the economy in general, and on gaming and hotel companies in particular; construction factors, including delays, zoning issues, environmental restrictions, soil and water conditions, weather and other hazards, site access matters and building permit issues; the effects of environmental and structural building conditions relating to our properties; the ability to timely and cost-effectively integrate into Harrah’s operations the companies that it acquires, including with respect to its acquisition of Caesars; access to available and feasible financing, including financing for Harrah’s acquisition of Caesars, on a timely basis; changes in laws (including increased tax rates), regulations or accounting standards, third-party relations and approvals, and decisions of courts, regulators and governmental bodies; litigation outcomes and judicial actions, including gaming legislative action, referenda and taxation; the ability of our customer-tracking, customer loyalty and yield-management programs to continue to increase customer loyalty and same store sales; our ability to recoup costs of capital investments through higher revenues; acts of war or terrorist incidents; abnormal gaming holds; and the effects of competition, including locations of competitors and operating and market competition.
Any forward-looking statements are made pursuant to the Private Securities Litigation Reform Act of 1995 and, as such, speak only as of the date made. Harrah’s and Caesars disclaim any obligation to update the forward-looking statements. You are cautioned not to place undue reliance on these forward-looking statements which speak only as of the date stated, or if no date is stated, as of the date of this press release.
Additional information about Harrah’s is available on the World Wide Web at http://www.harrahs.com. Additional information about Caesars is available on the World Wide Web at http://www.caesars.com.
Additional Information about the Acquisition and Where to Find It
In connection with the Acquisition, Caesars and Harrah’s intend to file relevant materials with the Securities and Exchange Commission (SEC), including a registration statement on Form S-4 that will contain a prospectus and a joint proxy statement. INVESTORS AND SECURITY HOLDERS OF HARRAH’S AND CAESARS ARE URGED TO READ THE PROSPECTUS AND JOINT PROXY STATEMENT WHEN THEY BECOME AVAILABLE BECAUSE THEY WILL CONTAIN IMPORTANT INFORMATION ABOUT HARRAH’S, CAESARS AND THE ACQUISITION. The proxy statement, prospectus and other relevant materials (when they become available), and any other documents filed by Harrah’s or Caesars with the SEC, may be obtained free of charge at the SEC’s web site at www.sec.gov. In addition, investors and security holders may obtain free copies of the documents filed with the SEC by Harrah’s by directing a written request to: Harrah’s, One Harrah’s Court, Las Vegas, Nevada 89119, Attention: Investor Relations or Caesars Entertainment, Inc., 3930 Howard Hughes Parkway, Las Vegas, Nevada 89109, Attention: Investor Relations. Investors and security holders are urged to read the proxy statement, prospectus and the other relevant materials when they become available before making any voting or investment decision with respect to the Acquisition.
Harrah’s, Caesars and their respective executive officers and directors may be deemed to be participants in the solicitation of proxies from the stockholders of Caesars and Harrah’s in connection with the Acquisition. Information about those executive officers and directors of Harrah’s and their ownership of Harrah’s common stock is set forth in the Harrah’s Form 10-K
for the year ended December 31, 2003, which was filed with the SEC on March 5, 2004, and the proxy statement for Harrah’s 2004 Annual Meeting of Stockholders, which was filed with the SEC on March 4, 2004. Information about the executive officers and directors of Caesars and their ownership of Caesars common stock is set forth in the proxy statement for Caesars’ 2004 Annual Meeting of Stockholders, which was filed with the SEC on April 16, 2004. Investors and security holders may obtain additional information regarding the direct and indirect interests of Harrah’s, Caesars and their respective executive officers and directors in the Acquisition by reading the proxy statement and prospectus regarding the Acquisition when it becomes available.
This communication shall not constitute an offer to sell or the solicitation of an offer to sell or the solicitation of an offer to buy any securities, nor shall there be any sale of securities in any jurisdiction in which such offer, solicitation or sale would be unlawful prior to registration or qualification under the securities laws of any such jurisdiction. No offering of securities shall be made except by means of a prospectus meeting the requirements of Section 10 of the Securities Act of 1933, as amended.