UNITED STATES
SECURITIES AND EXCHANGE COMMISSION
Washington, D.C. 20549
FORM N-CSR
CERTIFIED SHAREHOLDER REPORT OF REGISTERED
MANAGEMENT INVESTMENT COMPANIES
Investment Company Act file number 811-09067
Kirr, Marbach Partners Funds, Inc.
(Exact name of registrant as specified in charter)
621 Washington Street, Columbus, IN 47201
(Address of principal executive offices) (Zip code)
Kirr, Marbach & Company, LLC, 621 Washington Street, Columbus, IN 47201
(Name and address of agent for service)
(812) 376-9444
Registrant's telephone number, including area code
Date of fiscal year end: September 30, 2009
Date of reporting period: March 31, 2009
Item 1. Report to Stockholders.
Kirr, Marbach Partners
Value Fund
| Semi-Annual Report | ||
| www.kmpartnersfunds.com | March 31, 2009 |
KIRR, MARBACH PARTNERS
“Amid this bad news, however, never forget that our country has faced far worse travails in the past. In the 20th Century alone, we dealt with two great wars (one of which we initially appeared to be losing); a dozen or so panics and recessions; virulent inflation that led to a 21 ½% prime rate in 1980; and the Great Depression of the 1930s, when unemployment ranged between 15% and 25% for many years. America has had no shortage of challenges. Without fail, however, we’ve overcome them…Though the path has not been smooth, our economic system has worked extraordinarily well over time. It has unleashed human potential as no other system has, and it will continue to do so. America’s best days lie ahead.”
—Warren Buffett (2008 Berkshire Hathaway Inc. Shareholder Letter)
May 21, 2009
Dear Fellow Shareholders:
We are all painfully aware that the first calendar quarter of 2009 marked the sixth consecutive quarterly decline for the U.S. equity market, as measured by the S&P 500 Index. This was only the second time in the history of the S&P 500 that this has occurred. The market has never endured a string of seven consecutive quarterly declines, so while there are no guarantees, history and probabilities would argue we may be due for a positive quarter. We see a glimmer of light in the market’s strong rally off of its recent low on March 9, 2009 (at which point the S&P 500 was down almost 25% year-to-date). The Wall Street Journal noted the 21% increase in the Dow Jones Industrial Average (DJIA) over the next 13 trading days (to March 26) was the fastest 20% rebound from a bear market low since 1938. The abrupt reversal seemed to be fueled by extreme pessimism combined with some positive fundamental news. Noteworthy positives were 1) Citigroup, Bank of America and JP Morgan indicated they were actually profitable in January and February, 2) the Federal Reserve announced its plan (March 18) to pump more than $1 trillion into the economy by purchasing $300 billion in “longer-term” U.S. Treasury securities and an additional $700 billion plus in Fannie Mae and Freddie Mac guaranteed mortgage-backed securities and other debt and 3) Treasury Secretary Geithner finally announced (March 23) the long-awaited details of the Administration’s $1 trillion plan to help banks rid themselves of problem loans and securities (Public-Private Investment Program (PPIP)).
Nobody can say for sure if March 9, 2009 low will ultimately mark the low of this excruciating bear market. We can say the “conventional wisdom” is that the recent strength is simply a short-term, short-covering bounce from an extremely oversold condition (i.e. the glimmer of light is actually an oncoming freight train, not the start of a new bull market). Given the number of failed rallies and the still dismal tone of the economic news, this skepticism is neither unexpected nor unwarranted. Hence, we expect the market to continue to have significant headline risk as many investors will have a “hair trigger” on the sell side. With huge amounts of cash sitting in money markets earning essentially 0%, it will be interesting to see what happens if the rate of economic deterioration starts to slow and/or the rally proves to have more staying power than currently expected. As investment legend John Templeton said, “Bull markets are born on pessimism, grow on skepticism, mature on optimism and die on euphoria.”
The S&P 500’s rally off of the 2008 low (November 20, 2008) proved to be short-lived, as a decline that began in early January turned into a full-fledged, globally synchronized rout a month later. Markets and economies around the globe were caught in a vicious “negative feedback loop” as weakness begat more weakness and fear spread like wildfire. This negative feedback loop accelerated as the S&P 500 fell towards and eventually breached that November 20, 2008 low. The market action and headlines might have had you believe that the wisest “investment” was a shotgun, canned goods, gold bullion and a stash of currency. Our response was to try to do a better job protecting the downside while still being positioned to potentially benefit from an eventual
1
KIRR, MARBACH PARTNERS
recovery. We tried to accomplish this by raising a meaningful amount of cash through selling stocks whose intrinsic value was permanently impaired during this crisis. We have also noted that the silver lining to this debacle has been the opportunity to upgrade the quality of the portfolio by adding stocks of what we feel are some truly outstanding businesses that were heretofore always too expensive for us to consider. The net effect of raising cash by selling weaker stocks and opportunistically redeploying into better quality names has had two primary effects. First, our portfolio had a higher than normal cash position as of March 31, 2009, which should provide cushion in what we expect will continue to be an extremely volatile market. Second, and more importantly, we believe our overall portfolio is the highest quality, most attractively valued we’ve ever owned.
We apologize for not recognizing the potential depth, breadth or velocity of the decline. We have learned some painful lessons we believe should help prevent future episodes like this. In abnormal times of massive panic and forced liquidations, fundamental valuation parameters that are useful in determining downside risk in normal times can be ineffective, at best. Indeed, we watched as many of our holdings went from cheap to stupid cheap to unbelievably cheap in a very short period of time. Related to this, “don’t fight the tape” is an old traders’ maxim. We pride ourselves on being fundamental-driven, long-term investors (i.e. versus technical-driven, short-term traders), but should not be so proud as to dismiss potentially useful inputs. “Once in a lifetime” events are both unique and obvious only in hindsight. We can’t know if utilizing technical inputs would have helped us recognize the danger ahead any sooner or if they’ll be helpful identifying the next event. Still, it seems to make sense for us to have more tools in our belt than fewer.
| Periods ending | Value Fund(1) | Russell 3000(2) | S&P 500(3) |
March 31, 2009(4) | Total Return | Index | Index |
| 3-months | -12.65% | -10.80% | -11.01% |
| 6-months | -38.43% | -31.12% | -30.54% |
| One-year | -45.55% | -38.20% | -38.09% |
| Three-years | -20.97% | -13.55% | -13.06% |
| Five-years | -9.11% | -4.59% | -4.76% |
| Ten-years | -0.55% | -2.25% | -3.00% |
| Since Inception | -0.50% | -1.88% | -2.47% |
| (December 31, 1998) |
The Fund’s Annual Operating Expenses were 1.54% according to the Prospectus dated January 28, 2009. Until February 28, 2010, the Adviser has contractually agreed to waive its management fee and/or reimburse the Fund’s other expenses to the extent necessary to ensure that the total annual operating expenses do not exceed 1.45% of its average net assets. Investment performance reflects waivers in effect. In the absence of such waivers, total return would be reduced.
Performance data quoted represents past performance; past performance is no guarantee of future results. The investment return and principal value of an investment will fluctuate so that an investor’s shares, when redeemed, may be worth more or less than their original cost. Current performance of the fund may be lower or higher than the performance quoted. Performance data current to the most recent month-end may be obtained by calling 1-800-870-8039. The fund imposes a 1.00% redemption fee on shares held less than 30 days. Performance data quoted does not reflect the redemption fee. If reflected, total returns would be reduced.
| (1) | The performance data quoted assumes the reinvestment of capital gains and income distributions. The performance does not reflect the deduction of taxes that a shareholder would pay on Fund distributions or the redemption of Fund shares. |
| (2) | The Russell 3000 Index is an unmanaged, capitalization-weighted index generally representative of the overall U.S. stock market. This Index cannot be invested in directly. |
2
KIRR, MARBACH PARTNERS
| (3) | The S&P 500 Index is an unmanaged, capitalization-weighted index generally representative of the U.S. market for large capitalization stocks. This Index cannot be invested in directly. |
| (4) | One-year, three-year, five-year, ten-year and Since Inception returns are Average Annualized Returns. |
Short-to-Intermediate Term Outlook and Strategy
At the risk of over-using Warren Buffett, he noted that Benjamin Graham taught: “Though the stock market functions as a voting machine in the short run, it acts as a weighing machine in the long run.” Buffett said, “Fear and greed play important roles when votes are being cast, but they don’t register on the scale.” Certainly a good amount of the bear market decline can be attributed to investors’ collective votes of “no confidence” in the integrity of the financial markets and banking system, the effectiveness of regulatory oversight and the ability of the government to craft a credible and comprehensive policy response to the crisis. As we stated earlier, although the market has enjoyed a respite from the incessant decline, investors remain extremely nervous and will be quick to react to news, particularly bad news.
It is difficult to manage our portfolio for the long-term in an environment where the market is so intently focused on the short-term. We will continue our efforts to upgrade the overall quality of portfolios by culling weaker names and opportunistically redeploying the proceeds into what we believe are relatively stronger names. We have been monitoring a number of key indicators and factors, some of which have flattened or turned positive. If this “good” list grows, we will feel more comfortable getting more aggressive in putting cash to work.
| • | Reinstatement of the “Uptick Rule,” enforcement of prohibition on “Naked Shorting” and reform of Credit Default Swaps (CDS). We discussed the issue of the “Uptick Rule” and CDS in our January 21, 2009 letter. Briefly, the “Uptick Rule” was implemented in the 1930s to protect investors from “bear raids” that enabled short sellers to set-off cascading, waterfall-type declines in stock prices. This rule was repealed in July 2007, just in time for the biggest bear market since the 1930s. After resisting for many months, regulators have taken steps we believe will lead to reinstatement of this rule. CDS were designed to allow a creditor to purchase insurance against a debtor defaulting. Short-sellers have misused CDS to “paint a picture” of impending doom of a company. We believe CDS purchases should be limited to those with an insurable interest (i.e. creditors of the company). Regarding “Naked Shorting,” by rule short-sellers are required to arrange to borrow shares from a stockholder before selling them. In a “naked” short sale, the seller doesn’t bother with arranging to borrow the shares before selling them. This practice became prevalent as the rule was interpreted to mean a short-seller only needed to have a reasonable belief the shares could be borrowed. The practical impact is these three factors have given market manipulators the tools to act immediately, in concert and with apparent impunity. |
| • | Credit spreads need to tighten and credit availability and activity need to improve. Credit spreads reflect the risk premium that investors demand for purchasing corporate vs. risk-free (as far as interest payments and return of principal at maturity) U.S. Government debt. Preceding the credit crisis, we believed that spreads had narrowed to the point where risk was being priced too cheaply and investors were not being adequately compensated for risk. During the current crisis, spreads exploded to the point where we think risk is being priced very expensively and investors are being overcompensated for risk. While spreads have narrowed somewhat, they have remained stubbornly high. Further narrowing would likely indicate investors have regained their appetite for risk assets. Regarding credit availability, the government has committed huge amounts of funding to get credit flowing through the system again. However, this funding has been slow to lead to new lending. Lenders have been cautious because they are afraid of making new loans that may soon go bad. In addition, lenders have been “encouraged” by |
3
KIRR, MARBACH PARTNERS
| regulators to tighten lending standards. Borrowers have been hesitant to make commitments in an uncertain economy. Increased lending activity should indicate lenders and borrowers are comfortable making commitments that go beyond tomorrow. |
| • | Housing needs to stabilize. The continuing rapid decline in house prices is fodder for newspaper headlines. However, house prices historically have been a lagging indicator and unlikely to show any strength until well after the housing market has turned. We are encouraged that sales of new and existing homes have ticked up and the inventory of new houses for sale has ticked down. Housing starts have ticked up and mortgage refinance activity has surged in the wake of the Fed’s aggressive policy moves to lower interest rates. Housing got us into this mess and stabilization should start us on the path out of it. |
Long-Term Outlook and Strategy
We believe our portfolio is well positioned for long-term performance, while at the same time having a cushion of cash to help protect the downside in a market that will likely continue to have significant short-term risk. The Leuthold Group calculated the 10-year compound and total loss for the S&P 500 as of 12/31/08 was -1.38% and -13.00%, respectively. By definition, these 10-year figures were even worse at the recent low on 3/9/09, as headlines screamed that U.S. market indices were back to levels last seen in 1997. The important investment lesson from Leuthold’s study of various 10-year periods is that weak 10-year periods have historically always been followed by strong 10-year periods. As you can see in the table below, when 10-year compound returns fell to 1% or less, the following 10-year period had average compound and cumulative returns of 10.7% and 182.7%, respectively. Out of the 15 observations, the worst 10-year recovery was 7.21% and 100.63%, respectively and the best recovery was 15.58% and 325.30%. We’ve learned that historical guideposts don’t protect you in abnormal times, but we still find this compelling.
S&P 500 Index Annual Compound Returns (ACR)—
10-Year Periods Following Poor 10-Year Periods
| Annual | |||||||||||||||||||||||
| 10 Year | Compound | Total | |||||||||||||||||||||
| Past Ten Years | ACR | Next Ten Years | Return | Return | |||||||||||||||||||
| Q2 | 1929 | to | Q2 | 1939 | -3.65 | Q2 | 1939 | to | Q2 | 1949 | 8.62 | 128.54 | |||||||||||
| Q1 | 1929 | to | Q1 | 1939 | -2.79 | Q1 | 1939 | to | Q1 | 1949 | 9.12 | 139.36 | |||||||||||
| Q3 | 1929 | to | Q3 | 1939 | -2.74 | Q3 | 1939 | to | Q3 | 1949 | 7.74 | 110.79 | |||||||||||
| Q1 | 1928 | to | Q1 | 1938 | -2.54 | Q1 | 1938 | to | Q1 | 1948 | 11.76 | 203.87 | |||||||||||
| Q1 | 1930 | to | Q1 | 1940 | -1.42 | Q1 | 1940 | to | Q1 | 1950 | 9.65 | 151.31 | |||||||||||
| Q2 | 1930 | to | Q2 | 1940 | -1.42 | Q2 | 1940 | to | Q2 | 1950 | 12.19 | 215.88 | |||||||||||
| Q4 | 1928 | to | Q4 | 1938 | -0.65 | Q4 | 1938 | to | Q4 | 1948 | 7.21 | 100.63 | « | WORST | |||||||||
| Q3 | 1928 | to | Q3 | 1938 | -0.10 | Q3 | 1938 | to | Q3 | 1948 | 8.12 | 118.31 | |||||||||||
| Q3 | 1930 | to | Q3 | 1940 | 0.18 | Q3 | 1940 | to | Q3 | 1950 | 12.57 | 226.85 | |||||||||||
| Q4 | 1927 | to | Q4 | 1937 | 0.20 | Q4 | 1937 | to | Q4 | 1947 | 9.61 | 150.39 | |||||||||||
| Q4 | 1929 | to | Q4 | 1939 | 0.23 | Q4 | 1939 | to | Q4 | 1949 | 9.09 | 138.67 | |||||||||||
| Q2 | 1928 | to | Q2 | 1938 | 0.44 | Q2 | 1938 | to | Q2 | 1948 | 9.52 | 148.39 | |||||||||||
| Q3 | 1964 | to | Q3 | 1974 | 0.49 | Q3 | 1974 | to | Q3 | 1984 | 15.58 | 325.30 | « | BEST | |||||||||
| Q1 | 1931 | to | Q1 | 1941 | 0.71 | Q1 | 1941 | to | Q1 | 1951 | 14.47 | 286.14 | |||||||||||
| Q4 | 1964 | to | Q4 | 1974 | 1.24 | Q4 | 1974 | to | Q4 | 1984 | 14.76 | 296.23 | |||||||||||
| Average | 10.67 | 182.71 | |||||||||||||||||||||
Source: The Leuthold Group 2009
Performance data quoted represents past performance; past performance is no guarantee of future results.
4
KIRR, MARBACH PARTNERS
Summary
We regret we didn’t do a better job navigating through this uncharted territory. Still, the U.S. economy and financial markets have endured many other difficult periods. In closing, we want to assure you that we are working our hardest each and every day to try to regain your capital, trust and confidence.
Regards,
 |  |
| Mark D. Foster, CFA | Mickey Kim, CFA |
| President | Vice-President, Treasurer and Secretary |
Value Fund invests in foreign securities, which involves greater volatility and political, economic and currency risks and differences in accounting methods. Value Fund may also invest in small- and medium-capitalization companies, which tend to have more limited liquidity and greater price volatility than large-capitalization companies.
Please refer to the Schedule of Investments for complete fund holdings information.
Value Fund’s holdings are subject to change and are not a recommendation to buy or sell any security. References to other investment vehicles should not be interpreted as on offer of these securities.
The information provided herein represents the opinion of Value Fund’s investment adviser and is not intended to be a forecast of future events, a guarantee of future results, nor investment advice.
This material must be preceded or accompanied by a current Prospectus. Value Fund’s investment objectives, risks, charges and expenses must be considered carefully before you invest or send money.
Quasar Distributors, LLC is the Distributor for Value Fund. (5/09)
The Dow Jones Industrial Average is an unmanaged index of common stocks comprised of thirty major industrial companies. You cannot invest directly in an index.
For further information about Value Fund and/or an account application, please call Matt Kirr at Value Fund at (812) 376-9444 or (800) 808-9444 or write to Value Fund at 621 Washington Street, Columbus, IN 47202-1729.
5
KIRR, MARBACH PARTNERS
Expense Example – March 31, 2009
As a shareholder of the Fund, you incur two types of costs: (1) transaction costs, including sales charges (loads) on purchase payments, reinvested dividends, or other distributions; redemption fees; and exchange fees; and (2) ongoing costs, including management fees; distribution and/or service fees; and other Fund expenses. This Example is intended to help you understand your ongoing costs (in dollars) of investing in the Fund and to compare these costs with the ongoing costs of investing in other mutual funds. The Example is based on an investment of $1,000 invested at the beginning of the period and held for the entire period (October 1, 2008 – March 31, 2009).
Actual Expenses
The first line of the table below provides information about actual account values and actual expenses. Although the Fund charges no sales load or transaction fees, you will be assessed fees for outgoing wire transfers, returned checks and stop payment orders at prevailing rates charged by U.S. Bancorp Fund Services, LLC, the Fund’s transfer agent. If you request that a redemption be made by wire transfer, currently a $15.00 fee is charged by the Fund’s transfer agent. You will be charged a transaction fee equal to 1.00% of the net amount of the redemption if you redeem your shares within 30 days of purchase. IRA accounts will be charged a $15.00 annual maintenance fee. To the extent the Fund invests in shares of other investment companies as part of its investment strategy, you will indirectly bear your proportionate share of any fees and expenses charged by the underlying funds in which the Fund invests in addition to the expenses of the Fund. Actual expenses of the underlying funds are expected to vary among the various underlying funds. These expenses are not included in the example below. The example below includes, but is not limited to, management fees, shareholder servicing fees, fund accounting, custody and transfer agent fees. However, the example below does not include portfolio trading commissions and related expenses, interest expense and other extraordinary expenses as determined under generally accepted accounting principles. You may use the information in this line, together with the amount you invested, to estimate the expenses that you paid over the period. Simply divide your account value by $1,000 (for example, an $8,600 account value divided by $1,000 = 8.6), then multiply the result by the number in the first line under the heading entitled “Expenses Paid During Period” to estimate the expenses you paid on your account during this period.
Hypothetical Example for Comparison Purposes
The second line of the table below provides information about hypothetical account values and hypothetical expenses based on the Fund’s actual expense ratio and an assumed rate of return of 5% per year before expenses, which is not the Fund’s actual return. The hypothetical account values and expenses may not be used to estimate the actual ending account balance or expenses you paid for the period. You may use this information to compare the ongoing costs of investing in the Fund and other funds. To do so, compare this 5% hypothetical example with the 5% hypothetical examples that appear in the shareholder reports of the other funds.
Please note that the expenses shown in the table are meant to highlight your ongoing costs only and do not reflect any transactional costs, such as sales charges (loads), redemption fees, or exchange fees. Therefore, the second line of the table is useful in comparing ongoing costs only, and will not help you determine the relative total costs of owning different funds. In addition, if these transactional costs were included, your costs would have been higher.
| Beginning | Ending | Expenses Paid | |
| Account Value | Account Value | During Period | |
| 10/1/08 | 3/31/09 | 10/1/08 – 3/31/09(1) | |
| Actual | $1,000.00 | $ 615.70 | $5.84 |
| Hypothetical (5% return before expenses) | 1,000.00 | 1,017.70 | 7.29 |
| (1) | Expenses are equal to the Fund’s annualized expense ratio after expense reimbursement of 1.45%, multiplied by the average account value over the period, multiplied by 182/365 to reflect the one-half year period. The annualized expense ratio prior to expense reimbursement was 2.00%. |
6
KIRR, MARBACH PARTNERS
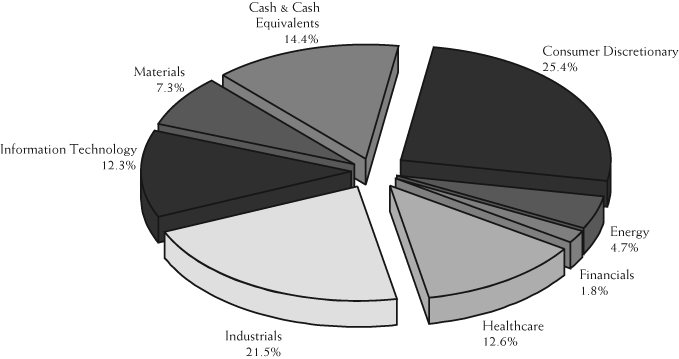
Allocation of Portfolio Net Assets
March 31, 2009 (Unaudited)
Top Ten Equity Holdings
as of March 31, 2009 (% of net assets)
| Lubrizol Corp. | 4.3% |
| AutoZone, Inc. | 4.2% |
| Ascent Media Corp. - Class A | 4.2% |
| Intel Corp. | 4.1% |
| Alcon, Inc. | 3.8% |
| Microsoft Corp. | 3.7% |
| Dollar Tree, Inc. | 3.7% |
| Toll Brothers, Inc. | 3.3% |
| McGraw-Hill Companies, Inc. | 3.3% |
| Chevron Corp. | 3.3% |
7
KIRR, MARBACH PARTNERS
Schedule of Investments
March 31, 2009 (Unaudited)
| Number | |||||||
| of Shares | Value | ||||||
| COMMON STOCKS - 85.6% | |||||||
| Consumer Discretionary - 25.4% | |||||||
| 29,550 | Ascent Media Corp. - Class A* | $ | 738,750 | ||||
| 4,564 | AutoZone, Inc.* | 742,198 | |||||
| 26,866 | Coach, Inc.* | 448,662 | |||||
| 14,491 | Dollar Tree, Inc.* | 645,574 | |||||
| 48,971 | HSN, Inc.* | 251,711 | |||||
| 25,385 | McGraw-Hill Companies, Inc. | 580,555 | |||||
| 10,350 | Time Warner Cable, Inc. - Class A | 256,680 | |||||
| 32,105 | Toll Brothers, Inc.* | 583,027 | |||||
| 16,600 | WABCO Holdings, Inc. | 204,346 | |||||
| 4,451,503 | |||||||
| Energy - 4.7% | |||||||
| 8,488 | Chevron Corp. | 570,733 | |||||
| 51,902 | Rosetta Resources, Inc.* | 256,915 | |||||
| 827,648 | |||||||
| Financials - 1.8% | |||||||
| 48,048 | Janus Capital Group, Inc. | 319,519 | |||||
| Healthcare - 12.6% | |||||||
| 7,247 | Alcon, Inc. | 658,825 | |||||
| 17,512 | Analogic Corp. | 560,734 | |||||
| 14,663 | Covidien Ltd. | 487,398 | |||||
| 13,512 | WellPoint, Inc.* | 513,051 | |||||
| 2,220,008 | |||||||
| Industrials - 21.5% | |||||||
| 21,151 | Atlas Air Worldwide | ||||||
| Holdings, Inc.* | 366,970 | ||||||
| 12,707 | Canadian Pacific Railway Ltd. - f | 376,508 | |||||
| 33,176 | EMCOR Group, Inc.* | 569,632 | |||||
| 9,702 | FedEx Corp. | 431,642 | |||||
| 49,900 | John Bean Technologies Corp. | 521,954 | |||||
| 33,119 | KBR, Inc. | 457,373 | |||||
| 15,911 | Portfolio Recovery Associates, Inc.* | 427,051 | |||||
| 41,648 | Titan International, Inc. | 209,490 | |||||
| 21,135 | Tyco International Ltd. - f | 413,401 | |||||
| 3,774,021 | |||||||
| Information Technology - 12.3% | |||||||
| 23,443 | Cognizant Technology | ||||||
| Solutions Corp. - Class A* | 487,380 | ||||||
| 10,460 | Harris Corp. | 302,712 | |||||
| 47,516 | Intel Corp. | 715,116 | |||||
| 35,315 | Microsoft Corp. | 648,737 | |||||
| 2,153,945 | |||||||
| Materials - 7.3% | |||||||
| 22,411 | Lubrizol Corp. | 762,198 | |||||
| 10,419 | Nucor Corp. | 397,693 | |||||
| 66,600 | Solutia, Inc.* | 124,542 | |||||
| 1,284,433 | |||||||
| TOTAL COMMON STOCKS | |||||||
| (Cost $20,607,837) | 15,031,077 | ||||||
| Principal | |||||||
| Amount | |||||||
| SHORT TERM INVESTMENT - 0.3% | |||||||
| Variable Rate Demand Note** - 0.3% | |||||||
| $ | 50,000 | American Family, 0.10% | 50,000 | ||||
| TOTAL SHORT TERM | |||||||
| INVESTMENT | |||||||
| (Cost $50,000) | 50,000 | ||||||
| Total Investments | |||||||
| (Cost $20,657,837) - 85.9% | 15,081,077 | ||||||
| Other Assets and | |||||||
| Liabilities, Net - 14.1% | 2,469,713 | ||||||
| TOTAL NET ASSETS - 100.0% | $ | 17,550,790 | |||||
| * | - Non-income producing security. |
| ** | - Variable rate security as of March 31, 2009. |
| f | - Foreign security. |
See Notes to the Financial Statements
8
KIRR, MARBACH PARTNERS
Statement of Assets and Liabilities
March 31, 2009
(Unaudited)
| ASSETS: | ||||
| Investments, at current value | ||||
| (cost $20,657,837) | $ | 15,081,077 | ||
| Cash | 2,495,043 | |||
| Prepaid expenses | 11,510 | |||
| Dividends receivable | 11,044 | |||
| Receivable for Fund shares sold | 5,480 | |||
| Interest receivable | 8 | |||
| Total Assets | 17,604,162 | |||
| LIABILITIES: | ||||
| Payable for securities purchased | 33,919 | |||
| Accrued expenses | 17,706 | |||
| Payable to Adviser | 1,747 | |||
| Total Liabilities | 53,372 | |||
| NET ASSETS | $ | 17,550,790 | ||
| NET ASSETS CONSIST OF: | ||||
| Capital stock | $ | 35,424,584 | ||
| Undistributed net investment income | 325,439 | |||
| Undistributed net realized loss on investments | (12,622,423 | ) | ||
| Net unrealized depreciation on investments | (5,576,810 | ) | ||
| Total Net Assets | $ | 17,550,790 | ||
| Shares outstanding (500,000,000 shares | ||||
| of $0.01 par value authorized) | 2,702,203 | |||
| Net asset value, redemption price | ||||
| and offering price per share | $ | 6.49 | ||
Statement of Operations
Six Months Ended March 31, 2009
(Unaudited)
| INVESTMENT INCOME: | ||||
| Dividend income | ||||
| (net of withholding of $821) | $ | 490,726 | ||
| Interest income | 872 | |||
| Total Investment Income | 491,598 | |||
| EXPENSES: | ||||
| Investment Adviser fees | 114,529 | |||
| Legal fees | 27,615 | |||
| Administration fees | 17,753 | |||
| Shareholder servicing fees | 17,560 | |||
| Fund accounting fees | 11,869 | |||
| Audit fees | 9,236 | |||
| Distribution fees | 8,586 | |||
| Custody fees | 7,322 | |||
| Directors fees | 6,006 | |||
| Federal and state registration fees | 5,709 | |||
| Other | 3,177 | |||
| Total expenses before reimbursement | 229,362 | |||
| Less: Reimbursement from Investment Adviser | (63,295 | ) | ||
| Net Expenses | 166,067 | |||
| NET INVESTMENT INCOME | 325,531 | |||
| REALIZED AND UNREALIZED | ||||
| LOSS ON INVESTMENTS: | ||||
| Net realized loss on investments | (8,604,536 | ) | ||
| Change in unrealized appreciation/ | ||||
| depreciation on investments | (5,796,572 | ) | ||
| Net realized and unrealized | ||||
| loss on investments | (14,401,108 | ) | ||
| NET DECREASE IN NET ASSETS | ||||
| RESULTING FROM OPERATIONS | $ | (14,075,577 | ) | |
See Notes to the Financial Statements
9
KIRR, MARBACH PARTNERS
Statement of Changes in Net Assets
| Six Months Ended | ||||||||
| March 31, 2009 | Year Ended | |||||||
| (UNAUDITED) | September 30, 2008 | |||||||
| OPERATIONS: | ||||||||
| Net investment income (loss) | $ | 325,531 | $ | (127,455 | ) | |||
| Net realized loss on investments | (8,604,536 | ) | (4,032,383 | ) | ||||
| Change in unrealized appreciation/depreciation on investments | (5,796,572 | ) | (10,497,582 | ) | ||||
| Net decrease in net assets resulting from operations | (14,075,577 | ) | (14,657,420 | ) | ||||
| CAPITAL SHARE TRANSACTIONS: | ||||||||
| Proceeds from shares sold | 508,912 | 2,536,156 | ||||||
| Shares issued to holders in reinvestment of dividends | — | 5,441,577 | ||||||
| Cost of shares redeemed | (5,131,205 | ) | (4,209,278 | ) | ||||
| Net increase (decrease) in net assets from capital share transactions | (4,622,293 | ) | 3,768,455 | |||||
| DISTRIBUTIONS TO SHAREHOLDERS: | ||||||||
| From net investment income | — | — | ||||||
| From net realized gains | — | (5,668,875 | ) | |||||
| Total distributions to shareholders | — | (5,668,875 | ) | |||||
| TOTAL DECREASE IN NET ASSETS | (18,697,870 | ) | (16,557,840 | ) | ||||
| NET ASSETS: | ||||||||
| Beginning of period | 36,248,660 | 52,806,500 | ||||||
| End of period (including undistributed net investment | ||||||||
| income (loss) of $325,439 and $(92), respectively) | $ | 17,550,790 | $ | 36,248,660 | ||||
| CHANGES IN SHARES OUTSTANDING: | ||||||||
| Shares sold | 73,502 | 196,146 | ||||||
| Shares issued to holders in reinvestment of dividends | — | 396,616 | ||||||
| Shares redeemed | (810,054 | ) | (322,836 | ) | ||||
| Net increase (decrease) | (736,552 | ) | 269,926 | |||||
See Notes to the Financial Statements
10
KIRR, MARBACH PARTNERS
Financial Highlights
For a Fund share outstanding throughout the period.
| Six Months Ended | ||||||||||||||||||||||||
| March 31, 2009 | Year Ended September 30, | |||||||||||||||||||||||
| (UNAUDITED) | 2008 | 2007 | 2006 | 2005 | 2004 | |||||||||||||||||||
| PER SHARE DATA: | ||||||||||||||||||||||||
| Net asset value, beginning of period | $ | 10.54 | $ | 16.66 | $ | 15.56 | $ | 14.98 | $ | 14.16 | $ | 12.50 | ||||||||||||
| Investment operations: | ||||||||||||||||||||||||
| Net investment income (loss) | 0.12 | (0.04 | ) | (0.03 | ) | — | 0.11 | 0.08 | ||||||||||||||||
| Net realized and unrealized | ||||||||||||||||||||||||
| gain (loss) on investments | (4.17 | ) | (4.27 | ) | 1.74 | 1.38 | 2.28 | 1.58 | ||||||||||||||||
| Total from investment operations | (4.05 | ) | (4.31 | ) | 1.71 | 1.38 | 2.39 | 1.66 | ||||||||||||||||
| Less distributions: | ||||||||||||||||||||||||
| Dividends from net investment income | — | — | — | (0.05 | ) | (0.08 | ) | — | ||||||||||||||||
| Distributions from net capital gains | — | (1.81 | ) | (0.61 | ) | (0.75 | ) | (1.49 | ) | — | ||||||||||||||
| Total distributions | — | (1.81 | ) | (0.61 | ) | (0.80 | ) | (1.57 | ) | — | ||||||||||||||
| Net asset value, end of period | $ | 6.49 | $ | 10.54 | $ | 16.66 | $ | 15.56 | $ | 14.98 | $ | 14.16 | ||||||||||||
| TOTAL RETURN | (38.43 | )% | (28.39 | )% | 11.14 | % | 9.59 | % | 17.64 | % | 13.28 | % | ||||||||||||
| SUPPLEMENTAL DATA AND RATIOS: | ||||||||||||||||||||||||
| Net assets, end of period (in millions) | $ | 17.6 | $ | 36.2 | $ | 52.8 | $ | 46.5 | $ | 44.5 | $ | 40.8 | ||||||||||||
| Ratio of expenses to average net assets: | ||||||||||||||||||||||||
| Before expense reimbursement | 2.00 | % | 1.54 | % | 1.51 | % | 1.59 | % | 1.60 | % | 1.67 | % | ||||||||||||
| After expense reimbursement | 1.45 | % | 1.45 | % | 1.45 | % | 1.45 | % | 1.45 | % | 1.45 | % | ||||||||||||
| Ratio of net investment income (loss) | ||||||||||||||||||||||||
| to average net assets: | ||||||||||||||||||||||||
| Before expense reimbursement | 2.29 | % | (0.37 | )% | (0.24 | )% | (0.13 | )% | 0.59 | % | 0.39 | % | ||||||||||||
| After expense reimbursement | 2.84 | % | (0.28 | )% | (0.18 | )% | 0.01 | % | 0.74 | % | 0.61 | % | ||||||||||||
| Portfolio turnover rate | 26 | % | 34 | % | 32 | % | 38 | % | 33 | % | 41 | % | ||||||||||||
See Notes to the Financial Statements
11
KIRR, MARBACH PARTNERS
Notes to the Financial Statements
March 31, 2009 (Unaudited)
1. ORGANIZATION AND SIGNIFICANT ACCOUNTING POLICIES
Kirr, Marbach Partners Funds, Inc. (the “Corporation”) was organized as a Maryland corporation on September 23, 1998 and is registered under the Investment Company Act of 1940, as amended (the “1940 Act”), as an open-end diversified management investment company issuing its shares in series, each series representing a distinct portfolio with its own investment objective and policies. The one series presently authorized is the Kirr, Marbach Partners Value Fund (the “Fund”). The investment objective of the Fund is to seek long-term capital growth. The Fund commenced operations on December 31, 1998.
The following is a summary of significant accounting policies consistently followed by the Fund.
| a) | Investment Valuation - Securities listed on the Nasdaq National Market are valued at the Nasdaq Official Closing Price (“NOCP”). Other securities traded on a national securities exchange (including options on indices so traded) are valued at the last sales price on the exchange where the security is primarily traded. Exchange-traded securities for which there were no transactions and Nasdaq-traded securities for which there is no NOCP are valued at the mean of the bid and asked prices. Securities for which market quotations are not readily available are valued at fair value as determined in good faith under the supervision of the Board of Directors of the Corporation. Foreign securities have been issued by foreign private issuers registered on United States exchanges in accordance with Section 12 of the Securities Exchange Act of 1934. Debt securities maturing in 60 days or less valued at amortized cost, which approximates fair value. Debt securities having maturities over 60 days or for which amortized cost is not deemed to reflect fair value may be priced by independent pricing services that use prices provided by market makers or estimates of market values obtained from yield data relating to instruments or securities with similar characteristics. |
| The Fund adopted the provisions of Statement of Financial Accounting Standards No. 157, “Fair Value Measurements” (“FAS 157”), on October 1, 2008. FAS 157 requires the Fund to classify its securities based on valuation method, using the following levels: |
| Level 1 - Quoted prices in active markets for identical securities. |
| Level 2 - Other significant observable inputs (including quoted prices for similar securities, interest rates, prepayment speeds, credit risk, etc.). |
| Level 3 - Significant unobservable inputs (including the Fund’s own assumptions in determining the fair value of investments). |
| The inputs or methodology used for valuing securities are not an indication of the risk associated with investing in those securities. The following is a summary of the inputs used to value the Fund’s investments as of March 31, 2009: |
| Other | |||||||||
| Investments | Financial | ||||||||
| Description | in Securities | Instruments* | |||||||
| Level 1 | $ | 15,031,077 | $ | — | |||||
| Level 2 | 50,000 | — | |||||||
| Level 3 | — | — | |||||||
| Total | $ | 15,081,077 | $ | — | |||||
| * | Other financial instruments are derivative instruments not reflected in the Portfolio of Investments, such as futures, forwards and swap contracts, which are valued at the unrealized appreciation (depreciation) on the instrument (none held as of March 31, 2009). |
12
KIRR, MARBACH PARTNERS
Notes to the Financial Statements (Continued)
March 31, 2009 (Unaudited)
| b) | Federal Income Taxes - A provision, for federal income taxes or excise taxes, has not been made since the Fund has elected to be taxed as a “regulated investment company” and intends to distribute substantially all taxable income to its shareholders and otherwise comply with the provisions of the Internal Revenue Code applicable to regulated investment companies. The Fund recognizes uncertain tax positions consistent with FASB Interpretation No. 48, “Accounting for Uncertainty in Income Taxes” (“FIN 48”). FIN 48 requires the Fund to analyze all open tax years as defined by the relevant Statute of Limitations for all major jurisdictions. Open tax years are those that are open for exam by authorities. The major tax authority for the Fund is the Internal Revenue Service. At September 30, 2008, three previous tax years are open: September 30, 2005 – September 30, 2007. The Fund has no examinations in progress. The Fund reviewed the year ended September 30, 2008 and concluded the adoption of FIN 48 resulted in no effect on the Fund’s financial position or results of operations. There is no tax liability resulting from unrecognized tax benefits relating to uncertain income tax positions taken or expected to be taken on the tax return for the fiscal year ended September 30, 2008. The Fund is not aware of any tax positions for which it is reasonably possible that the total amounts of unrecognized tax benefits will significantly change in the next twelve months. |
| c) | Income and Expense - The Fund is charged for those expenses that are directly attributable to the Fund, such as advisory, administration and certain shareholder service fees. |
| d) | Distributions to Shareholders - Dividends from net investment income and distributions of net realized capital gains, if any, will be declared and paid at least annually. The character of distributions made during the period from net investment income or net realized gains may differ from the characterization for federal income tax purposes due to differences in the recognition of income, expense and gain items for financial statement and tax purposes. All short-term capital gains are included in ordinary income for tax purposes. |
| e) | Use of Estimates - The preparation of financial statements in conformity with accounting principles generally accepted in the United States requires management to make estimates and assumptions that affect the reported amounts of assets and liabilities and disclosure of contingent assets and liabilities at the date of the financial statements and the reported amounts of revenues and expenses during the reporting period. Actual results could differ from those estimates. |
| f) | Repurchase Agreements - The Fund may enter into repurchase agreements with certain banks or non-bank dealers. The Adviser will monitor, on an ongoing basis, the value of the underlying securities to ensure that the value always equals or exceeds the repurchase price plus accrued interest. |
| g) | Other - Investment and shareholder transactions are recorded on the trade date. The Fund determines the gain or loss realized from the investment transactions by comparing the original cost of the security lot sold with the net sales proceeds. Dividend income is recognized on the ex-dividend date or as soon as information is available to the Fund and interest income is recognized on an accrual basis. Accounting principles generally accepted in the United States require that permanent financial reporting and tax differences be reclassified to capital stock. |
13
KIRR, MARBACH PARTNERS
Notes to the Financial Statements (Continued)
March 31, 2009 (Unaudited)
2. INVESTMENT TRANSACTIONS
The aggregate purchases and sales of securities, excluding short-term investments, by the Fund for the six months ended March 31, 2009, were as follows:
| Purchases | Sales | |||||||
| U.S. Government | $ | — | $ | — | ||||
| Other | $ | 5,863,086 | $ | 11,747,056 | ||||
At September 30, 2008, the components of accumulated earnings (losses) on a tax basis were as follows:
| Cost of investments | $ | 35,138,297 | ||
| Gross unrealized appreciation | 4,861,992 | |||
| Gross unrealized depreciation | (4,642,230 | ) | ||
| Net unrealized appreciation | $ | 219,762 | ||
| Undistributed ordinary income | $ | — | ||
| Undistributed long-term capital gain | — | |||
| Total distributable earnings | $ | — | ||
| Other accumulated gains/losses | $ | (4,017,979 | ) | |
| Total accumulated earnings (losses) | $ | (3,798,217 | ) |
At September 30, 2008, the Fund had accumulated net realized capital loss carryforwards of $1,057,713 which expire September 30, 2016. The fund had post-October losses deferred at September 30, 2008, on a tax basis, of $2,960,266.
The tax character of distributions paid during the six months ended March 31, 2009 and the year ended September 30, 2008 were as follows:
| 2009 | 2008 | |||||||
| Ordinary income | $ | — | $ | — | ||||
| Long-term capital gain | $ | — | $ | 5,668,875 | ||||
3. AGREEMENTS
The Fund has entered into an Investment Advisory Agreement with Kirr, Marbach & Company, LLC (the “Investment Adviser”). Pursuant to its advisory agreement with the Fund, the Investment Adviser is entitled to receive a fee, calculated daily and payable monthly, at the annual rate of 1.00% as applied to the Fund's daily net assets.
The Investment Adviser has contractually agreed to waive its management fee and/or reimburse the Fund’s other expenses to the extent necessary to ensure that the Fund’s total annual operating expenses do not exceed 1.45% of its average daily net assets until February 28, 2010. Accordingly, for the six months ended March 31, 2009, the Investment Adviser waived advisory fees to reimburse the Fund for other expenses in the amount of $63,295. The Investment Adviser may decide to continue the agreement, or revise the total annual operating expense limitations after February 28, 2010. Any waiver or reimbursement is subject to later adjustment to allow the Investment Adviser to recoup amounts waived or reimbursed to the extent actual fees and expenses for a period are less than the expense limitation cap of 1.45%, provided, however, that the Investment Adviser shall only be entitled to recoup such amounts for a period of three years from the date such amount was waived or reimbursed. Waived/reimbursed fees and expenses subject to potential recovery by year of expiration are as follows:
| Year of expiration | Amount |
| 9/30/2009 | $65,080 |
| 9/30/2010 | $29,885 |
| 9/30/2011 | $41,532 |
| 9/30/2012 | $63,295 |
14
KIRR, MARBACH PARTNERS
Notes to the Financial Statements (Continued)
March 31, 2009 (Unaudited)
As of March 31, 2009, it was possible, but not probable, those amounts would be recovered by the Investment Adviser. At the end of each fiscal year in the future, the Fund will continue to assess the potential recovery of waived/reimbursed fees and expenses for financial reporting purposes.
Quasar Distributors, LLC, (the “Distributor”) serves as principal underwriter of the shares of the Fund pursuant to a Distribution Agreement between the Distributor and the Corporation. The Fund's shares are sold on a no-load basis and, therefore, the Distributor receives no sales commission or sales load for providing services to the Fund. The Corporation has adopted a plan pursuant to Rule 12b-1 under the 1940 Act (the “12b-1 Plan”), which authorizes the Corporation to pay the Distributor and certain financial intermediaries who assist in distributing the Fund shares or who provided shareholder services to Fund shareholders a distribution and shareholder servicing fee of up to 0.25% of the Fund’s average daily net assets (computed on an annual basis). All or a portion of the fee may be used by the Fund or the Distributor to pay its distribution fee and costs of printing reports and prospectuses for potential investors and the costs of other distribution and shareholder servicing expenses. During the six months ended March 31, 2009, the Fund incurred expenses of $8,586 pursuant to the 12b-1 Plan.
U.S. Bancorp Fund Services, LLC serves as transfer agent, administrator and accounting services agent for the Fund. U.S. Bank, N.A. serves as custodian for the Fund.
The Fund imposes a 1% redemption fee on shares held 30 days or less. For the six-month period ended March 31, 2009 and the year ended September 30, 2008, the Fund collected $239 and $24, respectfully, in redemption fees.
4. NEW ACCOUNTING PRONOUNCEMENTS
In March 2008, FASB issued Statement on Financial Accounting Standards No. 161, “Disclosures about Derivative Instruments and Hedging Activities – an amendment of FASB Statement No. 133” (“FAS 161”). FAS 161 requires enhanced disclosures about funds’ derivative and hedging activities. Funds are required to provide enhanced disclosures about (a) how and why the fund uses derivative instruments, (b) how derivative instruments are accounted for under FAS 133 and its related interpretations, and (c) how derivative instruments affect the fund’s financial position and financial performance. FAS 161 is effective for financial statements issued for fiscal years beginning after November 15, 2008 and interim periods within those fiscal years. The fund does not expect FAS 161 to have a material impact on its financial statements; however, additional disclosures may be required.
15
KIRR, MARBACH PARTNERS
Additional Information
March 31, 2009 (Unaudited)
BOARD APPROVAL OF INVESTMENT ADVISORY AGREEMENT
On November 14, 2008, at an in-person meeting of the Board of Directors of the Kirr, Marbach Partners Fund, Inc. (the “Corporation”), the Directors, including a majority of the disinterested Directors, approved the continuation of the investment advisory agreement dated June 10, 2005 (the “Advisory Agreement”) between the Corporation and Kirr, Marbach & Company, LLC (the “Adviser”). It was noted that, as described in the Adviser’s memorandum, the Adviser has significant experience providing investment advice and is qualified to provide investment advisory services to the Fund. In addition, it was noted that the Adviser promoted a culture of compliance. It was noted that prior short-term to intermediate-term performance was disappointing relative to the benchmarks (i.e., the S&P 500 and the Russell 3000), but acceptable given the current extraordinary market conditions and turmoil. The directors noted that although the Fund underperformed the benchmarks for the year ending September 30, 2008, the Fund’s long-term performance since inception has been adequate. The directors also noted that a significant percentage of the Fund (approximately 30%) is owned by Adviser insiders and therefore the directors feel that the Adviser’s interests are aligned with other Fund shareholders. The directors considered information relating to the Fund’s fees, costs and expense ratios and compared such fees, costs and expense ratios to competitive industry fee structures and expense ratios. Specifically, the directors reviewed charts prepared by the administrator based on data compiled by a nationally recognized third party comparative data provider. In connection with this, the directors also considered the control of the Fund’s operating expenses through the expense cap agreement, and noted that the current expense cap agreement is favorable in comparison to similar funds as evidenced by the comparative data presented at the meeting. In addition, the Board noted that the Adviser is providing substantially similar investment advisory services to the Fund and its other separate account clients and, with the current expense cap arrangement in place, providing such services to the Fund at substantially similar rates to those charged to the Adviser’s other clients. The directors considered whether the Adviser would receive any fall-out benefits through its relationship with the Fund, and it was noted that because none of the other service providers to the Fund are affiliated with the Adviser, there are no identifiable material fall-out benefits accruing to the Adviser. The directors considered the Adviser’s cost of providing services to the Fund and the profitability of its relationship to the Fund. It was noted that the Adviser’s profitability was in line with its profitability for providing investment advice to its separate account clients given the current expense cap agreement, and the directors noted that the Adviser’s profit in connection with its services to the Fund appeared reasonable. The directors considered whether economies of scale were being realized that could justify reduced expenses for the Fund. It was noted that current asset levels had fallen from prior years and therefore the Fund had not realized any economies of scale. During the deliberations, the disinterested directors did not identify any single consideration or particular piece of information that was all important or controlling in determining whether to approve the Advisory Agreement. The disinterested directors evaluated all information presented to them and determined that the compensation paid to the Adviser under the Advisory Agreement was fair and reasonable in light of the services to be performed.
16
KIRR, MARBACH PARTNERS
AVAILABILITY OF FUND PORTFOLIO INFORMATION
The Fund files its complete schedule of portfolio holdings with the SEC for the first and third quarters of each fiscal year on Form N-Q, which is available on the SEC’s website at www.sec.gov. The Fund’s Form N-Q may be reviewed and copied at the SEC’s Public Reference Room in Washington D.C. For information on the Public Reference Room call 1-800-SEC-0330. In addition, the Fund will post its complete schedule of portfolio holdings as of the end of its last completed fiscal quarter as part of its quarterly shareholder update on the Fund’s website on or soon after the 21st day after the end of each fiscal quarter.
AVAILABILITY OF PROXY VOTING INFORMATION
Both a description of the Fund’s Proxy Voting Policies and Procedures and information about the Fund’s proxy voting record will be available (1) without charge, upon request, by calling 1-800-870-8039, and (2) on the SEC’s website at www.sec.gov.
17
(This Page Intentionally Left Blank.)
Directors
Mark D. Foster, CFA
Mickey Kim, CFA
Jeffrey N. Brown
Mark E. Chesnut
John F. Dorenbusch
Principal Officers
Mark D. Foster, CFA, President
Mickey Kim, CFA, Vice President, Treasurer and Secretary
Investment Adviser
Kirr, Marbach & Company, LLC
621 Washington Street
Columbus, IN 47201
Distributor
Quasar Distributors, LLC
615 East Michigan Street
Milwaukee, WI 53202
Custodian
U.S. Bank, N.A.
1555 North River Center Drive
Milwaukee, WI 53212
Administrator,
Transfer Agent and
Dividend – Disbursing Agent
U.S. Bancorp Fund Services, LLC
Third Floor
615 E. Michigan Street
Milwaukee, WI 53202
Independent Registered Public Accounting Firm
Tait, Weller & Baker LLP
1818 Market Street, Suite 2400
Philadelphia, PA 19103
Legal Counsel
Kirkland & Ellis LLP
200 E. Randolph Drive
Chicago, IL 60601
This report should be accompanied or preceded by a prospectus.
The Fund’s Statement of Additional Information contains additional information about the Fund’s directors and is available
without charge upon request by calling 1-800-808-9444.
The Fund’s Proxy Voting Policies and Procedures are available without charge upon request by calling 1-800-808-9444. A description of the
Fund’s proxy voting policies and procedures is available on the Fund’s website, www.kmpartnersfunds.com, or on the SEC’s website, at www.sec.gov.
Information regarding how the Fund voted proxies relating to portfolio securities during the twelve months ended June 30, 2008 is available
without charge upon request by calling 1-800-808-9444 or on the SEC’s website, at www.sec.gov.
Semi-Annual Report
March 31, 2009
Item 2. Code of Ethics.
Not applicable for semi-annual reports.
Item 3. Audit Committee Financial Expert.
Not applicable for semi-annual reports.
Item 4. Principal Accountant Fees and Services.
Note applicable for semi-annual reports.
Item 5. Audit Committee of Listed Registrants.
Not applicable for semi-annual reports.
Item 6. Schedule of Investments.
Schedule of Investments is included as part of the report to shareholders filed under Item 1 of this Form.
Item 7. Disclosure of Proxy Voting Policies and Procedures for Closed-End Management Investment Companies.
Not applicable to open-end investment companies.
Item 8. Portfolio Managers of Closed-End Management Investment Companies.
Not applicable to open-end investment companies.
Item 9. Purchases of Equity Securities by Closed-End Management Investment Company and Affiliated Purchases.
Not applicable to open-end investment companies.
Item 10. Submission of Matters to a Vote of Security Holders.
Not Applicable.
Item 11. Controls and Procedures.
| (a) | The Registrant’s President and Treasurer have reviewed the Registrant's disclosure controls and procedures (as defined in Rule 30a-3(c) under the Investment Company Act of 1940 (the “Act”)) as of a date within 90 days of the filing of this report, as required by Rule 30a-3(b) under the Act and Rules 13a-15(b) or 15d-15(b) under the Securities Exchange Act of 1934. Based on their review, such officers have concluded that the disclosure controls and procedures are effective in ensuring that information required to be disclosed in this report is appropriately recorded, processed, summarized and reported and made known to them by others within the Registrant and by the Registrant’s service provider. |
| (b) | There were no significant changes in the Registrant's internal control over financial reporting (as defined in Rule 30a-3(d) under the Act) that occurred during the second fiscal quarter of the period covered by this report that has materially affected, or is reasonably likely to materially affect, the Registrant's internal control over financial reporting. |
Item 12. Exhibits.
| (a) | (1) Any code of ethics or amendment thereto, that is subject of the disclosure required by Item 2, to the extent that the registrant intends to satisfy Item 2 requirements through filing an exhibit. Not applicable for semi-annual reports. |
(2) Certifications pursuant to Section 302 of the Sarbanes-Oxley Act of 2002. Filed herewith.
(3) Any written solicitation to purchase securities under Rule 23c-1 under the Act sent or given during the period covered by the report by or on behalf of the registrant to 10 or more persons. Not applicable to open-end investment companies.
| (b) | Certification pursuant to Section 906 of the Sarbanes-Oxley Act of 2002. Furnished herewith. |
SIGNATURES
Pursuant to the requirements of the Securities Exchange Act of 1934 and the Investment Company Act of 1940, the registrant has duly caused this report to be signed on its behalf by the undersigned, thereunto duly authorized.
(Registrant) Kirr, Marbach Partners Funds, Inc.
By (Signature and Title)* /s/ Mr. Mark Foster
Mr. Mark Foster, President
Date 06/01/09
Pursuant to the requirements of the Securities Exchange Act of 1934 and the Investment Company Act of 1940, this report has been signed below by the following persons on behalf of the registrant and in the capacities and on the dates indicated.
By (Signature and Title)* /s/ Mr. Mark Foster
Mr. Mark Foster, President
Date 06/01/09
By (Signature and Title)* /s/ Mr. Mickey Kim
Mr. Mickey Kim, Treasurer
Date 06/01/09
* Print the name and title of each signing officer under his or her signature.