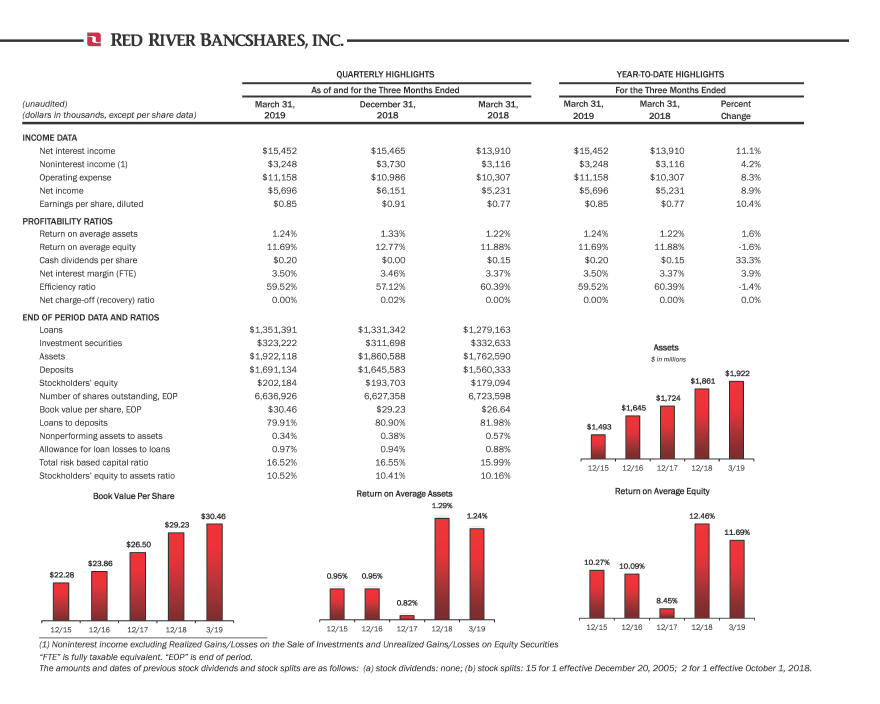
QUARTERLYHIGHLIGHTS YEAR-TO-DATE HIGHLIGHTS (unaudited) (dollars in thousands, except per share data) As of and for the Three Months Ended For the Three Months Ended March 31, 2019December 31, 2018 March 31, 2018 March 31, March 31, Percent 2019 2018 Change INCOME DATA Net interest income $15,452 $15,465 $13,910 $15,452 $13,910 11.1% Noninterest income (1)$3,248 $3,730 $3,116 $3,248 $3,116 4.2% Operating expense $11,158 $10,986 10,307 $11,158 $10,307 8.3% Net income $5,696 $6,151 $5,231 $5,696 $5,231 8.9% Earnings per share, diluted $0.85 $0.91 $0.77 $0.85 $0.77 10.4% PROFITABILITY RATIOS Return on average assets 1.24%1.33%1.22%1.24%1.22%1.6% Return on average equity 11.69%12.77%11.88%11.69%11.88%-1.6% Cash dividends per share $0.20 $0.00 $0.15 $0.20 $0.15 33.3% Net interest margin (FTE) 3.50% 3.46% 3.37%3 .50% 3.37% 3.9% Efficiency ratio 59.52%57.12%60.39%59.52%60.39%-1.4% Netcharge-off (recovery) ratio 0.00%0.02%0.00%0.00%0.00%0.0% END OF PERIOD DATA AND RATIOS Loans $1,351,391 $1,331,342 $1,279,163 Investment securities $323,222 $311,698 $332,633 Assets $1,922,118 $1,860,588 $1,762,590 Deposits $1,691,134 $1,645,583 $1,560,333 Stockholders’ equity $202,184 $193,703 $179,094 Number of shares outstanding, EOP 6,636,9266,627,3586,723,598 Book value per share, EOP $30.46 $29.23 $26.64 Loans to 79.91% 80.90% 81.98% Nonperforming assets to assets 0.34% 0.38% 0.57% Allowance for loan losses to loans 0.97% 0.94% 0.88% Total risk based capital ratio 16.52% 16.55% 15.99% Stockholders’ equity to assets ratio 10.52% 10.41%10.16%