UNITED STATES
SECURITIES AND EXCHANGE COMMISSION
Washington, D.C. 20549
FORM N-CSR
CERTIFIED SHAREHOLDER REPORT OF REGISTERED MANAGEMENT
INVESTMENT COMPANIES
Investment Company Act file number 811-09037
Nuveen Investment Trust III
(Exact name of registrant as specified in charter)
Nuveen Investments
333 West Wacker Drive, Chicago, IL 60606
(Address of principal executive offices) (Zip code)
Mark J. Czarniecki
Vice President and Secretary
333 West Wacker Drive,
Chicago, IL 60606
(Name and address of agent for service)
Registrant’s telephone number, including area code: (312) 917-7700
Date of fiscal year end: September 30
Date of reporting period: September 30, 2021
Form N-CSR is to be used by management investment companies to file reports with the Commission not later than 10 days after the transmission to stockholders of any report that is required to be transmitted to stockholders under Rule 30e-1 under the Investment Company Act of 1940 (17 CFR 270.30e-1). The Commission may use the information provided on Form N-CSR in its regulatory, disclosure review, inspection, and policy making roles.
A registrant is required to disclose the information specified by Form N-CSR, and the Commission will make this information public. A registrant is not required to respond to the collection of information contained in Form N-CSR unless the Form displays a currently valid Office of Management and Budget (“OMB”) control number. Please direct comments concerning the accuracy of the information collection burden estimate and any suggestions for reducing the burden to Secretary, Securities and Exchange Commission, 450 Fifth Street, NW, Washington, DC 20549-0609. The OMB has reviewed this collection of information under the clearance requirements of 44 U.S.C. ss.3507.
| ITEM 1. | REPORTS TO STOCKHOLDERS. |

Nuveen Taxable Fixed Income Funds
| | | | | | | | |
| Fund Name | | Class A | | Class C | | Class R6 | | Class I |
| Nuveen High Yield Income Fund | | NCOAX | | NCFCX | | NCSRX | | NCOIX |
| Nuveen Floating Rate Income Fund | | NFRAX | | NFFCX | | NFRFX | | NFRIX |
As permitted by regulations adopted by the Securities and Exchange Commission, paper copies of the Funds’ annual and semiannual shareholder reports will not be sent to you by mail unless you specifically request paper copies of the reports. Instead, the reports will be made available on the Funds’ website (www.nuveen.com), and you will be notified by mail each time a report is posted and provided with a website link to access the report.
You may elect to receive shareholder reports and other communications from the Funds electronically at any time by contacting the financial intermediary (such as a broker-dealer or bank) through which you hold your Fund shares or, if you are a direct investor, by enrolling at www.nuveen.com/e-reports.
You may elect to receive all future shareholder reports in paper free of charge at any time by contacting your financial intermediary or, if you are a direct investor, by calling 800-257-8787 and selecting option #1. Your election to receive reports in paper will apply to all funds held in your account with your financial intermediary or, if you are a direct investor, to all your directly held Nuveen Funds and any other directly held funds within the same group of related investment companies.
Annual Report
Life is Complex.
Nuveen makes things e-simple.
It only takes a minute to sign up for e-Reports. Once enrolled, you’ll receive an e-mail as soon as your Nuveen Fund information is ready. No more waiting for delivery by regular mail. Just click on the link within the e-mail to see the report and save it on your computer if you wish.
Free e-Reports right to your email!
www.investordelivery.com
If you receive your Nuveen Fund distributions and statements from your financial professional or brokerage account.
or
www.nuveen.com/client-access
If you receive your Nuveen Fund distributions and statements directly from Nuveen.
Must be preceded by or accompanied by a prospectus.
NOT FDIC INSURED MAY LOSE VALUE NO BANK GUARANTEE
Table
of Contents
3
Chair’s Letter to Shareholders

Dear Shareholders,
More than a year and a half has passed since the World Health Organization declared COVID-19 a global pandemic in March 2020, resulting in a period marked by a global economic downturn, financial market turbulence and some immeasurable losses of life. Although the health crisis persists, with the widespread distribution of vaccines in the U.S. and extraordinary economic interventions by governments and central banks around the world, we collectively look forward to what our “new normal” might be.
Global economies have largely recovered from the pandemic-driven downturns with the help of vaccines and extraordinary support measures from governments and central banks. Since the crisis began, the U.S. government has enacted six relief measures totaling $5.3 trillion to support individuals and families, small and large businesses, state and local governments, education, public health and vaccinations. More recently, Congress passed a $1 trillion infrastructure spending plan, funding upgrades to road, rail and air transportation, broadband internet, and power and water systems.
Nevertheless, pandemic-related impacts continue to weigh on the outlook, particularly regarding inflation. The spread of the COVID-19 delta variant this year has exacerbated shortages of raw materials and labor, which contributed to inflation staying elevated for longer than expected. In response, some central banks, including the U.S. Federal Reserve, are beginning to reduce pandemic-era stimulus measures while other central banks have already started raising interest rates. The timing of monetary policy normalization will be a key focus in the markets, as will the progression of the virus, which can be difficult to predict given uneven vaccination rates around the world and new variants such as delta. Other key pieces of legislation also remain on the horizon in the U.S., including a $1.75 trillion social spending plan and raising the nation’s borrowing limit (known as the debt ceiling).
Short-term market fluctuations can provide your Fund opportunities to invest in new ideas as well as upgrade existing positioning while providing long-term value for shareholders. For more than 120 years, the careful consideration of risk and reward has guided Nuveen’s focus on delivering long-term results to our shareholders.
During this time of economic uncertainty, it may be an opportune time to assess your portfolio. We encourage you to review your time horizon, risk tolerance and investment goals with your financial professional.
On behalf of the other members of the Nuveen Fund Board, I look forward to continuing to earn your trust in the months and years ahead.
Sincerely,

Terence J. Toth
Chair of the Board
November 22, 2021
4
Portfolio Managers’ Comments
Nuveen High Yield Income Fund
Nuveen Floating Rate Income Fund
The Funds’ are sub-advised by Nuveen Asset Management, LLC (NAM), an affiliate of Nuveen Fund Advisors, LLC, the Funds’ investment adviser (the “Adviser”). On December 31, 2020, the Funds’ previous sub-adviser, Symphony Asset Management, LLC (“Symphony”), also an affiliate of the Adviser, was merged with and into NAM (the “Reorganization”). Effective as of the date of the Reorganization, NAM assumed the portfolio management responsibilities for the Funds’ investment portfolio and, as previously approved by the Fund’s Board of Trustees, the Funds’ entered into an amended and restated sub-advisory agreement with NAM, the terms of which were substantially identical to the prior subadvisory agreement with Symphony. Portfolio Managers Scott Caraher and Jean C. Lin, CFA, continue to oversee the investments of the Nuveen High Yield Income Fund. Portfolio Managers Scott Caraher and Kevin Lorenz, CFA, continue to oversee the investments of the Nuveen Floating Rate Income Fund.
Here the portfolio management team discusses economic and market conditions, key investment strategies and the Funds’ performance for the twelve-month reporting period ended September 30, 2021. For more information on the Funds’ investment objectives and policies, please refer to the Funds’ prospectus.
What factors affected the economy and the markets during the twelve-month annual reporting period ended September 30, 2021?
Supported by massive fiscal and monetary stimulus and economic reopening, the U.S. economy rebounded more quickly than expected from the deep downturn caused by the COVID-19 crisis and containment measures. The federal government’s relief measures have totaled approximately $5.3 trillion across six aid packages, which included direct payments to individuals and families, expanded unemployment insurance, loans to large and small businesses, funding for hospitals and health agencies, state and local governments, education and public health/vaccinations. Additionally, after the close of this reporting period, Congress approved a $1 trillion infrastructure and jobs plan in November 2021, which funds improvements to roads/bridges, broadband internet, airports and ports, and water and power systems. The U.S. Federal Reserve (Fed) has maintained short-term interest rates near zero and enacted credit facilities to help keep the financial system stable, lowering borrowing costs for businesses and individuals.
By the start of this reporting period, markets had largely stabilized from the initial shock of the health crisis. In March 2020, equity and commodity markets sold off and safe-haven assets rallied as countries initiated quarantines, restricted travel and shuttered factories and businesses, while an ill-timed oil price war between the Organization of the Petroleum Exporting Countries (OPEC) and non-OPEC member Russia amplified price volatility. In late 2020, the announcement of high efficacy rates in several COVID-19 vaccine trials, followed by regulatory authorizations and public vaccination drives across Western countries, improved the outlook for 2021, which contributed to risk-on sentiment in the markets. The positive sentiment was realized during the first half of 2021 as U.S. gross domestic product (GDP) expanded at an annualized rate of 6.3% in the first quarter of 2021 and 6.7% in the second quarter of
This material is not intended to be a recommendation or investment advice, does not constitute a solicitation to buy, sell or hold a security or an investment strategy and is not provided in a fiduciary capacity. The information provided does not take into account the specific objectives or circumstances of any particular investor, or suggest any specific course of action. Investment decisions should be made based on an investor’s objectives and circumstances and in consultation with his or her advisors.
Certain statements in this report are forward-looking statements. Discussions of specific investments are for illustration only and are not intended as recommendations of individual investments. The forward-looking statements and other views expressed herein are those of the portfolio managers as of the date of this report. Actual future results or occurrences may differ significantly from those anticipated in any forward-looking statements and the views expressed herein are subject to change at any time, due to numerous market and other factors. The Funds disclaim any obligation to update publicly or revise, any forward-looking statements or views expressed herein.
For financial reporting purposes, the ratings disclosed are the highest rating given by one of the following national rating agencies: Standard & Poor’s (S&P), Moody’s Investors Service, Inc. (Moody’s) or Fitch, Inc. (Fitch). This treatment of split-rated securities may differ from that used for other purposes, such as for Fund investment policies. Credit ratings are subject to change. AAA, AA, A and BBB are investment grade ratings, while BB, B, CCC, CC, C and D are below investment grade ratings. Holdings designated N/R are not rated by these national rating agencies.
Refer to the Glossary of Terms Used in this Report for further definition of the terms used within this section.
5
Portfolio Managers’ Comments (continued)
2021. However, economic growth slowed considerably in the third quarter of 2021 to a 2.0% annualized rate, dampened by the spread of the COVID-19 delta variant and constricted supply chains, according to the “advance” estimate released by the Bureau of Economic Analysis.
Although supply bottlenecks, labor shortages and higher cost inflation have weighed on economic growth in the short term, consumer demand remains strong and COVID-19 cases have fallen from recent peaks. Given the U.S. economy’s progress, the Fed began signaling a timeline for tapering pandemic monetary support by reducing its monthly bond purchases (which was announced at the November 2021 policy meeting, after the close of this reporting period), as well as suggested interest rate normalization that could start later in 2022. In addition to monetary policy, markets remained concerned about the political gridlock over raising the debt ceiling – the amount the U.S. government is allowed to borrow. (After the close of this reporting period, the government enacted a temporary increase to the debt ceiling, but Congress will need to revisit the issue in December 2021.)
During the reporting period, the high yield bond market, as represented by the ICE BofA U.S. High Yield Index, returned 11.5%. Within the high yield bond asset class, prices advanced across industries and the credit spectrum. Lower rated bonds led the way during the reporting period, with CCC-rated bonds outperforming BB and B-rated bonds. As spreads narrowed, the index ended the reporting period with both its yield-to-worst and option-adjusted spread (OAS) at multi-year lows. High yield bond credit fundamentals were sound, bolstered by generally healthy consumer and corporate balance sheets.
In terms of senior loans, relatively stable conditions prevailed in the reporting period led by improvement in the fundamentals for the asset class. In addition, loans benefited from strong demand throughout the first nine months of 2021. During that stretch, retail mutual funds and exchange-traded funds (ETFs) garnered $34 billion of inflows as the institutional collateralized loan obligations (CLO) market continued to produce a historic amount of net demand ($122 billion) for loans. The total inflows climbed toward the end of the reporting period as volatility picked up in the U.S. Treasury market. With their floating rate coupon structures, loans tend to see an increase in retail flows during times of rising interest rates and duration-driven volatility.
Nuveen High Yield Income Fund
What strategies were used to manage the Fund during the twelve-month reporting period ended September 30, 2021?
The investment objective of the Fund is to seek current income and capital appreciation by investing primarily in debt instruments such as bonds, loans and convertible securities, a substantial portion of which may be rated below investment grade or, if unrated, of comparable quality. Nuveen Asset Management (NAM) bases its investment process on fundamental, bottom-up credit analysis. Analysts assess sector dynamics, company business models and asset quality. Specific recommendations are based on an analysis of the relative value of the various types of debt within a company’s capital structure. Inherent in the credit analysis process is the evaluation of potential upside and downside to any credit. As such, NAM concentrates its efforts on sectors where there is sufficient transparency to assess the downside risk and where firms have assets to support meaningful recovery in case of default.
How did the Fund perform during the twelve-month reporting period ended September 30, 2021?
For the twelve-month reporting period ended September 30, 2021, the Fund outperformed the ICE BofA U.S. High Yield Index. For purposes of this Performance Commentary, references to relative performance are in comparison to the ICE BofA U.S. High Yield Index.
For the reporting period, outperformance for the Fund was driven by a tactical allocation to, and positive security selection within, senior loans. On a sector basis, favorable security selection in communication services, consumer discretionary and consumer staples contributed to relative performance. Regarding individual holdings, the loans of automotive and specialty LED light producer Lumileds performed well over the reporting period given improved earnings. The Fund sold the position as the loans appreciated during the reporting period. In addition, loans issued by oil and gas E&P (exploration and production) services provider Fieldwood Energy, LLC rallied as oil prices rose and the company emerged from bankruptcy. The Fund continues to hold the loans of Quarternorth Energy (formerly known as Fieldwood Energy). Lastly, the post-reorganization equity of broadcast company iHeartMedia, Inc. benefited from increased advertising revenue as vaccine optimism improved the U.S. economic outlook. The Fund opportunistically sold the iHeartMedia equity holdings amid rising share prices during the reporting period.
6
Partially offsetting some of the portfolio’s positive relative performance was an underweight in the energy sector. Given the rally in oil prices and overall risk-on sentiment that prevailed during the reporting period, the underweight to lower quality oil field services and midstream issuers detracted from the Fund’s relative returns. Unfavorable security selection within the industrials sector detracted from relative results as well.
Nuveen Floating Rate Income Fund
What strategies were used to manage the Fund during the twelve-month reporting period ended September 30, 2021?
The principal investment objective of the Fund is to seek a high level of current income, and secondarily capital appreciation, by investing primarily in floating rate loans and other floating rate securities, a substantial portion of which will be rated below investment grade. Nuveen Asset Management (NAM) bases its investment process on fundamental, bottom-up credit analysis. Analysts assess sector dynamics, company business models and asset quality. Specific recommendations are based on an analysis of the relative value of the various types of debt within a company’s capital structure. Inherent in the credit analysis process is the evaluation of potential upside and downside to any credit. As such, NAM concentrates its efforts on sectors where there is sufficient transparency to assess the downside risk and where firms have assets to support meaningful recovery in case of default.
How did the Fund perform during the twelve-month reporting period ended September 30, 2021?
For the twelve-month reporting period ended September 30, 2021, the Fund outperformed the Credit Suisse Leveraged Loan Index. For purposes of this Performance Commentary, references to relative performance are in comparison to the Credit Suisse Leveraged Loan Index.
For the reporting period, outperformance for the Fund was driven largely by strong security selection in the loan portfolio, including selection within energy and media and entertainment. The outperformance in the energy sector was led by the loans issued by oil and gas E&P (exploration and production) services provider Fieldwood Energy, LLC, which rallied as oil prices rose, and the company emerged from bankruptcy. The Fund continues to maintain exposure to Quarternorth Energy (formerly known as Fieldwood Energy). Additionally, the Fund’s out of benchmark allocation to equities received from reorganizations contributed to relative performance during the reporting period. In particular, the post-reorganization equity of E&P company California Resources traded higher during the reporting period alongside higher oil prices and earnings. The Fund continues to maintain exposure to California Resources.
Offsetting some of the portfolio’s positive relative performance was an underweight in the lower rated segment of the senior loan market as lower quality assets generally outperformed during the reporting period. In addition, exposure to Diamond Sports LLC, a communication and media services company, detracted from performance. The company has experienced pressure around potential restructuring talks and disappointing earnings during the reporting period. Lastly, Endo Health Solutions, Inc. hurt performance during the reporting period as the issuer faces continued costs from opioid lawsuits. The Fund continues to maintain exposure to Diamond Sports and Endo Health Solutions.
7
Risk Considerations and Dividend Information
Risk Considerations
Nuveen High Yield Income Fund
Mutual fund investing involves risk; principal loss is possible. There is no guarantee the Fund’s investment objectives will be achieved. Investments in below investment grade or high yield securities are subject to liquidity risk and heightened credit risk. Credit risk arises from an issuer’s ability to make interest and principal payments when due, as well as the prices of bonds declining when an issuer’s credit quality is expected to deteriorate. The Fund is subject to interest rate risk; as interest rates rise, bond prices fall. This Fund is subject to the risks of investing in loans, including loan settlement risk due to the lack of established settlement standards or remedies for failure to settle and covenant lite loan risk, which is the risk that loans with limited restrictive covenants on borrowers may weaken the Fund’s ability to access collateral securing the loan and enforce its rights as a lender. Non-U.S. investments involve risks such as currency fluctuation, political and economic instability, lack of liquidity and differing legal and accounting standards. These and other risk considerations, such as active management, call, derivatives, income, and unrated securities risks, are described in detail in the Fund’s prospectus.
Nuveen Floating Rate Income Fund
Mutual fund investing involves risk; principal loss is possible. Debt or fixed income securities such as those held by the Fund, are subject to market risk, credit risk, interest rate risk, derivatives risk, liquidity risk, and income risk. As interest rates rise, bond prices fall. Below investment grade or high yield debt securities are subject to liquidity risk and heightened credit risk. Foreign investments involve additional risks, including currency fluctuation, political and economic instability, lack of liquidity and differing legal and accounting standards. The value of the Fund’s convertible securities may decline in response to such factors as rising interest rates and fluctuations in the market price of the underlying securities. This Fund is subject to loan settlement risk due to the lack of established settlement standards or remedies for failure to settle.
Dividend Information
Each Fund seeks to pay regular monthly dividends out of its net investment income at a rate that reflects its past and projected net income performance. To permit each Fund to maintain a more stable monthly dividend, the Fund may pay dividends at a rate that may be more or less than the amount of net income actually earned by the Fund during the period. Distributions to shareholders are determined on a tax basis, which may differ from amounts recorded in the accounting records. In instances where the monthly dividend exceeds the earned net investment income, the Fund would report a negative undistributed net ordinary income. Refer to Note 6 – Income Tax Information for additional information regarding the amounts of undistributed net ordinary income and undistributed net long-term capital gains and the character of the actual distributions paid by the Fund during the period.
All monthly dividends paid by each Fund during the current reporting period were paid from net investment income. If a portion of the Fund’s monthly distributions is sourced or comprised of elements other than net investment income, including capital gains and/or a return of capital, shareholders will be notified of those sources. For financial reporting purposes, the per share amounts of each Fund’s distributions for the reporting period are presented in this report’s Financial Highlights. For income tax purposes, distribution information for each Fund as of its most recent tax year end is presented in Note 6 – Income Tax Information within the Notes to Financial Statements of this report.
8
Fund Performance and Expense Ratios
The Fund Performance and Expense Ratios for each Fund are shown within this section of the report.
Fund Performance
Returns quoted represent past performance, which is no guarantee of future results. Investment returns and principal value will fluctuate so that when shares are redeemed, they may be worth more or less than their original cost. Current performance may be higher or lower than the performance shown.
Total returns for a period of less than one year are not annualized (i.e. cumulative returns). Since inception returns are shown for share classes that have less than 10-years of performance. Returns at net asset value (NAV) would be lower if the sales charge were included. Returns assume reinvestment of dividends and capital gains. For performance, current to the most recent month-end visit nuveen.com or call (800) 257-8787.
Returns do not reflect the deduction of taxes that a shareholder would pay on Fund distributions or the redemption of Fund shares.
Returns may reflect fee waivers and/or expense reimbursements by the investment adviser during the periods presented. If any such waivers and/or reimbursements had not been in place, returns would have been reduced. See Notes to Financial Statements, Note 7—Management Fees and Other Transactions with Affiliates for more information.
Returns reflect differences in sales charges and expenses, which are primarily differences in distribution and service fees, and assume reinvestment of dividends and capital gains.
Comparative index and Lipper return information is provided for Class A Shares at NAV only.
Expense Ratios
The expense ratios shown are as of the Fund’s most recent prospectus. The expense ratios shown reflect total operating expenses (before fee waivers and/or expense reimbursements, if any). The expense ratios include management fees and other fees and expenses. Refer to the Financial Highlights later in this report for the Fund’s expense ratios as of the end of the reporting period.
9
Fund Performance and Expense Ratios (continued)
Nuveen High Yield Income Fund
Refer to the first page of this Fund Performance and Expense Ratios section for further explanation of the information included within this section. Refer to Glossary of Terms Used in this Report for definitions of terms used within this section.
Fund Performance and Expense Ratios
| | | | | | | | | | | | | | | | | | | | | | | | |
| | | | | | Total Returns as of September 30, 2021* | | | | | | | |
| | | | | | Average Annual | | | Expense Ratios** | |
| | | Inception Date | | | 1-Year | | | 5-Year | | | 10-Year | | | Gross | | | Net | |
Class A Shares at NAV | | | 4/28/10 | | | | 12.44% | | | | 5.73% | | | | 6.59% | | | | 1.05% | | | | 1.01% | |
Class A Shares at maximum Offering Price | | | 4/28/10 | | | | 7.10% | | | | 4.70% | | | | 6.07% | | | | — | | | | — | |
ICE BofA U.S. High Yield Index1 | | | — | | | | 11.46% | | | | 6.35% | | | | 7.30% | | | | — | | | | — | |
Lipper High Yield Funds Classification Average | | | — | | | | 10.91% | | | | 5.63% | | | | 6.36% | | | | — | | | | — | |
| | | | | | |
Class C Shares | | | 4/28/10 | | | | 11.61% | | | | 4.94% | | | | 5.96% | | | | 1.81% | | | | 1.76% | |
Class I Shares | | | 4/28/10 | | | | 12.69% | | | | 5.99% | | | | 6.86% | | | | 0.80% | | | | 0.76% | |
| | | | |
| | | | | | Total Returns as of September 30, 2021* | | | | | | | |
| | | | | | Average Annual | | | Expense Ratios** | |
| | | Inception Date | | | 1-Year | | | 5-Year | | | Since
Inception | | | Gross | | | Net | |
Class R6 Shares | | | 10/1/14 | | | | 12.87% | | | | 6.12% | | | | 4.95% | | | | 0.69% | | | | 0.64% | |
| * | Class A Shares have a maximum 4.75% sales charge (Offering Price). Class A Share purchases of $1 million or more are sold at net asset value without an up-front sales charge but may be subject to a contingent deferred sales charge (CDSC) of 1% if redeemed within eighteen months of purchase. Class C Shares have a 1% CDSC for redemptions within less than twelve months, which is not reflected in the total returns. Class C Shares automatically convert to Class A Shares ten years after purchase (effective March 1, 2021, eight years after purchase). Returns for periods longer than eight years for Class C Shares reflect the performance of Class A Shares after the deemed eight-years conversion to Class A Shares within such periods. Class R6 Shares have no sales charge and are available only to certain limited categories of investors as described in the prospectus. Class I Shares have no sales charge and may be purchased under limited circumstances or by specified classes of investors. |
| ** | The Fund’s investment adviser has contractually agreed to waive fees and/or reimburse expenses so that the total annual operating expenses of the Fund (excluding 12b-1 distribution and/or service fees, interest expenses, taxes, acquired fund fees and expenses, fees incurred in acquiring and disposing of portfolio securities and extraordinary expenses) do not exceed 0.79% through July 31, 2023 or 1.35% after July 31, 2023 of the average daily net assets of any class of Fund shares. However, because Class R6 shares are not subject to sub-transfer agent and similar fees, the total annual operating expenses for the Class R6 shares will be less than the expense limitation. The expense limitation expiring July 31, 2023 may be terminated or modified prior to that date only with the approval of the Board of Trustees of the Fund. The expense limitation in effect thereafter may be terminated or modified only with the approval of shareholders of the Fund. |
| 1 | For purposes of Fund performance, relative results are measured against this index/benchmark. |
10
Nuveen High Yield Income Fund
Growth of an Assumed $10,000 Investment as of September 30, 2021 – Class A Shares
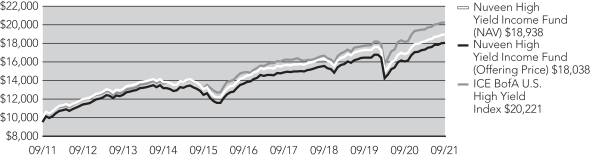
The graphs do not reflect the deduction of taxes that a shareholder may pay on Fund distributions or the redemption of Fund shares.
11
Fund Performance and Expense Ratios (continued)
Nuveen Floating Rate Income Fund
Refer to the first page of this Fund Performance and Expense Ratios section for further explanation of the information included within this section. Refer to Glossary of Terms Used in this Report for definitions of terms used in this section.
Fund Performance and Expense Ratios
| | | | | | | | | | | | | | | | | | | | |
| | | | | | Total Returns as of September 30, 2021* | | | | |
| | | | | | Average Annual | | | | |
| | | Inception Date | | | 1-Year | | | 5-Year | | | 10-Year | | | Expense
Ratio | |
Class A Shares at NAV | | | 05/02/11 | | | | 11.67% | | | | 4.13% | | | | 5.15% | | | | 1.02% | |
Class A Shares at maximum Offering Price | | | 05/02/11 | | | | 8.32% | | | | 3.50% | | | | 4.83% | | | | — | |
Credit Suisse Leveraged Loan Index1 | | | — | | | | 8.46% | | | | 4.64% | | | | 5.04% | | | | — | |
Lipper Loan Participation Funds Classification Average | | | — | | | | 7.72% | | | | 3.52% | | | | 4.03% | | | | — | |
Class C Shares | | | 05/02/11 | | | | 10.79% | | | | 3.35% | | | | 4.52% | | | | 1.77% | |
Class I Shares | | | 05/02/11 | | | | 11.93% | | | | 4.40% | | | | 5.41% | | | | 0.77% | |
| | | |
| | | | | | Total Returns as of September 30, 2021* | | | | |
| | | | | | Average Annual | | | Expense Ratio | |
| | | Inception Date | | | 1-Year | | | 5-Year | | | Since
Inception | | | Gross | |
Class R6 Shares | | | 01/28/15 | | | | 12.03% | | | | 4.50% | | | | 4.15% | | | | 0.68% | |
| * | Class A Shares have a maximum 3.00% sales charge (Offering Price). Class A Share purchases of $500,000 or more are sold at net asset value without an up-front sales charge but may be subject to a contingent deferred sales charge (CDSC) of 1% if redeemed within eighteen months of purchase. Class C Shares have a 1% CDSC for redemptions within less than twelve months, which is not reflected in the total returns. Class C Shares automatically convert to Class A Shares ten years after purchase (effective March 1, 2021, eight years after purchase). Returns for periods longer than eight years for Class C Shares reflect the performance of Class A Shares after the deemed eight-years conversion to Class A Shares within such periods. Class R6 Shares have no sales charge and are available only to certain limited categories of investors as described in the prospectus. Class I Shares have no sales charge and may be purchased under limited circumstances or by specified classes of investors. |
| 1 | For purposes of Fund performance, relative results are measured against this index/benchmark. |
12
Nuveen Floating Rate Income Fund
Growth of an Assumed $10,000 Investment as of September 30, 2021 – Class A Shares
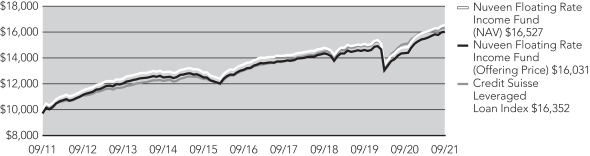
The graphs do not reflect the deduction of taxes that a shareholder may pay on Fund distributions or the redemption of Fund shares.
13
Yields as of September 30, 2021
Dividend Yield is the most recent dividend per share (annualized) divided by the offering price per share.
The SEC 30-Day Yield is a standardized measure of a Fund’s yield that accounts for the future amortization of premiums or discounts of bonds held in the fund’s portfolio. The SEC 30-Day Yield is computed under an SEC standardized formula and is based on the maximum offer price per share. Subsidized yields reflect fee waivers and/or expense reimbursements from the investment adviser during the period. If any such waivers and/or reimbursements had not been in place, yields would have been reduced. Unsubsidized yields do not reflect waivers and/or reimbursements from the investment adviser during the period. If the fund did not receive a fee waiver/expense reimbursement during the period under its most recent agreement, subsidized and unsubsidized yields will be equal. Refer to the Notes to Financial Statements, Note 7 – Management Fees and Other Transactions with Affiliates for further details on the investment adviser’s most recent agreement with the Fund to waive fees and/or reimburse expenses, where applicable. Dividend Yield may differ from the SEC 30-Day Yield because the fund may be paying out more or less than it is earning and it may not include the effect of amortization of bond premium or discount.
Nuveen High Yield Income Fund
| | | | | | | | | | | | | | | | |
| | | Share Class | |
| | | Class A1 | | | Class C | | | Class R6 | | | Class I | |
Dividend Yield | | | 4.28% | | | | 3.74% | | | | 4.80% | | | | 4.73% | |
SEC 30-Day Yield-Subsidized | | | 3.20% | | | | 2.66% | | | | 3.83% | | | | 3.64% | |
SEC 30-Day Yield-Unsubsidized | | | 3.10% | | | | 2.54% | | | | 3.72% | | | | 3.53% | |
Nuveen Floating Rate Income Fund
| | | | | | | | | | | | | | | | |
| | | Share Class | |
| | | Class A1 | | | Class C | | | Class R6 | | | Class I | |
Dividend Yield | | | 3.97% | | | | 3.34% | | | | 4.38% | | | | 4.34% | |
SEC 30-Day Yield | | | 2.42% | | | | 1.76% | | | | 2.86% | | | | 2.73% | |
| 1 | The SEC Yield for Class A Shares quoted in the table reflects the maximum sales load. Investors paying a reduced load because of volume discounts, investors paying no load because they qualify for one of the several exclusions from the load, and existing shareholders who previously paid a load but would like to know the SEC Yield applicable to their shares on a going-forward basis, should understand that the SEC Yield effectively applicable to them would be higher than the figure quoted in the table. |
14
Holding Summaries as of September 30, 2021
This data relates to the securities held in each Fund’s portfolio of investments as of the end of this reporting period. It should not be construed as a measure of performance for the Fund itself. Holdings are subject to change.
For financial reporting purposes, the ratings disclosed are the highest rating given by one of the following national rating agencies: Standard & Poor’s, Moody’s Investors Service, Inc. or Fitch, Inc. This treatment of split-rated securities may differ from that used for other purposes, such as for Fund investment policies. Credit ratings are subject to change. AAA, AA, A and BBB are investment grade ratings; BB, B, CCC, CC, C and D are below investment grade ratings. Holdings designated N/R are not rated by these national rating agencies.
Nuveen High Yield Income Fund
Fund Allocation
(% of net assets)
| | | | |
| | |
Corporate Bonds | | | 71.4% | |
| |
Variable Rate Senior Loan Interests | | | 23.1% | |
| |
Common Stocks | | | 0.9% | |
| |
Warrants | | | 0.3% | |
| |
Investments Purchased with Collateral from Securities Lending | | | 1.6% | |
| |
Investment Companies | | | 5.5% | |
| |
Other Assets Less Liabilities | | | (2.8)% | |
| |
Net Assets | | | 100% | |
Top Five Holdings
(% of net assets)
| | | | |
| | |
BlackRock Liquidity Funds T-Fund | | | 5.5% | |
| |
Prime Security Services Borrower, LLC, Term Loan | | | 1.4% | |
| |
Imola Merger Corp | | | 1.3% | |
| |
Jazz Financing Lux S.a.r.l., Term Loan | | | 1.3% | |
| |
Occidental Petroleum Corp | | | 1.2% | |
Portfolio Composition
(% of net assets)
| | | | |
| | |
Oil, Gas & Consumable Fuels | | | 11.9% | |
| |
Media | | | 7.4% | |
| |
Hotels, Restaurants & Leisure | | | 7.2% | |
| |
Health Care Providers & Services | | | 6.9% | |
| |
Commercial Services & Supplies | | | 5.1% | |
| |
Pharmaceuticals | | | 4.5% | |
| |
Chemicals | | | 4.3% | |
| |
Software | | | 3.9% | |
| |
Specialty Retail | | | 3.4% | |
| |
Auto Components | | | 3.3% | |
| |
IT Services | | | 2.9% | |
| |
Diversified Telecommunication Services | | | 2.7% | |
| |
Equity Real Estate Investment Trust | | | 2.4% | |
| |
Personal Products | | | 2.0% | |
| |
Automobiles | | | 1.8% | |
| |
Diversified Financial Services | | | 1.8% | |
| |
Food & Staples Retailing | | | 1.4% | |
| |
Metals & Mining | | | 1.3% | |
| |
Real Estate Management & Development | | | 1.3% | |
| |
Beverages | | | 1.3% | |
| |
Other1 | | | 18.9% | |
| |
Investments Purchased with Collateral from Securities Lending | | | 1.6% | |
| |
Investment Companies | | | 5.5% | |
| |
Other Assets Less Liabilities | | | (2.8)% | |
| |
Net Assets | | | 100% | |
Portfolio Credit Quality
(% of total long-term fixed-income investments)
| | | | |
| | |
BBB | | | 0.9% | |
| |
BB or Lower | | | 98.2% | |
| |
N/R (not rated) | | | 0.9% | |
| |
Total | | | 100% | |
| 1 | See Portfolio of Investments for details on “other” Portfolio Composition. |
15
Holding Summaries as of March 31, 2021 (continued)
Nuveen Floating Rate Income Fund
Fund Allocation
(% of net assets)
| | | | |
| | |
Variable Rate Senior Loan Interests | | | 79.2% | |
| |
Corporate Bonds | | | 13.6% | |
| |
Common Stocks | | | 2.0% | |
| |
Warrants | | | 0.6% | |
| |
Convertible Preferred Securities | | | 0.0% | |
| |
Investment Companies | | | 11.8% | |
| |
Other Assets Less Liabilities | | | (7.2)% | |
| |
Net Assets | | | 100% | |
Top Five Holdings
(% of net assets)
| | | | |
| | |
BlackRock Liquidity Funds T-Fund | | | 11.8% | |
| |
RegionalCare Hospital Partners Holdings, Inc., Term Loan B | | | 1.9% | |
| |
Phoenix Newco Inc., Term Loan | | | 1.6% | |
| |
Delta 2 (LUX) S.a.r.l., Term Loan | | | 1.6% | |
| |
Mallinckrodt International Finance S.A., Term Loan B | | | 1.3% | |
Portfolio Composition
(% of net assets)
| | | | |
| | |
Hotels, Restaurants & Leisure | | | 10.1% | |
| |
Media | | | 9.7% | |
| |
Health Care Providers & Services | | | 8.7% | |
| |
Software | | | 6.8% | |
| |
Commercial Services & Supplies | | | 6.2% | |
| |
Pharmaceuticals | | | 5.4% | |
| |
Oil, Gas & Consumable Fuels | | | 4.2% | |
| |
Diversified Telecommunication Services | | | 2.8% | |
| |
Life Sciences Tools & Services | | | 2.7% | |
| |
IT Services | | | 2.3% | |
| |
Communications Equipment | | | 2.2% | |
| |
Insurance | | | 2.2% | |
| |
Health Care Equipment & Supplies | | | 2.2% | |
| |
Specialty Retail | | | 2.2% | |
| |
Chemicals | | | 1.8% | |
| |
Airlines | | | 1.7% | |
| |
Food & Staples Retailing | | | 1.6% | |
| |
Professional Services | | | 1.4% | |
| |
Construction & Engineering | | | 1.3% | |
| |
Other1 | | | 19.9% | |
| |
Investment Companies | | | 11.8% | |
| |
Other Assets Less Liabilities | | | (7.2)% | |
| |
Net Assets | | | 100% | |
Portfolio Credit Quality
(% of total long-term fixed-income investments)
| | | | |
| | |
BBB | | | 6.4% | |
| |
BB or Lower | | | 90.6% | |
| |
N/R (not rated) | | | 3.0% | |
| |
Total | | | 100% | |
| 1 | See Portfolio of Investments for details on “other” Portfolio Composition. |
16
Expense Examples
As a shareholder of one or more of the Funds, you incur two types of costs: (1) transaction costs, including up-front and back-end sales charges (loads) or redemption fees, where applicable; and (2) ongoing costs, including management fees; distribution and service (12b-1) fees, where applicable; and other Fund expenses. The Examples below are intended to help you understand your ongoing costs (in dollars) of investing in the Funds and to compare these costs with the ongoing costs of investing in other mutual funds.
The Examples below are based on an investment of $1,000 invested at the beginning of the period and held through the period ended September 30, 2021.
The beginning of the period is April 1, 2021.
The information under “Actual Performance,” together with the amount you invested, allows you to estimate actual expenses incurred over the reporting period. Simply divide your account value by $1,000 (for example, an $8,600 account value divided by $1,000 = 8.60) and multiply the result by the cost shown for your share class, in the row entitled “Expenses Incurred During Period” to estimate the expenses incurred on your account during this period.
The information under “Hypothetical Performance,” provides information about hypothetical account values and hypothetical expenses based on each Fund’s actual expense ratios and an assumed rate of return of 5% per year before expenses, which is not the Fund’s actual return. The hypothetical account values and expenses may not be used to estimate the actual ending account balance or expense you incurred for the period. You may use this information to compare the ongoing costs of investing in the Fund and other funds. To do so, compare this 5% hypothetical example with the 5% hypothetical examples that appear in the shareholder reports of the other funds.
Please note that the expenses shown in the following tables are meant to highlight your ongoing costs only and do not reflect any transaction costs. Therefore, the hypothetical information is useful in comparing ongoing costs only, and will not help you determine the relative total costs of owning different funds or share classes. In addition, if these transaction costs were included, your costs would have been higher.
Nuveen High Yield Income Fund
| | | | | | | | | | | | | | | | |
| | | Share Class | |
| | | Class A | | | Class C | | | Class R6 | | | Class I | |
Actual Performance | | | | | | | | | | | | | | | | |
Beginning Account Value | | $ | 1,000.00 | | | $ | 1,000.00 | | | $ | 1,000.00 | | | $ | 1,000.00 | |
Ending Account Value | | $ | 1,041.45 | | | $ | 1,037.55 | | | $ | 1,043.97 | | | $ | 1,042.67 | |
Expenses Incurred During the Period | | $ | 5.12 | | | $ | 8.89 | | | $ | 3.13 | | | $ | 3.84 | |
Hypothetical Performance (5% annualized return before expenses) | | | | | | | | | | | | | | | | |
Beginning Account Value | | $ | 1,000.00 | | | $ | 1,000.00 | | | $ | 1,000.00 | | | $ | 1,000.00 | |
Ending Account Value | | $ | 1,020.05 | | | $ | 1,016.34 | | | $ | 1,022.01 | | | $ | 1,021.31 | |
Expenses Incurred During the Period | | $ | 5.06 | | | $ | 8.80 | | | $ | 3.09 | | | $ | 3.80 | |
For each class of the Fund, expenses are equal to the Fund’s annualized net expense ratio of 1.00%, 1.74%, 0.61% and 0.75% for Classes A, C, R6 and I, respectively, multiplied by the average account value over the period, multiplied by 183/365 to reflect the one-half year period).
17
Expense Examples (continued)
Nuveen Floating Rate Income Fund
| | | | | | | | | | | | | | | | |
| | | Share Class | |
| | | Class A | | | Class C | | | Class R6 | | | Class I | |
Actual Performance | | | | | | | | | | | | | | | | |
Beginning Account Value | | $ | 1,000.00 | | | $ | 1,000.00 | | | $ | 1,000.00 | | | $ | 1,000.00 | |
Ending Account Value | | $ | 1,035.42 | | | $ | 1,031.61 | | | $ | 1,037.44 | | | $ | 1,036.68 | |
Expenses Incurred During the Period | | $ | 5.20 | | | $ | 9.01 | | | $ | 3.47 | | | $ | 3.93 | |
Hypothetical Performance (5% annualized return before expenses) | | | | | | | | | | | | | | | | |
Beginning Account Value | | $ | 1,000.00 | | | $ | 1,000.00 | | | $ | 1,000.00 | | | $ | 1,000.00 | |
Ending Account Value | | $ | 1,019.95 | | | $ | 1,016.19 | | | $ | 1,021.66 | | | $ | 1,021.21 | |
Expenses Incurred During the Period | | $ | 5.16 | | | $ | 8.95 | | | $ | 3.45 | | | $ | 3.90 | |
For each class of the Fund, expenses are equal to the Fund’s annualized net expense ratio of 1.02%, 1.77%, 0.68% and 0.77% for Classes A, C, R6 and I, respectively, multiplied by the average account value over the period, multiplied by 183/365 to reflect the one-half year period).
18
Report of Independent Registered Public Accounting Firm
To the Shareholders and Board of Trustees of
Nuveen Investment Trust III:
Opinion on the Financial Statements
We have audited the accompanying statements of assets and liabilities of Nuveen High Yield Income Fund and Nuveen Floating Rate Income Fund (two of the funds comprising Nuveen Investment Trust III) (the Funds), including the portfolios of investments, as of September 30, 2021, the related statements of operations for the year then ended, the statements of changes in net assets for each of the years in the two-year period then ended, and the related notes (collectively, the financial statements) and the financial highlights for each of the years in the five-year period then ended. In our opinion, the financial statements and financial highlights present fairly, in all material respects, the financial position of the Funds as of September 30, 2021, the results of their operations for the year then ended, the changes in their net assets for each of the years in the two-year period then ended, and the financial highlights for each of the years in the five-year period then ended, in conformity with U.S. generally accepted accounting principles.
Basis for Opinion
These financial statements and financial highlights are the responsibility of the Funds’ management. Our responsibility is to express an opinion on these financial statements and financial highlights based on our audits. We are a public accounting firm registered with the Public Company Accounting Oversight Board (United States) (PCAOB) and are required to be independent with respect to the Fund in accordance with the U.S. federal securities laws and the applicable rules and regulations of the Securities and Exchange Commission and the PCAOB.
We conducted our audits in accordance with the standards of the PCAOB. Those standards require that we plan and perform the audit to obtain reasonable assurance about whether the financial statements and financial highlights are free of material misstatement, whether due to error or fraud. Our audits included performing procedures to assess the risks of material misstatement of the financial statements and financial highlights, whether due to error or fraud, and performing procedures that respond to those risks. Such procedures included examining, on a test basis, evidence regarding the amounts and disclosures in the financial statements and financial highlights. Such procedures also included confirmation of securities owned as of September 30, 2021, by correspondence with custodians and brokers or other appropriate auditing procedures. Our audits also included evaluating the accounting principles used and significant estimates made by management, as well as evaluating the overall presentation of the financial statements and financial highlights. We believe that our audits provide a reasonable basis for our opinion.
/s/ KPMG LLP
We have served as the auditor of one or more Nuveen investment companies since 2014.
Chicago, Illinois
November 24, 2021
19
Nuveen High Yield Income Fund
Portfolio of Investments September 30, 2021
| | | | | | | | | | | | | | | | | | | | | | | | | | | | |
Principal
Amount (000) | | | Description (1) | | Coupon | | | | | | | | | Maturity | | | Ratings (2) | | | Value | |
| | | | | | | |
| | | | LONG-TERM INVESTMENTS – 95.7% | | | | | | | | | | | | | | | | | | | | | | | | |
| | | | | | | |
| | | | CORPORATE BONDS – 71.4% | | | | | | | | | | | | | | | | | | | | | | | | |
| | | |
| | | | Aerospace & Defense – 0.6% | | | | | | | |
| | | | | | | |
| $ | 1,455 | | | Bombardier Inc, 144A | | | 7.125% | | | | | | | | | | | | 6/15/26 | | | | CCC+ | | | $ | 1,527,750 | |
| | | | | | | |
| | 2,250 | | | Rolls-Royce PLC, 144A | | | 5.750% | | | | | | | | | | | | 10/15/27 | | | | BB– | | | | 2,486,250 | |
| | 3,705 | | | Total Aerospace & Defense | | | | | | | | | | | | | | | | | | | | | | | 4,014,000 | |
| | | | | | | |
| | | | Air Freight & Logistics – 0.4% | | | | | | | | | | | | | | | | | | |
| | | | | | | |
| | 2,475 | | | Cargo Aircraft Management Inc, 144A | | | 4.750% | | | | | | | | | | | | 2/01/28 | | | | BB | | | | 2,559,150 | |
| | | | | | | |
| | | | Airlines – 0.2% | | | | | | | | | | | | | | | | | | |
| | | | | | | |
| | 675 | | | United Airlines Inc, 144A | | | 4.375% | | | | | | | | | | | | 4/15/26 | | | | Ba1 | | | | 692,719 | |
| | | | | | | |
| | 675 | | | United Airlines Inc, 144A | | | 4.625% | | | | | | | | | | | | 4/15/29 | | | | Ba1 | | | | 697,579 | |
| | 1,350 | | | Total Airlines | | | | | | | | | | | | | | | | | | | | | | | 1,390,298 | |
| | | | | | | |
| | | | Auto Components – 2.6% | | | | | | | | | | | | | | | | | | |
| | | | | | | |
| | 4,000 | | | Adient Global Holdings Ltd, 144A | | | 4.875% | | | | | | | | | | | | 8/15/26 | | | | B | | | | 4,095,080 | |
| | | | | | | |
| | 1,800 | | | Allison Transmission Inc, 144A | | | 5.875% | | | | | | | | | | | | 6/01/29 | | | | Ba2 | | | | 1,958,490 | |
| | | | | | | |
| | 1,005 | | | Dornoch Debt Merger Sub Inc, 144A, (WI/DD) | | | 6.625% | | | | | | | | | | | | 10/15/29 | | | | Caa1 | | | | 1,005,000 | |
| | | | | | | |
| | 1,850 | | | Goodyear Tire & Rubber Co, 144A | | | 5.000% | | | | | | | | | | | | 7/15/29 | | | | BB– | | | | 1,963,312 | |
| | | | | | | |
| | 3,750 | | | Goodyear Tire & Rubber Co, 144A | | | 5.250% | | | | | | | | | | | | 7/15/31 | | | | BB– | | | | 3,993,750 | |
| | | | | | | |
| | 1,000 | | | IHO Verwaltungs GmbH, 144A, (cash 6.000%, PIK 6.750%) | | | 6.000% | | | | | | | | | | | | 5/15/27 | | | | Ba2 | | | | 1,042,390 | |
| | | | | | | |
| | 3,325 | | | NESCO Holdings II Inc, 144A | | | 5.500% | | | | | | | | | | | | 4/15/29 | | | | B | | | | 3,448,690 | |
| | 16,730 | | | Total Auto Components | | | | | | | | | | | | | | | | | | | | | | | 17,506,712 | |
| | | |
| | | | Automobiles – 1.8% | | | | | | | |
| | | | | | | |
| | 6,460 | | | Ford Motor Credit Co LLC | | | 2.700% | | | | | | | | | | | | 8/10/26 | | | | BB+ | | | | 6,472,920 | |
| | | | | | | |
| | 1,800 | | | Ford Motor Credit Co LLC | | | 4.125% | | | | | | | | | | | | 8/17/27 | | | | BB+ | | | | 1,908,900 | |
| | | | | | | |
| | 1,500 | | | Ford Motor Credit Co LLC | | | 5.113% | | | | | | | | | | | | 5/03/29 | | | | BB+ | | | | 1,676,250 | |
| | | | | | | |
| | 1,800 | | | Ford Motor Credit Co LLC | | | 4.000% | | | | | | | | | | | | 11/13/30 | | | | BB+ | | | | 1,872,000 | |
| | 11,560 | | | Total Automobiles | | | | | | | | | | | | | | | | | | | | | | | 11,930,070 | |
| | | | | | | |
| | | | Beverages – 0.8% | | | | | | | | | | | | | | | | | | |
| | | | | | | |
| | 5,175 | | | Primo Water Holdings Inc, 144A | | | 4.375% | | | | | | | | | | | | 4/30/29 | | | | B1 | | | | 5,161,286 | |
| | | | | | | |
| | | | Biotechnology – 0.4% | | | | | | | | | | | | | | | | | | |
| | | | | | | |
| | 2,800 | | | Emergent BioSolutions Inc, 144A | | | 3.875% | | | | | | | | | | | | 8/15/28 | | | | BB– | | | | 2,723,000 | |
| | | | | | | |
| | | | Building Products – 0.8% | | | | | | | | | | | | | | | | | | |
| | | | | | | |
| | 2,640 | | | Park River Holdings Inc, 144A | | | 6.750% | | | | | | | | | | | | 8/01/29 | | | | Caa1 | | | | 2,646,600 | |
| | | | | | | |
| | 1,715 | | | SRS Distribution Inc, 144A | | | 4.625% | | | | | | | | | | | | 7/01/28 | | | | B– | | | | 1,749,643 | |
| | | | | | | |
| | 880 | | | Standard Industries Inc/NJ, 144A | | | 4.375% | | | | | | | | | | | | 7/15/30 | | | �� | BB– | | | | 897,600 | |
| | 5,235 | | | Total Building Products | | | | | | | | | | | | | | | | | | | | | | | 5,293,843 | |
20
| | | | | | | | | | | | | | | | | | | | | | | | | | | | |
Principal
Amount (000) | | | Description (1) | | Coupon | | | | | | | | | Maturity | | | Ratings (2) | | | Value | |
| | | |
| | | | Chemicals – 4.2% | | | | | | | |
| | | | | | | |
| $ | 5,105 | | | Consolidated Energy Finance SA, 144A | | | 5.625% | | | | | | | | | | | | 10/15/28 | | | | B+ | | | $ | 5,105,000 | |
| | | | | | | |
| | 3,218 | | | OCI NV, 144A | | | 4.625% | | | | | | | | | | | | 10/15/25 | | | | BB+ | | | | 3,378,900 | |
| | | | | | | |
| | 4,900 | | | Olympus Water US Holding Corp, 144A, (WI/DD) | | | 4.250% | | | | | | | | | | | | 10/01/28 | | | | B2 | | | | 4,828,828 | |
| | | | | | | |
| | 2,760 | | | Olympus Water US Holding Corp, 144A, (WI/DD) | | | 6.250% | | | | | | | | | | | | 10/01/29 | | | | CCC+ | | | | 2,735,022 | |
| | | | | | | |
| | 2,600 | | | Rayonier AM Products Inc, 144A | | | 7.625% | | | | | | | | | | | | 1/15/26 | | | | B1 | | | | 2,759,250 | |
| | | | | | | |
| | 3,200 | | | Tronox Inc, 144A | | | 4.625% | | | | | | | | | | | | 3/15/29 | | | | B | | | | 3,184,000 | |
| | | | | | | |
| | 3,320 | | | Unifrax Escrow Issuer Corp, 144A | | | 5.250% | | | | | | | | | | | | 9/30/28 | | | | BB | | | | 3,361,500 | |
| | | | | | | |
| | 785 | | | Unifrax Escrow Issuer Corp, 144A | | | 7.500% | | | | | | | | | | | | 9/30/29 | | | | CCC+ | | | | 804,444 | |
| | | | | | | |
| | 2,005 | | | WR Grace Holdings LLC, 144A | | | 5.625% | | | | | | | | | | | | 8/15/29 | | | | B+ | | | | 2,065,170 | |
| | 27,893 | | | Total Chemicals | | | | | | | | | | | | | | | | | | | | | | | 28,222,114 | |
| | | |
| | | | Commercial Services & Supplies – 2.7% | | | | | | | |
| | | | | | | |
| | 3,245 | | | ADT Security Corp, 144A | | | 4.125% | | | | | | | | | | | | 8/01/29 | | | | BB– | | | | 3,225,175 | |
| | | | | | | |
| | 750 | | | Allied Universal Holdco LLC / Allied Universal Finance Corp, 144A | | | 6.625% | | | | | | | | | | | | 7/15/26 | | | | BB– | | | | 792,960 | |
| | | | | | | |
| | 5,000 | | | Allied Universal Holdco LLC/Allied Universal Finance Corp/Atlas Luxco 4 Sarl, 144A | | | 4.625% | | | | | | | | | | | | 6/01/28 | | | | BB– | | | | 4,992,250 | |
| | | | | | | |
| | 2,600 | | | GFL Environmental Inc, 144A | | | 4.750% | | | | | | | | | | | | 6/15/29 | | | | B– | | | | 2,671,500 | |
| | | | | | | |
| | 2,800 | | | Pitney Bowes Inc, 144A | | | 6.875% | | | | | | | | | | | | 3/15/27 | | | | N/R | | | | 2,947,000 | |
| | | | | | | |
| | 3,225 | | | Pitney Bowes Inc, 144A | | | 7.250% | | | | | | | | | | | | 3/15/29 | | | | BB | | | | 3,390,281 | |
| | 17,620 | | | Total Commercial Services & Supplies | | | | | | | | | | | | | | | | | | | | | | | 18,019,166 | |
| | | |
| | | | Communications Equipment – 0.3% | | | | | | | |
| | | | | | | |
| | 1,800 | | | Viasat Inc, 144A | | | 5.625% | | | | | | | | | | | | 4/15/27 | | | | BB+ | | | | 1,876,500 | |
| | | | | | | |
| | | | Consumer Finance – 0.9% | | | | | | | | | | | | | | | | | | |
| | | | | | | |
| | 3,000 | | | Navient Corp | | | 4.875% | | | | | | | | | | | | 3/15/28 | | | | Ba3 | | | | 3,024,390 | |
| | | | | | | |
| | 2,850 | | | OneMain Finance Corp | | | 4.000% | | | | | | | | | | | | 9/15/30 | | | | Ba2 | | | | 2,835,750 | |
| | 5,850 | | | Total Consumer Finance | | | | | | | | | | | | | | | | | | | | | | | 5,860,140 | |
| | | |
| | | | Distributors – 0.2% | | | | | | | |
| | | | | | | |
| | 1,400 | | | H&E Equipment Services Inc, 144A | | | 3.875% | | | | | | | | | | | | 12/15/28 | | | | BB– | | | | 1,394,540 | |
| | | | | | | |
| | | | Diversified Financial Services – 0.9% | | | | | | | | | | | | | | | | | | |
| | | | | | | |
| | 3,700 | | | HCRX Investments Holdco LP, 144A | | | 4.500% | | | | | | | | | | | | 8/01/29 | | | | B2 | | | | 3,718,500 | |
| | | | | | | |
| | 2,040 | | | OneMain Finance Corp | | | 3.500% | | | | | | | | | | | | 1/15/27 | | | | Ba2 | | | | 2,040,918 | |
| | 5,740 | | | Total Diversified Financial Services | | | | | | | | | | | | | | | | | | | | | | | 5,759,418 | |
| | | |
| | | | Diversified Telecommunication Services – 2.7% | | | | | | | |
| | | | | | | |
| | 4,975 | | | Altice France SA/France, 144A | | | 5.125% | | | | | | | | | | | | 7/15/29 | | | | B | | | | 4,877,863 | |
| | | | | | | |
| | 3,650 | | | Avaya Inc, 144A | | | 6.125% | | | | | | | | | | | | 9/15/28 | | | | BB | | | | 3,837,865 | |
| | | | | | | |
| | 2,000 | | | DIRECTV Holdings LLC / DIRECTV Financing Co Inc, 144A | | | 5.875% | | | | | | | | | | | | 8/15/27 | | | | BBB– | | | | 2,087,500 | |
| | | | | | | |
| | 1,790 | | | Switch Ltd, 144A | | | 4.125% | | | | | | | | | | | | 6/15/29 | | | | BB | | | | 1,836,987 | |
| | | | | | | |
| | 700 | | | Virgin Media Finance PLC, 144A | | | 5.000% | | | | | | | | | | | | 7/15/30 | | | | B | | | | 717,833 | |
| | | | | | | |
| | 880 | | | Virgin Media Secured Finance PLC, 144A | | | 4.500% | | | | | | | | | | | | 8/15/30 | | | | BB+ | | | | 894,300 | |
21
Nuveen High Yield Income Fund (continued)
Portfolio of Investments September 30, 2021
| | | | | | | | | | | | | | | | | | | | | | | | | | | | |
Principal
Amount (000) | | | Description (1) | | Coupon | | | | | | | | | Maturity | | | Ratings (2) | | | Value | |
| | | |
| | | | Diversified Telecommunication Services (continued) | | | | | | | |
| | | | | | | |
| $ | 3,860 | | | Vmed O2 UK Financing I PLC, 144A | | | 4.750% | | | | | | | | | | | | 7/15/31 | | | | BB+ | | | $ | 3,943,685 | |
| | 17,855 | | | Total Diversified Telecommunication Services | | | | | | | | | | | | 18,196,033 | |
| | | |
| | | | Electric Utilities – 0.8% | | | | | | | |
| | | | | | | |
| | 1,800 | | | Bruce Mansfield Unit 1 2007 Pass Through Trust, (3) | | | 6.850% | | | | | | | | | | | | 6/01/34 | | | | N/R | | | | 2,250 | |
| | | | | | | |
| | 2,725 | | | Edison International | | | 5.375% | | | | | | | | | | | | 9/15/70 | | | | BB+ | | | | 2,817,786 | |
| | | | | | | |
| | 2,245 | | | TerraForm Power Operating LLC, 144A | | | 4.750% | | | | | | | | | | | | 1/15/30 | | | | BB | | | | 2,348,831 | |
| | 6,770 | | | Total Electric Utilities | | | | | | | | | | | | | | | | | | | | | | | 5,168,867 | |
| | | |
| | | | Electronic Equipment, Instruments & Components – 1.3% | | | | | | | |
| | | | | | | |
| | 8,250 | | | Imola Merger Corp, 144A | | | 4.750% | | | | | | | | | | | | 5/15/29 | | | | BB+ | | | | 8,534,778 | |
| | | |
| | | | Energy Equipment & Services – 0.8% | | | | | | | |
| | | | | | | |
| | 3,950 | | | Archrock Partners LP / Archrock Partners Finance Corp, 144A | | | 6.250% | | | | | | | | | | | | 4/01/28 | | | | B+ | | | | 4,085,189 | |
| | | | | | | |
| | 1,625 | | | Genesis Energy LP / Genesis Energy Finance Corp | | | 8.000% | | | | | | | | | | | | 1/15/27 | | | | B1 | | | | 1,645,312 | |
| | 5,575 | | | Total Energy Equipment & Services | | | | | | | | | | | | | | | | | | | | | | | 5,730,501 | |
| | | |
| | | | Equity Real Estate Investment Trust – 2.4% | | | | | | | |
| | | | | | | |
| | 2,500 | | | Diversified Healthcare Trust | | | 4.375% | | | | | | | | | | | | 3/01/31 | | | | BB | | | | 2,418,093 | |
| | | | | | | |
| | 2,000 | | | Iron Mountain Inc, 144A | | | 4.875% | | | | | | | | | | | | 9/15/27 | | | | BB– | | | | 2,076,360 | |
| | | | | | | |
| | 1,850 | | | MPH Acquisition Holdings LLC, 144A, (4) | | | 5.750% | | | | | | | | | | | | 11/01/28 | | | | B– | | | | 1,742,663 | |
| | | | | | | |
| | 1,475 | | | Park Intermediate Holdings LLC / PK Domestic Property LLC / PK Finance Co-Issuer, 144A | | | 4.875% | | | | | | | | | | | | 5/15/29 | | | | B+ | | | | 1,518,107 | |
| | | | | | | |
| | 1,090 | | | RLJ Lodging Trust LP, 144A | | | 3.750% | | | | | | | | | | | | 7/01/26 | | | | BB– | | | | 1,095,450 | |
| | | | | | | |
| | 1,755 | | | RLJ Lodging Trust LP, 144A | | | 4.000% | | | | | | | | | | | | 9/15/29 | | | | BB– | | | | 1,752,262 | |
| | | | | | | |
| | 2,675 | | | Uniti Group LP / Uniti Group Finance Inc / CSL Capital LLC, 144A | | | 4.750% | | | | | | | | | | | | 4/15/28 | | | | BB+ | | | | 2,731,844 | |
| | | | | | | |
| | 2,915 | | | XHR LP, 144A | | | 4.875% | | | | | | | | | | | | 6/01/29 | | | | B1 | | | | 2,993,967 | |
| | 16,260 | | | Total Equity Real Estate Investment Trust | | | | | | | | | | | | | | | | | | | | | | | 16,328,746 | |
| | | |
| | | | Food & Staples Retailing – 1.0% | | | | | | | |
| | | | | | | |
| | 1,000 | | | Chobani LLC / Chobani Finance Corp Inc, 144A | | | 4.625% | | | | | | | | | | | | 11/15/28 | | | | B1 | | | | 1,032,500 | |
| | | | | | | |
| | 1,620 | | | New Albertsons LP | | | 8.000% | | | | | | | | | | | | 5/01/31 | | | | B+ | | | | 1,976,400 | |
| | | | | | | |
| | 3,500 | | | Performance Food Group Inc, 144A | | | 4.250% | | | | | | | | | | | | 8/01/29 | | | | B+ | | | | 3,508,750 | |
| | 6,120 | | | Total Food & Staples Retailing | | | | | | | | | | | | | | | | | | | | | | | 6,517,650 | |
| | | |
| | | | Food Products – 0.2% | | | | | | | |
| | | | | | | |
| | 1,575 | | | Post Holdings Inc, 144A | | | 4.625% | | | | | | | | | | | | 4/15/30 | | | | B+ | | | | 1,587,175 | |
| | | |
| | | | Gas Utilities – 0.1% | | | | | | | |
| | | | | | | |
| | 375 | | | Suburban Propane Partners LP / Suburban Energy Finance Corp, 144A | | | 5.000% | | | | | | | | | | | | 6/01/31 | | | | BB– | | | | 389,063 | |
| | | | | |
| | | | Health Care Equipment & Supplies – 0.5% | | | | | | | | | | | | | |
| | | | | | | |
| | 740 | | | 180 Medical Inc, 144A | | | 3.875% | | | | | | | | | | | | 10/15/29 | | | | BB+ | | | | 746,475 | |
| | | | | | | |
| | 2,000 | | | Mozart Debt Merger Sub Inc, 144A, (WI/DD) | | | 3.875% | | | | | | | | | | | | 4/01/29 | | | | B+ | | | | 2,000,000 | |
22
| | | | | | | | | | | | | | | | | | | | | | | | | | | | |
Principal
Amount (000) | | | Description (1) | | Coupon | | | | | | | | | Maturity | | | Ratings (2) | | | Value | |
| |
| | | | Health Care Equipment & Supplies (continued) | |
| | | | | | | |
| $ | 865 | | | Mozart Debt Merger Sub Inc, 144A, (WI/DD) | | | 5.250% | | | | | | | | | | | | 10/01/29 | | | | B– | | | $ | 865,000 | |
| | 3,605 | | | Total Health Care Equipment & Supplies | | | | | | | | | | | | | | | | | | | | | | | 3,611,475 | |
| | | |
| | | | Health Care Providers & Services – 4.7% | | | | | | | |
| | | | | | | |
| | 1,400 | | | AdaptHealth LLC, 144A | | | 5.125% | | | | | | | | | | | | 3/01/30 | | | | B1 | | | | 1,400,700 | |
| | | | | | | |
| | 1,890 | | | AHP Health Partners Inc, 144A | | | 5.750% | | | | | | | | | | | | 7/15/29 | | | | CCC+ | | | | 1,908,900 | |
| | | | | | | |
| | 4,000 | | | CHS/Community Health Systems Inc, 144A | | | 6.875% | | | | | | | | | | | | 4/15/29 | | | | CCC | | | | 4,009,400 | |
| | | | | | | |
| | 900 | | | Cushman & Wakefield US Borrower LLC, 144A | | | 6.750% | | | | | | | | | | | | 5/15/28 | | | | BB– | | | | 976,500 | |
| | | | | | | |
| | 1,800 | | | DaVita Inc, 144A | | | 4.625% | | | | | | | | | | | | 6/01/30 | | | | Ba3 | | | | 1,851,499 | |
| | | | | | | |
| | 1,750 | | | Global Medical Response Inc, 144A | | | 6.500% | | | | | | | | | | | | 10/01/25 | | | | B | | | | 1,809,063 | |
| | | | | | | |
| | 1,200 | | | HealthEquity Inc, 144A, (WI/DD) | | | 4.500% | | | | | | | | | | | | 10/01/29 | | | | B | | | | 1,218,000 | |
| | | | | | | |
| | 3,075 | | | LifePoint Health Inc, 144A | | | 5.375% | | | | | | | | | | | | 1/15/29 | | | | CCC+ | | | | 2,990,437 | |
| | | | | | | |
| | 4,000 | | | Team Health Holdings Inc, 144A | | | 6.375% | | | | | | | | | | | | 2/01/25 | | | | CCC | | | | 3,865,520 | |
| | | | | | | |
| | 4,500 | | | Tenet Healthcare Corp, 144A | | | 4.625% | | | | | | | | | | | | 6/15/28 | | | | B+ | | | | 4,662,720 | |
| | | | | | | |
| | 6,650 | | | Tenet Healthcare Corp, 144A | | | 6.125% | | | | | | | | | | | | 10/01/28 | | | | B | | | | 6,985,659 | |
| | 31,165 | | | Total Health Care Providers & Services | | | | | | | | | | | | | | | | | | | | | | | 31,678,398 | |
| | | |
| | | | Health Care Technology – 0.3% | | | | | | | |
| | | | | | | |
| | 1,850 | | | MPH Acquisition Holdings LLC, 144A | | | 5.500% | | | | | | | | | | | | 9/01/28 | | | | Ba3 | | | | 1,844,913 | |
| | | |
| | | | Hotels, Restaurants & Leisure – 5.6% | | | | | | | |
| | | | | | | |
| | 1,800 | | | Boyd Gaming Corp, 144A | | | 4.750% | | | | | | | | | | | | 6/15/31 | | | | B | | | | 1,856,250 | |
| | | | | | | |
| | 3,000 | | | Carnival Corp, 144A | | | 5.750% | | | | | | | | | | | | 3/01/27 | | | | B | | | | 3,101,250 | |
| | | | | | | |
| | 1,000 | | | Cedar Fair LP / Canada’s Wonderland Co / Magnum Management Corp / Millennium Op, 144A | | | 5.500% | | | | | | | | | | | | 5/01/25 | | | | Ba2 | | | | 1,038,750 | |
| | | | | | | |
| | 1,225 | | | Churchill Downs Inc, 144A | | | 4.750% | | | | | | | | | | | | 1/15/28 | | | | B+ | | | | 1,281,656 | |
| | | | | | | |
| | 6,245 | | | Cinemark USA Inc, 144A | | | 5.250% | | | | | | | | | | | | 7/15/28 | | | | B | | | | 6,151,325 | |
| | | | | | | |
| | 1,195 | | | Constellation Merger Sub Inc, 144A | | | 8.500% | | | | | | | | | | | | 9/15/25 | | | | CCC– | | | | 1,159,150 | |
| | | | | | | |
| | 2,485 | | | Hilton Grand Vacations Borrower Escrow LLC / Hilton Grand Vacations Borrower Esc, 144A | | | 5.000% | | | | | | | | | | | | 6/01/29 | | | | BB– | | | | 2,534,700 | |
| | | | | | | |
| | 2,000 | | | Life Time Inc, 144A | | | 5.750% | | | | | | | | | | | | 1/15/26 | | | | B– | | | | 2,070,000 | |
| | | | | | | |
| | 4,780 | | | Marriott Ownership Resorts Inc, 144A | | | 4.500% | | | | | | | | | | | | 6/15/29 | | | | B1 | | | | 4,839,750 | |
| | | | | | | |
| | 1,675 | | | Playtika Holding Corp, 144A | | | 4.250% | | | | | | | | | | | | 3/15/29 | | | | B | | | | 1,680,343 | |
| | | | | | | |
| | 3,460 | | | Premier Entertainment Sub LLC / Premier Entertainment Finance Corp, 144A | | | 5.625% | | | | | | | | | | | | 9/01/29 | | | | B3 | | | | 3,494,600 | |
| | | | | | | |
| | 3,460 | | | Premier Entertainment Sub LLC / Premier Entertainment Finance Corp, 144A | | | 5.875% | | | | | | | | | | | | 9/01/31 | | | | B3 | | | | 3,495,628 | |
| | | | | | | |
| | 4,300 | | | Scientific Games International Inc, 144A | | | 8.625% | | | | | | | | | | | | 7/01/25 | | | | B– | | | | 4,656,618 | |
| | 36,625 | | | Total Hotels, Restaurants & Leisure | | | | | | | | | | | | | | | | | | | | | | | 37,360,020 | |
| | | |
| | | | Household Durables – 0.5% | | | | | | | |
| | | | | | | |
| | 3,425 | | | WASH Multifamily Acquisition Inc, 144A | | | 5.750% | | | | | | | | | | | | 4/15/26 | | | | B– | | | | 3,576,471 | |
23
Nuveen High Yield Income Fund (continued)
Portfolio of Investments September 30, 2021
| | | | | | | | | | | | | | | | | | | | | | | | | | | | |
Principal
Amount (000) | | | Description (1) | | Coupon | | | | | | | | | Maturity | | | Ratings (2) | | | Value | |
| | | |
| | | | Household Products – 0.6% | | | | | | | |
| | | | | | | |
| $ | 3,600 | | | Spectrum Brands Inc, 144A | | | 5.000% | | | | | | | | | | | | 10/01/29 | | | | BB | | | $ | 3,870,000 | |
| | | |
| | | | Independent Power & Renewable Electricity Producers – 0.5% | | | | | | | |
| | | | | | | |
| | 1,625 | | | Atlantica Sustainable Infrastructure PLC, 144A | | | 4.125% | | | | | | | | | | | | 6/15/28 | | | | BB+ | | | | 1,679,438 | |
| | | | | | | |
| | 1,890 | | | Clearway Energy Operating LLC, 144A | | | 3.750% | | | | | | | | | | | | 1/15/32 | | | | BB | | | | 1,887,637 | |
| | 3,515 | | | Total Independent Power & Renewable Electricity Producers | | | | | | | | | | | | | | | | | | | | | | | 3,567,075 | |
| | | |
| | | | Industrial Conglomerates – 1.0% | | | | | | | |
| | | | | | | |
| | 1,850 | | | Icahn Enterprises LP / Icahn Enterprises Finance Corp | | | 5.250% | | | | | | | | | | | | 5/15/27 | | | | BB | | | | 1,919,375 | |
| | | | | | | |
| | 4,625 | | | Icahn Enterprises LP / Icahn Enterprises Finance Corp | | | 4.375% | | | | | | | | | | | | 2/01/29 | | | | BB | | | | 4,619,219 | |
| | 6,475 | | | Total Industrial Conglomerates | | | | | | | | | | | | | | | | | | | | | | | 6,538,594 | |
| | | |
| | | | Insurance – 1.2% | | | | | | | |
| | | | | | | |
| | 3,700 | | | Acrisure LLC / Acrisure Finance Inc, 144A | | | 4.250% | | | | | | | | | | | | 2/15/29 | | | | B | | | | 3,658,375 | |
| | | | | | | |
| | 1,100 | | | Alliant Holdings Intermediate LLC / Alliant Holdings Co-Issuer, 144A | | | 4.250% | | | | | | | | | | | | 10/15/27 | | | | B | | | | 1,111,000 | |
| | | | | | | |
| | 1,925 | | | AmWINS Group Inc, 144A | | | 4.875% | | | | | | | | | | | | 6/30/29 | | | | B– | | | | 1,952,046 | |
| | | | | | | |
| | 1,345 | | | Antero Resources Corp, 144A | | | 5.375% | | | | | | | | | | | | 3/01/30 | | | | BB– | | | | 1,416,487 | |
| | 8,070 | | | Total Insurance | | | | | | | | | | | | | | | | | | | | | | | 8,137,908 | |
| | | |
| | | | Interactive Media & Services – 0.4% | | | | | | | |
| | | | | | | |
| | 150 | | | Arches Buyer Inc, 144A | | | 4.250% | | | | | | | | | | | | 6/01/28 | | | | B1 | | | | 152,083 | |
| | | | | | | |
| | 2,750 | | | Rackspace Technology Global Inc, 144A | | | 3.500% | | | | | | | | | | | | 2/15/28 | | | | B+ | | | | 2,654,355 | |
| | 2,900 | | | Total Interactive Media & Services | | | | | | | | 2,806,438 | |
| | | | | | | |
| | | | Internet Software & Services – 0.2% | | | | | | | | | | | | | | | | | | |
| | | | | | | |
| | 1,225 | | | J2 Global Inc, 144A | | | 4.625% | | | | | | | | | | | | 10/15/30 | | | | BB | | | | 1,301,563 | |
| | | | | | | |
| | | | IT Services – 0.9% | | | | | | | | | | | | | | | | | | |
| | | | | | | |
| | 5,895 | | | Ahead DB Holdings LLC, 144A | | | 6.625% | | | | | | | | | | | | 5/01/28 | | | | CCC+ | | | | 5,939,212 | |
| | | | | | | |
| | | | Leisure Products – 0.5% | | | | | | | | | | | | | | | | | | |
| | | | | | | |
| | 3,200 | | | Academy Ltd, 144A | | | 6.000% | | | | | | | | | | | | 11/15/27 | | | | Ba3 | | | | 3,456,000 | |
| | | | | | | |
| | | | Machinery – 0.1% | | | | | | | | | | | | | | | | | | |
| | | | | | | |
| | 385 | | | Roller Bearing Co of America Inc, 144A, (WI/DD) | | | 4.375% | | | | | | | | | | | | 10/15/29 | | | | B+ | | | | 394,625 | |
| | | | | | | |
| | | | Media – 5.7% | | | | | | | | | | | | | | | | | | |
| | | | | | | |
| | 2,025 | | | CCO Holdings LLC / CCO Holdings Capital Corp, 144A | | | 4.500% | | | | | | | | | | | | 8/15/30 | | | | BB+ | | | | 2,089,233 | |
| | | | | | | |
| | 5,650 | | | CCO Holdings LLC / CCO Holdings Capital Corp | | | 4.500% | | | | | | | | | | | | 5/01/32 | | | | BB+ | | | | 5,819,500 | |
| | | | | | | |
| | 3,120 | | | Clear Channel Outdoor Holdings Inc, 144A | | | 7.500% | | | | | | | | | | | | 6/01/29 | | | | CCC | | | | 3,244,800 | |
| | | | | | | |
| | 1,600 | | | CSC Holdings LLC, 144A | | | 5.750% | | | | | | | | | | | | 1/15/30 | | | | B+ | | | | 1,626,760 | |
| | | | | | | |
| | 2,750 | | | DISH DBS Corp | | | 7.375% | | | | | | | | | | | | 7/01/28 | | | | B2 | | | | 2,916,306 | |
| | | | | | | |
| | 2,800 | | | Getty Images Inc, 144A | | | 9.750% | | | | | | | | | | | | 3/01/27 | | | | CCC+ | | | | 2,982,000 | |
| | | | | | | |
| | 1,800 | | | Houghton Mifflin Harcourt Publishers Inc, 144A | | | 9.000% | | | | | | | | | | | | 2/15/25 | | | | BB+ | | | | 1,914,390 | |
| | | | | | | |
| | 4 | | | iHeartCommunications Inc | | | 6.375% | | | | | | | | | | | | 5/01/26 | | | | B+ | | | | 4,683 | |
| | | | | | | |
| | 1,900 | | | iHeartCommunications Inc | | | 8.375% | | | | | | | | | | | | 5/01/27 | | | | CCC+ | | | | 2,030,625 | |
24
| | | | | | | | | | | | | | | | | | | | | | | | | | | | |
Principal
Amount (000) | | | Description (1) | | Coupon | | | | | | | | | Maturity | | | Ratings (2) | | | Value | |
| | | | | | | |
| | | | Media (continued) | | | | | | | | | | | | | | | | | | |
| | | | | | | |
| $ | 2,420 | | | iHeartCommunications Inc, 144A | | | 4.750% | | | | | | | | | | | | 1/15/28 | | | | B+ | | | $ | 2,493,810 | |
| | | | | | | |
| | 3,400 | | | LCPR Senior Secured Financing DAC, 144A | | | 5.125% | | | | | | | | | | | | 7/15/29 | | | | BB+ | | | | 3,501,830 | |
| | | | | | | |
| | 3,270 | | | Sirius XM Radio Inc, 144A | | | 4.000% | | | | | | | | | | | | 7/15/28 | | | | BB | | | | 3,325,181 | |
| | | | | | | |
| | 4,500 | | | Univision Communications Inc, 144A | | | 4.500% | | | | | | | | | | | | 5/01/29 | | | | B1 | | | | 4,573,125 | |
| | | | | | | |
| | 1,800 | | | Virgin Media Secured Finance PLC, 144A | | | 5.500% | | | | | | | | | | | | 5/15/29 | | | | BB+ | | | | 1,897,200 | |
| | 37,039 | | | Total Media | | | | | | | | | | | | | | | | | | | | | | | 38,419,443 | |
| | | |
| | | | Metals & Mining – 1.3% | | | | | | | |
| | | | | | | |
| | 1,660 | | | Allegheny Technologies Inc | | | 4.875% | | | | | | | | | | | | 10/01/29 | | | | B | | | | 1,666,225 | |
| | | | | | | |
| | 1,400 | | | Allegheny Technologies Inc | | | 5.125% | | | | | | | | | | | | 10/01/31 | | | | B | | | | 1,410,780 | |
| | | | | | | |
| | 2,000 | | | First Quantum Minerals Ltd, 144A | | | 6.875% | | | | | | | | | | | | 10/15/27 | | | | B | | | | 2,115,000 | |
| | | | | | | |
| | 1,868 | | | Joseph T Ryerson & Son Inc, 144A | | | 8.500% | | | | | | | | | | | | 8/01/28 | | | | B | | | | 2,071,145 | |
| | | | | | | |
| | 1,715 | | | United States Steel Corp, (4) | | | 6.250% | | | | | | | | | | | | 3/15/26 | | | | B3 | | | | 1,768,594 | |
| | 8,643 | | | Total Metals & Mining | | | | | | | | | | | | | | | | | | | | | | | 9,031,744 | |
| | | |
| | | | Mortgage Real Estate Investment Trust – 0.5% | | | | | | | |
| | | | | | | |
| | 3,110 | | | Starwood Property Trust Inc, 144A | | | 3.625% | | | | | | | | | | | | 7/15/26 | | | | BB+ | | | | 3,133,325 | |
| | | | | | | |
| | | | Oil, Gas & Consumable Fuels – 11.1% | | | | | | | | | | | | | | | | | | |
| | | | | | | |
| | 1,700 | | | Antero Midstream Partners LP / Antero Midstream Finance Corp, 144A | | | 7.875% | | | | | | | | | | | | 5/15/26 | | | | BB– | | | | 1,858,865 | |
| | | | | | | |
| | 1,835 | | | Antero Midstream Partners LP / Antero Midstream Finance Corp, 144A | | | 5.375% | | | | | | | | | | | | 6/15/29 | | | | BB– | | | | 1,890,050 | |
| | | | | | | |
| | 750 | | | Antero Resources Corp, (4) | | | 5.000% | | | | | | | | | | | | 3/01/25 | | | | BB– | | | | 768,188 | |
| | | | | | | |
| | 1,203 | | | Antero Resources Corp, 144A | | | 8.375% | | | | | | | | | | | | 7/15/26 | | | | BB– | | | | 1,362,674 | |
| | | | | | | |
| | 1,350 | | | Buckeye Partners LP, 144A | | | 4.125% | | | | | | | | | | | | 3/01/25 | | | | BB | | | | 1,398,951 | |
| | | | | | | |
| | 3,750 | | | Calumet Specialty Products Partners LP / Calumet Finance Corp, (4) | | | 7.750% | | | | | | | | | | | | 4/15/23 | | | | B– | | | | 3,717,187 | |
| | | | | | | |
| | 2,645 | | | Cheniere Energy Partners LP, 144A | | | 3.250% | | | | | | | | | | | | 1/31/32 | | | | BB+ | | | | 2,653,729 | |
| | | | | | | |
| | 1,530 | | | CNX Midstream Partners LP, 144A | | | 4.750% | | | | | | | | | | | | 4/15/30 | | | | BB– | | | | 1,553,677 | |
| | | | | | | |
| | 4,050 | | | Crestwood Midstream Partners LP / Crestwood Midstream Finance Corp, 144A | | | 6.000% | | | | | | | | | | | | 2/01/29 | | | | BB– | | | | 4,237,871 | |
| | | | | | | |
| | 2,060 | | | DT Midstream Inc, 144A | | | 4.125% | | | | | | | | | | | | 6/15/29 | | | | BB+ | | | | 2,088,964 | |
| | | | | | | |
| | 550 | | | DT Midstream Inc, 144A | | | 4.375% | | | | | | | | | | | | 6/15/31 | | | | BB+ | | | | 566,500 | |
| | | | | | | |
| | 2,900 | | | Energean Israel Finance Ltd, 144A, Reg S | | | 5.875% | | | | | | | | | | | | 3/30/31 | | | | BB– | | | | 2,980,356 | |
| | | | | | | |
| | 2,600 | | | Energy Transfer LP | | | 6.500% | | | | | | | | | | | | 11/15/69 | | | | BB | | | | 2,707,562 | |
| | | | | | | |
| | 2,350 | | | EnLink Midstream LLC, 144A | | | 5.625% | | | | | | | | | | | | 1/15/28 | | | | BB+ | | | | 2,502,139 | |
| | | | | | | |
| | 440 | | | EQM Midstream Partners LP, 144A | | | 6.500% | | | | | | | | | | | | 7/01/27 | | | | BB | | | | 494,890 | |
| | | | | | | |
| | 3,075 | | | EQM Midstream Partners LP, 144A | | | 4.750% | | | | | | | | | | | | 1/15/31 | | | | BB | | | | 3,198,061 | |
| | | | | | | |
| | 1,800 | | | Hess Midstream Operations LP, 144A | | | 5.125% | | | | | | | | | | | | 6/15/28 | | | | BB+ | | | | 1,880,190 | |
| | | | | | | |
| | 575 | | | Hilcorp Energy I LP / Hilcorp Finance Co, 144A | | | 5.750% | | | | | | | | | | | | 2/01/29 | | | | BB– | | | | 590,813 | |
| | | | | | | |
| | 550 | | | Hilcorp Energy I LP / Hilcorp Finance Co, 144A | | | 6.000% | | | | | | | | | | | | 2/01/31 | | | | BB– | | | | 565,125 | |
| | | | | | | |
| | 1,975 | | | MEG Energy Corp, 144A | | | 5.875% | | | | | | | | | | | | 2/01/29 | | | | BB– | | | | 2,019,438 | |
25
Nuveen High Yield Income Fund (continued)
Portfolio of Investments September 30, 2021
| | | | | | | | | | | | | | | | | | | | | | | | | | | | |
Principal
Amount (000) | | | Description (1) | | Coupon | | | | | | | | | Maturity | | | Ratings (2) | | | Value | |
| | | | | | |
| | | | Oil, Gas & Consumable Fuels (continued) | | | | | | | | | | | | | | | | |
| | | | | | | |
| $ | 1,850 | | | Murphy Oil Corp | | | 6.375% | | | | | | | | | | | | 7/15/28 | | | | BB+ | | | $ | 1,956,375 | |
| | | | | | | |
| | 1,850 | | | Murphy Oil Corp, (4) | | | 7.050% | | | | | | | | | | | | 5/01/29 | | | | BB+ | | | | 2,077,726 | |
| | | | | | | |
| | 3,150 | | | New Fortress Energy Inc, 144A | | | 6.500% | | | | | | | | | | | | 9/30/26 | | | | BB– | | | | 3,012,187 | |
| | | | | | | |
| | 2,800 | | | NGL Energy Operating LLC / NGL Energy Finance Corp, 144A | | | 7.500% | | | | | | | | | | | | 2/01/26 | | | | BB– | | | | 2,852,500 | |
| | | | | | | |
| | 1,150 | | | NuStar Logistics LP | | | 6.375% | | | | | | | | | | | | 10/01/30 | | | | BB– | | | | 1,265,000 | |
| | | | | | | |
| | 3,600 | | | Occidental Petroleum Corp | | | 5.875% | | | | | | | | | | | | 9/01/25 | | | | BB | | | | 4,034,700 | |
| | | | | | | |
| | 675 | | | Occidental Petroleum Corp | | | 5.500% | | | | | | | | | | | | 12/01/25 | | | | BB | | | | 747,563 | |
| | | | | | | |
| | 2,750 | | | Occidental Petroleum Corp | | | 6.375% | | | | | | | | | | | | 9/01/28 | | | | BB | | | | 3,217,500 | |
| | | | | | | |
| | 5,700 | | | Occidental Petroleum Corp | | | 8.875% | | | | | | | | | | | | 7/15/30 | | | | BB | | | | 7,743,051 | |
| | | | | | | |
| | 750 | | | PBF Holding Co LLC / PBF Finance Corp, 144A | | | 9.250% | | | | | | | | | | | | 5/15/25 | | | | BB | | | | 710,625 | |
| | | | | | | |
| | 1,400 | | | SM Energy Co | | | 5.625% | | | | | | | | | | | | 6/01/25 | | | | B | | | | 1,408,022 | |
| | | | | | | |
| | 620 | | | SM Energy Co, (4) | | | 6.500% | | | | | | | | | | | | 7/15/28 | | | | B | | | | 641,898 | |
| | | | | | | |
| | 1,850 | | | Southwestern Energy Co | | | 5.375% | | | | | | | | | | | | 3/15/30 | | | | BB | | | | 1,996,566 | |
| | | | | | | |
| | 2,145 | | | SunCoke Energy Inc, 144A | | | 4.875% | | | | | | | | | | | | 6/30/29 | | | | BB | | | | 2,136,956 | |
| | | | | | | |
| | 1,285 | | | Western Midstream Operating LP | | | 5.300% | | | | | | | | | | | | 2/01/30 | | | | BB+ | | | | 1,419,925 | |
| | 69,263 | | | Total Oil, Gas & Consumable Fuels | | | | | | | | | | | | | | | | | | | | | | | 74,255,824 | |
| | | |
| | | | Personal Products – 0.7% | | | | | | | |
| | | | | | | |
| | 4,900 | | | Coty Inc, 144A | | | 5.000% | | | | | | | | | | | | 4/15/26 | | | | B1 | | | | 5,005,497 | |
| | | | | | | |
| | | | Pharmaceuticals – 2.7% | | | | | | | | | | | | | | | | | | |
| | | | | | | |
| | 2,750 | | | Bausch Health Americas Inc, 144A | | | 9.250% | | | | | | | | | | | | 4/01/26 | | | | B | | | | 2,936,931 | |
| | | | | | | |
| | 2,750 | | | Bausch Health Cos Inc, 144A | | | 5.000% | | | | | | | | | | | | 1/30/28 | | | | B | | | | 2,608,980 | |
| | | | | | | |
| | 2,750 | | | Bausch Health Cos Inc, 144A | | | 7.250% | | | | | | | | | | | | 5/30/29 | | | | B | | | | 2,818,338 | |
| | | | | | | |
| | 950 | | | Endo Luxembourg Finance Co I Sarl / Endo US Inc, 144A | | | 6.125% | | | | | | | | | | | | 4/01/29 | | | | B– | | | | 950,000 | |
| | | | | | | |
| | 2,775 | | | ORGANON & CO/ORG, 144A | | | 4.125% | | | | | | | | | | | | 4/30/28 | | | | BB | | | | 2,830,500 | |
| | | | | | | |
| | 5,750 | | | ORGANON & CO/ORG, 144A | | | 5.125% | | | | | | | | | | | | 4/30/31 | | | | BB– | | | | 6,039,512 | |
| | 17,725 | | | Total Pharmaceuticals | | | | | | | | | | | | | | | | | | | | | | | 18,184,261 | |
| | | |
| | | | Professional Services – 0.1% | | | | | | | |
| | | | | | | |
| | 800 | | | ASGN Inc, 144A | | | 4.625% | | | | | | | | | | | | 5/15/28 | | | | BB– | | | | 828,000 | |
| |
| | | | Real Estate Management & Development – 1.3% | |
| | | | | | | |
| | 3,000 | | | Hunt Cos Inc, 144A | | | 5.250% | | | | | | | | | | | | 4/15/29 | | | | BB– | | | | 2,940,000 | |
| | | | | | | |
| | 1,675 | | | Kennedy-Wilson Inc | | | 4.750% | | | | | | | | | | | | 3/01/29 | | | | BB | | | | 1,704,313 | |
| | | | | | | |
| | 1,750 | | | Kennedy-Wilson Inc | | | 5.000% | | | | | | | | | | | | 3/01/31 | | | | BB | | | | 1,789,375 | |
| | | | | | | |
| | 2,350 | | | Realogy Group LLC / Realogy Co-Issuer Corp, 144A | | | 9.375% | | | | | | | | | | | | 4/01/27 | | | | B | | | | 2,582,062 | |
| | 8,775 | | | Total Real Estate Management & Development | | | | | | | | | | | | 9,015,750 | |
| | | |
| | | | Road & Rail – 0.2% | | | | | | | |
| | | | | | | |
| | 1,335 | | | First Student Bidco Inc / First Transit Parent Inc, 144A | | | 4.000% | | | | | | | | | | | | 7/31/29 | | | | BB+ | | | | 1,316,644 | |
| | | | | | | |
| | | | Software – 1.3% | | | | | | | | | | | | | | | | | | |
| | | | | | | |
| | 1,800 | | | Camelot Finance SA, 144A | | | 4.500% | | | | | | | | | | | | 11/01/26 | | | | B1 | | | | 1,869,750 | |
26
| | | | | | | | | | | | | | | | | | | | | | | | | | | | |
Principal
Amount (000) | | | Description (1) | | Coupon | | | | | | | | | Maturity | | | Ratings (2) | | | Value | |
| | | | | | | |
| | | | Software (continued) | | | | | | | | | | | | | | | | | | |
| | | | | | | |
| $ | 3,300 | | | Elastic NV, 144A | | | 4.125% | | | | | | | | | | | | 7/15/29 | | | | B+ | | | $ | 3,316,500 | |
| | | | | | | |
| | 3,875 | | | Rocket Software Inc, 144A | | | 6.500% | | | | | | | | | | | | 2/15/29 | | | | CCC | | | | 3,836,250 | |
| | 8,975 | | | Total Software | | | | | | | | | | | | | | | | | | | | | | | 9,022,500 | |
| | | |
| | | | Specialty Retail – 2.2% | | | | | | | |
| | | | | | | |
| | 2,425 | | | Ferrellgas LP / Ferrellgas Finance Corp, 144A | | | 5.375% | | | | | | | | | | | | 4/01/26 | | | | B– | | | | 2,370,183 | |
| | | | | | | |
| | 2,650 | | | Ferrellgas LP / Ferrellgas Finance Corp, 144A | | | 5.875% | | | | | | | | | | | | 4/01/29 | | | | B– | | | | 2,570,500 | |
| | | | | | | |
| | 2,825 | | | LCM Investments Holdings II LLC, 144A | | | 4.875% | | | | | | | | | | | | 5/01/29 | | | | BB– | | | | 2,898,648 | |
| | | | | | | |
| | 365 | | | LCM Investments Holdings II LLC, 144A | | | 4.875% | | | | | | | | | | | | 5/01/29 | | | | BB– | | | | 374,516 | |
| | | | | | | |
| | 2,575 | | | Michaels Cos Inc, 144A | | | 5.250% | | | | | | | | | | | | 5/01/28 | | | | Ba3 | | | | 2,656,112 | |
| | | | | | | |
| | 1,875 | | | Michaels Cos Inc, 144A | | | 7.875% | | | | | | | | | | | | 5/01/29 | | | | B3 | | | | 1,948,547 | |
| | | | | | | |
| | 300 | | | PetSmart Inc / PetSmart Finance Corp, 144A | | | 4.750% | | | | | | | | | | | | 2/15/28 | | | | BB– | | | | 308,250 | |
| | | | | | | |
| | 1,675 | | | Superior Plus LP / Superior General Partner Inc, 144A | | | 4.500% | | | | | | | | | | | | 3/15/29 | | | | BB– | | | | 1,729,437 | |
| | 14,690 | | | Total Specialty Retail | | | | | | | | | | | | | | | | | | | | | | | 14,856,193 | |
| | | |
| | | | Technology Hardware, Storage & Peripherals – 0.9% | | | | | | | |
| | | | | | | |
| | 1,880 | | | Diebold Nixdorf Inc, (4) | | | 8.500% | | | | | | | | | | | | 4/15/24 | | | | Caa1 | | | | 1,919,950 | |
| | | | | | | |
| | 1,825 | | | Diebold Nixdorf Inc, 144A | | | 9.375% | | | | | | | | | | | | 7/15/25 | | | | B2 | | | | 1,997,243 | |
| | | | | | | |
| | 2,000 | | | NCR Corp, 144A | | | 5.125% | | | | | | | | | | | | 4/15/29 | | | | N/R | | | | 2,062,500 | |
| | 5,705 | | | Total Technology Hardware, Storage & Peripherals | | | | | | | | 5,979,693 | |
| | | |
| | | | Textiles, Apparel & Luxury Goods – 0.3% | | | | | | | |
| | | | | | | |
| | 2,180 | | | Wolverine World Wide Inc, 144A | | | 4.000% | | | | | | | | | | | | 8/15/29 | | | | BB | | | | 2,201,800 | |
| $ | 467,188 | | | Total Corporate Bonds (cost $469,247,535) | | | | | | | | 479,496,416 | |
| | | | | | | |
Principal
Amount (000) | | | Description (1) | | Coupon (5) | | | Reference
Rate (5) | | | Spread (5) | | | Maturity (6) | | | Ratings (2) | | | Value | |
| | | | |
| | | | VARIABLE RATE SENIOR LOAN INTERESTS – 23.1% (5) | | | | | | | | | | | | | |
| | | |
| | | | Airlines – 0.6% | | | | | | | |
| | | | | | | |
| $ | 3,700 | | | Air Canada, Term Loan B | | | 4.250% | | | | 3-Month LIBOR | | | | 3.500% | | | | 8/11/28 | | | | Ba2 | | | $ | 3,720,036 | |
| | | | | | | |
| | | | Auto Components – 0.7% | | | | | | | | | | | | | | | | | | |
| | | | | | | |
| | 3,000 | | | Clarios Global LP, Term Loan B | | | 3.337% | | | | 1-Month LIBOR | | | | 3.250% | | | | 4/30/26 | | | | B1 | | | | 2,990,442 | |
| | | | | | | |
| | 1,791 | | | Truck Hero, Inc., Term Loan B | | | 4.000% | | | | 1-Month LIBOR | | | | 3.250% | | | | 2/24/28 | | | | B2 | | | | 1,789,504 | |
| | 4,791 | | | Total Auto Components | | | | | | | | | | | | | | | | | | | | | | | 4,779,946 | |
| | | |
| | | | Banks – 0.1% | | | | | | | |
| | | | | | | |
| | 349 | | | iQor US Inc., Exit Term Loan | | | 8.500% | | | | 1-Month LIBOR | | | | 7.500% | | | | 9/15/27 | | | | N/R | | | | 358,261 | |
| | | |
| | | | Beverages – 0.5% | | | | | | | |
| | | | | | | |
| | 3,675 | | | Triton Water Holdings, Inc, Term Loan | | | 4.000% | | | | 3-Month LIBOR | | | | 3.500% | | | | 3/31/28 | | | | B1 | | | | 3,674,570 | |
| | | |
| | | | Building Products – 0.4% | | | | | | | |
| | | | | | | |
| | 2,580 | | | White Cap Buyer LLC, Term Loan B | | | 4.500% | | | | 1-Month LIBOR | | | | 4.000% | | | | 10/19/27 | | | | B | | | | 2,590,022 | |
27
Nuveen High Yield Income Fund (continued)
Portfolio of Investments September 30, 2021
| | | | | | | | | | | | | | | | | | | | | | | | | | | | |
Principal
Amount (000) | | | Description (1) | | Coupon (5) | | | Reference
Rate (5) | | | Spread (5) | | | Maturity (6) | | | Ratings (2) | | | Value | |
| | | |
| | | | Chemicals – 0.1% | | | | | | | |
| | | | | | | |
| $ | 600 | | | Diamond BC BV, Term Loan, (WI/DD) | | | TBD | | | | TBD | | | | TBD | | | | TBD | | | | Ba3 | | | $ | 601,206 | |
| | | |
| | | | Commercial Services & Supplies – 2.4% | | | | | | | |
| | | | | | | |
| | 2,288 | | | Amentum Government Services Holdings LLC, Term Loan B | | | 3.584% | | | | 1-Month LIBOR | | | | 3.500% | | | | 1/31/27 | | | | B1 | | | | 2,290,324 | |
| | | | | | | |
| | 2,682 | | | Prime Security Services Borrower, LLC, Term Loan | | | 3.500% | | | | 1-Month LIBOR | | | | 2.750% | | | | 9/23/26 | | | | BB- | | | | 2,682,145 | |
| | | | | | | |
| | 3,506 | | | Prime Security Services Borrower, LLC, Term Loan | | | 3.500% | | | | 6-Month LIBOR | | | | 2.750% | | | | 9/23/26 | | | | BB- | | | | 3,506,047 | |
| | | | | | | |
| | 3,506 | | | Prime Security Services Borrower, LLC, Term Loan | | | 3.500% | | | | 12-Month LIBOR | | | | 2.750% | | | | 9/23/26 | | | | BB- | | | | 3,506,047 | |
| | | | | | | |
| | 4,264 | | | Spin Holdco Inc., Term Loan | | | 4.750% | | | | 3-Month LIBOR | | | | 4.000% | | | | 3/04/28 | | | | B- | | | | 4,281,029 | |
| | 16,246 | | | Total Commercial Services & Supplies | | | | | | | | | | | | | | | | | | | | 16,265,592 | |
| | | |
| | | | Communications Equipment – 0.4% | | | | | | | |
| | | | | | | |
| | 2,736 | | | CommScope, Inc., Term Loan B | | | 3.336% | | | | 1-Month LIBOR | | | | 3.250% | | | | 4/04/26 | | | | Ba3 | | | | 2,727,778 | |
| | | |
| | | | Diversified Financial Services – 0.9% | | | | | | | |
| | | | | | | |
| | 1,841 | | | Getty Images, Inc., Term Loan B | | | 4.625% | | | | 1-Month LIBOR | | | | 4.500% | | | | 2/19/26 | | | | B2 | | | | 1,843,121 | |
| | | | | | | |
| | 3,978 | | | Verscend Holding Corp., Term Loan B | | | 4.084% | | | | 1-Month LIBOR | | | | 4.000% | | | | 8/27/25 | | | | BB- | | | | 3,988,964 | |
| | 5,819 | | | Total Diversified Financial Services | | | | | | | | | | | | | | | | | | | | 5,832,085 | |
| | | |
| | | | Food & Staples Retailing – 0.4% | | | | | | | |
| | | | | | | |
| | 2,351 | | | H Food Holdings LLC, Term Loan B | | | 3.772% | | | | 1-Month LIBOR | | | | 3.688% | | | | 5/31/25 | | | | B2 | | | | 2,347,971 | |
| | | | | | | |
| | 137 | | | H Food Holdings LLC, Term Loan B3 | | | 6.000% | | | | 1-Month LIBOR | | | | 5.000% | | | | 5/31/25 | | | | B2 | | | | 137,261 | |
| | 2,488 | | | Total Food & Staples Retailing | | | | | | | | | | | | | | | | | | | | 2,485,232 | |
| | | |
| | | | Health Care Providers & Services – 2.2% | | | | | | | |
| | | | | | | |
| | 2,786 | | | Air Methods Corporation, Term Loan B | | | 4.500% | | | | 3-Month LIBOR | | | | 3.500% | | | | 4/21/24 | | | | B | | | | 2,767,168 | |
| | | | | | | |
| | 4,650 | | | RegionalCare Hospital Partners Holdings, Inc., Term Loan B | | | 3.835% | | | | 1-Month LIBOR | | | | 3.750% | | | | 11/16/25 | | | | B1 | | | | 4,649,186 | |
| | | | | | | |
| | 5,030 | | | Surgery Center Holdings, Inc., Term Loan | | | 4.500% | | | | 1-Month LIBOR | | | | 3.750% | | | | 8/31/26 | | | | B1 | | | | 5,044,575 | |
| | | | | | | |
| | 2,010 | | | US Radiology Specialists, Inc., Term Loan | | | 5.632% | | | | 3-Month LIBOR | | | | 5.500% | | | | 12/15/27 | | | | B- | | | | 2,021,741 | |
| | 14,476 | | | Total Health Care Providers & Services | | | | | | | | | | | | | | | | | | | | 14,482,670 | |
| | | |
| | | | Hotels, Restaurants & Leisure – 1.5% | | | | | | | |
| | | | | | | |
| | 371 | | | 24 Hour Fitness Worldwide, Inc., Exit Term Loan, (cash 1.000%, PIK 5.000%) | | | 5.132% | | | | 3-Month LIBOR | | | | 5.000% | | | | 12/29/25 | | | | B3 | | | | 322,818 | |
| | | | | | | |
| | 138 | | | All Day AcquisitionCo LLC, Term Loan | | | 5.132% | | | | 3-Month LIBOR | | | | 5.000% | | | | 9/29/26 | | | | N/R | | | | 124,001 | |
| | | | | | | |
| | 889 | | | Carnival Corporation, Term Loan B | | | 3.750% | | | | 1-Month LIBOR | | | | 3.000% | | | | 6/30/25 | | | | Ba2 | | | | 885,697 | |
| | | | | | | |
| | 2,778 | | | ClubCorp Holdings, Inc., Term Loan B | | | 2.882% | | | | 3-Month LIBOR | | | | 2.750% | | | | 9/18/24 | | | | B- | | | | 2,617,399 | |
| | | | | | | |
| | 1,850 | | | Hilton Grand Vacations Borrower LLC, Term Loan B | | | 3.500% | | | | 1-Month LIBOR | | | | 3.000% | | | | 8/02/28 | | | | Ba1 | | | | 1,856,475 | |
| | | | | | | |
| | 2,357 | | | IRB Holding Corp, Term Loan | | | 4.250% | | | | 3-Month LIBOR | | | | 3.250% | | | | 12/15/27 | | | | B | | | | 2,363,634 | |
| | | | | | | |
| | 1,841 | | | Life Time Fitness Inc , Term Loan B | | | 5.750% | | | | 3-Month LIBOR | | | | 4.750% | | | | 12/15/24 | | | | B- | | | | 1,857,220 | |
| | 10,224 | | | Total Hotels, Restaurants & Leisure | | | | | | | | | | | | | | | | | | | | 10,027,244 | |
| | | |
| | | | Household Durables – 0.5% | | | | | | | |
| | | | | | | |
| | 2,026 | | | Apex Tool Group, LLC, Term Loan B | | | 6.500% | | | | 1-Month LIBOR | | | | 5.250% | | | | 8/21/24 | | | | B3 | | | | 2,031,154 | |
| | | | | | | |
| | 1,228 | | | Weber-Stephen Products LLC, Term Loan B | | | 4.000% | | | | 1-Month LIBOR | | | | 3.250% | | | | 10/30/27 | | | | B1 | | | | 1,232,521 | |
| | | | | | | |
| | 37 | | | Weber-Stephen Products LLC, Term Loan B | | | 4.000% | | | | 6-Month LIBOR | | | | 3.250% | | | | 10/30/27 | | | | B1 | | | | 37,201 | |
| | 3,291 | | | Total Household Durables | | | | | | | | | | | | | | | | | | | | 3,300,876 | |
28
| | | | | | | | | | | | | | | | | | | | | | | | | | | | |
Principal
Amount (000) | | | Description (1) | | Coupon (5) | | | Reference
Rate (5) | | | Spread (5) | | | Maturity (6) | | | Ratings (2) | | | Value | |
| | | |
| | | | Interactive Media & Services – 0.6% | | | | | | | |
| | | | | | | |
| $ | 4,371 | | | Arches Buyer Inc., Term Loan B | | | 3.750% | | | | 1-Month LIBOR | | | | 3.250% | | | | 12/06/27 | | | | B1 | | | $ | 4,354,261 | |
| | | |
| | | | Internet & Direct Marketing Retail – 0.2% | | | | | | | |
| | | | | | | |
| | 1,343 | | | CNT Holdings I Corp, Term Loan | | | 4.500% | | | | 3-Month LIBOR | | | | 3.750% | | | | 11/08/27 | | | | B | | | | 1,346,333 | |
| | | |
| | | | IT Services – 2.0% | | | | | | | |
| | | | | | | |
| | 2,736 | | | DTI Holdco, Inc., Term Loan B | | | 5.750% | | | | 3-Month LIBOR | | | | 4.750% | | | | 9/30/23 | | | | CCC+ | | | | 2,709,092 | |
| | | | | | | |
| | 4,338 | | | Intrado Corporation, Term Loan | | | 4.743% | | | | 3-Month LIBOR | | | | 4.000% | | | | 10/10/24 | | | | B2 | | | | 4,281,383 | |
| | | | | | | |
| | 6,389 | | | Syniverse Holdings, Inc., Term Loan, First Lien | | | 6.000% | | | | 3-Month LIBOR | | | | 5.000% | | | | 3/09/23 | | | | CCC+ | | | | 6,398,047 | |
| | 13,463 | | | Total IT Services | | | | | | | | | | | | | | | | | | | | 13,388,522 | |
| | | |
| | | | Machinery – 0.3% | | | | | | | |
| | | | | | | |
| | 1,227 | | | Alliance Laundry Systems LLC, Term Loan B | | | 4.250% | | | | 3-Month LIBOR | | | | 3.500% | | | | 10/08/27 | | | | B | | | | 1,230,515 | |
| | | | | | | |
| | 980 | | | Blount International Inc., Term Loan B | | | 4.750% | | | | 1-Month LIBOR | | | | 3.750% | | | | 4/12/23 | | | | B2 | | | | 982,633 | |
| | 2,207 | | | Total Machinery | | | | | | | | | | | | | | | | | | | | 2,213,148 | |
| | | |
| | | | Media – 1.7% | | | | | | | |
| | | | | | | |
| | 422 | | | Cablevision Lightpath LLC, Term Loan B | | | 3.750% | | | | 1-Month LIBOR | | | | 3.250% | | | | 12/01/27 | | | | B+ | | | | 422,761 | |
| | | | | | | |
| | 5,079 | | | Clear Channel Outdoor Holdings, Inc., Term Loan B | | | 3.629% | | | | 3-Month LIBOR | | | | 3.500% | | | | 8/21/26 | | | | B1 | | | | 4,981,934 | |
| | | | | | | |
| | 3,925 | | | DirecTV Financing, LLC, Term Loan | | | 5.750% | | | | 3-Month LIBOR | | | | 5.000% | | | | 8/02/27 | | | | BBB- | | | | 3,931,947 | |
| | | | | | | |
| | 1,774 | | | GCI Holdings, Inc., Term Loan B | | | 3.500% | | | | 1-Month LIBOR | | | | 2.750% | | | | 10/15/25 | | | | BB | | | | 1,774,653 | |
| | | | | | | |
| | 273 | | | Radiate Holdco, LLC, Term Loan | | | 4.250% | | | | 1-Month LIBOR | | | | 3.500% | | | | 9/25/26 | | | | B1 | | | | 273,017 | |
| | 11,473 | | | Total Media | | | | | | | | | | | | | | | | | | | | 11,384,312 | |
| | | |
| | | | Oil, Gas & Consumable Fuels – 0.2% | | | | | | | |
| | | | | | | |
| | 1,266 | | | QuarterNorth Energy Holding Inc., Exit Term Loan, Second Lien | | | 9.000% | | | | 3-Month LIBOR | | | | 8.000% | | | | 8/27/26 | | | | B | | | | 1,274,074 | |
| | | |
| | | | Paper & Forest Products – 0.5% | | | | | | | |
| | | | | | | |
| | 3,085 | | | Sylvamo Corp, Term Loan, (WI/DD) | | | TBD | | | | TBD | | | | TBD | | | | TBD | | | | BB+ | | | | 3,081,144 | |
| | | |
| | | | Personal Products – 1.3% | | | | | | | |
| | | | | | | |
| | 3,002 | | | Kronos Acquisition Holdings Inc., Term Loan B | | | 3.834% | | | | 1-Month LIBOR | | | | 3.750% | | | | 12/22/26 | | | | B2 | | | | 2,936,382 | |
| | | | | | | |
| | 7,252 | | | Revlon Consumer Products Corporation, Term Loan B, (7) | | | 4.250% | | | | 3-Month LIBOR | | | | 3.500% | | | | 9/07/23 | | | | CC | | | | 5,910,149 | |
| | 10,254 | | | Total Personal Products | | | | | | | | | | | | | | | | | | | | 8,846,531 | |
| | | |
| | | | Pharmaceuticals – 1.8% | | | | | | | |
| | | | | | | |
| | 3,936 | | | Bausch Health Companies Inc., Term Loan B | | | 3.084% | | | | 1-Month LIBOR | | | | 3.000% | | | | 6/02/25 | | | | BB | | | | 3,935,391 | |
| | | | | | | |
| | 8,434 | | | Jazz Financing Lux S.a.r.l., Term Loan | | | 4.000% | | | | 1-Month LIBOR | | | | 3.500% | | | | 5/05/28 | | | | BB+ | | | | 8,454,989 | |
| | 12,370 | | | Total Pharmaceuticals | | | | | | | | | | | | | | | | | | | | 12,390,380 | |
| | | |
| | | | Software – 2.6% | | | | | | | |
| | | | | | | |
| | 3,138 | | | Blackboard, Inc., Term Loan B5 | | | 7.000% | | | | 3-Month LIBOR | | | | 6.000% | | | | 6/30/24 | | | | B1 | | | | 3,160,695 | |
| | | | | | | |
| | 943 | | | Camelot U.S. Acquisition 1 Co., Term Loan B | | | 4.000% | | | | 1-Month LIBOR | | | | 3.000% | | | | 10/31/26 | | | | B1 | | | | 946,265 | |
| | | | | | | |
| | 2,481 | | | Epicor Software Corporation, Term Loan | | | 4.000% | | | | 1-Month LIBOR | | | | 3.250% | | | | 7/31/27 | | | | B2 | | | | 2,483,619 | |
| | | | | | | |
| | 7,177 | | | Finastra USA, Inc., Term Loan, First Lien, (DD1) | | | 4.500% | | | | 6-Month LIBOR | | | | 3.500% | | | | 6/13/24 | | | | BB- | | | | 7,129,710 | |
| | | | | | | |
| | 966 | | | iQor US Inc., Second Out Term Loan | | | 8.500% | | | | 1-Month LIBOR | | | | 7.500% | | | | 11/19/25 | | | | CCC+ | | | | 951,427 | |
29
Nuveen High Yield Income Fund (continued)
Portfolio of Investments September 30, 2021
| | | | | | | | | | | | | | | | | | | | | | | | | | | | |
Principal
Amount (000) | | | Description (1) | | Coupon (5) | | | Reference
Rate (5) | | | Spread (5) | | | Maturity (6) | | | Ratings (2) | | | Value | |
| | | |
| | | | Software (continued) | | | | | | | |
| | | | | | | |
| $ | 2,885 | | | Polaris Newco LLC, Term Loan B | | | 4.500% | | | | 6-Month LIBOR | | | | 4.000% | | | | 6/04/28 | | | | B2 | | | $ | 2,894,621 | |
| | 17,590 | | | Total Software | | | | | | | | | | | | | | | | | | | | 17,566,337 | |
| | | |
| | | | Specialty Retail – 1.2% | | | | | | | |
| | | | | | | |
| | 2,820 | | | Jo-Ann Stores, Inc., Term Loan B1 | | | 5.500% | | | | 3-Month LIBOR | | | | 4.750% | | | | 6/30/28 | | | | B | | | | 2,749,500 | |
| | | | | | | |
| | 1,030 | | | Michaels Companies, Inc., Term Loan B | | | 5.000% | | | | 3-Month LIBOR | | | | 4.250% | | | | 4/15/28 | | | | Ba3 | | | | 1,031,638 | |
| | | | | | | |
| | 2,500 | | | PetSmart, Inc., Term Loan B | | | 4.500% | | | | 6-Month LIBOR | | | | 3.750% | | | | 2/12/28 | | | | BB- | | | | 2,508,925 | |
| | | | | | | |
| | 1,845 | | | Staples, Inc., Term Loan, (WI/DD) | | | TBD | | | | TBD | | | | TBD | | | | TBD | | | | B | | | | 1,764,550 | |
| | 8,195 | | | Total Specialty Retail | | | | | | | | | | | | | | | | | | | | | | | 8,054,613 | |
| $ | 156,592 | | | Total Variable Rate Senior Loan Interests (cost $153,447,765) | | | | | | | | | | | | 154,745,173 | |
| | | | | | | |
| Shares | | | Description (1) | | | | | | | | | | | | | | | | | Value | |
| | | | | |
| | | | COMMON STOCKS – 0.9% | | | | | | | | | | | | | | | | | |
| | | | | | | |
| | | | Banks – 0.1% | | | | | | | | | | | | | | | | | | |
| | | | | | | |
| | 32,423 | | | iQor US Inc, (8), (9) | | | | | | | | | | | | | | | | | | | | | | $ | 383,013 | |
| | | | | | | |
| | | | Electric Utilities – 0.2% | | | | | | | | | | | | | | | | | | |
| | | | | | |
| | 38,861 | | | Energy Harbor Corp, (8), (9), (10) | | | | | | | | | | | | | | | | | | | | 1,562,951 | |
| | | |
| | | | Hotels, Restaurants & Leisure – 0.1% | | | | | | | |
| | | | | | |
| | 86,730 | | | 24 Hour Fitness Worldwide Inc, (8) | | | | | | | | | | | | | | | | | | | | 238,507 | |
| | | | | | |
| | 182,331 | | | 24 Hour Fitness Worldwide Inc, (8), (9) | | | | | | | | | | | | | | | | | | | | 364,662 | |
| | | | Total Hotels, Restaurants & Leisure | | | | | | | | | | | | | | | | 603,169 | |
| | | | |
| | | | Internet & Direct Marketing Retail – 0.0% | | | | | | | | | | |
| | | | | | |
| | 652 | | | Catalina Marketing Corp, (8), (9) | | | | | | | | | | | | | | | | | | | | 1,956 | |
| | | | | | | |
| | | | Media – 0.0% | | | | | | | | | | | | | | | | | | |
| | | | | | | |
| | 9,292 | | | Tribune Co, (8), (9) | | | | | | | | | | | | | | | | | | | | | | | 93 | |
| |
| | | | Oil, Gas & Consumable Fuels – 0.3% | |
| | | | | |
| | 23,016 | | | Fieldwood Energy LLC, (8), (9) | | | | | | | | | | | | | | | | 2,301,600 | |
| | | | | |
| | | | Professional Services – 0.2% | | | | | | | | | | | | | |
| | | | | | | |
| | 117,284 | | | Skillsoft Corp, (7), (9) | | | | | | | | | | | | | | | | | | | | | | | 1,239,662 | |
| | | | Total Common Stocks (cost $7,677,403) | | | | | | | | | | | | | | | | 6,092,444 | |
| | | | | | | |
| Shares | | | Description (1) | | | | | | | | | | | | | | | | | Value | |
| | | | | | | |
| | | | WARRANTS – 0.3% | | | | | | | | | | | | | | | | | | |
| |
| | | | Communications Equipment – 0.0% | |
| | | | | | | |
| | 45,063 | | | Avaya Holdings Corp, (8) | | | | | | | | | | | | | | | | | | | | | | $ | 95,533 | |
| | | | | |
| | | | Oil, Gas & Consumable Fuels – 0.3% | | | | | | | | | | | | | |
| | | | | | |
| | 13,860 | | | Fieldwood Energy LLC, (8) | | | | | | | | | | | | | | | | | | | | 1,386,000 | |
| | | | | | |
| | 18,918 | | | Fieldwood Energy LLC, (8) | | | | | | | | | | | | | | | | | | | | 170,262 | |
30
| | | | | | | | | | | | | | | | | | | | | | | | | | | | |
| | | | | | | |
| Shares | | | Description (1) | | | | | | | | | | | | | | | | | Value | |
| | | | | |
| | | | Oil, Gas & Consumable Fuels (continued) | | | | | | | | | | | | | |
| | | | | | | |
| | 36,435 | | | Fieldwood Energy LLC, (8) | | | | | | | | | | | | | | | | | | | | | | $ | 182,175 | |
| | | | Total Oil, Gas & Consumable Fuels | | | | | | | | | | | | | | | | 1,738,437 | |
| | | | Total Warrants (cost $5,005,089) | | | | | | | | | | | | | | | | | | | | | | | 1,833,970 | |
| | | | Total Long-Term Investments (cost $635,377,792) | | | | 642,168,003 | |
| | | | | | | |
| Shares | | | Description (1) | | | | | | | | | | | Coupon | | | | | | Value | |
| |
| | | | INVESTMENTS PURCHASED WITH COLLATERAL FROM SECURITIES LENDING – 1.6% | |
| | | | | | | |
| | | | MONEY MARKET FUNDS – 1.6% | | | | | | | | | | | | | | | | | | |
| | | | | |
| | 10,618,982 | | | State Street Navigator Securities Lending Government Money Market Portfolio, (11) | | | | | | | | 0.030%(12) | | | | | | | | 10,618,982 | |
| | | | Total Investments Purchased with Collateral from Securities Lending (cost $10,618,982) | | | | 10,618,982 | |
| | | | | | | |
| Shares | | | Description (1) | | | | | | | | | | | Coupon | | | | | | Value | |
| | | | | | | |
| | | | SHORT-TERM INVESTMENTS – 5.5% | | | | | | | | | | | | | | | | | | |
| | | | | | | |
| | | | INVESTMENT COMPANIES – 5.5% | | | | | | | | | | | | | | | | | | |
| | | | | | | |
| | 36,883,600 | | | BlackRock Liquidity Funds T-Fund Portfolio | | | | | | | | | | | | | | | 0.100%(13) | | | | | | | $ | 36,883,600 | |
| | | | Total Short-Term Investments (cost $36,883,600) | | | | 36,883,600 | |
| | | | Total Investments (cost $682,880,374) – 102.8% | | | | 689,670,585 | |
| | | | Other Assets Less Liabilities – (2.8)% | | | | (18,579,254) | |
| | | | Net Assets – 100% | | | $ | 671,091,331 | |
31
Nuveen High Yield Income Fund (continued)
Portfolio of Investments September 30, 2021
For Fund portfolio compliance purposes, the Fund’s industry classifications refer to any one or more of the industry sub-classifications used by one or more widely recognized market indexes or ratings group indexes, and/or as defined by Fund management. This definition may not apply for purposes of this report, which may combine industry sub-classifications into sectors for reporting ease.
| (1) | All percentages shown in the Portfolio of Investments are based on net assets. |
| (2) | For financial reporting purposes, the ratings disclosed are the highest of Standard & Poor’s Group (“Standard & Poor’s”), Moody’s Investors Service, Inc. (“Moody’s”) or Fitch, Inc. (“Fitch”) rating. This treatment of split-rated securities may differ from that used for other purposes, such as for Fund investment policies. Ratings below BBB by Standard & Poor’s, Baa by Moody’s or BBB by Fitch are considered to be below investment grade. Holdings designated N/R are not rated by any of these national rating agencies. Ratings are not covered by the report of independent registered public accounting firm. |
| (3) | Defaulted security. A security whose issuer has failed to fully pay principal and/or interest when due, or is under the protection of bankruptcy. |
| (4) | Investment, or a portion of investment, is out on loan for securities lending. The total value of securities out on loan at the end of the reporting period was $10,194,166. |
| (5) | Senior loans generally pay interest at rates which are periodically adjusted by reference to a base short-term, floating lending rate (Reference Rate) plus an assigned fixed rate (Spread). These floating lending rates are generally (i) the lending rate referenced by the London Inter- Bank Offered Rate (“LIBOR”), or (ii) the prime rate offered by one or more major United States banks. Senior loans may be considered restricted in that the Fund ordinarily is contractually obligated to receive approval from the agent bank and/or borrower prior to the disposition of a senior loan. The rate shown is the coupon as of the end of the reporting period. |
| (6) | Senior Loans generally are subject to mandatory and/or optional prepayment. Because of these mandatory prepayment conditions and because there may be significant economic incentives for a borrower to prepay, prepayments of senior loans may occur. As a result, the actual remaining maturity of senior loans held may be substantially less than the stated maturities shown. |
| (7) | Investment valued at fair value using methods determined in good faith by, or at the discretion of, the Board. For fair value measurement disclosure purposes, investment classified as Level 3. |
| (8) | For fair value measurement disclosure purposes, investment classified as Level 2. |
| (9) | Non-income producing; issuer has not declared an ex-dividend date within the past twelve months. |
| (10) | Common Stock received as part of the bankruptcy settlements during February 2020 for Bruce Mansfield Unit 1 2007 Pass-Through Trust. |
| (11) | The Fund may loan securities representing up to one third of the market value of its total assets (which includes collateral for securities on loan) to broker dealers, banks, and other institutions. The collateral maintained by the Fund shall have a market value, at the inception of each loan, equal to not less than 100% of the market value of the loaned securities. The cash collateral received by the Fund is invested in this money market fund. |
| (12) | The rate shown is the one-day yield as of the end of the reporting period. |
| (13) | The rate shown is the annualized seven-day subsidized yield as of end of the reporting period. |
| 144A | Investment is exempt from registration under Rule 144A of the Securities Act of 1933, as amended. These investments may only be resold in transactions exempt from registration, which are normally those transactions with qualified institutional buyers. |
| DD1 | Portion of investment purchased on a delayed delivery basis. |
| LIBOR | London Inter-Bank Offered Rate |
| PIK | Payment-in-kind (“PIK”) security. Depending on the terms of the security, income may be received in the form of cash, securities, or a combination of both. The PIK rate shown, where applicable, represents the annualized rate of the last PIK payment made by the issuer as of the end of the reporting period. |
| Reg S | Regulation S allows U.S. companies to sell securities to persons or entitles located outside of the United States without registering those securities with the Securities and Exchange Commission. Specifically, Regulation S provides a safe harbor from the registration requirements of the Securities Act for the offers and sales of securities by both foreign and domestic issuers that are made outside the United States. |
| TBD | Senior loan purchased on a when-issued or delayed-delivery basis. Certain details associated with this purchase are not known prior to the settlement date of the transaction. In addition, senior loans typically trade without accrued interest and therefore a coupon rate is not available prior to settlement. At settlement, if still unknown, the borrower or counterparty will provide the Fund with the final coupon rate and maturity date. |
| WI/DD | Purchased on a when-issued or delayed delivery basis. |
See accompanying notes to financial statements.
32
Nuveen Floating Rate Income Fund
Portfolio of Investments September 30, 2021
| | | | | | | | | | | | | | | | | | | | | | | | | | | | |
Principal Amount (000) | | | Description (1) | | Coupon (2) | | | Reference Rate (2) | | | Spread (2) | | | Maturity (3) | | | Ratings (4) | | | Value | |
| | | | | | |
| | | | LONG-TERM INVESTMENTS – 95.4% | | | | | | | | | | | | | | | | | | | | | |
| | | | | |
| | | | VARIABLE RATE SENIOR LOAN INTERESTS – 79.2% (2) | | | | | | | | | | | | | | | | | |
| | | | | | |
| | | | Aerospace & Defense – 0.9% | | | | | | | | | | | | | | | | |
| | | | | | | |
| $ | 6,881 | | | Maxar Technologies Ltd., Term Loan B | | | 2.840% | | | | 1-Month LIBOR | | | | 2.750% | | | | 10/05/24 | | | | B | | | $ | 6,835,303 | |
| | | | | | | |
| | 1,371 | | | TransDigm, Inc., Term Loan E | | | 2.334% | | | | 1-Month LIBOR | | | | 2.250% | | | | 5/30/25 | | | | Ba3 | | | | 1,355,839 | |
| | | | | | | |
| | 1,795 | | | TransDigm, Inc., Term Loan F | | | 2.334% | | | | 1-Month LIBOR | | | | 2.250% | | | | 12/09/25 | | | | Ba3 | | | | 1,775,113 | |
| | 10,047 | | | Total Aerospace & Defense | | | | | | | | | | | | | | | | | | | | | | | 9,966,255 | |
| | | | | | | |
| | | | Airlines – 1.7% | | | | | | | | | | | | | | | | | | |
| | | | | | | |
| | 3,028 | | | AAdvantage Loyalty IP Ltd., Term Loan | | | 5.500% | | | | 3-Month LIBOR | | | | 4.750% | | | | 4/20/28 | | | | Ba2 | | | | 3,134,262 | |
| | | | | | | |
| | 3,410 | | | Air Canada, Term Loan B | | | 4.250% | | | | 3-Month LIBOR | | | | 3.500% | | | | 8/11/28 | | | | Ba2 | | | | 3,428,465 | |
| | | | | | | |
| | 2,646 | | | Allegiant Travel Company, Term Loan | | | 3.124% | | | | 3-Month LIBOR | | | | 3.000% | | | | 2/05/24 | | | | BB– | | | | 2,636,429 | |
| | | | | | | |
| | 164 | | | American Airlines, Inc., Term Loan | | | 2.084% | | | | 1-Month LIBOR | | | | 2.000% | | | | 12/14/23 | | | | Ba3 | | | | 161,481 | |
| | | | | | | |
| | 3,837 | | | Kestrel Bidco Inc., Term Loan B | | | 4.000% | | | | 6-Month LIBOR | | | | 3.000% | | | | 12/11/26 | | | | BB– | | | | 3,753,045 | |
| | | | | | | |
| | 790 | | | Mileage Plus Holdings LLC, Term Loan B | | | 6.250% | | | | 3-Month LIBOR | | | | 5.250% | | | | 6/20/27 | | | | Baa3 | | | | 840,118 | |
| | | | | | | |
| | 2,275 | | | SkyMiles IP Ltd., Term Loan B | | | 4.750% | | | | 3-Month LIBOR | | | | 3.750% | | | | 10/20/27 | | | | Baa1 | | | | 2,422,739 | |
| | | | | | | |
| | 1,741 | | | United Airlines, Inc., Term Loan B | | | 4.500% | | | | 3-Month LIBOR | | | | 3.750% | | | | 4/21/28 | | | | Ba1 | | | | 1,757,182 | |
| | 17,891 | | | Total Airlines | | | | | | | | | | | | | | | | | | | | | | | 18,133,721 | |
| | | | | | | |
| | | | Auto Components – 1.0% | | | | | | | | | | | | | | | | | | |
| | | | | | | |
| | 2,992 | | | Adient US LLC, Term Loan B | | | 3.584% | | | | 1-Month LIBOR | | | | 3.500% | | | | 4/08/28 | | | | BB- | | | | 2,996,555 | |
| | | | | | | |
| | 2,113 | | | Clarios Global LP, Term Loan B | | | 3.337% | | | | 1-Month LIBOR | | | | 3.250% | | | | 4/30/26 | | | | B1 | | | | 2,106,401 | |
| | | | | | | |
| | 1,667 | | | DexKo Global Inc., Term Loan | | | 4.250% | | | | 1-Week LIBOR | | | | 3.250% | | | | 7/24/24 | | | | B1 | | | | 1,667,891 | |
| | | | | | | |
| | 1,630 | | | DexKo Global, Inc., Term Loan B, (WI/DD) | | | TBD | | | | TBD | | | | TBD | | | | TBD | | | | B1 | | | | 1,630,276 | |
| | | | | | | |
| | 310 | | | DexKo Global, Inc., Term Loan B, (WI/DD), (5) | | | TBD | | | | TBD | | | | TBD | | | | TBD | | | | B1 | | | | 310,529 | |
| | | | | | | |
| | 1,737 | | | Les Schwab Tire Centers, Term Loan B | | | 4.000% | | | | 3-Month LIBOR | | | | 3.250% | | | | 11/02/27 | | | | B | | | | 1,739,055 | |
| | 10,449 | | | Total Auto Components | | | | | | | | | | | | | | | | | | | | | | | 10,450,707 | |
| | | |
| | | | Automobiles – 0.1% | | | | | | | |
| | | | | | | |
| | 1,512 | | | Wand NewCo 3, Inc., Term Loan | | | 3.084% | | | | 1-Month LIBOR | | | | 3.000% | | | | 2/05/26 | | | | B2 | | | | 1,499,862 | |
| | | |
| | | | Banks – 0.0% | | | | | | | |
| | | | | | | |
| | 292 | | | iQor US Inc., Exit Term Loan | | | 8.500% | | | | 1-Month LIBOR | | | | 7.500% | | | | 9/15/27 | | | | N/R | | | | 299,388 | |
| | | |
| | | | Beverages – 0.3% | | | | | | | |
| | | | | | | |
| | 1,066 | | | City Brewing Company, LLC, Term Loan | | | 4.250% | | | | 3-Month LIBOR | | | | 3.500% | | | | 4/05/28 | | | | B+ | | | | 1,058,447 | |
| | | | | | | |
| | 2,619 | | | Triton Water Holdings, Inc, Term Loan | | | 4.000% | | | | 3-Month LIBOR | | | | 3.500% | | | | 3/31/28 | | | | B1 | | | | 2,618,784 | |
| | 3,685 | | | Total Beverages | | | | | | | | | | | | | | | | | | | | | | | 3,677,231 | |
| | | |
| | | | Building Products – 0.4% | | | | | | | |
| | | | | | | |
| | 700 | | | All-Star Bidco AB, Term Loan, (WI/DD) | | | TBD | | | | TBD | | | | TBD | | | | TBD | | | | B2 | | | | 699,562 | |
| | | | | | | |
| | 1,473 | | | Cornerstone Building Brands, Inc., Term Loan B | | | 3.750% | | | | 1-Month LIBOR | | | | 3.250% | | | | 4/12/28 | | | | B+ | | | | 1,472,298 | |
| | | | | | | |
| | 1,164 | | | LBM Acquisition LLC, Term Loan B, (DD1) | | | 4.500% | | | | 3-Month LIBOR | | | | 3.750% | | | | 12/18/27 | | | | B+ | | | | 1,154,943 | |
| | | | | | | |
| | 1,311 | | | Quikrete Holdings, Inc., Term Loan, First Lien | | | 2.585% | | | | 1-Month LIBOR | | | | 2.500% | | | | 1/31/27 | | | | BB– | | | | 1,301,784 | |
| | 4,648 | | | Total Building Products | | | | | | | | | | | | | | | | | | | | | | | 4,628,587 | |
33
Nuveen Floating Rate Income Fund (continued)
Portfolio of Investments September 30, 2021
| | | | | | | | | | | | | | | | | | | | | | | | | | | | |
Principal Amount (000) | | | Description (1) | | Coupon (2) | | | Reference Rate (2) | | | Spread (2) | | | Maturity (3) | | | Ratings (4) | | | Value | |
| | | |
| | | | Capital Markets – 0.4% | | | | | | | |
| | | | | | | |
| $ | 506 | | | Klockner-Pentaplast of America, Inc., Term Loan B | | | 5.250% | | | | 6-Month LIBOR | | | | 4.750% | | | | 2/09/26 | | | | B | | | $ | 508,221 | |
| | | | | | | |
| | 122 | | | Lions Gate Capital Holdings LLC, Term Loan A | | | 1.834% | | | | 1-Month LIBOR | | | | 1.750% | | | | 3/22/23 | | | | Ba2 | | | | 121,955 | |
| | | | | | | |
| | 2,918 | | | Sequa Mezzanine Holdings L.L.C., Extended Term Loan, (cash 6.750%, PIK 1.000%) | | | 7.750% | | | | 3-Month LIBOR | | | | 6.750% | | | | 7/31/23 | | | | B– | | | | 2,966,355 | |
| | | | | | | |
| | 707 | | | Sequa Mezzanine Holdings L.L.C., Term Loan, Second Lien, (cash 5.000%, PIK 6.750%) | | | 11.750% | | | | 3-Month LIBOR | | | | 10.750% | | | | 7/31/24 | | | | CCC– | | | | 697,635 | |
| | 4,253 | | | Total Capital Markets | | | | | | | | | | | | | | | | | | | | | | | 4,294,166 | |
| | | |
| | | | Chemicals – 1.6% | | | | | | | |
| | | | | | | |
| | 6,323 | | | Atotech B.V., Term Loan B, (DD1) | | | 3.000% | | | | 3-Month LIBOR | | | | 2.500% | | | | 3/18/28 | | | | B+ | | | | 6,322,514 | |
| | | | | | | |
| | 4,775 | | | Diamond BC BV, Term Loan, (WI/DD) | | | TBD | | | | TBD | | | | TBD | | | | TBD | | | | Ba3 | | | | 4,784,598 | |
| | | | | | | |
| | 1,048 | | | INEOS Styrolution US Holding LLC, Term Loan B | | | 3.250% | | | | 1-Month LIBOR | | | | 2.750% | | | | 1/29/26 | | | | BB+ | | | | 1,049,077 | |
| | | | | | | |
| | 882 | | | Lonza Group AG, Term Loan B | | | 4.750% | | | | 6-Month LIBOR | | | | 4.000% | | | | 7/02/28 | | | | B2 | | | | 885,568 | |
| | | | | | | |
| | 392 | | | Sparta U.S. HoldCo LLC, Term Loan | | | 4.250% | | | | 3-Month LIBOR | | | | 3.500% | | | | 8/02/28 | | | | B+ | | | | 393,225 | |
| | | | | | | |
| | 658 | | | Unifrax Holdings, Term Loan, First Lien | | | 3.897% | | | | 3-Month LIBOR | | | | 3.750% | | | | 12/14/25 | | | | BB | | | | 651,514 | |
| | | | | | | |
| | 3,505 | | | WR Grace Holdings LLC, Term Loan, (WI/DD) | | | TBD | | | | TBD | | | | TBD | | | | TBD | | | | BB+ | | | | 3,521,982 | |
| | 17,583 | | | Total Chemicals | | | | | | | | | | | | | | | | | | | | | | | 17,608,478 | |
| | | |
| | | | Commercial Services & Supplies – 4.5% | | | | | | | |
| | | | | | | |
| | 995 | | | Amentum Government Services Holdings LLC, Term Loan B | | | 5.500% | | | | 3-Month LIBOR | | | | 4.750% | | | | 1/31/27 | | | | B1 | | | | 1,004,701 | |
| | | | | | | |
| | 2,547 | | | CCRR Parent, Inc, Term Loan B | | | 4.500% | | | | 3-Month LIBOR | | | | 3.750% | | | | 3/05/28 | | | | B | | | | 2,556,752 | |
| | | | | | | |
| | 1,715 | | | Clean Harbors Inc., Term Loan, (WI/DD) | | | TBD | | | | TBD | | | | TBD | | | | TBD | | | | BBB– | | | | 1,718,567 | |
| | | | | | | |
| | 16,819 | | | Delta 2 (LUX) S.a.r.l., Term Loan, (DD1) | | | 3.500% | | | | 1-Month LIBOR | | | | 2.500% | | | | 2/01/24 | | | | B+ | | | | 16,800,635 | |
| | | | | | | |
| | 1,429 | | | Garda World Security Corporation, Term Loan B | | | 4.340% | | | | 1-Month LIBOR | | | | 4.250% | | | | 10/30/26 | | | | BB+ | | | | 1,433,379 | |
| | | | | | | |
| | 3,503 | | | GFL Environmental Inc., Term Loan | | | 3.500% | | | | 3-Month LIBOR | | | | 3.000% | | | | 5/30/25 | | | | BB- | | | | 3,513,730 | |
| | | | | | | |
| | 2,250 | | | Herman Miller, Inc, Term Loan B, (DD1) | | | 2.063% | | | | 1-Month LIBOR | | | | 2.000% | | | | 7/19/28 | | | | BBB– | | | | 2,253,611 | |
| | | | | | | |
| | 440 | | | KAR Auction Services, Inc., Term Loan B6 | | | 2.375% | | | | 1-Month LIBOR | | | | 2.250% | | | | 9/19/26 | | | | Ba3 | | | | 431,375 | |
| | | | | | | |
| | 748 | | | Madison IAQ LLC, Term Loan | | | 3.750% | | | | 3-Month LIBOR | | | | 3.250% | | | | 6/21/28 | | | | B1 | | | | 747,968 | |
| | | | | | | |
| | 706 | | | PAE Holding Corporation, Term Loan B | | | 5.250% | | | | 3-Month LIBOR | | | | 4.500% | | | | 10/19/27 | | | | B | | | | 706,483 | |
| | | | | | | |
| | 2,364 | | | Prime Security Services Borrower, LLC, Term Loan, (DD1) | | | 3.500% | | | | 1-Month LIBOR | | | | 2.750% | | | | 9/23/26 | | | | BB- | | | | 2,364,664 | |
| | | | | | | |
| | 3,091 | | | Prime Security Services Borrower, LLC, Term Loan, (DD1) | | | 3.500% | | | | 6-Month LIBOR | | | | 2.750% | | | | 9/23/26 | | | | BB- | | | | 3,091,042 | |
| | | | | | | |
| | 3,091 | | | Prime Security Services Borrower, LLC, Term Loan, (DD1) | | | 3.500% | | | | 12-Month LIBOR | | | | 2.750% | | | | 9/23/26 | | | | BB- | | | | 3,091,041 | |
| | | | | | | |
| | 998 | | | Spin Holdco Inc., Term Loan | | | 4.750% | | | | 3-Month LIBOR | | | | 4.000% | | | | 3/04/28 | | | | B- | | | | 1,001,410 | |
| | | | | | | |
| | 1,238 | | | Trans Union, LLC, Term Loan B5 | | | 1.834% | | | | 1-Month LIBOR | | | | 1.750% | | | | 11/13/26 | | | | BBB- | | | | 1,231,750 | |
| | | | | | | |
| | 3,985 | | | Travelport Finance (Luxembourg) S.a.r.l., Term Loan, (cash 3.500%, PIK 6.500%) | | | 3.500% | | | | 3-Month LIBOR | | | | 2.500% | | | | 2/28/25 | | | | B- | | | | 4,143,451 | |
| | | | | | | |
| | 1,241 | | | West Corporation, Term Loan B1 | | | 4.500% | | | | 3-Month LIBOR | | | | 3.500% | | | | 10/10/24 | | | | B2 | | | | 1,216,763 | |
| | | | | | | |
| | 792 | | | WEX Inc., Term Loan | | | 2.334% | | | | 1-Month LIBOR | | | | 2.250% | | | | 4/01/28 | | | | Ba2 | | | | 789,360 | |
| | 47,952 | | | Total Commercial Services & Supplies | | | | | | | | | | | | | | | | 48,096,682 | |
| | | |
| | | | Communications Equipment – 1.7% | | | | | | | |
| | | | | | | |
| | 2,500 | | | Avaya, Inc., Term Loan B | | | 4.334% | | | | 1-Month LIBOR | | | | 4.250% | | | | 12/15/27 | | | | BB | | | | 2,507,225 | |
| | | | | | | |
| | 3,641 | | | CommScope, Inc., Term Loan B | | | 3.336% | | | | 1-Month LIBOR | | | | 3.250% | | | | 4/04/26 | | | | Ba3 | | | | 3,629,773 | |
| | | | | | | |
| | 2,679 | | | Cyxtera DC Holdings Inc., Term Loan, (WI/DD) | | | TBD | | | | TBD | | | | TBD | | | | TBD | | | | B | | | | 2,663,659 | |
34
| | | | | | | | | | | | | | | | | | | | | | | | | | | | |
Principal Amount (000) | | | Description (1) | | Coupon (2) | | | Reference Rate (2) | | | Spread (2) | | | Maturity (3) | | | Ratings (4) | | | Value | |
| | | |
| | | | Communications Equipment (continued) | | | | | | | |
| | | | | | | |
| $ | 650 | | | Delta TopCo, Inc., Term Loan, Second Lien | | | 8.000% | | | | 3-Month LIBOR | | | | 7.250% | | | | 12/01/28 | | | | CCC | | | $ | 658,665 | |
| | | | | | | |
| | 998 | | | MetroNet Systems Holdings, LLC, Term Loan, First Lien | | | 4.500% | | | | 3-Month LIBOR | | | | 3.750% | | | | 6/02/28 | | | | B2 | | | | 1,001,241 | |
| | | | | | | |
| | 554 | | | MLN US HoldCo LLC, Term Loan, First Lien | | | 4.583% | | | | 1-Month LIBOR | | | | 4.500% | | | | 11/30/25 | | | | B3 | | | | 505,663 | |
| | | | | | | |
| | 1,830 | | | Plantronics Inc, Term Loan B | | | 2.585% | | | | 1-Month LIBOR | | | | 2.500% | | | | 7/02/25 | | | | Ba2 | | | | 1,791,222 | |
| | | | | | | |
| | 3,828 | | | Riverbed Technology, Inc., Term Loan B | | | 7.000% | | | | 3-Month LIBOR | | | | 6.000% | | | | 12/31/25 | | | | B2 | | | | 3,445,613 | |
| | | | | | | |
| | 1,018 | | | Univision Communications Inc., Term Loan C5 | | | 2.834% | | | | 1-Month LIBOR | | | | 2.750% | | | | 3/15/24 | | | | B | | | | 1,018,210 | |
| | | | | | | |
| | 494 | | | Windstream Services, LLC, Exit Term Loan B | | | 7.250% | | | | 1-Month LIBOR | | | | 6.250% | | | | 9/21/27 | | | | BB | | | | 496,731 | |
| | 18,192 | | | Total Communications Equipment | | | | | | | | | | | | | | | | 17,718,002 | |
| | | |
| | | | Construction & Engineering – 1.3% | | | | | | | |
| | | | | | | |
| | 748 | | | AECOM, Term Loan B | | | 1.834% | | | | 1-Month LIBOR | | | | 1.750% | | | | 4/13/28 | | | | BBB- | | | | 749,154 | |
| | | | | | | |
| | 1,055 | | | Aegion Corporation, Term Loan | | | 5.500% | | | | 3-Month LIBOR | | | | 4.750% | | | | 5/17/28 | | | | B | | | | 1,064,231 | |
| | | | | | | |
| | 1,635 | | | Brown Group Holding, LLC, Term Loan B | | | 3.250% | | | | 3-Month LIBOR | | | | 2.750% | | | | 4/22/28 | | | | B+ | | | | 1,636,059 | |
| | | | | | | |
| | 1,750 | | | Centuri Group, Inc, Term Loan B | | | 3.000% | | | | 3-Month LIBOR | | | | 2.500% | | | | 8/27/28 | | | | Ba2 | | | | 1,751,461 | |
| | | | | | | |
| | 1,369 | | | Traverse Midstream Partners LLC, Term Loan | | | 6.500% | | | | 1-Month LIBOR | | | | 5.500% | | | | 9/27/24 | | | | B | | | | 1,372,279 | |
| | | | | | | |
| | 6,885 | | | Zurn Holdings Inc., Term Loan, (WI/DD) | | | TBD | | | | TBD | | | | TBD | | | | TBD | | | | BB | | | | 6,898,770 | |
| | 13,442 | | | Total Construction & Engineering | | | | | | | | | | | | | | | | 13,471,954 | |
| | | |
| | | | Containers & Packaging – 0.8% | | | | | | | |
| | | | | | | |
| | 2,280 | | | Berry Global, Inc., Term Loan Z | | | 1.856% | | | | 2-Month LIBOR | | | | 1.750% | | | | 7/01/26 | | | | BBB– | | | | 2,269,772 | |
| | | | | | | |
| | 1,555 | | | Grinding Media Inc., Term Loan, (WI/DD) | | | TBD | | | | TBD | | | | TBD | | | | TBD | | | | B | | | | 1,560,831 | |
| | | | | | | |
| | 2,575 | | | Reynolds Group Holdings Inc. , Term Loan B | | | 4.000% | | | | 1-Month LIBOR | | | | 3.500% | | | | 9/24/28 | | | | B+ | | | | 2,575,000 | |
| | | | | | | |
| | 331 | | | TricorBraun Holdings, Inc., Delayed Draw Term Loan, (5) | | | 3.359% | | | | 1-Month LIBOR | | | | 3.250% | | | | 3/03/28 | | | | B2 | | | | 329,757 | |
| | | | | | | |
| | 1,470 | | | TricorBraun Holdings, Inc., Term Loan | | | 3.750% | | | | 1-Month LIBOR | | | | 3.250% | | | | 3/03/28 | | | | B2 | | | | 1,463,631 | |
| | 8,211 | | | Total Containers & Packaging | | | | | | | | | | | | | | | | 8,198,991 | |
| | | |
| | | | Distributors – 0.3% | | | | | | | |
| | | | | | | |
| | 1,750 | | | Core & Main LP, Term Loan B | | | 2.586% | | | | 1-Month LIBOR | | | | 2.500% | | | | 6/10/28 | | | | Ba3 | | | | 1,745,992 | |
| | | | | | | |
| | 1,715 | | | Univar Solutions USA Inc., Term Loan B6 | | | 2.084% | | | | 1-Month LIBOR | | | | 2.000% | | | | 6/03/28 | | | | BBB– | | | | 1,713,099 | |
| | 3,465 | | | Total Distributors | | | | | | | | | | | | | | | | | | | | | | | 3,459,091 | |
| | | |
| | | | Diversified Consumer Services – 0.4% | | | | | | | |
| | | | | | | |
| | 4,150 | | | Cengage Learning, Inc., Term Loan B | | | 5.750% | | | | 3-Month LIBOR | | | | 4.750% | | | | 7/14/26 | | | | B | | | | 4,182,308 | |
| | | |
| | | | Diversified Financial Services – 0.9% | | | | | | | |
| | | | | | | |
| | 1,484 | | | Avaya, Inc., Term Loan B2, (WI/DD) | | | TBD | | | | TBD | | | | TBD | | | | TBD | | | | N/R | | | | 1,487,866 | |
| | | | | | | |
| | 2,270 | | | Ditech Holding Corporation, Term Loan, (6) | | | 0.000% | | | | N/A | | | | N/A | | | | 6/30/22 | | | | N/R | | | | 455,349 | |
| | | | | | | |
| | 1,224 | | | Lions Gate Capital Holdings LLC, Term Loan B | | | 2.334% | | | | 1-Month LIBOR | | | | 2.250% | | | | 3/24/25 | | | | Ba2 | | | | 1,216,868 | |
| | | | | | | |
| | 4,934 | | | Verscend Holding Corp., Term Loan B | | | 4.084% | | | | 1-Month LIBOR | | | | 4.000% | | | | 8/27/25 | | | | BB– | | | | 4,947,455 | |
| | | | | | | |
| | 1,250 | | | Vision Solutions, Inc., Term Loan, First Lien | | | 5.000% | | | | 3-Month LIBOR | | | | 4.250% | | | | 3/04/28 | | | | N/R | | | | 1,249,800 | |
| | 11,162 | | | Total Diversified Financial Services | | | | | | | | 9,357,338 | |
| | | |
| | | | Diversified Telecommunication Services – 1.6% | | | | | | | |
| | | | | | | |
| | 715 | | | Altice France S.A., Term Loan B12 | | | 3.814% | | | | 3-Month LIBOR | | | | 3.687% | | | | 1/31/26 | | | | B | | | | 710,903 | |
| | | | | | | |
| | 9,019 | | | Altice France S.A., Term Loan B13 | | | 4.125% | | | | 3-Month LIBOR | | | | 4.000% | | | | 8/14/26 | | | | B | | | | 9,008,229 | |
35
Nuveen Floating Rate Income Fund (continued)
Portfolio of Investments September 30, 2021
| | | | | | | | | | | | | | | | | | | | | | | | | | | | |
Principal Amount (000) | | | Description (1) | | Coupon (2) | | | Reference Rate (2) | | | Spread (2) | | | Maturity (3) | | | Ratings (4) | | | Value | |
| | | |
| | | | Diversified Telecommunication Services (continued) | | | | | | | |
| | | | | | | |
| $ | 519 | | | CenturyLink, Inc., Term Loan B | | | 2.337% | | | | 1-Month LIBOR | | | | 2.250% | | | | 3/15/27 | | | | BBB– | | | $ | 514,066 | |
| | | | | | | |
| | 614 | | | Connect Finco Sarl, Term Loan B | | | 4.500% | | | | 1-Month LIBOR | | | | 3.500% | | | | 12/12/26 | | | | B+ | | | | 614,968 | |
| | | | | | | |
| | 3,245 | | | Frontier Communications Corp., DIP Term Loan B | | | 4.500% | | | | 3-Month LIBOR | | | | 3.750% | | | | 10/08/27 | | | | BB+ | | | | 3,247,632 | |
| | | | | | | |
| | 750 | | | Intelsat Jackson Holdings S.A., Term Loan B4, (6) | | | 8.750% | | | | 3-Month LIBOR | | | | 5.500% | | | | 1/02/24 | | | | N/R | | | | 764,299 | |
| | | | | | | |
| | 1,299 | | | Intelsat Jackson Holdings S.A., Term Loan B5, (6) | | | 8.625% | | | | N/A | | | | N/A | | | | 1/02/24 | | | | N/R | | | | 1,323,167 | |
| | | | | | | |
| | 998 | | | MTN Infrastructure TopCo Inc, Term Loan, First Lien B | | | 4.000% | | | | 1-Month LIBOR | | | | 3.000% | | | | 11/17/24 | | | | B | | | | 997,478 | |
| | 17,159 | | | Total Diversified Telecommunication Services | | | | | | | | 17,180,742 | |
| | | |
| | | | Electric Utilities – 0.1% | | | | | | | |
| | | | | | | |
| | 904 | | | ExGen Renewables IV, LLC, Term Loan | | | 3.500% | | | | 3-Month LIBOR | | | | 2.500% | | | | 12/15/27 | | | | BB– | | | | 905,387 | |
| | | |
| | | | Electrical Equipment – 0.3% | | | | | | | |
| | | | | | | |
| | 673 | | | Avolon TLB Borrower 1 (US) LLC, Term Loan B4 | | | 2.250% | | | | 1-Month LIBOR | | | | 1.500% | | | | 2/12/27 | | | | Baa2 | | | | 667,664 | |
| | | | | | | |
| | 2,793 | | | Ingram Micro Inc., Term Loan B | | | 4.000% | | | | 3-Month LIBOR | | | | 3.500% | | | | 7/02/28 | | | | BB+ | | | | 2,803,125 | |
| | 3,466 | | | Total Electrical Equipment | | | | | | | | 3,470,789 | |
| | | |
| | | | Electronic Equipment, Instruments & Components – 0.1% | | | | | | | |
| | | | | | | |
| | 967 | | | TTM Technologies, Inc., Term Loan | | | 2.586% | | | | 1-Month LIBOR | | | | 2.500% | | | | 9/28/24 | | | | BB+ | | | | 969,809 | |
| | | |
| | | | Energy Equipment & Services – 0.0% | | | | | | | |
| | | | | | | |
| | 620 | | | PGS ASA, Term Loan | | | 7.647% | | | | 1-Month LIBOR | | | | 7.000% | | | | 3/19/24 | | | | N/R | | | | 565,708 | |
| | | |
| | | | Entertainment – 1.2% | | | | | | | |
| | | | | | | |
| | 218 | | | AMC Entertainment Holdings, Inc. , Term Loan B | | | 3.083% | | | | 1-Month LIBOR | | | | 3.000% | | | | 4/22/26 | | | | B– | | | | 203,272 | |
| | | | | | | |
| | 1,305 | | | Crown Finance US, Inc., Term Loan | | | 3.500% | | | | 6-Month LIBOR | | | | 2.500% | | | | 2/28/25 | | | | CCC | | | | 1,079,062 | |
| | | | | | | |
| | 338 | | | Crown Finance US, Inc., Term Loan | | | 3.750% | | | | 3-Month LIBOR | | | | 2.750% | | | | 9/20/26 | | | | CCC | | | | 277,707 | |
| | | | | | | |
| | 169 | | | Crown Finance US, Inc., Term Loan B1 | | | 9.250% | | | | 3-Month LIBOR | | | | 8.250% | | | | 5/23/24 | | | | B– | | | | 181,831 | |
| | | | | | | |
| | 1,336 | | | Metro-Goldwyn-Mayer Inc., Term Loan, First Lien | | | 2.590% | | | | 1-Month LIBOR | | | | 2.500% | | | | 7/03/25 | | | | BB– | | | | 1,332,483 | |
| | | | | | | |
| | 4,250 | | | Metro-Goldwyn-Mayer Inc., Term Loan, Second Lien | | | 5.500% | | | | 1-Month LIBOR | | | | 4.500% | | | | 7/06/26 | | | | B3 | | | | 4,264,174 | |
| | | | | | | |
| | 4,235 | | | NASCAR Holdings, Inc, Term Loan B, (DD1) | | | 2.584% | | | | 1-Month LIBOR | | | | 2.500% | | | | 10/18/26 | | | | BB+ | | | | 4,237,925 | |
| | | | | | | |
| | 1,803 | | | William Morris Endeavor Entertainment, LLC, Term Loan, First Lien | | | 2.840% | | | | 1-Month LIBOR | | | | 2.750% | | | | 5/16/25 | | | | B | | | | 1,771,536 | |
| | 13,654 | | | Total Entertainment | | | | | | | | 13,347,990 | |
| | | |
| | | | Food & Staples Retailing – 1.6% | | | | | | | |
| | | | | | | |
| | 3,061 | | | H Food Holdings LLC, Term Loan B | | | 3.772% | | | | 1-Month LIBOR | | | | 3.688% | | | | 5/31/25 | | | | B2 | | | | 3,055,899 | |
| | | | | | | |
| | 120 | | | H Food Holdings LLC, Term Loan B3 | | | 6.000% | | | | 1-Month LIBOR | | | | 5.000% | | | | 5/31/25 | | | | B2 | | | | 120,572 | |
| | | | | | | |
| | 1,658 | | | Shearer’s Foods, Inc., Term Loan | | | 4.250% | | | | 3-Month LIBOR | | | | 3.500% | | | | 8/01/27 | | | | B2 | | | | 1,658,281 | |
| | | | | | | |
| | 12,002 | | | US Foods, Inc., Term Loan B, (DD1) | | | 1.834% | | | | 1-Month LIBOR | | | | 1.750% | | | | 6/27/23 | | | | BB– | | | | 11,945,517 | |
| | 16,841 | | | Total Food & Staples Retailing | | | | | | | | 16,780,269 | |
| | | |
| | | | Food Products – 0.2% | | | | | | | |
| | | | | | | |
| | 2,150 | | | Sycamore Buyer LLC, Term Loan, (WI/DD) | | | TBD | | | | TBD | | | | TBD | | | | TBD | | | | BB+ | | | | 2,145,969 | |
| | | |
| | | | Health Care Equipment & Supplies – 1.8% | | | | | | | |
| | | | | | | |
| | 2,435 | | | Agiliti Health, Inc, Term Loan | | | 2.875% | | | | 1-Month LIBOR | | | | 2.750% | | | | 1/04/26 | | | | B+ | | | | 2,425,882 | |
| | | | | | | |
| | 730 | | | Agiliti Health, Inc, Term Loan | | | 3.500% | | | | 1-Month LIBOR | | | | 2.750% | | | | 1/04/26 | | | | B+ | | | | 729,569 | |
36
| | | | | | | | | | | | | | | | | | | | | | | | | | | | |
Principal Amount (000) | | | Description (1) | | Coupon (2) | | | Reference Rate (2) | | | Spread (2) | | | Maturity (3) | | | Ratings (4) | | | Value | |
| | | |
| | | | Health Care Equipment & Supplies (continued) | | | | | | | |
| | | | | | | |
| $ | 1,455 | | | Carestream Health, Inc., Extended Term Loan | | | 7.750% | | | | 3-Month LIBOR | | | | 6.750% | | | | 5/08/23 | | | | B1 | | | $ | 1,464,352 | |
| | | | | | | |
| | 76 | | | Lifescan Global Corporation, Term Loan, First Lien | | | 6.146% | | | | 3-Month LIBOR | | | | 6.000% | | | | 10/01/24 | | | | B | | | | 75,227 | |
| | | | | | | |
| | 12,500 | | | Mozart Borrower LP, Term Loan, (WI/DD) | | | TBD | | | | TBD | | | | TBD | | | | TBD | | | | B+ | | | | 12,476,562 | |
| | | | | | | |
| | 1,223 | | | Viant Medical Holdings, Inc., Term Loan, First Lien | | | 3.834% | | | | 1-Month LIBOR | | | | 3.750% | | | | 7/02/25 | | | | B3 | | | | 1,184,073 | |
| | | | | | | |
| | 839 | | | Vyaire Medical, Inc., Term Loan B | | | 5.750% | | | | 3-Month LIBOR | | | | 4.750% | | | | 4/30/25 | | | | B3 | | | | 726,677 | |
| | 19,258 | | | Total Health Care Equipment & Supplies | | | | | | | | 19,082,342 | |
| | | |
| | | | Health Care Providers & Services – 6.4% | | | | | | | |
| | | | | | | |
| | 1,493 | | | ADMI Corp., Term Loan B2 | | | 3.625% | | | | 1-Month LIBOR | | | | 3.125% | | | | 12/23/27 | | | | B | | | | 1,482,373 | |
| | | | | | | |
| | 5,360 | | | AHP Health Partners, Inc., Term Loan B | | | 4.000% | | | | 1-Month LIBOR | | | | 3.500% | | | | 8/23/28 | | | | B1 | | | | 5,381,788 | |
| | | | | | | |
| | 367 | | | Air Methods Corporation, Term Loan B | | | 4.500% | | | | 3-Month LIBOR | | | | 3.500% | | | | 4/21/24 | | | | B | | | | 364,949 | |
| | | | | | | |
| | 1,914 | | | BW NHHC Holdco, Inc., Term Loan, First Lien | | | 5.125% | | | | 3-Month LIBOR | | | | 5.000% | | | | 5/15/25 | | | | Caa1 | | | | 1,697,780 | |
| | | | | | | |
| | 1,695 | | | CHG Healthcare Services Inc., Term Loan, (WI/DD) | | | TBD | | | | TBD | | | | TBD | | | | TBD | | | | B1 | | | | 1,699,543 | |
| | | | | | | |
| | 2,653 | | | Envision Healthcare Corporation, Term Loan, First Lien | | | 3.834% | | | | 1-Month LIBOR | | | | 3.750% | | | | 10/10/25 | | | | CCC+ | | | | 2,368,780 | |
| | | | | | | |
| | 1,677 | | | EyeCare Partners, LLC, Term Loan | | | 3.882% | | | | 3-Month LIBOR | | | | 3.750% | | | | 2/20/27 | | | | B | | | | 1,670,181 | |
| | | | | | | |
| | 2,755 | | | Gates Global LLC, Term Loan B3, (DD1) | | | 3.250% | | | | 1-Month LIBOR | | | | 2.500% | | | | 3/31/27 | | | | B+ | | | | 2,754,625 | |
| | | | | | | |
| | 300 | | | Gentiva Health Services, Inc., Term Loan | | | 2.834% | | | | 1-Month LIBOR | | | | 2.750% | | | | 7/02/25 | | | | BB+ | | | | 300,690 | |
| | | | | | | |
| | 1,045 | | | Global Medical Response, Inc., Term Loan B2, (DD1) | | | 5.250% | | | | 6-Month LIBOR | | | | 4.250% | | | | 3/14/25 | | | | B | | | | 1,050,213 | |
| | | | | | | |
| | — (7) | | | National Mentor Holdings, Inc., Delayed Draw Term Loan, (5) | | | 3.750% | | | | 3-Month LIBOR | | | | 3.750% | | | | 3/02/28 | | | | B1 | | | | 54 | |
| | | | | | | |
| | — (7) | | | National Mentor Holdings, Inc., Term Loan | | | 4.500% | | | | 3-Month LIBOR | | | | 3.750% | | | | 3/02/28 | | | | B1 | | | | 670 | |
| | | | | | | |
| | 1 | | | National Mentor Holdings, Inc., Term Loan | | | 4.500% | | | | 1-Month LIBOR | | | | 3.750% | | | | 3/02/28 | | | | B1 | | | | 743 | |
| | | | | | | |
| | 1,312 | | | Onex TSG Intermediate Corp., Term Loan B | | | 5.500% | | | | 3-Month LIBOR | | | | 4.750% | | | | 2/26/28 | | | | B | | | | 1,324,174 | |
| | | | | | | |
| | 3,287 | | | Phoenix Guarantor Inc, Term Loan B | | | 3.336% | | | | 1-Month LIBOR | | | | 3.250% | | | | 3/05/26 | | | | B1 | | | | 3,271,647 | |
| | | | | | | |
| | 995 | | | Phoenix Guarantor Inc, Term Loan B3 | | | 3.585% | | | | 1-Month LIBOR | | | | 3.500% | | | | 3/05/26 | | | | B1 | | | | 992,513 | |
| | | | | | | |
| | 234 | | | Quorum Health Corporation, Term Loan, (6) | | | 8.000% | | | | 3-Month LIBOR | | | | 7.000% | | | | 4/29/25 | | | | B– | | | | 234,827 | |
| | | | | | | |
| | 20,787 | | | RegionalCare Hospital Partners Holdings, Inc., Term Loan B | | | 3.835% | | | | 1-Month LIBOR | | | | 3.750% | | | | 11/16/25 | | | | B1 | | | | 20,783,568 | |
| | | | | | | |
| | 4,257 | | | Select Medical Corporation, Term Loan B | | | 2.340% | | | | 1-Month LIBOR | | | | 2.250% | | | | 3/06/25 | | | | Ba2 | | | | 4,238,854 | |
| | | | | | | |
| | 748 | | | Sound Inpatient Physicians, Term Loan B | | | 3.500% | | | | 1-Month LIBOR | | | | 3.000% | | | | 6/28/25 | | | | Ba3 | | | | 748,907 | |
| | | | | | | |
| | 13,350 | | | Surgery Center Holdings, Inc., Term Loan, (DD1) | | | 4.500% | | | | 1-Month LIBOR | | | | 3.750% | | | | 8/31/26 | | | | B1 | | | | 13,387,645 | |
| | | | | | | |
| | 2,764 | | | Team Health Holdings, Inc., Term Loan, First Lien | | | 3.750% | | | | 1-Month LIBOR | | | | 2.750% | | | | 2/06/24 | | | | B | | | | 2,701,885 | |
| | | | | | | |
| | 1,514 | | | US Radiology Specialists, Inc., Term Loan | | | 5.632% | | | | 3-Month LIBOR | | | | 5.500% | | | | 12/15/27 | | | | B– | | | | 1,522,545 | |
| | 68,508 | | | Total Health Care Providers & Services | | | | | | | | | | | | | | | | 67,978,954 | |
| | | |
| | | | Health Care Technology – 1.0% | | | | | | | |
| | | | | | | |
| | 1,966 | | | Carestream Health, Inc., Extended Term Loan Second Lien, (cash 5.500%, PIK 8.000%) | | | 5.500% | | | | 3-Month LIBOR | | | | 4.500% | | | | 8/05/23 | | | | CCC+ | | | | 1,934,760 | |
| | | | | | | |
| | 56 | | | Change Healthcare Holdings LLC, Term Loan B | | | 3.500% | | | | 1-Month LIBOR | | | | 2.500% | | | | 3/01/24 | | | | B+ | | | | 55,684 | |
| | | | | | | |
| | 6,242 | | | Change Healthcare Holdings LLC, Term Loan B | | | 3.500% | | | | 3-Month LIBOR | | | | 2.500% | | | | 3/01/24 | | | | B+ | | | | 6,242,713 | |
| | | | | | | |
| | 2,012 | | | Zelis Healthcare Corporation, Term Loan | | | 3.586% | | | | 1-Month LIBOR | | | | 3.500% | | | | 9/30/26 | | | | B | | | | 2,006,105 | |
| | 10,276 | | | Total Health Care Technology | | | | | | | | | | | | | | | | 10,239,262 | |
37
Nuveen Floating Rate Income Fund (continued)
Portfolio of Investments September 30, 2021
| | | | | | | | | | | | | | | | | | | | | | | | | | | | |
Principal Amount (000) | | | Description (1) | | Coupon (2) | | | Reference Rate (2) | | | Spread (2) | | | Maturity (3) | | | Ratings (4) | | | Value | |
| | | |
| | | | Hotels, Restaurants & Leisure – 8.6% | | | | | | | |
| | | | | | | |
| $ | 326 | | | 24 Hour Fitness Worldwide, Inc., Exit Term Loan, (cash 0.132%, PIK 5.000%) | | | 5.132% | | | | 3-Month LIBOR | | | | 5.000% | | | | 12/29/25 | | | | B3 | | | $ | 283,073 | |
| | | | | | | |
| | 132 | | | All Day AcquisitionCo LLC, Term Loan | | | 5.132% | | | | 3-Month LIBOR | | | | 5.000% | | | | 9/29/26 | | | | N/R | | | | 118,750 | |
| | | | | | | |
| | 1,383 | | | Alterra Mountain Company, Term Loan | | | 4.000% | | | | 1-Month LIBOR | | | | 3.500% | | | | 8/17/28 | | | | B | | | | 1,381,207 | |
| | | | | | | |
| | 1,703 | | | Alterra Mountain Company, Term Loan B1 | | | 2.834% | | | | 1-Month LIBOR | | | | 2.750% | | | | 7/31/24 | | | | B | | | | 1,694,906 | |
| | | | | | | |
| | 6,093 | | | B.C. Unlimited Liability Company, Term Loan B4 | | | 1.837% | | | | 1-Month LIBOR | | | | 1.750% | | | | 11/19/26 | | | | BB+ | | | | 6,029,841 | |
| | | | | | | |
| | 7,250 | | | Bally’s Corp., Term Loan, (WI/DD) | | | TBD | | | | TBD | | | | TBD | | | | TBD | | | | Ba2 | | | | 7,257,069 | |
| | | | | | | |
| | 1,604 | | | Boyd Gaming Corporation, Term Loan B3 | | | 2.322% | | | | 1-Week LIBOR | | | | 2.250% | | | | 9/15/23 | | | | BB | | | | 1,604,079 | |
| | | | | | | |
| | 1,861 | | | Caesars Resort Collection, Term Loan, (WI/DD) | | | TBD | | | | TBD | | | | TBD | | | | TBD | | | | B+ | | | | 1,864,678 | |
| | | | | | | |
| | 7,277 | | | Caesars Resort Collection, LLC, Term Loan, First Lien B | | | 2.834% | | | | 1-Month LIBOR | | | | 2.750% | | | | 12/22/24 | | | | B+ | | | | 7,243,690 | |
| | | | | | | |
| | 2,719 | | | Carnival Corporation, Term Loan B | | | 3.750% | | | | 1-Month LIBOR | | | | 3.000% | | | | 6/30/25 | | | | Ba2 | | | | 2,709,822 | |
| | | | | | | |
| | 246 | | | Churchill Downs Incorporated, Term Loan B | | | 2.086% | | | | 1-Month LIBOR | | | | 2.000% | | | | 12/27/24 | | | | BBB– | | | | 245,536 | |
| | | | | | | |
| | 1,606 | | | Churchill Downs Incorporated, Term Loan B1 | | | 2.086% | | | | 1-Month LIBOR | | | | 2.000% | | | | 3/17/28 | | | | BBB– | | | | 1,594,173 | |
| | | | | | | |
| | 6,505 | | | ClubCorp Holdings, Inc., Term Loan B | | | 2.882% | | | | 3-Month LIBOR | | | | 2.750% | | | | 9/18/24 | | | | B– | | | | 6,128,814 | |
| | | | | | | |
| | 361 | | | Crown Finance US, Inc., Term Loan B1, (cash 7.132%, PIK 8.250%) | | | 7.132% | | | | 3-Month LIBOR | | | | 7.000% | | | | 5/23/24 | | | | B– | | | | 446,883 | |
| | | | | | | |
| | 4,699 | | | Equinox Holdings, Inc., Term Loan, First Lien | | | 4.000% | | | | 3-Month LIBOR | | | | 3.000% | | | | 3/08/24 | | | | CCC | | | | 4,375,642 | |
| | | | | | | |
| | 583 | | | Equinox Holdings, Inc., Term Loan, Second Lien | | | 8.000% | | | | 3-Month LIBOR | | | | 7.000% | | | | 3/08/25 | | | | CC | | | | 512,393 | |
| | | | | | | |
| | 2,000 | | | Everi Holdings Inc., Term Loan, (WI/DD) | | | TBD | | | | TBD | | | | TBD | | | | TBD | | | | BB+ | | | | 1,998,130 | |
| | | | | | | |
| | 26 | | | Golden Nugget, Inc., Initial Term Loan | | | 13.000% | | | | 3-Month LIBOR | | | | 12.000% | | | | 10/04/23 | | | | N/R | | | | 28,936 | |
| | | | | | | |
| | 12,546 | | | Golden Nugget, Inc., Term Loan B | | | 3.250% | | | | 2-Month LIBOR | | | | 2.500% | | | | 10/04/23 | | | | B | | | | 12,502,995 | |
| | | | | | | |
| | 2,500 | | | Hilton Grand Vacations Borrower LLC, Term Loan B | | | 3.500% | | | | 1-Month LIBOR | | | | 3.000% | | | | 8/02/28 | | | | Ba1 | | | | 2,508,750 | |
| | | | | | | |
| | 3,603 | | | Life Time Fitness Inc , Term Loan B | | | 5.750% | | | | 3-Month LIBOR | | | | 4.750% | | | | 12/15/24 | | | | B– | | | | 3,635,056 | |
| | | | | | | |
| | 1,040 | | | Playtika Holding Corp, Term Loan | | | 2.834% | | | | 1-Month LIBOR | | | | 2.750% | | | | 3/11/28 | | | | BB | | | | 1,040,659 | |
| | | | | | | |
| | 9,379 | | | Scientific Games International, Inc., Term Loan B5 | | | 2.834% | | | | 1-Month LIBOR | | | | 2.750% | | | | 8/14/24 | | | | B+ | | | | 9,349,181 | |
| | | | | | | |
| | 2,000 | | | SeaWorld Parks & Entertainment, Inc., Term Loan B | | | 3.500% | | | | 1-Month LIBOR | | | | 3.000% | | | | 8/25/28 | | | | BB– | | | | 1,996,260 | |
| | | | | | | |
| | 12,318 | | | Stars Group Holdings B.V., Term Loan, (DD1) | | | 3.632% | | | | 3-Month LIBOR | | | | 3.500% | | | | 7/10/25 | | | | BBB | | | | 12,290,920 | |
| | | | | | | |
| | 1,551 | | | Station Casinos LLC, Term Loan B | | | 2.500% | | | | 1-Month LIBOR | | | | 2.250% | | | | 2/08/27 | | | | BB– | | | | 1,537,952 | |
| | | | | | | |
| | 1,292 | | | Wyndham Hotels & Resorts, Inc., Term Loan B | | | 1.835% | | | | 1-Month LIBOR | | | | 1.750% | | | | 5/30/25 | | | | BBB– | | | | 1,284,535 | |
| | 92,603 | | | Total Hotels, Restaurants & Leisure | | | | | | | | 91,663,930 | |
| | | |
| | | | Household Durables – 0.6% | | | | | | | |
| | | | | | | |
| | 2,000 | | | AI Aqua Merger Sub, Inc., Term Loan, First Lien B, (DD1) | | | 4.500% | | | | 1-Month LIBOR | | | | 4.000% | | | | 7/30/28 | | | | B3 | | | | 2,008,750 | |
| | | | | | | |
| | 250 | | | AI Aqua Merger Sub, Inc., Term Loan, First Lien B, (WI/DD) | | | TBD | | | | TBD | | | | TBD | | | | TBD | | | | B3 | | | | 251,094 | |
| | | | | | | |
| | 1,794 | | | Apex Tool Group, LLC, Term Loan B | | | 6.500% | | | | 1-Month LIBOR | | | | 5.250% | | | | 8/21/24 | | | | B3 | | | | 1,798,772 | |
| | | | | | | |
| | 92 | | | Serta Simmons Bedding, LLC, Term Loan, (6) | | | 8.500% | | | | 1-Month LIBOR | | | | 7.500% | | | | 8/10/23 | | | | B | | | | 93,508 | |
| | | | | | | |
| | 607 | | | Serta Simmons Bedding, LLC, Term Loan, (6) | | | 8.500% | | | | 1-Month LIBOR | | | | 7.500% | | | | 8/10/23 | | | | B– | | | | 579,302 | |
| | | | | | | |
| | 56 | | | Weber-Stephen Products LLC, Term Loan B, (DD1) | | | 4.000% | | | | 6-Month LIBOR | | | | 3.250% | | | | 10/30/27 | | | | B1 | | | | 55,847 | |
| | | | | | | |
| | 1,844 | | | Weber-Stephen Products LLC, Term Loan B, (DD1) | | | 4.000% | | | | 1-Month LIBOR | | | | 3.250% | | | | 10/30/27 | | | | B1 | | | | 1,850,292 | |
| | 6,643 | | | Total Household Durables | | | | | | | | 6,637,565 | |
38
| | | | | | | | | | | | | | | | | | | | | | | | | | | | |
Principal Amount (000) | | | Description (1) | | Coupon (2) | | | Reference Rate (2) | | | Spread (2) | | | Maturity (3) | | | Ratings (4) | | | Value | |
| | | |
| | | | Household Products – 0.1% | | | | | | | |
| | | | | | | |
| $ | 1,020 | | | Illuminate Merger Sub Corp., Term Loan | | | 4.000% | | | | 3-Month LIBOR | | | | 3.500% | | | | 7/23/28 | | | | B1 | | | $ | 1,020,852 | |
| | | |
| | | | Independent Power & Renewable Electricity Producers – 0.3% | | | | | | | |
| | | | | | | |
| | 664 | | | Calpine Corporation, Term Loan B10 | | | 2.084% | | | | 1-Month LIBOR | | | | 2.000% | | | | 8/12/26 | | | | BB+ | | | | 657,351 | |
| | | | | | | |
| | 1,116 | | | Calpine Corporation, Term Loan B5 | | | 2.590% | | | | 1-Month LIBOR | | | | 2.500% | | | | 12/16/27 | | | | BB+ | | | | 1,114,385 | |
| | | | | | | |
| | 1,083 | | | WIN Waste Innovations Holdings, Inc., Term Loan B | | | 3.250% | | | | 3-Month LIBOR | | | | 2.750% | | | | 3/25/28 | | | | B+ | | | | 1,083,362 | |
| | 2,863 | | | Total Independent Power & Renewable Electricity Producers | | | | | | | | 2,855,098 | |
| | | |
| | | | Industrial Conglomerates – 0.1% | | | | | | | |
| | | | | | | |
| | 647 | | | Emerald Expositions Holding, Inc., Term Loan B | | | 2.584% | | | | 1-Month LIBOR | | | | 2.500% | | | | 5/22/24 | | | | B | | | | 619,159 | |
| | | |
| | | | Insurance – 1.9% | | | | | | | |
| | | | | | | |
| | 3,787 | | | Acrisure, LLC, Term Loan B | | | 3.632% | | | | 3-Month LIBOR | | | | 3.500% | | | | 2/15/27 | | | | B | | | | 3,759,027 | |
| | | | | | | |
| | 1,470 | | | Alliant Holdings Intermediate, LLC, Term Loan B | | | 3.334% | | | | 1-Month LIBOR | | | | 3.250% | | | | 5/10/25 | | | | B | | | | 1,460,922 | |
| | | | | | | |
| | 747 | | | Alliant Holdings Intermediate, LLC, Term Loan B3 | | | 4.250% | | | | 1-Month LIBOR | | | | 3.750% | | | | 11/06/27 | | | | B | | | | 748,199 | |
| | | | | | | |
| | 4,859 | | | Asurion LLC, Term Loan B6, (DD1) | | | 3.209% | | | | 1-Month LIBOR | | | | 3.125% | | | | 11/03/23 | | | | Ba3 | | | | 4,837,501 | |
| | | | | | | |
| | 401 | | | Asurion LLC, Term Loan B8 | | | 3.334% | | | | 1-Month LIBOR | | | | 3.250% | | | | 12/23/26 | | | | Ba3 | | | | 395,617 | |
| | | | | | | |
| | 3,000 | | | Asurion LLC, Term Loan, Second Lien B4 | | | 5.334% | | | | 1-Month LIBOR | | | | 5.250% | | | | 1/15/29 | | | | B | | | | 2,989,875 | |
| | | | | | | |
| | 1,648 | | | Hub International Limited, Term Loan B | | | 2.875% | | | | 3-Month LIBOR | | | | 2.750% | | | | 4/25/25 | | | | B | | | | 1,633,601 | |
| | | | | | | |
| | 3,377 | | | USI, Inc., Repriced Term Loan | | | 3.132% | | | | 3-Month LIBOR | | | | 3.000% | | | | 5/16/24 | | | | B | | | | 3,358,609 | |
| | | | | | | |
| | 979 | | | USI, Inc., Term Loan B | | | 3.382% | | | | 3-Month LIBOR | | | | 3.250% | | | | 12/02/26 | | | | B | | | | 974,636 | |
| | 20,268 | | | Total Insurance | | | | | | | | | | | | | | | | | | | | | | | 20,157,987 | |
| | | |
| | | | Interactive Media & Services – 1.1% | | | | | | | |
| | | | | | | |
| | 571 | | | Arches Buyer Inc., Term Loan B | | | 3.750% | | | | 1-Month LIBOR | | | | 3.250% | | | | 12/06/27 | | | | B1 | | | | 568,504 | |
| | | | | | | |
| | 728 | | | Mission Broadcasting, Inc., Term Loan B | | | 2.586% | | | | 1-Month LIBOR | | | | 2.500% | | | | 6/03/28 | | | | BBB– | | | | 726,184 | |
| | | | | | | |
| | 10,115 | | | Rackspace Technology Global, Inc., Term Loan B | | | 3.500% | | | | 3-Month LIBOR | | | | 2.750% | | | | 2/09/28 | | | | B+ | | | | 10,053,439 | |
| | 11,414 | | | Total Interactive Media & Services | | | | | | | | | | | | | | | | 11,348,127 | |
| | | |
| | | | Internet & Direct Marketing Retail – 0.2% | | | | | | | |
| | | | | | | |
| | 1,995 | | | CNT Holdings I Corp, Term Loan, (DD1) | | | 4.500% | | | | 3-Month LIBOR | | | | 3.750% | | | | 11/08/27 | | | | B | | | | 1,999,579 | |
| | | |
| | | | Internet Software & Services – 0.9% | | | | | | | |
| | | | | | | |
| | 792 | | | Banff Merger Sub Inc, Term Loan | | | 3.882% | | | | 3-Month LIBOR | | | | 3.750% | | | | 10/02/25 | | | | B2 | | | | 788,142 | |
| | | | | | | |
| | 5,606 | | | Greeneden U.S. Holdings II, LLC, Term Loan B4 | | | 4.750% | | | | 1-Month LIBOR | | | | 4.000% | | | | 12/01/27 | | | | B– | | | | 5,631,687 | |
| | | | | | | |
| | 3,149 | | | IGT Holding IV AB, Term Loan | | | 4.250% | | | | 3-Month LIBOR | | | | 3.750% | | | | 3/29/28 | | | | B | | | | 3,161,000 | |
| | 9,547 | | | Total Internet Software & Services | | | | | | | | 9,580,829 | |
| | | |
| | | | IT Services – 2.3% | | | | | | | |
| | | | | | | |
| | 1,353 | | | Ahead DB Holdings, LLC, Term Loan B | | | 4.500% | | | | 3-Month LIBOR | | | | 3.750% | | | | 10/16/27 | | | | B+ | | | | 1,359,650 | |
| | | | | | | |
| | 1,835 | | | CCC Intelligent Solutions Inc., Term Loan B | | | 3.000% | | | | 3-Month LIBOR | | | | 2.500% | | | | 9/21/28 | | | | B1 | | | | 1,835,578 | |
| | | | | | | |
| | 733 | | | DTI Holdco, Inc., Term Loan B | | | 5.750% | | | | 3-Month LIBOR | | | | 4.750% | | | | 9/30/23 | | | | CCC+ | | | | 726,432 | |
| | | | | | | |
| | 1,628 | | | Intrado Corporation, Term Loan, (DD1) | | | 4.743% | | | | 2-Month LIBOR | | | | 4.000% | | | | 10/10/24 | | | | B2 | | | | 1,606,334 | |
| | | | | | | |
| | 4,454 | | | Intrado Corporation, Term Loan, (DD1) | | | 4.743% | | | | 3-Month LIBOR | | | | 4.000% | | | | 10/10/24 | | | | B2 | | | | 4,395,638 | |
| | | | | | | |
| | 1,316 | | | KBR, Inc., Term Loan B | | | 2.834% | | | | 1-Month LIBOR | | | | 2.750% | | | | 2/07/27 | | | | Ba1 | | | | 1,318,572 | |
| | | | | | | |
| | 1,750 | | | Magenta Buyer LLC, Term Loan, First Lien | | | 5.750% | | | | 3-Month LIBOR | | | | 5.000% | | | | 7/27/28 | | | | BB– | | | | 1,752,188 | |
39
Nuveen Floating Rate Income Fund (continued)
Portfolio of Investments September 30, 2021
| | | | | | | | | | | | | | | | | | | | | | | | | | | | |
Principal Amount (000) | | | Description (1) | | Coupon (2) | | | Reference Rate (2) | | | Spread (2) | | | Maturity (3) | | | Ratings (4) | | | Value | |
| | | |
| | | | IT Services (continued) | | | | | | | |
| | | | | | | |
| $ | 1,550 | | | NeuStar, Inc., Term Loan B4 | | | 4.500% | | | | 1-Month LIBOR | | | | 3.500% | | | | 8/08/24 | | | | B+ | | | $ | 1,552,111 | |
| | | | | | | |
| | 1,515 | | | NeuStar, Inc., Term Loan, Second Lien | | | 9.000% | | | | 1-Month LIBOR | | | | 8.000% | | | | 8/08/25 | | | | CCC | | | | 1,518,063 | |
| | | | | | | |
| | 398 | | | Project Ruby Ultimate Parent Corp., Term Loan | | | 4.000% | | | | 1-Month LIBOR | | | | 3.250% | | | | 3/10/28 | | | | B | | | | 398,000 | |
| | | | | | | |
| | 4,734 | | | Syniverse Holdings, Inc., Term Loan, First Lien | | | 6.000% | | | | 3-Month LIBOR | | | | 5.000% | | | | 3/09/23 | | | | CCC+ | | | | 4,740,709 | |
| | | | | | | |
| | 763 | | | Syniverse Holdings, Inc., Term Loan, Second Lien | | | 10.000% | | | | 3-Month LIBOR | | | | 9.000% | | | | 3/11/24 | | | | CCC– | | | | 764,049 | |
| | | | | | | |
| | 2,188 | | | Tempo Acquisition LLC, Extended Term Loan | | | 3.750% | | | | 1-Month LIBOR | | | | 3.250% | | | | 10/31/26 | | | | BB– | | | | 2,194,781 | |
| | 24,217 | | | Total IT Services | | | | | | | | | | | | | | | | | | | | | | | 24,162,105 | |
| | | |
| | | | Leisure Products – 0.4% | | | | | | | |
| | | | | | | |
| | 3,236 | | | Hayward Industries, Inc., Term Loan | | | 3.000% | | | | 1-Month LIBOR | | | | 2.500% | | | | 5/28/28 | | | | BB– | | | | 3,232,542 | |
| | | | | | | |
| | 727 | | | SRAM, LLC , Term Loan B | | | 3.250% | | | | 6-Month LIBOR | | | | 2.750% | | | | 5/18/28 | | | | BB– | | | | 727,877 | |
| | | | | | | |
| | 182 | | | SRAM, LLC , Term Loan B | | | 3.250% | | | | 3-Month LIBOR | | | | 2.750% | | | | 5/18/28 | | | | BB– | | | | 181,969 | |
| | | | | | | |
| | 46 | | | SRAM, LLC , Term Loan B | | | 3.250% | | | | 1-Month LIBOR | | | | 2.750% | | | | 5/18/28 | | | | BB– | | | | 45,492 | |
| | 4,191 | | | Total Leisure Products | | | | | | | | | | | | | | | | | | | | | | | 4,187,880 | |
| | | |
| | | | Life Sciences Tools & Services – 2.7% | | | | | | | |
| | | | | | | |
| | 1,200 | | | Curia Global, Inc., Term Loan | | | 4.500% | | | | 3-Month LIBOR | | | | 3.750% | | | | 8/30/26 | | | | B | | | | 1,202,187 | |
| | | | | | | |
| | 6,388 | | | ICON Luxembourg S.A.R.L., Term Loan | | | 3.000% | | | | 3-Month LIBOR | | | | 2.500% | | | | 7/01/28 | | | | BB+ | | | | 6,416,705 | |
| | | | | | | |
| | 1,592 | | | ICON Luxembourg S.A.R.L., Term Loan | | | 3.000% | | | | 3-Month LIBOR | | | | 2.500% | | | | 7/01/28 | | | | BB+ | | | | 1,598,726 | |
| | | | | | | |
| | 16,815 | | | Phoenix Newco Inc., Term Loan, (WI/DD) | | | TBD | | | | TBD | | | | TBD | | | | TBD | | | | B1 | | | | 16,838,709 | |
| | | | | | | |
| | 2,976 | | | PPD, Inc., Initial Term Loan | | | 2.500% | | | | 1-Month LIBOR | | | | 2.000% | | | | 1/13/28 | | | | Ba2 | | | | 2,974,850 | |
| | 28,971 | | | Total Life Sciences Tools & Services | | | | | | | | | | | | 29,031,177 | |
| | | |
| | | | Machinery – 0.9% | | | | | | | |
| | | | | | | |
| | 1,325 | | | Alliance Laundry Systems LLC, Term Loan B | | | 4.250% | | | | 3-Month LIBOR | | | | 3.500% | | | | 10/08/27 | | | | B | | | | 1,328,956 | |
| | | | | | | |
| | 2,574 | | | Standard Industries Inc/NJ, Term Loan, (WI/DD) | | | TBD | | | | TBD | | | | TBD | | | | TBD | | | | BBB– | | | | 2,579,922 | |
| | | | | | | |
| | 988 | | | Star US Bidco LLC, Term Loan B | | | 5.250% | | | | 1-Month LIBOR | | | | 4.250% | | | | 3/17/27 | | | | B– | | | | 991,618 | |
| | | | | | | |
| | 2,651 | | | Vertical US Newco Inc, Term Loan B, (DD1) | | | 4.000% | | | | 3-Month LIBOR | | | | 3.500% | | | | 7/31/27 | | | | B+ | | | | 2,658,948 | |
| | | | | | | |
| | 1,773 | | | Vertiv Group Corporation, Term Loan B | | | 2.833% | | | | 1-Month LIBOR | | | | 2.750% | | | | 3/02/27 | | | | BB– | | | | 1,764,599 | |
| | 9,311 | | | Total Machinery | | | | | | | | | | | | | | | | | | | | | | | 9,324,043 | |
| | | |
| | | | Marine – 0.2% | | | | | | | |
| | | | | | | |
| | 2,769 | | | HGIM Corp., Exit Term Loan, (DD1) | | | 7.000% | | | | 3-Month LIBOR | | | | 6.000% | | | | 7/02/23 | | | | Caa3 | | | | 2,066,626 | |
| | | |
| | | | Media – 7.9% | | | | | | | |
| | | | | | | |
| | 2,992 | | | Cable One, Inc., Term Loan B4 | | | 2.084% | | | | 1-Month LIBOR | | | | 2.000% | | | | 5/03/28 | | | | BB+ | | | | 2,980,335 | |
| | | | | | | |
| | 1,514 | | | Cablevision Lightpath LLC, Term Loan B | | | 3.750% | | | | 1-Month LIBOR | | | | 3.250% | | | | 12/01/27 | | | | B+ | | | | 1,516,968 | |
| | | | | | | |
| | 284 | | | Checkout Holding Corp., First Out Term Loan | | | 8.500% | | | | 1-Month LIBOR | | | | 7.500% | | | | 2/15/23 | | | | N/R | | | | 272,636 | |
| | | | | | | |
| | 493 | | | Checkout Holding Corp., Last Out Term Loan, (cash 2.000%, PIK 9.500%) | | | 2.000% | | | | 1-Month LIBOR | | | | 1.000% | | | | 8/15/23 | | | | N/R | | | | 256,223 | |
| | | | | | | |
| | 11,087 | | | Clear Channel Outdoor Holdings, Inc., Term Loan B | | | 3.629% | | | | 3-Month LIBOR | | | | 3.500% | | | | 8/21/26 | | | | B1 | | | | 10,874,489 | |
| | | | | | | |
| | 6,411 | | | CSC Holdings, LLC, Term Loan | | | 2.334% | | | | 1-Month LIBOR | | | | 2.250% | | | | 1/15/26 | | | | BB | | | | 6,334,657 | |
| | | | | | | |
| | 5,250 | | | CSC Holdings, LLC, Term Loan B1 | | | 2.334% | | | | 1-Month LIBOR | | | | 2.250% | | | | 7/17/25 | | | | BB | | | | 5,187,516 | |
| | | | | | | |
| | 3,612 | | | CSC Holdings, LLC, Term Loan B5 | | | 2.584% | | | | 1-Month LIBOR | | | | 2.500% | | | | 4/15/27 | | | | BB | | | | 3,575,808 | |
| | | | | | | |
| | 878 | | | Diamond Sports Group, LLC, Term Loan | | | 3.340% | | | | 1-Month LIBOR | | | | 3.250% | | | | 8/24/26 | | | | Caa1 | | | | 550,901 | |
40
| | | | | | | | | | | | | | | | | | | | | | | | | | | | |
Principal Amount (000) | | | Description (1) | | Coupon (2) | | | Reference Rate (2) | | | Spread (2) | | | Maturity (3) | | | Ratings (4) | | | Value | |
| | | |
| | | | Media (continued) | | | | | | | |
| | | | | | | |
| $ | 6,753 | | | DirecTV Financing, LLC, Term Loan | | | 5.750% | | | | 3-Month LIBOR | | | | 5.000% | | | | 8/02/27 | | | | BBB– | | | $ | 6,764,953 | |
| | | | | | | |
| | 538 | | | GCI Holdings, Inc., Term Loan B | | | 3.500% | | | | 1-Month LIBOR | | | | 2.750% | | | | 10/15/25 | | | | BB | | | | 537,815 | |
| | | | | | | |
| | 995 | | | Gray Television, Inc., Term Loan B | | | 2.336% | | | | 1-Month LIBOR | | | | 2.250% | | | | 2/07/24 | | | | BB+ | | | | 994,090 | |
| | | | | | | |
| | 507 | | | Gray Television, Inc., Term Loan C | | | 2.586% | | | | 1-Month LIBOR | | | | 2.500% | | | | 1/02/26 | | | | BB+ | | | | 506,146 | |
| | | | | | | |
| | 21 | | | Houghton Mifflin Harcourt Publishing Company, Term Loan B | | | 7.250% | | | | 1-Month LIBOR | | | | 6.250% | | | | 11/22/24 | | | | BB+ | | | | 21,022 | |
| | | | | | | |
| | 7,789 | | | iHeartCommunications, Inc., Term Loan | | | 3.084% | | | | 1-Month LIBOR | | | | 3.000% | | | | 5/01/26 | | | | B+ | | | | 7,741,104 | |
| | | | | | | |
| | 6,263 | | | Intelsat Jackson Holdings S.A., DIP Term Loan, (5) | | | 5.392% | | | | 3-Month LIBOR | | | | 4.750% | | | | 7/13/22 | | | | N/R | | | | 6,318,242 | |
| | | | | | | |
| | 12,942 | | | Intelsat Jackson Holdings S.A., Term Loan B3, (6) | | | 8.000% | | | | 1-Month LIBOR | | | | 4.750% | | | | 11/27/23 | | | | N/R | | | | 13,135,891 | |
| | | | | | | |
| | 1,805 | | | LCPR Loan Financing LLC, Term Loan B | | | 3.834% | | | | 1-Month LIBOR | | | | 3.750% | | | | 10/15/28 | | | | BB+ | | | | 1,810,177 | |
| | | | | | | |
| | 2,240 | | | McGraw-Hill Global Education Holdings, LLC, Term Loan | | | 5.250% | | | | 1-Month LIBOR | | | | 4.750% | | | | 7/30/28 | | | | B2 | | | | 2,249,598 | |
| | | | | | | |
| | 227 | | | Meredith Corporation, Term Loan B | | | 5.250% | | | | 3-Month LIBOR | | | | 4.250% | | | | 1/31/25 | | | | BB– | | | | 232,307 | |
| | | | | | | |
| | 1,106 | | | Meredith Corporation, Term Loan B2 | | | 2.584% | | | | 1-Month LIBOR | | | | 2.500% | | | | 1/31/25 | | | | BB– | | | | 1,104,809 | |
| | | | | | | |
| | 2,272 | | | Nexstar Broadcasting, Inc., Term Loan B3 | | | 2.334% | | | | 1-Month LIBOR | | | | 2.250% | | | | 1/17/24 | | | | BBB– | | | | 2,272,818 | |
| | | | | | | |
| | 1,874 | | | Radiate Holdco, LLC, Term Loan | | | 4.250% | | | | 1-Month LIBOR | | | | 3.500% | | | | 9/25/26 | | | | B1 | | | | 1,874,337 | |
| | | | | | | |
| | 1,570 | | | Sinclair Television Group Inc., Term Loan B1 | | | 2.340% | | | | 1-Month LIBOR | | | | 2.250% | | | | 1/03/24 | | | | Ba2 | | | | 1,554,966 | |
| | | | | | | |
| | 2,219 | | | Virgin Media Bristol LLC, Term Loan N | | | 2.584% | | | | 1-Month LIBOR | | | | 2.500% | | | | 1/31/28 | | | | BB+ | | | | 2,206,806 | |
| | | | | | | |
| | 510 | | | WideOpenWest Finance LLC, Term Loan B | | | 4.250% | | | | 1-Month LIBOR | | | | 3.250% | | | | 8/19/23 | | | | B | | | | 510,861 | |
| | | | | | | |
| | 2,621 | | | Ziggo Financing Partnership, Term Loan I | | | 2.584% | | | | 1-Month LIBOR | | | | 2.500% | | | | 4/30/28 | | | | BB | | | | 2,602,869 | |
| | 84,773 | | | Total Media | | | | | | | | | | | | | | | | | | | | | | | 83,988,344 | |
| | | |
| | | | Multiline Retail – 0.3% | | | | | | | |
| | | | | | | |
| | 165 | | | Belk, Inc., Term Loan | | | 8.500% | | | | 3-Month LIBOR | | | | 7.500% | | | | 7/31/25 | | | | B– | | | | 165,907 | |
| | | | | | | |
| | 738 | | | Belk, Inc., Term Loan, (cash 5.000%, PIK 8.000%) | | | 13.000% | | | | 3-Month LIBOR | | | | 13.000% | | | | 7/31/25 | | | | CCC– | | | | 572,775 | |
| | | | | | | |
| | 2,309 | | | EG America LLC, Term Loan | | | 4.145% | | | | 3-Month LIBOR | | | | 4.000% | | | | 2/05/25 | | | | B– | | | | 2,305,473 | |
| | 3,212 | | | Total Multiline Retail | | | | | | | | | | | | | | | | | | | | | | | 3,044,155 | |
| | | |
| | | | Office Electronics – 0.0% | | | | | | | |
| | | | | | | |
| | 315 | | | Pitney Bowes Inc., Term Loan B | | | 4.084% | | | | 1-Month LIBOR | | | | 4.000% | | | | 3/19/28 | | | | BBB– | | | | 315,679 | |
| | | | | |
| | | | Oil, Gas & Consumable Fuels – 1.5% | | | | | | | | | | | | | |
| | | | | | | |
| | 413 | | | BCP Renaissance Parent LLC, Term Loan B | | | 4.500% | | | | 3-Month LIBOR | | | | 3.500% | | | | 11/01/24 | | | | B+ | | | | 410,073 | |
| | | | | | | |
| | 4,056 | | | Buckeye Partners, L.P., Term Loan B | | | 2.334% | | | | 1-Month LIBOR | | | | 2.250% | | | | 11/01/26 | | | | BBB– | | | | 4,040,549 | |
| | | | | | | |
| | 445 | | | Citgo Petroleum Corporation, Term Loan B | | | 7.250% | | | | 6-Month LIBOR | | | | 6.250% | | | | 3/28/24 | | | | BB | | | | 446,036 | |
| | | | | | | |
| | 1,527 | | | Delek US Holdings, Inc., Term Loan B | | | 2.334% | | | | 1-Month LIBOR | | | | 2.250% | | | | 3/30/25 | | | | BB+ | | | | 1,485,286 | |
| | | | | | | |
| | 468 | | | Delek US Holdings, Inc., Term Loan B | | | 6.500% | | | | 1-Month LIBOR | | | | 5.500% | | | | 3/30/25 | | | | BB+ | | | | 469,940 | |
| | | | | | | |
| | 39 | | | DT Midstream, Inc, Term Loan B | | | 2.500% | | | | 3-Month LIBOR | | | | 2.000% | | | | 6/10/28 | | | | Baa2 | | | | 39,033 | |
| | | | | | | |
| | 360 | | | DT Midstream, Inc, Term Loan B | | | 2.500% | | | | 6-Month LIBOR | | | | 2.000% | | | | 6/10/28 | | | | Baa2 | | | | 360,310 | |
| | | | | | | |
| | 4,164 | | | Gulf Finance, LLC, Term Loan B | | | 6.250% | | | | 3-Month LIBOR | | | | 5.250% | | | | 8/25/23 | | | | B– | | | | 4,014,854 | |
| | | | | | | |
| | 5,030 | | | QuarterNorth Energy Holding Inc., Exit Term Loan, Second Lien | | | 9.000% | | | | 3-Month LIBOR | | | | 8.000% | | | | 8/27/26 | | | | B | | | | 5,061,149 | |
| | 16,502 | | | Total Oil, Gas & Consumable Fuels | | | | | | | | | | | | 16,327,230 | |
41
Nuveen Floating Rate Income Fund (continued)
Portfolio of Investments September 30, 2021
| | | | | | | | | | | | | | | | | | | | | | | | | | | | |
Principal Amount (000) | | | Description (1) | | Coupon (2) | | | Reference Rate (2) | | | Spread (2) | | | Maturity (3) | | | Ratings (4) | | | Value | |
| | | |
| | | | Paper & Forest Products – 0.3% | | | | | | | |
| | | | | | | |
| $ | 1,282 | | | Asplundh Tree Expert, LLC, Term Loan B | | | 1.834% | | | | 1-Month LIBOR | | | | 1.750% | | | | 9/04/27 | | | | BBB– | | | $ | 1,278,910 | |
| | | | | | | |
| | 1,748 | | | Post Holdings Inc., Term Loan B | | | 4.750% | | | | 1-Month LIBOR | | | | 4.000% | | | | 10/21/24 | | | | B+ | | | | 1,758,685 | |
| | 3,030 | | | Total Paper & Forest Products | | | | | | | | | | | | 3,037,595 | |
| | | |
| | | | Personal Products – 0.6% | | | | | | | |
| | | | | | | |
| | 1,000 | | | Conair Holdings, LLC, Term Loan B | | | 4.250% | | | | 3-Month LIBOR | | | | 3.750% | | | | 5/17/28 | | | | B1 | | | | 1,001,980 | |
| | | | | | | |
| | 2,015 | | | Journey Personal Care Corp., Term Loan B, (DD1) | | | 5.000% | | | | 3-Month LIBOR | | | | 4.250% | | | | 3/01/28 | | | | B | | | | 2,022,093 | |
| | | | | | | |
| | 658 | | | Kronos Acquisition Holdings Inc., Term Loan B | | | 3.834% | | | | 1-Month LIBOR | | | | 3.750% | | | | 12/22/26 | | | | B2 | | | | 643,231 | |
| | | | | | | |
| | 4,056 | | | Revlon Consumer Products Corporation, Term Loan B, (DD1), (8) | | | 4.250% | | | | 3-Month LIBOR | | | | 3.500% | | | | 9/07/23 | | | | CC | | | | 3,305,867 | |
| | 7,729 | | | Total Personal Products | | | | | | | | | | | | 6,973,171 | |
| | | |
| | | | Pharmaceuticals – 4.9% | | | | | | | |
| | | | | | | |
| | 10,530 | | | Bausch Health Companies Inc., Term Loan B, (DD1) | | | 3.084% | | | | 1-Month LIBOR | | | | 3.000% | | | | 6/02/25 | | | | BB | | | | 10,528,681 | |
| | | | | | | |
| | 2,720 | | | Catalent Pharma Solutions Inc., Term Loan B3, (DD1) | | | 2.500% | | | | 1-Month LIBOR | | | | 2.000% | | | | 2/22/28 | | | | BBB– | | | | 2,725,852 | |
| | | | | | | |
| | 3,922 | | | Endo Luxembourg Finance Company I S.a r.l., Term Loan | | | 6.000% | | | | 3-Month LIBOR | | | | 5.000% | | | | 3/25/28 | | | | B– | | | | 3,843,999 | |
| | | | | | | |
| | 2,419 | | | Gainwell Acquisition Corp., Term Loan B | | | 4.750% | | | | 3-Month LIBOR | | | | 4.000% | | | | 10/01/27 | | | | BB– | | | | 2,428,135 | |
| | | | | | | |
| | 9,576 | | | Jazz Financing Lux S.a.r.l., Term Loan | | | 4.000% | | | | 1-Month LIBOR | | | | 3.500% | | | | 5/05/28 | | | | BB+ | | | | 9,599,988 | |
| | | | | | | |
| | 15,119 | | | Mallinckrodt International Finance S.A., Term Loan B, (DD1), (6) | | | 6.000% | | | | 6-Month LIBOR | | | | 5.250% | | | | 9/24/24 | | | | D | | | | 14,333,616 | |
| | | | | | | |
| | 1,561 | | | Mallinckrodt International Finance S.A., Term Loan B, (6) | | | 6.250% | | | | 1-Month LIBOR | | | | 5.500% | | | | 2/24/25 | | | | D | | | | 1,478,174 | |
| | | | | | | |
| | 7,980 | | | Organon & Co, Term Loan | | | 3.500% | | | | 3-Month LIBOR | | | | 3.000% | | | | 6/02/28 | | | | BB | | | | 8,009,925 | |
| | 53,827 | | | Total Pharmaceuticals | | | | | | | | | | | | | | | | | | | | | | | 52,948,370 | |
| | | |
| | | | Professional Services – 1.3% | | | | | | | |
| | | | | | | |
| | 5,213 | | | Ceridian HCM Holding Inc., Term Loan B, (DD1) | | | 2.572% | | | | 1-Week LIBOR | | | | 2.500% | | | | 4/30/25 | | | | B+ | | | | 5,150,332 | |
| | | | | | | |
| | 737 | | | Creative Artists Agency, LLC , Term Loan B | | | 3.834% | | | | 1-Month LIBOR | | | | 3.750% | | | | 11/26/26 | | | | B | | | | 734,285 | |
| | | | | | | |
| | 1,182 | | | Dun & Bradstreet Corporation (The), Term Loan | | | 3.336% | | | | 1-Month LIBOR | | | | 3.250% | | | | 2/08/26 | | | | BB+ | | | | 1,182,641 | |
| | | | | | | |
| | 612 | | | Nielsen Consumer Inc., Term Loan B | | | 4.084% | | | | 1-Month LIBOR | | | | 4.000% | | | | 3/05/28 | | | | BB | | | | 614,113 | |
| | | | | | | |
| | 2,501 | | | Nielsen Finance LLC, Term Loan B4, (DD1) | | | 2.083% | | | | 1-Month LIBOR | | | | 2.000% | | | | 10/04/23 | | | | BBB– | | | | 2,500,451 | |
| | | | | | | |
| | 3,250 | | | Tempo Acquisition LLC, Term Loan B | | | 3.500% | | | | 3-Month LIBOR | | | | 3.000% | | | | 8/24/28 | | | | BB– | | | | 3,258,125 | |
| | 13,495 | | | Total Professional Services | | | | | | | | | | | | 13,439,947 | |
| | | |
| | | | Real Estate Management & Development – 0.2% | | | | | | | |
| | | | | | | |
| | 1,748 | | | Forest City Enterprises, L.P., Term Loan B | | | 3.584% | | | | 1-Month LIBOR | | | | 3.500% | | | | 12/07/25 | | | | B2 | | | | 1,730,173 | |
| | | | | | | |
| | | | Road & Rail – 1.2% | | | | | | | | | | | | | | | | | | |
| | | | | | | |
| | 904 | | | Avolon TLB Borrower 1 (US) LLC, Term Loan B3 | | | 2.500% | | | | 1-Month LIBOR | | | | 1.750% | | | | 1/15/25 | | | | Baa2 | | | | 901,483 | |
| | | | | | | |
| | 2,313 | | | First Student Bidco Inc, Term Loan B | | | 3.500% | | | | 2-Month LIBOR | | | | 3.000% | | | | 7/21/28 | | | | BB+ | | | | 2,302,740 | |
| | | | | | | |
| | 853 | | | First Student Bidco Inc, Term Loan C | | | 3.500% | | | | 3-Month LIBOR | | | | 3.000% | | | | 7/21/28 | | | | BB+ | | | | 849,804 | |
| | | | | | | |
| | 2,443 | | | Fly Funding II S.a.r.l., Term Loan B | | | 1.880% | | | | 3-Month LIBOR | | | | 1.750% | | | | 8/09/25 | | | | BB+ | | | | 2,418,341 | |
| | | | | | | |
| | 1,229 | | | Genesee & Wyoming Inc. (New), Term Loan | | | 2.132% | | | | 3-Month LIBOR | | | | 2.000% | | | | 12/30/26 | | | | BB+ | | | | 1,222,637 | |
| | | | | | | |
| | 4,633 | | | Hertz Corporation, (The), Term Loan B, (DD1) | | | 4.000% | | | | 1-Month LIBOR | | | | 3.500% | | | | 6/30/28 | | | | B+ | | | | 4,642,992 | |
| | | | | | | |
| | 875 | | | Hertz Corporation, (The), Term Loan C, (DD1) | | | 4.000% | | | | 1-Month LIBOR | | | | 3.500% | | | | 6/30/28 | | | | BB– | | | | 876,622 | |
| | 13,250 | | | Total Road & Rail | | | | | | | | | | | | | | | | | | | | | | | 13,214,619 | |
42
| | | | | | | | | | | | | | | | | | | | | | | | | | | | |
Principal Amount (000) | | | Description (1) | | Coupon (2) | | | Reference Rate (2) | | | Spread (2) | | | Maturity (3) | | | Ratings (4) | | | Value | |
| | | |
| | | | Semiconductors & Semiconductor Equipment – 0.4% | | | | | | | |
| | | | | | | |
| $ | 2,147 | | | Bright Bidco B.V., Term Loan B, (WI/DD) | | | TBD | | | | TBD | | | | TBD | | | | TBD | | | | CCC | | | $ | 1,716,579 | |
| | | | | | | |
| | 165 | | | MACOM Technology Solutions Holdings, Inc., Term Loan | | | 2.334% | | | | 1-Month LIBOR | | | | 2.250% | | | | 5/19/24 | | | | BB | | | | 164,607 | |
| | | | | | | |
| | 1,228 | | | ON Semiconductor Corporation, Term Loan B | | | 2.084% | | | | 1-Month LIBOR | | | | 2.000% | | | | 9/19/26 | | | | Baa3 | | | | 1,227,512 | |
| | | | | | | |
| | 1,172 | | | Ultra Clean Holdings, Inc, Term Loan B | | | 3.834% | | | | 1-Month LIBOR | | | | 3.750% | | | | 8/27/25 | | | | B1 | | | | 1,175,749 | |
| | 4,712 | | | Total Semiconductors & Semiconductor Equipment | | | | | | | | 4,284,447 | |
| | | |
| | | | Software – 6.8% | | | | | | | |
| | | | | | | |
| | 1,471 | | | Applied Systems, Inc., Term Loan, First Lien | | | 3.750% | | | | 3-Month LIBOR | | | | 3.250% | | | | 9/19/24 | | | | B2 | | | | 1,472,514 | |
| | | | | | | |
| | 1,322 | | | Apttus Corporation, Term Loan | | | 5.000% | | | | 3-Month LIBOR | | | | 4.250% | | | | 5/06/28 | | | | BB | | | | 1,330,205 | |
| | | | | | | |
| | 2,353 | | | Blackboard, Inc., Term Loan B5 | | | 7.000% | | | | 3-Month LIBOR | | | | 6.000% | | | | 6/30/24 | | | | B1 | | | | 2,370,336 | |
| | | | | | | |
| | 2,067 | | | Camelot U.S. Acquisition 1 Co., Term Loan B | | | 3.084% | | | | 1-Month LIBOR | | | | 3.000% | | | | 10/31/26 | | | | B1 | | | | 2,064,414 | |
| | | | | | | |
| | 993 | | | Camelot U.S. Acquisition 1 Co., Term Loan B | | | 4.000% | | | | 1-Month LIBOR | | | | 3.000% | | | | 10/31/26 | | | | B1 | | | | 996,068 | |
| | | | | | | |
| | 2,494 | | | Delta TopCo, Inc., Term Loan B | | | 4.500% | | | | 3-Month LIBOR | | | | 3.750% | | | | 12/01/27 | | | | B2 | | | | 2,500,421 | |
| | | | | | | |
| | 3 | | | Emerald TopCo Inc, Term Loan | | | 3.584% | | | | 1-Month LIBOR | | | | 3.500% | | | | 7/25/26 | | | | B | | | | 3,213 | |
| | | | | | | |
| | 1,266 | | | Emerald TopCo Inc, Term Loan | | | 3.628% | | | | 3-Month LIBOR | | | | 3.500% | | | | 7/25/26 | | | | B | | | | 1,259,522 | |
| | | | | | | |
| | 5,750 | | | Epicor Software Corporation, Term Loan | | | 4.000% | | | | 1-Month LIBOR | | | | 3.250% | | | | 7/31/27 | | | | B2 | | | | 5,755,531 | |
| | | | | | | |
| | 8,320 | | | Finastra USA, Inc., Term Loan, First Lien, (DD1) | | | 4.500% | | | | 6-Month LIBOR | | | | 3.500% | | | | 6/13/24 | | | | BB– | | | | 8,264,721 | |
| | | | | | | |
| | 559 | | | Greenway Health, LLC, Term Loan, First Lien | | | 3.882% | | | | 3-Month LIBOR | | | | 3.750% | | | | 2/16/24 | | | | B– | | | | 538,332 | |
| | | | | | | |
| | 9,889 | | | Informatica LLC,, Term Loan B, (DD1) | | | 3.334% | | | | 1-Month LIBOR | | | | 3.250% | | | | 2/14/27 | | | | B1 | | | | 9,869,176 | |
| | | | | | | |
| | 1,750 | | | Informatica LLC,, Term Loan, Second Lien | | | 7.125% | | | | N/A | | | | N/A | | | | 2/25/25 | | | | CCC+ | | | | 1,778,437 | |
| | | | | | | |
| | 807 | | | iQor US Inc., Second Out Term Loan | | | 8.500% | | | | 1-Month LIBOR | | | | 7.500% | | | | 11/19/25 | | | | CCC+ | | | | 795,080 | |
| | | | | | | |
| | 1,235 | | | IQVIA Inc., Term Loan B3 | | | 1.882% | | | | 3-Month LIBOR | | | | 1.750% | | | | 6/11/25 | | | | BBB– | | | | 1,233,580 | |
| | | | | | | |
| | 620 | | | MA FinanceCo., LLC, Term Loan B | | | 5.250% | | | | 3-Month LIBOR | | | | 4.250% | | | | 6/05/25 | | | | BB+ | | | | 625,339 | |
| | | | | | | |
| | 1,193 | | | MA FinanceCo., LLC, Term Loan B3 | | | 2.837% | | | | 1-Month LIBOR | | | | 2.750% | | | | 6/21/24 | | | | BB | | | | 1,183,685 | |
| | | | | | | |
| | 2,317 | | | McAfee, LLC, Term Loan B | | | 3.837% | | | | 1-Month LIBOR | | | | 3.750% | | | | 9/29/24 | | | | BB+ | | | | 2,320,524 | |
| | | | | | | |
| | 1,859 | | | Perforce Software, Inc., Term Loan B | | | 3.834% | | | | 1-Month LIBOR | | | | 3.750% | | | | 7/01/26 | | | | B2 | | | | 1,846,781 | |
| | | | | | | |
| | 1,750 | | | Polaris Newco LLC, Term Loan B | | | 4.500% | | | | 6-Month LIBOR | | | | 4.000% | | | | 6/04/28 | | | | B2 | | | | 1,755,836 | |
| | | | | | | |
| | 2,306 | | | Proofpoint, Inc., Term Loan, First Lien, (DD1) | | | 3.750% | | | | 3-Month LIBOR | | | | 3.250% | | | | 8/31/28 | | | | BB– | | | | 2,296,776 | |
| | | | | | | |
| | 1,710 | | | RealPage, Inc, Term Loan, First Lien | | | 3.750% | | | | 1-Month LIBOR | | | | 3.250% | | | | 4/22/28 | | | | B+ | | | | 1,706,614 | |
| | | | | | | |
| | 8,052 | | | Seattle Spinco, Inc., Term Loan B3 | | | 2.834% | | | | 1-Month LIBOR | | | | 2.750% | | | | 6/21/24 | | | | BB+ | | | | 7,993,257 | |
| | | | | | | |
| | 3,930 | | | Sophia, L.P., Term Loan, First Lien | | | 4.500% | | | | 3-Month LIBOR | | | | 3.750% | | | | 10/07/27 | | | | B | | | | 3,949,631 | |
| | | | | | | |
| | 888 | | | SS&C European Holdings Sarl, Term Loan B4 | | | 1.834% | | | | 1-Month LIBOR | | | | 1.750% | | | | 4/16/25 | | | | BB+ | | | | 880,202 | |
| | | | | | | |
| | 1,172 | | | SS&C Technologies Inc., Term Loan B3 | | | 1.834% | | | | 1-Month LIBOR | | | | 1.750% | | | | 4/16/25 | | | | BB+ | | | | 1,162,379 | |
| | | | | | | |
| | 1,169 | | | SS&C Technologies Inc., Term Loan B5 | | | 1.834% | | | | 1-Month LIBOR | | | | 1.750% | | | | 4/16/25 | | | | BB+ | | | | 1,159,785 | |
| | | | | | | |
| | 5,243 | | | Ultimate Software Group Inc(The), Term Loan | | | 4.000% | | | | 3-Month LIBOR | | | | 3.250% | | | | 5/03/26 | | | | B1 | | | | 5,260,192 | |
| | | | | | | |
| | 291 | | | Ultimate Software Group Inc(The), Term Loan, Second Lien | | | 7.500% | | | | 3-Month LIBOR | | | | 6.750% | | | | 5/03/27 | | | | Caa1 | | | | 296,705 | |
| | 72,779 | | | Total Software | | | | | | | | | | | | | | | | | | | | | | | 72,669,256 | |
| | | |
| | | | Specialty Retail – 1.9% | | | | | | | |
| | | | | | | |
| | 1,269 | | | Academy, Ltd., Term Loan | | | 4.500% | | | | 1-Month LIBOR | | | | 3.750% | | | | 11/06/27 | | | | Ba3 | | | | 1,272,906 | |
| | | | | | | |
| | 97 | | | American Tire Distributors Holdings, Inc., Term Loan | | | 8.500% | | | | 3-Month LIBOR | | | | 7.500% | | | | 9/01/21 | | | | N/R | | | | 97,540 | |
43
Nuveen Floating Rate Income Fund (continued)
Portfolio of Investments September 30, 2021
| | | | | | | | | | | | | | | | | | | | | | | | | | | | |
Principal Amount (000) | | | Description (1) | | Coupon (2) | | | Reference Rate (2) | | | Spread (2) | | | Maturity (3) | | | Ratings (4) | | | Value | |
| | | |
| | | | Specialty Retail (continued) | | | | | | | |
| | | | | | | |
| $ | 893 | | | American Tire Distributors Holdings, Inc., Term Loan | | | 8.500% | | | | 1-Month LIBOR | | | | 7.500% | | | | 9/01/21 | | | | N/R | | | $ | 893,490 | |
| | | | | | | |
| | 2,772 | | | Birkenstock GmbH & Co. KG, Term Loan B, (WI/DD) | | | TBD | | | | TBD | | | | TBD | | | | TBD | | | | BB– | | | | 2,773,508 | |
| | | | | | | |
| | 1,950 | | | Jo-Ann Stores, Inc., Term Loan B1 | | | 5.500% | | | | 3-Month LIBOR | | | | 4.750% | | | | 6/30/28 | | | | B | | | | 1,901,250 | |
| | | | | | | |
| | 240 | | | LBM Acquisition LLC, Term Loan B, (WI/DD), (5) | | | TBD | | | | TBD | | | | TBD | | | | TBD | | | | B+ | | | | 237,770 | |
| | | | | | | |
| | 478 | | | LBM Acquisition LLC, Term Loan B2 | | | 4.500% | | | | 3-Month LIBOR | | | | 3.750% | | | | 12/18/27 | | | | B+ | | | | 474,347 | |
| | | | | | | |
| | 12,040 | | | PetSmart, Inc., Term Loan B | | | 4.500% | | | | 6-Month LIBOR | | | | 3.750% | | | | 2/12/28 | | | | BB– | | | | 12,082,934 | |
| | | | | | | |
| | 658 | | | Staples, Inc., Term Loan | | | 5.126% | | | | 3-Month LIBOR | | | | 5.000% | | | | 4/12/26 | | | | B | | | | 629,467 | |
| | 20,397 | | | Total Specialty Retail | | | | | | | | | | | | | | | | | | | | | | | 20,363,212 | |
| | | |
| | | | Technology Hardware, Storage & Peripherals – 0.3% | | | | | | | |
| | | | | | | |
| | 2,366 | | | NCR Corporation, Term Loan | | | 2.630% | | | | 3-Month LIBOR | | | | 2.500% | | | | 8/28/26 | | | | BB+ | | | | 2,347,800 | |
| | | | | | | |
| | 995 | | | Peraton Corp., Term Loan B | | | 4.500% | | | | 1-Month LIBOR | | | | 3.750% | | | | 2/01/28 | | | | BB– | | | | 997,333 | |
| | 3,361 | | | Total Technology Hardware, Storage & Peripherals | | | | | | | | 3,345,133 | |
| | | |
| | | | Textiles, Apparel & Luxury Goods – 0.1% | | | | | | | |
| | | | | | | |
| | 1,489 | | | Canada Goose Inc., Term Loan | | | 4.250% | | | | 3-Month LIBOR | | | | 3.500% | | | | 10/07/27 | | | | BB | | | | 1,494,351 | |
| | | |
| | | | Transportation Infrastructure – 0.2% | | | | | | | |
| | | | | | | |
| | 2,000 | | | KKR Apple Bidco, LLC, Term Loan | | | 3.500% | | | | 1-Month LIBOR | | | | 3.000% | | | | 7/13/28 | | | | B+ | | | | 2,000,710 | |
| | |
| | | | Wireless Telecommunication Services – 0.4% | | | | |
| | | | | | | |
| | 2,521 | | | Altice Financing SA, Term Loan, First Lien | | | 2.900% | | | | 3-Month LIBOR | | | | 2.750% | | | | 1/31/26 | | | | B | | | | 2,482,426 | |
| | | | | | | |
| | 1,746 | | | GOGO Intermediate Holdings LLC, Term Loan B | | | 4.500% | | | | 3-Month LIBOR | | | | 3.750% | | | | 4/30/28 | | | | B | | | | 1,750,172 | |
| | 4,267 | | | Total Wireless Telecommunication Services | | | | | | | | 4,232,598 | |
| $ | 854,082 | | | Total Variable Rate Senior Loan Interests (cost $840,449,948) | | | | | | | | | | | | 845,773,929 | |
| | | | | | | |
Principal
Amount (000) | | | Description (1) | | Coupon | | | | | | | | | Maturity | | | Ratings (4) | | | Value | |
| | | |
| | | | CORPORATE BONDS – 13.6% | | | | | | | | | |
| | | | | | |
| | | | Auto Components – 0.3% | | | | | | | | | | | | | | | | |
| | | | | | | |
| $ | 500 | | | Adient Global Holdings Ltd, 144A | | | 4.875% | | | | | | | | | | | | 8/15/26 | | | | B | | | $ | 511,885 | |
| | | | | | | |
| | 2,210 | | | Adient US LLC, 144A | | | 9.000% | | | | | | | | | | | | 4/15/25 | | | | BB– | | | | 2,386,800 | |
| | 2,710 | | | Total Auto Components | | | | | | | | | | | | | | | | | | | | | | | 2,898,685 | |
| | | | | | | |
| | | | Chemicals – 0.2% | | | | | | | | | | | | | | | | | | |
| | | | | | | |
| | 1,500 | | | Rayonier AM Products Inc, 144A | | | 7.625% | | | | | | | | | | | | 1/15/26 | | | | B1 | | | | 1,591,875 | |
| | |
| | | | Commercial Services & Supplies – 1.7% | | | | |
| | | | | | | |
| | 3,800 | | | GFL Environmental Inc, 144A | | | 5.125% | | | | | | | | | | | | 12/15/26 | | | | BB– | | | | 3,990,418 | |
| | | | | | | |
| | 2,000 | | | GFL Environmental Inc, 144A | | | 4.750% | | | | | | | | | | | | 6/15/29 | | | | B– | | | | 2,055,000 | |
| | | | | | | |
| | 2,000 | | | Prime Security Services Borrower LLC / Prime Finance Inc, 144A | | | 5.250% | | | | | | | | | | | | 4/15/24 | | | | BB– | | | | 2,133,100 | |
| | | | | | | |
| | 8,500 | | | Prime Security Services Borrower LLC / Prime Finance Inc, 144A | | | 5.750% | | | | | | | | | | | | 4/15/26 | | | | BB– | | | | 9,194,963 | |
| | | | | | | |
| | 1,000 | | | Prime Security Services Borrower LLC / Prime Finance Inc, 144A | | | 6.250% | | | | | | | | | | | | 1/15/28 | | | | B– | | | | 1,033,780 | |
| | 17,300 | | | Total Commercial Services & Supplies | | | | | | | | 18,407,261 | |
44
| | | | | | | | | | | | | | | | | | | | | | | | | | | | |
Principal
Amount (000) | | | Description (1) | | Coupon | | | | | | | | | Maturity | | | Ratings (4) | | | Value | |
| | | | | | | |
| | | | Communications Equipment – 0.5% | | | | | | | | | | | | | | | | | | |
| | | | | | | |
| $ | 2,500 | | | CommScope Inc, 144A | | | 6.000% | | | | | | | | | | | | 3/01/26 | | | | Ba3 | | | $ | 2,595,825 | |
| | | | | | | |
| | 1,000 | | | CommScope Inc, 144A | | | 8.250% | | | | | | | | | | | | 3/01/27 | | | | B3 | | | | 1,046,725 | |
| | | | | | | |
| | 2,000 | | | Viasat Inc, 144A | | | 6.500% | | | | | | | | | | | | 7/15/28 | | | | BB– | | | | 2,106,440 | |
| | 5,500 | | | Total Communications Equipment | | | | | | | | | | | | | | | | | | | | | | | 5,748,990 | |
| | |
| | | | Diversified Telecommunication Services – 1.2% | | | | |
| | | | | | | |
| | 6,024 | | | Avaya Inc, 144A | | | 6.125% | | | | | | | | | | | | 9/15/28 | | | | BB | | | | 6,334,055 | |
| | | | | | | |
| | 3,900 | | | Lumen Technologies Inc | | | 5.800% | | | | | | | | | | | | 3/15/22 | | | | BB | | | | 3,974,100 | |
| | | | | | | |
| | 2,500 | | | Lumen Technologies Inc | | | 6.750% | | | | | | | | | | | | 12/01/23 | | | | BB | | | | 2,740,625 | |
| | 12,424 | | | Total Diversified Telecommunication Services | | | | | | | | | | | | 13,048,780 | |
| | | | | | | |
| | | | Electric Utilities – 0.6% | | | | | | | | | | | | | | | | | | |
| | | | | | | |
| | 5,340 | | | Bruce Mansfield Unit 1 2007 Pass Through Trust, (6) | | | 6.850% | | | | | | | | | | | | 6/01/34 | | | | N/R | | | | 6,675 | |
| | | | | | | |
| | 497 | | | Pacific Gas and Electric Co | | | 3.150% | | | | | | | | | | | | 1/01/26 | | | | BBB– | | | | 513,248 | |
| | | | | | | |
| | 1,218 | | | Pacific Gas and Electric Co | | | 4.550% | | | | | | | | | | | | 7/01/30 | | | | BBB– | | | | 1,317,489 | |
| | | | | | | |
| | 497 | | | Pacific Gas and Electric Co | | | 4.500% | | | | | | | | | | | | 7/01/40 | | | | BBB– | | | | 507,004 | |
| | | | | | | |
| | 1,907 | | | Pacific Gas and Electric Co | | | 4.450% | | | | | | | | | | | | 4/15/42 | | | | BBB– | | | | 1,899,153 | |
| | | | | | | |
| | 2,000 | | | PG&E Corp | | | 5.000% | | | | | | | | | | | | 7/01/28 | | | | BB | | | | 2,037,500 | |
| | 11,459 | | | Total Electric Utilities | | | | | | | | | | | | | | | | | | | | | | | 6,281,069 | |
| | | | | | | |
| | | | Energy Equipment & Services – 0.5% | | | | | | | | | | | | | | | | | | |
| | | | | | | |
| | 5,300 | | | Bausch Health Cos Inc, 144A | | | 6.125% | | | | | | | | | | | | 4/15/25 | | | | B | | | | 5,409,445 | |
| | |
| | | | Equity Real Estate Investment Trust – 0.7% | | | | |
| | | | | | | |
| | 2,000 | | | RLJ Lodging Trust LP, 144A | | | 3.750% | | | | | | | | | | | | 7/01/26 | | | | BB– | | | | 2,010,000 | |
| | | | | | | |
| | 5,565 | | | Uniti Group LP / Uniti Fiber Holdings Inc / CSL Capital LLC, 144A | | | 7.875% | | | | | | | | | | | | 2/15/25 | | | | BB+ | | | | 5,879,979 | |
| | 7,565 | | | Total Equity Real Estate Investment Trust | | | | | | | | | | | | | | | | | | | | | | | 7,889,979 | |
| | | | | | | |
| | | | Gas Utilities – 0.1% | | | | | | | | | | | | | | | | | | |
| | | | | | | |
| | 250 | | | NGL Energy Partners LP / NGL Energy Finance Corp | | | 7.500% | | | | | | | | | | | | 11/01/23 | | | | CCC+ | | | | 242,957 | |
| | | | | | | |
| | 250 | | | NGL Energy Partners LP / NGL Energy Finance Corp | | | 6.125% | | | | | | | | | | | | 3/01/25 | | | | CCC+ | | | | 220,673 | |
| | 500 | | | Total Gas Utilities | | | | | | | | | | | | | | | | | | | | | | | 463,630 | |
| | | | |
| | | | Health Care Equipment & Supplies – 0.4% | | | | | | | | | | |
| | | | | | | |
| | 4,000 | | | Legacy LifePoint Health LLC, 144A | | | 6.750% | | | | | | | | | | | | 4/15/25 | | | | B1 | | | | 4,203,400 | |
| | | | |
| | | | Health Care Providers & Services – 2.3% | | | | | | | | | | |
| | | | | | | |
| | 585 | | | CHS/Community Health Systems Inc, 144A | | | 8.000% | | | | | | | | | | | | 3/15/26 | | | | BB– | | | | 620,378 | |
| | | | | | | |
| | 350 | | | CHS/Community Health Systems Inc, 144A | | | 8.000% | | | | | | | | | | | | 12/15/27 | | | | BB– | | | | 381,500 | |
| | | | | | | |
| | 1,000 | | | CHS/Community Health Systems Inc, 144A | | | 6.875% | | | | | | | | | | | | 4/15/29 | | | | CCC | | | | 1,002,350 | |
| | | | | | | |
| | 1,901 | | | HCA Inc | | | 5.375% | | | | | | | | | | | | 2/01/25 | | | | Baa3 | | | | 2,124,367 | |
| | | | | | | |
| | 6,586 | | | Legacy LifePoint Health LLC, 144A | | | 4.375% | | | | | | | | | | | | 2/15/27 | | | | B1 | | | | 6,569,535 | |
| | | | | | | |
| | 2,000 | | | LifePoint Health Inc, 144A | | | 5.375% | | | | | | | | | | | | 1/15/29 | | | | CCC+ | | | | 1,945,000 | |
| | | | | | | |
| | 500 | | | RegionalCare Hospital Partners Holdings Inc / LifePoint Health Inc, 144A | | | 9.750% | | | | | | | | | | | | 12/01/26 | | | | CCC+ | | | | 528,125 | |
45
Nuveen Floating Rate Income Fund (continued)
Portfolio of Investments September 30, 2021
| | | | | | | | | | | | | | | | | | | | | | | | | | | | |
Principal
Amount (000) | | | Description (1) | | Coupon | | | | | | | | | Maturity | | | Ratings (4) | | | Value | |
| | |
| | | | Health Care Providers & Services (continued) | | | | |
| | | | | | | |
| $ | 412 | | | Tenet Healthcare Corp | | | 4.625% | | | | | | | | | | | | 7/15/24 | | | | B+ | | | $ | 418,180 | |
| | | | | | | |
| | 2,500 | | | Tenet Healthcare Corp, 144A | | | 4.625% | | | | | | | | | | | | 9/01/24 | | | | BB– | | | | 2,556,250 | |
| | | | | | | |
| | 2,500 | | | Tenet Healthcare Corp, 144A | | | 4.875% | | | | | | | | | | | | 1/01/26 | | | | B+ | | | | 2,587,300 | |
| | | | | | | |
| | 2,500 | | | Tenet Healthcare Corp, 144A | | | 4.625% | | | | | | | | | | | | 6/15/28 | | | | B+ | | | | 2,590,400 | |
| | | | | | | |
| | 3,000 | | | Tenet Healthcare Corp, 144A | | | 6.125% | | | | | | | | | | | | 10/01/28 | | | | B | | | | 3,151,425 | |
| | 23,834 | | | Total Health Care Providers & Services | | | | | | | | | | | | | | | | | | | | | | | 24,474,810 | |
| | | | | | | |
| | | | Hotels, Restaurants & Leisure – 1.4% | | | | | | | | | | | | | | | | | | |
| | | | | | | |
| | 9,730 | | | Caesars Entertainment Inc, 144A | | | 6.250% | | | | | | | | | | | | 7/01/25 | | | | B1 | | | | 10,243,330 | |
| | | | | | | |
| | 106 | | | Carnival Corp, 144A | | | 11.500% | | | | | | | | | | | | 4/01/23 | | | | Ba2 | | | | 118,323 | |
| | | | | | | |
| | 2,400 | | | MGM Resorts International | | | 7.750% | | | | | | | | | | | | 3/15/22 | | | | Ba3 | | | | 2,466,000 | |
| | | | | | | |
| | 1,500 | | | Wynn Las Vegas LLC / Wynn Las Vegas Capital Corp, 144A | | | 5.500% | | | | | | | | | | | | 3/01/25 | | | | BB– | | | | 1,530,000 | |
| | 13,736 | | | Total Hotels, Restaurants & Leisure | | | | | | | | | | | | | | | | | | | | | | | 14,357,653 | |
| | | | | | | |
| | | | Insurance – 0.3% | | | | | | | | | | | | | | | | | | |
| | | | | | | |
| | 3,500 | | | Alliant Holdings Intermediate LLC / Alliant Holdings Co-Issuer, 144A | | | 4.250% | | | | | | | | | | | | 10/15/27 | | | | B | | | | 3,535,000 | |
| | | | | | | |
| | | | Media – 1.6% | | | | | | | | | | | | | | | | | | |
| | | | | | | |
| | 1,000 | | | CCO Holdings LLC / CCO Holdings Capital Corp, 144A | | | 5.000% | | | | | | | | | | | | 2/01/28 | | | | BB+ | | | | 1,043,900 | |
| | | | | | | |
| | 900 | | | Clear Channel Outdoor Holdings Inc, 144A | | | 7.750% | | | | | | | | | | | | 4/15/28 | | | | CCC | | | | 947,250 | |
| | | | | | | |
| | 1,850 | | | Clear Channel Outdoor Holdings Inc, 144A | | | 7.500% | | | | | | | | | | | | 6/01/29 | | | | CCC | | | | 1,924,000 | |
| | | | | | | |
| | 3,000 | | | CSC Holdings LLC, 144A | | | 5.500% | | | | | | | | | | | | 4/15/27 | | | | BB | | | | 3,123,300 | |
| | | | | | | |
| | 1,955 | | | Diamond Sports Group LLC / Diamond Sports Finance Co, 144A | | | 5.375% | | | | | | | | | | | | 8/15/26 | | | | Caa1 | | | | 1,290,300 | |
| | | | | | | |
| | 2,000 | | | DISH DBS Corp | | | 5.000% | | | | | | | | | | | | 3/15/23 | | | | B2 | | | | 2,072,500 | |
| | | | | | | |
| | 2,000 | | | DISH DBS Corp | | | 5.875% | | | | | | | | | | | | 11/15/24 | | | | B2 | | | | 2,150,560 | |
| | | | | | | |
| | 1,000 | | | Houghton Mifflin Harcourt Publishers Inc, 144A | | | 9.000% | | | | | | | | | | | | 2/15/25 | | | | BB+ | | | | 1,063,550 | |
| | | | | | | |
| | 5 | | | iHeartCommunications Inc | | | 6.375% | | | | | | | | | | | | 5/01/26 | | | | B+ | | | | 5,474 | |
| | | | | | | |
| | 2 | | | iHeartCommunications Inc | | | 8.375% | | | | | | | | | | | | 5/01/27 | | | | CCC+ | | | | 2,004 | |
| | | | | | | |
| | 715 | | | Intelsat Luxembourg SA, (6) | | | 8.125% | | | | | | | | | | | | 6/01/23 | | | | N/R | | | | 5,363 | |
| | | | | | | |
| | 2,500 | | | Outfront Media Capital LLC / Outfront Media Capital Corp, 144A | | | 5.000% | | | | | | | | | | | | 8/15/27 | | | | B+ | | | | 2,564,125 | |
| | | | | | | |
| | 1,250 | | | Univision Communications Inc, 144A | | | 9.500% | | | | | | | | | | | | 5/01/25 | | | | B | | | | 1,356,250 | |
| | 18,177 | | | Total Media | | | | | | | | | | | | | | | | | | | | | | | 17,548,576 | |
| | | | | | | |
| | | | Oil, Gas & Consumable Fuels – 1.0% | | | | | | | | | | | | | | | | | | |
| | | | | | | |
| | 1,000 | | | Callon Petroleum Co | | | 6.125% | | | | | | | | | | | | 10/01/24 | | | | B– | | | | 982,730 | |
| | | | | | | |
| | 2,000 | | | Callon Petroleum Co, 144A | | | 9.000% | | | | | | | | | | | | 4/01/25 | | | | N/R | | | | 2,162,610 | |
| | | | | | | |
| | 282 | | | Calumet Specialty Products Partners LP / Calumet Finance Corp | | | 7.625% | | | | | | | | | | | | 1/15/22 | | | | B– | | | | 280,590 | |
| | | | | | | |
| | 972 | | | Calumet Specialty Products Partners LP / Calumet Finance Corp, 144A | | | 9.250% | | | | | | | | | | | | 7/15/24 | | | | BB– | | | | 1,054,620 | |
46
| | | | | | | | | | | | | | | | | | | | | | | | | | | | |
Principal
Amount (000) | | | Description (1) | | Coupon | | | | | | | | | Maturity | | | Ratings (4) | | | Value | |
| | | | | | | |
| | | | Oil, Gas & Consumable Fuels (continued) | | | | | | | | | | | | | | | | | | |
| | | | | | | |
| $ | 1,500 | | | Citgo Holding Inc, 144A | | | 9.250% | | | | | | | | | | | | 8/01/24 | | | | B+ | | | $ | 1,511,250 | |
| | | | | | | |
| | 500 | | | Gulfport Energy Operating Corp, 144A | | | 8.000% | | | | | | | | | | | | 5/17/26 | | | | BB– | | | | 546,250 | |
| | | | | | | |
| | 1,000 | | | Matador Resources Co | | | 5.875% | | | | | | | | | | | | 9/15/26 | | | | B+ | | | | 1,033,700 | |
| | | | | | | |
| | 3,000 | | | NGL Energy Operating LLC / NGL Energy Finance Corp, 144A | | | 7.500% | | | | | | | | | | | | 2/01/26 | | | | BB– | | | | 3,056,250 | |
| | 10,254 | | | Total Oil, Gas & Consumable Fuels | | | | | | | | | | | | | | | | | | | | | | | 10,628,000 | |
| | | | | | | |
| | | | Pharmaceuticals – 0.5% | | | | | | | | | | | | | | | | | | |
| | | | | | | |
| | 5,000 | | | Bausch Health Cos Inc, 144A | | | 9.000% | | | | | | | | | | | | 12/15/25 | | | | B | | | | 5,277,375 | |
| | | | | | | |
| | 481 | | | Par Pharmaceutical Inc, 144A | | | 7.500% | | | | | | | | | | | | 4/01/27 | | | | B– | | | | 490,019 | |
| | 5,481 | | | Total Pharmaceuticals | | | | | | | | | | | | | | | | | | | | | | | 5,767,394 | |
| | | | | | | |
| | | | Specialty Retail – 0.3% | | | | | | | | | | | | | | | | | | |
| | | | | | | |
| | 400 | | | Party City Holdings Inc, 144A | | | 8.750% | | | | | | | | | | | | 2/15/26 | | | | CCC+ | | | | 418,500 | |
| | | | | | | |
| | 2,200 | | | PetSmart Inc / PetSmart Finance Corp, 144A | | | 7.750% | | | | | | | | | | | | 2/15/29 | | | | CCC+ | | | | 2,400,750 | |
| | 2,600 | | | Total Specialty Retail | | | | | | | | | | | | | | | | | | | | | | | 2,819,250 | |
| $ | 145,840 | | | Total Corporate Bonds (cost $143,482,557) | | | | | | | | | | | | 145,073,797 | |
| | | | | | | |
| Shares | | | Description (1) | | | | | | | | | | | | | | | | | Value | |
| | | | | | | |
| | | | COMMON STOCKS – 2.0% | | | | | | | | | | | | | | | | | | | | | | | | |
| | | | | | | |
| | | | Banks – 0.0% | | | | | | | | | | | | | | | | | | |
| | | | | | | |
| | 28,137 | | | iQor US Inc, (9), (10) | | | | | | | | | | | | | | | | | | | | | | $ | 332,382 | |
| | | | | | | |
| | | | Construction & Engineering – 0.0% | | | | | | | | | | | | | | | | | | |
| | | | | | | |
| | 4,761 | | | TNT Crane & Rigging Inc, (9), (10) | | | | | | | | | | | | | | | | | | | | | | | 7,141 | |
| | | | | | | |
| | 2,687 | | | TNT Crane & Rigging Inc, (9), (10) | | | | | | | | | | | | | | | | | | | | | | | 47,528 | |
| | | | Total Construction & Engineering | | | | | | | | | | | | | | | | | | | | | | | 54,669 | |
| | | | | | | |
| | | | Diversified Consumer Services – 0.0% | | | | | | | | | | | | | | | | | | |
| | | | | |
| | 17,726 | | | Cengage Learning Holdings II Inc, (9), (10) | | | | | | | | | | | | | | | | 376,677 | |
| | |
| | | | Diversified Telecommunication Services – 0.1% | | | | |
| | | | | | | |
| | 24,672 | | | Windstream Services PE LLC, (9), (10) | | | | | | | | | | | | | | | | | | | | | | | 376,248 | |
| | | | | | | |
| | 18,781 | | | Windstream Services PE LLC, (9), (10) | | | | | | | | | | | | | | | | | | | | | | | 272,324 | |
| | | | Total Diversified Telecommunication Services | | | | | | | | | | | | 648,572 | |
| | | | | | | |
| | | | Electric Utilities – 0.4% | | | | | | | | | | | | | | | | | | |
| | | | | | | |
| | 115,290 | | | Energy Harbor Corp, (9), (10), (11) | | | | | | | | | | | | | | | | | | | | | | | 4,636,849 | |
| | | | | | | |
| | | | Energy Equipment & Services – 0.0% | | | | | | | | | | | | | | | | | | |
| | | | | | | |
| | 76,990 | | | Transocean Ltd, (10) | | | | | | | | | | | | | | | | | | | | | | | 291,792 | |
| | | | | | | |
| | 5,884 | | | Vantage Drilling International, (9), (10) | | | | | | | | | | | | | | | | | | | | | | | 24,519 | |
| | | | Total Energy Equipment & Services | | | | | | | | | | | | | | | | | | | | | | | 316,311 | |
47
Nuveen Floating Rate Income Fund (continued)
Portfolio of Investments September 30, 2021
| | | | | | | | | | | | | | | | | | | | | | | | | | | | |
Shares | | | Description (1) | | | | | | | | | | | | | | | | | Value | |
| | | | | | | |
| | | | Health Care Providers & Services – 0.0% | | | | | | | | | | | | | | | | | | |
| | | | | | | |
| | 61,430 | | | Millennium Health LLC, (8), (10) | | | | | | | | | | | | | | | | | | | | | | $ | 57,376 | |
| | | | | | | |
| | 57,666 | | | Millennium Health LLC, (8), (10) | | | | | | | | | | | | | | | | | | | | | | | 48,093 | |
| | | | Total Health Care Providers & Services | | | | | | | | | | | | | | | | | | | | | | | 105,469 | |
| | | | | | | |
| | | | Hotels, Restaurants & Leisure – 0.1% | | | | | | | | | | | | | | | | | | |
| | | | | | | |
| | 76,044 | | | 24 Hour Fitness Worldwide Inc, (9) | | | | | | | | | | | | | | | | | | | | | | | 209,121 | |
| | | | | | | |
| | 159,883 | | | 24 Hour Fitness Worldwide Inc, (9), (10) | | | | | | | | | | | | | | | | | | | | | | | 319,766 | |
| | | | Total Hotels, Restaurants & Leisure | | | | | | | | | | | | | | | | | | | | | | | 528,887 | |
| | | | | | | |
| | | | Internet & Direct Marketing Retail – 0.0% | | | | | | | | | | | | | | | | | | |
| | | | | | | |
| | 7,503 | | | Catalina Marketing Corp, (9), (10) | | | | | | | | | | | | | | | | | | | | | | | 22,509 | |
| | | | | | | |
| | | | Marine – 0.0% | | | | | | | | | | | | | | | | | | |
| | | | | | | |
| | 1,018 | | | ACBL HLDG CORP, (9), (10) | | | | | | | | | | | | | | | | | | | | | | | 22,142 | |
| | | | | | | |
| | | | Media – 0.2% | | | | | | | | | | | | | | | | | | |
| | | | | | | |
| | 743,859 | | | Clear Channel Outdoor Holdings Inc, (10) | | | | | | | | | | | | | | | | | | | | | | | 2,015,858 | |
| | | | | | | |
| | 7 | | | Cumulus Media Inc, (10) | | | | | | | | | | | | | | | | | | | | | | | 86 | |
| | | | Total Media | | | | | | | | | | | | | | | | | | | | | | | 2,015,944 | |
| | | | | | | |
| | | | Multiline Retail – 0.0% | | | | | | | | | | | | | | | | | | |
| | | | | | | |
| | 99 | | | Belk Inc, (9), (10) | | | | | | | | | | | | | | | | | | | | | | | 1,436 | |
| | | | | | | |
| | | | Oil, Gas & Consumable Fuels – 1.1% | | | | | | | | | | | | | | | | | | |
| | | | | | | |
| | 62,930 | | | California Resources Corp, (10) | | | | | | | | | | | | | | | | | | | | | | | 2,580,130 | |
| | | | | | | |
| | 85,364 | | | Fieldwood Energy LLC, (9), (10) | | | | | | | | | | | | | | | | | | | | | | | 8,536,400 | |
| | | | | | | |
| | 3,891 | | | Whiting Petroleum Corp, (10) | | | | | | | | | | | | | | | | | | | | | | | 227,273 | |
| | | | Total Oil, Gas & Consumable Fuels | | | | | | | | | | | | | | | | | | | | | | | 11,343,803 | |
| | | | | | | |
| | | | Professional Services – 0.1% | | | | | | | | | | | | | | | | | | |
| | | | | | | |
| | 109,622 | | | Skillsoft Corp, (8), (10) | | | | | | | | | | | | | | | | | | | | | | | 1,158,674 | |
| | | | Total Common Stocks (cost $27,614,726) | | | | | | | | | | | | | | | | | | | | | | | 21,564,324 | |
| | | | | | | |
| Shares | | | Description (1) | | | | | | | | | | | | | | | | | Value | |
| | | | | | | |
| | | | WARRANTS – 0.6% | | | | | | | | | | | | | | | | | | | | | | | | |
| | | | | | | |
| | | | Communications Equipment – 0.0% | | | | | | | | | | | | | | | | | | |
| | | | | | | |
| | 16,108 | | | Avaya Holdings Corp, (9) | | | | | | | | | | | | | | | | | | | | | | $ | 34,149 | |
| | | | | | | |
| | | | Marine – 0.0% | | | | | | | | | | | | | | | | | | |
| | | | | | | |
| | 1,071 | | | ACBL HLDG CORP, (9) | | | | | | | | | | | | | | | | | | | | | | | 23,294 | |
| | | | | | | |
| | 3,984 | | | ACBL HLDG CORP, (9) | | | | | | | | | | | | | | | | | | | | | | | 102,257 | |
| | | | | | | |
| | 3,029 | | | ACBL HLDG CORP, (9) | | | | | | | | | | | | | | | | | | | | | | | 91,627 | |
| | | | | | | |
| | 19,920 | | | American Commercial Barge Line LLC, (8) | | | | | | | | | | | | | | | | | | | | | | | 6,554 | |
| | | | Total Marine | | | | | | | | | | | | | | | | | | | | | | | 223,732 | |
| | | | | | | |
| | | | Industrial Conglomerates – 0.0% | | | | | | | | | | | | | | | | | | |
| | | | | | | |
| | 15,145 | | | American Commercial Barge Line LLC, (8) | | | | | | | | | | | | | | | | | | | | | | | 6,649 | |
48
| | | | | | | | | | | | | | | | | | | | | | | | | | | | |
Shares | | | Description (1) | | | | | | | | | | | | | | | | | Value | |
| | | | | | | |
| | | | Oil, Gas & Consumable Fuels – 0.6% | | | | | | | | | | | | | | | | | | |
| | | | | | | |
| | 500 | | | California Resources Corp | | | | | | | | | | | | | | | | | | | | | | $ | 6,000 | |
| | | | | | | |
| | 55,057 | | | Fieldwood Energy LLC, (9) | | | | | | | | | | | | | | | | | | | | | | | 5,505,700 | |
| | | | | | | |
| | 28,708 | | | Fieldwood Energy LLC, (9) | | | | | | | | | | | | | | | | | | | | | | | 258,372 | |
| | | | | | | |
| | 55,290 | | | Fieldwood Energy LLC, (9) | | | | | | | | | | | | | | | | | | | | | | | 276,450 | |
| | | | Total Oil, Gas & Consumable Fuels | | | | | | | | | | | | | | | | | | | | | | | 6,046,522 | |
| | | | | | | |
| | | | Entertainment – 0.0% | | | | | | | | | | | | | | | | | | |
| | | | | | | |
| | 90,106 | | | Cineworld Warrant, (9) | | | | | | | | | | | | | | | | | | | | | | | 33,159 | |
| | | | Total Warrants (cost $2,155,034) | | | | | | | | | | | | | | | | | | | | | | | 6,344,211 | |
| | | | | | | |
| Shares | | | Description (1) | | | | | | | | | | | Coupon | | | Ratings (4) | | | Value | |
| | |
| | | | CONVERTIBLE PREFERRED SECURITIES – 0.0% | | | | | |
| | | | | | | |
| | | | Marine – 0.0% | | | | | | | | | | | | | | | | | | |
| | | | | | | |
| | 3,789 | | | ACBL HLDG CORP, (9), (10) | | | | | | | | | | | | | | | 0.000% | | | | N/R | | | $ | 97,252 | |
| | | | | | | |
| | 4,313 | | | ACBL HLDG CORP, (9), (10) | | | | | | | | | | | | | | | 0.000% | | | | N/R | | | | 130,468 | |
| | | | Total Marine | | | | | | | | | | | | | | | | | | | | | | | 227,720 | |
| | | | Total Convertible Preferred Securities (cost $230,061) | | | | | | | | | | | | 227,720 | |
| | | | Total Long-Term Investments (cost $1,013,932,326) | | | | | | | | | | | | 1,018,983,981 | |
| | | | | | | |
| Shares | | | Description (1) | | | | | | | | | | | Coupon | | | | | | Value | |
| | | | | | | |
| | | | SHORT-TERM INVESTMENTS – 11.8% | | | | | | | | | | | | | | | | | | |
| | | | | | | |
| | | | INVESTMENT COMPANIES – 11.8% | | | | | | | | | | | | | | | | | | |
| | | | | | | |
| | 126,308,045 | | | BlackRock Liquidity Funds T-Fund Portfolio | | | | | | | | | | | | | | | 0.100% (12) | | | | | | | $ | 126,308,045 | |
| | | | Total Short-Term Investments (cost $126,308,045) | | | | | | | | | | | | 126,308,045 | |
| | | | Total Investments (cost $1,140,240,371) – 107.2% | | | | | | | | | | | | 1,145,292,026 | |
| | | | Other Assets Less Liabilities – (7.2)% | | | | | | | | | | | | | | | | | | | | (76,633,019) | |
| | | | Net Assets – 100% | | | | | | | | | | | | | | | | | | | | | | $ | 1,068,659,007 | |
49
Nuveen Floating Rate Income Fund (continued)
Portfolio of Investments September 30, 2021
For Fund portfolio compliance purposes, the Fund’s industry classifications refer to any one or more of the industry sub-classifications used by one or more widely recognized market indexes or ratings group indexes, and/or as defined by Fund management. This definition may not apply for purposes of this report, which may combine industry sub-classifications into sectors for reporting ease.
| (1) | All percentages shown in the Portfolio of Investments are based on net assets. |
| (2) | Senior loans generally pay interest at rates which are periodically adjusted by reference to a base short-term, floating lending rate (Reference Rate) plus an assigned fixed rate (Spread). These floating lending rates are generally (i) the lending rate referenced by the London Inter-Bank Offered Rate (“LIBOR”), or (ii) the prime rate offered by one or more major United States banks. Senior loans may be considered restricted in that the Fund ordinarily is contractually obligated to receive approval from the agent bank and/or borrower prior to the disposition of a senior loan. The rate shown is the coupon as of the end of the reporting period. |
| (3) | Senior Loans generally are subject to mandatory and/or optional prepayment. Because of these mandatory prepayment conditions and because there may be significant economic incentives for a borrower to prepay, prepayments of senior loans may occur. As a result, the actual remaining maturity of senior loans held may be substantially less than the stated maturities shown. |
| (4) | For financial reporting purposes, the ratings disclosed are the highest of Standard & Poor’s Group (“Standard & Poor’s”), Moody’s Investors Service, Inc. (“Moody’s”) or Fitch, Inc. (“Fitch”) rating. This treatment of split-rated securities may differ from that used for other purposes, such as for Fund investment policies. Ratings below BBB by Standard & Poor’s, Baa by Moody’s or BBB by Fitch are considered to be below investment grade. Holdings designated N/R are not rated by any of these national rating agencies. Ratings are not covered by the report of independent registered public accounting firm. |
| (5) | Investment, or portion of investment, represents an outstanding unfunded senior loan commitment. |
| (6) | Defaulted security. A security whose issuer has failed to fully pay principal and/or interest when due, or is under the protection of bankruptcy. |
| (7) | Principal Amount (000) rounds to less than $1,000. |
| (8) | Investment valued at fair value using methods determined in good faith by, or at the discretion of, the Board. For fair value measurement disclosure purposes, investment classified as Level 3. |
| (9) | For fair value measurement disclosure purposes, investment classified as Level 2. |
| (10) | Non-income producing; issuer has not declared an ex-dividend date within the past twelve months. |
| (11) | Common Stock received as part of the bankruptcy settlements during February 2020 for Bruce Mansfield Unit 1 2007 Pass-Through Trust. |
| (12) | The rate shown is the annualized seven-day subsidized yield as of end of the reporting period. |
| 144A | Investment is exempt from registration under Rule 144A of the Securities Act of 1933, as amended. These investments may only be resold in transactions exempt from registration, which are normally those transactions with qualified institutional buyers. |
| DD1 | Portion of investment purchased on a delayed delivery basis. |
| LIBOR | London Inter-Bank Offered Rate |
| PIK | Payment-in-kind (“PIK”) security. Depending on the terms of the security, income may be received in the form of cash, securities, or a combination of both. The PIK rate shown, where applicable, represents the annualized rate of the last PIK payment made by the issuer as of the end of the reporting period. |
| TBD | Senior loan purchased on a when-issued or delayed-delivery basis. Certain details associated with this purchase are not known prior to the settlement date of the transaction. In addition, senior loans typically trade without accrued interest and therefore a coupon rate is not available prior to settlement. At settlement, if still unknown, the borrower or counterparty will provide the Fund with the final coupon rate and maturity date. |
| WI/DD | Purchased on a when-issued or delayed delivery basis. |
See accompanying notes to financial statements.
50
Statement of Assets and Liabilities
September 30, 2021
| | | | | | | | |
| | | High Yield
Income | | | Floating Rate Income | |
| | |
Assets | | | | | | | | |
| | |
Long-term investments, at value (cost $635,377,792 and $1,013,932,326, respectively)(1) | | $ | 642,168,003 | | | $ | 1,018,983,981 | |
| | |
Investment purchased with collateral from securities lending, at value (cost approximates value) | | | 10,618,982 | | | | — | |
| | |
Short-term investments, at value (cost approximates value) | | | 36,883,600 | | | | 126,308,045 | |
| | |
Receivable for: | | | | | | | | |
| | |
Interest | | | 7,987,249 | | | | 5,854,653 | |
| | |
Investments sold | | | 13,885,818 | | | | 51,573,223 | |
| | |
Reclaims | | | 8,556 | | | | — | |
| | |
Shares sold | | | 1,083,832 | | | | 11,995,805 | |
| | |
Other assets | | | 100,374 | | | | 172,000 | |
| | |
Total assets | | | 712,736,414 | | | | 1,214,887,707 | |
| | |
Liabilities | | | | | | | | |
| | |
Cash overdraft | | | 497,704 | | | | 2,101,268 | |
| | |
Payable for: | | | | | | | | |
| | |
Collateral from securities lending program | | | 10,618,982 | | | | — | |
| | |
Dividends | | | 104,880 | | | | 397,443 | |
| | |
Investments purchased - regular settlement | | | 8,456,787 | | | | 3,290,861 | |
| | |
Investments purchased - when-issued/delayed-delivery settlement | | | 20,435,447 | | | | 134,594,059 | |
| | |
Shares redeemed | | | 745,401 | | | | 3,414,373 | |
| | |
Unfunded senior loans | | | — | | | | 1,280,336 | |
| | |
Accrued expenses: | | | | | | | | |
| | |
Management fees | | | 256,727 | | | | 493,606 | |
| | |
Trustees fees | | | 62,882 | | | | 101,203 | |
| | |
12b-1 distribution and service fees | | | 36,153 | | | | 51,002 | |
| | |
Other | | | 430,120 | | | | 504,549 | |
| | |
Total liabilities | | | 41,645,083 | | | | 146,228,700 | |
| | |
Net assets | | $ | 671,091,331 | | | $ | 1,068,659,007 | |
See accompanying notes to financial statements.
51
Statement of Assets and Liabilities (continued)
| | | | | | | | |
| | | High Yield
Income | | | Floating Rate Income | |
| | |
Class A Shares | | | | | | | | |
| | |
Net assets | | $ | 53,994,459 | | | $ | 121,924,757 | |
| | |
Shares outstanding | | | 2,731,370 | | | | 6,397,700 | |
| | |
Net asset value (“NAV”) per share | | $ | 19.77 | | | $ | 19.06 | |
| | |
Offering price per share (NAV per share plus maximum sales charge of 4.75% and 3.00%, respectively, of offering price) | | $ | 20.76 | | | $ | 19.65 | |
| | |
Class C Shares | | | | | | | | |
| | |
Net assets | | $ | 30,390,539 | | | $ | 34,192,493 | |
| | |
Shares outstanding | | | 1,538,908 | | | | 1,794,151 | |
| | |
NAV and offering price per share | | $ | 19.75 | | | $ | 19.06 | |
| | |
Class R6 Shares | | | | | | | | |
| | |
Net assets | | $ | 7,567,694 | | | $ | 83,969,713 | |
| | |
Shares outstanding | | | 380,763 | | | | 4,383,248 | |
| | |
NAV and offering price per share | | $ | 19.88 | | | $ | 19.16 | |
| | |
Class I Shares | | | | | | | | |
| | |
Net assets | | $ | 579,138,639 | | | $ | 828,572,044 | |
| | |
Shares outstanding | | | 29,261,980 | | | | 43,424,762 | |
| | |
NAV and offering price per share | | $ | 19.79 | | | $ | 19.08 | |
| | |
Net assets consist of: | | | | | | | | |
| | |
Capital paid-in | | $ | 816,104,346 | | | $ | 1,259,061,552 | |
| | |
Total distributable earnings | | | (145,013,015 | ) | | | (190,402,545 | ) |
| | |
Fund level net assets | | $ | 671,091,331 | | | $ | 1,068,659,007 | |
| | |
Authorized shares – per class | | | Unlimited | | | | Unlimited | |
| | |
Par value per share | | $ | 0.01 | | | $ | 0.01 | |
| (1) | Includes securities loaned of $10,194,166 for High Yield Income. |
See accompanying notes to financial statements.
52
Statement of Operations
Year Ended September 30, 2021
| | | | | | | | |
| | | High Yield
Income | | | Floating
Rate Income | |
| | |
Investment Income | | | | | | | | |
| | |
Interest and dividends | | $ | 32,296,511 | | | $ | 39,490,108 | |
| | |
Securities lending income, net | | | 51,489 | | | | — | |
| | |
Total investment income | | | 32,348,000 | | | | 39,490,108 | |
| | |
Expenses | | | | | | | | |
| | |
Management fees | | | 3,504,490 | | | | 4,690,093 | |
| | |
12b-1 service fees – Class A Shares | | | 118,984 | | | | 236,755 | |
| | |
12b-1 distribution and service fees – Class C Shares | | | 334,422 | | | | 321,984 | |
| | |
Shareholder servicing agent fees | | | 676,100 | | | | 633,965 | |
| | |
Custodian fees | | | 106,017 | | | | 232,421 | |
| | |
Trustees fees | | | 16,801 | | | | 22,144 | |
| | |
Professional fees | | | 282,893 | | | | 220,759 | |
| | |
Shareholder reporting expenses | | | 136,592 | | | | 159,474 | |
| | |
Federal and state registration fees | | | 101,999 | | | | 109,389 | |
| | |
Other | | | 37,532 | | | | 193,841 | |
| | |
Total expenses before fee waiver/expense reimbursement | | | 5,315,830 | | | | 6,820,825 | |
| | |
Fee waiver/expense reimbursement | | | (412,776 | ) | | | — | |
| | |
Net expenses | | | 4,903,054 | | | | 6,820,825 | |
| | |
Net investment income (loss) | | | 27,444,946 | | | | 32,669,283 | |
| | |
Realized and Unrealized Gain (Loss) | | | | | | | | |
| | |
Net realized gain (loss) from investments | | | 14,738,521 | | | | (8,740,231 | ) |
| | |
Change in net unrealized appreciation (depreciation) of investments | | | 26,995,711 | | | | 62,295,861 | |
| | |
Net realized and unrealized gain (loss) | | | 41,734,232 | | | | 53,555,630 | |
| | |
Net increase (decrease) in net assets from operations | | $ | 69,179,178 | | | $ | 86,224,913 | |
See accompanying notes to financial statements.
53
Statement of Changes in Net Assets
| | | | | | | | | | | | | | | | | | | | |
| | | High
Yield Income | | | | | | Floating
Rate Income | |
| | | Year Ended
9/30/21 | | | Year Ended
9/30/20 | | | | | | Year Ended
9/30/21 | | | Year Ended
9/30/20 | |
| | | | | |
Operations | | | | | | | | | | | | | | | | | | | | |
| | | | | |
Net investment income (loss) | | $ | 27,444,946 | | | $ | 30,038,055 | | | | | | | $ | 32,669,283 | | | $ | 41,831,565 | |
| | | | | |
Net realized gain (loss) from: | | | | | | | | | | | | | | | | | | | | |
| | | | | |
Investments | | | 14,738,521 | | | | (29,094,856 | ) | | | | | | | (8,740,231 | ) | | | (48,008,589 | ) |
| | | | | |
Swaps | | | — | | | | (206,372 | ) | | | | | | | — | | | | — | |
| | | | | |
Change in net unrealized appreciation (depreciation) of investments | | | 26,995,711 | | | | (12,437,874 | ) | | | | | | | 62,295,861 | | | | (27,077,548 | ) |
| | | | | |
Net increase (decrease) in net assets from operations | | | 69,179,178 | | | | (11,701,047 | ) | | | | | | | 86,224,913 | | | | (33,254,572 | ) |
| | | | | |
Distributions to Shareholders | | | | | | | | | | | | | | | | | | | | |
| | | | | |
Dividends: | | | | | | | | | | | | | | | | | | | | |
| | | | | |
Class A Shares | | | (2,442,754 | ) | | | (3,048,610 | ) | | | | | | | (3,923,887 | ) | | | (5,043,261 | ) |
| | | | | |
Class C Shares | | | (1,478,044 | ) | | | (2,278,339 | ) | | | | | | | (1,099,742 | ) | | | (1,881,098 | ) |
| | | | | |
Class R6 Shares | | | (382,235 | ) | | | (391,970 | ) | | | | | | | (3,286,851 | ) | | | (2,956,643 | ) |
| | | | | |
Class I Shares | | | (27,432,689 | ) | | | (27,070,848 | ) | | | | | | | (26,580,531 | ) | | | (39,658,769 | ) |
| | | | | |
Decrease in net assets from distributions to shareholders | | | (31,735,722 | ) | | | (32,789,767 | ) | | | | | | | (34,891,011 | ) | | | (49,539,771 | ) |
| | | | | |
Fund Share Transactions | | | | | | | | | | | | | | | | | | | | |
| | | | | |
Proceeds from sale of shares | | | 297,420,498 | | | | 327,766,372 | | | | | | | | 648,316,331 | | | | 411,707,659 | |
| | | | | |
Proceeds from shares issued to shareholders due to reinvestment of distributions | | | 30,297,730 | | | | 30,907,131 | | | | | | | | 31,264,656 | | | | 44,804,076 | |
| | | | | |
| | | 327,718,228 | | | | 358,673,503 | | | | | | | | 679,580,987 | | | | 456,511,735 | |
| | | | | |
Cost of shares redeemed | | | (204,424,085 | ) | | | (405,072,906 | ) | | | | | | | (377,359,108 | ) | | | (774,402,165 | ) |
| | | | | |
Net increase (decrease) in net assets from Fund share transactions | | | 123,294,143 | | | | (46,399,403 | ) | | | | | | | 302,221,879 | | | | (317,890,430 | ) |
| | | | | |
Net increase (decrease) in net assets | | | 160,737,599 | | | | (90,890,217 | ) | | | | | | | 353,555,781 | | | | (400,684,773 | ) |
| | | | | |
Net assets at the beginning of period | | | 510,353,732 | | | | 601,243,949 | | | | | | | | 715,103,226 | | | | 1,115,787,999 | |
| | | | | |
Net assets at the end of period | | $ | 671,091,331 | | | $ | 510,353,732 | | | | | | | $ | 1,068,659,007 | | | $ | 715,103,226 | |
See accompanying notes to financial statements.
54
THIS PAGE INTENTIONALLY LEFT BLANK
55
Financial Highlights
High Yield Income
Selected data for a share outstanding throughout each period:
| | | | | | | | | | | | | | | | | | | | | | | | | | | | | | | | | | | | |
| | | | | |
| | | | | | Investment Operations | | | | | | Less Distributions | | | | |
| | | | | | | | | |
Class (Commencement Date) Year Ended September 30, | | Beginning
NAV | | | Net
Investment
Income
(Loss)(a) | | | Net
Realized/
Unrealized
Gain (Loss) | | | Total | | | | | | From
Net
Investment
Income | | | From
Accumulated
Net Realized
Gains
| | | Total | | | Ending
NAV | |
| | | | | | | | |
Class A (4/10) | | | | | | | | | | | | | | | | | | | | | | | | | | | | | | | | | |
| | | | | | | | | |
2021 | | $ | 18.51 | | | $ | 0.86 | | | $ | 1.40 | | | $ | 2.26 | | | | | | | $ | (1.00 | ) | | $ | — | | | $ | (1.00 | ) | | $ | 19.77 | |
| | | | | | | | | |
2020 | | | 20.16 | | | | 1.04 | | | | (1.57 | ) | | | (0.53 | ) | | | | | | | (1.12 | ) | | | — | | | | (1.12 | ) | | | 18.51 | |
| | | | | | | | | |
2019 | | | 20.14 | | | | 1.03 | | | | 0.07 | | | | 1.10 | | | | | | | | (1.08 | ) | | | — | | | | (1.08 | ) | | | 20.16 | |
| | | | | | | | | |
2018 | | | 20.36 | | | | 1.04 | | | | (0.12 | ) | | | 0.92 | | | | | | | | (1.14 | ) | | | — | | | | (1.14 | ) | | | 20.14 | |
| | | | | | | | | |
2017 | | | 20.11 | | | | 1.25 | | | | 0.50 | | | | 1.75 | | | | | | | | (1.50 | ) | | | — | | | | (1.50 | ) | | | 20.36 | |
| | | | | | | | |
Class C (4/10) | | | | | | | | | | | | | | | | | | | | | | | | | | | | | | | | | |
| | | | | | | | | |
2021 | | | 18.49 | | | | 0.72 | | | | 1.40 | | | | 2.12 | | | | | | | | (0.86 | ) | | | — | | | | (0.86 | ) | | | 19.75 | |
| | | | | | | | | |
2020 | | | 20.14 | | | | 0.89 | | | | (1.56 | ) | | | (0.67 | ) | | | | | | | (0.98 | ) | | | — | | | | (0.98 | ) | | | 18.49 | |
| | | | | | | | | |
2019 | | | 20.11 | | | | 0.88 | | | | 0.08 | | | | 0.96 | | | | | | | | (0.93 | ) | | | — | | | | (0.93 | ) | | | 20.14 | |
| | | | | | | | | |
2018 | | | 20.33 | | | | 0.89 | | | | (0.13 | ) | | | 0.76 | | | | | | | | (0.98 | ) | | | — | | | | (0.98 | ) | | | 20.11 | |
| | | | | | | | | |
2017 | | | 20.08 | | | | 1.11 | | | | 0.49 | | | | 1.60 | | | | | | | | (1.35 | ) | | | — | | | | (1.35 | ) | | | 20.33 | |
| | | | | | | | |
Class R6 (10/14) | | | | | | | | | | | | | | | | | | | | | | | | | | | | | | | | | |
| | | | | | | | | |
2021 | | | 18.60 | | | | 0.93 | | | | 1.42 | | | | 2.35 | | | | | | | | (1.07 | ) | | | — | | | | (1.07 | ) | | | 19.88 | |
| | | | | | | | | |
2020 | | | 20.25 | | | | 1.11 | | | | (1.57 | ) | | | (0.46 | ) | | | | | | | (1.19 | ) | | | — | | | | (1.19 | ) | | | 18.60 | |
| | | | | | | | | |
2019 | | | 20.22 | | | | 1.11 | | | | 0.07 | | | | 1.18 | | | | | | | | (1.15 | ) | | | — | | | | (1.15 | ) | | | 20.25 | |
| | | | | | | | | |
2018 | | | 20.42 | | | | 1.12 | | | | (0.13 | ) | | | 0.99 | | | | | | | | (1.19 | ) | | | — | | | | (1.19 | ) | | | 20.22 | |
| | | | | | | | | |
2017 | | | 20.14 | | | | 1.39 | | | | 0.45 | | | | 1.84 | | | | | | | | (1.56 | ) | | | — | | | | (1.56 | ) | | | 20.42 | |
| | | | | | | | |
Class I (4/10) | | | | | | | | | | | | | | | | | | | | | | | | | | | | | | | | | |
| | | | | | | | | |
2021 | | | 18.53 | | | | 0.91 | | | | 1.40 | | | | 2.31 | | | | | | | | (1.05 | ) | | | — | | | | (1.05 | ) | | | 19.79 | |
| | | | | | | | | |
2020 | | | 20.17 | | | | 1.08 | | | | (1.55 | ) | | | (0.47 | ) | | | | | | | (1.17 | ) | | | — | | | | (1.17 | ) | | | 18.53 | |
| | | | | | | | | |
2019 | | | 20.15 | | | | 1.08 | | | | 0.07 | | | | 1.15 | | | | | | | | (1.13 | ) | | | — | | | | (1.13 | ) | | | 20.17 | |
| | | | | | | | | |
2018 | | | 20.37 | | | | 1.10 | | | | (0.13 | ) | | | 0.97 | | | | | | | | (1.19 | ) | | | — | | | | (1.19 | ) | | | 20.15 | |
| | | | | | | | | |
2017 | | | 20.11 | | | | 1.28 | | | | 0.53 | | | | 1.81 | | | | | | | | (1.55 | ) | | | — | | | | (1.55 | ) | | | 20.37 | |
56
| | | | | | | | | | | | | | | | | | | | | | | | | | | | | | | | | | |
| | | | Ratios/Supplemental Data | |
| | | | | | | | | | Ratios to Average
Net Assets Before
Waiver/Reimbursement | | | | | | Ratios to Average
Net Assets After
Waiver/Reimbursement(c) | | | | |
| | | | | | | | |
Total
Return(b) | | | Ending
Net
Assets
(000) | | | | | | Expenses | | | Net
Investment
Income
(Loss) | | | | | | Expenses | | | Net
Investment
Income
(Loss) | | | Portfolio
Turnover
Rate(d) | |
| | | | | | | | |
| | | | | | | | | | | | | | | | | | | | | | | | | | | | | | | | | | |
| | | | | | | | |
| | 12.44 | % | | $ | 53,994 | | | | | | | | 1.06 | % | | | 4.33 | % | | | | | | | 0.99 | % | | | 4.40 | % | | | 134 | % |
| | | | | | | | |
| | (2.58 | ) | | | 39,747 | | | | | | | | 1.04 | | | | 5.38 | | | | | | | | 1.00 | | | | 5.43 | | | | 128 | |
| | | | | | | | |
| | 5.73 | | | | 47,647 | | | | | | | | 1.04 | | | | 5.17 | | | | | | | | 1.00 | | | | 5.22 | | | | 70 | |
| | | | | | | | |
| | 4.68 | | | | 52,494 | | | | | | | | 1.04 | | | | 5.15 | | | | | | | | 1.00 | | | | 5.19 | | | | 43 | |
| | | | | | | | |
| | 8.95 | | | | 86,950 | | | | | | | | 0.99 | | | | 6.13 | | | | | | | | 0.99 | | | | 6.14 | | | | 55 | |
| | | | | | | | |
| | | | | | | | | | | | | | | | | | | | | | | | | | | | | | | | | | |
| | | | | | | | |
| | 11.61 | | | | 30,391 | | | | | | | | 1.81 | | | | 3.62 | | | | | | | | 1.75 | | | | 3.69 | | | | 134 | |
| | | | | | | | |
| | (3.33 | ) | | | 36,222 | | | | | | | | 1.80 | | | | 4.65 | | | | | | | | 1.75 | | | | 4.70 | | | | 128 | |
| | | | | | | | |
| | 4.94 | | | | 54,408 | | | | | | | | 1.80 | | | | 4.42 | | | | | | | | 1.75 | | | | 4.47 | | | | 70 | |
| | | | | | | | |
| | 3.93 | | | | 63,854 | | | | | | | | 1.79 | | | | 4.39 | | | | | | | | 1.75 | | | | 4.43 | | | | 43 | |
| | | | | | | | |
| | 8.15 | | | | 80,828 | | | | | | | | 1.75 | | | | 5.45 | | | | | | | | 1.74 | | | | 5.45 | | | | 55 | |
| | | | | | | | |
| | | | | | | | | | | | | | | | | | | | | | | | | | | | | | | | | | |
| | | | | | | | |
| | 12.87 | | | | 7,568 | | | | | | | | 0.70 | | | | 4.71 | | | | | | | | 0.63 | | | | 4.78 | | | | 134 | |
| | | | | | | | |
| | (2.19 | ) | | | 6,567 | | | | | | | | 0.68 | | | | 5.78 | | | | | | | | 0.63 | | | | 5.82 | | | | 128 | |
| | | | | | | | |
| | 6.09 | | | | 6,651 | | | | | | | | 0.68 | | | | 5.53 | | | | | | | | 0.64 | | | | 5.58 | | | | 70 | |
| | | | | | | | |
| | 5.09 | | | | 7,064 | | | | | | | | 0.68 | | | | 5.49 | | | | | | | | 0.64 | | | | 5.54 | | | | 43 | |
| | | | | | | | |
| | 9.32 | | | | 4,494 | | | | | | | | 0.67 | | | | 6.76 | | | | | | | | 0.67 | | | | 6.76 | | | | 55 | |
| | | | | | | | |
| | | | | | | | | | | | | | | | | | | | | | | | | | | | | | | | | | |
| | | | | | | | |
| | 12.69 | | | | 579,139 | | | | | | | | 0.81 | | | | 4.59 | | | | | | | | 0.74 | | | | 4.66 | | | | 134 | |
| | | | | | | | |
| | (2.29 | ) | | | 427,818 | | | | | | | | 0.79 | | | | 5.62 | | | | | | | | 0.75 | | | | 5.67 | | | | 128 | |
| | | | | | | | |
| | 5.98 | | | | 492,539 | | | | | | | | 0.79 | | | | 5.41 | | | | | | | | 0.75 | | | | 5.45 | | | | 70 | |
| | | | | | | | |
| | 4.93 | | | | 586,060 | | | | | | | | 0.79 | | | | 5.41 | | | | | | | | 0.75 | | | | 5.45 | | | | 43 | |
| | | | | | | | |
| | 9.26 | | | | 556,776 | | | | | | | | 0.74 | | | | 6.31 | | | | | | | | 0.74 | | | | 6.31 | | | | 55 | |
| (a) | Per share Net Investment Income (Loss) is calculated using the average daily shares method. | |
| (b) | Total return is the combination of changes in NAV without any sales charge, reinvested dividend income at NAV and reinvested capital gains distributions at NAV, if any. Total returns are not annualized. | |
| (c) | After fee waiver and/or expense reimbursement from the Adviser, where applicable. See Note 7 – Management Fees and Other Transactions with Affiliates for more information. | |
| (d) | Portfolio Turnover Rate is calculated based on the lesser of long-term purchases or sales (as disclosed in Note 4 – Portfolio Securities and Investments in Derivatives) divided by the average long-term market value during the period. | |
See accompanying notes to financial statements.
57
Financial Highlights (continued)
Floating Rate Income
Selected data for a share outstanding throughout each period:
| | | | | | | | | | | | | | | | | | | | | | | | | | | | | | | | | | | | |
| | | | | |
| | | | | | Investment Operations | | | | | | Less Distributions | | | | |
| | | | | | | | | |
Class (Commencement Date) Year Ended September 30, | | Beginning
NAV | | | Net
Investment
Income
(Loss)(a) | | | Net
Realized/
Unrealized
Gain (Loss) | | | Total | | | | | | From
Net
Investment
Income | | | From
Accumulated
Net Realized
Gains | | | Total | | | Ending
NAV | |
| | | | | | | | |
Class A (5/11) | | | | | | | | | | | | | | | | | | | | | | | | | | | | | | | | | |
| | | | | | | | | |
2021 | | $ | 17.80 | | | $ | 0.72 | | | $ | 1.32 | | | $ | 2.04 | | | | | | | $ | (0.78 | ) | | $ | — | | | $ | (0.78 | ) | | $ | 19.06 | |
| | | | | | | | | |
2020 | | | 19.08 | | | | 0.80 | | | | (1.14 | ) | | | (0.34 | ) | | | | | | | (0.94 | ) | | | — | | | | (0.94 | ) | | | 17.80 | |
| | | | | | | | | |
2019 | | | 19.65 | | | | 0.93 | | | | (0.56 | ) | | | 0.37 | | | | | | | | (0.94 | ) | | | — | | | | (0.94 | ) | | | 19.08 | |
| | | | | | | | | |
2018 | | | 19.64 | | | | 0.79 | | | | 0.05 | | | | 0.84 | | | | | | | | (0.83 | ) | | | — | | | | (0.83 | ) | | | 19.65 | |
| | | | | | | | | |
2017 | | | 19.71 | | | | 0.78 | | | | 0.18 | | | | 0.96 | | | | | | | | (1.03 | ) | | | — | | | | (1.03 | ) | | | 19.64 | |
| | | | | | | | |
Class C (5/11) | | | | | | | | | | | | | | | | | | | | | | | | | | | | | | | | | |
| | | | | | | | | |
2021 | | | 17.80 | | | | 0.59 | | | | 1.31 | | | | 1.90 | | | | | | | | (0.64 | ) | | | — | | | | (0.64 | ) | | | 19.06 | |
| | | | | | | | | |
2020 | | | 19.08 | | | | 0.66 | | | | (1.14 | ) | | | (0.48 | ) | | | | | | | (0.80 | ) | | | — | | | | (0.80 | ) | | | 17.80 | |
| | | | | | | | | |
2019 | | | 19.65 | | | | 0.79 | | | | (0.56 | ) | | | 0.23 | | | | | | | | (0.80 | ) | | | — | | | | (0.80 | ) | | | 19.08 | |
| | | | | | | | | |
2018 | | | 19.63 | | | | 0.64 | | | | 0.06 | | | | 0.70 | | | | | | | | (0.68 | ) | | | — | | | | (0.68 | ) | | | 19.65 | |
| | | | | | | | | |
2017 | | | 19.71 | | | | 0.64 | | | | 0.16 | | | | 0.80 | | | | | | | | (0.88 | ) | | | — | | | | (0.88 | ) | | | 19.63 | |
| | | | | | | | | |
Class R6 (1/15) | | | | | | | | | | | | | | | | | | | | | | | | | | | | | | | | | | | | |
| | | | | | | | | |
2021 | | | 17.88 | | | | 0.79 | | | | 1.33 | | | | 2.12 | | | | | | | | (0.84 | ) | | | — | | | | (0.84 | ) | | | 19.16 | |
| | | | | | | | | |
2020 | | | 19.17 | | | | 0.86 | | | | (1.15 | ) | | | (0.29 | ) | | | | | | | (1.00 | ) | | | — | | | | (1.00 | ) | | | 17.88 | |
| | | | | | | | | |
2019 | | | 19.73 | | | | 1.06 | | | | (0.62 | ) | | | 0.44 | | | | | | | | (1.00 | ) | | | — | | | | (1.00 | ) | | | 19.17 | |
| | | | | | | | | |
2018 | | | 19.68 | | | | 0.90 | | | | 0.02 | | | | 0.92 | | | | | | | | (0.87 | ) | | | — | | | | (0.87 | ) | | | 19.73 | |
| | | | | | | | | |
2017 | | | 19.74 | | | | 0.86 | | | | 0.16 | | | | 1.02 | | | | | | | | (1.08 | ) | | | — | | | | (1.08 | ) | | | 19.68 | |
| | | | | | | | |
Class I (5/11) | | | | | | | | | | | | | | | | | | | | | | | | | | | | | | | | | |
| | | | | | | | | |
2021 | | | 17.81 | | | | 0.77 | | | | 1.32 | | | | 2.09 | | | | | | | | (0.82 | ) | | | — | | | | (0.82 | ) | | | 19.08 | |
| | | | | | | | | |
2020 | | | 19.10 | | | | 0.84 | | | | (1.15 | ) | | | (0.31 | ) | | | | | | | (0.98 | ) | | | — | | | | (0.98 | ) | | | 17.81 | |
| | | | | | | | | |
2019 | | | 19.67 | | | | 0.97 | | | | (0.55 | ) | | | 0.42 | | | | | | | | (0.99 | ) | | | — | | | | (0.99 | ) | | | 19.10 | |
| | | | | | | | | |
2018 | | | 19.65 | | | | 0.84 | | | | 0.05 | | | | 0.89 | | | | | | | | (0.87 | ) | | | — | | | | (0.87 | ) | | | 19.67 | |
| | | | | | | | | |
2017 | | | 19.72 | | | | 0.82 | | | | 0.19 | | | | 1.01 | | | | | | | | (1.08 | ) | | | — | | | | (1.08 | ) | | | 19.65 | |
58
| | | | | | | | | | | | | | | | | | | | | | | | | | | | | | | | | | |
| | | | Ratios/Supplemental Data | |
| | | | | | | | | | Ratios to Average
Net Assets Before
Waiver/Reimbursement | | | | | | Ratios to Average
Net Assets After
Waiver/Reimbursement(c) | | | | |
| | | | | | | | |
Total
Return(b) | | | Ending
Net
Assets
(000) | | | | | | Expenses | | | Net
Investment
Income
(Loss) | | | | | | Expenses | | | Net
Investment
Income
(Loss) | | | Portfolio
Turnover
Rate(d) | |
| | | | | | | | |
| | | | | | | | | | | | | | | | | | | | | | | | | | | | | | | | | | |
| | | | | | | | |
| | 11.67 | % | | $ | 121,925 | | | | | | | | 1.03 | % | | | 3.88 | % | | | | | | | 1.03 | % | | | 3.88 | % | | | 52 | % |
| | | | | | | | |
| | (1.81 | ) | | | 90,684 | | | | | | | | 1.01 | | | | 4.43 | | | | | | | | 1.01 | | | | 4.43 | | | | 63 | |
| | | | | | | | |
| | 1.93 | | | | 112,723 | | | | | | | | 1.00 | | | | 4.81 | | | | | | | | 1.00 | | | | 4.81 | | | | 32 | |
| | | | | | | | |
| | 4.40 | | | | 220,648 | | | | | | | | 1.04 | | | | 4.02 | | | | | | | | 1.04 | | | | 4.02 | | | | 33 | |
| | | | | | | | |
| | 4.95 | | | | 257,236 | | | | | | | | 0.99 | | | | 3.96 | | | | | | | | 0.99 | | | | 3.96 | | | | 58 | |
| | | | | | | | |
| | | | | | | | | | | | | | | | | | | | | | | | | | | | | | | | | | |
| | | | | | | | |
| | 10.79 | | | | 34,192 | | | | | | | | 1.78 | | | | 3.14 | | | | | | | | 1.78 | | | | 3.14 | | | | 52 | |
| | | | | | | | |
| | (2.50 | ) | | | 33,375 | | | | | | | | 1.76 | | | | 3.66 | | | | | | | | 1.76 | | | | 3.66 | | | | 63 | |
| | | | | | | | |
| | 1.21 | | | | 53,639 | | | | | | | | 1.75 | | | | 4.10 | | | | | | | | 1.75 | | | | 4.10 | | | | 32 | |
| | | | | | | | |
| | 3.61 | | | | 87,289 | | | | | | | | 1.79 | | | | 3.28 | | | | | | | | 1.79 | | | | 3.28 | | | | 33 | |
| | | | | | | | |
| | 4.12 | | | | 90,616 | | | | | | | | 1.74 | | | | 3.22 | | | | | | | | 1.74 | | | | 3.22 | | | | 58 | |
| | | | | | | | |
| | | | | | | | | | | | | | | | | | | | | | | | | | | | | | | | | | |
| | | | | | | | |
| | 12.03 | | | | 83,970 | | | | | | | | 0.70 | | | | 4.20 | | | | | | | | 0.70 | | | | 4.20 | | | | 52 | |
| | | | | | | | |
| | (1.46 | ) | | | 55,634 | | | | | | | | 0.67 | | | | 4.75 | | | | | | | | 0.67 | | | | 4.75 | | | | 63 | |
| | | | | | | | |
| | 2.34 | | | | 54,122 | | | | | | | | 0.66 | | | | 5.53 | | | | | | | | 0.66 | | | | 5.53 | | | | 32 | |
| | | | | | | | |
| | 4.80 | | | | 2,298 | | | | | | | | 0.65 | | | | 4.58 | | | | | | | | 0.65 | | | | 4.58 | | | | 33 | |
| | | | | | | | |
| | 5.26 | | | | 1,114 | | | | | | | | 0.66 | | | | 4.33 | | | | | | | | 0.66 | | | | 4.33 | | | | 58 | |
| | | | | | | | |
| | | | | | | | | | | | | | | | | | | | | | | | | | | | | | | | | | |
| | | | | | | | |
| | 11.93 | | | | 828,572 | | | | | | | | 0.78 | | | | 4.10 | | | | | | | | 0.78 | | | | 4.10 | | | | 52 | |
| | | | | | | | |
| | (1.56 | ) | | | 535,410 | | | | | | | | 0.76 | | | | 4.65 | | | | | | | | 0.76 | | | | 4.65 | | | | 63 | |
| | | | | | | | |
| | 2.24 | | | | 895,304 | | | | | | | | 0.76 | | | | 5.04 | | | | | | | | 0.76 | | | | 5.04 | | | | 32 | |
| | | | | | | | |
| | 4.65 | | | | 2,126,985 | | | | | | | | 0.79 | | | | 4.29 | | | | | | | | 0.79 | | | | 4.29 | | | | 33 | |
| | | | | | | | |
| | 5.20 | | | | 1,866,183 | | | | | | | | 0.75 | | | | 4.20 | | | | | | | | 0.75 | | | | 4.20 | | | | 58 | |
| (a) | Per share Net Investment Income (Loss) is calculated using the average daily shares method. | |
| (b) | Total return is the combination of changes in NAV without any sales charge, reinvested dividend income at NAV and reinvested capital gains distributions at NAV, if any. Total returns are not annualized. | |
| (c) | After fee waiver and/or expense reimbursement from the Adviser, where applicable. See Note 7 – Management Fees and Other Transactions with Affiliates for more information. | |
| (d) | Portfolio Turnover Rate is calculated based on the lesser of long-term purchases or sales (as disclosed in Note 4 – Portfolio Securities and Investments in Derivatives) divided by the average long-term market value during the period. | |
See accompanying notes to financial statements.
59
Notes to Financial Statements
1. General Information
Trust and Fund Information
The Nuveen Investment Trust III (the “Trust”), is an open-end management investment company registered under the Investment Company Act of 1940 (the “1940 Act”), as amended. The Trust is comprised of Nuveen High Yield Income Fund (“High Yield Income”) and Nuveen Floating Rate Income Fund (“Floating Rate Income”) (each a “Fund” and collectively, the “Funds”), as diversified funds, among others. The Trust was organized as a Massachusetts business trust on August 20, 1998.
The end of the reporting period for the Funds is September 30, 2021, and the period covered by these Notes to Financial Statements is the fiscal year ended September 30, 2021 (the “current fiscal period”).
Investment Adviser and Sub-Adviser
The Funds’ investment adviser is Nuveen Fund Advisors, LLC (the “Adviser”), a subsidiary of Nuveen, LLC (“Nuveen”). Nuveen is the investment management arm of Teachers Insurance and Annuity Association of America (TIAA). The Adviser has overall responsibility for management of the Funds, oversees the management of the Funds’ portfolios, manages the Funds’ business affairs and provides certain clerical, bookkeeping and other administrative services, and, if necessary, asset allocation decisions.
Prior to December 31, 2020, the Adviser had entered into a sub-advisory agreement with Symphony Asset Management, LLC (“Symphony”), an affiliate of the Adviser, under which Symphony managed the investment portfolios of the Funds. Effective as of December 31, 2020, Symphony merged into Nuveen Asset Management, LLC (“NAM” and the “Sub-Adviser”), also an affiliate of the Adviser, and assumed management responsibilities for the Funds’ investment portfolios. In connection with the transfer of sub-advisory responsibilities from Symphony to NAM, the Funds entered into an amended and restated sub-advisory agreement with NAM that is substantially identical to the prior sub-advisory agreement with Symphony.
Share Classes and Sales Charges
Class A Shares are generally sold with an up-front sales charge. Class A Share purchases of $1 million or more ($500,000 or more for Floating Rate Income) are sold at net asset value (“NAV”) without an up-front sales charge but may be subject to a contingent deferred sales charge (“CDSC”) of 1% if redeemed within eighteen months of purchase. Class C Shares are sold without an up-front sales charge but are subject to a CDSC of 1% if redeemed within twelve months of purchase. Class C Shares automatically convert to Class A Shares eight years (ten years prior to March 1, 2021) after purchase. Class R6 Shares and Class I Shares are sold without an upfront sales charge.
Other Matters
The outbreak of the novel coronavirus (“COVID-19”) and subsequent global pandemic began significantly impacting the U.S. and global financial markets and economies during the calendar quarter ended March 31, 2020. The worldwide spread of COVID-19 has created significant uncertainty in the global economy. The duration and extent of COVID-19 over the long term cannot be reasonably estimated at this time. The ultimate impact of COVID-19 and the extent to which COVID-19 impacts the Funds’ normal course of business, results of operations, investments, and cash flows will depend on future developments, which are highly uncertain and difficult to predict. Management continues to monitor and evaluate this situation.
2. Significant Accounting Policies
The accompanying financial statements were prepared in accordance with accounting principles generally accepted in the United States of America (“U.S. GAAP”), which may require the use of estimates made by management and the evaluation of subsequent events. Actual results may differ from those estimates. Each Fund is an investment company and follows the accounting guidance in the Financial Accounting Standards Board (“FASB”) Accounting Standards Codification 946, Financial Services – Investment Companies. The NAV for financial reporting purposes may differ from the NAV for processing security and shareholder transactions. The NAV for financial reporting purposes includes security and shareholder transactions through the date of the report. Total return is computed based on the NAV used for processing security and shareholder transactions. The following is a summary of the significant accounting policies consistently followed by the Funds.
Compensation
The Trust pays no compensation directly to those of its trustees who are affiliated with the Adviser or to its officers, all of whom receive remuneration for their services to the Trust from the Adviser or its affiliates. The Funds’ Board of Trustees (the “Board”) has adopted a deferred compensation plan for independent trustees that enables trustees to elect to defer receipt of all or a portion of the annual compensation they are entitled to receive from certain Nuveen-advised funds. Under the plan, deferred amounts are treated as though equal dollar amounts had been invested in shares of select Nuveen-advised funds.
60
Distributions to Shareholders
Distributions to shareholders are recorded on the ex-dividend date. The amount, character and timing of distributions are determined in accordance with federal income tax regulations, which may differ from U.S. GAAP.
Indemnifications
Under the Trust’s organizational documents, its officers and trustees are indemnified against certain liabilities arising out of the performance of their duties to the Trust. In addition, in the normal course of business, the Trust enters into contracts that provide general indemnifications to other parties. The Trust’s maximum exposure under these arrangements is unknown as this would involve future claims that may be made against the Trust that have not yet occurred. However, the Trust has not had prior claims or losses pursuant to these contracts and expects the risk of loss to be remote.
Investments and Investment Income
Securities transactions are accounted for as of the trade date for financial reporting purposes. Trade date for senior and subordinated loans purchased in the “primary market” is considered the date on which the loan allocations are determined. Trade date for senior and subordinated loans purchased in the “secondary market” is the date on which the transaction is entered into. Realized gains and losses on securities transactions are based upon the specific identification method. Dividend income is recorded on the ex-dividend date or, for foreign securities, when information is available. Non-cash dividends received in the form of stock, if any, are recognized on the ex-dividend date and recorded at fair value. Interest income, which is recorded on an accrual basis and includes accretion of discounts and amortization of premiums for financial reporting purposes. Interest income also reflects payment-in-kind (“PIK”) interest and paydown gains and losses, if any. PIK interest represents income received in the form of securities in lieu of cash. Fee income consists primarily of amendment fees, when applicable. Amendment fees are earned as compensation for evaluating and accepting changes to an original senior loan agreement and are recognized when received. Securities lending income is comprised of fees earned from borrowers and income earned on cash collateral investments. Fee income and amendment fees, if any, are recognized as “Fees” on the Statement of Operations.
Multiclass Operations and Allocations
Income and expenses of the Funds that are not directly attributable to a specific class of shares are prorated among the classes based on the relative value of the settled shares of each class. Expenses directly attributable to a class of shares are recorded to the specific class. 12b-1 distribution and service fees are allocated on a class-specific basis.
Sub-transfer agent fees and similar fees, which are recognized as a component of “Shareholder servicing agent fees” on the Statement of Operations, are not charged to Class R6 Shares and are prorated among the other classes based on their relative settled shares.
Realized and unrealized capital gains and losses of the Funds are prorated among the classes based on the relative net assets of each class.
Netting Agreements
In the ordinary course of business, the Funds may enter into transactions subject to enforceable master repurchase agreements, International Swaps and Derivatives Association, Inc. (ISDA) master agreements or other similar arrangements (“netting agreements”). Generally, the right to offset in netting agreements allows each Fund to offset certain securities and derivatives with a specific counterparty, when applicable, as well as any collateral received or delivered to that counterparty based on the terms of the agreements. Generally, each Fund manages its cash collateral and securities collateral on a counterparty basis.
The Funds’ investments subject to netting agreements as of the end of the reporting period, if any, are further described in Note 4 – Portfolio Securities and Investments in Derivatives.
New Accounting Pronouncements and Rule Issuances
Reference Rate Reform
In March 2020, FASB issued Accounting Standards Update (“ASU”) 2020-04, Reference Rate Reform: Facilitation of the Effects of Reference Rate Reform on Financial Reporting. The main objective of the new guidance is to provide relief to companies that will be impacted by the expected change in benchmark interest rates, when participating banks will no longer be required to submit London Interbank Offered Rate (LIBOR) quotes by the UK Financial Conduct Authority (FCA). The new guidance allows companies to, provided the only change to existing contracts are a change to an approved benchmark interest rate, account for modifications as a continuance of the existing contract without additional analysis. For new and existing contracts, the Funds may elect to apply the amendments as of March 12, 2020 through December 31, 2022. Management has not yet elected to apply the amendments, is continuously evaluating the potential effect a discontinuation of LIBOR could have on the Funds’ investments and has currently determined that it is unlikely the ASU’s adoption will have a significant impact on the Funds’ financial statements and various filings.
Securities and Exchange Commission (“SEC”) Adopts New Rules to Modernize Fund Valuation Framework
In December 2020, the SEC voted to adopt a new rule governing fund valuation practices. New Rule 2a-5 under the 1940 Act establishes requirements for determining fair value in good faith for purposes of the 1940 Act. Rule 2a-5 will permit fund boards to designate certain parties to perform fair value determinations, subject to board oversight and certain other conditions. Rule 2a-5 also defines when market quotations are “readily available” for purposes of Section 2(a)(41) of the 1940 Act, which requires a fund to fair value a security when market quotation are not readily available. The SEC also
61
Notes to Financial Statements (continued)
adopted new Rule 31a-4 under the 1940 Act, which sets forth the recordkeeping requirements associated with fair value determinations. Finally, the SEC is rescinding previously issued guidance on related issues, including the role of a board in determining fair value and the accounting and auditing of fund investments. Rule 2a-5 and Rule 31a-4 became effective on March 8, 2021, with a compliance date of September 8, 2022. A fund may voluntarily comply with the rules after the effective date, and in advance of the compliance date, under certain conditions. Management is currently assessing the impact of these provisions on the Funds’ financial statements.
3. Investment Valuation and Fair Value Measurements
The Funds’ investments in securities are recorded at their estimated fair value utilizing valuation methods approved by the Board. Fair value is defined as the price that would be received upon selling an investment or transferring a liability in an orderly transaction to an independent buyer in the principal or most advantageous market for the investment. U.S. GAAP establishes the three-tier hierarchy which is used to maximize the use of observable market data and minimize the use of unobservable inputs and to establish classification of fair value measurements for disclosure purposes. Observable inputs reflect the assumptions market participants would use in pricing the asset or liability. Observable inputs are based on market data obtained from sources independent of the reporting entity. Unobservable inputs reflect management’s assumptions about the assumptions market participants would use in pricing the asset or liability. Unobservable inputs are based on the best information available in the circumstances. The following is a summary of the three-tiered hierarchy of valuation input levels.
| | |
| Level 1 – | | Inputs are unadjusted and prices are determined using quoted prices in active markets for identical securities. |
| Level 2 – | | Prices are determined using other significant observable inputs (including quoted prices for similar securities, interest rates, credit spreads, etc.). |
| Level 3 – | | Prices are determined using significant unobservable inputs (including management’s assumptions in determining the fair value of investments). |
A description of the valuation techniques applied to the Funds’ major classifications of assets and liabilities measured at fair value follows:
Equity securities and exchange-traded funds listed or traded on a national market or exchange are valued based on their sale price at the official close of business of such market or exchange on the valuation date. Foreign equity securities and registered investment companies that trade on a foreign exchange are valued at the last sale price or official closing price reported on the exchange where traded and converted to U.S. dollars at the prevailing rates of exchange on the date of valuation. To the extent these securities are actively traded and that valuation adjustments are not applied, they are generally classified as Level 1. If there is no official close of business, then the latest available sale price is utilized. If no sales are reported, then the mean of the latest available bid and ask prices is utilized and these securities are generally classified as Level 2.
Investments in investment companies are valued at their respective NAVs on the valuation date and are generally classified as Level 1.
Prices of fixed-income securities are generally provided by an independent pricing service (“pricing service”) approved by the Board. The pricing service establishes a security’s fair value using methods that may include consideration of the following: yields or prices of investments of comparable quality, type of issue, coupon, maturity and rating, market quotes or indications of value from security dealers, evaluations of anticipated cash flows or collateral, general market conditions and other information and analysis, including the obligor’s credit characteristics considered relevant. In pricing certain securities, particularly less liquid and lower quality securities, the pricing service may consider information about a security, its issuer or market activity provided by the Adviser. These securities are generally classified as Level 2.
Any portfolio security or derivative for which market quotations are not readily available or for which the above valuation procedures are deemed not to reflect fair value are valued at fair value, as determined in good faith using procedures approved by the Board. As a general principle, the fair value of a security would appear to be the amount that the owner might reasonably expect to receive for it in a current sale. A variety of factors may be considered in determining the fair value of such securities, which may include consideration of the following: yields or prices of investments of comparable quality, type of issue, coupon, maturity and rating, market quotes or indications of value from security dealers, evaluations of anticipated cash flows or collateral, general market conditions and other information and analysis, including the obligor’s credit characteristics considered relevant. To the extent the inputs are observable and timely, the values would be classified as Level 2 of the fair value hierarchy; otherwise they would be classified as Level 3.
The following table summarizes the market value of the Funds’ investments as of the end of the reporting period, based on the inputs used to value them:
| | | | | | | | | | | | | | | | |
| High Yield Income Fund | | Level 1 | | | Level 2 | | | Level 3 | | | Total | |
Long-Term Investments:* | | | | | | | | | | | | | | | | |
Corporate Bonds | | $ | — | | | $ | 479,496,416 | | | $ | — | | | $ | 479,496,416 | |
Variable Rate Senior Loan Interests | | | — | | | | 148,835,024 | | | | 5,910,149 | | | | 154,745,173 | |
Common Stocks** | | | — | | | | 4,852,782 | | | | 1,239,662 | | | | 6,092,444 | |
Warrants** | | | — | | | | 1,833,970 | | | | — | | | | 1,833,970 | |
Investments Purchased with Collateral from Securities Lending | | | 10,618,982 | | | | — | | | | — | | | | 10,618,982 | |
Short-Term Investments: | | | | | | | | | | | | | | | | |
Investment Companies | | | 36,883,600 | | | | — | | | | — | | | | 36,883,600 | |
| Total | | $ | 47,502,582 | | | $ | 635,018,192 | | | $ | 7,149,811 | | | $ | 689,670,585 | |
62
| | | | | | | | | | | | | | | | |
| Floating Rate Income Fund | | Level 1 | | | Level 2 | | | Level 3 | | | Total | |
Long-Term Investments*: | | | | | | | | | | | | | | | | |
Variable Rate Senior Loan Interests | | $ | — | | | $ | 842,468,062 | | | $ | 3,305,867 | | | $ | 845,773,929 | |
Corporate Bonds | | | — | | | | 145,073,797 | | | | — | | | | 145,073,797 | |
Common Stocks** | | | 5,115,139 | | | | 15,185,042 | | | | 1,264,143 | | | | 21,564,324 | |
Warrants** | | | 6,000 | | | | 6,325,008 | | | | 13,203 | | | | 6,344,211 | |
Convertible Preferred Securities** | | | — | | | | 227,720 | | | | — | | | | 227,720 | |
Short-Term Investments: | | | | | | | | | | | | | | | | |
Investment Companies | | | 126,308,045 | | | | — | | | | — | | | | 126,308,045 | |
| Total | | $ | 131,429,184 | | | $ | 1,009,279,629 | | | $ | 4,583,213 | | | $ | 1,145,292,026 | |
| * | Refer to the Fund’s Portfolio of Investments for industry classifications. |
| ** | Refer to the Fund’s Portfolio of Investments for securities classified as Level 2 and/or Level 3. |
The following is a reconciliation of the Funds’ Level 3 investments held at the beginning and end of the measurement period:
| | | | | | | | | | | | | | | | | | | | | | | | | | | | |
| | | High Yield Income | | | | | | Floating Rate Income | |
| | | Level 3 | | | | | | Level 3 | |
| | | Variable Rate
Senior Loan
Interests | | | Common
Stocks | | | Warrant | | | | | | Variable Rate
Senior Loan
Interests | | | Common
Stocks | | | Warrant | |
| Balance at the beginning of period | | $ | 12,844 | | | $ | 9 | | | $ | 3 | | | | | | | $ | 4,438 | | | $ | 126,430 | | | $ | 3 | |
Gains (losses): | | | | | | | | | | | | | | | | | | | | | | | | | | | | |
Net realized gains (losses) | | | (2,590,679 | ) | | | — | | | | 1 | | | | | | | | (927,353 | ) | | | — | | | | — | |
Change in net unrealized appreciation (depreciation) | | | 2,580,816 | | | | 634,837 | | | | (3 | ) | | | | | | | 923,945 | | | | 560,295 | | | | 13,201 | |
Purchases at cost | | | — | | | | 604,909 | | | | — | | | | | | | | — | | | | 577,418 | | | | — | |
Sales at proceeds | | | (2,981 | ) | | | — | | | | (1 | ) | | | | | | | (1,030 | ) | | | — | | | | (1 | ) |
Net discounts (premiums) | | | — | | | | — | | | | — | | | | | | | | — | | | | — | | | | — | |
Transfers into | | | 5,910,149 | | | | — | | | | — | | | | | | | | 3,305,867 | | | | — | | | | — | |
Transfers (out of) | | | — | | | | (93 | ) | | | — | | | | | | | | — | | | | — | | | | — | |
| Balance at the end of period | | $ | 5,910,149 | | | $ | 1,239,662 | | | $ | — | | | | | | | $ | 3,305,867 | | | $ | 1,264,143 | | | $ | 13,203 | |
Change in net unrealized appreciation (depreciation) during the period of Level 3 securities held as of period end | | $ | 3,472,261 | | | $ | 634,837 | | | $ | — | | | | | | | $ | 1,955,243 | | | $ | 560,295 | | | $ | 13,203 | |
As of the measurement date, the following Common Stocks are categorized as Level 3: (1) Skillsoft Corp is priced at discount to the closing price; (2) Millennium Health LLC is priced at trust net assets. Variable Rate Senior Loan Interests categorized as Level 3 are utilizing weighted average of par recovery and being quoted by broker. Warrants categorized as Level 3 are utilizing weighted average cash value with 25% discount applied.
The table below presents the transfers in and out of the three valuation levels for the Funds as of the end of the reporting period when compared to the valuation levels at the end of the previous fiscal year. Changes in valuation inputs or methodologies may result in transfers into or out of an assigned level within the fair value hierarchy. Transfers in or out of levels are generally due to the availability of publicly available information and to the significance or extent the Adviser determines that the valuation inputs or methodologies may impact the valuation of those securities.
| | | | | | | | | | | | | | | | | | | | | | | | | | | | | | | | |
| | | Level 1 | | | | | | Level 2 | | | | | | Level 3 | |
| | | Transfers In | | | (Transfers Out) | | | | | | Transfers In | | | (Transfers Out) | | | | | | Transfers In | | | (Transfers Out) | |
High Yield Income | | | | | | | | | | | | | | | | | | | | | | | | | | | | | | | | |
Variable Rate Senior Loan Interests | | $ | — | | | $ | — | | | | | | | $ | — | | | $ | (5,910,149 | ) | | | | | | $ | 5,910,149 | | | $ | — | |
Common Stocks | | | — | | | | — | | | | | | | | 93 | | | | — | | | | | | | | — | | | | (93 | ) |
Floating Rate Income | | | | | | | | | | | | | | | | | | | | | | | | | | | | | | | | |
Variable Rate Senior Loan Interests | | $ | — | | | $ | — | | | | | | | $ | — | | | $ | (3,305,867 | ) | | | | | | $ | 3,305,867 | | | $ | — | |
4. Portfolio Securities and Investments in Derivatives
Portfolio Securities
Unfunded Commitments
Pursuant to the terms of certain of the variable rate senior loan agreements, the Funds may have unfunded senior loan commitments. Each Fund will maintain with its custodian, cash, liquid securities and/or liquid senior loans having an aggregate value at least equal to the amount of unfunded senior loan commitments. As of the end of the reporting period, the Funds’ outstanding unfunded senior loan commitments were as follows:
| | | | | | | | |
| | | High Yield
Income | | | Floating Rate
Income | |
| Outstanding unfunded senior loan commitments | | $ | — | | | $ | 1,280,336 | |
63
Notes to Financial Statements (continued)
Participation Commitments
With respect to the senior loans held in each Fund’s portfolio, the Funds may: 1) invest in assignments; 2) act as a participant in primary lending syndicates; or 3) invest in participations. If a Fund purchases a participation of a senior loan interest, the Fund would typically enter into a contractual agreement with the lender or other third party selling the participation, rather than directly with the borrower. As such, the Fund not only assumes the credit risk of the borrower, but also that of the selling participant or other persons interpositioned between the Fund and the borrower. As of the end of the reporting period, the Funds had no such outstanding participation commitments.
Securities Lending
High Yield Income may lend securities representing up to one-third of the value of its total assets to broker-dealers, banks, and other institutions in order to generate additional income. When loaning securities, the Fund retains the benefits of owning the securities, including the economic equivalent of dividends or interest generated by the security. The loans are continuous, can be recalled at any time, and have no set maturity. The Funds’ custodian, State Street Bank and Trust Company, serves as the securities lending agent (the “Agent”).
When a Fund loans its portfolio securities, it will receive, at the inception of each loan, cash collateral equal to an amount not less than 100% of the market value of the loaned securities. The actual percentage of the cash collateral will vary depending upon the asset type of the loaned securities. Collateral for the loaned securities is invested in a government money market vehicle maintained by the Agent, which is subject to the requirements of Rule 2a-7 under the 1940 Act. The value of the loaned securities and the liability to return the cash collateral received are recognized on the Statement of Assets and Liabilities. If the market value of the loaned securities increases, the borrower must furnish additional collateral to the Fund, which is also recognized on the Statement of Assets and Liabilities. Securities out on loan are subject to termination at any time at the option of the borrower or the Fund. Upon termination, the borrower is required to return to the Fund securities identical to the securities loaned. During the term of the loan, the Fund bears the market risk with respect to the investment of collateral and the risk that the Agent may default on its contractual obligations to the Fund. The Agent bears the risk that the borrower may default on its obligation to return the loaned securities as the Agent is contractually obligated to indemnify the Fund if at the time of a default by a borrower some or all of the loan securities have not been returned.
Securities lending income recognized by a Fund consists of earnings on invested collateral and lending fees, net of any rebates to the borrower and compensation to the Agent. Such income is recognized on the Statements of Operations.
As of the end of the reporting period, the total value of the loaned securities and the total value of collateral received were as follows:
| | | | | | | | | | |
| Fund | | Asset Class out on Loan | | Long-Term Investments, at Value | | | Total Collateral Received | |
| High Yield Income | | Corporate Bonds | | $ | 10,194,166 | | | $ | 10,618,982 | |
Zero Coupon Securities
A zero coupon security does not pay a regular interest coupon to its holders during the life of the security. Income to the holder of the security comes from accretion of the difference between the original purchase price of the security at issuance and the par value of the security at maturity and is effectively paid at maturity. The market prices of zero coupon securities generally are more volatile than the market prices of securities that pay interest periodically.
Investment Transactions
Long-term purchases and sales (including maturities but excluding securities purchased with collateral from securities lending, where applicable) during the current fiscal period were as follows:
| | | | | | | | |
| | | High Yield
Income | | | Floating
Rate Income | |
| Purchases | | $ | 894,294,806 | | | $ | 695,968,670 | |
| Sales and maturities | | | 770,606,855 | | | | 418,457,840 | |
The Funds may purchase securities on a when-issued or delayed-delivery basis. Securities purchased on a when-issued or delayed-delivery basis may have extended settlement periods; interest income is not accrued until settlement date. Any securities so purchased are subject to market fluctuation during this period. The Funds have earmarked securities in their portfolios with a current value at least equal to the amount of the when-issued/delayed delivery purchase commitments. If a Fund has outstanding when-issued/delayed-delivery purchases commitments as of the end of the reporting period, such amounts are recognized on the Statement of Assets and Liabilities.
Investments in Derivatives
Each Fund is authorized to invest in certain derivative instruments. The Funds record derivative instruments at fair value, with changes in fair value recognized on the Statement of Operations, when applicable. Even though the Funds’ investments in derivatives may represent economic hedges, they are not considered to be hedge transactions for financial reporting purposes.
Although the Funds are authorized to invest in derivative instruments, and may do so in the future, they did not make any such investments during the current fiscal period.
64
Market and Counterparty Credit Risk
In the normal course of business each Fund may invest in financial instruments and enter into financial transactions where risk of potential loss exists due to changes in the market (market risk) or failure of the other party to the transaction to perform (counterparty credit risk). The potential loss could exceed the value of the financial assets recorded on the financial statements. Financial assets, which potentially expose each Fund to counterparty credit risk, consist principally of cash due from counterparties on forward, option and swap transactions, when applicable. The extent of each Fund’s exposure to counterparty credit risk in respect to these financial assets approximates their carrying value as recorded on the Statement of Assets and Liabilities.
Each Fund helps manage counterparty credit risk by entering into agreements only with counterparties the Adviser believes have the financial resources to honor their obligations and by having the Adviser monitor the financial stability of the counterparties. Additionally, counterparties may be required to pledge collateral daily (based on the daily valuation of the financial asset) on behalf of each Fund with a value approximately equal to the amount of any unrealized gain above a pre-determined threshold. Reciprocally, when each Fund has an unrealized loss, the Funds have instructed the custodian to pledge assets of the Funds as collateral with a value approximately equal to the amount of the unrealized loss above a pre-determined threshold. Collateral pledges are monitored and subsequently adjusted if and when the valuations fluctuate, either up or down, by at least the pre-determined threshold amount.
5. Fund Shares
Transactions in Fund shares during the current and prior fiscal period were as follows:
| | | | | | | | | | | | | | | | |
| | | Year Ended
9/30/21 | | | Year Ended
9/30/20 | |
High Yield Income | | Shares | | | Amount | | | Shares | | | Amount | |
Shares sold: | | | | | | | | | | | | | | | | |
Class A | | | 1,520,705 | | | $ | 29,402,853 | | | | 2,094,513 | | | $ | 40,219,136 | |
Class A – automatic conversion of Class C Shares | | | 5,972 | | | | 117,155 | | | | — | | | | — | |
Class C | | | 189,392 | | | | 3,702,756 | | | | 81,248 | | | | 1,545,578 | |
Class R6 | | | 115,018 | | | | 2,253,904 | | | | 125,000 | | | | 2,338,363 | |
Class I | | | 13,486,053 | | | | 261,943,830 | | | | 15,169,152 | | | | 283,663,295 | |
Shares issued to shareholders due to reinvestment of distributions: | | | | | | | | | | | | | | | | |
Class A | | | 107,438 | | | | 2,094,316 | | | | 144,454 | | | | 2,750,271 | |
Class C | | | 73,557 | | | | 1,428,123 | | | | 111,220 | | | | 2,104,305 | |
Class R6 | | | 18,076 | | | | 353,647 | | | | 19,643 | | | | 372,380 | |
Class I | | | 1,355,185 | | | | 26,421,644 | | | | 1,352,713 | | | | 25,680,175 | |
| | | | 16,871,396 | | | | 327,718,228 | | | | 19,097,943 | | | | 358,673,503 | |
Shares redeemed: | | | | | | | | | | | | | | | | |
Class A | | | (1,049,758 | ) | | | (20,206,270 | ) | | | (2,455,553 | ) | | | (43,116,496 | ) |
Class C | | | (676,630 | ) | | | (13,154,080 | ) | | | (935,950 | ) | | | (17,636,706 | ) |
Class C – automatic conversion to Class A Shares | | | (5,978 | ) | | | (117,155 | ) | | | — | | | | — | |
Class R6 | | | (105,319 | ) | | | (2,056,147 | ) | | | (120,000 | ) | | | (2,269,095 | ) |
Class I | | | (8,666,649 | ) | | | (168,890,433 | ) | | | (17,848,561 | ) | | | (342,050,609 | ) |
| | | | (10,504,334 | ) | | | (204,424,085 | ) | | | (21,360,064 | ) | | | (405,072,906 | ) |
Net increase (decrease) | | | 6,367,062 | | | $ | 123,294,143 | | | | (2,262,121 | ) | | $ | (46,399,403 | ) |
| | |
| | | Year Ended
9/30/21 | | | Year Ended
9/30/20 | |
Floating Rate Income | | Shares | | | Amount | | | Shares | | | Amount | |
Shares sold: | | | | | | | | | | | | | | | | |
Class A | | | 3,057,096 | | | $ | 57,723,358 | | | | 1,506,851 | | | $ | 27,100,155 | |
Class A – automatic conversion of Class C Shares | | | 168 | | | | 3,138 | | | | 1,990 | | | | 37,153 | |
Class C | | | 426,509 | | | | 8,050,219 | | | | 208,562 | | | | 3,863,094 | |
Class R6 | | | 1,213,886 | | | | 22,572,822 | | | | 281,994 | | | | 5,040,233 | |
Class I | | | 29,640,494 | | | | 559,966,794 | | | | 20,322,145 | | | | 375,667,024 | |
Shares issued to shareholders due to reinvestment of distributions: | | | | | | | | | | | | | | | | |
Class A | | | 156,481 | | | | 2,930,167 | | | | 208,774 | | | | 3,780,579 | |
Class C | | | 51,823 | | | | 969,296 | | | | 86,431 | | | | 1,568,431 | |
Class R6 | | | 174,422 | | | | 3,285,824 | | | | 163,051 | | | | 2,955,415 | |
Class I | | | 1,283,649 | | | | 24,079,369 | | | | 2,016,547 | | | | 36,499,651 | |
| | | | 36,004,528 | | | | 679,580,987 | | �� | | 24,796,345 | | | | 456,511,735 | |
Shares redeemed: | | | | | | | | | | | | | | | | |
Class A | | | (1,911,842 | ) | | | (35,575,148 | ) | | | (2,529,746 | ) | | | (45,221,584 | ) |
Class C | | | (559,193 | ) | | | (10,414,528 | ) | | | (1,229,054 | ) | | | (22,262,056 | ) |
Class C – automatic conversion to Class A Shares | | | (168 | ) | | | (3,138 | ) | | | (1,990 | ) | | | (37,153 | ) |
Class R6 | | | (116,078 | ) | | | (2,202,856 | ) | | | (157,317 | ) | | | (2,777,845 | ) |
Class I | | | (17,555,830 | ) | | | (329,163,438 | ) | | | (39,165,677 | ) | | | (704,103,527 | ) |
| | | | (20,143,111 | ) | | | (377,359,108 | ) | | | (43,083,784 | ) | | | (774,402,165 | ) |
Net increase (decrease) | | | 15,861,417 | | | $ | 302,221,879 | | | | (18,287,439 | ) | | $ | (317,890,430 | ) |
65
Notes to Financial Statements (continued)
6. Income Tax Information
Each Fund is a separate taxpayer for federal income tax purposes. Each Fund intends to distribute substantially all of its net investment income and net capital gains to shareholders and to otherwise comply with the requirements of Subchapter M of the Internal Revenue Code applicable to regulated investment companies. Therefore, no federal income tax provision is required.
For all open tax years and all major taxing jurisdictions, management of the Funds has concluded that there are no significant uncertain tax positions that would require recognition in the financial statements. Open tax years are those that are open for examination by taxing authorities (i.e., generally the last four tax year ends and the interim tax period since then). Furthermore, management of the Funds is also not aware of any tax positions for which it is reasonably possible that the total amounts of unrecognized tax benefits will significantly change in the next twelve months.
The following information is presented on an income tax basis. Differences between amounts for financial statement and federal income tax purposes are primarily due to timing differences in recognizing certain gains and losses on investment transactions. To the extent that differences arise that are permanent in nature, such amounts are reclassified within the capital accounts as detailed below. Temporary differences do not require reclassification. Temporary and permanent differences do not impact the NAVs of the Funds.
The table below presents the cost and unrealized appreciation (depreciation) of each Fund’s investment portfolio, as determined on a federal income tax basis, as of September 30, 2021.
| | | | | | | | |
| | | High Yield
Income | | | Floating Rate
Income | |
| Tax cost of investments | | $ | 683,382,724 | | | $ | 1,143,343,882 | |
| Gross unrealized: | | | | | | | | |
Appreciation | | $ | 15,835,871 | | | $ | 20,564,540 | |
Depreciation | | | (9,548,010 | ) | | | (18,616,396 | ) |
| Net unrealized appreciation (depreciation) of investments | | $ | 6,287,861 | | | $ | 1,948,144 | |
Permanent differences, primarily due to bond premium amortization adjustments resulted in reclassifications among the Funds’ components of net assets as of September 30, 2021, the Funds’ tax year end.
The tax components of undistributed net ordinary income and net long-term capital gains as of September 30, 2021, the Funds’ tax year end, were as follows:
| | | | | | | | |
| | | High Yield
Income | | | Floating Rate
Income | |
| Undistributed net ordinary income1,2 | | $ | 1,224,413 | | | $ | 2,169,170 | |
| Undistributed net long-term capital gains | | | — | | | | — | |
| 1 | Undistributed net ordinary income (on a tax basis) has not been reduced for the dividends declared during the period September 1,2021 through September 30, 2021, and paid on October 1, 2021. |
| 2 | Net ordinary income consists of net taxable income derived from dividends, interest, and net short-term capital gains, if any. |
The tax character of distributions paid during the Funds’ tax years ended September 30, 2021 and September 30, 2020 was designated for purposes of the dividends paid deduction as follows:
| | | | | | | | |
| 2021 | | High Yield
Income | | | Floating Rate
Income | |
| Distributions from net ordinary income2 | | $ | 31,735,722 | | | $ | 34,891,011 | |
| Distributions from net long-term capital gains | | | — | | | | — | |
| | |
| 2020 | | High Yield
Income | | | Floating Rate
Income | |
| Distributions from net ordinary income2 | | $ | 32,789,767 | | | $ | 49,539,771 | |
| Distributions from net long-term capital gains | | | — | | | | — | |
| 2 | Net ordinary income consists of net taxable income derived from dividends, interest, and net short-term capital gains, if any. |
As of September 30, 2021, the Funds’ tax year end, the Funds had unused capital losses carrying forward available for federal income tax purposes to be applied against future capital gains, if any. The capital losses are not subject to expiration.
| | | | | | | | |
| | | High Yield
Income | | | Floating Rate Income | |
| Not subject to expiration: | | | | | | | | |
Short-term | | $ | 2,940,141 | | | $ | 32,438,294 | |
Long-term | | | 147,028,415 | | | | 158,369,764 | |
| Total | | $ | 149,968,556 | | | $ | 190,808,058 | |
During the Funds’ tax year ended September 30, 2021, High Yield Income utilized $11,800,338 of its capital loss carryforward.
66
7. Management Fees and Other Transactions with Affiliates
Management Fees
Each Fund’s management fee compensates the Adviser for overall investment advisory and administrative services and general office facilities. The Sub-Adviser is compensated for its services to the Funds from the management fees paid to the Adviser.
Each Fund’s management fee consists of two components – a fund-level fee, based only on the amount of assets within each individual Fund, and a complex-level fee, based on the aggregate amount of all eligible fund assets managed by the Adviser. This pricing structure enables each Fund’s shareholders to benefit from growth in the assets within their respective Fund as well as from growth in the amount of complex-wide assets managed by the Adviser.
The annual fund-level fee, payable monthly, for each Fund is calculated according to the following schedule:
| | | | | | | | |
| Average Daily Net Assets | | High Yield
Income | | | Floating Rate Income | |
| For the first $125 million | | | 0.4500 | % | | | 0.4500 | % |
| For the next $125 million | | | 0.4375 | | | | 0.4375 | |
| For the next $250 million | | | 0.4250 | | | | 0.4250 | |
| For the next $500 million | | | 0.4125 | | | | 0.4125 | |
| For the next $1 billion | | | 0.4000 | | | | 0.4000 | |
| For the next $3 billion | | | 0.3750 | | | | 0.3750 | |
| For the next $5 billion | | | 0.3500 | | | | 0.3500 | |
| For net assets over $10 billion | | | 0.3375 | | | | 0.3375 | |
The annual complex-level fee, payable monthly, for each Fund is calculated according to the following schedule:
| | | | |
| Complex-Level Eligible Asset Breakpoint Level* | | Effective Complex-Level Fee Rate at Breakpoint Level | |
| $55 billion | | | 0.2000 | % |
| $56 billion | | | 0.1996 | |
| $57 billion | | | 0.1989 | |
| $60 billion | | | 0.1961 | |
| $63 billion | | | 0.1931 | |
| $66 billion | | | 0.1900 | |
| $71 billion | | | 0.1851 | |
| $76 billion | | | 0.1806 | |
| $80 billion | | | 0.1773 | |
| $91 billion | | | 0.1691 | |
| $125 billion | | | 0.1599 | |
| $200 billion | | | 0.1505 | |
| $250 billion | | | 0.1469 | |
| $300 billion | | | 0.1445 | |
| * | The complex-level fee is calculated based upon the aggregate daily “eligible assets” of all Nuveen open-end and closed-end funds. Eligible assets do not include assets attributable to investments in other Nuveen funds or assets in excess of a determined amount (originally $2 billion) added to the Nuveen fund complex in connection with the Adviser’s assumption of the management of the former First American Funds effective January 1, 2011, but do include certain assets of certain Nuveen funds that were reorganized into funds advised by an affiliate of the Adviser during the 2019 calendar year. Eligible assets include closed-end fund assets managed by the Adviser that are attributable to certain types of leverage. For these purposes, leverage includes the closed-end funds’ use of preferred stock and borrowings and certain investments in the residual interest certificates (also called inverse floating rate securities) in tender option bond (TOB) trusts, including the portion of assets held by a TOB trust that has been effectively financed by the trust’s issuance of floating rate securities, subject to an agreement by the Adviser as to certain funds to limit the amount of such assets for determining eligible assets in certain circumstances. As of September 30, 2021, the complex-level fee for each Fund was 0.1536%. |
The Adviser has agreed to waive fees and/or reimburse expenses (“Expense Cap”) of each fund so that total annual Fund operating expenses (excluding 12b-1 distribution and/or service fees, interest expenses, taxes, acquired fund fees and expenses, fees incurred in acquiring and disposing of portfolio securities and extraordinary expenses) do not exceed the average daily net assets of any class of Fund shares in the amounts and for the time periods stated in the following table. However, because Class R6 shares are not subject to sub-transfer agent and similar fees, the total annual fund operating expense for the Class R6 shares will be less than the expense limitation. The temporary expense limitations may be terminated or modified prior to expiration date only with the approval of the Board. The expense limitation in effect thereafter may be terminated or modified only with the approval of shareholders of shareholders of the Funds.
| | | | | | | | | | |
| Fund | | Temporary
Expense Cap | | | Temporary
Expense Cap
Expiration Date | | Permanent
Expense Cap | |
High Yield Income | | | 0.79 | % | | July 31, 2023 | | | 1.35 | % |
Floating Rate Income | | | 0.85 | | | July 31, 2023 | | | 1.10 | |
Distribution and Service Fees
The Fund has adopted a distribution and service plan under rule 12b-1 under the 1940 Act. Class A Shares incur a 0.25% annual 12b-1 service fee. Class C Shares incur a 0.75% annual 12b-1 distribution fee and a 0.25% annual 12b-1 service fee. Class R6 and Class I Shares are not subject to
67
Notes to Financial Statements (continued)
12b-1 distribution or service fees. The fees under this plan compensate Nuveen Securities, LLC, (the “Distributor”), a wholly-owned subsidiary of Nuveen, for services provided and expenses incurred in distributing shares of the Fund and establishing and maintaining shareholder accounts.
Other Transactions with Affiliates
During the current fiscal period, the Distributor, collected sales charges on purchases of Class A Shares, the majority of which were paid out as concessions to financial intermediaries as follows:
| | | | | | | | |
| | | High Yield
Income | | | Floating Rate
Income | |
| Sales charges collected (Unaudited) | | $ | 201,515 | | | $ | 234,102 | |
| Paid to financial intermediaries (Unaudited) | | | 180,132 | | | | 220,106 | |
The Distributor also received 12b-1 service fees on Class A Shares, substantially all of which were paid to compensate financial intermediaries for providing services to shareholders relating to their investments.
During the current fiscal period, the Distributor compensated financial intermediaries directly with commission advances at the time of purchase as follows:
| | | | | | | | |
| | | High Yield
Income | | | Floating Rate
Income | |
| Commission advances (Unaudited) | | $ | 56,667 | | | $ | 236,313 | |
To compensate for commissions advanced to financial intermediaries, all 12b-1 service and distribution fees collected on Class C Shares during the first year following a purchase are retained by the Distributor. During the current fiscal period, the Distributor retained such 12b-1 fees as follows:
| | | | | | | | |
| | | High Yield
Income | | | Floating Rate
Income | |
| 12b-1 fees retained (Unaudited) | | $ | 17,583 | | | $ | 31,087 | |
The remaining 12b-1 fees charged to each fund were paid to compensate financial intermediaries for providing services to shareholders relating to their investments.
The Distributor also collected and retained CDSC on share redemptions during the current fiscal period, as follows:
| | | | | | | | |
| | | High Yield
Income | | | Floating Rate
Income | |
| CDSC retained (Unaudited) | | $ | 821 | | | $ | 67,272 | |
As of the end of the reporting period, the percentage of Fund shares owned by Nuveen as follows:
| | | | |
| | | Floating Rate
Income | |
| Nuveen owned shares | | | —% | * |
8. Borrowing Arrangements
Committed Line of Credit
The Funds, along with certain other funds managed by the Adviser (“Participating Funds”), have established a 364-day, $2.635 billion standby credit facility with a group of lenders, under which the Participating Funds may borrow for various purposes other than leveraging for investment purposes. Each Participating Fund is allocated a designated proportion of the facility’s capacity (and its associated costs, as described below) based upon a multi-factor assessment of the likelihood and frequency of its need to draw on the facility, the size of the Fund and its anticipated draws, and the potential importance of such draws to the operations and well-being of the Fund, relative to those of the other Funds. A Fund may effect draws on the facility in excess of its designated capacity if and to the extent that other Participating Funds have undrawn capacity. The credit facility expires in June 2022 unless extended or renewed.
The credit facility has the following terms: 0.15% per annum on unused commitment amounts and a drawn interest rate equal to the higher of (a) OBFR (Overnight Bank Funding Rate) plus 1.20% per annum or (b) the Fed Funds Effective Rate plus 1.20% per annum on amounts borrowed. Prior to June 23, 2021, the drawn interest rate was equal to the higher of (a) one-month LIBOR (London Inter-Bank Offered Rate) plus 1.25% per annum or (b) the Fed Funds rate plus 1.25% per annum on amounts borrowed. The Participating Funds also incurred a 0.05% upfront fee on the increase of the $230 million commitment amount during the reporting period. Interest expense incurred by the Participating Funds, when applicable, is recognized as a component of “Interest expense” on the Statement of Operations. Participating Funds paid administration, legal and arrangement fees, which are recognized as a component of “Interest expense” on the Statement of Operations, and along with commitment fees, have been allocated among such Participating Funds based upon the relative proportions of the facility’s aggregate capacity reserved for them and other factors deemed relevant by the Adviser and the Board of each Participating Fund.
During the current fiscal period, the Funds did not utilize this facility.
68
Additional Fund Information
(Unaudited)
| | | | | | | | | | |
| | | | | |
| | Investment Adviser Nuveen Fund Advisors, LLC 333 West Wacker Drive Chicago, IL 6o6o6 Sub-Adviser Nuveen Asset Management LLC 333 West Wacker Drive Chicago, IL 60606 | | Independent Registered
Public Accounting Firm KPMG LLP 200 East Randolph Street Chicago, IL 60601 Custodian State Street Bank & Trust Company One Lincoln Street Boston, MA 02111 | | Legal Counsel Chapman and Cutler LLP Chicago, IL 60603 | | Transfer Agent and
Shareholder Services DST Asset Manager Solutions, Inc. (DST) P.O. Box 219140 Kansas City, MO 64121-9140 (800) 257-8787 | | |
| | | | | | | | | | | | | | |
| | | | | |
| | | | | | | | | | |
| | |
| | Distribution Information: The Funds hereby designate their percentages of dividends paid from net ordinary income as dividends qualifying as Interest-Related Dividends and/or short-term capital gain dividends as defined in Internal Revenue Code Section 871(k) for the taxable periods ending December 31, 2020 and September 30, 2021: | | |
| | | | | | | |
| | | | | | | | | | | High Yield
Income | | Floating Rate Income | | |
| | October 1, 2020 through December 31, 2020 | | 84.7% | | 74.6% | | |
| | January 1, 2021 through September 30, 2021 | | 84.6% | | 76.9% | | |
| | |
| | The Funds had the following percentage, or maximum amount allowable, of ordinary dividends treated as Section 163(j) interest dividends pursuant to Section 163(j) of the Internal Revenue Code for the taxable year ended September 30, 2021: | | |
| | | | | | | |
| | | | | | | | | | | High Yield
Income | | Floating Rate
Income | | |
| | % of Section 163(j) Interest Dividends | | 98.4% | | 95.1% | | |
| | | | | |
| | | | | | | | | | |
| | |
| | Portfolio of Investments Information: Each Fund is required to file its complete schedule of portfolio holdings with the Securities and Exchange Commission (SEC) for the first and third quarters of each fiscal year as an exhibit to its report on Form N-PORT. You may obtain this information on the SEC’s website at http://www.sec.gov. | | |
| | | | | |
| | | | | | | | | | |
| | |
| | Nuveen Funds’ Proxy Voting Information: You may obtain (i) information regarding how each fund voted proxies relating to portfolio securities held during the most recent twelve-month period ended June 30, without charge, upon request, by calling Nuveen toll-free at (800) 257-8787 or on Nuveen’s website at www.nuveen.com and (ii) a description of the policies and procedures that each fund used to determine how to vote proxies relating to portfolio securities without charge, upon request, by calling Nuveen toll-free at (800) 257-8787. You may also obtain this information directly from the SEC. Visit the SEC on-line at http://www.sec.gov. | | |
| | | | | |
| | | | | | | | | | |
| | |
| | FINRA BrokerCheck: The Financial Industry Regulatory Authority (FINRA) provides information regarding the disciplinary history of FINRA member firms and associated investment professionals. This information as well as an investor brochure describing FINRA BrokerCheck is available to the public by calling the FINRA BrokerCheck Hotline number at (800) 289-9999 or by visiting www.FINRA.org. | | |
69
Glossary of Terms Used in this Report
(Unaudited)
Average Annual Total Return: This is a commonly used method to express an investment’s performance over a particular, usually multi-year time period. It expresses the return that would have been necessary each year to equal the investment’s actual cumulative performance (including change in NAV or offer price and reinvested dividends and capital gains distributions, if any) over the time period being considered.
Credit Suisse Leveraged Loan Index: A representative, unmanaged index of tradeable, senior, U.S. dollar-denominated leveraged loans. Index returns assume reinvestment of distributions, but do not reflect any applicable sales charges or management fees.
Gross Domestic Product (GDP): The total market value of all final goods and services produced in a country/region in a given year, equal to total consumer, investment and government spending, plus the value of exports, minus the value of imports.
ICE BofA U.S. High Yield Index: Tracks the performance of U.S. Dollar-denominated below investment grade corporate debt publicly issued in the U.S. domestic market. Index returns assume reinvestment of distributions, but do not reflect any applicable sales charges and management fees.
Lipper High Yield Funds Classification Average: Represents the average annualized total return for all reporting funds in the Lipper High Yield Funds Classification. Lipper returns account for the effects of management fees and assume reinvestment of distributions, but do not reflect any applicable sales charges.
Lipper Loan Participation Funds Classification Average: Represents the average annualized total return for all reporting funds in the Lipper Loan Participation Funds Classification. Lipper returns account for the effects of management fees and assume reinvestment of distributions, but do not reflect any applicable sales charges.
Net Asset Value (NAV) Per Share: A fund’s Net Assets is equal to its total assets (securities, cash and accrued earnings) less its total liabilities. For funds with multiple classes, Net Assets are determined separately for each share class. NAV per share is equal to the fund’s (or share class’) Net Assets divided by its number of shares outstanding.
Zero Coupon Bond: A zero coupon bond does not pay a regular interest coupon to its holders during the life of the bond. Income to the holder of the bond comes from accretion of the difference between the original purchase price of the bond at issuance and the par value of the bond at maturity and is effectively paid at maturity. The market prices of zero coupon bonds generally are more volatile than the market prices of bonds that pay interest periodically.
70
Annual Investment Management Agreement Approval Process
(Unaudited)
The Approval Process
At a meeting held on May 25-27, 2021 (the “May Meeting”), the Board of Trustees (the “Board” and each Trustee, a “Board Member”) of the Funds, which is comprised entirely of Board Members who are not “interested persons” (as defined under the Investment Company Act of 1940 (the “1940 Act”)) (the “Independent Board Members”), approved, for each Fund, the renewal of the management agreement (each, an “Investment Management Agreement”) with Nuveen Fund Advisors, LLC (the “Adviser”) pursuant to which the Adviser serves as the investment adviser to such Fund and the sub-advisory agreement (each, a “Sub-Advisory Agreement”) with Nuveen Asset Management, LLC (the “Sub-Adviser”) pursuant to which the Sub-Adviser serves as the sub-adviser to such Fund. Although the 1940 Act requires that continuances of the Advisory Agreements (as defined below) be approved by the in-person vote of a majority of the Independent Board Members, the May Meeting was held virtually through the internet in view of the health risks associated with holding an in-person meeting during the COVID-19 pandemic and governmental restrictions on gatherings. The May Meeting was held virtually in reliance on certain exemptive relief the Securities and Exchange Commission provided to registered investment companies providing temporary relief from the in-person voting requirements of the 1940 Act with respect to the approval of a fund’s advisory agreement in light of these challenges.
Following up to an initial two-year period, the Board considers the renewal of each Investment Management Agreement and Sub-Advisory Agreement on behalf of the applicable Fund on an annual basis. The Investment Management Agreements and Sub-Advisory Agreements are collectively referred to as the “Advisory Agreements” and the Adviser and the Sub-Adviser are collectively, the “Fund Advisers” and each, a “Fund Adviser.” Throughout the year, the Board and its committees meet regularly and, at these meetings, receive regular and/or special reports that cover an extensive array of topics and information that are relevant to its annual consideration of the renewal of the advisory agreements for the Nuveen funds. Such information may address, among other things, fund performance and risk information; the Adviser’s strategic plans; product initiatives for various funds; the review of the funds and investment teams; compliance, regulatory and risk management matters; the trading practices of the various sub-advisers to the funds; valuation of securities; fund expenses; payments to financial intermediaries, including 12b-1 fees and sub-transfer agency fees, if applicable; securities lending; liquidity management; and overall market and regulatory developments. The Board also seeks to meet periodically with the Nuveen funds’ sub-advisers and portfolio teams, when feasible.
In addition, in connection with the annual consideration of the advisory agreements for the Nuveen funds, the Board, through its independent legal counsel, requested and received extensive materials and information prepared specifically for its annual consideration of the renewal of such advisory agreements by the Adviser and by Broadridge Financial Solutions, Inc. (“Broadridge”), an independent provider of investment company data. The materials cover a wide range of topics including, but not limited to, a description of the nature, extent and quality of services provided by the Fund Advisers; a review of product actions taken during 2020 (such as mergers, liquidations, fund launches, changes to investment teams, and changes to investment policies); a review of each sub-adviser to the Nuveen funds and the applicable investment teams; an analysis of fund performance in absolute terms and as compared to the performance of certain peer funds and benchmarks with a focus on any performance outliers; an analysis of the fees and expense ratios of the Nuveen funds in absolute terms and as compared to those of certain peer funds with a focus on any expense outliers; a review of management fee schedules; a review of temporary and permanent expense caps and fee waivers for open-end funds (as applicable) and related expense savings; a description of portfolio manager compensation; a review of the performance of various service providers; a description of various initiatives Nuveen had undertaken or continued during the year for the benefit of particular fund(s) and/or the complex; a description of the profitability or financial data of Nuveen and the sub-advisers to the Nuveen funds; and a description of indirect benefits received by the Adviser and the sub-advisers as a result of their relationships with the Nuveen funds. The information prepared specifically for the annual review supplemented the information provided to the Board and its committees and the evaluations of the Nuveen funds by the Board and its committees during the year.
In continuing its practice, the Board met prior to the May Meeting to begin its considerations of the renewal of the Advisory Agreements. Accordingly, on April 21-22, 2021 (the “April Meeting”), the Board met to review and discuss, in part, the performance of the Nuveen funds and the Adviser’s evaluation of each sub-adviser to the Nuveen funds. At the April Meeting, the Board Members asked questions and requested additional information that was provided for the May Meeting. The Board reviewed fund performance throughout the year and in its review, the Board recognized the volatile market conditions that occurred in early 2020 arising, in part, from the public health crisis caused by the novel coronavirus known as COVID-19 and the resulting impact on a fund’s performance for 2020 and thereafter. Accordingly, the Board considered performance data measured over various periods of time as summarized in more detail below.
The Independent Board Members considered the review of the advisory agreements for the Nuveen funds to be an ongoing process and employed the accumulated information, knowledge and experience the Board Members had gained during their tenure on the boards governing the Nuveen
71
Annual Investment Management Agreement Approval Process (Unaudited) (continued)
funds and working with the Adviser and sub-advisers in their review of the advisory agreements. The contractual arrangements are a result of multiple years of review, negotiation and information provided in connection with the boards’ annual review of the Nuveen funds’ advisory arrangements and oversight of the Nuveen funds.
The Independent Board Members were advised by independent legal counsel during the annual review process as well as throughout the year, including meeting in executive sessions with such counsel at which no representatives from the Adviser or the Sub-Adviser were present. In connection with their annual review, the Independent Board Members also received a memorandum from independent legal counsel outlining their fiduciary duties and legal standards in reviewing the Advisory Agreements.
The Board’s decision to renew the Advisory Agreements was not based on a single identified factor, but rather the decision reflected the comprehensive consideration of all the information provided throughout the year and at the April and May Meetings, and each Board Member may have attributed different levels of importance to the various factors and information considered in connection with the approval process. The following summarizes the principal factors and information, but not all the factors, the Board considered in deciding to renew the Advisory Agreements as well as the Board’s conclusions.
A. Nature, Extent and Quality of Services
In evaluating the renewal of the Advisory Agreements, the Independent Board Members received and considered information regarding the nature, extent and quality of the applicable Fund Adviser’s services provided to the respective Fund with particular focus on the services and enhancements to such services provided during the last year. The Independent Board Members considered the Investment Management Agreements and the Sub-Advisory Agreements separately in the course of their review. With this approach, they considered the respective roles of the Adviser and the Sub-Adviser in providing services to the Funds.
The Board recognized that the Nuveen funds operate in a highly regulated industry and, therefore, the Adviser has provided a wide array of management, oversight and administrative services to manage and operate the funds, and the scope and complexity of these services have expanded over time as a result of, among other things, regulatory and other developments. The Board accordingly considered the extensive resources, tools and capabilities available to the Adviser to operate and manage the Nuveen funds. With respect to the Adviser, as a general matter, some of these services it and its affiliates provide to the Nuveen funds include, but are not limited to: product management (such as setting dividends, analyzing fund expenses, providing competitive analysis, and providing due diligence support); investment oversight, risk management and securities valuation services (such as overseeing and reviewing the various sub-advisers to the Nuveen funds and their investment teams; analyzing fund performance and risk data; overseeing operational and risk management; participating in financial statement, marketing and risk disclosures; providing daily valuation services and developing related valuation policies, procedures and methodologies; periodic testing of audit and regulatory requirements; participating in product development and management processes; participating in leverage management, liquidity monitoring and counterparty credit oversight; providing due diligence and overseeing fund accounting and custody providers; overseeing third party pricing services and periodically assessing investment and liquidity risks); fund administration (such as preparing fund tax returns and other tax compliance services; preparing regulatory filings; overseeing the funds’ independent public accountants and other service providers; analyzing products and enhancements; and managing fund budgets and expenses); oversight of shareholder services and transfer agency functions (such as overseeing transfer agent service providers which include registered shareholder customer service and transaction processing; overseeing proxy solicitation and tabulation services; and overseeing the production and distribution of financial reports by service providers); Board relations services (such as organizing and administering Board and committee meetings, preparing various reports to the Board and committees and providing other support services); compliance and regulatory oversight services (such as managing compliance policies; monitoring compliance with applicable fund policies and laws and regulations; devising internal compliance programs and a framework to review and assess compliance programs; evaluating the compliance programs of the various sub-advisers to the Nuveen funds and certain other service providers; responding to regulatory requests; and preparing compliance training materials); and legal support and oversight of outside law firms (such as helping to prepare and file registration statements and proxy statements; overseeing fund activities and providing legal interpretations regarding such activities; maintaining regulatory registrations and negotiating agreements with other fund service providers; and monitoring changes in regulatory requirements and commenting on rule proposals impacting investment companies).
In evaluating services, the Board reviewed various highlights of the initiatives the Adviser and its affiliates have undertaken or continued in 2020 to benefit the Nuveen complex and/or particular Nuveen funds and meet the requirements of an increasingly complex regulatory environment including, but not limited to:
| | • | | Centralization of Functions – ongoing initiatives to centralize investment leadership, market approach and shared support functions within Nuveen and its affiliates in seeking to operate more effectively the business and enhance the services to the Nuveen funds; |
| | • | | Fund Improvements and Product Management Initiatives – continuing to proactively manage the Nuveen fund complex as a whole and at the individual fund level with an aim to continually improve product platforms and investment strategies to better serve shareholders through, among other things, rationalizing the product line and gaining efficiencies through mergers, repositionings and liquidations; launching new funds; reviewing and updating investment policies and benchmarks; and modifying portfolio management teams for various funds; |
72
| | • | | Investment Team Integrations – continuing to integrate and adjust the members of certain investment teams, in part, to allow greater access to tools and resources within the Nuveen organization and its affiliates; |
| | • | | Capital Initiatives – continuing to invest capital to support new Nuveen funds with initial capital as well as to support existing funds and facilitate regulatory or logistical changes; |
| | • | | Liquidity Management – continuing to operate the liquidity management program of the applicable Nuveen funds including monitoring daily their liquidity profile and assessing annually the overall liquidity risk of such funds; |
| | • | | Compliance Program Initiatives – continuing efforts to mitigate compliance risk, increase operating efficiencies, implement enhancements to strengthen key compliance program elements and support international business growth and other corporate objectives; |
| | • | | Investment Oversight – preparing reports to the Board addressing, among other things, fund performance; market conditions; investment teams; new products; changes to mandates, policies and benchmarks; and other management proposals; |
| | • | | Risk Management and Valuation Services – continuing to oversee and manage risk including, among other things, conducting daily calculations and monitoring of risk measures across the Nuveen funds, instituting appropriate investment risk controls, providing risk reporting throughout the firm, participating in internal oversight committees, and continuing to implement an operational risk framework that seeks to provide greater transparency of operational risk matters across the complex as well as provide multiple other risk programs that seek to provide a more disciplined and consistent approach to identifying and mitigating Nuveen’s operational risks. Further, the securities valuation team continues, among other things, to oversee the daily valuation process of the portfolio securities of the funds, maintains the valuation policies and procedures, facilitates valuation committee meetings, manages relationships with pricing vendors, and prepares relevant valuation reports and designs methods to simplify and enhance valuation workflow within the organization; |
| | • | | Regulatory Matters – continuing efforts to monitor regulatory trends and advocate on behalf of Nuveen and/or the Nuveen funds, to implement and comply with new or revised rules and mandates and to respond to regulatory inquiries and exams; |
| | • | | Government Relations – continuing efforts of various Nuveen teams and Nuveen’s affiliates to develop policy positions on a broad range of issues that may impact the Nuveen funds, advocate and communicate these positions to lawmakers and other regulatory authorities and work with trade associations to ensure these positions are represented; |
| | • | | Business Continuity, Disaster Recovery and Information Security – continuing efforts of Nuveen to periodically test and update business continuity and disaster recovery plans and, together with its affiliates, to maintain an information security program designed to identify and manage information security risks, and provide reports to the Board, at least annually, addressing, among other things, management’s security risk assessment, cyber risk profile, potential impact of new or revised laws and regulations, incident tracking and other relevant information technology risk-related reports; and |
| | • | | Dividend Management Services – continuing to manage the dividends among the varying types of Nuveen funds within the Nuveen complex to be consistent with the respective fund’s product design and positioning in striving to deliver those earnings to shareholders in a relatively consistent manner over time as well as assisting in the development of new products or the restructuring of existing funds. |
In its review, the Board recognized that Nuveen’s risk management, compliance, technology and operations capabilities are all integral to providing its investment management services to the Nuveen funds. Further, the Board noted the benefits to shareholders of investing in a Nuveen fund, as each Nuveen fund is a part of a large fund complex with a variety of investment disciplines, capabilities, expertise and resources available to navigate and support the funds including during stressed times as occurred in the market in the first half of 2020. The Board recognized the impact of the COVID-19 pandemic during the year and the adaptations required by service providers to continue to deliver their services to the Nuveen funds, including working remotely. In this regard, the Board noted the ability of the Adviser and the various sub-advisers to the Nuveen funds to provide continuously their services notwithstanding the significant disruptions caused by the pandemic. In addition to the services provided by the Adviser, the Board also considered the risks borne by the Adviser and its affiliates in managing the Nuveen funds, including entrepreneurial, operational, reputational, regulatory and litigation risks.
The Board further considered the division of responsibilities between the Adviser and the Sub-Adviser and recognized that the Sub-Adviser and its investment personnel generally are responsible for the management of each Fund’s portfolio under the oversight of the Adviser and the Board. The Board considered an analysis of the Sub-Adviser provided by the Adviser which included, among other things, the assets under management of the applicable investment team and changes thereto, a summary of the applicable investment team and changes thereto, the investment process and philosophy of the applicable investment team, the performance of the Nuveen funds sub-advised by the Sub-Adviser over various periods of time and a summary of any significant policy and/or other changes to the Nuveen funds sub-advised by the Sub-Adviser. The Board further considered at the May Meeting or prior meetings evaluations of the Sub-Adviser’s compliance programs and trade execution. The Board also considered the structure of investment personnel compensation programs and whether this structure provides appropriate incentives to act in the best interests of the respective Nuveen funds. The Board noted that the Adviser recommended the renewal of the Sub-Advisory Agreements.
73
Annual Investment Management Agreement Approval Process (Unaudited) (continued)
Based on its review, the Board determined, in the exercise of its reasonable business judgment, that it was satisfied with the nature, extent and quality of services provided to the respective Funds under each applicable Advisory Agreement.
B. The Investment Performance of the Funds and Fund Advisers
In evaluating the quality of the services provided by the Fund Advisers, the Board also received and considered a variety of investment performance data of the Nuveen funds they advise. In evaluating performance, the Board recognized that performance data may differ significantly depending on the ending date selected, particularly during periods of market volatility, and therefore considered performance over a variety of time periods that may include full market cycles. In this regard, the Board reviewed, among other things, Fund performance over the quarter, one-, three- and five-year periods ending December 31, 2020 as well as performance data periods ending nearer to the May Meeting, including the quarter, one-, three- and five-year periods ending March 31, 2021 and May 14, 2021. The performance data was based on Class A shares; however, the performance of other classes should be substantially similar as they invest in the same portfolio of securities and differences in performance among the classes would be principally attributed to the variations in the expense structures of the classes. The performance data prepared for the annual review of the advisory agreements for the Nuveen funds supplemented the fund performance data that the Board received throughout the year at its meetings representing differing time periods. In its review, the Board took into account the discussions with representatives of the Adviser; the Adviser’s analysis regarding fund performance that occurred at these Board meetings with particular focus on funds that were considered performance outliers (both overperformance and underperformance); the factors contributing to the performance; and any recommendations or steps taken to address performance concerns. Regardless of the time period reviewed by the Board, the Board recognized that shareholders may evaluate performance based on their own holding periods which may differ from the periods reviewed by the Board and lead to differing results.
In its review, the Board reviewed both absolute and relative fund performance during the annual review over the various time periods. With respect to the latter, the Board considered fund performance in comparison to the performance of peer funds (the “Performance Peer Group”) and recognized and/or customized benchmarks (i.e., generally benchmarks derived from multiple recognized benchmarks). For Nuveen funds that had changes in portfolio managers since 2018 or significant changes, among other things, to their investment strategies or policies since 2019, the Board reviewed certain performance data comparing the performance of such funds before and after such changes. In considering performance data, the Board is aware of certain inherent limitations with such data, including that differences between the objective(s), strategies and other characteristics of the Nuveen funds compared to the respective Performance Peer Group and/or benchmark(s) (such as differences in the use of leverage) as well as differences in the composition of the Performance Peer Group over time will necessarily contribute to differences in performance results and limit the value of the comparative information. To assist the Board in its review of the comparability of the relative performance, the Adviser has ranked the relevancy of the peer group to the funds as low, medium or high.
The Board also evaluated performance in light of various relevant factors, including, among other things, general market conditions, issuer-specific information, asset class information, leverage and fund cash flows. In relation to general market conditions, the Board recognized the significant market decline in the early part of 2020 in connection with, among other things, the impact of the COVID-19 pandemic and that such a period of underperformance and market volatility may significantly weigh on the longer term performance results. Accordingly, depending on the facts and circumstances including any differences between the respective Nuveen fund and its benchmark and/or Performance Peer Group, the Board may be satisfied with a fund’s performance notwithstanding that its performance may be below that of its benchmark or peer group for certain periods. However, with respect to any Nuveen funds for which the Board had identified performance issues, the Board monitors such funds closely until performance improves, discusses with the Adviser the reasons for such results, considers whether any steps are necessary or appropriate to address such issues, and reviews the results of any steps undertaken.
The Board’s determinations with respect to each Fund are summarized below.
For Nuveen High Yield Income Fund (the “High Yield Fund”), the Board noted that although the Fund’s performance was below the performance of its benchmark for the one-, three- and five-year periods ended December 31, 2020 and the Fund ranked in the fourth quartile of its Performance Peer Group for the one- and three-year periods ended December 31, 2020, the Fund ranked in the first quartile of its Performance Peer Group for the five-year period ended December 31, 2020. Although the Fund’s performance was below the performance of its benchmark for the one-, three- and five-year periods ended March 31, 2021 and the Fund ranked in the fourth quartile of its Performance Peer Group for the three-year period ended March 31, 2021, the Fund ranked in the third quartile of its Performance Peer Group for the one-year period ended March 31, 2021 and second quartile for the five-year period ended March 31, 2021. In addition, for the periods ended May 14, 2021, although the Fund’s performance was below the performance of its benchmark for the one-, three- and five-year periods and the Fund ranked in the fourth quartile of its Performance Peer Group for the three-year period, the Fund ranked in the second quartile of its Performance Peer Group for the one- and five-year periods. In its review, the Board recognized the changes to the Fund’s portfolio management team in 2020. Based on its review, the Board was satisfied with the Fund’s overall performance.
For Nuveen Floating Rate Income Fund (the “Floating Rate Fund”), the Board noted that although the Fund’s performance was below the performance of its benchmark for the one-, three- and five-year periods ended December 31, 2020, the Fund ranked in the second quartile of its Performance Peer Group for such periods. Further, while the Fund’s performance was below the performance of its benchmark for the one-, three- and five-year periods
74
ended March 31, 2021, the Fund ranked in the second quartile of its Performance Peer Group for the one- and five-year periods ended March 31, 2021 and first quartile for the three-year period ended March 31, 2021. For the periods ended May 14, 2021, although the Fund’s performance was below the performance of its benchmark for the three- and five-year periods, the Fund outperformed its benchmark for the one-year period and ranked in the first quartile of its Performance Peer Group for the one- and three-year periods and second quartile for the five-year period. In its review, the Board noted the changes to the Fund’s portfolio management team in 2020. Based on its review, the Board was satisfied with the Fund’s overall performance.
C. Fees, Expenses and Profitability
1. Fees and Expenses
As part of its annual review, the Board considered the contractual management fee and net management fee (the management fee after taking into consideration fee waivers and/or expense reimbursements, if any) paid by a Nuveen fund to the Adviser in light of the nature, extent and quality of the services provided. The Board also considered the total operating expense ratio of each fund before and after any fee waivers and/or expense reimbursements. More specifically, the Independent Board Members reviewed, among other things, each fund’s gross and net management fee rates (i.e., before and after expense reimbursements and/or fee waivers, if any) and net total expense ratio in relation to those of a comparable universe of funds (the “Peer Universe”) and/or to a more focused subset of comparable funds (the “Peer Group”) established by Broadridge (subject to certain exceptions). The Independent Board Members reviewed the methodology Broadridge employed to establish its Peer Universe and Peer Group and recognized that differences between the applicable fund and its respective Peer Universe and/or Peer Group as well as changes to the composition of the Peer Group and/or Peer Universe from year to year may limit some of the value of the comparative data. The Independent Board Members also considered a fund’s operating expense ratio as it more directly reflected the shareholder’s costs in investing in the respective fund.
In their review, the Independent Board Members considered, in particular, each fund with a net expense ratio of six basis points or higher compared to that of its peer average (each, an “Expense Outlier Fund”) and an analysis as to the factors contributing to each such fund’s higher relative net expense ratio. Accordingly, in reviewing the comparative data between a fund and its peers, the Board generally considered the fund’s net expense ratio and fees to be higher if they were over 10 basis points higher, slightly higher if they were 6 to 10 basis points higher, in line if they were within approximately 5 basis points higher than the peer average and below if they were below the peer average of the Peer Group. The Independent Board Members also considered, in relevant part, a fund’s net management fee and net total expense ratio in light of its performance history.
In their review of the fee arrangements for the Nuveen funds, the Independent Board Members considered the management fee schedules, including the complex-wide and fund-level breakpoint schedules, and the expense reimbursements and/or fee waivers provided by Nuveen for each fund, as applicable. The Board noted that across the Nuveen fund complex, the complex-wide fee breakpoints reduced fees by approximately $58.4 million and fund-level breakpoints reduced fees by approximately $69.6 million in 2020. Further, fee caps and waivers for all applicable Nuveen funds saved approximately an additional $13.2 million in fees for shareholders in 2020.
With respect to the Sub-Adviser, the Board also considered the sub-advisory fee schedule paid to the Sub-Adviser in light of the sub-advisory services provided to the respective Fund, the breakpoint schedule and comparative data of the fees the Sub-Adviser charges to other clients, if any. In its review, the Board recognized that the compensation paid to the Sub-Adviser is the responsibility of the Adviser, not the Funds.
The Independent Board Members noted that (a) the High Yield Fund had a net management fee that was below its peer average and a net expense ratio that was in line with its peer average; and (b) the Floating Rate Fund had a net management fee that was in line with its peer average and a net expense ratio that was below its peer average.
Based on its review of the information provided, the Board determined that each Fund’s management fees (as applicable) to a Fund Adviser were reasonable in light of the nature, extent and quality of services provided to the Fund.
2. Comparisons with the Fees of Other Clients
In determining the appropriateness of fees, the Board also considered information regarding the fee rates the respective Fund Advisers charged to certain other types of clients and the type of services provided to these other clients. With respect to the Adviser and/or the Sub-Adviser, such other clients may include retail and institutional managed accounts advised by the Sub-Adviser; hedge funds managed by the Sub-Adviser; investment companies offered outside the Nuveen family and sub-advised by the Sub-Adviser; foreign investment companies offered by Nuveen and sub-advised by the Sub-Adviser; and collective investment trusts sub-advised by the Sub-Adviser. The Board further noted that the Adviser also advised certain exchange-traded funds (“ETFs”) sponsored by Nuveen.
The Board recognized that each Fund had an affiliated sub-adviser and, with respect to affiliated sub-advisers, reviewed, among other things, the range of fees assessed for managed accounts, hedge funds (along with their performance fee) and foreign investment companies offered by Nuveen. The Board also reviewed the fee range and average fee rate of certain selected investment strategies offered in retail and institutional managed accounts advised by the Sub-Adviser, the hedge funds advised by the Sub-Adviser (along with their performance fee) and non-Nuveen investment companies sub-advised by certain affiliated sub-advisers.
75
Annual Investment Management Agreement Approval Process (Unaudited) (continued)
In considering the fee data of other clients, the Board recognized, among other things, the differences in the amount, type and level of services provided to the Nuveen funds relative to other clients as well as the differences in portfolio investment policies, investor profiles, account sizes and regulatory requirements, all of which contribute to the variations in the fee schedules. The Board recognized the breadth of services the Adviser had provided to the Nuveen funds compared to the other types of clients as the funds operate in a highly regulated industry with increasing regulatory requirements as well as the increased entrepreneurial, legal and regulatory risks that the Adviser incurs in sponsoring and managing the funds. Further, with respect to ETFs, the Board considered that Nuveen ETFs were passively managed compared to the active management of the other Nuveen funds which contributed to the differences in fee levels between the Nuveen ETFs and other Nuveen funds. In general, higher fee levels reflect higher levels of service provided by the Adviser, increased investment management complexity, greater product management requirements, and higher levels of business risk or some combination of these factors. The Board further considered that the Sub-Adviser’s fee is essentially for portfolio management services and therefore more comparable to the fees it receives for retail wrap accounts and other external sub-advisory mandates. The Board concluded the varying levels of fees were justified given, among other things, the inherent differences in the products and the level of services provided to the Nuveen funds versus other clients, the differing regulatory requirements and legal liabilities and the entrepreneurial, legal and regulatory risks incurred in sponsoring and advising a registered investment company.
3. Profitability of Fund Advisers
In their review, the Independent Board Members considered information regarding Nuveen’s level of profitability for its advisory services to the Nuveen funds for the calendar years 2020 and 2019. The Board reviewed, among other things, Nuveen’s net margins (pre-tax) (both including and excluding distribution expenses); gross and net revenue margins (pre- and post-tax and excluding distribution) from Nuveen funds only; revenues, expenses and net income (pre- and post-tax and before distribution expenses) of Nuveen for fund advisory services; and comparative profitability data comparing the operating margins of Nuveen compared to the adjusted operating margins of certain peers that had publicly available data and with the most comparable assets under management (based on asset size and asset composition) for each of the last two calendar years. In reviewing the peer comparison data, the Independent Board Members noted that Nuveen Investments, Inc.’s operating margins were on the low range compared to the total company adjusted operating margins of the peers. The Board also reviewed the revenues and expenses the Adviser derived from its ETF product line for the 2019 and 2020 calendar years.
In reviewing the profitability data, the Independent Board Members recognized the subjective nature of calculating profitability as the information is not audited and is dependent on cost allocation methodologies to allocate corporate-wide expenses to the Nuveen complex and its affiliates and to further allocate such Nuveen complex expenses between the Nuveen fund and non-fund businesses. Generally, fund-specific expenses are allocated to the Nuveen funds and partial fund-related expenses and/or corporate overhead and shared costs (such as legal and compliance, accounting and finance, information technology and human resources and office services) are partially attributed to the funds pursuant to cost allocation methodologies. The Independent Board Members reviewed a description of the cost allocation methodologies employed to develop the financial information, a summary of the history of changes to the methodology over the years from 2010 to 2020, and the net revenue margins derived from the Nuveen funds (pre-tax and including and excluding distribution) and total company margins from Nuveen Investments, Inc. compared to the firm-wide adjusted margins of the peers for each calendar year from 2010 to 2020. The Board had also appointed three Independent Board Members to serve as the Board’s liaisons, with the assistance of independent counsel, to review the development of the profitability data and any proposed changes to the cost allocation methodology prior to incorporating any such changes and to report to the full Board. The Board recognized that other reasonable and valid allocation methodologies could be employed and could lead to significantly different results. The Independent Board Members also considered the key drivers behind the revenue and expense changes that impacted Nuveen’s net margins between 2019 and 2020. The Board also noted the reinvestments Nuveen and/or its parent made into its business through, among other things, the investment of seed capital in certain Nuveen funds and continued investments in enhancements to information technology, portfolio accounting systems and the global trading platform.
In reviewing the comparative peer data noted above, the Board considered that the operating margins of Nuveen Investments, Inc. were in the lower half of the peer group range; however, the Independent Board Members also recognized the limitations of the comparative data given that peer data is not generally public and the calculation of profitability is subjective and affected by numerous factors (such as types of funds a peer manages, its business mix, its cost of capital, the numerous assumptions underlying the methodology used to allocate expenses and other factors) that can have a significant impact on the results.
Aside from Nuveen’s profitability, the Board recognized that the Adviser is a subsidiary of Nuveen, LLC, the investment management arm of Teachers Insurance and Annuity Association of America (“TIAA”). Accordingly, the Board also reviewed a balance sheet for TIAA reflecting its assets, liabilities and capital and contingency reserves for the 2020 and 2019 calendar years to consider the financial strength of TIAA. The Board recognized the benefit of an investment adviser and its parent with significant resources, particularly during periods of market volatility as experienced with the COVID-19 pandemic.
In addition to Nuveen, the Independent Board Members considered the profitability of the Sub-Adviser from its relationships with the Nuveen funds. In this regard, the Independent Board Members reviewed, among other things, the Sub-Adviser’s revenues, expenses and net revenue margins (pre- and post-tax) for its advisory activities for the calendar year ended December 31, 2020 as well as its pre- and post-tax net revenue
76
margins for 2020 compared to such margins for 2019. The Independent Board Members also reviewed a profitability analysis reflecting the revenues, expenses and revenue margin (pre- and post-tax) by asset type for the Sub-Adviser for the calendar year ending December 31, 2020 and the pre- and post-tax revenue margins from 2020 and 2019.
In evaluating the reasonableness of the compensation, the Independent Board Members also considered any other ancillary benefits derived by the respective Fund Adviser from its relationship with the Nuveen funds as discussed in further detail below.
Based on a consideration of all the information provided, the Board noted that Nuveen’s and the Sub-Adviser’s level of profitability was acceptable and not unreasonable in light of the services provided.
D. Economies of Scale and Whether Fee Levels Reflect These Economies of Scale
The Board considered whether there have been economies of scale with respect to the management of the Nuveen funds and whether these economies of scale have been appropriately shared with the funds. The Board recognized that although economies of scale are difficult to measure and certain expenses may not decline with a rise in assets, there are several methods to help share the benefits of economies of scale, including breakpoints in the management fee schedule, fee waivers and/or expense limitations, the pricing of Nuveen funds at scale at inception and investments in Nuveen’s business which can enhance the services provided to the funds for the fees paid. The Board noted that Nuveen generally has employed these various methods, and the Board considered the extent to which the Nuveen funds will benefit from economies of scale as their assets grow. In this regard, the Board noted that the management fee of the Adviser is generally comprised of a fund-level component and a complex-level component each with its own breakpoint schedule, subject to certain exceptions. The Board reviewed the fund-level and complex-level fee schedules. The Board considered that the fund-level breakpoint schedules are designed to share economies of scale with shareholders if the particular fund grows, and the complex-level breakpoint schedule is designed to deliver the benefits of economies of scale to shareholders when the eligible assets in the complex pass certain thresholds even if the assets of a particular fund are unchanged or have declined. In the calculation of the complex-level component, the Board noted that it had approved the acquisition of several Nuveen funds by similar TIAA-CREF funds in 2019. However, to mitigate the loss of the assets of these Nuveen funds deemed eligible to be included in the calculation of the complex-wide fee when these Nuveen funds left the complex upon acquisition, Nuveen agreed to credit approximately $604.5 million to assets under management to the Nuveen complex in calculating the complex-wide component.
In addition to the fund-level and complex-level fee schedules, the Independent Board Members considered the temporary and/or permanent expense caps applicable to certain Nuveen funds (including the amounts of fees waived or amounts reimbursed to the respective funds in 2019 and 2020), including the temporary and permanent expense caps applicable to each Fund.
The Independent Board Members also recognized the Adviser’s continued reinvestment in its business through various initiatives including maintaining a seed account available for investments into Nuveen funds and investing in its internal infrastructure, information technology and other systems that will, among other things, consolidate and enhance accounting systems, integrate technology platforms to support growth and efficient data processing, and further develop its global trading platform to enhance the investment process for the investment teams.
Based on its review, the Board concluded that the current fee arrangements together with the Adviser’s reinvestment in its business appropriately shared any economies of scale with shareholders.
E. Indirect Benefits
The Independent Board Members received and considered information regarding other benefits the respective Fund Adviser or its affiliates may receive as a result of their relationship with the Nuveen funds. The Independent Board Members recognized that an affiliate of the Adviser serves as principal underwriter providing distribution and/or shareholder services to the open-end funds. The Independent Board Members further noted that, subject to certain exceptions, the Nuveen open-end funds pay 12b-1 fees and while a majority of such fees were paid to third party broker-dealers, the Board reviewed the amount retained by the Adviser’s affiliate. In addition, the Independent Board Members also noted that various sub-advisers (including the Sub-Adviser) may engage in soft dollar transactions pursuant to which they may receive the benefit of research products and other services provided by broker-dealers executing portfolio transactions on behalf of the applicable Nuveen funds. However, the Board noted that any benefits for the Sub-Adviser when transacting in fixed-income securities may be more limited as such securities generally trade on a principal basis and therefore do not generate brokerage commissions.
Based on its review, the Board concluded that any indirect benefits received by a Fund Adviser as a result of its relationship with the Funds were reasonable and within acceptable parameters.
F. Other Considerations
The Board Members did not identify any single factor discussed previously as all-important or controlling. The Board Members, including the Independent Board Members, concluded that the terms of each Advisory Agreement were fair and reasonable, that the respective Fund Adviser’s fees were reasonable in light of the services provided to each Fund and that the Advisory Agreements be renewed.
77
Liquidity Risk Management Program
(Unaudited)
Discussion of the operation and effectiveness of the Funds’ liquidity risk management program
In compliance with Rule 22e-4 under the Investment Company Act of 1940, as amended (the “Liquidity Rule”), each Fund covered in this Report (the “Funds”) has adopted and implemented a liquidity risk management program (the “Program”). which is designed to manage the Fund’s liquidity risk. The Program consists of various protocols for assessing and managing each Fund’s liquidity risk. The Funds’ Board of Trustees previously designated Nuveen Fund Advisors, LLC, the Funds’ investment adviser, as the Administrator of the Program. The adviser’s Liquidity Monitoring and Analysis Team (“LMAT”) carries out day-to-day Program management with oversight by the adviser’s Liquidity Oversight Sub-Committee (the “LOSC”). The LOSC is composed of personnel from the adviser and Teachers Advisors, LLC, an affiliate of the adviser.
At a May 26, 2021 meeting of the Board, the Administrator provided the Board with a written report addressing the Program’s operation, adequacy and effectiveness of implementation for calendar year 2019 (the “Review Period”), as required under the Liquidity Rule. The report noted that the Program has been and continues to be adequately and effectively implemented to monitor and (as applicable) respond to each Fund’s liquidity developments.
In accordance with the Program, the LMAT assesses each Fund’s liquidity risk no less frequently than annually based on various factors, such as (i) the Fund’s investment strategy and the liquidity of portfolio investments, (ii) cash flow projections, and (iii) holdings of cash and cash equivalents, borrowing arrangements, and other funding sources. Certain factors are considered under both normal and reasonably foreseeable stressed conditions.
Each Fund portfolio investment is classified into one of four liquidity categories (including the most liquid, “Highly Liquid”, and the least liquid, “Illiquid”, discussed below). The classification is based on a determination of how long it is reasonably expected to take to convert the investment into cash, or sell or dispose of the investment, in current market conditions without significantly changing the market value of the investment. Liquidity classification determinations take into account various market, trading, and investment-specific considerations, as well as market depth, and use third-party vendor data.
Any Fund that does not primarily hold highly liquid investments must, among other things, determine a minimum percentage of Fund assets that must be invested in highly liquid investments (a “Highly Liquid Investment Minimum”). During the Review Period, Nuveen California High Yield Municipal Bond Fund determined that it would hold a minimum of 25% of its assets in highly liquid investments, and it maintained at least that amount during the Review period. Nuveen California Municipal Bond Fund, primarily held Highly Liquid investments and therefore was exempt from the requirement to adopt a Highly Liquid Investment Minimum and to comply with the related requirements under the Liquidity Rule.
The Liquidity Rule also limits a Fund’s investments in Illiquid investments. Specifically, the Liquidity Rule prohibits a Fund from acquiring Illiquid investments if doing so would result in the Fund holding more than 15% of its net assets in Illiquid investments, and requires certain reporting to the Fund Board and the Securities and Exchange Commission any time a Fund’s holdings of Illiquid investments exceeds 15% of net assets. During the Review Period, no Fund exceeded the 15% limit on Illiquid investments. However, the Nuveen California High Yield Municipal Bond Fund exceeded the 15% limit on Illiquid investments for two business days after the end of the Review Period, which will be discussed in next year’s annual shareholder report in connection with discussing the operations of that Fund’s liquidity risk management program during 2020.
78
Trustees and Officers
(Unaudited)
The management of the Funds, including general supervision of the duties performed for the Funds by the Adviser, is the responsibility of the Board of Trustees of the Funds. None of the Trustees who are not “interested” persons of the Funds (referred to herein as “Independent Trustees”) has ever been a Trustee or employee of, or consultant to, Nuveen or its affiliates. The names and business addresses of the Trustees and officers of the Funds, their principal occupations and other affiliations during the past five years, the number of portfolios each Trustee oversees and other directorships they hold are set forth below.
The Funds’ Statement of Additional Information (“SAI”) includes more information about the Trustees. To request a free copy, call Nuveen Investments at (800) 257-8787 or visit the Funds’ website at www.nuveen.com.
| | | | | | | | |
Name,
Year of Birth
& Address | | Position(s)
Held with
the Funds | | Year First
Elected or
Appointed (1) | | Principal Occupation(s)
Including other Directorships
During Past 5 Years | | Number of
Portfolios in
Fund Complex
Overseen by
Trustee |
| | | | | |
| Independent Trustees: | | | | | | | | |
Terence J. Toth 1959 333 W. Wacker Drive Chicago, IL 60606 | | Chair and Trustee | | 2008 | | Formerly, a Co-Founding Partner, Promus Capital (investment advisory firm) (2008-2017); Director, Quality Control Corporation (manufacturing) (since 2012); member: Catalyst Schools of Chicago Board (since 2008) and Mather Foundation Board (philanthropy) (since 2012), and chair of its investment committee; formerly, Director, Fulcrum IT Services LLC (information technology services firm to government entities) (2010-2019); formerly, Director, LogicMark LLC (health services) (2012-2016); formerly, Director, Legal & General Investment Management America, Inc. (asset management) (2008-2013); formerly, CEO and President, Northern Trust Global Investments (financial services) (2004-2007); Executive Vice President, Quantitative Management & Securities Lending (2000-2004); prior thereto, various positions with Northern Trust Company (financial services) (since 1994); formerly, Member, Northern Trust Mutual Funds Board (2005-2007), Northern Trust Global Investments Board (2004-2007), Northern Trust Japan Board (2004-2007), Northern Trust Securities Inc. Board (2003- 2007) and Northern Trust Hong Kong Board (1997-2004). | | 143 |
Jack B. Evans 1948 333 W. Wacker Drive Chicago, IL 60606 | | Trustee | | 1999 | | Chairman (since 2019), formerly, President (1996-2019), The Hall-Perrine Foundation, (private philanthropic corporation); Life Trustee of Coe College; formerly, Member and President Pro-Tem of the Board of Regents for the State of Iowa University System (2007- 2013); Director and Chairman (2009-2021), United Fire Group, a publicly held company; Director, Public Member, American Board of Orthopaedic Surgery (2015-2020); Director (2000-2004), Alliant Energy; Director (1996-2015), The Gazette Company (media and publishing); Director (1997- 2003), Federal Reserve Bank of Chicago; President and Chief Operating Officer (1972-1995), SCI Financial Group, Inc., (regional financial services firm). | | 143 |
William C. Hunter 1948 333 W. Wacker Drive Chicago, IL 60606 | | Trustee | | 2003 | | Dean Emeritus, formerly, Dean, Tippie College of Business, University of Iowa (2006-2012); Director of Wellmark, Inc. (since 2009); past Director (2005-2015), and past President (2010- 2014) Beta Gamma Sigma, Inc., The International Business Honor Society; formerly, Director (2004-2018) of Xerox Corporation; formerly, Dean and Distinguished Professor of Finance, School of Business at the University of Connecticut (2003-2006); previously, Senior Vice President and Director of Research at the Federal Reserve Bank of Chicago (1995-2003); formerly, Director (1997-2007), Credit Research Center at Georgetown University. | | 143 |
79
Trustees and Officers (Unaudited) (continued)
| | | | | | | | |
Name,
Year of Birth
& Address | | Position(s)
Held with
the Funds | | Year First
Elected or
Appointed (1) | | Principal Occupation(s)
Including other Directorships
During Past 5 Years | | Number of
Portfolios in
Fund Complex
Overseen by
Trustee |
Amy B. R. Lancellotta 1959 333 W. Wacker Drive Chicago, IL 60606 | | Trustee | | 2021 | | Formerly, Managing Director, Independent Directors Council (IDC) (supports the fund independent director community and is part of the Investment Company Institute (ICI), which represents regulated investment companies) (2006-2019); formerly, various positions with ICI (1989-2006); Member of the Board of Directors, Jewish Coalition Against Domestic Abuse (JCADA) (since 2020). | | 143 |
Joanne T. Medero 1954 333 W. Wacker Drive Chicago, IL 60606 | | Trustee | | 2021 | | Formerly, Managing Director, Government Relations and Public Policy (2009-2020) and Senior Advisor to the Vice Chairman (2018-2020), BlackRock, Inc. (global investment management firm); formerly, Managing Director, Global Head of Government Relations and Public Policy, Barclays Group (IBIM) (investment banking, investment management and wealth management businesses)(2006-2009); formerly, Managing Director, Global General Counsel and Corporate Secretary, Barclays Global Investors (global investment management firm) (1996-2006); formerly, Partner, Orrick, Herrington & Sutcliffe LLP (law firm) (1993-1995); formerly, General Counsel, Commodity Futures Trading Commission (government agency overseeing U.S. derivatives markets) (1989-1993); formerly, Deputy Associate Director/Associate Director for Legal and Financial Affairs, Office of Presidential Personnel, The White House (1986-1989); Member of the Board of Directors, Baltic-American Freedom Foundation (seeks to provide opportunities for citizens of the Baltic states to gain education and professional development through exchanges in the U.S.) (since 2019). | | 143 |
Albin F. Moschner 1952 333 W. Wacker Drive Chicago, IL 60606 | | Trustee | | 2016 | | Founder and Chief Executive Officer, Northcroft Partners, LLC, (management consulting) (since 2012); formerly, Chairman (2019), and Director (2012-2019), USA Technologies, Inc., (provider of solutions and services to facilitate electronic payment transactions); formerly, Director, Wintrust Financial Corporation (1996-2016); previously, held positions at Leap Wireless International, Inc. (consumer wireless services), including Consultant (2011-2012), Chief Operating Officer (2008-2011), and Chief Marketing Officer (2004-2008); formerly, President, Verizon Card Services division of Verizon Communications, Inc. (2000-2003); formerly, President, One Point Services at One Point Communications (telecommunication services) (1999-2000); formerly, Vice Chairman of the Board, Diba, Incorporated (internet technology provider) (1996-1997); formerly, various executive positions (1991-1996) including Chief Executive Officer (1995-1996) of Zenith Electronics Corporation (consumer electronics). | | 143 |
John K. Nelson 1962 333 W. Wacker Drive Chicago, IL 60606 | | Trustee | | 2013 | | Member of Board of Directors of Core12 LLC. (private firm which develops branding, marketing and communications strategies for clients) (since 2008); served The President’s Council of Fordham University (2010-2019) and previously a Director of the Curran Center for Catholic American Studies (2009-2018); formerly, senior external advisor to the Financial Services practice of Deloitte Consulting LLP. (2012-2014); former Chair of the Board of Trustees of Marian University (2010-2014 as trustee, 2011-2014 as Chair); formerly Chief Executive Officer of ABN AMRO Bank N.V., North America, and Global Head of the Financial Markets Division (2007-2008), with various executive leadership roles in ABN AMRO Bank N.V. between 1996 and 2007. | | 143 |
80
| | | | | | | | |
Name,
Year of Birth
& Address | | Position(s)
Held with
the Funds | | Year First
Elected or
Appointed (1) | | Principal Occupation(s)
Including other Directorships
During Past 5 Years | | Number of
Portfolios in
Fund Complex
Overseen by
Trustee |
Judith M. Stockdale 1947 333 W. Wacker Drive Chicago, IL 60606 | | Trustee | | 1997 | | Board Member, Land Trust Alliance (national public charity addressing natural land and water conservation in the U.S.) (since 2013); formerly, Board Member, U.S. Endowment for Forestry and Communities (national endowment addressing forest health, sustainable forest production and markets, and economic health of forest-reliant communities in the U.S.) (2013-2019); formerly, Executive Director (1994-2012), Gaylord and Dorothy Donnelley Foundation (private foundation endowed to support both natural land conservation and artistic vitality); prior thereto, Executive Director, Great Lakes Protection Fund (endowment created jointly by seven of the eight Great Lakes states’ Governors to take a regional approach to improving the health of the Great Lakes) (1990-1994). | | |
Carole E. Stone 1947 333 W. Wacker Drive Chicago, IL 60606 | | Trustee | | 2007 | | Former Director, Chicago Board Options Exchange (2006-2017), and C2 Options Exchange, Incorporated (2009-2017); formerly, Director, Cboe Global Markets, Inc., (2010-2020) (formerly named CBOE Holdings, Inc.); formerly, Commissioner, New York State Commission on Public Authority Reform (2005-2010). | | 143 |
Matthew Thornton III 1958 333 W. Wacker Drive Chicago, IL 60606 | | Trustee | | 2020 | | Formerly, Executive Vice President and Chief Operating Officer (2018-2019), FedEx Freight Corporation, a subsidiary of FedEx Corporation (“FedEx”) (provider of transportation, e-commerce and business services through its portfolio of companies); formerly, Senior Vice President, U.S. Operations (2006-2018), Federal Express Corporation, a subsidiary of FedEx; formerly Member of the Board of Directors (2012-2018), Safe Kids Worldwide® (a non-profit organization dedicated to preventing childhood injuries). Member of the Board of Directors (since 2014), The Sherwin-Williams Company (develops, manufactures, distributes and sells paints, coatings and related products); Director (since 2020), Crown Castle International (provider of communications infrastructure). | | 143 |
Margaret L. Wolff 1955 333 W. Wacker Drive Chicago, IL 60606 | | Trustee | | 2016 | | Formerly, member of the Board of Directors (2013-2017) of Travelers Insurance Company of Canada and The Dominion of Canada General Insurance Company (each, a part of Travelers Canada, the Canadian operation of The Travelers Companies, Inc.); formerly, Of Counsel, Skadden, Arps, Slate, Meagher & Flom LLP (legal services, Mergers & Acquisitions Group) (2005-2014); Member of the Board of Trustees of New York-Presbyterian Hospital (since 2005); Member (since 2004) and Chair (since 2015) of the Board of Trustees of The John A. Hartford Foundation (a philanthropy dedicated to improving the care of older adults); formerly, Member (2005-2015) and Vice Chair (2011-2015) of the Board of Trustees of Mt. Holyoke College. | | 143 |
Robert L. Young 1963 333 W. Wacker Drive Chicago, IL 60606 | | Trustee | | 2017 | | Formerly, Chief Operating Officer and Director, J.P. Morgan Investment Management Inc. (financial services) (2010-2016); formerly, President and Principal Executive Officer (2013-2016), and Senior Vice President and Chief Operating Officer (2005-2010), of J.P. Morgan Funds; formerly, Director and various officer positions for J.P. Morgan Investment Management Inc. (formerly, JPMorgan Funds Management, Inc. and formerly, One Group Administrative Services) and JPMorgan Distribution Services, Inc. (financial services) (formerly, One Group Dealer Services, Inc.) (1999-2017). | | 143 |
81
Trustees and Officers (Unaudited) (continued)
| | | | | | |
Name,
Year of Birth
& Address | | Position(s)
Held with
the Funds | | Year First
Elected or
Appointed (2) | | Principal Occupation(s)
During Past 5 Years |
| | | | |
| Officers of the Funds: | | | | | | |
Christopher E. Stickrod 1976 333 W. Wacker Drive Chicago, IL 60606 | | Chief Administrative Officer | | 2020 | | Senior Managing Director (since 2017) and Head of Advisory Product (since 2020), formerly, Managing Director (2016-2017) and Senior Vice President (2013-2016) of Nuveen; Senior Managing Director of Nuveen Securities, LLC (since 2018) and of Nuveen Fund Advisors, LLC (since 2019). |
Mark J. Czarniecki 1979 901 Marquette Avenue Minneapolis, MN 55402 | | Vice President and Secretary | | 2013 | | Vice President and Assistant Secretary of Nuveen Securities, LLC (since 2016) and Nuveen Fund Advisors, LLC (since 2017); Vice President and Associate General Counsel of Nuveen (since 2013) and Vice President, Assistant Secretary and Associate General Counsel of Nuveen Asset Management, LLC (since 2018). |
Diana R. Gonzalez 1978 333 W. Wacker Drive Chicago, IL 60606 | | Vice President and Assistant Secretary | | 2017 | | Vice President and Assistant Secretary of Nuveen Fund Advisors, LLC (since 2017); Vice President and Associate General Counsel of Nuveen (since 2017); formerly, Associate General Counsel of Jackson National Asset Management, LLC (2012-2017). |
Nathaniel T. Jones 1979 333 W. Wacker Drive Chicago, IL 60606 | | Vice President and Treasurer | | 2016 | | Senior Managing Director (since 2021), formerly, Managing Director (2017-2021), Senior Vice President (2016-2017), Vice President (2011- 2016) of Nuveen; Managing Director (since 2015) of Nuveen Fund Advisors, LLC; Chartered Financial Analyst. |
Tina M. Lazar 1961 333 W. Wacker Drive Chicago, IL 60606 | | Vice President | | 2002 | | Managing Director (since 2017), formerly, Senior Vice President (2014-2017) of Nuveen Securities, LLC. |
Brian J. Lockhart 1974 333 W. Wacker Drive Chicago, IL 60606 | | Vice President | | 2019 | | Managing Director (since 2019) of Nuveen Fund Advisors, LLC; Senior Managing Director (since 2021), formerly, Managing Director (2017-2021), Vice President (2010-2017) of Nuveen; Head of Investment Oversight (since 2017), formerly, Team Leader of Manager Oversight (2015-2017); Chartered Financial Analyst and Certified Financial Risk Manager. |
Jacques M. Longerstaey 1963 8500 Andrew Carnegie Blvd. Charlotte, NC 28262 | | Vice President | | 2019 | | Senior Managing Director, Chief Risk Officer, Nuveen (since May 2019); Senior Managing Director (since May 2019) of Nuveen Fund Advisors, LLC; formerly, Chief Investment and Model Risk Officer, Wealth & Investment Management Division, Wells Fargo Bank (NA) (2013-2019). |
Kevin J. McCarthy 1966 333 W. Wacker Drive Chicago, IL 60606 | | Vice President and Assistant Secretary | | 2007 | | Senior Managing Director (since 2017) and Secretary and General Counsel (since 2016) of Nuveen Investments, Inc., formerly, Executive Vice President (2016-2017) and Managing Director and Assistant Secretary (2008-2016); Senior Managing Director (since 2017) and Assistant Secretary (since 2008) of Nuveen Securities, LLC, formerly Executive Vice President (2016-2017) and Managing Director (2008-2016); Senior Managing Director (since 2017) and Secretary (since 2016) of Nuveen Fund Advisors, LLC, formerly, Co-General Counsel (2011-2020), Executive Vice President (2016-2017), Managing Director (2008-2016) and Assistant Secretary (2007-2016); Senior Managing Director (since 2017), Secretary (since 2016) of Nuveen Asset Management, LLC, formerly, Associate General Counsel (2011-2020), Executive Vice President (2016-2017) and Managing Director and Assistant Secretary (2011-2016); Vice President (since 2007) and Secretary (since 2016), formerly, Assistant Secretary, of NWQ Investment Management Company, LLC, Santa Barbara Asset Management, LLC and Winslow Capital Management, LLC (since 2010). Senior Managing Director (since 2017) and Secretary (since 2016) of Nuveen Alternative Investments, LLC. |
Jon Scott Meissner 1973 8500 Andrew Carnegie Blvd. Charlotte, NC 28262 | | Vice President and Assistant Secretary | | 2019 | | Managing Director of Mutual Fund Tax and Financial Reporting groups at Nuveen (since 2017); Managing Director of Nuveen Fund Advisors, LLC (since 2019); Senior Director of Teachers Advisors, LLC and TIAA-CREF Investment Management, LLC (since 2016); Senior Director (since 2015) Mutual Fund Taxation to the TIAA-CREF Funds, the TIAA-CREF Life Funds, the TIAA Separate Account VA-1 and the CREF Accounts; has held various positions with TIAA since 2004. |
82
| | | | | | |
Name,
Year of Birth
& Address | | Position(s)
Held with
the Funds | | Year First
Elected or
Appointed (2) | | Principal Occupation(s)
During Past 5 Years |
Deann D. Morgan 1969 730 Third Avenue New York, NY 10017 | | Vice President | | 2020 | | President, Nuveen Fund Advisors, LLC (since 2020); Executive Vice President, Global Head of Product at Nuveen (since 2019); Co-Chief Executive Officer of Nuveen Securities, LLC (since 2020); Managing Member of MDR Collaboratory LLC (since 2018); formerly, Managing Director, Head of Wealth Management Product Structuring & COO Multi Asset Investing. The Blackstone Group (2013-2017). |
Christopher M. Rohrbacher 1971 333 W. Wacker Drive Chicago, IL 60606 | | Vice President and Assistant Secretary | | 2008 | | Managing Director and Assistant Secretary (since 2017) of Nuveen Securities, LLC; Managing Director (since 2017), General Counsel (since 2020), and Assistant Secretary (since 2016), formerly, Senior Vice President (2016-2017), of Nuveen Fund Advisors, LLC; Managing Director, Associate General Counsel and Assistant Secretary of Nuveen Asset Management, LLC (since 2020); Managing Director (since 2017) and Associate General Counsel (since 2016), formerly, Senior Vice President (2012-2017) and Assistant General Counsel (2008-2016) of Nuveen. |
William A. Siffermann 1975 333 W. Wacker Drive Chicago, IL 60606 | | Vice President | | 2017 | | Managing Director (since 2017), formerly Senior Vice President (2016-2017) and Vice President (2011-2016) of Nuveen. |
E. Scott Wickerham 1973 8500 Andrew Carnegie Blvd. Charlotte, NC 28262 | | Vice President and Controller | | 2019 | | Senior Managing Director, Head of Public Investment Finance at Nuveen (since 2019), formerly, Managing Director; Senior Managing Director (since 2019) of Nuveen Fund Advisors, LLC; Principal Financial Officer, Principal Accounting Officer and Treasurer (since 2017) of the TIAA-CREF Funds, the TIAA-CREF Life Funds, the TIAA Separate Account VA-1 and Principal Financial Officer, Principal Accounting Officer (since 2020) and Treasurer (since 2017) of the CREF Accounts; formerly, Senior Director, TIAA-CREF Fund Administration (2014-2015); has held various positions with TIAA since 2006. |
Mark L. Winget 1968 333 W. Wacker Drive Chicago, IL 60606 | | Vice President and Assistant Secretary | | 2008 | | Vice President and Assistant Secretary of Nuveen Securities, LLC (since 2008), and Nuveen Fund Advisors, LLC (since 2019); Vice President, Associate General Counsel and Assistant Secretary of Nuveen Asset Management, LLC (since 2020); Vice President (since 2010) and Associate General Counsel (since 2019), formerly, Assistant General Counsel (2008-2016) of Nuveen. |
Gifford R. Zimmerman 1956 333 W. Wacker Drive Chicago, IL 60606 | | Vice President and Chief Compliance Officer | | 1988 | | Formerly: Managing Director (2002-2020) and Assistant Secretary (2002-2020) of Nuveen Securities, LLC; formerly, Managing Director (2002-2020), Assistant Secretary (1997-2020) and Co-General Counsel (2011-2020) of Nuveen Fund Advisors, LLC; formerly, Managing Director (2004-2020) and Assistant Secretary (1994-2020) of Nuveen Investments, Inc.; formerly, Managing Director, Assistant Secretary and Associate General Counsel of Nuveen Asset Management, LLC (2011-2020); formerly, Vice President and Assistant Secretary of NWQ Investment Management Company, LLC (2002-2020), Santa Barbara Asset Management, LLC (2006-2020) and Winslow Capital Management, LLC (2010-2020); Chartered Financial Analyst. |
| (1) | Trustees serve an indefinite term until his/her successor is elected or appointed. The year first elected or appointed represents the year in which the director was first elected or appointed to any fund in the Nuveen fund complex. |
| (2) | Officers serve one year terms through August of each year. The year first elected or appointed represents the year in which the officer was first elected or appointed to any fund in the Nuveen fund complex. |
83
Nuveen:
Serving Investors for Generations
Since 1898, financial professionals and their clients have relied on Nuveen to provide dependable investment solutions through continued adherence to proven, long-term investing principles. Today, we offer a range of high quality solutions designed to be integral components of a well-diversified core portfolio.
Focused on meeting investor needs.
Nuveen is the investment manager of TIAA. We have grown into one of the world’s premier global asset managers, with specialist knowledge across all major asset classes and particular strength in solutions that provide income for investors and that draw on our expertise in alternatives and responsible investing. Nuveen is driven not only by the independent investment processes across the firm, but also the insights, risk management, analytics and other tools and resources that a truly world-class platform provides. As a global asset manager, our mission is to work in partnership with our clients to create solutions which help them secure their financial future.
Find out how we can help you.
To learn more about how the products and services of Nuveen may be able to help you meet your financial goals, talk to your financial professional, or call us at (800) 257-8787. Please read the information provided carefully before you invest. Investors should consider the investment objective and policies, risk considerations, charges and expenses of any investment carefully. Where applicable, be sure to obtain a prospectus, which contains this and other relevant information. To obtain a prospectus, please contact your securities representative or Nuveen, 333 W. Wacker Dr., Chicago, IL 6o6o6. Please read the prospectus carefully before you invest or send money.
Learn more about Nuveen Funds at: www.nuveen.com/mutual-funds
| | | | |
Nuveen Securities, LLC, member FINRA and SIPC |
333 West Wacker Drive Chicago, IL 60606 | www.nuveen.com | | MAN-SCFR-0921D | | 1893890-INV-
Y-11/22 |
As of the end of the period covered by this report, the registrant has adopted a code of ethics that applies to the registrant’s principal executive officer, principal financial officer, principal accounting officer or controller, or persons performing similar functions. There were no amendments to or waivers from the code during the period covered by this report. The registrant has posted the code of ethics on its website at www.nuveen.com/fund-governance. (To view the code, click on Code of Conduct.)
| ITEM 3. | AUDIT COMMITTEE FINANCIAL EXPERT. |
As of the end of the period covered by this report, the registrant’s Board of Directors or Trustees (“Board”) determined that the registrant has at least one “audit committee financial expert” (as defined in Item 3 of Form N-CSR) serving on its Audit Committee. The registrant’s audit committee financial experts are Carole E. Stone, Jack B. Evans, William C. Hunter and Albin F. Moschner, who are “independent” for purposes of Item 3 of Form N-CSR.
Ms. Stone served for five years as Director of the New York State Division of the Budget. As part of her role as Director, Ms. Stone was actively involved in overseeing the development of the State’s operating, local assistance and capital budgets, its financial plan and related documents; overseeing the development of the State’s bond-related disclosure documents and certifying that they fairly presented the State’s financial position; reviewing audits of various State and local agencies and programs; and coordinating the State’s system of internal audit and control. Prior to serving as Director, Ms. Stone worked as a budget analyst/examiner with increasing levels of responsibility over a 30 year period, including approximately five years as Deputy Budget Director. Ms. Stone has also served as Chair of the New York State Racing Association Oversight Board, as Chair of the Public Authorities Control Board, as a Commissioner on the New York State Commission on Public Authority Reform and as a member of the Boards of Directors of several New York State public authorities. These positions have involved overseeing operations and finances of certain entities and assessing the adequacy of project/entity financing and financial reporting. Currently, Ms. Stone is on the Board of Directors of CBOE Holdings, Inc., of the Chicago Board Options Exchange, and of C2 Options Exchange. Ms. Stone’s position on the boards of these entities and as a member of both CBOE Holdings’ Audit Committee and its Finance Committee has involved, among other things, the oversight of audits, audit plans and preparation of financial statements.
Mr. Evans was formerly President and Chief Operating Officer of SCI Financial Group, Inc., a full service registered broker-dealer and registered investment adviser (“SCI”). As part of his role as President and Chief Operating Officer, Mr. Evans actively supervised the Chief Financial Officer (the “CFO”) and actively supervised the CFO’s preparation of financial statements and other filings with various regulatory authorities. In such capacity, Mr. Evans was actively involved in the preparation of SCI’s financial statements and the resolution of issues raised in connection therewith. Mr. Evans has also served on the audit committee of various reporting companies. At such companies, Mr. Evans was involved in the oversight of audits, audit plans, and the preparation of financial statements. Mr. Evans also formerly chaired the audit committee of the Federal Reserve Bank of Chicago.
Mr. Hunter was formerly a Senior Vice President at the Federal Reserve Bank of Chicago. As part of his role as Senior Vice President, Mr. Hunter was the senior officer responsible for all operations of each of the Economic Research, Statistics, and Community and Consumer Affairs units at the Federal Reserve Bank of Chicago. In such capacity, Mr. Hunter oversaw the subunits of the Statistics and Community and Consumer Affairs divisions responsible for the analysis and evaluation of bank and bank holding company financial statements and financial filings. Prior to serving as Senior Vice President at the Federal Reserve Bank of Chicago, Mr. Hunter was the Vice President of the Financial Markets unit at the Federal Reserve Bank of Atlanta where he supervised financial staff and bank holding company analysts who analyzed and evaluated bank and bank holding company financial statements. Mr. Hunter also currently serves on the Boards of Directors of Xerox Corporation and Wellmark, Inc. as well as on the Audit Committees of such Boards. As an Audit Committee member, Mr. Hunter’s responsibilities include, among other things, reviewing financial statements, internal audits and internal controls over financial reporting. Mr. Hunter also formerly was a Professor of Finance at the University of Connecticut School of Business and has authored numerous scholarly articles on the topics of finance, accounting and economics.
Mr. Moschner, Founder and Chief Executive Officer, Northcroft Partners, LLC, (management consulting) (since 2012); formerly, Chairman (2019), and Director (2012-2019), USA Technologies, Inc., (provider of solutions and services to facilitate electronic payment transactions); formerly, Director, Wintrust Financial Corporation (1996-2016); previously, held positions at Leap Wireless International, Inc., (consumer wireless services) including Consultant (2011-2012), Chief Operating Officer (2008-2011), and Chief Marketing Officer (2004-2008); formerly, President, Verizon Card Services division of Verizon Communications, Inc. (2000-2003); formerly, President, One Point Services at One Point Communications (telecommunication services) (1999-2000); formerly, Vice Chairman of the Board, Diba, Incorporated (internet technology provider) (1996-1997); formerly, various executive positions (1991-1996), including Chief Executive Officer (1995-1996) of Zenith Electronics Corporation (consumer electronics).
| ITEM 4. | PRINCIPAL ACCOUNTANT FEES AND SERVICES. |
The following tables show the amount of fees that KPMG LLP the Funds’ auditor, billed to the Funds’ during the Funds’ last two full fiscal years. The Audit Committee approved in advance all audit services and non-audit services that KPMG LLP provided to the Funds, except for those non-audit services that were subject to the pre-approval exception under Rule 2-01 of Regulation S-X (the “pre-approval exception”). The preapproval exception for services provided directly to the Funds waives the pre-approval requirement for services other than audit, review or attest services if: (A) the aggregate amount of all such services provided constitutes no more than 5% of the total amount of revenues paid by the Funds during the fiscal year in which the services are provided; (B) the Funds did not recognize the services as non-audit services at the time of the engagement; and (C) the services are promptly brought to the Audit Committee’s attention, and the Committee (or its delegate) approves the services before the audit is completed.
The Audit Committee has delegated certain pre-approval responsibilities to its Chair (or, in her absence, any other member of the Audit Committee).
| | | | | | | | | | | | | | | | |
Fiscal Year Ended September 30, 2021 | | Audit Fees Billed
to Funds 1 | | | Audit-Related Fees
Billed to Funds 2 | | | Tax Fees Billed
to Funds 3 | | | All Other Fees
Billed to Funds 4 | |
Fund Name | | | | | | | | | | | | | | | | |
Nuveen High Yield Income Fund | | | 46,420 | | | | 0 | | | | 0 | | | | 0 | |
Nuveen Floating Rate Income Fund | | | 44,100 | | | | 0 | | | | 0 | | | | 0 | |
| | | | | | | | | | | | | | | | |
Total | | $ | 90,520 | | | $ | 0 | | | $ | 0 | | | $ | 0 | |
| 1 | | “Audit Fees” are the aggregate fees billed for professional services for the audit of the Fund’s annual financial statements and services provided in connection with statutory and regulatory filings or engagements. |
| 2 | | “Audit-Related Fees” are the aggregate fees billed for assurance and related services reasonably related to the performance of the audit or review of financial statements that are not reported under “Audit Fees”. These fees include offerings related to the Fund’s common shares and leverage. |
| 3 | | “Tax Fees” are the aggregate fees billed for professional services for tax advice, tax compliance, and tax planning. These fees include: all global withholding tax services; excise and state tax reviews; capital gain, tax equalization and taxable basis calculations performed by the principal accountant. |
| 4 | | “All Other Fees” are the aggregate fees billed for products and services other than “Audit Fees”, “Audit-Related Fees” and “Tax Fees”. These fees represent all “Agreed-Upon Procedures” engagements pertaining to the Fund’s use of leverage. |
| | | | | | | | | | | | | | | | |
| | | Percentage Approved Pursuant to Pre-approval Exception | |
| | | Audit Fees Billed
to Funds | | | Audit-Related Fees
Billed to Funds | | | Tax Fees
Billed to Funds | | | All Other Fees
Billed to Funds | |
Fund Name | | | | | | | | | | | | | | | | |
Nuveen High Yield Income Fund | | | 0 | % | | | 0 | % | | | 0 | % | | | 0 | % |
Nuveen Floating Rate Income Fund | | | 0 | % | | | 0 | % | | | 0 | % | | | 0 | % |
| | | | |
September 30, 2020 | | Audit Fees Billed
to Funds 1 | | | Audit-Related Fees
Billed to Funds 2 | | | Tax Fees
Billed to Funds 3 | | | All Other Fees
Billed to Funds 4 | |
Fund Name | | | | | | | | | | | | | | | | |
Nuveen High Yield Income Fund | | | 43,560 | | | | 0 | | | | 0 | | | | 0 | |
Nuveen Floating Rate Income Fund | | | 41,280 | | | | 0 | | | | 0 | | | | 0 | |
| | | | | | | | | | | | | | | | |
Total | | $ | 84,840 | | | $ | 0 | | | $ | 0 | | | $ | 0 | |
| 1 | | “Audit Fees” are the aggregate fees billed for professional services for the audit of the Fund’s annual financial statements and services provided in connection with statutory and regulatory filings or engagements. |
| 2 | | “Audit-Related Fees” are the aggregate fees billed for assurance and related services reasonably related to the performance of the audit or review of financial statements that are not reported under “Audit Fees”. These fees include offerings related to the Fund’s common shares and leverage. |
| 3 | | “Tax Fees” are the aggregate fees billed for professional services for tax advice, tax compliance, and tax planning. These fees include: all global withholding tax services; excise and state tax reviews; capital gain, tax equalization and taxable basis calculations performed by the principal accountant. |
| 4 | | “All Other Fees” are the aggregate fees billed for products and services other than “Audit Fees”, “Audit-Related Fees” and “Tax Fees”. These fees represent all “Agreed-Upon Procedures” engagements pertaining to the Fund’s use of leverage. |
| | | | | | | | | | | | | | | | |
| | | Percentage Approved Pursuant to Pre-approval Exception | |
| | | Audit Fees Billed
to Funds | | | Audit-Related Fees
Billed to Funds | | | Tax Fees
Billed to Funds | | | All Other Fees
Billed to Funds | |
Fund Name | | | | | | | | | | | | | | | | |
Nuveen High Yield Income Fund | | | 0 | % | | | 0 | % | | | 0 | % | | | 0 | % |
Nuveen Floating Rate Income Fund | | | 0 | % | | | 0 | % | | | 0 | % | | | 0 | % |
| | | | | | | | | | | | |
Fiscal Year Ended September 30, 2021 | | Audit-Related Fees
Billed to Adviser and
Affiliated Fund
Service Providers | | | Tax Fees Billed to
Adviser and
Affiliated Fund
Service Providers | | | All Other Fees
Billed to Adviser
and Affiliated Fund
Service Providers | |
Nuveen Investment Trust III | | $ | 0 | | | $ | 0 | | | $ | 0 | |
| |
| | | Percentage Approved Pursuant to Pre-approval Exception | |
| | | Audit-Related Fees
Billed to Adviser and
Affiliated Fund
Service Providers | | | Tax Fees Billed to
Adviser and
Affiliated Fund
Service Providers | | | All Other Fees
Billed to Adviser
and Affiliated Fund
Service Providers | |
| | | 0 | % | | | 0 | % | | | 0 | % |
| | | |
Fiscal Year Ended September 30, 2020 | | Audit-Related Fees
Billed to Adviser and
Affiliated Fund
Service Providers | | | Tax Fees Billed to
Adviser and
Affiliated Fund
Service Providers | | | All Other Fees
Billed to Adviser
and Affiliated Fund
Service Providers | |
Nuveen Investment Trust III | | $ | 0 | | | $ | 0 | | | $ | 0 | |
| |
| | | Percentage Approved Pursuant to Pre-approval Exception | |
| | | Audit-Related Fees
Billed to Adviser and
Affiliated Fund
Service Providers | | | Tax Fees Billed to
Adviser and
Affiliated Fund
Service Providers | | | All Other Fees
Billed to Adviser
and Affiliated Fund
Service Providers | |
| | | 0 | % | | | 0 | % | | | 0 | % |
| | | | | | | | | | | | | | | | |
Fiscal Year Ended September 30, 2021 | | Total Non-Audit Fees
Billed to Trust | | | Total Non-Audit Fees
billed to Adviser and
Affiliated Fund Service
Providers (engagements
related directly to the
operations and financial
reporting of the Trust) | | | Total Non-Audit Fees
billed to Adviser and
Affiliated Fund Service
Providers (all other
engagements) | | | Total | |
Fund Name | | | | | | | | | | | | | | | | |
Nuveen High Yield Income Fund | | | 0 | | | | 0 | | | | 0 | | | | 0 | |
Nuveen Floating Rate Income Fund | | | 0 | | | | 0 | | | | 0 | | | | 0 | |
| | | | | | | | | | | | | | | | |
Total | | $ | 0 | | | $ | 0 | | | $ | 0 | | | $ | 0 | |
“Non-Audit Fees billed to Fund” for both fiscal year ends represent “Tax Fees” and “All Other Fees” billed to Fund in their respective amounts from the previous table.
Less than 50 percent of the hours expended on the principal accountant’s engagement to audit the registrant’s financial statements for the most recent fiscal year were attributed to work performed by persons other than the principal accountant’s full-time, permanent employees.
| | | | | | | | | | | | | | | | |
Fiscal Year Ended September 30, 2020 | | Total Non-Audit Fees
Billed to Trust | | | Total Non-Audit Fees
billed to Adviser and
Affiliated Fund Service
Providers (engagements
related directly to the
operations and financial
reporting of the Trust) | | | Total Non-Audit Fees
billed to Adviser and
Affiliated Fund Service
Providers (all other
engagements) | | | Total | |
Fund Name | | | | | | | | | | | | | | | | |
Nuveen High Yield Income Fund | | | 0 | | | | 0 | | | | 0 | | | | 0 | |
Nuveen Floating Rate Income Fund | | | 0 | | | | 0 | | | | 0 | | | | 0 | |
| | | | | | | | | | | | | | | | |
Total | | $ | 0 | | | $ | 0 | | | $ | 0 | | | $ | 0 | |
“Non-Audit Fees billed to Fund” for both fiscal year ends represent “Tax Fees” and “All Other Fees” billed to Fund in their respective amounts from the previous table.
Audit Committee Pre-Approval Policies and Procedures. Generally, the Audit Committee must approve (i) all non-audit services to be performed for the Funds by the Funds’ independent accountant and (ii) all audit and non-audit services to be performed by the Funds’ independent accountant for the Affiliated Fund Service Providers with respect to the operations and financial reporting of the Funds. Regarding tax and research projects conducted by the independent accountant for the Funds and Affiliated Fund Service Providers (with respect to operations and financial reports of the Trust), such engagements will be (i) pre-approved by the Audit Committee if they are expected to be for amounts greater than $10,000; (ii) reported to the Audit Committee Chair for her verbal approval prior to engagement if they are expected to be for amounts under $10,000 but greater than $5,000; and (iii) reported to the Audit Committee at the next Audit Committee meeting if they are expected to be for an amount under $5,000.
| ITEM 5. | AUDIT COMMITTEE OF LISTED REGISTRANTS. |
Not applicable to this registrant.
| ITEM 6. | SCHEDULE OF INVESTMENTS. |
| a) | | See Portfolio of Investments in Item 1. |
| ITEM 7. | DISCLOSURE OF PROXY VOTING POLICIES AND PROCEDURES FOR CLOSED-END MANAGEMENT INVESTMENT COMPANIES. |
Not applicable to this registrant.
| ITEM 8. | PORTFOLIO MANAGERS OF CLOSED-END MANAGEMENT INVESTMENT COMPANIES. |
Not applicable to this registrant.
| ITEM 9. | PURCHASES OF EQUITY SECURITIES BY CLOSED-END MANAGEMENT INVESTMENT COMPANY AND AFFILIATED PURCHASERS. |
Not applicable to this registrant.
| ITEM 10. | SUBMISSION OF MATTERS TO A VOTE OF SECURITY HOLDERS. |
There have been no material changes to the procedures by which shareholders may recommend nominees to the registrant’s Board of Trustees implemented after the registrant last provided disclosure in response to this Item.
| ITEM 11. | CONTROLS AND PROCEDURES. |
| | (a) | | The registrant’s principal executive and principal financial officers, or persons performing similar functions, have concluded that the registrant’s disclosure controls and procedures (as defined in Rule 30a-3(c) under the Investment Company Act of 1940, as amended (the “1940 Act”) (17 CFR 270.30a-3(c))) are effective, as of a date within 90 days of the filing date of this report that includes the disclosure required by this paragraph, based on their evaluation of the controls and procedures required by Rule 30a-3(b) under the 1940 Act (17 CFR 270.30a-3(b)) and Rules 13a-15(b) or 15d-15(b) under the Securities Exchange Act of 1934, as amended (the “Exchange Act”) (17 CFR 240.13a-15(b) or 240.15d-15(b)). |
| | (b) | | There were no changes in the registrant’s internal control over financial reporting (as defined in Rule 30a-3(d) under the 1940 Act (17 CFR 270.30a-3(d)) that occurred during the period covered by this report that has materially affected, or is reasonably likely to materially affect, the registrant’s internal control over financial reporting. |
| ITEM 12. | DISCLOSURE OF SECURITIES LENDING ACTIVITIES FOR CLOSED-END MANAGEMENT INVESTMENT COMPANIES. |
Not applicable.
File the exhibits listed below as part of this Form.
SIGNATURES
Pursuant to the requirements of the Securities Exchange Act of 1934 and the Investment Company Act of 1940, the registrant has duly caused this report to be signed on its behalf by the undersigned, thereunto duly authorized.
(Registrant) Nuveen Investment Trust III
| | |
| By (Signature and Title) | | /s/ Mark J. Czarniecki |
| | Mark J. Czarniecki |
| | Vice President and Secretary |
Date: December 3, 2021
Pursuant to the requirements of the Securities Exchange Act of 1934 and the Investment Company Act of 1940, this report has been signed below by the following persons on behalf of the registrant and in the capacities and on the dates indicated.
| | |
| By (Signature and Title) | | /s/ Christopher E. Stickrod |
| | Christopher E. Stickrod |
| | Chief Administrative Officer |
| | (principal executive officer) |
Date: December 3, 2021
| | |
| By (Signature and Title) | | /s/ E. Scott Wickerham |
| | E. Scott Wickerham |
| | Vice President and Controller |
| | (principal financial officer) |
Date: December 3, 2021