| AS FILED WITH THE SECURITIES AND EXCHANGE COMMISSION ON APRIL 27, 2020 |
UNITED STATES
SECURITIES AND EXCHANGE COMMISSION
WASHINGTON, DC 20549
FORM 20-F
(Mark One)
| ☐ | REGISTRATION STATEMENT PURSUANT TO SECTION 12(b) OR (g) OF THE SECURITIES EXCHANGE ACT OF 1934 |
OR
| ☒ | ANNUAL REPORT PURSUANT TO SECTION 13 OR 15(d) OF THE SECURITIES EXCHANGE ACT OF 1934 |
For the fiscal year ended December 31, 2019
OR
| ☐ | TRANSITION REPORT PURSUANT TO SECTION 13 OR 15(d) OF THE SECURITIES EXCHANGE ACT OF 1934 |
For the transition period from ___________to___________
OR
| ☐ | SHELL COMPANY REPORT PURSUANT TO SECTION 13 OR 15(d) OF THE SECURITIES EXCHANGE ACT OF 1934 |
Date of event requiring this shell company report___________
For the transition period from .___________ to___________
Commission file number: 001 - 32535
BANCOLOMBIA S.A.
(Exact name of Registrant as specified in its charter)
N/A
(Translation of Registrant’s name into English)
Republic of Colombia
(Jurisdiction of incorporation or organization)
Carrera 48 # 26-85, Avenida Los Industriales
Medellín, Colombia
(Address of principal executive offices)
Alejandro Mejia Jaramillo, Investor Relations Manager
Tel. +574 4041837, e-mail: almejia@bancolombia.com
Carrera 48 # 26-85, Medellín, Colombia
(Name, Telephone, E-Mail and/or Facsimile number and Address of Company Contact Person)
Securities registered or to be registered pursuant to Section 12(b) of the Act.
| Title of each Class | Trading Symbol (s) | Name of each exchange on which registered |
| American Depositary Shares | CIB | New York Stock Exchange |
| Preferred Shares | | New York Stock Exchange* |
| | | |
| * | Bancolombia’s preferred shares are not listed for trading directly, but only in connection with its American Depositary Shares, which are evidenced by American Depositary Receipts, each representing four preferred shares. |
Securities registered or to be registered pursuant to Section 12(g) of the Act.
Not applicable
(Title of Class)
Securities for which there is a reporting obligation pursuant to Section 15(d) of the Act.
Not applicable
(Title of Class)
indicate the number of outstanding shares of each of the issuer’s classes of capital or common stock as of the close of the
period covered by the annual report.
| Common Shares | 509,704,584 |
| Preferred Shares | 452,122,416 |
Indicate by check mark if the registrant is a well-known seasoned issuer, as defined in Rule 405 of the Securities Act.
Yes☒ No ☐
If this report is an annual or transition report, indicate by check mark if the registrant is not required to file reports pursuant to
Section 13 of 15(d) of the Securities Exchange Act of 1934.
Yes ☐ No ☒
Indicate by check mark whether the registrant (1) has filed all reports required to be filed by Section 13 or 15(d) of the Securities Exchange Act of 1934 during the preceding 12 months (or for such shorter period that the registrant was required to file such reports),
and (2) has been subject to such filing requirements for the past 90 days.
Yes ☒ No ☐
Indicate by check mark whether the registrant has submitted electronically every Interactive Data File required to be submitted and posted pursuant to Rule 405 of Regulation S-T during the preceding 12 months (or for such shorter period that the registrant was required to submit and post such files).
Yes☐ No ☒
Indicate by check mark whether the registrant is a large accelerated filer, an accelerated filer, a non-accelerated filer, or an emerging growth company. See the definitions of “large accelerated filer”, “accelerated filer” and “emerging growth company” in Rule 12b-2 of the Exchange Act. (Check one):
| Large accelerated filer ☒ | Accelerated filer ☐ | Non-accelerated filer ☐ |
| | | Emerging growth company ☐ |
(Do not check if a smaller reporting company)
If an emerging growth company that prepares its financial statements in accordance with U.S. GAAP, indicate by check mark if the registrant has elected not to use the extended transition period for complying with any new or revised financial accounting standards† provided pursuant to Section 13(a) of the Exchange Act. ☐
The term “new or revised financial accounting standard” refers to any update issued by the Financial Accounting Standards Board to its Accounting Standards Codification after April 5, 2012.
Indicate by check mark which basis of accounting the registrant has used to prepare the financial statements included in this filing:
| U.S. GAAP ☐ | International Financial Reporting Standards as issued by the International Accounting Standards Board ☒ | Other ☐ |
If “Other” has been checked in response to the previous question, indicate by check mark which financial statement item the registrant has elected to follow.
Item 17 ☐ Item 18 ☐
If this is an annual report, indicate by check mark whether the registrant is a shell company (as defined in Rule 12b-2 of the Exchange Act).
Yes ☐ No ☒
(APPLICABLE ONLY TO ISSUERS INVOLVED IN BANKRUPTCY PROCEEDINGS DURING THE PAST FIVE YEARS.)
Indicate by check mark whether the registrant has filed all documents and reports required to be filed by Section 12, 13 or 15(d) of the Securities Exchange Act of 1934 subsequent to the distribution of securities under a plan confirmed by a court.
Yes ☐ No ☒
TABLE OF CONTENTS
CERTAIN DEFINED TERMS
Unless otherwise specified or if the context so requires, in this annual report:
“ADSs” refers to the Bank’s American Depositary Shares (one ADS represents four preferred shares).
“Annual Report” refer to this annual report on Form 20-F.
“ATM” refer to automated teller machine.
“BAM” refer to Banco Agromercantil de Guatemala S.A., a banking institution organized under the laws of the Republic of Guatemala, including its subsidiaries on a consolidated basis, unless otherwise indicated or the context otherwise requires.
“Banagrícola” refer to Banagrícola S.A., a company incorporated in Panama, including its subsidiaries on a consolidated basis, unless otherwise indicated or the context otherwise requires.
“Banca de Inversión” refer to Banca de Inversión Bancolombia S.A. Corporación Financiera, a Subsidiary of Bancolombia S.A. organized under the laws of the Republic of Colombia that specializes in providing investment banking services.
“Banco Agrícola” refer to Banco Agrícola S.A., a banking institution organized under the laws of the Republic of El Salvador, including its subsidiaries on a consolidated basis, unless otherwise indicated or the context otherwise requires.
“Bancolombia”, the “Bank”, “us”, “we” or “our” refer to Bancolombia S.A., a banking institution organized under the laws of the Republic of Colombia, including its subsidiaries on a consolidated basis, unless otherwise indicated or the context otherwise requires.
“Bancolombia Panama” refer to Bancolombia Panamá S.A., a subsidiary of Bancolombia S.A. organized under the laws of the Republic of Panama that provides banking services to non-Panamanian customers.
“Banistmo” refer to Banistmo S.A., a banking institution organized under the laws of the Republic of Panama, including its subsidiaries on a consolidated basis, unless otherwise indicated or the context otherwise requires.
“Central Bank” refer to the Central Bank of Colombia (“Banco de la República”).
“Colombia” refer to the Republic of Colombia.
“Colombian banking GAAP” refer to generally accepted accounting Principles in Colombia as regulated by Law 1314 of 2009, Decree 1851 of 2013 and as supplemented by the applicable regulations of the SFC, which differs with IFRS in (i) the recognition of impairment for loans; (ii) the classification and subsequent measurement of debt and equity investments, and (iii) the impairment of foreclosed assets. The Consolidated Financial Statements included in this Annual Report are prepared under IFRS as issued by the International Accounting Standard Board.
“Consolidated Financial Statements” refer to the audited consolidated statements of financial position of the Bank as of December 31, 2019 and 2018 and the audited consolidated statements of income, comprehensive income, changes in equity and cash flows for the years ended December 31, 2019, 2018 and 2017 and related notes included in this Annual Report.
“DTF” refer to the “Depósitos a Término Fijo” rate, the weighted average interest rate paid by finance corporations, commercial banks and financing companies in Colombia for time deposits with maturities of 90 days.
“Fiduciaria Bancolombia” refer to Fiduciaria Bancolombia S.A. Sociedad Fiduciaria, a Subsidiary of Bancolombia organized under the laws of Colombia which provides trust and fund management services.
“Grupo Agromercantil” refer to Grupo Agromercantil Holding S.A., a company organized under the laws of the Republic of Panama and the parent company of BAM, and its consolidated subsidiaries, unless the context otherwise requires.
“IFRS” refer to the International Financial Reporting Standards as issued by the International Accounting Standards Board.
“IRS” refer to the U.S. Internal Revenue Service.
“NYSE” refer to the New York Stock Exchange.
“OCI” refers to Other Comprehensive Income.
“peso”, “pesos” or “COP” refer to the lawful currency of Colombia.
“preferred shares” and “common shares” refer to our issued outstanding and fully paid-in preferred and common shares, designated as “acciones con dividendo preferencial sin derecho a voto” and “acciones ordinarias”, respectively.
“Renting Colombia” refer to Renting Colombia S.A.S., a Subsidiary of Bancolombia S.A. organized under the laws of Colombia, which provides operating lease and fleet management services for individuals and companies.
“Representative Market Rate” refer to “Tasa Representativa del Mercado”, the U.S. dollar representative market rate, certified by the SFC. The Representative Market Rate is an economic indicator of the daily exchange rate on the Colombian market spot of currencies. It corresponds to the arithmetical weighted average of the rates for the purchase and sale of currencies by certain financial institutions (including Bancolombia) authorized to engage in foreign exchange transactions in Colombia.
“SEC” refer to the U.S. Securities and Exchange Commission.
“SMEs” refer to Small and Medium Enterprises.
“SMMLV” refer to “Salario Mínimo Mensual Legal Vigente”, the effective legal minimum monthly salary in Colombia. In 2019, the effective legal minimum monthly salary in Colombia was COP $828.116.
“Subsidiaries” refer to entities controlled by Bancolombia S.A. The Bank controls an investee when the investor is exposed, or has rights, to variable returns from its involvement with the investee and has the ability to affect those returns through the Bank’s power.
“Superintendency of Finance” or “SFC” refer to the Colombian Superintendency of Finance (“Superintendencia Financiera de Colombia”), a technical entity under the Ministry of Finance and Public Credit (“Ministerio de Hacienda y Crédito Público”) with functions of inspection, supervision and control over the entities involved in financial activities, capital markets, insurance and any other services related to the management, use or investment of resources collected from the public.
“Superintendency of Industry and Commerce” or “SIC” refer to the Colombian Superintendency of Industry and Commerce (Superintendencia de Industria y Comercio de Colombia), a technical entity under the Ministry of Commerce, Industry and Tourism (Ministerio de Comercio Industria y Turismo) with functions of supervision and regulation of the competition in several industries, including financial institutions.
“U.S.” or “United States” refer to the United States of America.
“U.S. dollar”, “USD”, and “US$” refer to the lawful currency of the United States.
“UVR” refer to Unidades de Valor Real, a Colombian inflation-adjusted monetary index calculated by the board of directors of the Central Bank and generally used for pricing home-mortgage loans.
“Valores Bancolombia” refer to Valores Bancolombia S.A. Comisionista de Bolsa, a Subsidiary of Bancolombia S.A. organized under the laws of the Republic of Colombia that provides brokerage and asset management services.
Our fiscal year ends on December 31, and references in this annual report to any specific fiscal year are to the 12-month period ended December 31 of such year.
CAUTIONARY NOTE REGARDING FORWARD-LOOKING STATEMENTS
This Annual Report contains statements which may constitute forward-looking statements within the meaning of the safe harbor provisions of the U.S. Private Securities Litigation Reform Act of 1995. These forward-looking statements are not based on historical facts but instead represent only the Bank’s belief regarding future events, many of which, by their nature, are inherently uncertain and outside the Bank’s control. The words “anticipate”, “believe”, “estimate”, “expect”, “intend”, “plan”, “predict”, “target”, “forecast”, “guideline”, “should”, “project” and similar words and expressions are intended to identify forward-looking statements. It is possible that the Bank’s actual results may differ, possibly materially, from the anticipated results indicated in or implied by these forward-looking statements.
Information regarding important factors that could cause actual results to differ, perhaps materially, from those in the Bank’s forward-looking statements appear in a number of places in this Annual Report, principally in Item 3. “Key Information – D. Risk Factors” and Item 5. “Operating and Financial Review and Prospects”. These factors include, but are not limited to: (i) changes in general economic, business, political, social, fiscal or other conditions in Colombia, or in any of the other countries where the Bank operates; (ii) changes in capital markets or in markets in general that may affect policies or attitudes towards lending; (iii) unanticipated increases in financing and other costs or the inability to obtain additional debt or equity financing on attractive terms; (iv) inflation, changes in foreign exchange rates and/or interest rates; (v) sovereign risks; (vi) liquidity risks; (vii) increases in delinquencies by the Bank’s borrowers; (viii) lack of acceptance of new products or services by the Bank’s targeted customers; (ix) competition in the banking, financial services, credit card services, insurance, asset management, remittances, business and other industries in which the Bank operates; (x) adverse determination of legal or regulatory disputes or proceedings; (xi) changes in official regulations and the Colombian government’s banking policy as well as changes in laws, regulations or policies in other jurisdictions in which the Bank does business and (xii) the negative impact on operations and financial results of the Bank resulting from widespread health emergencies, infectious diseases or pandemics, such as COVID-19.
Forward-looking statements speak only as of the date they are made and are subject to change, and the Bank does not intend, and does not assume any obligation, to update these forward-looking statements in light of new information or future events arising after the date of this Annual Report.
PRESENTATION OF CERTAIN FINANCIAL AND OTHER INFORMATION
Accounting Principles
The audited consolidated statements of financial position of the Bank as of December 31, 2019 and 2018 and the audited consolidated statements of income, of comprehensive income, changes in equity and cash flows for the years ended December 31, 2019, 2018 and 2017 and related notes (the “Consolidated Financial Statements”) included in this Annual Report were prepared in accordance with IFRS as issued by the International Accounting Standards Board (“IASB”) and the related interpretations issued by the IFRS Interpretations Committee (“IFRS IC”). All data included in this report has been prepared in accordance with IFRS as issued by the IASB, except for the data included in Item 4. B.7 Competition, which has been prepared in accordance with the local GAAP of each subsidiary.
The Consolidated Financial Statements include entities which the Bank controls, directly or indirectly. See Item 4. “Information on the Company – C. Organizational Structure” for an organizational chart depicting Bancolombia and its subsidiaries.
Currencies
The Consolidated Financial Statements are presented in Colombian pesos, which is the functional currency for Bancolombia S.A., and the presentation currency for the Consolidated Financial Statements. The Consolidated Financial Statements as of December 31, 2019 and 2018 and for the three fiscal years ended December 31, 2019, 2018, and 2017 contained in this Annual Report are expressed in millions of pesos.
This Annual Report translates certain pesos amounts into U.S. dollars at specified rates solely for the convenience of the reader. Unless otherwise indicated, such peso amounts have been translated at the rate of COP 3,277.14 per USD 1.00, which corresponds to the Representative Market Rate calculated on December 31, 2019. The SFC also calculates and certifies the average Representative Market Rate for each month for purposes of preparing financial statements and converting amounts in foreign currency to pesos. Such conversion should not be construed as a representation that the peso amounts correspond to, or have been or could be converted into, U.S. dollars at that rate or any other rate. On April 27, 2020, the Representative Market Rate was COP 4,039.87 per USD 1.00.
Rounding Comparability of Data
Certain monetary amounts, percentages and other figures included in this Annual Report have been subject to rounding adjustments. Accordingly, figures shown as totals in certain tables may not be the arithmetic aggregation of the figures that precede them, and figures expressed as percentages in the text may not total 100% or, as applicable, when aggregated may not be the arithmetic aggregation of the percentages that precede them.
The Bank maintains an internet site at http://www.grupobancolombia.com/. In addition, certain of the Bank’s Subsidiaries referred to in this Annual Report maintain separate internet sites. For example, Banco Agrícola, Banistmo and Banco Agromercantil de Guatemala maintain internet sites at http://www.bancoagricola.com/, http://www.banistmo.com/, and https://www.bam.com.gt/ respectively. Information included on or accessible through Bancolombia’s internet site or the internet site of any of the Subsidiaries of the Bank is not incorporated into this Annual Report or the fili. All references in this Annual Report to these and other internet sites are inactive textual references to these URLs, or “uniform resource locators”, and are for your informational reference only.
PART I
| ITEM 1 | IDENTITY OF DIRECTORS, SENIOR MANAGEMENT AND ADVISERS |
Not applicable.
| ITEM 2 | OFFER STATISTICS AND EXPECTED TIMETABLE |
Not applicable.
A. | SELECTED FINANCIAL DATA |
The selected consolidated statement of financial position data as of December 31, 2019 and 2018, and the selected consolidated statement of income data for each of the periods ended December 31, 2019, 2018 and 2017, set forth below have been derived from the Consolidated Financial Statements under IFRS as issued by the IASB included in this Annual Report, except for the figures translated to U.S. dollars, which are presented for the convenience of the reader.
The selected consolidated statement of financial position data as of December 31, 2016 and 2015 have been derived from audited consolidated financial statements under IFRS as issued by IASB previously filed with the SEC as part of the Bank’s Annual Report on Form 20-F for the years ended December 31, 2016 and 2015.
The selected consolidated financial data should be read in conjunction with, and is qualified in its entirety by reference to the Consolidated Financial Statements, including the notes thereto, the audit reports of the Bank’s independent registered public accounting firms and the previously consolidated statement filed with the SEC as part of the Bank’s Annual Report on Form 20-F for the years ended December 31, 2017, 2016 and 2015.
The Consolidated Financial Statements of the Bank as of and for the years ended December 31, 2019 and 2018 were audited by PricewaterhouseCoopers Ltda., while the Consolidated Financial Statements of the Bank for the years ended December 31, 2017 and 2016 were audited by Deloitte and Touche Ltda. The Consolidated Financial Statements of the Bank as of and for the year ended December 31, 2015 were audited by PricewaterhouseCoopers Ltda.
| | As of and for the year ended December 31, |
| | 2019(1) | | 2019 | | 2018 | | 2017 | | 2016 | | 2015 |
| CONSOLIDATED STATEMENT OF INCOME DATA: | | | | | | | | | | | | |
| Total interest and valuation on financial instruments | USD | 5,303,614 | COP | 17,380,684 | COP | 16,116,500 | COP | 16,696,393 | COP | 15,748,805 | COP | 11,269,644 |
| Interest expenses | | (1,885,728) | | (6,179,794) | | (5,670,216) | | (6,232,986) | | (6,053,100) | | (4,037,941) |
| Net interest margin and valuation income on financial instruments before impairment on loans and financial leases, and other financial instruments and off balance sheet credit instruments | | 3,417,886 | | 11,200,890 | | 10,446,284 | | 10,463,407 | | 9,695,705 | | 7,231,703 |
| Credit impairment charges on loans and advances and financial leases, net(2) | | (1,032,968) | | (3,385,181) | | (3,851,625) | | (3,468,699) | | (2,643,710) | | (1,667,680) |
| Credit impairment recoveries (charges) on off balance sheet credit instruments | | (7,993) | | (26,195) | | 5,668 | | 7,082 | | (87,442) | | (7,421) |
| Allowances for credit losses on debt investments(2) | | 78 | | 255 | | 2,885 | | - | | - | | - |
| Net interest margin and valuation income on financial instruments after impairment on loans and financial leases and off balance sheet credit instruments | | 2,377,003 | | 7,789,769 | | 6,603,212 | | 7,001,790 | | 6,964,553 | | 5,556,602 |
| Total other operating income(3) | | 1,507,894 | | 4,941,579 | | 4,495,556 | | 4,217,039 | | 3,974,310 | | 3,577,320 |
| Total operating expenses | | (2,518,605) | | (8,253,817) | | (7,482,898) | | (7,226,058) | | (6,970,581) | | (5,898,287) |
| Profit before tax | | 1,366,292 | | 4,477,531 | | 3,615,870 | | 3,992,771 | | 3,968,282 | | 3,235,635 |
| Income tax | | (385,386) | | (1,262,964) | | (829,435) | | (1,238,598) | | (1,176,832) | | (649,250) |
| Profit for the year from continued operations | | 980,906 | | 3,214,567 | | 2,786,435 | | 2,754,173 | | 2,791,450 | | 2,586,385 |
| Net income from discontinued operations | | - | | - | | - | | - | | 163,497 | | 22,513 |
| Net income | | 980,906 | | 3,214,567 | | 2,786,435 | | 2,754,173 | | 2,954,947 | | 2,608,898 |
| Net income attributable to equity holders of the parent company | USD | 951,241 | COP | 3,117,351 | COP | 2,658,864 | COP | 2,615,000 | COP | 2,865,328 | COP | 2,518,890 |
| Non-controlling interest | | 29,665 | | 97,216 | | 127,571 | | 139,173 | | 89,619 | | 90,008 |
| Weighted average of Preferred and Common Shares outstanding(4) | | | | 961,827,000 | | 961,827,000 | | 961,827,000 | | 961,827,000 | | 961,827,000 |
| Basic and diluted earnings per share to common shareholders(4) | | 1.01 | | 3,301 | | 2,825 | | 2,780 | | 3,040 | | 2,680 |
| From continuing operations | | 1.01 | | 3,301 | | 2,825 | | 2,780 | | 2,870 | | 2,656 |
| From discontinued operations | | - | | - | | - | | - | | 170 | | 24 |
Basic and diluted earnings per ADS(4) | | 4.03 | | 13,204 | | 11,300 | | 11,120 | | 12,160 | | 10,720 |
| From continuing operations | | 4.03 | | 13,204 | | 11,300 | | 11,120 | | 11,480 | | 10,624 |
| From discontinued operations | | | | - | | - | | - | | 680 | | 96 |
| Cash dividends declared per share | | | | 1,638 | | 1,092 | | 1,020 | | 950 | | 888 |
| Cash dividends declared per share (stated in USD) | | | | 0.50 | | 0.34 | | 0.34 | | 0.32 | | 0.28 |
| Cash dividends declared per ADS | | | | 6,552 | | 4,368 | | 4,080 | | 3,800 | | 3,552 |
| Cash dividends declared per ADS (stated in USD) | | | | 2.00 | | 1.34 | | 1.37 | | 1.27 | | 1.13 |
| (1) | Translated for convenience only using the Representative Market Rate as computed and certified by the Superintendency of Finance on December 31, 2019 of 3,277.14 per USD 1.00. |
| (2) | IFRS 9 (2014) set significant changes in the assessment of the impairment of the value of financial instruments and therefore their associated risk, going from an incurred loss model to one of expected credit loss. As of December 31, 2019 and 2018, the Bank recognized credit impairment charges based on IFRS 9 model. The allowances for the years ended December 31, 2017, 2016, and 2015 were computed under IAS 39. Accordingly, those amounts are not comparable to the amounts as of December 31, 2018 and 2019. |
| (3) | Includes total fees and commissions net, other operating income and dividends received, and share of profits of equity method investees. See consolidated statement of income to the Consolidated Financial Statements, and for the year ended as of December 31, 2015, see annual reports previously filed with the SEC for the years ended December 31, 2016 and 2015. |
| (4) | The weighted average of preferred and common shares outstanding for the fiscal years ended December 31, 2019, 2018, 2017, 2016 and 2015 are 452,122,416 preferred shares and 509,704,584 common shares. |
| | | | | For the year ended December 31, | | |
| | | 2019(1) | | 2019 | | 2018 | | 2017 | | 2016 | | 2015 |
| SELECTED CONSOLIDATED STATEMENT OF FINANCIAL POSITION DATA: | | | | | | | | | | | | |
| Assets: | | | | | | | | | | | | |
| Cash and cash equivalents | USD | 7,243,524 | COP | 23,738,042 | COP | 18,730,810 | COP | 18,165,644 | COP | 20,460,245 | COP | 18,597,614 |
| Financial assets Investments | | 5,133,364 | | 16,822,754 | | 17,361,475 | | 16,377,253 | | 13,060,653 | | 14,277,824 |
| Derivative financial instruments | | 580,676 | | 1,902,955 | | 1,843,708 | | 1,134,372 | | 1,677,970 | | 2,382,168 |
| Loans and advances to customers and financial Institutions | | 55,622,507 | | 182,282,743 | | 173,819,116 | | 160,468,094 | | 151,747,486 | | 145,620,639 |
| Allowance for loans and advances and lease losses(2) | | (3,335,041) | | (10,929,395) | | (10,235,831) | | (8,223,103) | | (6,621,911) | | (5,248,755) |
| Assets held for sale and inventories, net | | 158,293 | | 518,749 | | 636,028 | | 377,003 | | 273,187 | | 1,950,808 |
| Investment in associates and joint ventures | | 722,507 | | 2,367,757 | | 2,149,579 | | 1,565,059 | | 1,298,246 | | 546,549 |
| Investment property | | 608,141 | | 1,992,964 | | 1,732,873 | | 1,657,409 | | 1,581,689 | | 1,505,046 |
| Premises and equipment, net(3) | | 1,168,050 | | 3,827,865 | | 3,368,647 | | 3,127,405 | | 3,115,697 | | 3,052,266 |
| Right of use assets | | 516,339 | | 1,692,116 | | | | | | | | |
| Goodwill and Intangible assets, net | | 2,207,203 | | 7,233,312 | | 7,201,855 | | 6,631,424 | | 6,694,037 | | 7,092,255 |
| Deferred tax, net | | 122,363 | | 401,002 | | 271,177 | | 148,614 | | 222,862 | | 170,482 |
| Other assets, net | | 1,292,973 | | 4,237,249 | | 3,197,045 | | 2,479,037 | | 2,750,883 | | 3,025,971 |
| Total assets | USD | 72,040,899 | COP | 236,088,113 | COP | 220,076,482 | COP | 203,908,211 | COP | 196,261,044 | COP | 192,972,867 |
| Liabilities and stockholders’ equity: Liabilities and equity | | | | | | | | | | | | |
| Deposits by customers | | 47,970,277 | | 157,205,312 | | 142,128,471 | | 131,959,215 | | 124,624,011 | | 121,802,028 |
| Borrowings from other financial institutions | | 4,259,611 | | 13,959,343 | | 16,337,964 | | 13,822,152 | | 18,905,843 | | 19,721,184 |
| Debt instruments in issue | | 6,078,933 | | 19,921,515 | | 20,287,233 | | 19,648,714 | | 18,704,809 | | 19,435,865 |
| Lease liabilities(4) | | 558,897 | | 1,831,585 | | - | | - | | - | | - |
| Other liabilities(5) | | 4,383,316 | | 14,364,739 | | 14,667,589 | | 14,048,580 | | 11,549,401 | | 11,605,871 |
| Total equity | | 8,789,865 | | 28,805,619 | | 26,655,225 | | 24,429,550 | | 22,476,980 | | 20,407,919 |
| Total liabilities and equity | USD | 72,040,899 | COP | 236,088,113 | COP | 220,076,482 | COP | 203,908,211 | COP | 196,261,044 | COP | 192,972,867 |
| (1) | Translated for convenience only using the representative market rate as computed and certified by the Superintendency of Finance of COP 3,277.14 per U.S. 1.00 on December 31, 2019. |
| (2) | IFRS 9 (2014) set significant changes in the assessment of the impairment of the value of financial instruments and therefore their associated risk, going from an incurred loss model to one of expected credit loss. As of December 31, 2019 and 2018, the Bank recognized credit impairment charges based on IFRS 9 model. The allowances for the years ended December 31, 2017, 2016, and 2015 were computed under IAS 39. Accordingly, those amounts are not comparable to the amount as of December 31, 2018 and 2019. |
| (3) | The Bank previously classified land and buildings that were acquired through foreclosure of loans with net carrying amount of 189,296 as of December 31, 2015 in premises and equipment. As of December 31, 2016, and 2015, such assets were reclassified to other assets as they are intended for immediate sale or disposition. |
| (4) | As of January 1, 2019 the Bank adopted IFRS 16 using the modified retrospective adoption method, in which the right-of-use assets are measured as if IFRS 16 had always been applied, using the lessee’s incremental borrowing rate known at the date of transition. See Note 7 to the Consolidated Financial Statements, Leases. |
| (5) | Includes interbank deposits, repurchase agreements and other similar secured borrowing, liabilities relating to assets held for sale, derivative financial instruments, preferred shares, current tax, deferred tax, net, employees benefit plans and other liabilities See consolidated statement of financial position to the Consolidated Financial Statements. |
See ― “Item 8. Financial Information – A. Consolidated Financial Statements and Other Financial Information –A.3. Dividend Policy”, for information about the dividends declared per share in both pesos and U.S. dollars during the fiscal years ended December 31, 2019, 2018, 2017, 2016 and 2015.
SELECTED RATIOS
| | | As of and for the year ended December 31, | |
| | | 2019 | | | 2018 | | | 2017 | | | 2016 | | | 2015 | |
| | | Percentages, except for operating data | |
| SELECTED RATIOS:(1) | | | | | | | | | | | | | | | | | | | | |
| Profitability ratios: | | | | | | | | | | | | | | | | | | | | |
| Net interest and valuation margin from continuing operations(2) | | | 5.67 | | | | 5.80 | | | | 6.08 | | | | 5.96 | | | | 5.25 | |
| Return on average total assets from continuing operations(3) | | | 1.35 | | | | 1.28 | | | | 1.30 | | | | 1.49 | | | | 1.53 | |
| Return on average stockholders‘ equity attributable to the owners of the parent company(4) | | | 12.09 | | | | 11.50 | | | | 11.99 | | | | 14.52 | | | | 13.62 | |
| Efficiency ratio: | | | | | | | | | | | | | | | | | | | | |
| Operating expenses to net operating income from continuing operations | | | 51.13 | | | | 50.08 | | | | 49.22 | | | | 51.02 | | | | 54.57 | |
| Operating expenses to average total assets from continuing operations | | | 3.57 | | | | 3.62 | | | | 3.60 | | | | 3.64 | | | | 3.62 | |
| Operating expenses to productive assets from continuing operations | | | 4.18 | | | | 4.16 | | | | 4.20 | | | | 4.29 | | | | 4.28 | |
| Capital ratios: | | | | | | | | | | | | | | | | | | | | |
| Technical capital to risk weighted assets(5)(6) | | | 12.82 | | | | 13.47 | | | | 14.18 | | | | 13.26 | | | | 12.46 | |
| Credit quality data: | | | | | | | | | | | | | | | | | | | | |
| Past due loans to loans principal(7) | | | 4.27 | | | | 4.33 | | | | 4.49 | | | | 3.31 | | | | 2.98 | |
| Allowances for loan and lease losses to past due loans principal | | | 133.94 | | | | 128.21 | | | | 107.52 | | | | 125.90 | | | | 115.16 | |
| Allowance for loan and lease losses as a percentage of total loans principal | | | 5.71 | | | | 5.55 | | | | 4.83 | | | | 4.17 | | | | 3.43 | |
| Operational data (in units): | | | | | | | | | | | | | | | | | | | | |
| Number of branches(8) | | | 1,083 | | | | 1,113 | | | | 1,153 | | | | 1,247 | | | | 1,274 | |
| Number of employees(9) | | | 31,075 | | | | 31,040 | | | | 31,061 | | | | 34,567 | | | | 34,392 | |
| (1) | Average balances used to calculate the ratios have been calculated as follows: for eah year presented, for each month, the actual month-end balances were established. The average consolidated balance for such periods is the average of such month-end balances. These averages are calculated using 13 month-end balances. |
| (2) | Net interest and valuation on financial instruments income divided by average interest-earning assets. |
| (3) | Net income attributable to equity holders of the Parent Company divided by average total assets. |
| (4) | Net income attributable to equity holders of the Parent Company divided by average stockholders’ equity attributable to the owners of the parent company. |
| (5) | For an explanation of risk-weighted assets and Technical Capital, see Item 4. “Information on the Company – B. Business Overview – B.8 –Supervision and Regulation” and Item 5 “Operating and Financial Review and Prospects - B. Liquidity and Capital Resources – B.1. Liquidity and Funding - Capital Adequacy". |
| (6) | The Bank’s consolidated capital adequacy was computed considering balance accounts under IFRS for each year presented. |
| (7) | Loans that are past due more than 30 days to loans principal. |
| (8) | Number of branches includes branches of the Bank’s Subsidiaries. For some subsidiaries, the central office is considered a branch. Representative offices are included. |
| (9) | The number of employees includes employees of the Bank’s consolidated Subsidiaries. For the year 2015 Compañía de Financiamiento Tuya S.A had 3,020 employees. For the years 2016, 2017, 2018 and 2019, Tuya S.A. Compañía de Financiamiento is classified as an investment in a joint venture in the Bank’s consolidated financial statements. |
Exchange Rates
On March 31, 2020, the Representative Market Rate was COP 4,054.54 per USD 1.00. The Federal Reserve Bank of New York does not report a rate for pesos; the SFC calculates the Representative Market Rate based on the weighted average of the buy/sell foreign exchange rates quoted daily by certain financial institutions, including Bancolombia, for the purchase and sale of U.S. dollars.
The following table sets forth the low and high peso per U.S. dollar exchange rates and the peso/U.S. dollar representative market rate on the last day of the month, for each of the last six months:
| Recent exchange rates of pesos per U.S. dollars |
| Month | Low | High | Period-End |
| March 2020 | 3,455.56 | 4,153.91 | 4,054.54 |
| February 2020 | 3,355.44 | 3,539.86 | 3,539.86 |
| January 2020 | 3,253.89 | 3,423.24 | 3,423.24 |
| December 2019 | 3,277.14 | 3,508.39 | 3,277.14 |
| November 2019 | 3,318.47 | 3,522.48 | 3,522.48 |
| October 2019 | 3,380.90 | 3,497.34 | 3,383.29 |
The following table sets forth the peso/U.S. dollar representative market rate on the last day of the year and the average peso/U.S. dollar representative market rate (calculated by using the average of the Representative Market Rates on the last day of each month during the year) for each of the five most recent financial years.
| Representative Market Rate |
| Period | Period-End | Average |
| | Peso/USD 1.00 | |
| 2019 | 3,277.14 | 3,297.01 |
| 2018 | 3,249.75 | 2,977.54 |
| 2017 | 2,984.00 | 2,963.13 |
| 2016 | 3,000.71 | 3,039.23 |
| 2015 | 3,149.47 | 2,773.43 |
| B. | CAPITALIZATION AND INDEBTEDNESS |
Not applicable.
| C. | REASONS FOR THE OFFER AND USE OF PROCEEDS |
Not applicable.
Investors should consider the following risks and uncertainties, and the other factors presented in this Annual Report. In addition, the information referred to below, as well as all other information presented in this Annual Report, should be considered by investors when reviewing any forward-looking statements contained in this Annual Report, in any document incorporated by reference in this Annual Report, in any of the Bank’s future public filings or press releases, or in any future oral statements made by the Bank or any of its officers or other persons acting on its behalf. If any of the following risks occur, the Bank’s business, results of operations and financial condition, its ability to raise capital and its ability to access funding could be materially and adversely affected. These risk factors should not be considered a complete list of potential risks that may affect Bancolombia.
Risk Factors Relating to Colombia and Other Countries Where the Bank Operates.
The ongoing pandemic may adversely affect the Bank´s business and financial results.
The ongoing COVID-19 pandemic may impact our ability to provide services in the ordinary manner due to precautions and health and safety measures instated to avoid the expansion of illnesses. These measures, as well as others implemented by governmental authorities, may have a negative effect on our business operations and financial condition. For more information see “Item 4. Information on the Company – B. Business Overview – B.10. Covid-19 Considerations”.
We implemented procedures to allow most of our staff to work remotely in the geographies were the Bank operates. These procedures may result in incremental security, cybersecurity and operational risks, as well as increased periods of service unavailability. Although part of our physical branches remain open to the public, as required by law, the service hours, number of branches, and number of staff has been limited and, as a result, our customers will migrate from physical service channels to telephone or digital channels, which may lead to network congestions and result in longer customer waiting times.
COVID-19 may significantly impact macro-economic variables in the countries where we operate, which might adversely affect our results. Moreover, we are exposed to the performance of borrowers conducting business in many industries and commercial activities, some of which depend on the performance of the global economy, which will likely emerge in distress from these events.
The current situation associated to the spread of COVID-19 has caused worldwide business and trade disruption. As a result, the banking sector in general, including us, might have lower liquidity levels. In addition, further Expected Credit Losses (“ECLs”) could arise from other parts of our business impacted by the disruption to global supply chains, and through the impact that COVID-19 is having more broadly on economic growth globally. If any such events materialize, it could have a material adverse effect on our business, financial condition, results of operations and prospects.
The general uncertainty regarding the pandemic and other global events such as the performance of the oil prices, has resulted in high volatility on the markets and exchange rates, which has affected and may continue to affect our client’s investment portfolios and foreign exchange exposures, and result in a decrease of assets under management in our wealth management business and an in an increase in default rates. Furthermore, prolonged volatility may have a negative impact on the Bank´s proprietary trading business and on the valuation of our portfolio.
Additionally, our business depends upon, among other things, on the willingness and ability of our customers in multiple sectors of the economy to conduct banking and other financial transactions. These customers may experience a significant economic impact from these events which may result in a lower demand for loans, a decrease in savings and investments, and an inability to perform on their obligations under current loans.
The effects resulting from COVID-19 may have an adverse effect on our operations and, given the uncertainty around the extent and timing of the future spread of COVID-19 and the imposition or relaxation of, protective measures, as of the date of this annual report it is not possible to reasonably estimate at the time the impact to our results of operations, cash flows or financial condition. The risks related to COVID-19 and its impacts are being constantly monitored by our Senior Management and Board of Directors. For more information see “Item 4. Information on the Company - B. Business Overview – B.10. Covid-19 Considerations”.
Changes in economic and political conditions in Colombia, Panama, El Salvador and Guatemala or in other countries where the Bank operates may adversely affect the Bank’s financial condition and results of operations.
The Bank’s financial condition, results of operations and asset quality are significantly dependent on the macroeconomic and political conditions prevailing in Colombia, Panama, El Salvador, Guatemala and the other jurisdictions where the Bank operates. Accordingly, decreases in the growth rate, periods of negative growth, increases in inflation, changes in policy, or future judicial interpretations of policies involving exchange controls and other matters such as currency depreciation, inflation, interest rates, taxation, banking laws and regulations and other political or economic developments in such jurisdictions may affect the overall business environment and may in turn negatively affect the Bank’s financial condition and results of operations.
In particular, the governments of Colombia, Panama, El Salvador and Guatemala have historically exercised substantial influence on their economies, and they are likely to continue to implement policies that will have an important impact on the business and results of operations of the entities in such countries (including the Bank), market conditions and prices and rates of return on securities of local issuers (including the Bank’s securities). Potential changes in laws, public policies and regulations may cause instability and volatility in Colombia, Panama, El Salvador and Guatemala, and their respective markets. Future developments in government policies could negatively affect the Bank’s business and financial condition and the market value of its securities.
Colombia and Panama currently have investment grade credit ratings from international rating agencies, El Salvador and Guatemala do not. As of the date of this Annual Report, El Salvador has a long-term debt rating B- from Fitch, B3 from Moody’s, and B- by S&P. Guatemala has ratings of BB from Fitch, Ba1 from Moody’s and BB- S&P. Downgrades in the ratings of either country, or the failure of Colombia or Panama to maintain investment grade credit ratings, could increase the Bank’s funding costs and adversely affect our results of operation and financial condition.
The economies of the countries in which the Bank operates are vulnerable to external effects that could be caused by significant economic difficulties experienced by their major regional trading partners or by more general contagion effects, which could have a material adverse effect on economic growth in these countries and their ability to service their public debt.
A significant decline in economic growth or a sustained economic downturn of any of Colombia, Panama, El Salvador or Guatemala’s major trading partners (i.e., the European Union, the United States, China and other Latin American countries for Colombia and the United States and European Union for Panama, Guatemala and El Salvador) could have a material adverse impact on Colombia, Panama, El Salvador and Guatemala’s balance of trade and remittances inflows, resulting in lower economic growth.
Deterioration in the economic and political situation in neighbouring countries could adversely affect the economy and cause instability in Colombia, Panama, El Salvador and Guatemala by disrupting their diplomatic or commercial relationships with neighboring countries. Any future tensions may cause political and economic uncertainty, instability, market volatility, low confidence levels and higher risk aversion by investors and market participants that may negatively affect economic activity in any of those jurisdictions.
Events occurring in a market where we do not operate may cause international investors to have an increased risk perception of an entire region or class of investment, which could in turn negatively affect market prices and liquidity of securities issued or owned by the Bank.
Any additional taxes resulting from changes to tax regulations or the interpretation thereof in Colombia, Panama, El Salvador, Guatemala or other countries in where the Bank operates, could adversely affect the Bank’s consolidated results.
Uncertainty relating to tax legislation poses a constant risk to us. Changes in legislation, regulation and jurisprudence can affect tax burdens by increasing tax rates and fees, creating new taxes, limiting deductions and exemptions, and eliminating incentives and non-taxed income. Notably, the Colombian and Salvadorian governments have significant fiscal deficits that may result in future tax increases. Moreover, in Colombia, the tax reform of 2018 resulted in a tax burden that is higher on the banking industry than on other taxpayers and, therefore, we can give no assurance that additional differential treatment will not be imposed in the future. On October 16, 2019, the Colombian Constitutional Court declared the tax reform of 2018 unconstitutional with effect as of January 1, 2020. Consequently, on October 22, 2019, the Colombian government presented to Congress a new tax reform bill to replace the 2018 reform which was signed into law on December 27, 2019. The new tax reform is similar to the 2018 tax reform (except for issues that were challenged in 2019) but does increase the surcharge for financial entities in 4%, from 33% to 37% in 2020. The surcharge for years 2021 and 2022 remains at 3% as initially intended in the 2018 tax reform. Higher taxes such as the surcharge could negatively affect our results of operations and cash flow. In addition, national or local taxing authorities may not interpret tax regulations in the same way as we do, even though the Bank does not normally adopt aggressive positions on tax law interpretation. Differing interpretations could result in future tax litigation and associated costs.
Exchange rate fluctuations may adversely affect the Colombian economy, the market price of the Bank’s ADSs, and the dividends payable to holders of the Bank’s ADSs.
Colombia has adopted a floating exchange rate system. The Central Bank maintains the power to intervene in the exchange market in order to consolidate or dispose of international reserves, and to control any volatility in the exchange rate. From time to time, including during 2019, there have been significant fluctuations in the exchange rate between the Colombian peso and the U.S. dollar. Unforeseen events in the international markets, fluctuations in interest rates, volatility of the oil price in the international markets, or changes in capital flows, may cause exchange rate instability that could generate sharp movements in the value of the peso. Because a portion of our assets and liabilities are denominated in, or indexed to, foreign currencies, especially the U.S. dollar, sharp movements in exchange rates may negatively impact our results. In addition, exchange rate fluctuations may adversely impact the value of dividends paid to holders of our ADSs as well as the market price and liquidity of ADSs.
Colombia has experienced several periods of violence and instability that could affect the economy and the Bank.
Colombia has experienced periods of criminal violence over the past four decades, primarily due to the activities of guerilla groups and drug cartels. Despite the peace treaty between the Colombian government and the Revolutionary Armed Forces of Colombia (“Fuerzas Armadas Revolucionarias de Colombia orFARC”), a lasting decrease in violence or drug-related crime in Colombia or the successful integration of former guerilla members into Colombian society, may not be achieved. In 2018, the Colombian government suspended the peace negotiations with the National Liberation Army (“Ejército de Liberación Nacional”or “ELN”) and in 2019, a minority group of dissidents within FARC announced their return to illegal activities. An escalation of violence or drug-related crime may have a negative impact on the Colombian economy and on us.
Allegations of corruption against the government, politicians and private industry in the countries where we operate could create economic and political uncertainty and could expose us to additional credit risk.
Allegations of corruption against the Colombian government, politicians and private industry in the countries where we operate could create economic and political uncertainty specially, if the investigations triggered by these cases reach conviction or result in further allegations or findings of illicit conduct committed by the accused parties. Furthermore, proven or alleged wrongdoings could have adverse effects on the political and economic stability in such countries. These adverse political and economic effects may negatively impact our business, including by depressing business volumes, reducing our ability to recover amounts we have loaned to persons or projects involved in illicit or allegedly illicit conduct and/or harming our reputation.
Risk Factors relating to the Bank’s Business and the Banking Industry
Our financial results may be negatively affected by changes to accounting standards.
We report our results and financial position in accordance with IFRS as issued by the IASB. Changes to IFRS or interpretations thereof may cause our future reported results and financial position to differ from current expectations. Such changes may also affect our regulatory capital and financial ratios. We monitor potential accounting changes and when possible, we determine their potential impact and disclose significant future changes in our financial statements that we expect as a result of those changes. Currently, there are not a number of issued but not yet effective IFRS changes, that could be expected to impact our reported results, financial position and regulatory capital in the next several years. For further information about developments in financial accounting and reporting standards, see Note 2 to the Consolidated Financial Statements, “Significant Accounting Policies”.
Our financial results may be negatively affected by changes to assumptions supporting the value of our goodwill.
We test the goodwill that we have recognized on the respective financial position of our operating segments for impairment at least annually. Our impairment test in respect of the assets recognized as of December 31, 2019 indicated that our respective goodwill balances are not impaired. The impairment test requires that we make assumptions regarding estimated earnings, discount rates and long-term growth rates impacting the recoverable amount of the goodwill associated with each operating segment and on estimates of the carrying amounts of the operating segments to which the goodwill relates. If the actual results in future periods deviate from the earnings and other assumptions on which our impairment testing is based, the value of the goodwill in any one or more of our businesses may become impaired in the future, resulting in charges to income.
Changes in banking laws and regulations in Colombia and in other jurisdictions in which the Bank operates could adversely affect the Bank’s consolidated results.
Banking laws and regulations, or their official interpretation, in Colombia and in other jurisdictions in which the Bank operates, have a material effect on the Bank’s business and operations. Banking laws and regulations may change frequently, and changes may be adopted, enforced or interpreted in a manner that may have an adverse effect on the Bank’s business.
Moreover, regulators in the jurisdictions in which Bancolombia operates may alter the current regulatory capital requirements to which Bancolombia is subject and thereby require equity increases that could dilute existing stockholders, lead to required asset sales or adversely impact the return on stockholders’ equity and/or the market price of the Bank’s common and preferred shares.
Furthermore, banking laws and regulations may create new types of financial entities whose services could compete with the segments or services offered by the Bank. Increased competition could lead to lower margins for affected products and services and could adversely affect the Bank’s results of operations.
The Bank is subject to regulatory inspections, examinations, inquiries or audits in Colombia and in other countries where it operates, and any sanctions, fines and other penalties resulting from such inspections, examinations, inquiries or audits could materially and adversely affect the Bank’s business, financial condition, results of operations and reputation.
The Bank is subject to comprehensive regulation and supervision by the banking authorities of Colombia, Panama, El Salvador, Guatemala and the other jurisdictions in which the Bank operates or is an issuer. These Banking authorities have broad powers to adopt regulations and impose other requirements affecting or restricting virtually all aspects of the Bank’s capitalization, organization and operations, including the imposition of anti-money laundering measures and the authority to regulate the terms and conditions on which the banks can extend credit. In the event of non-compliance with applicable regulations, the Bank could be subject to fines, sanctions or the revocation of licenses or permits to operate its business. In Colombia, for instance, if the Bank encounters significant financial problems or becomes insolvent or in danger of becoming insolvent, banking authorities would have the power to take over the Bank’s management and operations. Any sanctions, fines and other penalties resulting from non-compliance with regulations in Colombia, El Salvador, Guatemala, Panama and other jurisdictions in which the Bank operates could materially and adversely affect the Bank’s business, financial condition, results of operations and reputation.
An increase in constitutional public interest actions (acciones populares) or class actions (acciones de grupo) may affect the Bank’s businesses and results of operations.
Under the Colombian constitution, individuals may initiate constitutional public interest or class actions to protect their collective or class rights, respectively. Colombian financial institutions, including the Bank, have experienced a high number of these actions. The great majority of such actions have been related to fees, financial services and interest rates, and their outcome is uncertain. Pursuant to Law 1425 of 2010, monetary awards for plaintiffs in constitutional actions or class actions were eliminated as of January 1, 2011. Nevertheless, individuals continue to have the right to initiate these actions against the Bank.
Future restrictions on interest rates or banking fees could negatively affect the Bank’s profitability.
In prior years, the Colombian congress has considered various regulatory initiatives regarding banking fees. For instance, on December 27, 2019, Congress approved a new regulation which forces financial institutions to offer certain transactions or services such as national wire-transfers and certain withdrawls or deposits free of charge for clients who have either a savings account, a debit card or a credit card with the financial institution. Although the majority of such initiatives have not been adopted in the past, there might be new initiatives to impose restrictions on banking fees in the future. If we are prohibited or otherwise limited (including by limits with respect to pricing) from continuing to charge our clients for certain products or services, including specified types of transactions, or from imposing charges for products or services that might be introduced in the future, our results of operations and financial condition could be adversely affected.
Colombian tax haven regulation could adversely affect the Bank’s business and financial results.
Decree 1966 of 2014, as modified by Decree 2095 of 2014, and Decree 1625 of 2016 designates 37 jurisdictions as tax havens for Colombian tax purposes although neither Panama nor other countries in which the Bank operates, were included on this list. As a result of the tax haven regulation the Bank’s clients who are residents in such jurisdictions would be subject to (i) higher withholding tax rates including a higher withholding rate on interest and dividends derived from investments in the Colombian securities market, (ii) the transfer pricing regime and its reporting duties, (iii) enhanced ability on the part of Colombian authorities to qualify a conduct as abusive under tax regulations, (iv) non-deductibility of payments made to such residents or entities located in tax havens, unless the required tax amount has been withheld and (v) additional information disclosure requirements, any of which could have a negative impact on Bancolombia’s business and financial results.
In order to avoid Panama’s designation as a tax haven by Colombia, Colombia and Panama signed a memorandum of understanding which states that both countries will negotiate a treaty for the avoidance of double taxation. This treaty is expected to include provisions regarding the exchange of information between Colombian and Panamanian tax authorities. Any failure by Colombia and Panama to enter into such a Treaty, or the designation of Panama as a tax haven by Colombia, could result in a negative impact on the Bank’s customer base and, therefore, a potential negative impact on the Bank’s results of operations and financial condition. On April 28, 2016, the Colombian Ministry of Finance and Public Credit announced the successful conclusion of the negotiations between Colombia and Panama, but as of the date of this Annual Report no treaty has been entered into.
Further, even though, Panama adhered to the Convention on Mutual Administrative Assistance in Tax Matters of the Organization for Economic Cooperation and Development (“OECD”) in 2017, on February 18, 2020, the European Union finance ministers added Panama to its list of non-cooperative jurisdictions for tax purposes for allegedly having shortcomings over exchange of tax information on request based on the OECD’s Global Forum on Transparency and Exchange of Information for Tax Purposes (“Global Forum”) report published in November 2019. We cannot assure whether such decision will have any effect on the designation that Colombia may make as to Panama in the future.
The Bank and most of its Subsidiaries are subject to the U.S. Foreign Account Tax Compliance Act of 2010 and the OECD’s Automatic Exchange of Information - Common Reporting Standard (CRS).
Bancolombia and most of its subsidiaries are considered foreign financial institutions (“FFIs”) under the Foreign Account Tax Compliance Act of 2010 (“FATCA”) (see “Item 4. Information on the Company – B. Business Overview – B.8. Supervision and Regulation – International regulations applicable to Bancolombia and its subsidiaries”). Additionally, Bancolombia and some of its subsidiaries are subject to the reporting obligations derived from the conventions that implement the Common Reporting Standard (“CRS”) approved by the OECD.
Given the size and the scope of the Bank’s international operations, we have taken measures and implemented procedures aimed at complying with FATCA and CRS, including transmitting to the relevant authorities the reports required under FATCA and CRS.
However, if the Bank cannot satisfy the requirements thereunder, certain payments to Bancolombia, or its Subsidiaries, may be subject to withholding under FATCA or other penalties imposed by each government. The possibility of such withholding or penalties and the need for accountholders and investors to provide certain information may discourage some customers or potential customers from banking with us, thereby adversely affecting our results of operations and financial condition. In addition, compliance with the terms of the intergovernmental agreements (“IGA”), particular agreements entered into with the IRS, the international conventions signed for the exchange of information under CRS, the laws or any other regulations enforced in the relevant jurisdictions may increase our compliance costs. Legislation and regulations implementing FATCA and CRS in some of the countries in which the Bank operates remain under development, and the reporting dates vary depending on the jurisdiction.
The Bank is exposed to increased costs and damages in the event of failure of its services providers to perform their obligations under key services contracts
The Bank enters into contracts with third parties who provide certain key services that are essential to its business. These services include online banking platforms, data processing and payment services, clearing and settlement services, software for processing credit and debit card services, and technological infrastructure, among others. The Bank faces the risk of operational disruption, failure or capacity constraints due to its dependency on such third-party vendors for certain components of its systems.
While the Bank conducts due diligence prior to engaging with third party service providers and performs ongoing monitoring of vendor controls, it does not control their operations. If any of our key service providers fails to fulfill any of their contractual obligations or cause disruptions in services (including as a result of a cyberattack, other information security event or a natural or health disaster (such as COVID-19 or other epidemics), failure to handle current or higher volumes, poor performance of services and failure to comply with applicable laws and regulations), the Bank’s ability to conduct its businesses could be adversely affected and could also negatively impact its results of operations and financial position. In addition, the Bank may be required to incur significant additional costs to find replacement providers. Furthermore, the unavailability of the services provided by some technology vendors could result in the unavailability of certain channels through which our clients execute transactions with us until a replacement provider is engaged, which could result in lost revenue, additional costs and, potentially, adverse regulatory consequences and reputational harm.
The Bank has a robust vendor selection process designed to ensure that the service providers appointed are among the most experienced and qualified available in the market. The Bank also, generally requires that service providers have contingency plans, which must be regularly updated to anticipate, identify, and mitigate these potential risks. In addition, in most cases, when contracting a critical service provider, in accordance with applicable regulation, the Bank seeks to include contractual provisions related to SLAs (service level agreements), penalty clauses and insurances to deter the service providers from failing to comply with their contractual obligations.
Notwithstanding the measures described above, the Bank may not be able to prevent all significant negative consequences in case of a material failure of its key service providers.
The Bank is subject to credit risk and estimating exposure to credit risk involves subjective and complex judgments.
A number of our products expose the Bank to credit risk. These products include loans, financial leases, guarantees and lending commitments.
The Bank estimates and establishes reserves for credit risk and potential credit losses. This process involves subjective and complex judgments, including projections of economic conditions and assumptions about the ability of our borrowers to repay their loans. This process is also subject to human error as the Bank’s employees may not always be able to assign an accurate credit risk rating to a client, which may result in the Bank’s exposure to a higher credit risk than one indicated by the Bank’s risk rating system. The Bank may not be able to timely detect these risks before they occur, or due to limited resources or available infrastructure, the Bank’s employees may not be able to effectively implement its credit risk management system, which may increase the Bank’s exposure to credit risk. Moreover, the Bank’s failure to continuously refine its credit risk management system may result in a higher risk exposure for the Bank, which could materially and adversely affect its results of operations and financial position.
Overall, if the Bank is unable to effectively control the level of non-performing or poor credit quality loans in the future, or if its loan loss reserves are insufficient to cover future loan losses, the Bank’s financial condition and results of operations may be materially and adversely affected.
The amount of the Bank’s non-performing loans may increase in the future as a result of factors beyond the Bank’s control, such as changes in the income levels of the Bank’s borrowers, increases in the inflation rate or an increase in interest rates, the impact of macroeconomic trends and political events affecting Colombia and other jurisdictions in which the Bank operates or has exposure (especially Panama, El Salvador and Guatemala) or events affecting specific industries. Any of these developments could have a negative effect on the quality of the Bank’s loan portfolio, requiring the Bank to increase provisions for loan losses and resulting in reduced profits or in losses.
Also, the Bank may suffer unexpected losses if the expected credit loss (ECL) model, used to estimate reserves to products expose to credit risk, becomes less predictive as a result of significant and unexpected changes in the assumptions and scenarios used in the model such as those caused by the outbreak of COVID-19 or other similar diseases which could impact the financial assets’ future cash flow, reduce their recoverable amount and increase the provisions for credit losses.
The Bank is subject to credit risk with respect to its non-traditional banking businesses including investing in securities and entering into derivatives transactions.
Non-traditional sources of credit risk can arise from, among other things: investing in securities, entering into derivative contracts under which counterparties have obligations to make payments to the Bank, and executing securities, futures, currency or commodity trades from the Bank’s proprietary trading desk that fail to settle at the required time due to non-delivery by the counterparty or systems failure by clearing agents, exchanges, clearing houses or other financial intermediaries. Any significant increases in exposure to any of these non-traditional risks, or a significant decline in the credit quality or the insolvency of any of the counterparties, could materially and adversely affect the Bank’s results of operations and financial position.
The Bank is exposed to risks associated with the mortgage loan market.
The Bank is a relevant player in the mortgage loan markets in which it operates. Colombia’s mortgage loan market is highly regulated and has historically been affected by macroeconomic factors, as have the mortgage loan markets of Panama, Guatemala and El Salvador. Although interest rates have been stable, periods of sustained high interest rates have historically discouraged customers from borrowing and have resulted in increased defaults in outstanding loans and deterioration in the quality of assets.
The Bank is subject to concentration of default risks in its loan portfolio. Problems with one or more of its largest borrowers may adversely affect its financial condition and results of operations.
As of December 31, 2019, the aggregate outstanding principal amount of the Bank’s 25 largest credit exposures, on a consolidated basis, represented 7.33% of the Bank’s loan portfolio. No single exposure represented more than 2% of the loan book and all of those loans were corporate loans. Problems with one or more of the Bank’s largest borrowers could materially and adversely affect its results of operations and financial position, see “Item 4. Information on the Company – E. Selected Statistical Information – E.3. Loan Portfolio – Borrowing Relationships”.
The value of the collateral securing the outstanding principal and interest balance of the Bank’s loans may not be sufficient to cover such outstanding principal and interest. In addition, the Bank may be unable to realize the full value of the collateral or guarantees securing the outstanding principal and interest balance of its loans.
The Bank’s loan collateral primarily includes real estate, assets pledged in financial leasing transactions and other assets that are located primarily in Colombia, El Salvador, Panama and Guatemala, the value of which may significantly fluctuate or decline due to factors beyond the Bank’s control. Such factors include market factors, environmental risks, macroeconomic factors and political events affecting the local economy. In addition, the Bank may face difficulties in enforcing its rights as a secured creditor. Timing delays, procedural problems enforcing collateral and local protectionism may make foreclosures on collateral and enforcement of judgments difficult. Any decline in the value of the collateral securing the Bank’s loans may result in a reduction in the recovery from collateral realization and may have an adverse impact on the Bank’s results of operations and financial condition.
The Bank is subject to market risk.
The Bank is directly and indirectly affected by changes in market conditions. Market risk, or the risk of losses in positions arising from movements in market prices, is inherent in the products and instruments associated with our operations, including loans, deposits, securities, bonds, long-term debt, short-term borrowings, proprietary trading in assets and liabilities and derivatives. Changes in market conditions that may affect our financial condition and results of operations include fluctuations in interest and currency exchange rates, securities prices and changes in the implied volatility of interest rates and foreign currency exchange rates, among others.
The Bank’s results of operations are sensitive to fluctuations in interest rates.
The Bank holds a substantial portfolio of loans and debt instruments that have both fixed and floating interest rates. Therefore, changes in interest rates could adversely affect our net interest margins as well as the value of the debt instruments. Increases in interest rates may reduce the market value of the Bank’s debt instruments, leading to smaller gains or larger losses on these investments. Sustained high interest rates have historically discouraged customers from borrowing and have resulted in increased delinquencies in outstanding loans and deterioration in the quality of assets. On the other hand, decreases in interest rates may cause margin compression and lower net interest income as the Bank usually maintains more assets than liabilities at variable rates. Decreasing interest rates also may trigger loan prepayments which could negatively affect the Bank’s net interest income. Generally, in a declining interest rate environment, prepayment activity increases, reducing the weighted average maturity of the Bank’s interest earning assets and adversely affecting its operating results. Prepayment risk also has a significant adverse impact on the Bank’s earnings from its credit card and collateralized mortgage obligations, since prepayments could shorten the weighted average life of these portfolios, which may result in a mismatch in funding or in reinvestment of the prepayment proceeds at lower yields. In addition, these risks could significantly impact the Bank’s portfolio as well as portfolios managed by the Bank and owned by third parties. To the extent we experience withdrawals of third-party assets, our asset management revenues and related income will be adversely affected.
The Bank’s income from its proprietary trading activities is highly volatile.
The Bank derives a portion of its profits from its proprietary trading activities. Income from this activity is highly volatile and depends on numerous factors beyond the Bank’s control, such as the general market environment, overall market trading activity, interest rate levels, fluctuations in exchange rates and general market volatility. A significant decline in the Bank’s trading income, or the incurrence of a trading loss, could adversely affect the Bank’s results of operations and financial position.
The Bank has significant exposure to sovereign risk, and especially Colombian risk, and the Bank’s results could be adversely affected by decreases in the value of its sovereign debt instruments.
The Bank’s debt instruments portfolio is primarily composed of sovereign debt instruments. Therefore, the Bank’s results are exposed to credit, market, and liquidity risk associated with sovereign debt, in particular risk associated with securities issued or guaranteed by the Colombian Government. As of December 31, 2019, the Bank’s total debt instruments represented 6.61% of its total assets, and 37.07% of these securities were issued or guaranteed by the Colombian Government. A significant decline in the value of the securities issued or guaranteed by the Colombian Government could adversely affect the Bank’s debt instruments portfolio and consequently the Bank’s results of operations and financial position.
The Bank is subject to market, liquidity, operational and structural risks associated with its derivative transactions.
The Bank enters into derivative transactions for hedging purposes on its own account and on behalf of its customers. The Bank is subject to market, liquidity (due to difficult to close out a trade prior to maturity or if bid-ask spreads are so large, representing a significant cost) and operational risk associated with these transactions, including basis risk (the risk of loss associated with variations in the spread between the asset yield and the funding and/or hedge cost) and credit or default risk (the risk of insolvency or other inability of the counterparty to a particular transaction to perform its obligations thereunder). In addition, the market practice and documentation for derivative transactions is less developed in the jurisdictions in which the Bank operates as compared to other more economically developed countries, and the court systems in such jurisdictions have limited experience in dealing with issues related to derivative transactions. As a result, there are increased operating and structural risks associated with derivatives transactions in these jurisdictions.
In addition, the execution and performance of derivatives transactions depend on the Bank’s ability to develop adequate control and administrative systems, and to hire and retain qualified personnel. Moreover, the Bank’s ability to adequately monitor, analyze and report these derivative transactions depends, to a great extent, on its information technology systems. These factors may further increase the risks associated with these transactions and could materially and adversely affect the Bank’s results of operations and financial position.
The Bank is subject to operational risks and losses.
The Bank’s businesses are dependent on the ability to process a large number of transactions efficiently and accurately. Operational risks and losses can result from fraud, employee errors, technological failures and failure to properly document transactions or to obtain proper internal authorization, failure to comply with regulatory requirements, breaches of conduct of business rules, equipment failures, natural disasters or the failure of external systems. The Bank has adopted procedures to prevent and manage each of the operational risks, but there can be no assurance that our procedures will be sufficient to prevent losses resulting from these risks.
In addition, the Bank’s businesses are exposed to risk from potential non-compliance with policies, employee misconduct or negligence and fraud, which could result in regulatory sanctions and serious reputational or financial harm. In recent years, a number of financial institutions have suffered material losses due to the actions of employees and third parties. The precautions the Bank takes to prevent and detect employee and third-party misconduct may not always be effective.
The Bank’s businesses rely heavily on data collection, processing and storage systems, the failure of which could materially and adversely affect the effectiveness of its risk management, reputation and internal control system as well as its financial condition and results of operations.
All of the Bank’s principal businesses are highly dependent on the ability to timely collect and process a large amount of financial and other information at its various branches across numerous markets, at a time when transaction processes have become increasingly complex with increasing volume. The proper functioning of financial control, accounting or other data collection and processing systems is critical to the Bank’s businesses and to its ability to compete effectively.
A partial or complete failure of any of these primary systems could materially and adversely affect the Bank’s decision-making process, its risk management and internal control systems, the quality of its service, and the Bank’s ability to respond on a timely basis to changing market conditions. If the Bank cannot maintain an effective data collection and management system, its business operations, financial condition, reputation and results of operations could be materially and adversely affected.
The Bank is also dependent on information systems to operate its website, process transactions, respond to customer inquiries on a timely basis and maintain cost-efficient operations. The Bank may experience operational problems with its information systems as a result of system failures, viruses, computer hackers or other causes. Any material disruption or slowdown of its systems could cause information, including data related to customer requests and other client information, to be lost, compromised, or to be delivered to the Bank’s clients with delays or errors, which could reduce demand for the Bank’s services and products, resulting in additional costs for the Bank and potentially fines and penalties by regulators which could materially and adversely affect the Bank’s results of operations and financial position. To guarantee service continuity, the Bank plans and implements exercises related to business continuity and disaster recovery as well as cybersecurity risks and vulnerabilities´ management, according to internal and external control areas requirements. There can be no assurance that these measures will successfully eliminate or substantially mitigate the risk associated with failure of our data collection, processing and storage systems.
The Bank is subject to cyber-security risk.
The Bank offers to customers the possibility to conduct their financial operations through virtual channels and internet services. We rely heavily on information technology systems to store, transmit, and process confidential information of our customers, and therefore are main targets of cyber threats that may carry out fraud, information leakage and interruption of the services on critical information assets, which could result in financial losses, regulatory penalties or negatively affecting the reputation of the Bank.
The Bank has alliances and business relationships that also store, transmit and process our confidential information and that of our customers and the organization itself, which constitutes an additional source of cybersecurity and technology operational risks. While the Bank performs actions to mitigate risks associated with these third party relationships such as risk assessments, definition and implementation of action plans, periodic control visits, quality control over software developments, assessments of their control environment, and request for the implementation of information security standards and policies, cyber threats could cause events impacts as previously discussed.
The landscape of cyber-attacks is constantly evolving, and increasingly complex techniques and tools are used by those who perpetrate such attacks. As a result, the Bank invests a large amount of resources to constantly improve its protection measures and manage cybersecurity events in real time, with the intention of seeking a suitable control environment to protect the company against emerging cybersecurity risks. Regardless of such efforts, given, among other factors, the large area of existing attack vectors and the incremental exposure through third parties, it is possible that not all cyber threats can be anticipated.
The Bank has instituted cybersecurity policies, standards, processes and technology to identify and detect threats, protect the information, and respond and restore from cybersecurity events, allowing it to proactively manage and mitigate cybersecurity risks. Additionally, the Bank has implemented a model with three lines of defense, governed by a collaborative work including (i) a first line whose responsibility consists in defining the information security strategy and the preventive detection and isolation of advanced threats, (ii) a second one that establishes the risk management framework to provide timely information that supports upper management in their making decision process and (iii) a third one that supports regulatory compliance, the strengthening of good practices in information security and the independent supervision of the management carried out in the first two lines of defense. The main objective of this model is to have better response mechanisms against cybersecurity incidents, allowing customers and their information to be protected and therefore maintain their trust.
For further information see “ITEM 4. Information on the Company – B. Business Overview- B.9. Cybersecurity framework”.
Failures related to the Bank’s information technology infrastructure and management information systems could adversely affect the Bank’s competitiveness, reputation, financial condition and results of operations.
In the past the Bank faced technological failures which affected some of the Bank’s products and services. To mitigate potential failures, obsolescence risks, and prevent future threats, the Bank has implemented technological updates, controls and measures, such as enabling alternative channels to guarantee the clients’ uninterrupted access to our services.
The organization recognizes the importance of having a business continuity management system and accordingly gives high priority to the design of contingency plans to avoid service interruption risks.
The occurrence of natural disasters in the regions in which the Bank operates could impair its ability to conduct business effectively and could impact its results of operations.
The Bank is exposed to the risk of natural disasters such as earthquakes, volcanic eruptions, tropical storms, floods, wind and hurricanes in the regions where it operates. Although the Bank has implemented disaster recovery systems, in the event of a natural disaster, unanticipated problems could have a material adverse effect on the Bank’s ability to conduct business in the affected region, particularly if those problems affect its computer-based data processing, transmission, storage and retrieval systems and destroy valuable data.
In addition, if a significant number of the Bank’s employees and managers became unavailable due to a natural disaster, the Bank’s ability to effectively conduct business could be severely compromised. In addition, the Bank may face added credit risk if its clients that are located in the affected region are not able to make timely payment on outstanding loans or other obligations to the Bank. A natural disaster or multiple catastrophic events could have a material adverse effect on the Bank’s business and results of operations in the affected region.
The Bank’s ability to attract and retain specialized talent could impact some digital business objectives.
The current economic landscape requires workforces to exhibit new skills and attributes such as creativity, innovation and flexibility, which are necessary to adapt the Bank’s operations to constant technological advances, and to update the Bank’s digital business models and strategies to develop new products and services. To respond to these trends, many companies, including financial institutions as the Bank, are struggling to engage employees with specialized knowledge in a variety of technological information areas, including data science, quantitative resources, information security and other technical areas, in which it is becoming more difficult to acquire and retain staff on a cost-effective basis.
The Bank’s strategic objectives are linked to their human talent. Specifically, the development of new products, services and digital tools demands that its human talent specialized capabilities to carry out the relevant process, enabling to achieve competitive advantages with respect to its competitors.
While the Bank has implemented strategies to attract and retain experienced and skilled professionals, the lack of specialized workforce to fill positions that require this kind of knowledge in various areas could negatively affect the Bank’s ability to deal with future challenges, slow the digital business strategy execution, including development of new products and affect the Bank’s results of operations.
As a result of climate change and evolving consumer trends, the Bank may need to modify its value proposition and credit risk management.
Addressing climate change, and learning how certain industries accelerate such change, has become a mainstream discussion topic in the last decade and the focus of increasing attention by various environmental groups and governments in recent years. This focus has influenced, and will continue to influence, how societies approach this issue and has caused, and will likely continue to cause, changes in consumer consumption trends, with an expected shift to products and services offered by companies that offer environmentally sustainable business models.
Social and environmental activists are increasingly targeting different businesses, including financial services companies such as the Bank, with public criticism for their relationships with clients that are engaged in certain sensitive industries, including businesses whose products contribute are or are perceived to contribute to climate change, or whose activities negatively affect or are perceived to negatively affect the environment.
The reputational harm to clients that offer products or services or engage in activities that are perceived to be have harmful effects on the environment or to accelerate climate change may cause their businesses to deteriorate and could potentially reduce their creditworthiness and result in an increase in the Bank’s allowances for loan losses. In order to address this risk, the Bank may need to prioritize the funding of industries whose activities do not present these risks. The commercial, risk and sustainability teams of the Bank take active steps to mitigate these risks and to adapt the Bank’s lending and investment activities to align more closely with evolving concerns regarding climate change and the protection of the environment. However, any resulting shift in patterns of loan origination trend may cause a reduction in the Bank’s loan portfolio as the Bank makes the transition to greater funding to businesses with more sustainable business models. Conversely, if the Bank is unable to shift its loan origination activities in the manner described above, it may become a target of public criticism and suffer reputational harm which in turn may cause certain clients and customers to cease doing business with the Bank, impair the Bank’s ability to attract new clients or expand its relationship with existing ones.
Acquisitions and strategic alliances may not perform in accordance with expectations or may disrupt the Bank’s operations and adversely affect its profitability.
An element of the Bank’s business strategy is to identify and pursue growth-enhancing strategic opportunities. The Bank may base assessments of potential acquisitions and alliances on assumptions with respect to operations, profitability and other matters that may subsequently prove to be incorrect, and any future acquisitions, investments and alliances may not produce the anticipated synergies or perform in accordance with the Bank’s expectations which could adversely affect its operations and profitability. In particular, the Bank holds a minority financial investment in an infrastructure project located in Colombia through a private equity fund. In recent years, the main shareholder of the project and the concession company have faced negative press related to irregular practices. If any of these situations result in sanctions or convictions then the company in which the Bank indirectly holds a minority stake, which is the holder of a toll road concession, may suffer a reputational harm, which in turn may have an adverse impact on its results of operations and financial condition and the return on the Bank’s investment.
The Bank’s concentration in and reliance on short-term deposits may increase its funding costs.
The Bank’s principal source of funds is short-term deposits, which on a consolidated basis represented 75.80% of total liabilities at the end of 2019 compared to 73.60% at the end of 2018. Because the Bank relies primarily on short-term deposits for its funding, in the event of a sudden or unexpected shortage of funds in the banking systems and money markets in which the Bank operates, the Bank may not be able to maintain its current level of funding without incurring higher costs or selling assets at prices below their prevailing market value.
The Bank faces risks relating to compliance with regulatory compliance in general, and in particular with respect to laws relating to anti-competitive practices, consumer protection and protection of personal data.
The Bank is subject to laws and regulations related to anti-competitive practices, including the formation of cartels and the abuse of its dominant position. Violation of these laws and regulations may result in significant administrative sanctions imposed by the SIC.
The Bank has created a special unit responsible for overseeing and ensuring regulatory compliance in general and, in particular, compliance with regulations related to anti-competitive practices, personal data protection and consumer protection.
Moreover, to ensure compliance with regulations regarding the use and protection of personal data, the Bank is currently developing a comprehensive data protection program.
The Bank may not be able to prevent all risks associated with regulatory compliance or detect all instances of non-compliance with the regulations described above. Any failure by the Bank to detect and prevent the aforementioned practices in a timely manner could damage the Banks reputation and facing substantial fines and penalties which could adversely affect the Bank’s results of operations and financial position.
The Bank’s policies and procedures may not be able to detect money laundering, terrorism financing, corruption or other illegal or improper activities fully or on a timely basis.
The Bank is required to comply with applicable anti-money laundering, anti-terrorism and anti-corruption laws and regulations. These laws and regulations require the Bank, among other things, to adopt and enforce “know your customer” policies and procedures and to report suspicious and large transactions to the applicable authorities. While the Bank has adopted policies and procedures aimed at preventing and detecting the use of its banking network for money laundering and terrorism financing activities and by terrorists and terrorist-related organizations and individuals generally, as the methods used by criminals evolve and become increasingly sophisticated, such policies and procedures may not completely eliminate the risk that the Bank may be used by other parties to engage in money laundering, terrorism financing, corruption or other illegal or improper activities.
The Bank is subject to laws and regulations that prohibit corrupt payments to public officials, including the U.S. Foreign Corrupt Practices Act and Colombian regulations on transnational bribery. The Bank has anti-corruption procedures, which incorporates, among others, an anti-corruption policy, training, reporting channels, monitoring, internal investigations and sanctions. While this system is designed to prevent and detect corrupt behavior, it does not completely eliminate the risk that the Bank´s employees, providers, clients or agents may engage in corrupt practices.
If the Bank fails to fully comply with applicable laws and regulations, it may face fines, penalties or other liabilities including restrictions on its ability to conduct business. In addition, the Bank’s business and reputation could suffer if it is not able to prevent and detect money laundering, terrorism financing, corruption or other illegal practices.
The Bank is subject to increasing competition which may adversely affect its results of operations.
The Bank operates in a highly competitive environment and management expects competition to increase in the jurisdictions where the Bank operates. Intensified merger activity in the financial services industry has produced larger, better capitalized and more geographically diverse firms that are capable of offering a wider array of financial products and services at more competitive prices. Also, the emergence of new financial technologies, unregulated financial intermediaries (known as “shadow banking”) and the recent enactment of regulations aimed at enabling non-Colombian residents (other than individuals) to offer loans in COP, may increase competition for the Bank. The Bank’s ability to maintain its competitive position depends mainly on its ability to fulfill new customers’ needs through the development of new products and services, the Bank’s ability to offer adequate services and strengthen its customer base through cross-selling and the Bank’s ability to bring in and retain human talent. The Bank’s business will be adversely affected if the Bank is not able to maintain efficient service strategies. In addition, the Bank’s efforts to offer new services and products may not succeed if product or market opportunities develop more slowly than expected or if the profitability of opportunities is undermined by competitive pressures.
Downgrades in the credit ratings of the Bank and its subsidiaries would increase their cost of borrowing funds and make their ability to raise new funds, attract deposits or renew maturing debt more difficult.
The Bank’s and its subsidiaries’ credit ratings are an important component of the liquidity profile of each entity, and their ability to successfully compete depends on various factors, including their financial stability as reflected by their credit ratings. A downgrade in the credit ratings of the Bank or its subsidiaries would increase their cost of raising funds from other banks or in the capital markets. Purchases of the Bank’s or its subsidiaries’ securities by institutional investors could be reduced if they suffer a decline in their credit ratings. The ability of the Bank or its subsidiaries to renew maturing debt could become restricted and the terms for such renewal more expensive if their credit ratings were to decline. The Bank’s and its subsidiaries’ lenders and counterparties in derivative transactions are sensitive to the risk of a credit rating downgrade. A downgrade in the credit rating of the Bank or its subsidiaries may adversely affect perception of their financial stability and their ability to raise deposits, which could make each entity less successful when competing for deposits and loans in the marketplace.
The Central Bank may impose requirements on our (and other Colombian residents) ability to obtain loans in foreign currency.
The Central Bank may impose certain mandatory deposit requirements in connection with foreign currency denominated loans obtained by Colombian residents, including the Bank, although no such mandatory deposit requirement is currently in effect. We cannot predict or control future actions by the Central Bank in respect of deposit requirements, which may involve the establishment of a mandatory deposit percentage, and the use of such measures by the Central Bank may raise our cost of raising funds and reduce our financial flexibility.
Discontinuation of the London InterBank Offered Rate (“LIBOR”), and the regulation and implementation of a replacement benchmark rate could adversely affect our business, financial condition and result of operations.
In 2017, the U.K. Financial Conduct Authority announced that it would no longer persuade or require banks to submit rates for the calculation of the Libor benchmark after 2021. This announcement has resulted in uncertainty about the future of Libor which is used as interest rate benchmark. These actions and uncertainties may trigger future changes in the rules or methodologies used to calculate benchmarks or lead to the discontinuation or unavailability of benchmarks.
In order to address the discontinuation of LIBOR, a work team was organized within the Bank, which is implementing different initiatives to mitigate risks. This team is focused on (i) systems adaptation, (ii) analyzing and implementing appropriate "fallback language" and (iii) designing a strategy to approach clients. Addressing the discontinuation of LIBOR includes understanding and identifying the impacts on products, contracts, technological applications, areas and processes that could be affected, as well as the effects on customers and the calculation of possible exposure of companies in Colombia, Panama, El Salvador and Guatemala. This team is supervised by a steering committee and the Bank’s board of directors.
The Bank is exposed to assets and liabilities linked to the calculation of Libor. For more information, see Item 5 “Operating and Financial Review and Prospects – B. Liquidity and Capital Resources – B.1 Liquidity and Funding”.
Any failure by market participants, such as the Bank, and regulators to successfully introduce benchmark rates to replace Libor and implement effective transitional arrangements to address the discontinuation of Libor could result in disruption of the financial and capital markets. In addition, the transition process to an alternative reference rate could impact the Bank’s business, financial condition or result of operations, as a result of:
| ● | An adverse impact in pricing, liquidity, value, return and trading for a broad array of financial products, loans and derivatives that are included in the Bank’s financial assets and liabilities. |
| ● | Extensive changes to documentation that contain references to Libor or use formulas that depend on Libor. |
| ● | Disputes, litigation or other actions with counterparties regarding the interpretation and enforceability of provisions in Libor-based products such as fallback language or other related provisions. |
| ● | The transition and development of appropriate systems and analytics to effectively transition the Bank’s risk management processes from Libor-based products to those based on one or more alternative reference rates in a timely manner; and |
| ● | An increase in prepayments of Libor-linked loans by the Bank’s clients. |
Risks Relating to the Preferred Shares and the ADSs.
Preemptive rights may not be available to holders of American Depositary Receipts (“ADRs”) evidencing ADSs.
The Bank’s by-laws and Colombian law require that, whenever the Bank issues new shares of any outstanding class, it must offer the holders of each class of shares (including holders of ADRs) the right to purchase a number of shares of such class sufficient to maintain their existing percentage ownership of the aggregate capital stock of the Bank. These rights are called preemptive rights. United States holders of ADRs may not be able to exercise their preemptive rights through The Bank of New York Mellon, which acts as depositary (the “Depositary”) for the Bank’s ADR facility, unless a registration statement under the Securities Act is effective with respect to such rights and class of shares or an exemption from the registration requirement thereunder is available. The Bank is obligated to file a registration statement or find a corresponding exemption only if it determines to extend the rights to holders of the ADRs. Although it is not obligated to, do so, the Bank intends to consider at the time of any rights offering the costs and potential liabilities associated with any such registration statement, the benefits to the Bank from enabling the holders of the ADRs to exercise those rights and any other factors deemed appropriate at the time before it makes a decision as to whether to file a registration statement. Accordingly, the Bank may in some cases decide not to file a registration statement.
Under the deposit agreement between the Bank and the Depositary, only the Depositary is entitled to exercise preemptive rights, and the Depositary has no obligation to make available preemptive rights to holders of ADRs. If the Bank offers or causes to be offered to the holders of any deposited securities, including preferred shares of the Bank, any rights to subscribe for additional preferred shares of the Bank or any rights of any other nature, the Depositary has discretion as to the procedure to be followed in making such rights available to any holders of ADRs or in disposing of such rights on behalf of any holders of ADRs and making the net proceeds available to such holders of ADRs. If by the terms of such rights offering or for any other reason, the Depositary does not either make such rights available to any holders of ADRs or dispose of such rights and make the net proceeds available to such holders of ADRs, then the Depositary will allow the rights to lapse. Whenever the rights are sold or lapse, the equity interests of the holders of ADRs will be proportionately diluted.
The Bank’s preferred shares have limited voting rights.
The Bank’s corporate affairs are governed by its by-laws and Colombian law. Under the Bank’s by-laws and Colombian law, the Bank’s preferred stockholders may have fewer rights than stockholders of a corporation incorporated in a U.S. jurisdiction. Under the Bank’s by-laws and Colombian corporate law, holders of preferred shares (and, consequently, holders of ADRs) have no voting rights in respect of preferred shares, other than in limited circumstances as described in “Item 10. Additional Information – B. Memorandum and Articles of Association – Voting Rights – Preferred Shares”. Holders of the Bank’s preferred shares, including holders of ADRs, are not entitled to vote for the election of directors or to influence the Bank’s management policies.
Holders of the Bank’s ADRs may encounter difficulties in the exercise of dividend and voting rights.
Holders of the Bank’s ADRs may encounter difficulties in the exercise of some of their rights with respect to the shares underlying ADRs. If the Bank makes a distribution to holders of underlying shares in the form of securities, the Depositary is allowed, in its discretion, to sell those securities on behalf of ADR holders and instead distribute the net proceeds to the ADR holders. Also, even in those limited instances in which the preferred shares represented by the ADRs have the power to vote, under some circumstances, ADR holders may not be able to vote by giving instructions to the depositary. This may occur if ADR holders do not receive from the Depositary a notice of meeting sufficiently prior to the instruction date to ensure that the Depositary will vote the preferred shares represented by the ADRs in accordance with instructions received from such holders. There are no circumstances in which holders of ADRs may vote in a way other than by providing instructions to the Depositary.
Relative illiquidity of the Colombian securities markets may impair the ability of an ADR holder to sell preferred shares.
The Bank’s common and preferred shares are listed on the Colombian Securities Exchange, which is relatively small and illiquid compared to securities exchanges in major financial centers. In addition, a small number of issuers represent a disproportionately large percentage of market capitalization and trading volume on the Colombian Securities Exchange. A liquid trading market for the Bank’s securities might not develop on the Colombian Securities Exchange. A limited trading market could impair the ability of an ADR holder to sell preferred shares (obtained upon withdrawal of such shares from the ADR facility) on the Colombian Securities Exchange in the amount and at the price and time such holder desires, and could increase the volatility of the price of the ADRs.
Changes in Colombia’s tax regime may affect ADRs tax treatment.
ADRs do not have the same tax benefits as other equity investments in Colombia. ADRs represent Bancolombia’s preferred shares and are held through a fund of foreign capital in Colombia which is subject to a specific tax regulatory regime. Accordingly, the regulations applicable in Colombia to equity investments, in particular those relating to dividends and profits from sale, are not applicable to ADRs, including the Bank’s ADRs.
However, the tax regime applicable to ADRs may change from time to time, considering that in recent years the Colombian tax regime has had several reforms.
For more information see “Item 10. Additional Information. –E. Taxation –Colombia Taxation”.
| ITEM 4 | INFORMATION ON THE COMPANY |
| A. | HISTORY AND DEVELOPMENT OF THE COMPANY |
Bancolombia is one of the biggest Colombian financial institution, with presence in other jurisdictions such as Panama, El Salvador, Puerto Rico, Guatemala and the Cayman Islands, providing a wide range of financial products and services to a diversified individual, corporate, and government customer base throughout Colombia, Latin America and the Caribbean region.
Bancolombia is a stock company (“sociedad anónima”) domiciled in Medellin, Colombia and operates under Colombian laws and regulations, mainly the Colombian Commercial Code, Decree 663 of 1993 and Decree 2555 of 2010. Bancolombia was incorporated in Colombia in 1945, under the name Banco Industrial Colombiano S.A. or “BIC”, and is incorporated until 2044. In 1998, the Bank merged with Banco de Colombia S.A., and changed its legal name to Bancolombia S.A. On July 30, 2005, Conavi Banco Comercial y de Ahorros S.A. and Corporación Financiera Nacional y Suramericana S.A. merged with and into Bancolombia, with Bancolombia as the surviving entity. Through this merger, Bancolombia gained important competitive advantages in retail and corporate banking which materially strengthened Bancolombia’s multi-banking franchise.
In May 2007, Bancolombia Panama acquired Banagrícola, which controls several subsidiaries, including Banco Agrícola in El Salvador, and is dedicated to banking, commercial activities, consumer activities and brokerage. Through its first international acquisition, Bancolombia gained a leadership position in the Salvadorian market.
In October 2013, Bancolombia acquired a 100% percent interest in the ordinary voting shares of Banistmo.
Also, in October 2013, Bancolombia Panama acquired a 40% interest in Grupo Agromercantil, the parent company of BAM, and certain other companies dedicated to securities brokerage and other financial businesses. On December 30, 2015, Bancolombia Panama acquired an additional 20% interest, which afforded and control of Grupo Agromercantil. On March 13, 2020 Bancolombia Panama and BAM Financial Corporation BFC, entered into a stock purchase agreement pursuant to which Bancolombia Panama will acquire the remaining 40% of the common stock of Grupo Agromercantil as a result of which Bancolombia Panama will own 100% of the shares of Grupo Agromercantil.
The aggregate purchase price for the shares representing the 40% to be adquired is USD 289,144,606, and such amount has been provisioned in Bancolombia’s consolidated financial statements for the fiscal year 2019. Closing of the transaction will occur once the approval by the regulatory authorities is obtained, which is expected to happen in the third quarter of 2020.
Since 1995, Bancolombia has maintained a listing on the NYSE, where its ADSs are traded under the symbol “CIB”, and on the Colombian Securities Exchange, where its preferred shares are traded under the symbol “PFBCOLOM”. Since 1981 Bancolombia’s common shares have been traded on the Colombian Securities Exchange under the symbol “BCOLOMBIA”. See “Item 9. The Offer and Listing”.
Bancolombia has grown substantially over the years, both through organic growth and acquisitions.
As of December 31, 2019, Bancolombia and its consolidated subsidiaries had:
COP 236,088 billion in total assets;
COP 171,353 billion in total net loans and advances to customers and financial institution;
COP 157,205 billion in total deposits by customers; and
COP 26,884 billion in stockholders’ equity attributable to the owners of the parent company.
Bancolombia’s consolidated net income attributable to equity holders of Bancolombia S.A. for the year ended December 31, 2019 was COP 3,117 billion, representing a return on average total equity of 12.09% and a return on average total assets of 1.35%.
The address and telephone numbers of the Bank’s headquarters are as follows: Carrera 48 # 26-85, Medellín, Colombia; telephone + (574) 404-1837. The Bank’s website is: https://www.grupobancolombia.com. The Bank’s agent for service of process in the United States is Puglisi & Associates, located at 850 Library Avenue, Suite 204, Newark, Delaware 19711.
RECENT DEVELOPMENTS
Divestiture in Peruvian subsidiaries
On July 12, 2019, the Bank´s subsidiaries Fiduciaria Bancolombia and Banca de Inversión Bancolombia, completed the sale of a 100% stake in FiduPerú S.A. Sociedad Fiduciaria, to TMF Group Americas B.V. (“TMF”).
Changes to governance structure
On September 27, 2019, Jaime Alberto Velasquez Botero announced his decision to resign as the Chief Strategy and Financial Officer of Bancolombia. As a result of the announcement and in line with the development of the Bank’s governance model, the Corporate Vice-presidency of Bancolombia was created as of October 1, 2019. The Corporate Vice-presidency oversees the Legal, Financial, Treasury, Human Resources and Compliance Vice-presidencies and the Reputation and Communications and Regulation Departments. Mauricio Rosillo Rojas was appointed as Corporate Vice-president of Bancolombia.
Jose Humberto Acosta, who had been acting as the Financial Vice-president of Bancolombia, has assumed the position of Chief Financial Officer of Bancolombia.
Resignation of Mr. Roberto Steiner Sampedro and appointment of Mrs. Sylvia Escobar
On September 12, 2019, Mr. Roberto Steiner Sampedro resigned as a member of the Bank’s Board of Directors. Mr. Steiner, who was also member of the Risk and Corporate Governance Committees, resigned due to his appointment as Co-director of the Colombian Central Bank (the “Central Bank”). During the Bank’s last annual shareholders meeting, the shareholders appointed Mrs. Sylvia Escobar as the new independent board member to replace Mr. Steiner.
Appointment of Ms. Claudia Echavarria Uribe
On December 9, 2019, Ms. Claudia Echavarria Uribe assumed the position of Chief Legal Officer and General Counsel of Grupo Bancolombia. Ms. Echavarria Uribe most recently was the Corporate Vice-president and the General Counsel of Almacenes Exito S.A. and previously held various positions within the legal department of Bancolombia and Banca de Inversion Bancolombia between 2004 and 2015.
Issuance of Subordinated Notes due 2029 and Tender Offer for Outstanding Subordinated Notes
On December 18, 2019, Bancolombia issued US$550,000,000 aggregate principal amount of 4.625% Subordinated Notes due 2029.
On December 24, 2019, Bancolombia announced the expiration and final tender results of the offer by Citigroup Global Markets Inc., as offeror, to purchase for cash up to a maximum amount of US$750,000,000 of Bancolombia’s outstanding 6.125% Subordinated Notes due 2020 and 5.125% Subordinated Notes due 2022, under the terms and conditions set forth in the offer to purchase dated November 25, 2019. Pursuant to the tender offer the offeror accepted for purchase an aggregate principal amount of US$490,499,000 of subordinated notes duly tendered
Issuance of Senior Notes due 2025, Tender Offer for Outstanding Senior Notes and Redemption
On January 29, 2020, Bancolombia issued US$950,000,000 aggregate principal amount of 3.000% Senior Notes due 2025.
On February 7, 2020, Citigroup Globlal Markets Inc., as offeror, settled its tender offer to purchase any and all of Bancolombia´s outstanding 5.950% Senior Notes due 2021, under the terms and conditions set forth in the offer to purchase dated January 8, 2020. Pursuant to the tender offer, the offeror accepted for purchase an aggregate principal amount of US$559,395,000 of senior notes duly tendered. On March 2, 2020, Bancolombia redeemed all remaining 5.950% Senior Notes due 2021.
PUBLIC TAKEOVER OFFERS
In 2019, and as of the date of this Annual Report, there have been no public takeover offers by third parties with respect to the Bank’s shares or by the Bank in respect to another company’s shares.
CAPITAL ACQUISITIONS AND DIVESTITURES
During 2019, total capital expenditures amounted to COP 659.9 billion. Such investments were mainly focused on IT related projects (COP 78 billion), the expansion of the Bank’s branch and ATM network (COP 73.3 billion), the purchase of fixed assets (COP 403.7 billion) (such as the new regional headquarters for Bancolombia in the city of Bogotá), and other miscellaneous projects, including new software modules, upgrade of web contents, automation of reports, and construction of data centers (COP 104.8 billion).
In 2019, Bancolombia funded its capital expenditures with its own resources and plans to continue to fund those currently in progress in the same manner.
In 2020, the Bank expects to invest approximately COP 669.0 billion as follows: COP 172.3 billion in connection with the expansion of the Bank’s branch and ATM network, COP 46.5 billion in connection with the purchase of hardware for the expansion, updating and replacement of the current IT equipment, COP 349.2 billion in connection with other fixed assets and COP 99.9 billion in connection with strategic projects. These figures represent only an estimate and may change according to the continuing assessment of the Bank’s project portfolio. No assurance can be given, however, that all such capital expenditures will be made and, if made, that such expenditures will be in the amounts currently expected.
The following table summarizes the Bank’s capital acquisitions and divestitures in interests in other companies, for the years ending December 31, 2019, 2018 and 2017:
| Capital Acquisitions(1) | | For the year ended December 31, | |
| Type of Investment | 2019 | | 2018 | | 2017 | | Total |
| | | In millions of COP | |
| Compañía de Financiamiento Tuya S.A. | Joint venture | 26,316 | | 5,000 | | 30,000 | | 61,316 |
| P.A. Fideicomiso Lote Avenida San Martin | Financial Instrument | 8,215 | | - | | - | | 8,215 |
| VLIPCO S.A.S. | Joint venture | 4,269 | | - | | - | | 4,269 |
| Reintegra S.A.S. | Associate | 3,775 | | 1,152 | | 739 | | 5,666 |
| SPDR S&P 500 ETF Trust | Financial Instrument | 2,736 | | - | | - | | 2,736 |
| Servicios de Identidad Digital S.A.S | Associate | 2,369 | | - | | - | | 2,369 |
| P.A Proyecto CRECE | Joint venture | 2,200 | | - | | - | | 2,200 |
| Amazon.com Inc | Financial Instrument | 1,695 | | - | | - | | 1,695 |
| Health Care Select Sector SPDR® Fund | Financial Instrument | 1,649 | | - | | - | | 1,649 |
| Consumer Staples Select Sector SPDR® Fund | Financial Instrument | 1,628 | | - | | - | | 1,628 |
| Financial Select Sector SPDR® Fund | Financial Instrument | 1,609 | | - | | - | | 1,609 |
| iShares Core MSCI EMU UCITS ETF | Financial Instrument | 1,367 | | - | | - | | 1,367 |
| iShares MSCI Eurozone ETF | Financial Instrument | 1,367 | | - | | - | | 1,367 |
| Microsoft Corporation | Financial Instrument | 1,033 | | - | | - | | 1,033 |
| Alphabet Inc Class A | Financial Instrument | 878 | | - | | - | | 878 |
| iShares MSCI Japan ETF | Financial Instrument | 871 | | - | | - | | 871 |
| Canacol Energy Ltd. | Financial Instrument | 857 | | - | | 2,375 | | 3,232 |
| 500 Luchadores II, L.P | Financial Instrument | 619 | | - | | 2,984 | | 3,603 |
| P.A Viva Malls | Associate | - | | 274,951 | | 262,918 | | 537,869 |
| FCP Fondo Inmobiliario Colombia | Subsidiary | - | | 208,995 | | - | | 208,995 |
| P. A. Cartera Factoring Valores Simesa | Financial Instrument | - | | 25,074 | | - | | 25,074 |
| Fondo Renta Fija Valor | Financial Instrument | - | | 16,256 | | - | | 16,256 |
| CIFI (Corporación para el financiamiento y la infraestructura) | Financial Instrument | - | | 6,599 | (2) | - | | 6,599 |
| Ely Lilly Company | Financial Instrument | - | | 1,047 | | - | | 1,047 |
| Walgreens Boots Alliance, Inc | Financial Instrument | - | | 434 | | 762 | | 1,196 |
| PA Central Point | Financial Instrument | - | | - | | 36,242 | | 36,242 |
| Puntos Colombia S.AS. | Joint venture | - | | - | | 9,000 | | 9,000 |
| ECOPETROL S.A. | Financial Instrument | - | | - | | 6,347 | | 6,347 |
| Davivienda S.A. Preferencial | Financial Instrument | - | | - | | 2,490 | | 2,490 |
| PA Estrategias Inmobiliarias | Financial Instrument | - | | - | | 1,797 | | 1,797 |
| Grupo AVAL Acciones y Valores S.A. | Financial Instrument | - | | - | | 1,735 | | 1,735 |
| CEMEX Latam Holdings S.A. | Financial Instrument | - | | - | | 1,650 | | 1,650 |
| Fondo Bursátil Ishares COLCAP | Financial Instrument | - | | - | | 1,567 | | 1,567 |
| Corporación Financiera Colombiana S.A. | Financial Instrument | - | | - | | 1,501 | | 1,501 |
| Fondos SURA SAF SAC | Financial Instrument | - | | - | | 1,345 | | 1,345 |
| Anheuser-Busch Companies, Inc | Financial Instrument | - | | - | | 1,328 | | 1,328 |
| Johnson & Johnson | Financial Instrument | - | | - | | 1,258 | | 1,258 |
| SPDR Gold Shares | Financial Instrument | - | | - | | 916 | | 916 |
| Amgen, Inc | Financial Instrument | - | | - | | 784 | | 784 |
| Others | | 1,649 | | 3,457 | | 3,440 | | 8,546 |
| Total Acquisitions | | 65,102 | | 542,965 | | 371,178 | | 979,245 |
____________________________
| (1) | The amount disclosed in this table correspond to the consideration paid as a result of the acquisition of each investment. |
| (2) | The amount of USD 1,122 thousand has been converted at the rate of COP 2,930.8 per USD 1,00, which is the Representative Market Rate calculated on June 30, 2018, as reported by the SFC. |
| Capital Divestitures(1) | | As of December 31, |
| Type of Investment | 2019 | | 2018 | | 2017 | Total |
| | | In millions of COP |
| SURA ASSET MANAGEMENT S.A | Financial Instrument | 423,997 | | - | | - | 423,997 |
| EPSA S.A. E.S.P | Financial Instrument | 128,450 | | - | | - | 128,450 |
| Arrendamiento Operativo CIB S.A.C - Renting Perú(2) | Subsidiary | 69,798 | | - | | 3,757 | 73,555 |
| Concesiones CCFC S.A. | Associate | 34,565 | | - | | - | 34,565 |
| P. A. Cartera Factoring Valores Simesa | Financial Instrument | 25,074 | | - | | - | 25,074 |
| Avefarma S.A.S. | Associate | 20,658 | | - | | - | 20,658 |
| CIFI (Corporación para el financiamiento y la infraestructura) | Financial Instrument | 20,065 | | - | | - | 20,065 |
| Mortgage-Backed Securities | Financial Instrument | 32,773 | | - | | - | 32,773 |
| Panamerican Pharmaceutical Holding Inc. | Associate | 8,951 | | - | | - | 8,951 |
| Servicios de Aceptación S.A.S | Joint venture | 8,927 | | - | | - | 8,927 |
| Corporación Financiera Colombiana S.A. | Financial Instrument | 8,777 | | - | | - | 8,777 |
| Glassfarma Tech S.A.S. | Associate | 4,424 | | - | | - | 4,424 |
| DECEVAL | Financial Instrument | - | | 22,024 | | - | 22,024 |
| Renta Liquidez Cartera Colectiva | Financial Instrument | - | | 21,606 | | - | 21,606 |
| Bolsa de Valores de Colombia | Financial Instrument | - | | 6,752 | | - | 6,752 |
| ETB S.A. E.S.P. | Financial Instrument | - | | 2,940 | | - | 2,940 |
| Davivienda S.A. Preferencial | Financial Instrument | - | | 2,490 | | - | 2,490 |
| Canacol Energy Ltd. | Financial Instrument | - | | 2,375 | | - | 2,375 |
| Interconexión Eléctrica S.A. | Financial Instrument | - | | 1,976 | | - | 1,976 |
| Preferencial Grupo Sura | Financial Instrument | - | | 1,924 | | - | 1,924 |
| PA Estrategias Inmobiliarias | Financial Instrument | - | | 1,797 | | - | 1,797 |
| Clean Harbors Inc | Financial Instrument | - | | 1,650 | | - | 1,650 |
| Anheuser-Busch InBev | Financial Instrument | - | | 1,328 | | - | 1,328 |
| Johnson & Johnson | Financial Instrument | - | | 1,258 | | - | 1,258 |
| Capital Investment SAFI(2) | Subsidiary | - | | 1,148 | | - | 1,148 |
| Grupo Odinsa S.A. | Financial Instrument | - | | 95 | | - | 95 |
| Grupo Argos | Financial Instrument | - | | - | | 92,966 | 92,966 |
| Fideicomiso P.A Acqua Power Center | Financial Instrument | - | | - | | 17,640 | 17,640 |
| Leasing Perú S.A(2) | Subsidiary | - | | - | | 16,838 | 16,838 |
| ECOPETROL S.A. | Financial Instrument | - | | - | | 15,469 | 15,469 |
| PA Plesco | Financial Instrument | - | | - | | 10,935 | 10,935 |
| ADARA VENTURES | Financial Instrument | - | | - | | 6,979 | 6,979 |
| Fideicomiso Corpacero S.A.S | Financial Instrument | - | | - | | 6,584 | 6,584 |
| Construcciones El Cóndor S.A. | Financial Instrument | - | | - | | 2,819 | 2,819 |
| Fondos SURA SAF SAC | Financial Instrument | - | | - | | 2,128 | 2,128 |
| SURA Corto Plazo CASHDOL | Financial Instrument | - | | - | | 1,194 | 1,194 |
| Fogansa S.A. | Financial Instrument | - | | - | | 883 | 883 |
| Others | | 4,005 | | 5,267 | | 2,420 | 11,692 |
| Total Divestitures | | 790,464 | | 74,630 | | 180,612 | 1,045,706 |
(1) The amount disclosed in this table correspond to the consideration received as a result of the sale of each investment.
(2) Investment wound-up in during the year 2018.
B.1 GENERAL
COMPANY DESCRIPTION, PRODUCTS AND SERVICES
Bancolombia is a full service financial institution that offers a wide range of banking products and services to a diversified individual and corporate customer base of nearly 15 million customers. Bancolombia delivers its products and services through its regional network comprising Colombia’s largest non-Government owned banking network, El Salvador’s leading financial conglomerate, Guatemala’s fourth-largest bank, Panama’s second-largest bank and off-shore banking subsidiaries in Panama, Cayman and Puerto Rico, in each case measured by amount of gross loans.
Bancolombia and its subsidiaries offer the following products and services:
Savings and Investment: The Bank offers its customers checking accounts, savings accounts, fixed term deposits and a diverse variety of investment products that fit the specific transactional needs of each client and their income bracket, which can be opened thought digital channels. The Bank also offers its clients and users the service of tax collection in all its branches, and through electronic and digital channels.
Ahorro a la Mano: This is a mobile phone-based savings account specially designed to serve low-income clients and those with no prior experience with banking products.
Financing:The Bank offers its customers a wide range of credit alternatives which include: trade financing, loans funded by domestic development banks, working capital loans, credit cards, personal loans, vehicle loans, payroll loans and overdrafts, among others.
Mortgage Banking:The Bank is a leader in the mortgage market in Colombia, providing full financial support to real estate developers and mortgages for individuals and companies.
Factoring:Bancolombia offers its clients solutions for handling their working capital and maximizing their assets turnover through comprehensive solutions to manage their accounts receivable financing.
Financial and Operating Leases:The Bank offers financial and operating leases specifically designed for acquiring fixed assets.
Capital Markets:The Bank assists its clients in mitigating market risk through hedging instruments such as, futures, forwards, options and swaps.
Trading:The bank offers an internet-based trading platform, available for retail and institutional clients, which allows them to buy/sell securities in the Colombian Securities Exchange.
The Bank also performs inter-bank lending, repurchase agreements (repos), foreign exchange transactions, as well as sovereign and corporate securities sales and trading. Bancolombia is an active player in the “market-makers” scheme for trading Colombian sovereign debt (TES bonds).
The Bank offers its clients direct access to local and international capital markets through a full range of brokerage and investment advisory services that cover equities and fixed income securities, proprietary trading and third party asset management products, such as mutual funds, private equity funds, and privately managed investment accounts for institutional, corporate and private bank clients.
Cash Management:The Bank provides support to its clients through efficient cash management, offering a portfolio of standard products that allows clients to make payments and collections through different channels. The Bank’s payables and receivables services provide solutions to process and reconcile transactions accurately, efficiently, and in a timely manner. We also offer a comprehensive reporting solution, providing the data that is required by customers’ internal processes. In addition, the Bank designs and creates custom-made products in order to address the Bank’s clients’ specific payment and collection needs. These include a variety of real time web services, straight through processing (STP) and messaging through Swift Net solutions.
Foreign Currency and Trade Finance: The Bank offers its clients specialized solutions to satisfy their investment, financing and payment needs with regard to foreign currency transactions. The Bank also provides trade finance solutions with products such as Letters of Credit, Standby Letters of Credit and Bills Collection.
Bancassurance and Insurance: The Bank distributes diverse insurance products (life, auto, commercial, and homeowner’s insurance) written by Compañía Suramericana de Seguros S.A., one of the main insurance companies in Colombia. In addition, Bancolombia offers unemployment insurance written by Sure General Cardif Colombia S.A.
Investment Banking: The Bank, through its subsidiary Banca de Inversión, offers a wide variety of value-added services, including project and acquisition finance, debt and equity capital markets, principal investments (in real estate, industrials, manufacturing, construction), M&A, hedging strategies, restructurings and structured finance across all economic sectors.
Trust and Fiduciary Services: The Bank, through its subsidiary Fiduciaria Bancolombia offers a broad and diversified portfolio of services for companies and individuals, meeting their needs with tailored services. These services include managing escrow accounts, multiple investment funds, and real estate funds.
Nequi (Digital Bank): Nequi is a digital platform that is seeking to disrupt the financial market in Latin America starting in Colombia and Panama. Nequi is a 100% digital bank that operates independently from the Bancolombia´s brand and aims to articulate real financial needs of nowadays’ clients with a wide range of possibilities enabled by technology. Nequi is completely paperless; users interact with the platform exclusively by mobile phone, with no contact with Bancolombia’s branch network. Nequi offers saving accounts, a digital card, PayPal integration, nano-loans and third-party non-financial services, like utilities, entertainment and transportation among others, to over 1.8 million users in Colombia and over 100 thousand in Panama.
NEW PRODUCTS OR SERVICES
Bancolombia continues its efforts to diversify and innovate in its product portfolio. Below is a brief description of the new products and services introduced in 2019:
Bancolombia QR code:Bancolombia QR is a fast, secure and free solution for entrepreneurs, small businesses and freelancers that allows them to receive money from their clients’ purchases, directly to their savings, checking, Bancolombia a la Mano or Nequi accounts. Since its launch in July 2019 thousands of businesses have adopted this solution nationwide. Half a million account holders in Colombia have used the QR Bancolombia.
New digital platform “administra tu negocio”:In 2019 the Bank launched a new digital platform that seeks to strenghten its relationship with corporate clients and support their daily management, aiming to help companies enhance the growth of their businesses. This platform counts with more than half a million potential clients between SMEs and individuals.
WOMPI:in March 2019 Bancolombia launched an online payment system. This product allows businesses (regardless of their size) to accept payments online. Clients can create a payment link, have an online terminal or integrate via API or web checkout.
There are two different models available: hosted and self-hosted. The hosted payment gateway enables companies to accept online payments without having to engage another financial institution and is targeted to SMEs. The self-hosted payment gateway is offered as an added value to the Bank’s clients that have a merchant account set up with American Express, Mastercard or Visa, and/or revenue collection products, with Bancolombia.
MAIN LINES OF BUSINESS
The Bank manages its business through nine main operating segments: Banking Colombia, Banking Panama, Banking El Salvador, Banking Guatemala, Trust, Investment Banking, Brokerage, Off Shore, and All other.
For a description and discussion of these segments, please see “Item 5. Operating and Financial Review and Prospects – A. Operating Results – Results by Segment”.
B.2 OPERATIONS
See Note 3 to the Consolidated Financial Statements included in this Annual Report for a description of the principal markets in which the Bank competes, including a breakdown of total interest and valuation income by category of activity and geographic market for each of the last three fiscal years.
B.3 SEASONALITY OF DEPOSITS
Historically, the Bank has experienced some seasonality in its demand deposits, with higher average balances at the end of the year and lower average balances in the first months of the year. This behavior is explained primarily by the increased liquidity provided by the Central Bank and the Colombian National Treasury at year end, as economic activity tends to be higher during this period resulting in a greater number of transactions. However, we do not consider the seasonality of demand deposits to have a significant impact on the Bank’s business.
B.4 RAW MATERIALS
The Bank is not dependent on sources or availability of raw materials.
B.5 DISTRIBUTION NETWORK
Bancolombia provides its products and services through a traditional branch network, sales and customer representatives as well as through mobile branches (or“Puntos de Atención Móviles”), an ATM network, online and computer banking, telephone banking, mobile phone banking services and points of sale (or “Puntos de Atención Cercano”), among others. Transactions performed through electronic channels represented more than 93.19% of all transactions in 2019, up from 92.78% of all transactions in 2018. In addition, as of December 31, 2019, Bancolombia had a sales force of approximately 12,503 employees.
The following are the distribution channels offered by Bancolombia as of December 31, 2019:
Branch Network
As of December 31, 2019, Bancolombia’s consolidated branch network consisted of 1,083 offices, including 686 from Bancolombia S.A., 94 from Banco Agrícola, 43 from Banistmo, 152 from BAM and 108 from other subsidiaries.
| Company* | Number
of
branches
2019 | Number
of
branches
2018 | Number
of
branches
2017 | Number
of
branches
2016 |
| Bancolombia S.A. (unconsolidated) | 686 | 704 | 726 | 817 |
| BAM (Guatemala)) | 152 | 177 | 177 | 208 |
| Banco Agrícola | 94 | 97 | 97 | 97 |
| Banistmo | 43 | 44 | 44 | 45 |
| Renting Colombia | 42 | 33 | 24 | 22 |
| Company* | Number
of
branches
2019 | Number
of
branches
2018 | Number
of
branches
2017 | Number
of
branches
2016 |
| Leasing Bancolombia(1) | 18 | 18 | 19 | 20 |
| Valores Bancolombia | 18 | 6 | 6 | 6 |
| Financomer | 8 | 8 | 8 | 8 |
| Fiduciaria Bancolombia | 6 | 7 | 7 | 6 |
| SUFI(2) | 3 | 5 | 5 | 3 |
| Banca de Inversión | 2 | 2 | 2 | 2 |
| Inversiones CFNS S.A.S. | 2 | 2 | 2 | 2 |
| Bancolombia Panama | 1 | 1 | 1 | 2 |
| Bancolombia S.A. Panama Branch | 1 | 1 | 1 | 1 |
| Valores Banistmo | 1 | 1 | 1 | 1 |
| Bancolombia Puerto Rico International Inc. | 1 | 1 | 1 | 1 |
| Arrendamiento Operativo CIB S.A.C.(3) | 1 | 1 | 1 | 1 |
| Arrendadora Financiera S.A. | 1 | 1 | 1 | 1 |
| Valores Banagricola, S.A. de C.V. | 1 | 1 | 1 | 1 |
| Capital Investments SAFI S.A. | 1 | 1 | 1 | 1 |
| Transportempo S.A.S. | 1 | 1 | 1 | 1 |
| Fondo Inversión Arrend.Operativo Renting Perú(3) | - | - | - | 1 |
| Total | 1,083 | 1,113 | 1,153 | 1,247 |
| * | For some subsidiaries, their central office is considered a branch. |
| (1) | On September 30, 2016, Leasing Bancolombia S.A., a former Subsidiary of Bancolombia S.A. organized under the laws of Colombia, merged into Bancolombia. Bancolombia, as the surviving entity, became the holder of the rights and liabilities of Leasing Bancolombia S.A., and assumed responsibility for managing its existing portfolio of products and services. Leasing Bancolombia S.A. assigned to Bancolombia the “Leasing Bancolombia” trademark, which has thereafter been used to identify a division of Bancolombia. Leasing Bancolombia S.A. operates 18 branches under that brand. |
| (2) | Sufi is a Bancolombia brand that operates 3 branches. |
| (3) | Fondo Inversión Arrend.Operativo Renting Perú changed its legal name to Arrendamiento Operativo CIB S.A.C. The offices operated for the Localiza franchise in Peru are included in the total number of branches reported for Arrendamiento Operativo CIB S.A.C. |
Banking Correspondents
A banking correspondent is a platform which allows non-financial institutions, such as stores open to the public, to provide financial services and transactions in towns where banks and financial institutions have limited or no presence. As of December 31, 2019, Bancolombia had a total of 16,740 banking correspondents, including 15,765 in Colombia, 194 in Panama, 680 in El Salvador and 101 in Guatemala.
Puntos de Atención Móviles “PAM”
PAMs consist of commercial advisors who visit small towns in Colombia periodically to offer Bancolombia’s products and services. As of December 31, 2019, there were a total of 556 PAMs (533 in Colombia, 7 in Panama and 16 in El Salvador).
Kiosks
Kiosks are located inside the Bank’s agencies, malls, and other public places and are used to provide the Bank’s clients the possibility of conducting a variety of self-service transactions. As of December 31, 2019, there were a total of 219 kiosks in El Salvador and 117 in Colombia (located only in branches).
Automated Teller Machines “ATMs”
Bancolombia has a total of 6,169 ATMs, including 5,090 in Colombia, 584 in El Salvador, 339 in Panama, and 156 in Guatemala.
Online/Computer Banking
We offer multiple online and computer-based banking alternatives designed to fit the specific needs of the Bank’s different client segments. Through a variety of platforms (computer and Internet-based solutions) the Bank’s clients can review their account balances and monitor transactions in their deposit accounts, loans, and credit cards, make virtual term investments, access funds from pre-approved loans, make payroll and supplier payments, make purchases and bill payments, negotiate stocks, learn about products and services and complete other transactions in real time.
Telephone Banking
We provide customized and convenient advisory services to customers of all segments through automatic interactive voice response (IVR) operations and a 24/7 contact center.
Point of Sale orPunto de Atención Cercano “PAC”
Through the Bank’s own network of 2,318 PACs the Bank’s customers may carry out a variety of transactions including transfer of funds, bill payments, and changes to debit card PINs, among others.
Mobile Phone Banking Service
The Bank’s clients can conduct a variety of transactions using their cell phones, including fund transfers between Bancolombia accounts, account balance inquiries, purchase of prepaid cell phone air time and payment of bills and invoices.
Business Connections Banking Service
The Bancolombia Business Connections service (H2H) is a new differentiating feature of our entire range of solutions, that aims to supplement the interaction with both our cash management and factoring products. It offers a secure and efficient option for clients to manage their funds, particularly their cash management needs. H2H is a service that allows direct connections between a client’s computer server and the Bank’s servers. This service is typically used for payroll payments, vendor payments and other transactions that typically consist of large amounts of information and that must be processed quickly.
B.6 PATENTS, LICENSES AND CONTRACTS
The Bank is not dependent on patents or licenses, nor is it substantially dependent on any industrial, commercial or financial contracts (including contracts with customers or suppliers). However, the Bank has entered into contracts with third parties who provide certain key services that are important to the Bank’s business. These services include: online banking platforms, data processing and payment services, clearing and settlement services, software for processing credit and debit card services, and technological infrastructure, among others.
If any of those service providers were not to fulfill their respective contractual obligations, the Bank’s business could suffer, some of the Bank’s channels of attention to the Bank’s clients may be unavailable until a replacement provider is engaged and we might be required to incur in additional costs to find such replacement providers.
B.7 COMPETITION
Description of the Colombian Financial System
Overview
Since 2007, the Colombian banking system has been undergoing a period of expansion, given the series of mergers and acquisitions that have taken place within the sector. More specifically, several mergers and acquisitions took place in 2007, mainly due to the global economic situation. Colombian banks made several investments allowing some entities to become big players in the Latin American market; Bancolombia, completed the acquisition of Banagrícola in El Salvador and Davivienda merged with Granbanco S.A. Bancafé, which allowed Davivienda to have operations in Panama. In 2010, Banco de Bogotá acquired BAC-Credomatic, which operates in several countries in Central America; and, in October 2011, Canadian Scotiabank purchased a stake in Colpatria. In 2012, the most relevant event regarding the presence of foreign banks in Colombia was the acquisition of Banco Santander Colombia S.A. in July 2012 by Corpbanca (Chile). Also, Davivienda acquired the subsidiaries of HSBC in Costa Rica, Honduras and El Salvador.
In 2013, Bancolombia continued its internationalization process with the acquisition of the banking and insurance operations of HSBC in Panama for USD 2,234 million. In addition, Bancolombia Panama acquired 40% of the common shares of Grupo Agromercantil for USD 217 million. In 2013, Grupo Aval acquired 100% of the Guatemalan Reformador Financial Group (the transaction was valued at USD 411 million) and acquired BBVA Panama for USD 490 million. In 2013, some competitors started operations in Colombia: Itau BBA entered the market with an investment bank, as did BNP Paribas; Credicorp acquired Correval (a local brokerage firm); Brazilian broker-dealer BTG Pactual acquired Bolsa y Renta; Banco Santander returned to the Colombian market with a bank; and the Chilean company Larrain Vial started operations with a brokerage firm.
During 2014, the entry of new entities continued as the financing company Hipotecaria, specialized in mortgage loans, which began operations in March 2014; and in June, Corpbanca completed the acquisition of Helm Bank, keeping Corpbanca’s brand. During the same year, the bank GNB Sudameris acquired 99.9% of the capital of HSBC Colombia and started to operate under the brand GNB Colombia, while an agreement was signed to operate in Paraguay, Peru and Uruguay. In 2015, the Chilean group CorpBanca merged with the Itaú of Brazil and Bancolombia sold 50% of its shares in Tuya SA to Grupo Exito. In December 2015, Bancolombia also acquired an additional 20% interest in Grupo Agromercantil, bringing its interest to 60% in total. Until January 2019, Serfinansa was a commercial financing company and on February 2019 it began to operate as the 26th bank in the Colombian financial system.
As of December 31, 2019, according to the SFC, the main participants in the Colombian financial system were 26 commercial banks (15 domestic private banks, 10 foreign banks, and 1 domestic state-owned bank), 5 financial corporations and 14 financing companies (3 leasing companies and 11 traditional financing companies). In addition, trust companies, cooperatives, insurance companies, insurance brokerage and securities intermediaries, special state-owned institutions, and severance payments and pension funds also participate in the Colombian financial system.
Market and Credit Institutions’ Evolution in 2019
Colombian financial institutions began reporting their consolidated financial results under IFRS framework in 2015. However, in the case of credit institutions (including banks, financial corporations, financing companies and 38 financial cooperatives), the SFC has allowed the presentation of stand-alone financial statements under Colombian Banking GAAP basis, following Decree 1851 of August 2013, which regulates the Law 1314 of 2009 concerning technical regulatory framework for the institutions that report their financial results. Accordingly, following information includes the figures under Colombian Banking GAAP regulation, as reported by Colombian credit institutions to the SFC.
Loan growth at Colombian credit institutions was 7.66% in 2019, compared to 6.11% in 2018. Commercial loans grew by 2.76% in 2019, compared to 3.22% in the previous year. Consumer loans increased 15.74% in 2019, more than the 9.21% showed in 2018. Mortgage loans increased 9.92%, less than 12.17% in 2018, and small business loans grew 5.44 % in 2019 from 3.53% in 2018.
The credit institutions level of past-due loans as a percentage of the total loan portfolio, decreased from 4.56% in December 2018 to 4.31% in December 2019. In addition, the coverage, measured by the ratio of allowances for loans losses (principal) to PDLs (overdue 30 days), ended 2019 at 142.57%, compared to 137.31% at the end of 2018.
At the end of 2019 the loans portfolio represented 65.21% of the assets, more than the previous year which was 65.18%. The investments and derivatives transactions, as a percentage of total assets increased from 19.72% at the end of 2018 to 20.09% at the end of 2019. Deposits increased its participation in the total balance of loans from 61.73% in 2018 to 70.50% in 2019.
As of December 31, 2019, credit institutions recorded COP 710.3 trillion in total assets, representing a 7.74% increase compared to previous year. Based on total assets held by Colombian credit institutions, banks had a market share of 95.04% followed by financing companies with 2.56%, financial corporations with 1.86%, and financial cooperatives with 0.54%.
The capital adequacy ratio (Tier 1 + Tier 2) for credit institutions was 15.44% in December 2019 (including banks, financial corporations, financing companies and financial cooperatives), which is well above the minimum legal requirement of 9%. With the effectiveness of Decree 1771 of 2012 and the external circular 20 of 2013 of the Financial Superintendence, a new capital regime for credit institutions was established in order to strengthen the quality of equity of financial institutions to ensure they have the capacity to absorb losses in the development of their activities.
Bancolombia and its Competitors
The following table shows the key profitability, capital adequacy ratios and loan portfolio quality indicators for Bancolombia unconsolidated and its main competitors unconsolidated, based on IFRS information as applicable under Colombian Banking GAAP and published by the SFC.
| | ROE(1) | ROA(2) | Past-due loans/
Total loans | Allowances/
Past-due loans | Capital Adequacy |
| | Dic-19 | Dic-18 | Dic-19 | Dic-18 | Dic-19 | Dic-18 | Dic-19 | Dic-18 | Dic-19 | Dic-18 |
| Bancolombia | 13.0% | 11.5% | 2.0% | 1.7% | 4.2% | 4.5% | 169.1% | 157.2% | 15.4% | 16.0% |
| Banco de Bogotá | 13.1% | 15.5% | 2.7% | 3.1% | 4.1% | 4.2% | 132.7% | 136.6% | 19.1% | 20.7% |
| Davivienda | 11.5% | 11.6% | 1.4% | 1.4% | 4.5% | 4.9% | 128.2% | 110.6% | 14.6% | 15.1% |
| BBVA | 15.1% | 12.6% | 1.1% | 0.9% | 4.1% | 4.6% | 144.3% | 139.6% | 11.6% | 12.4% |
| Banco de Occidente | 10.2% | 9.1% | 1.2% | 1.1% | 4.1% | 4.1% | 127.0% | 127.4% | 12.1% | 13.0% |
| Banco Corpbanca | 3.2% | 0.3% | 0.4% | 0.0% | 5.0% | 4.0% | 122.9% | 152.5% | 14.9% | 14.6% |
| Banco Colpatria | 6.0% | 5.0% | 0.5% | 0.5% | 5.2% | 5.8% | 115.8% | 115.1% | 10.5% | 10.7% |
Source: SFC.
| (1) | ROE is return on average stockholders’ equity. |
| (2) | ROA is return on average assets. |
The following tables illustrate Bancolombia and its main competitor’s market share on an unconsolidated basis with respect to various key products, based on figures published by the SFC for the years ended December 31, 2019 and 2018:
Total Net Loans
Market Share
| Total Net Loans – Market Share (%) | 2019 | 2018 |
| Bancolombia | 25.7% | 26.1% |
| Banco de Bogotá | 12.3% | 12.2% |
| Davivienda | 16.0% | 15.5% |
| BBVA | 10.4% | 10.2% |
| Banco de Occidente | 6.1% | 6.1% |
| Banco Corpbanca | 4.2% | 4.7% |
| Banco Colpatria | 6.0% | 6.2% |
| Others | 19.3% | 19.0% |
____________________________ | | |
| Source: Ratios are calculated by Bancolombia based on figures published by the SFC. |
Checking Accounts
Market Share
| Checking Accounts – Market Share (%) | 2019 | 2018 |
| Bancolombia | 24.0% | 23.4% |
| Banco de Bogotá | 24.1% | 22.8% |
| Davivienda | 9.7% | 10.1% |
| BBVA | 10.8% | 12.9% |
| Banco de Occidente | 9.8% | 10.1% |
| Banco Corpbanca | 2.7% | 2.8% |
| Banco Colpatria | 3.0% | 3.6% |
| Others | 15.9% | 14.3% |
____________________________ | |
| Source: Ratios are calculated by Bancolombia based on figures published by the SFC. |
Time Deposits
Market Share
| Time Deposits – Market Share (%) | 2019 | 2018 |
| Bancolombia | 22.1% | 21.0% |
| Banco de Bogotá | 11.3% | 13.3% |
| Davivienda | 15.8% | 15.2% |
| BBVA | 12.5% | 13.0% |
| Banco de Occidente | 3.9% | 3.7% |
| Banco Corpbanca | 4.9% | 5.8% |
| Banco Colpatria | 8.3% | 7.7% |
| Others | 21.2% | 20.3% |
____________________________ | |
| Source: Ratios are calculated by Bancolombia based on figures published by the SFC. |
Saving Accounts
Market Share
| Saving Accounts – Market Share (%) | 2019 | 2018 |
| Bancolombia | 27.1% | 26.4% |
| Banco de Bogotá | 12.1% | 12.1% |
| Davivienda | 13.3% | 12.7% |
| BBVA | 10.3% | 10.6% |
| Saving Accounts – Market Share (%) | 2019 | 2018 |
| Banco de Occidente | 6.3% | 6.1% |
| Banco Corpbanca | 3.3% | 3.1% |
| Banco Colpatria | 5.7% | 6.1% |
| Others | 21.9% | 22.9% |
____________________________ | |
| Source: Ratios are calculated by Bancolombia based on figures published by the SFC. |
Banco Agrícola and its Competitors
In 2019, Banco Agrícola continued to lead the Salvadorian financial system and ranked first in terms of total assets, loans, deposits, stockholders’ equity and profits. The information presented in the following tables relates to Banco Agrícola and its competitors on a stand-alone basis and was prepared based on publicy available information prepared in accordance with El Salvador accounting standards.
The following table illustrates the market share for the main institutions of the Salvadorian financial system as of and for the year ended on December 31, 2019:
| | Assets | Stockholders` Equity | Loans | Deposits | Profits |
| Banco Agrícola | 27.6% | 28.4% | 28.9% | 28.5% | 51.7% |
| Cuscatlán | 9.7% | 12.2% | 9.2% | 9.5% | 6.9% |
| Davivienda | 15.9% | 14.5% | 16.5% | 14.9% | 13.0% |
| Scotiabank | 11.9% | 12.1% | 11.7% | 12.1% | 7.7% |
| BAC | 15.1% | 13.8% | 15.4% | 15.7% | 14.3% |
| Promerica | 7.2% | 5.3% | 7.1% | 7.5% | 1.3% |
| Others | 12.6% | 13.7% | 11.2% | 11.8% | 5.2% |
____________________________
Sources: ABANSA (Asociación Bancaria Salvadoreña)
The following tables illustrate the market share of Banco Agrícola and its main competitors, based on figures published by the Salvadorian Banking Association (ABANSA), as of December 31, 2019 and 2018:
Total Loans
Market Share
| Total Loans - Market Share (%) | 2019 | 2018 |
| Banco Agrícola | 28.9% | 28.2% |
| Cuscatlán | 9.2% | 8.9% |
| Davivienda | 16.5% | 16.1% |
| Scotiabank | 11.7% | 12.9% |
| BAC | 15.4% | 15.2% |
| Promerica | 7.1% | 7.5% |
| Others | 11.2% | 11.3% |
Checking Accounts
Market Share
| Checking Accounts - Market Share (%) | 2019 | 2018 |
| Banco Agrícola | 23.4% | 21.5% |
| Cuscatlán | 13.0% | 13.3% |
| Davivienda | 12.6% | 11.5% |
| Scotiabank | 8.7% | 8.1% |
| BAC | 22.0% | 24.0% |
| Promerica | 7.4% | 7.2% |
| Others | 12.9% | 14.4% |
Time Deposits
Market Share
| Time Deposits - Market Share (%) | 2019 | 2018 |
| Banco Agrícola | 21.7% | 21.8% |
| Cuscatlán | 6.3% | 6.4% |
| Davivienda | 16.8% | 16.5% |
| Scotiabank | 15.5% | 14.8% |
| BAC | 14.0% | 14.2% |
| Promerica | 9.4% | 10.5% |
| Others | 16.3% | 15.8% |
Saving Accounts
Market Share
| Saving Account - Market Share (%) | 2019 | 2018 |
| Banco Agrícola | 42.4% | 43.1% |
| Cuscatlán | 10.0% | 10.2% |
| Davivienda | 14.9% | 13.9% |
| Scotiabank | 11.4% | 12.2% |
| BAC | 11.2% | 10.7% |
| Promerica | 5.1% | 4.8% |
| Others | 5.0% | 5.0% |
Banistmo and its Competitors
Banistmo is the second largest bank in the Panama with a 10.5% market share in the loans segment. The information presented in the following tables relates to Banistmo and its competitors based on figures published by the Superintendency of Banks of Panama and prepared based on Panama accounting standards.
The following table illustrates the market share for the main institutions of the Panamanian financial system as of and for the year ended in December 31, 2019.
| MARKET SHARE |
| | Assets | Equity | Loans | Deposits | Profits |
| Banistmo | 9.4% | 8.5% | 10.5% | 11.9% | 4.3% |
| Banco General | 15.7% | 11.1% | 16.2% | 21.4% | 26.7% |
| Global Bank | 8.1% | 6.4% | 8.5% | 8.5% | 1.3% |
| Banesco | 4.0% | 3.4% | 4.2% | 5.9% | 1.9% |
| BAC | 8.4% | 23.1% | 5.6% | 7.9% | 28.9% |
| Others | 54.4% | 47.5% | 55.0% | 44.4% | 36.9% |
Source: Banistmo based on data by SBP (Superintendency of Banks of Panama)
The following tables illustrate the market share of Banistmo stand-alone and its main competitors, based on figures published by the Superintendency of Banks of Panama, in accordance with Panamanian banking regulations, for the years ended in December 31, 2019 and 2018:
Total Loans
Market Share
Total Loans - Market Share (%) | 2019 | 2018 |
Banistmo | 10.5% | 10.4% |
Banco General | 16.2% | 16.1% |
Global Bank* | 8.5% | 9.4% |
Banesco | 4.2% | 4.1% |
BAC | 5.6% | 5.7% |
Others | 55.0% | 54.3% |
Source: Banistmo based on data by SBP (Superintendency of Banks of Panama) and prepared based on Panama accounting standards
* Figures for the year 2018 were re-expressed to be comparable to 2019 because of the merger between Global Bank and Banvivienda that took place in 2019.
Saving Accounts
Market Share
Saving Account - Market Share (%) | 2019 | 2018 |
Banistmo | 12.1% | 12.4% |
Banco General | 27.6% | 25.9% |
Global Bank* | 7.8% | 7.6% |
Banesco | 10.6% | 11.4% |
BAC | 3.7% | 3.5% |
Others | 38.2% | 39.2% |
Source: Banistmo based on data by SBP (Superintendency of Banks of Panama) and prepared based on Panama accounting standards
* Figures for the year 2018 were re-expressed to be comparable to 2019 because of the merger between Global Bank and Banvivienda that took place in 2019.
Checking Accounts
Market Share
Checking Accounts - Market Share (%) | 2019 | 2018 |
Banistmo | 11.5% | 12.6% |
Banco General | 26.5% | 26.0% |
Global Bank* | 4.4% | 4.7% |
Banesco | 4.9% | 4.4% |
BAC | 9.9% | 9.2% |
Others | 42.8% | 43.1% |
Source: Banistmo based on data by SBP (Superintendency of Banks of Panama) and prepared based on Panama accounting standards
* Figures for the year 2018 were re-expressed to be comparable to 2019 because of the merger between Global Bank and Banvivienda that took place in 2019.
Time Deposits
Market Share
Time Deposits - Market Share (%) | 2019 | 2018 |
Banistmo | 11.9% | 10.7% |
Banco General | 17.7% | 17.9% |
Global Bank* | 10.0% | 9.4% |
Banesco | 4.5% | 5.0% |
BAC | 8.9% | 8.7% |
Others | 47.0% | 48.3% |
Source: Banistmo based on data by SBP (Superintendency of Banks of Panama) and prepared based on Panama accounting standards
* Figures for the year 2018 were re-expressed to be comparable to 2019 because of the merger between Global Bank and Banvivienda that took place in 2019.
BAM and its Competitors
BAM is the fifth largest bank in the banking system in Guatemala measured by total assets and net loans and the sixth in terms of deposits and stockholders’ equity.
As of December 31, 2019, the Superintendencia de Bancos de Guatemala (SIB) has under its supervision and inspection, 16 banking entities. The information presented in the following tables was prepared in accordance with Guatemalan banking regulations, as reported to the SIB (“Superintendencia de Bancos de Guatemala”).
The following table illustrates the market share for the main institutions of the financial system as of and for the year ended December 31, 2019:
MARKET SHARE |
| Assets | Stockholders’ Equity | Net Loans | Deposits | Profits |
Banco Industrial | 28.0% | 25.0% | 27.9% | 25.6% | 29.9% |
Banrural | 21.4% | 22.3% | 17.5% | 23.4% | 16.8% |
Banco G&T Continental | 15.0% | 13.6% | 11.6% | 14.9% | 8.8% |
BAC-Reformador | 8.6% | 8.7% | 11.8% | 9.2% | 11.4% |
Banco Agromercantil | 8.1% | 7.4% | 11.5% | 7.5% | 5.6% |
Bantrab | 4.1% | 4.3% | 5.2% | 4.4% | 4.9% |
Banco Promerica | 7.3% | 9.0% | 7.0% | 7.2% | 9.0% |
Others* | 28.0% | 25.0% | 27.9% | 25.6% | 29.9% |
*Others. Includes the followings banks: Internacional, Crédito Hipotecario Nacional, Ficohsa Azteca, Inmobiliario, De Antigua, Vivibanco, Citibank, N.A. de Guatemala, Inv. |
Source: Superintendencia de Bancos de Guatemala (SIB).
The following tables illustrate the market share of BAM on a stand-alone basis and its main competitors, based on figures published by the SIB, under Guatemalan banking regulations as of December 31, 2019 and 2018:
Net Loans
Market Share
Net Loans - Market Share (%) | 2019 | 2018 |
Banco Industrial | 27.9% | 28.6% |
Banrural | 17.5% | 16.9% |
BAC-Reformador | 11.8% | 11.2% |
Banco G&T Continental | 11.6% | 13.5% |
Banco Agromercantil | 11.5% | 10.9% |
Bantrab | 7.5% | 7.3% |
Banco Promerica | 5.2% | 5.0% |
Others* | 7.0% | 6.6% |
*Others. Includes the following banks: Internacional, Crédito Hipotecario Nacional, Ficohsa, Azteca, Inmobiliario, De Antigua, Vivibanco, Citibank, N.A. de Guatemala,, Inv.
Source: Superintendencia de Bancos de Guatemala (SIB).
Checking Accounts
Market Share
| Checking Accounts - Market Share (%) | 2019 | 2018 |
| Banco Industrial | 31.4% | 30.7% |
| Banrural | 22.8% | 23.5% |
| Banco G&T Continental | 16.2% | 16.9% |
| BAC-Reformador | 11.5% | 10.8% |
| Banco Agromercantil | 7.0% | 7.0% |
| Banco Promerica | 2.5% | 2.3% |
| Bantrab | 1.4% | 1.3% |
| Others* | 7.2% | 7.5% |
*Others. Includes the following banks: Internacional, Crédito Hipotecario Nacional, Ficohsa, Azteca, Inmobiliario, De Antigua, Vivibanco, Citibank, N.A. de Guatemala, Inv.
Source: Superintendencia de Bancos de Guatemala (SIB).
Time Deposits
Market Share
| Time Deposits - Market Share (%) | 2019 | 2018 |
| Banco Industrial | 21.2% | 20.9% |
| Banrural | 19.2% | 18.1% |
| Bantrab | 15.4% | 16.4% |
| Banco G&T Continental | 10.9% | 12.6% |
| BAC-Reformador | 9.6% | 8.0% |
| Banco Agromercantil | 7.7% | 8.2% |
| Banco Promerica | 7.5% | 6.9% |
| Others* | 8.5% | 8.9% |
*Others. Includes the following banks: Internacional, Crédito Hipotecario Nacional, Ficohsa, Azteca, Inmobiliario, De Antigua, Vivibanco, Citibank, N.A. de Guatemala,, Inv.
Source: Superintendencia de Bancos de Guatemala (SIB).
Saving Accounts
Market Share
| Saving Accounts - Market Share (%) | 2019 | 2018 |
| Banrural | 31.3% | 30.9% |
| Banco Industrial | 24.6% | 25.1% |
| Banco G&T Continental | 20.2% | 21.0% |
| Banco Agromercantil | 8.0% | 7.2% |
| BAC-Reformador | 5.3% | 5.3% |
| Bantrab | 4.1% | 3.6% |
| Banco Promerica | 1.7% | 2.0% |
| Others* | 4.8% | 4.9% |
*Others. Includes the following banks: Internacional, Crédito Hipotecario Nacional, Ficohsa, Azteca, Inmobiliario, De Antigua, Vivibanco, Citibank, N.A. de Guatemala,, Inv.
Source: Superintendencia de Bancos de Guatemala (SIB).
B.8 SUPERVISION AND REGULATION
Colombian Banking Regulators
Pursuant to Colombia’s Constitution, the congress of Colombia has the power to prescribe the general legal framework within which the Government may regulate the financial system. The agencies vested with the authority to regulate the financial system are the board of directors of the Central Bank, the Ministry of Finance and Public Credit (the “Ministry of Finance”), the SFC, the Superintendency of Industry and Commerce (the “SIC”) and the Self-Regulatory Organization (“Autoregulador del Mercado de Valores” or “AMV”).
Central Bank
The Central Bank exercises the customary functions of a central bank, including price stabilization, monetary policy, regulation of currency circulation, regulation of credit, exchange rate monitoring and management of international reserves. Its board of directors is the regulatory authority for monetary, currency exchange and credit policies, and is responsible for the direction of the Central Bank’s duties. The Central Bank also acts as lender of last resort to financial institutions.
Ministry of Finance
One of the functions of the Ministry of Finance is to regulate all aspects of financial and insurance activities. As part of its duties, the Ministry of Finance issues decrees relating to financial matters that may affect banking operations in Colombia. In particular, the Ministry of Finance is responsible for regulations relating to capital adequacy, legal lending limits, authorized operations, disclosure of information and accounting of financial institutions on a high level, which matters are then regulated in detail by the SFC.
Decree 4172 of 2011, established the Unit of Financial Regulation (“URF”), an affiliated unit of the Ministry of Finance. The URF is responsible for preparing and drafting any new financial, credit, securities, foreign exchange and insurance regulation to be issued by the Colombian Government.
Superintendency of Finance
The SFC is the authority responsible for supervising and regulating financial institutions, including commercial banks such as the Bank, finance corporations, financing companies, financial services companies and insurance companies, all of which require prior authorization of the SFC before commencing operations. Regulations issued by the SFC must comply with decrees issued by the Ministry of Finance. The SFC has broad discretionary powers to supervise financial institutions, including the authority to impose fines on financial institutions and their directors and officers for violations of applicable regulations. The SFC can also conduct on-site inspections of Colombian financial institutions.
The SFC is also responsible for monitoring and regulating the market for publicly traded securities in Colombia and for monitoring and supervising securities market participants, including the Colombian Securities Exchange, brokers, dealers, mutual funds and issuers.
Violations of the financial system rules and regulations are subject to administrative and, in some cases, criminal sanctions.
Other Colombian regulators
Self- Regulatory Organization
The AMV is a private entity responsible for the regulation of entities participating in the Colombian capital markets. The AMV may issue mandatory instructions to its members and supervise its members’ compliance and impose sanctions for violations.
All capital market intermediaries, including the Bank, must become members of the AMV and are subject to its regulations.
Superintendency of Industry and Commerce
The SIC is the authority responsible for supervising and regulating competition in several industrial sectors, including financial institutions. The SIC is authorized to initiate administrative proceedings and impose sanctions on banks, including the Bank, whenever the financial entity behaves in a manner considered to be anti-competitive.
Regulatory Framework for Colombian Banking Institutions
The basic regulatory framework of the Colombian financial sector is set forth in Decree 663 of 1993, as modified by among others, Law 510 of 1999, Law 546 of 1999, Law 795 of 2003, Law 1328 of 2009, Law 1870 of 2017, Decree 2555 of 2010, External Resolution 1 of 2018, (exchange control regulation statute), and External Resolution 4 of 2006 issued by the board of directors of the Central Bank, as well as by External Circulars 29 of 2014 (“Circular Básica Jurídica”) and 100 of 1995 (“Circular Básica Contable y Financiera”) issued by the SFC, in each case as amended and supplemented.
Decree 663 of 1993 defines the structure of the Colombian financial system, establishes a set of permitted activities within the system and defines several forms of business entities, including: (i) credit institutions (“establecimientos de crédito”) (which are further categorized into banking institutions, such as the Bank, finance corporations, (“corporaciones financieras”), financing companies(“compañias de financiamiento”) and finance cooperatives (“cooperativas financieras”); (ii) financial services entities (“sociedades de servicios financieros”); (iii) capitalization corporations (“sociedades de capitalización”); (iv) insurance companies (“entidades aseguradoras”); and (v) insurance intermediaries(“intermediarios de Seguros”). Furthermore, Decree 663 of 1993 sets forth (i) the procedure applicable for mergers and acquisitions, spin-offs, and other corporate reorganizations of the aforementioned entities, (ii) specific regulations that apply to the issuance and sale of shares and other securities by such entities, and (iii) certain rules regarding the activities of officers and directors of such institutions, among others. Finally, Decree 663 of 1993 provides that no financial, banking or credit institution may operate in Colombia without the prior approval of the SFC.
Law 510 of 1999 improved the solvency standards and stability of Colombia’s financial institutions by providing rules for their incorporation and regulating permitted investments of credit institutions, insurance companies and investment companies.
Law 546 of 1999 was enacted to regulate the system of long-term home loans.
Law 795 of 2003 broadened the scope of permitted activities for financial institutions, to update regulations with some of the then-latest principles of the Basel Committee and to increase the minimum capital requirements in order to incorporate a financial institution (for more information, see “Minimum Capital Requirements” below). Law 795 of 2003 also provided authority to the SFC to take preventive measures, consisting mainly of preventive interventions with respect to financial institutions whose capital falls below certain thresholds.
Law 1328 of 2009 provided a set of rights and responsibilities for customers of the financial system and a set of obligations for financial institutions in order to minimize disputes. This law also gives foreign banks more flexibility to operate in Colombia through “branches”. Following its adoption, credit institutions were allowed to operate leasing businesses and banks were allowed to extend loans to third parties so that borrowers could acquire control of other companies.
Law 1870 of 2017 (“Law 1870”) implemented the legal framework for the regulation and supervision of financial conglomerates in areas such as regulatory capital, related party transactions, corporate governance principles, conflicts of interest and risk management, among others. According to Law 1870, a financial holding company may acquire that status by either (i) having significant influence over a financial institution or (ii) controlling a financial institution. A financial holding company (1) has significant influence over a financial institution when it directly or indirectly, has more than fifty percent (50%) of the voting capital of the financial institution, excluding from the calculation voting capital held by entities that under their regulations are not allowed to control a financial institution (such as pension funds), and (2) controls a financial institution, when it has (i) more than 50% of the voting capital of the financial institution, (ii) the majority of the votes in the Board of Directors of the financial institution or the right to elect a majority of its members or (iii) a dominant influence over the decisions made by the financial institution as a result of an agreement with the financial institution or its shareholders as established in articles 260 and 261 of the Colombian Code of Commerce. The Government and the SFC must take into consideration the structure, complexity, and individual features of each conglomerate when regulating financial conglomerates. Additionally, regarding risk management and exposure limits, the new requirements applicable to financial conglomerates must consider the requirements that currently apply to financial institutions. Furthermore, when financial institutions fulfill capital adequacy requirements and solvency ratios on their own, authorities may not impose solvency ratios on the financial conglomerate as a whole. The Government has issued several decrees pursuant to its authority under Law 1870, including Decree 774 of 2018, which regulates capital adequacy requirements for financial conglomerates, and Decree 1486 of 2018, which regulates the criteria to determine related parties, risk concentration limits and conflicts of interest.
The law also reinforced the mechanism for the resolution of credit institutions - deposit-taking institutions under Colombian Law - by establishing the concept of the bridge bank, an entity used to facilitate the purchase of assets and transfer of liabilities from failing institutions.
Pursuant to the provisions of Law 1870 of 2017 and the Decrees mentioned above, Grupo de Inversiones Suramericana S.A. has significant influence and, therefore, is the financial holding company of Bancolombia only for the purposes of the financial conglomerates framework. These new regulations require Grupo de Inversiones Suramericana S.A. to: (i) continue strengthening the Bank’s Corporate Governance System as a Financial Conglomerate; (ii) review the risk management and capital adequacy models; and (iii) strengthen the internal control and information reporting systems of the companies that make up the conglomerate under this framework. The SFC has authority to implement applicable regulations and, accordingly, from time to time issues administrative resolutions and circulars. By means of External Circular 029 of 2014, the SFC compiled the rules and regulations applicable to financial institutions and other entities under its supervision. Likewise, by means of External Circular 100 of 1995 (the “Basic Accounting and Financial Circular”), it compiled all accounting rules applicable to financial institutions and its other supervised entities.
This new regulatory framework will not represent a negative impact on Bancolombia’s business and its affiliates. Grupo de Inversiones Suramericana S.A. will determine policies and procedures on the matter as the Decree 1486 establishes.
The SFC have introduced reforms for the implementation of Basel III in the country. For this, it has issued Decrees 1477 of 2018 and 1421 of 2019 (integrated into Decree 2555 of 2010). After the signing of these decrees, it was necessary for the SFC to adjust the instructions and formats introducing new chapters to the SFC's Basic Accounting and Financial Circular and creating a series of reporting formats through the External Circular 20 of 2019. For further details regarding the regulation please see “Item 4.B.8 Supervision and Regulation – Capital adequacy requirements”. In addition to the aforementioned regulations, the SFC issued the External Circular 19 of 2019 in order to continue with the transition process for the full adoption in Colombia of the Basel III standards. For further information please see “Item 4.B.8 Supervision and Regulation - Risk Management Systems”.
Financial institutions are subject to further rules if they engage in additional activities. Law 964 of 2005 (securities market law) regulates securities intermediation activities, which may be performed by banks, and securities offerings. External Resolution 1 of 2018 (foreign exchange regulations), and External Resolution 4 of 2006 issued by the board of directors of the Central Bank, defined the different activities that banks, including the Bank, may perform as foreign exchange market intermediaries, including lending in foreign currencies and investing in foreign securities.
Additionally, Decree 2555 of 2010 compiled regulations that were dispersed in separate decrees, including regulations regarding banking, insurance and securities market activities, capital adequacy requirements, principles relating to the determination, dissemination and publication of rates and prices of products and financial services, and lending activities.
Violations of any of the above statutes and their relevant regulations are subject to administrative sanctions and, in some cases, criminal sanctions.
Key interest rates
Colombian commercial banks, finance corporations and consumer financing companies are required to provide the Central Bank, on a weekly basis, with data regarding the total volume (in pesos) of certificates of deposit issued during the prior week and the average interest rates paid for certificates of deposit with maturities of 90 days. Based on such reports, the Central Bank computes the DTF, which is published at the beginning of the following week, for use in calculating interest rates payable by financial institutions. Forthe week of April 27, 2020, the DTF was 4.66%.
Article 884 of the Colombian Commercial Code provides for a limit on the amount of interest that may be charged in commercial transactions. The limit is 1.5 times the current banking interest rate, or interés bancario corriente, certified and calculated by the SFC as the average rate of interest ordinarily charged by banks for loans made during a specified period. The current banking interest rate for small business loans and for all other loans is certified by the SFC. As of December 31, 2019, the banking interest rate for small business loans was 36.56% and for all other loans was 18.91%.
Capital adequacy requirements
Capital adequacy requirements for Colombian financial institutions (as set forth in Decree 2555 of 2010, as amended) are based on applicable Basel Committee standards. Decree 1477 of 2018 (as amended by Decree 1421 of 2019) introduced into the Colombian banking regulation several Basel III reforms, mainly relating to the (i) implementation of capital buffers, (ii) alignment with Basel III solvency ratio definitions, (iii) quality of the regulatory capital base and (iv) update of the measurement of the Risk Weighted Assets and (v) the alignment of the standardized approach for credit risk. This regulation establishes a gradual implementation plan beginning in 2021 and ending in 2024 for requirements regarding solvency ratios and capital buffers, as further established in Decree 1421 of 2019. Recently, the SFC issued External Circular 020 of 2019 which defines the applicability of conditions of Decree 1477 of 2018 in relation to capital adequacy requirements for credit institutions and information reporting to the SFC.
Some of the highlights of this regulation are as follows:
| ● | The technical capital (“Technical Capital” ) is calculated as the sum of Common Equity Tier 1 One Capital (the “patrimonio básico ordinario”),the Additional Tier One Capital (“patrimonio básico adicional”)and the Tier Two Capital (“patrimonio adicional”). |
| ● | Revised criteria for debt and equity instruments to be considered Common Equity Tier One Capital , Additional Tier One Capital, and Tier Two Capital were established. Additionally, the SFC must review whether a given instrument adequately complies with these criteria in order for an instrument to be considered Tier One Capital or Tier Two Capital, upon request of the issuer. Debt and equity instruments that have not been classified by the SFC as Tier One Capital or Tier Two Capital shall not be considered Tier One Capital or Tier two Capital for purposes of capital adequacy requirements. |
| ● | The Capital Adequacy Ratio is set at a minimum of 9% of the financial institution’s total risk-weighted assets; however, each entity must comply with: (i) a minimum basic solvency ratio of 4.5% (which is defined as the ordinary basic capital after deductions divided by the financial institution’s total risk-weighted assets and off-balance sheet items); (ii) a minimum additional basic solvency ratio (which is defined as the sum of Common Equity Tier One Capital after deductions and Additional Tier One Capital, divided by the financial institution’s total risk-weighted assets and off-balance sheet items) of 4.875% beginning on January 1, 2021, increasing gradually up to 6% as of January 1, 2024; (iii) a capital conservation buffer (which is defined as the Common Equity Tier One Capital after deductions divided by the financial institution’s total risk-weighted assets and off-balance sheet items) of 0.375% beginning on January 1, 2021, increasing gradually up to 1.5% as of January 1, 2024; (iv) a systemically important institution buffer (which is defined as the Common Equity Tier One after deductions divided by the financial institution’s total risk-weighted assets and off-balance sheet items) of 0.25% beginning on January 1, 2021, increasing gradually uo to 1% as o January 1, 2024; and (v) a combined buffer equivalent to the sum of the aforementioned buffers as of January 1, 2024. These ratios apply to credit institutions individually and on a consolidated basis. Credit institutions includes banks (including Bancolombia.), financial corporations, and financing companies. |
| ● | Credit establishments must comply with a minimum leverage ratio of 3%, which is defined as the sum of the Common Equity Tier OneCapital after deductions and the Additional Tier One Capital, divided by the leverage value. The leverage value is the sum of all net assets, the net exposures in all repo, simultaneous transactions and temporary transfer of securities, the credit exposures in all derivative instruments, and the exposure value of all contingencies. |
| ● | Decree 415 of 2018, requires that as of the year 2019, non-depository financial institutions, such as asset managers and fiduciary entities under Colombian law, comply with a 9% minimum solvency ratio on an individual basis. |
| ● | Decree 1421 of 2019, introduced minimum capital requirements for operational risk to credit establishments adopting the Basel III standardised approach. This new capital requirement will be determined by the product of the Business Indicator (“indicador de negocio”), the Operational Risk Coefficient (coeficiente de riesgo operacional) and the Internal Loss Multiplier (indicador de pérdida interna). The operational risk coefficient will be 12% of the Business Indicator, but if the Business Indicator exceeds COP 3 billion, the coefficient will be 15% for the exceeded amount. Each entity must comply with the requirement as of January 1, 2021. |
In 2014, the Ministry of Finance issued Decree 1648 of 2014 and Decree 2392 of 2015 establishing criteria for hybrid instruments to be considered additional basic capital (Additional Tier 1).
As of December 31, 2019, the Bank’s capital adequacy ratio was 12.82%, exceeding the requirements of the Colombian government and the SFC by 382 basis points. As of December 31, 2018, the Bank’s capital adequacy ratio was 13.47%.
For more information, see “Item 5. Operating and Financial Review and Prospects - B1 Liquidity and Funding. Capital Adequacy.”
The minimum capital requirement for banks on an unconsolidated basis is established in Article 80 of Decree 633 of 1993. The minimum capital requirement for banks, including Bancolombia S.A., for 2019 is COP 96,813 million. Failure to meet such requirement can result in the taking of possession (toma de posesión) of the Bank by the SFC (see Item 4. “Information on the Company – B. Business Overview – B.8 –Supervision and Regulation – Bankruptcy Considerations”).
Capital Investment Limit
For entities incorporated in Colombia, all investments in subsidiaries and other authorized capital investments, excluding those made in order to abide by legal requirements, may not exceed 100% of the total aggregate capital, equity reserves and the equity re-adjustment account of the respective bank, financial corporation or commercial finance company excluding unadjusted fixed assets and including deductions for accumulated losses.
Mandatory Investments
Central Bank regulations require financial institutions, including the Bank, to hold minimum mandatory investments in debt instruments issued by Fondo para el Financiamiento del Sector Agropecuario (“Finagro”), a Colombian public financial institution that finances production and rural activities to support the agricultural sector. The amount of these mandatory investments is calculated by applying a fixed percentage (ranging from 4.3% to 5.8%, depending on the type of liability) to the quarterly average of the end of day balances of certain liabilities, primarily, deposits and short-term debt. The investment balance is computed at the end of each quarter. Any required adjustment (due to a change in the quarterly average between periods) results in the purchase of additional securities or may result in redemption by Finagro at of securities in excess of the requirement. The purchase of additional securities takes place during the month following the date as of which the computation was performed.
Foreign Currency Position Requirements
According to External Resolution 1 of 2018 issued by the board of directors of the Central Bank as amended or supplemented (“Resolution 1 of 2018”), a financial institution’s foreign currency position (posición propia en moneda extranjera) is the difference between such institution’s foreign currency-denominated assets and liabilities (including any off-balance sheet items), actual or contingent, including those that may be converted into Colombian legal currency.
Additionally, in the case of foreign exchange market intermediaries that consolidate financial statements and have controlled foreign investments, such as the Bank, the foreign exchange market intermediary shall exclude from its foreign currency position: (i) the value of controlled foreign investments, and (ii) the value of derivatives and other liabilities designated by the intermediary as hedging instruments for the controlled foreign investments.
Resolution 1 of 2018 provides that the average of a bank’s foreign currency position for three business days cannot exceed the equivalent in Colombian pesos of 20% of the bank’s technical capital. Foreign exchange market intermediaries such as the Bank are permitted to hold a three business days’ average negative foreign currency position not exceeding the equivalent in foreign currency of 5% of its technical capital (with penalties being payable after the first business day).
Resolution 1 of 2018 also defines the foreign currency position in cash (posición propia de contado en moneda extranjera) as the difference between all foreign currency-denominated assets and liabilities.
Finally, Resolution 1 of 2018 requires banks to calculate a gross position of leverage (posición bruta de apalancamiento) as it relates to its foreign currency position. Gross position of leverage is defined as (i) the value of term contracts denominated in foreign currency, plus (ii) the value of transactions denominated in foreign currency to be settled in a term equal or greater than one day in cash, plus (iii) the value of the exchange rate risk exposure associated with exchange rate options and derivatives.
Reserve Requirements
Credit institutions are required to satisfy reserve requirements with respect to deposits and other cash demands which are held by the Central Bank in the form of cash deposits. According to Resolution 11 of 2008 issued by the board of directors of the Central Bank, as amended, the reserve requirements for Colombian banks are measured bi-weekly and the amount depends on the class of deposits.
Credit institutions must maintain reserves of 11% over private demand deposits, government demand deposits, other deposits and liabilities and savings deposits; of 4.5% over term deposits with maturities fewer than 540 days and 0% over term deposits with maturities equal to or more than 540 days.
Foreign Currency Loans
According to External Resolution 1 of 2018, residents of Colombia may obtain foreign currency loans from foreign residents, and from Colombian foreign exchange market intermediaries (such as the Bank) or by placing debt instruments abroad. Foreign currency loans must be either disbursed through a foreign exchange intermediary or deposited in special purpose offshore accounts.
Colombian residents who borrow funds in foreign currency may be required to post with the Central Bank non-interest bearing deposits for a specified term, although currently the size of the required deposit is currently zero. Such deposits would not be required in certain cases, including foreign currency loans aimed at financing Colombian investments abroad, or for short-term exportation loans, provided that these loans are disbursed against the funds of Banco de Comercio Exterior – Bancoldex.
External Resolution 1 of 2018 sets forth a number of restrictions and limitations as to the use of proceeds in the case of foreign currency loans obtained by Colombian foreign exchange market intermediaries for the purpose of avoiding the deposit requirement described above. Such foreign currency loans may be used, among others, for lending activities in a foreign currency with a tenor equal to, or shorter than, the tenor of the foreign financing, provided that such foreign currency loans are hedged with a derivative in foreign currency that has a tenor equal to the term between the disbursement and the final maturity of the loan.
Finally, pursuant to Law 9 of 1991, the board of directors of the Central Bank is entitled to impose conditions and limitations on the incurrence of foreign currency indebtedness, as an exchange control policy, in order to avoid pressure in the currency exchange market.
Non-Performing Loan Allowance
The SFC maintains rules on non-performing loan allowances for financial institutions. These rules apply to Bancolombia’s financial statements on a stand-alone basis for Colombian regulatory purposes. Non-performing loan allowances in the Consolidated Financial Statements are calculated according to IFRS.
Lending Activities
Decree 2555 of 2010, as amended, sets forth the legal lending limits, which provide for the maximum amounts that a financial institution may lend to a single borrower (including for this purpose all related fees, expenses and charges). These maximum amounts may not exceed 10% of a bank’s technical capital. However, there are several circumstances under which the limit may be raised. In general, the limit is raised to 25% when amounts lent above 5% of technical capital are secured by guarantees that comply with the financial guidelines provided in Decree 2555 of 2010, as amended.
Also, a bank may not make loans to any shareholder that holds directly more than 10% of its capital stock for one year after such shareholder reaches the 10% threshold. In no event may a loan to a shareholder holding directly or indirectly 20% or more of the Bank’s capital stock exceed 20% of the Bank’s technical capital. In addition, no loan to a single financial institution may exceed 30% of the Bank’s technical capital, with the exception of loans funded by Colombian development banks which are not subject to such limit.
Decree 2555 of 2010 also sets a maximum limit of 30% of the Bank’s technical capital for single-party risk, the calculation of which includes loans, leasing operations and equity and debt investments.
The Central Bank also has the authority to establish maximum limits on the interest rates that commercial banks and other financial institutions may charge on loans. However, interest rates must also be consistent with market terms with a maximum limit certified by the SFC.
Ownership and Management Restrictions
The Bank is organized as a stock company (sociedad anónima). Its corporate existence is subject to the rules applicable to commercial companies, principally the Colombian Commercial Code which requires stock companies (such as the Bank) to have a minimum of five shareholders at all times and provides that no single shareholder may own 95% or more of the Bank’s subscribed capital stock. Article 262 of the Colombian Commerce Code prohibits the Bank’s subsidiaries from acquiring stock of the Bank.
Pursuant to Decree 663 of 1993, as amended, any transaction resulting in an individual or entity holding 10% or more of the outstanding shares of any Colombian financial institution, including, in the case of the Bank, transactions resulting in holding ADRs representing 10% or more of the subscribed capital stock of the Bank, is subject to the prior authorization of the SFC. For that purpose, the SFC must evaluate the proposed transaction based on the criteria and guidelines specified in Decree 663 of 1993. Transactions entered into without the prior approval of the SFC are null and void and cannot be recorded in the institution’s stock ledger. These restrictions apply equally to Colombian and foreign investors.
Bankruptcy Considerations
Colombian banks and other financial institutions are not subject to the laws and regulations that generally govern the insolvency, restructuring and liquidation of industrial and commercial companies, but rather are subject to special rules, the most important details of which are summarized below.
Pursuant to Colombian banking law, the SFC has the power to intervene in the operations of a bank in order to prevent it from, or to control and reduce the effects of, a bank failure. The SFC also conducts periodic visits to financial institutions and may impose capital or solvency obligations on financial institutions without taking control of such financial institutions.
The SFC may intervene in a bank’s business: (i) prior to the liquidation of the bank, in order to prevent the bank from entering into a state where the SFC would need to take possession by taking one of the following recovery measures (institutos de salvamento): (a) submitting the bank to a special supervision regime; (b) issuing a mandatory order to recapitalize the bank; (c) placing the bank under the management of another authorized financial institution, acting as trustee; (d) ordering the transfer of all or part of the assets, liabilities and contracts of the bank to another financial institution; (e) ordering the bank to merge with one or more financial institutions that consent to the merger; (f) ordering the adoption of a recovery plan by the bank pursuant to guidelines approved by the government; (g) ordering the exclusion of certain assets and liabilities by requiring the transfer of such assets and liabilities to another institution designated by the SFC; or (h) ordering the progressive unwinding (desmonte progresivo) of the operations of the bank; or (ii) at any time, by taking possession of the bank to either administer the bank or order its liquidation, depending on how critical the situation is found to be by the SFC.
The following grounds for a taking of possession are considered to be “automatic” in the sense that, if the SFC discovers their existence, the SFC must step in and take over the financial institution: (i) if the financial institution’s technical capital falls below 40% of the legal minimum; or (ii) upon the expiration of the term of any then-current recovery plans or the non-fulfillment of the goals set forth in such plans.
Additionally, and subject to the approval of the Ministry of Finance and the opinion of its advisory council (Consejo Asesor del Superintendente), the SFC may, at its discretion, initiate intervention procedures against a bank under the following circumstances: (i) suspension of payments; (ii) failure to pay deposits; (iii) refusal to submit its files, accounts and supporting documentation for inspection by the SFC; (iv) refusal to be interrogated under oath regarding its business; (v) repeated failure to comply with orders and instructions from the SFC; (vi) repeated violations of applicable laws and regulations or of the bank’s by-laws; (vii) unauthorized or fraudulent management of the bank’s business; (viii) reduction of the bank’s net worth below 50% of its subscribed capital; (ix) existence of serious inconsistencies in the information provided to the SFC that, at its discretion, impedes the SFC to accurately understand the situation of the bank; (x) failure to comply with the minimum capital requirements set forth in Decree 663 of 1993; (xi) failure to comply with the recovery plans that were adopted by the bank; (xii) failure to comply with the order of exclusion of certain assets and liabilities to another institution designated by the SFC; and (xiii) failure to comply with the order of progressive unwinding (desmonte progresivo) of the operations of the bank.
Within two months (extendible for two additional months) from the date in which the SFC takes possession of a bank, the SFC must decide which measures to adopt. The decision is to be made with the purpose of permitting depositors, creditors and investors to obtain full or partial payment of their credits and must be submitted to the Fondo de Garantías de Instituciones Financieras’ (Fogafin) previous opinion.
Upon the taking of possession of a bank, depending on the bank’s financial situation and the reasons that gave rise to such measure, the SFC may (but is not required to) order the bank to suspend payments to its creditors. The SFC has the power to determine that such suspension will affect all of the obligations of the bank, or only certain types of obligations or even obligations up to or in excess of a specified amount.
As a result of a taking of possession, the SFC must appoint as special agent the person or entity designated by Fogafin to administer the affairs of the bank while such process lasts and until it is decided whether to liquidate the bank.
As part of its duties following the taking of possession by the SFC, Fogafin must provide the SFC with the plan to be followed by the special agent in order to meet the goals set for the fulfillment of the measures that may have been adopted. If the underlying problems that gave rise to the taking of possession of the bank are not resolved within a term not to exceed two years, the SFC must order the liquidation of the bank.
During a taking of possession (which period ends when the liquidation process begins), Colombian banking laws prevent any creditor of the bank from: (i) initiating any procedure for the collection of any amount owed by the bank; (ii) enforcing any judicial decision rendered against the bank to secure payment of any of its obligations; (iii) constituting a lien or attachment over any of the assets of the bank to secure payment of any of its obligations; or (iv) making any payment, advance or compensation or assuming any obligation on behalf of the bank, with the funds or assets that may belong to it and are held by third parties, except for payments that are made by way of set-off between regulated entities of the Colombian financial and insurance systems.
In the event that the bank is liquidated, the SFC must, among other measures, provide that all term obligations owed by the bank are due and payable as of the date when the order to liquidate becomes effective.
During the liquidation process bank deposits and certain other types of saving instruments will be excluded from the liquidation process and paid prior to any other liabilities. The remainder of resources will be distributed among creditors whose claims are recognized in accordance with the following rank: (i) the first class of claims includes the court expenses incurred in the interest of all creditors, wages and other obligations related with employment contracts and tax authorities’ credits regarding national and local taxes; (ii) the second class of claims comprises the claims secured by a security interest on movable assets; (iii) the third class of claims includes the claims secured by real estate collateral, such as mortgages; (iv) the fourth class of claims contains some other claims of the tax authorities against the debtor that are not included in the first class of claims and claims of suppliers of raw materials and input to the debtor and (v) finally, the fifth class of claims includes all other credits without any priority or privilege, provided, however, that among credits of the fifth class, subordinated debt will be ranked junior to the external liabilities (pasivos externos) and senior only to capital stock. Each category of creditors will collect in the order indicated above, whereby distributions in one category will be subject to the full satisfaction of claims in the prior category.
Deposit insurance—Troubled Financial Institutions
Subject to specific limitations, Fogafin is authorized to provide equity (whether or not reducing the par value of the recipient’s shares) and/or secured credits to troubled financial institutions, and to insure deposits of commercial banks and certain other financial institutions.
To protect the customers of commercial banks and certain financial institutions, Resolution 1 of 2012 of the board of directors of Fogafin, as amended, requires mandatory deposit insurance. Banks must pay an annual premium of 0.30% of total funds received on saving accounts, checking accounts, certificates of deposit and other deposits, which is paid in four quarterly installments. If a bank is liquidated, the deposit insurance will cover the funds deposited by an individual or corporation with such bank up to a maximum of COP 50 million regardless of the number of accounts held.
Risk Management Systems
Commercial banks must have risk administration systems to meet the SFC minimum standards for compliance and to avoid and mitigate the following risks: (i) credit; (ii) liquidity; (iii) market; (iv) operational; (v) money laundering and terrorism; and (vi) counterparty.
Commercial banks generally have several risk measurement methods, including the risk weighted assets measurement which is calculated according to weight percentages assigned to different types of assets, which may be 0%, 20%, 50% and 100%. There are some exceptions in which the weight percentage is higher and is calculated based on the associated risk perception of the evaluated asset. Provisions, which are calculated on a monthly basis, are another risk measurement method. For commercial and consumer loans, the SFC issues a provision reference model, according to which the probability of default depends on an assigned rating (AA, A, BB, B, CC and default). For mortgage loans and small business loans, provisions are calculated based on ratings (A, B, C, D and E) assigned depending on the time elapsed since the client’s default.
With respect to market risks, commercial banks must follow the provisions of the Basic Accounting Circular, which defines criteria and procedures for measuring a bank’s exposure to interest rate, foreign exchange, and market risks. Under such regulations, banks must submit to the SFC information on the net present value, duration, and interest rate of its assets, liabilities, and derivative positions. Colombian banks are required to calculate, for each position on the statement of financial position, a volatility rate and a parametric value at risk (“VaR”), which is calculated based on net present value, modified duration and a risk factor computed in terms of a basis points change. Each risk factor is calculated and provided by the SFC.
With respect to liquidity risk, financial entities must meet a liquidity coverage test that ensures their ability to hold liquid assets sufficient to cover potential net cash outflows for a period of 30 days. Net cash outflows for this purpose are contractual maturities of assets (interbank borrowings, financial assets investments, loans and advances to customers, derivative financial instruments) minus contractual maturities of liabilities (demand deposits, time deposits, interbank deposits borrowings from other financial institutions, debt instruments, derivative financial instruments) occurring within a period of 30 days. For purposes of this calculation, liabilities do not include projections of future transactions. The maturity of the loan portfolio is affected by the historical default indicator and the maturity of deposits is modeled according to the regulation.
With respect to operational risk, commercial banks must assess, according to principles provided by the Basic Accounting Circular, each of their business lines (such as corporate finance, purchases and sales of securities, commercial banking, asset management, etc.) in order to record the risk events that may occur and result in fraud, technology problems, legal and reputational problems and problems associated with labor relations at the bank.
In order to implement Basel III liquidity standards and complement the measure and management of short-term liquidity risk, the SFC issued the External Circular 019 of 2019 which introduced the Net Stable Funding Ratio (Coeficiente de Fondeo Estable Neto or “CFEN”). The CFEN will require credit institutions, such as Bancolombia S.A., to maintain a stable funding profile in relation to the composition of their assets. The CFEN is a ratio that seeks to limit excessive dependency on unreliable financing sources for strategic assets which are often illiquid. The way this ratio works is assigning a value to each deposit by type of investor, establishing a percentage value for each deposit. The implementation of this new ratio intends to aid companies in maintaining an appropriate stable funding profile, in relation to its assets. The CFEN is defined as the amount of Available Stable Funding, includes equity and liabilities that will remain with the credit institution for more than one year. This ratio should be equal to at least 100% on an ongoing basis (Fondeo Estable Disponible or “FED”) relative to the amount of Required Stable Funding (Fondeo Estable Requerido). The ratio will start being reported on March 31, 2020.
Anti-Money Laundering Provisions
The regulatory framework to prevent and control money laundering is contained in, among others, Decree 663 of 1993 and External Circular 029 of 2014 issued by the SFC, as well as Law 599 of 2000, and the Colombian Criminal Code, as amended.
Colombian laws adopt the latest guidelines related to anti-money laundering and other terrorist activities established by the Financial Action Task Force on Money Laundering (“FATF”). Colombia, as a member of the GAFI-SUD (a FATF-style regional body), follows all of FATF’s 40 recommendations and eight special recommendations. External Circular 029 of 2014 requires the implementation by financial institutions of a system of controls for money laundering and terrorism financing. These rules emphasize “know your customer” policies and knowledge of customers and markets, and other customer identification and monitoring processes that include screening against international lists.
Financial institutions must cooperate with the appropriate authorities to prevent and control money laundering and terrorism financing. Finally, the Colombian Criminal Code introduced criminal rules and regulations to prevent, control, detect, eliminate and adjudicate all matters related to financing terrorism and money laundering, including the omission of reports on cash transactions, mobilization or storage of cash, and the lack of controls.
Regulatory Framework for Subsidiaries that are Non-Participants in the Financial Sector
All of Bancolombia’s Colombian subsidiaries that do not provide financial services are governed by the laws and regulations embodied in the Colombian Civil Code and the Colombian Commercial Code as well as any regulations issued by the Colombian Superintendency of Industry and Commerce and the Superintendency of Corporations or any other type of special regulations that may be applicable to the commercial and industrial activities carried out by said subsidiaries.
International regulations applicable to Bancolombia and its subsidiaries
FATCA
FATCA, a U.S. federal tax law enacted in 2010, imposes a 30% withholding tax on ‘withholdable payments’ made to non-U.S. financial institutions that do not participate in the FATCA program or that fail (or, in some cases, that have affiliates in which they hold an interest of more than 50% and which are also non-U.S. financial institutions that fail) to provide certain information regarding their U.S. accountholders and/or certain U.S. investors (such U.S. accountholders and U.S. investors, “U.S. accountholders”) to the IRS.
Among the countries where Bancolombia operates, Colombia, the Cayman Islands, and Panama have signed an IGA Model 1. In addition, certain subsidiaries of Bancolombia located in other countries have transmitted directly to the IRS the information required pursuant to FATCA, since they have not entered into an IGA.
CRS
The CRS, approved by the OECD Council in 2014, is applicable to signatory countries of the Multilateral Competent Authority Agreement (“MCAA”) and requires signatory countries to obtain information from their financial institutions and automatically exchange that information with other jurisdictions on an annual basis. The CRS defines (i) which financial institutions are required to report; (ii) the types of accounts covered; and (iii) the due diligence procedures that financial institutions must follow to identify the reporting information.
Among the countries where Bancolombia operates, Colombia, Panamá and Cayman Island, have entered into the MCAA.
Compliance with the terms the international conventions signed for the exchange of information under CRS, the laws or any other regulations enforced in the relevant jurisdictions may increase Bancolombia´s compliance costs.
Financial Regulation in Panama
The banking business in Panama is regulated by the Law Decree 9 of 1998, subsequently amended by Law Decree 2 of 2008. In accordance with the Law Decree, as amended, the Superintendency of Banks of the Republic of Panama, as the banking supervisor, has the power to issue agreements and resolutions to regulate the banking system. These regulations are mainly focused on matters such as licensing of banks, corporate governance, banking supervision (consolidated and individual or sub-consolidated), capital requirements, capital adequacy, liquidity requirements, risk management (credit, market, liquidity, country, asset and liability, operational, information technology, electronic banking), external audit, on-site inspections, reporting, compliance, change of control, mergers and acquisitions, confidentiality, money laundering, voluntary wind up, administrative and operational control, reorganization, bankruptcy, penalties, customers protection and dispute resolution.
In order to implement Basel III capital standards, the Superintendency of Banks of the Republic of Panama issued in January 2015 an agreement on Capital Adequacy. This agreement sets forth the new composition of a banking institution’s capital base, as well as the new capital adequacy ratio, including tier 1 core capital ratio and tier 1 capital ratio, all consistent with Basel III standards. This agreement became effective in June 2016 and as of January 1, 2019 the new standards are fully applicable. With respect to liquidity, banks operating under a general banking license, or General License Banks, are currently required to maintain 30% of their global deposits in liquid assets (which include short-term loans to other banks and other liquid assets) of the type prescribed by the Superintendency of Banks. Additionally, General License Banks are required to maintain assets in Panama of no less than 60% of their local deposits or any other percentage fixed by the Superintendency of Banks. Under the Banking Law, deposits from central banks and other similar depositories of the international reserves of sovereign states are immune from attachment or seizure proceedings. However, in 2018, the Superintendency of Banks of the Republic of Panama, moving forward with the implementation of Basel III liquidity standards, issued an agreement on Liquidity Coverage Ratio (LCR), also requiring General License Banks to maintain high quality liquid assets in relation to its short-term net cash outflows. Daily compliance with the LCR (High Quality Liquid Assets as a percentage of net cash outflows) are being implemented progressively, beginning on December 2018 with a compliance percentage of 25%, until achieving a 100% compliance percentage on 2022.
The Superintendency has also issued regulations, consistent with Basel III standards, regarding capital requirements for market risk on the trading book; and regulations to improve country risk management and operational risk management, as well as governance and controls regarding investment in securities.
Panamanian regulations also require all financial institutions to maintain a legal reserve for certain obligations. The Superintendency of Banks may require additional marginal reserves. The exact level and method of calculation of these reserve requirements is set by the Superintendency of Banks.
As for credit risk, in March 2016, the Superintendency of Banks of the Republic of Panamá issued Accord No.3-2016, which sets forth new risk weights applicable to on and off-balance sheet credit exposures, which are more risk sensitive in line with Basel II. The Accord introduces the treatment of counterparty exposures in derivatives transactions, as well as credit risk mitigation techniques, such as the treatment of financial collaterals.
In Panama, banks are prohibited from granting, directly or indirectly, to any individual or legal person, including any entity that is part of the economic group of a bank, any loan or credit facility, guarantee or any other obligation (other than credit facilities fully secured by deposits in the bank) (“Credit Facilities”) in favor of said person exceeding at any time, individually or jointly, 25% of the total regulatory capital of the bank. Obligations to related parties (as such term is defined in the applicable regulations) that exceed (i) 5% of its total capital, in the case of unsecured transactions, and (ii) 10% of its total capital, in the case of secured transactions (other than loans secured by deposits in the bank), are prohibited.
Banks and banking groups (defined as the holding company and all direct and indirect subsidiaries of the holding company) are subject to inspection by the Superintendency of Banks, which must take place at least once every two years. The Superintendency of Banks is empowered to request from any bank or any company that belongs to the economic group of which a bank in Panama is a member, the documents and reports pertaining to its operations and activities. The Superintendency of Banks can assume the administrative and operating control of a bank, including possession of its assets and seizure of its management in order to defend the best interest of the bank’s depositors and creditors, under any of the following grounds: (i) at the request of the bank; (ii) if the bank may not continue operations without endangering the interests of the depositors; (iii) as a consequence of the evaluation of an advisor’s report; (iv) noncompliance with the measures ordered by the Superintendency of Banks; (v) if the bank carries out its operations in an illegal, negligent or fraudulent manner; (vi) if the bank has suspended payment of its obligations; and (vii) if the Superintendency of Banks confirms that capital adequacy, solvency or liquidity of the bank has deteriorated in such a way as to require the Superintendency of Banks intervention. Upon expiration of the period of administrative control, the Superintendent will decide whether to proceed with the reorganization of the bank, the compulsory liquidation of the bank or the return of administrative and operating control to the directors or legal representatives of the bank, as the case may be.
The Superintendency of Banks of the Republic of Panama is also in charge of the supervision and oversight of the trust business, regulated by Law 1 of 1984, which set forth aspects such as minimum requirements of trust agreements, characteristics of trusts, rights and responsibilities of grantors, trustees and beneficiaries.
In 2017, the Panamanian congress issued Law No.21 of 2017, which strengthens the oversight and regulation capabilities of the Superintendency of Banks, regarding the trust business. The Law imposes higher standards and provides for more detailed supervision, with respect to matters such as licensing, prudential regulation, corporate governance, reporting and customer protection, amongst others.
Other Regulations in Panama
Securities market activities in Panama are subject to the supervision, control and oversight of the Superintendency of the Securities Market. These activities are primarily regulated by Law Decree 1 of 1999, as amended by several laws, which established important changes in order to strengthen the regulatory framework of the Panamanian securities market and increase investors’ confidence. Among the most important changes introduced by these recent amendments are the following:
1. The establishment of a coordination and cooperation system between the financial supervisors. This system also enables a more comprehensive supervision of financial conglomerates operating in multiple areas of the financial industry.
2. The establishment of the Superintendency of the Securities Market, as the supervising entity replacing the previous National Securities Commission.
3. The authority given to the Superintendency of the Securities Market to carry the consolidated supervision, as home supervisor, of intermediaries having agencies abroad, and to enter into cooperation agreements with foreign supervisors to facilitate the consolidated supervision.
4. The regulation of foreign currency exchange as a securities activity and the regulation of certain actors of the securities market, such as securities price suppliers, risk rating agencies and Administrative Service Suppliers of the securities market.
5. The introduction of provisions regarding clearing and settlement of securities and financial instruments, which will bring more stability and security to transactions.
6. The creation of new participants to promote over-the-counter transactions, such as entities acting as central counterparties, and infrastructure providers for the over-the-counter market.
The principal aspects of the securities business covered by the Law-Decree 1 of 1999 as amended, and the agreements and resolutions issued by the Superintendency of the Securities Market of the Republic of Panama are (i) licensing requirements of securities brokers, investment advisors, fund administrators and self-regulated organizations, (ii) registration requirements of risk rating agencies, securities price suppliers, securities, public offerings, funds and administrative service suppliers of the securities market, (iii) authorization for requesting voting powers regarding registered securities, (iv) notification requirements of public offerings for the acquisition of registered shares, (v) options, futures contracts and derivatives, (vi) custody, clearing and settlement of securities, (vii) penalization procedures and penalties, (viii) voluntary wind up, reorganization and bankruptcy of securities brokers, self-regulated organizations, funds, and fund administrators, (ix) reporting of issuers of registered securities, securities brokers, investment advisors, funds, fund administrators, self-regulated organization and other registered entities, (x) on-site inspection of securities brokers, investment advisors, self-regulated organizations, funds, fund administrators, administrative service suppliers of the securities market, securities price suppliers and rating agencies, (xi) capital requirements, liquidity requirements, risk assessment, confidentiality, conflict of interest, suitability, compliance and money laundering of securities brokers and (xii) communication of events of importance by issuers of registered securities.
Panama has also enacted a series of laws in order to prevent, detect and punish money-laundering activities. In Panama, anti-money laundering requirements are primarily regulated by (i) Executive Decree No. 136 of June 9, 1995, which created a Financial Analysis Unit (“UAF”) for the Prevention of Money Laundering, and (ii) Law No. 23 of April 27, 2015 (“Law 23”), regulated by Executive Decree No. 363 of August 13, 2015, whereby banks and trust corporations, among other financial institutions, are required to perform their operations with due diligence and due care conducive to preventing said operations, to be performed with funds, or over funds, generated from activities related to money laundering.
Law 23 and Accord No. 7- of 2015 provide that the following entities are deemed to be “supervised entities” for purposes of money laundering, financing of terrorism or any other illicit activity: (i) banks; (ii) bank groups; (iii) trust corporations; (iv) leasing companies; (v) factoring companies; (vi) credit, debit or pre-paid card processing entities; (vii) companies engaged in remittances or wire transfers; and (viii) companies that provide any other service related to trust companies. These entities must take necessary measures to prevent their operations and/or transactions from being used for money laundering, financing of terrorism or any other illicit activity, including tax evation. Non-compliance with Law 23, or those dictated by the pertinent authorities of supervision of each activity for which there is no specific sanction established, is subject to fines ranging from US$5,000 to US$1,000,000. Recently, following recommendations, from the Financial Action Task Force (FATF)Law No.70 of 2019 was enacted, to include tax evasion as an offense precedent to money laundering.
Panama has also moved forward with the adoption of international standards on transparency and cooperation on tax matters, through the approval of the Inter-Governmental Agreement for the implementation of FATCA in 2016, the commitment regarding the automatic exchange of information on a bilateral basis and under the Common Reporting Standard, beginning in September, 2018, and the ratification of the Multilateral Convention on Mutual Administrative Assistance on Tax Matters in 2017. All of the above will enable the exchange of information for tax matters between the Panamanian tax authorities, and a broader set of countries to implement these commitments. Regulations were adopted in 2016 and 2017 setting forth the obligations and responsibilities of banking institutions, regarding due diligence procedures in order to identify reportable accounts under FATCA and CRS, as well as responsibilities regarding control measures and reporting requirements necessary to comply with such international standards and agreements. The laws, rules and regulations issued for these purposes include: Law No.47 of 2016, Law No.51 of 2016, Law No.5 of 2017, Executive Decree No.124 of 2017, Executive Decree No.461 of 2017 and the Resolution No.201-3931 of 2017 amended by Resolution No.201-4488 of 2017.
Financial Regulation in El Salvador
In 2011, Decree 592, entitled “Supervision and Regulation of the Financial System” (Ley de Supervisión y Regulación del Sistema Financiero) was enacted in order to strengthen the State’s organization, adapting all supervision and regulatory institutions to the economic reality of the financial system. Decree 592 states that the Superintendency of the Financial System and the Central Reserve Bank of El Salvador are mandated to supervise all members of the financial system and to approve the necessary regulation for the adequate application of Decree 592.
Decree 592’s main objectives are to maintain stability in the Salvadorian financial system, to guarantee efficiency, transparency, security and solidity within the system, and to bring all its members in compliance with this law, and other applicable laws and regulations, all in accordance with best international practices.
The Superintendency of the Financial System is responsible for the supervision of the individual and consolidated activities of all the members in the Salvadorian financial system, as well as the people, operations and entities described in the law. Decree 592 establishes all the powers and duties of the Superintendency, some of which are: (i) to fulfill and enforce the regulations applicable to the entities subject to its supervision and issue all the necessary instructions for compliance of the laws applicable to the system; (ii) to authorize the establishment, function, operation, intervention, suspension, modification, revocation of authorizations and closure of all members of the system, in accordance with regulations. In the event of closure, the Superintendency will coordinate with the entities involved the actions established by the law; (iii) risk prevention through the monitoring and management of the members within the system with a view toward the prudential management of liquidity and capital adequacy; (iv) facilitation of an efficient, transparent and organized financial system; (v) to require that all supervised entities and institutions be managed in accordance with the best international practices of risk management and corporate governance; and (vi) all other legal requirements.
In 2015, the Salvadorian congress amended Decree 592 in order to include within the scope of the supervision of the Superintendency of the Financial System all legal entities dedicated to the money transfer business. In 2016 another amendment to Decree 592 was enacted in order to define the requirements that must be met by valuation experts when elaborating valuation reports in connection with guarantees of loans granted by financial entities.
Banking Law of El Salvador
In 1999, Salvadorian congress enacted Decree 697, which regulates the financial intermediation activities and other operations performed by banks. Banks are required to establish the regulatory reserve requirements set by the Superintendency of the Financial System in accordance with the deposits and liabilities of each bank.
According to the Salvadorian Superintendency of Financial System’s regulations, the reserve requirements for Salvadorian banks as of December 31, 2019 are:
| | Ordinary Reserve Requirements % |
| Checking accounts | 25% |
| Saving accounts | 20% |
| Time deposits | 20% |
| Borrowings from foreign banks | 5% |
| Long-term debt (1) | 15%- 20% |
| Checking accounts | 25% |
____________________________ (1) 15% for long-term debt with maturity above one year and 20% for long-term debt with maturity less than one year. Investment Certificates with maturity equal or more than 5 years with mortgage guarantee, are not obliged to have reserves. |
Monetary Integration Law of El Salvador
The Monetary Integration Law adopted the U.S. dollar as the legal currency, establishing a fixed exchange rate of 8.75 Colones per USD 1.00. The colón continues to have unrestricted legal circulation, but the Central Reserve Bank has been replacing it with the U.S. dollar each time colón bills and coins are used in commercial transactions.
Since the implementation of the Monetary Integration Law, all financial operations, such as bank deposits, loans, pensions, securities offerings and any other activities performed through the financial system, as well as the accounting records, must be expressed in U.S. dollars. The operations or transactions of the financial system made or agreed in Colones before the effective date of the Monetary Integration Law are expressed in U.S. dollars at the exchange rate established in such law.
Investment Funds Law
The investment funds law seeks to encourage economic activity by providing small investors with access to capital markets, diversification of their investments and channeling of their savings into productive sectors, in order to generate higher economic growth.
This Law sets forth the regulatory framework for the supervision of investment funds, their share of participation and companies that administer such funds and their operations; as well as other participants to which it refers. Additionally, it regulates the marketing of participation shares in foreign investment funds.
This Law also provides for the creation of investment fund managers who are responsible for performing all acts, contracts and operations necessary for the administration and operation of investment funds.
In 2016, the Central Bank enacted Technical Standards (“Normas Técnicas”) in order to apply this Law. Such technical standards include, standards regarding permitted transactions by the investment funds, and standards related to the disclosure of information, among other things.
Financial Inclusion Law
This law was enacted by the Salvadorian congress in September 2015, and aims to promote financial inclusion and competition in the Salvadorian financial system, as well as to reduce costs for users and customers of such system, through the authorization for the issuance and circulation of electronic money and for the use of the “Simplified Account”, an account that doesn’t require customers to have a tax ID and allows limited balances and transactions.
This law encourages and promotes citizens to have access to formal financial services and to use retail payment instruments to achieve their insertion into productive activities, contributing to the improvement of their quality of life and well-being, and therefore the law facilitates the development of financial products that are designed having in mind the income levels and volume of transactions of low income population.
The Salvadorian Central Bank has enacted certain Technical Standards “Normas Técnicas” in order to apply this law.
Consumer Protection Law
This law has been in force in El Salvador since September 2005. Its purpose is to protect the rights of consumers in order to ensure balance, certainty and legal security in their relationships with commercial establishments, including financial institutions, retailers and suppliers. The law also,created the institutional framework to enable enforcement of the law and safeguard consumers´ rights.
The, law applies to commercial activities generally, but also has specific regulationsthat apply to financial services providers, especially regarding obligations and prohibitions, as well as setting limits for the amounts of bank fees and surcharges, and contract requirements.
The Salvadorian Central Bank has enacted certain Technical Standards “Normas Técnicas” in order to apply this law.
Financial Regulation in Guatemala
Decree No. 16-2002 sets forth the scope of the activities of Banco de Guatemala in its capacity as Central Bank of the country, establishing as its fundamental purpose contributing to the creation and maintenance of the most favorable conditions for an orderly development of the national economy, for which it shall facilitate the monetary, foreign exchange and credit conditions that promote stability in general prices.
Pursuant to Decree No. 16 -2002, Banco de Guatemala´s main objectives are to (i) be the sole issuer of the national currency, (ii) assure the effective functioning of the national payments system, (iii) assure an adequate liquidity level in the banking system, (iv) receive in deposit bank reserve requirements and statutory deposits, (v) manage international reserves.
Decree No. 16- 2002 also regulates the activities of the Monetary Board as governing body of the Banco de Guatemala financial system. Pursuant to Decree No. 16-2002, the Monetary Board has the following roles with respect to the Guatemalan financial system: (i) determine and assess the monetary, currency exchange and credit policies of the country; (ii) ensure liquidity and solvency of the national banking system; (iii) regulate aspects related to bank reserves and statutory deposits; (iv) regulate the Banking Clearing House Chamber; (v) authorize the investment policy of international monetary reserves; (vi) establish the minimum reserves required in order to strengthen the Banco de Guatemala´s net worth; (vii) issue regulations with respect to the financial system and financial activities, and; (viii) approve any provisions or rules submitted for its consideration by the Superintendency of Banks or by the Banco de Guatemala , as applicable, among others.
The Superintendency of Banks is created and regulated by Decree No. 18-2002. The Decree establishes the scope of the Superintendency´s regulatory and supervisory activities within the financial system. Thus, the Superintendency of Banks is in charge of the supervision of entities such as the Banco de Guatemala, banks, financial corporations, credit institutions, bond entities, insurance entities, warehouse deposit companies, currency exchange offices, financial groups and holding companies of financial groups, and other entities as mentioned by law.
Pursuant to Decree No. 18-2002, the Superintendency of Banks, in order to achieve its purpose, shall exercise the following functions:
| a) | Supervise financial entities so they can maintain adequate liquidity and solvency levels that enable them to timely and fully perform their obligations, and to assess and properly manage their risks |
| b) | Issue instructions intended to remediate any deficiencies or irregularities found in the activities of financial entities. |
| c) | Impose any applicable penalties and fines to financial institutions in accordance to applicable laws and regulations. |
| d) | Supervise and inspect, with the broadest attributions, all sources and systems of information of the supervised financial entities, including, but not limited to, accounting records, reports, contracts, documents and any other information the Superintendence deems necessary. |
| e) | Require information on any of the financial entities activities, acts, trust operations and financial condition, either individually, or where appropriate, in a consolidated manner. |
| f) | Perform its supervision activities on a consolidated basis. |
| g) | Assess risk policies, procedures, standards and systems of financial entities, and in general terms, ensure that they have integral risk management processes. |
| h) | Ensure overall and uniform compliance with the accounting standards, in compliance with the regulations issued for such purposes by the Monetary Board. |
| i) | Ensure compliance with the regulations issued by the Monetary Board requiring financial entities to provide sufficient, trustworthy and timely information to the public on their activities and their financial situation, individually, and where applicable, in a consolidated manner. |
| j) | Publish sufficient, trustworthy and timely information on the financial situation of the financial entities subject to its supervision, either individually or in a consolidated manner. |
The following are some of the main considerations taken into account by the Superintendency of Banks in determining compliance with applicable regulations:
| a) | Minimum Reserve Requirements: Banking institutions are subject to a minimum reserve requirement of 14.6% over the deposits received by the institution, which must be kept in the form of immediately available deposits with the Banco de Guatemala. To verify compliance with the regulation, banking institutions must provide the Superintendence of Banks with a daily report detailing the minimum reserve requirement. |
| b) | Loan Loss Reserves: In accordance with limitations specified by Decree 19 of 2002,(Banks and Financial Groups Law) and regulations issued by the Monetary Board, banking institutions, financial service entities, offshore entities and other financial institutions must carry out quarterly delinquency assessments of their credit and record reserves based on estimates of non-recoverability. Banking institutions and financial corporations must provide to the Superintendence of Banks monthly reports concerning outstanding credits in effect and movements and appraisals of credit portfolios in accordance with criteria specified by the Monetary Board. Additionally, the Superintendence of Banks carries out on-site reviews in which it evaluates payment ability and payment fulfillment of debtors and requests the institutions to record that necessary reserves be based on the non-payment risk. |
| c) | Capital Requirements: As specified in regulations issued by the Monetary Board, banking institutions in Guatemala must have a minimum capital adequacy ratio (risk-weighted assets to equity) of 10%, which is consistent with the Basel I guidelines. Banks must submit a weekly report to the Superintendence of Banks for monitoring compliance with this requirement. |
| d) | Related Party Transactions: In its on-site reviews the Superintendence of Banks verifies that financial institutions are in compliance with Monetary Board regulations limiting transactions between related parties. Related parties may conduct business with one another provided they do so in accordance with their normal standards of business. Article 47 of the Banks and Financial Groups Law establishes the limitations to carry out operations that imply direct and indirect financing of any nature, regardless of the legal form they take, such as, but not limited to, bonds, promissory notes, obligations and/or credits, or grant guarantees or endorsements, which together exceed the following thresholds: |
| 1. | 15% of the assets computable to a single individual or legal person, of a private nature; or one State or autonomous company or entity. |
| 2. | 30% of the assets computable to two or more related persons who are part of a risk unit. |
In addition, when a bank has a deficit in its regulatory capital (deficiencia patrimonial), it must immediately report it to the Superintendence of Banks. The Monetary Board will immediately order the suspension of operations of a bank that has suspended payment of its obligations and has a deficit in regulatory capital that exceeds 50% of equity, or if it has not submitted to the Superintendence of Banks a recovery plan, or if such plan has been rejected or has not been complied with. In such a case, the Monetary Board will name an Assets and Liabilities Exclusion Board which will be responsible for suspending the obligations of the entity and closing its operations. If, after suspension of operations, the Board of Assets and Liabilities Exclusion reports to the Monetary Board that dissolution is inevitable, the Monetary Board must then instruct the Superintendence of Banks to request a judicial declaration of bankruptcy. Once bankruptcy proceedings commence, the Savings Protection Fund participates as the entity in charge of the recovery of depositor funds.
The Law for Banks and Financial Groups provides within a regularization plan, and if deemed convenient, at the discretion of the Monetary Board, limiting distributions to shareholders of a bank as well as the possibility of placing a member on the Board of Directors.
Decree No. 19-2002 regulates the creation, organization, merging, activities, operations, functioning, suspension of operations and winding up of banks and financial entities, as well as the establishment and closure of branches and representation offices of foreign banks in Guatemala.
Such Decree also establishes that the members of the board of directors and general managers of the above-mentioned entities shall be held civilly, administrative and criminally accountable for the performance of their duties and, therefore, will respond unlimitedly with their personal assets with respect to liability for fines, damages and other monetary sanctions, directors and general managers are subject to potentially unlimited personal liability.
Decree 19 of 2002 allows financial entities to form financial groups or conglomerates under the common control of a holding entity or to designate one of the financial entities of the group as its holding company. In order to form such financial group conglomerates, it is necessary that the financial group have a bank.. The identification as a financial group does not entail that the financial group becomes a separate legal entity. Rather , the purpose of such identification is to allow the Superintendency of Banks to perform its supervision tasks on a consolidated basis.
Other Regulations in Guatemala
Decree No. 94- 2000 permits and regulates the use, transfer and payment in foreign currencies, as well as the use of foreign currency accounts and deposits within the Guatemalan financial system. Corporations and other entities that wish to offer securities denominated in foreign currencies must obtain prior authorization from the Monetary Board.
Decree No.67-2001 regulates the Anti-Money Laundering Law (Ley Contra el Lavado de Dinero u Otros Activos). The law was enacted to prevent and control money laundering in connection with criminal activities. Regulations issued by the Superintendency of Banks in accordance with this law went into effect on April 26, 2002. Among other things, the law and regulations created the Financial Intelligence Unit within the Superintendence of Banks under the name of Special Verification Intendancy (Intendencia de Verificación Especial – IVE). The Special Verification Intendancy has developed a national network for the prevention, control and surveillance of money-laundering activities. Penalties for non-compliance with anti-money laundering laws and regulations are set forth in the Superintendence of Banks Resolution 43-2002 and include fines or jail time for bank directors or employees and the suspension or cancellation of a financial institution’s license.
| B.9 | CYBERSECURITY FRAMEWORK |
The Bank's internal policies define cyber-security risk as the possibility of an economic or non-economic loss arising from a violation to the confidentiality, integrity and availability of the information that the Bank processes excluding damages caused directly in the information systems of our customers, whenever at least one of the following events occurs: (i) intentional interruption of the Bank's informational and technological infrastructure, excluding technological or operative failures; (ii) successful unauthorized access to information or to a system; and (iii) unauthorized change in the Bank's hardware, firmware or software. Materialization of cyber-security risks may result in the unauthorized access to privileged information, technological breaches of the infrastructure of the Bank with the aim of stealing information, fraud due to exploitation of vulnerabilities, and the interruption of the Bank's services.
Over the past recent years the Bank has implemented a cyber-security management and control system that is designed to identify and protect critical assets, anticipate, identify, and protect from cybersecurity threats, and respond and recover capabilities or services that were impaired due to a cybersecurity event. The system includes features such as: perimeter security devices; endpoint and malicious software security mechanisms, including firewalls, intrusion prevention systems, endpoint protection platform, navigation control such as proxy and cloud access security broker, network access control, virtual private networks, encryption techniques, Anti-DDoS (distributed denial of service), multi-factor authentication, backup security systems and techniques; the constant monitoring and continuous assessment of technological infrastructure though software and hardware updates, penetration tests and ethical hacking seeking to identify and mitigate vulnerabilities; implementations of software and hardware upgrades; backup security systems; a 24/7 security operations center to detect, analyze, respond to, report on, and prevent cybersecurity incidents as well as computer forensics, intelligence and threat hunting services, among others. Furthermore, the Bank has obtained an insurance policy aimed at covering certain damages that may be suffered by the Bank and third parties as a result of data losses derived from cyber-attacks, although the coverage under the policy is subject to a retention (deductible) and the coverage limit may not be adequate to compensate the Bank for all losses resulting from a cybersecurity event.
The framework used to manage cyber-security risks is designed under practices of international frameworks and standards issued by the National Institute of Standards and Technology (NIST) in NIST SP 800-30 and NIST Cybersecurity Framework, the International Organization for Standardization (ISO) in ISO/IEC-27032, as well as the definitions established by the Bank.
The cybersecurity and information security division of the Bank is responsible for cyber-security risk management, a function performed together with the business processes, technology, risk and internal audit, considering the nature of the Bank, its risk appetite, customer needs, business strategy and the environment of the financial industry.
The framework seeks to ensure that the risks are identified, measured, controlled and monitored, and considers the international and regional best practices and regulations. The cyber-security risk management system is designed as a three lines of defense model: a risk identification stage, executed by IT Managers (applications and platforms) and security managers; an oversight stage, which includes monitoring, assessment and analysis of the risk's potential impact, executed by the technological component and security managers along with the risk areas; and, a review of the control's effectiveness stage developed by the internal audit area.
The Bank's senior management is committed to cybersecurity risk management, through a clear strategy which includes the allocation of human, technical and financial resources and a clear definition and disclosure of responsibilities regarding to cybersecurity. Senior management has stablished a cybersecurity and information security committee, responsible for: approving and promoting the most important policies, strategies and projects, being informed and making decisions about associated controls, periodically evaluating the strategic and tactical plans of compliance, the review, approval and prioritization of initiatives or decisions as well as the prioritization of the use of the allocated budget. This Committee is formed by seven vice presidents of the following vice presidencies: Bancolombia's Corporate Services Vice-presidency Banistmo's Corporate Services Vice-presidency, BAM’s Corporate Services Vice-presidency, Banco Agrícola's Corporate Services Vice-presidency, Bancolombia's Administrative and Security Services Vice-presidency, Bancolombia's Corporate Human Resources Vice-presidency and Bancolombia's Corporate Risk Vice Presidency (corporate).
In addition to senior management, Bancolombia's Board of Directors is also involved in cyber-security risk management. The Risk Corporate Vice Presidency is responsible for proposing the methodology, procedures and tools for cyber-security related risks management and the management policies which is approved by the Board of Directors; ensuring that an appropriate cyber-security risk management process is maintained and keeping the Board of Directors informed of its effectiveness according to the approved guidelines and methodologies; and analyzing periodically the reports that are submitted by the senior management on cyber-security risk exposure, exposures substantial changes, tolerance level compliance and mitigation and management measures adopted by the Bank. All members of the Board of Directors receive periodic reports on the level of compliance with the approved policies and procedures for cyber-security risk management, as well as relating to the causes of any breaches and the measures adopted to address the gaps identified by the cyber-security and Information Security Committee, to consider any corrective actions required.
In 2019, Bancolombia invested 32.7 million USD, in activities related to preventive, detective and corrective efforts for cybersecurity management, including: insurance policies, human resources costs, security solutions licensing and the administration and maintenance of cybersecurity controls for the Bank. In 2019, Bancolombia had no cybersecurity and information security incidents that could have materially affected the Bank with an economic or non-economic impact, in accordance with the definition and criteria defined by the Bank for that purpose. Therefore, no costs are associated with its remediation or consequences.
As of the date of this Annual Report, the Bank has not faced a cyber-attack with a material impact on its business or customers. However, we can give no assurance that the previously described measures, initiatives and procedures will be effective to prevent or mitigate potential future attacks or threats to the Bank’s technology infrastructure. Any failure by the Bank to detect or prevent cyber-security risk in a timely manner could result in a negative impact on the Bank's results of operations and financial position, or in problems with information, including data related to customers being lost, compromised, or delivered to the Bank's customers with delays or errors. The public perception that a cyber-attack on its systems has been successful, whether or not this perception is correct, may damage the Bank's reputation with customers and third parties with whom it does business.
| B.10 | COVID-19 CONSIDERATIONS |
Since the beginning of March 2020, the outbreak of COVID-19 has impacted the Bank’s operations, customers, suppliers and employees. This circumstance affects the Bank’s Colombian and Central American operations. It remains unclear at this time how the developments in relation to COVID-19 will evolve through 2020 and the Bank will continue to monitor the situation closely.
As a response to the COVID-19 pandemic, on March 17, 2020 the Colombian government declared the social, economic and ecological emergency. Pursuant to such declaration, the government issued Decree 457 of 2020, which includes a mandatory shelter-in-place order within Colombia, as well as the suspension of international and domestic flights.
Many countries, including those where the Bank operates directly or through its subsidiaries have imposed similar measures, such as mandatory shelter-in-place and the closing of borders or travel prohibitions. These restrictions may adversely affect the jurisdictions where the Bank operates and its ability to conduct businesses as usual in those jurisdictions.
Bancolombia has operations in Colombia, Panamá, El Salvador and Guatemala, which are key for the overall performance of its business. As of the date of this Annual Report, the Bank has invoked business continuity plans in these subsidiaries and so far it has been able to maintain an acceptable level of service with minimal disruption to its customers.
As a response to the effects of COVID-19, in March 2020 Bancolombia started to offer temporary relief measures to assist both personal and small business customers in Colombia during the period of disruption. These measures are supported by the Colombian central bank and Superintendencia Financiera and are being offered throughout the country by the banking sector.
If the COVID-19 outbreak continues to cause disruption to economic activity in Colombia and Central America through 2020, there could be adverse impacts on other assets, such as the Bank’s investment portfolio, joint ventures and associates, as well as impacts on its income due to lower lending and transaction volumes, and fee revenue, which may impact the Bank’s profitability and capital position.
It is expected that in the first quarter of 2020 there will be higher expected credit losses (ECL) driven by a change in the economic scenarios used to calculate ECL. The COVID-19 outbreak has led to an expected weakening of the GDP forecasts in Colombia and Central America, and the probability of a more adverse economic scenario for the short term is higher than what was expected at 31 December 2019.
Currently, it is difficult to determine the impacts on the Bank’s impairment assessment of long-lived assets, loans and financial leases, associates, investments, among other assets on a reasonable and supportable basis. However, the Bank must consider both internal and external sources of information to determine the recoverable amounts and fair value of the assets. Likewise, changes in economic conditions will be monitored by the Bank as new information becomes available as to reflect in macroeconomic scenarios when assessing impairment of assets.
To mitigate the negative effects caused by COVID-19 the Colombian government has enacted measures to provide liquidity to the economy, to financially assist vulnerable populations and to provide funding to companies in sectors that are of national importance, including the banking sector. With the same purpose, Bancolombia adopted actions to help its customers and the national economy overall, by offering special credit lines and conditions such as deadline extensions to facilitate clients´s fulfillment of their obligations, and establishing special interest rates for the acquisition of basic goods such as food and medication through Bancolombia’s credit cards.
Similar measures have been adopted by the governments of the jurisdictions where the Bank operates. For instance, the Panamanian government, in the absence of central bank, has implemented an assistance plan for vulnerable populations and small business through direct financial assistance and tax benefits, and is yet to announce specific measures to offer liquidity to financial institutions, the Salvadorian government has adopted measures to preserve market liquidity through approval of additional national funding and the Guatemalan government has created the “Capital Protection Fund” which seeks to grant loans with special interest rates for both individuals and businesses.
The Bank has put in place a strategy to closely monitor its liquidity levels, considering loan commitments, maturity of liabilities, and withdrawals of deposits, among other factors, in order to enhance the cash position and liquid assets. In addition, the Central Bank of Colombia has taken measures to offer liquidity lines to financial institutions that may need extra support and avoid disruptions in inter-bank borrowings.
Nevertheless, despite the measures instated by the government and the Bank, the progression of COVID-19 may continue to result in the above-mentioned consequences.
For more information on the Bank’s risks associated to COVID-19, refer to Item 3.D. Risk Factors – “Ongoing Pandemics may adversely affect the Bank´s business and financial results”.
| C. | ORGANIZATIONAL STRUCTURE |
The following are the subsidiaries of Bancolombia:
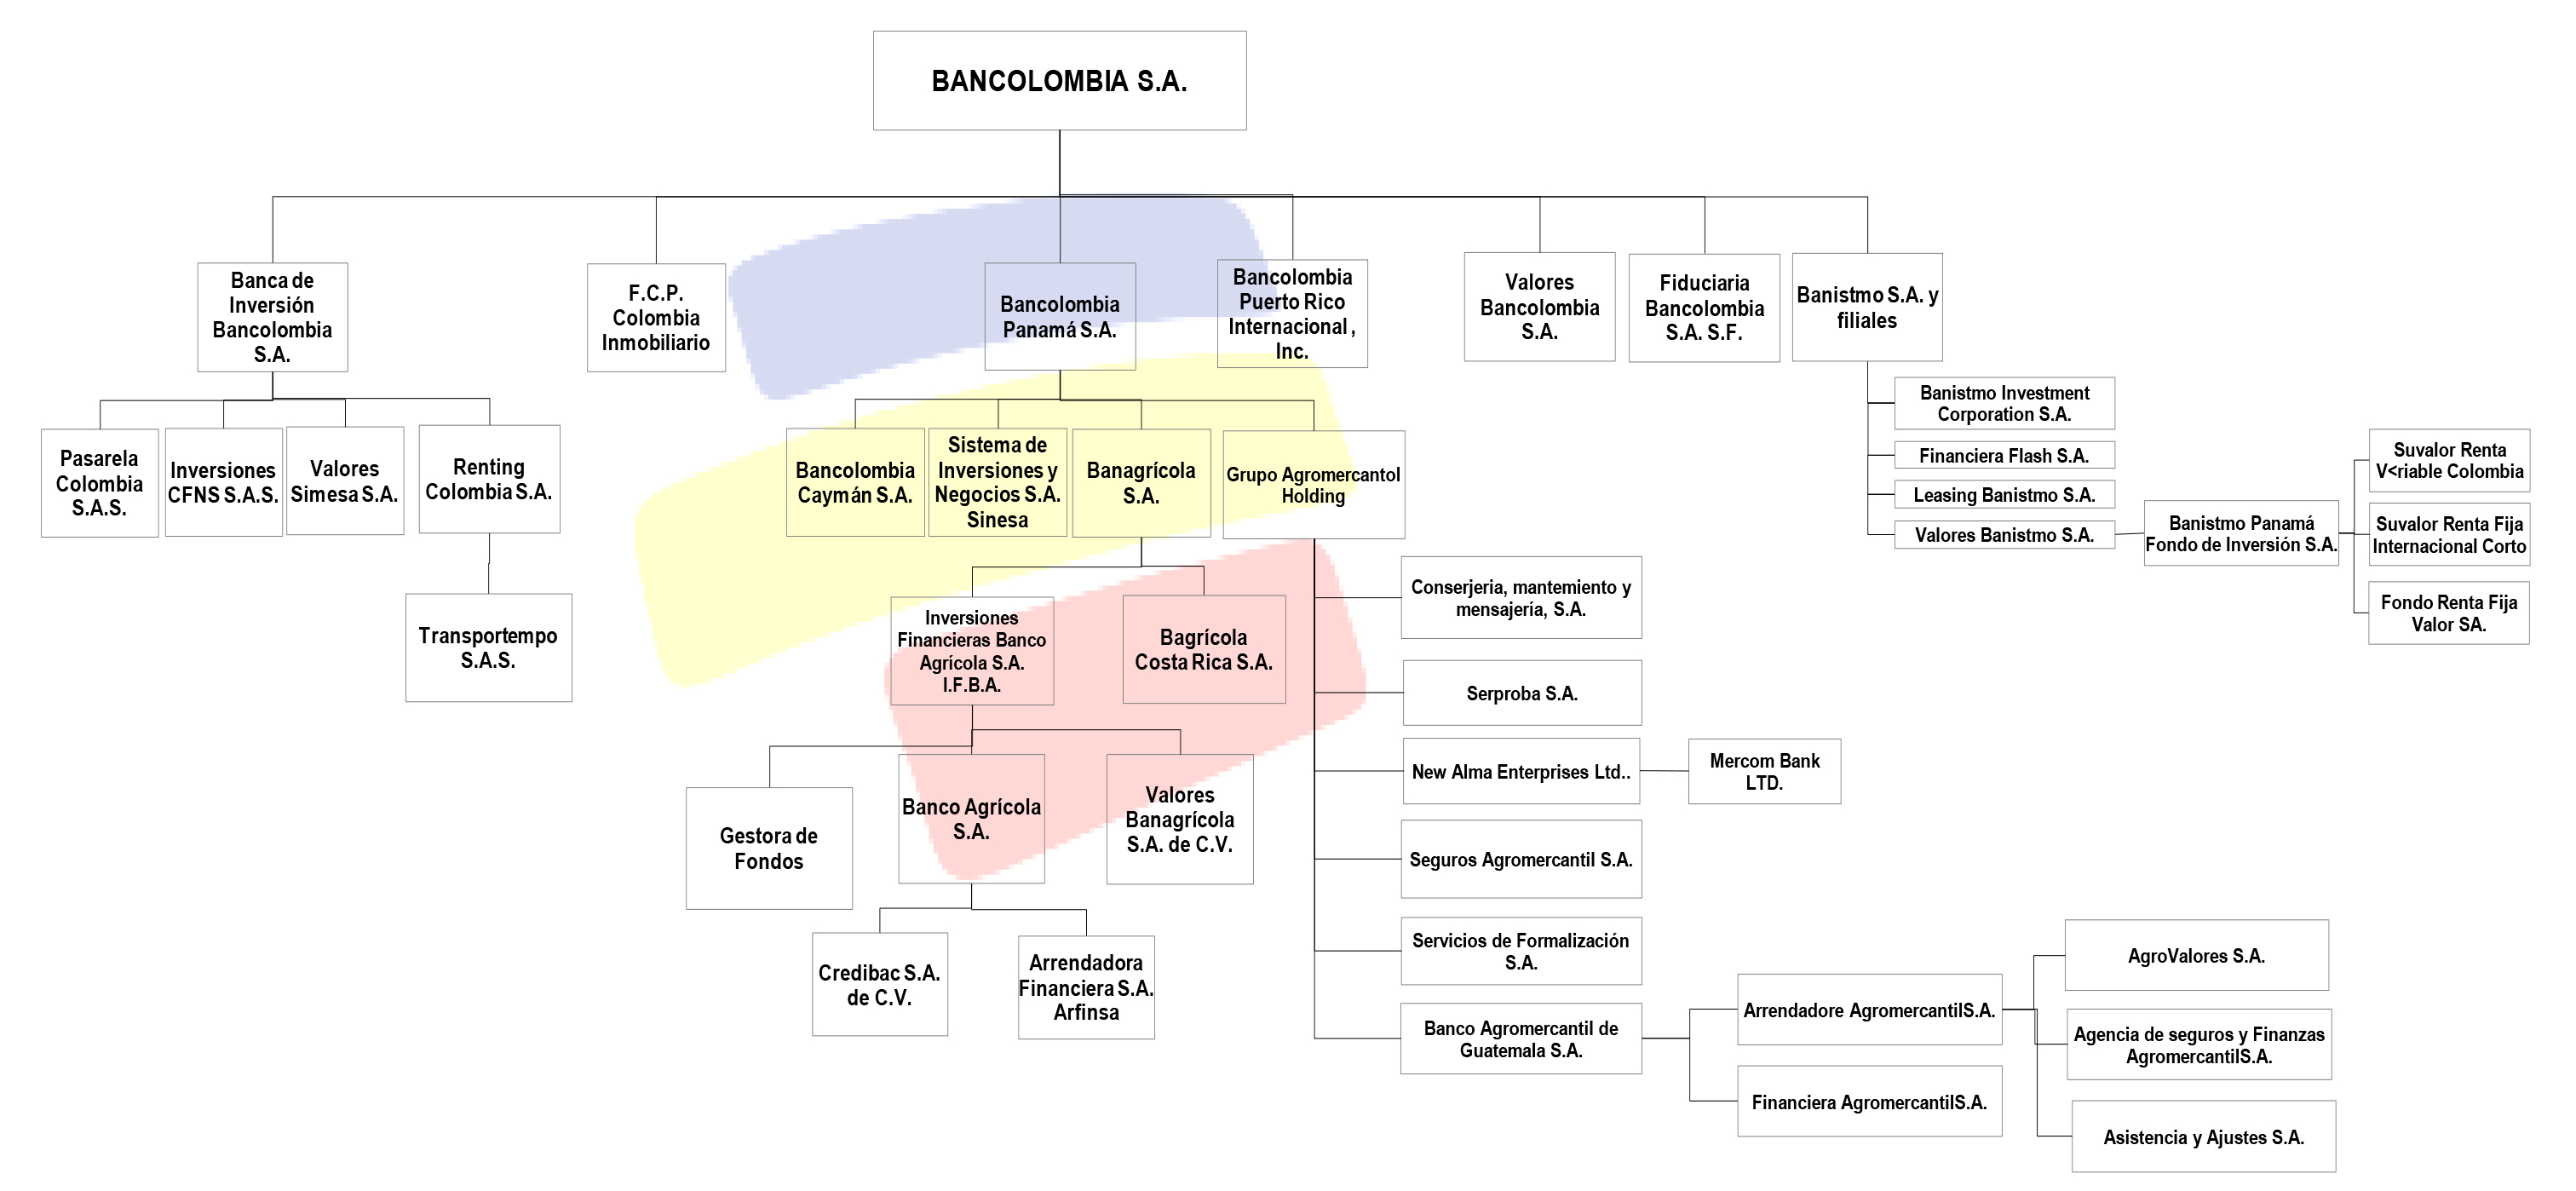
The following is a list of subsidiaries of Bancolombia as of December 31, 2019:
SUBSIDIARIES
| Entity | Jurisdiction of Incorporation | Business | Shareholding Directly and Indirectly 2019 |
| | | | |
| Fiduciaria Bancolombia S.A. Sociedad Fiduciaria | Colombia | Trust | 98.81% |
| Banca de Inversión Bancolombia S.A. Corporación Financiera | Colombia | Investment banking | 100.00% |
| Valores Bancolombia S.A. Comisionista de Bolsa | Colombia | Securities brokerage | 100.00% |
| Renting Colombia S.A.S. | Colombia | Operating leasing | 100.00% |
| Transportempo S.A.S. | Colombia | Transportation | 100.00% |
| Valores Simesa S.A. | Colombia | Investments | 67.11% |
| Inversiones CFNS S.A.S. | Colombia | Investments | 99.94% |
| Pasarela Colombia S.A.S. (Before BIBA Inmobiliaria S.A.S.) | Colombia | Real estate broker | 100.00% |
| Fondo de Capital Privado Fondo Inmobiliario Colombia | Colombia | Real estate broker | 49.96% |
| Fideicomiso "Lote Abelardo Castro". | Colombia | Mercantil trust | 66.77% |
| Fideicomiso Lote Distrito Vera B1B2 | Colombia | Mercantil trust | 66.77% |
| Fideicomiso Lote Distrito Vera B3B4 | Colombia | Mercantil trust | 66.77% |
| Bancolombia Panamá S.A. | Panama | Banking | 100.00% |
| Sistemas de Inversiones y Negocios S.A. Sinesa | Panama | Investments | 100.00% |
| Banagrícola S.A. | Panama | Investments | 99.17% |
| Banistmo S.A. | Panama | Banking | 100.00% |
| Banistmo Investment Corporation S.A. | Panama | Trust | 100.00% |
| Financomer S.A. | Panama | Financial services | 100.00% |
| Leasing Banistmo S.A. | Panama | Leasing | 100.00% |
| Valores Banistmo S.A. | Panama | Purchase and sale of securities | 100.00% |
| Banistmo Panamá Fondo de Inversión S.A. (Before Suvalor Panamá Fondos de Inversión S.A.) | Panama | Holding | 100.00% |
| Suvalor Renta Fija Internacional Corto Plazo S.A. | Panama | Collective investment fund | 100.00% |
| Suvalor Renta Variable Colombia S.A. | Panama | Collective investment fund | 100.00% |
| Banistmo Capital Markets Group Inc. (Non-operational stage) | Panama | Purchase and sale of securities | 100.00% |
| Anavi Investment Corporation S.A. (Non-operational stage) | Panama | Real estate broker | 100.00% |
| Desarrollo de Oriente S.A. (Non-operational stage) | Panama | Real estate broker | 100.00% |
| Steens Enterpresies S.A. (Non-operational stage) | Panama | Loan portfolio holder | 100.00% |
| Ordway Holdings S.A. (Non-operational stage) | Panama | Real estate broker | 100.00% |
| Entity | Jurisdiction of Incorporation | Business | Shareholding Directly and Indirectly 2019 |
| Grupo Agromercantil Holding S.A. | Panama | Holding | 60.00% |
| Banco Agrícola S.A. | El Salvador | Banking | 97.36% |
| Arrendadora Financiera S.A. Arfinsa | El Salvador | Leasing | 97.37% |
| Credibac S.A. de C.V. | El Salvador | Credit card services | 97.36% |
| Valores Banagrícola S.A. de C.V. | El Salvador | Securities brokerage | 98.89% |
| Inversiones Financieras Banco Agrícola S.A IFBA | El Salvador | Investments | 98.89% |
| Gestora de Fondos de Inversión Banagrícola S.A. | El Salvador | Administers investment funds | 98.89% |
| Banco Agromercantil de Guatemala S.A. | Guatemala | Banking | 60.00% |
| Seguros Agromercantil de Guatemala S.A. | Guatemala | Insurance company | 59.17% |
| Financiera Agromercantil S.A. | Guatemala | Financial services | 60.00% |
| Agrovalores S.A. | Guatemala | Securities brokerage | 60.00% |
| Arrendadora Agromercantil S.A. | Guatemala | Operating Leasing | 60.00% |
| Agencia de Seguros y Fianzas Agromercantil S.A. | Guatemala | Insurance company | 60.00% |
| Asistencia y Ajustes S.A. | Guatemala | Services | 60.00% |
| Serproba S.A. | Guatemala | Maintenance and remodelling services | 60.00% |
| Servicios de Formalización S.A. | Guatemala | Loans formalization | 60.00% |
| Conserjeria, Mantenimiento y Mensajería S.A. | Guatemala | Maintenance services | 60.00% |
| Mercom Bank Ltd. | Barbados | Banking | 60.00% |
| New Alma Enterprises Ltd. | Bahamas | Investments | 60.00% |
| Bancolombia Puerto Rico Internacional Inc. | Puerto Rico | Banking | 100.00% |
| Bancolombia Caymán S.A. | Cayman Islands | Banking | 100.00% |
| Bagrícola Costa Rica S.A. | Costa Rica | Outsourcing | 99.17% |
As of December 31, 2019, the Bank owned COP 3,828 billion in premises and equipment, net (including assets that are part of our operating leasing business), COP 2,093 billion correspond to land and buildings, of which approximately 96.58% are used for administrative offices and branches in 46 municipalities in Colombia, 25 municipalities in El Salvador, 7 municipalities in Guatemala and 4 municipalities in Panama. Likewise, COP 952 billion correspond to computer equipment, of which 12.3% relate to the central computer and servers of the Bank and the rest relate to personal computers, ATMs, telecommunications equipment and other equipment. Also, the Bank is currently constructing facilities amounting to COP 31 billion.
In addition to its own branches, the Bank occupies 819 rented offices.
The following table illustrates the balance amount of premises and equipment valued in COP in each country as of December 31, 2019:
| Country | Amount |
| In millions of COP |
| Colombia | 3,230,330 |
| El Salvador | 308,371 |
| Guatemala | 159,994 |
| Panama | 128,736 |
| Puerto Rico | 327 |
| Costa Rica | 107 |
| Total PPE | 3,827,865 |
The Bank does not have any material liens on its property.
| E. | SELECTED STATISTICAL INFORMATION |
The following information should be read in conjunction with the Consolidated Financial Statements as well as Item 5, “Operating and Financial Review and Prospects”. This information has been prepared based on the Bank’s financial records, which are prepared in accordance with IFRS as issued by the IASB and the related interpretations issued by the IFRIC. The consolidated selected statistical information corresponds to the Bank, including all Subsidiaries as to which Bancolombia has control.
| E.1 | DISTRIBUTION OF ASSETS, LIABILITIES AND STOCKHOLDERS’ EQUITY; INTEREST RATES AND INTEREST DIFFERENTIAL |
Average balances for each of the years ended December 31, 2019, 2018 and 2017 have been calculated as the arithmetic average of the last 13 monthly IFRS balances. In addition, the interest rate subtotals are based on the weighted average of domestic and foreign assets and liabilities.
Average statement of financial position
The following tables show for the years ended December 31, 2019, 2018 and 2017, respectively: (i) average balances for all of the Bank’s assets and liabilities; (ii) interest earned and interest paid amounts; and (iii) average nominal interest rates/yield for the Bank’s interest-earning assets and interest-bearing liabilities:
| | Average statement of financial position and Income from Interest-Earning Assets for the Fiscal Year Ended December 31,(1) |
| | 2019 | 2018 | 2017 |
| | Average
Balance | Interest
income
earned | Average
Yield / Rate | Average
Balance | Interest
income
earned | Average
Yield / Rate | Average Balance | Interest
income earned | Average
Yield / Rate |
| | In millions of COP, except percentages |
| ASSETS | | | | | | | | | |
| Interest-earning assets | | | | | | | | | |
| Funds sold and securities purchased under agreements to resell | | | | | | | | | |
| Domestic activities | 1,000,645 | 36,580 | 3.7% | 1,775,740 | 106,706 | 6.0% | 1,164,612 | 57,071 | 4.9% |
| Foreign activities | 2,416,173 | 70,411 | 2.9% | 1,587,751 | 38,001 | 2.4% | 2,196,602 | 504 | 0.0% |
| Total | 3,416,818 | 106,991 | 3.1% | 3,363,491 | 144,707 | 4.3% | 3,361,214 | 57,575 | 1.7% |
| Debt investments(2) | | | | | | | | | |
| Domestic activities | 10,029,160 | 633,587 | 6.3% | 9,022,396 | 419,066 | 4.6% | 9,057,238 | 612,076 | 6.8% |
| Foreign activities | 7,278,953 | 408,598 | 5.6% | 5,834,760 | 245,058 | 4.2% | 5,390,576 | 247,655 | 4.6% |
| Total | 17,308,113 | 1,042,185 | 6.0% | 14,857,156 | 664,124 | 4.5% | 14,447,814 | 859,731 | 6.0% |
| Loans and advances to customers and financial institutions(3)(4) | | | | | | | | | |
| Domestic activities | 115,577,087 | 12,151,936 | 10.5% | 106,400,898 | 11,519,444 | 10.8% | 94,870,082 | 12,122,572 | 12.8% |
| Foreign activities | 60,917,700 | 4,476,384 | 7.3% | 55,139,161 | 4,046,980 | 7.3% | 55,631,821 | 3,851,013 | 6.9% |
| Total | 176,494,787 | 16,628,320 | 9.4% | 161,540,059 | 15,566,424 | 9.6% | 150,501,903 | 15,973,585 | 10.6% |
| Total interest-earning assets(4) | | | | | | | | | |
| Domestic activities | 126,606,892 | 12,822,103 | 10.1% | 117,199,034 | 12,045,216 | 10.3% | 105,091,932 | 12,791,719 | 12.2% |
| Foreign activities | 70,612,826 | 4,955,393 | 7.0% | 62,561,672 | 4,330,039 | 6.9% | 63,218,999 | 4,099,172 | 6.5% |
| Total | 197,219,718 | 17,777,496 | 9.0% | 179,760,706 | 16,375,255 | 9.1% | 168,310,931 | 16,890,891 | 10.0% |
| Total non-interest-earning assets | | | | | | | | | |
| Domestic activities | 17,086,581 | - | - | 12,833,019 | - | - | 16,254,108 | - | - |
| Foreign activities(5) | 16,885,662 | - | - | 14,625,382 | - | - | 16,347,218 | - | - |
| Total | 33,972,243 | - | - | 27,458,401 | - | - | 32,601,326 | - | - |
| Total interest and non-interest earnings assets | | | | | | | | | |
| Domestic activities | 143,693,473 | 12,822,103 | 8.9% | 130,032,053 | 12,045,216 | 9.3% | 121,346,040 | 12,791,719 | 10.5% |
| Foreign activities(5) | 87,498,488 | 4,955,393 | 5.7% | 77,187,054 | 4,330,039 | 5.6% | 79,566,217 | 4,099,172 | 5.2% |
| Total(4) | 231,191,961 | 17,777,496 | 7.7% | 207,219,107 | 16,375,255 | 7.9% | 200,912,257 | 16,890,891 | 8.4% |
| (1) | The Bank average total assets and total liabilities and stockholder's equity were calculated considering the last 13 monthly IFRS balances. |
| (2) | Tax-exempt income of tax-exempt investment securities has not been calculated on a tax equivalent basis because the effect of such calculation would not be material. |
| (3) | Includes performing loans only. |
| (4) | The decrease in interest earned for the year ended December 31, 2018, as compared to the figure for the year ended December 31, 2017, is due to the adoption of IFRS 9. IFRS 9 requires that interest revenue shall be calculated by applying the effective interest rate to the ‘amortised cost’ of the financial asset (‘net interest revenue’), for financial assets that are not purchased or originated credit-impaired financial assets and have subsequently become credit-impaired financial assets. |
| (5) | The percentage of total average assets attributable to foreign activities was 37.8%, 37.2% and 39.6% respectively, for the fiscal years ended December 31, 2019, 2018 and 2017. |
| | Average statement of financial position and Interest Paid on Interest-Bearing Liabilities for the Fiscal Year Ended December 31,(1) |
| | 2019 | 2018 | 2017 |
| | Average Balance | Interest paid | Average Yield / Rate(2) | Average Balance | Interest paid | Average Yield / Rate(2) | Average Balance | Interest paid | Average Yield / Rate |
| | In millions of COP, except percentages |
| LIABILITIES AND STOCKHOLDERS’ EQUITY | | | | | | | | | |
| Interest-bearing liabilities: | | | | | | | | | |
| Checking deposits | | | | | | | | | |
| Domestic activities | 12,230,317 | 14,201 | 0.1% | 10,857,580 | 14,347 | 0.1% | 10,319,409 | 14,234 | 0.1% |
| Foreign activities | 10,599,525 | 42,266 | 0.4% | 10,375,370 | 39,321 | 0.4% | 10,173,663 | 36,579 | 0.4% |
| Total | 22,829,842 | 56,467 | 0.2% | 21,232,950 | 53,668 | 0.3% | 20,493,072 | 50,813 | 0.2% |
| Savings deposits | | | | | | | | | |
| Domestic activities | 47,172,719 | 946,105 | 2.0% | 42,738,807 | 916,912 | 2.1% | 38,111,789 | 1,064,435 | 2.8% |
| Foreign activities | 14,279,292 | 230,838 | 1.6% | 12,634,703 | 196,117 | 1.6% | 12,277,933 | 200,781 | 1.6% |
| Total | 61,452,011 | 1,176,943 | 1.9% | 55,373,510 | 1,113,029 | 2.0% | 50,389,722 | 1,265,216 | 2.5% |
| Time deposits | | | | | | | | | |
| Domestic activities | 33,449,926 | 1,893,758 | 5.7% | 30,842,476 | 1,856,806 | 6.0% | 30,666,059 | 2,182,011 | 7.1% |
| Foreign activities | 29,096,091 | 1,037,630 | 3.6% | 24,216,326 | 828,557 | 3.4% | 24,242,926 | 781,276 | 3.2% |
| Total | 62,546,017 | 2,931,388 | 4.7% | 55,058,802 | 2,685,363 | 4.9% | 54,908,985 | 2,963,287 | 5.4% |
| Funds purchased and securities sold under agreements to repurchase | | | | | | | | | |
| Domestic activities | 4,619,266 | 198,145 | 4.3% | 4,275,044 | 215,679 | 5.0% | 4,109,470 | 175,911 | 4.3% |
| Foreign activities | 1,429,210 | 2,097 | 0.1% | 1,457,406 | 3,832 | 0.3% | 845,370 | 5,056 | 0.6% |
| Total | 6,048,476 | 200,242 | 3.3% | 5,732,450 | 219,511 | 3.8% | 4,954,840 | 180,967 | 3.7% |
| Borrowings from development and other domestic banks(2) | | | | | | | | | |
| Domestic activities | 4,641,720 | 279,758 | 6.0% | 4,829,403 | 297,843 | 6.2% | 5,066,726 | 391,449 | 7.7% |
| Foreign activities | 287,518 | 35,893 | 12.5% | 492,483 | 47,254 | 9.6% | 683,451 | 34,300 | 5.0% |
| Total | 4,929,238 | 315,651 | 6.4% | 5,321,886 | 345,097 | 6.5% | 5,750,177 | 425,749 | 7.4% |
| Interbank borrowings(2)(3) | | | | | | | | | |
| Domestic activities | - | - | 0.0% | - | - | - | - | - | - |
| Foreign activities | 10,453,680 | 354,678 | 3.4% | 8,814,236 | 274,851 | 3.1% | 10,779,261 | 278,107 | 2.6% |
| Total | 10,453,680 | 354,678 | 3.4% | 8,814,236 | 274,851 | 3.1% | 10,779,261 | 278,107 | 2.6% |
| Long-term debt | | | | | | | | | |
| Domestic activities | 5,117,798 | 557,726 | 10.9% | 5,311,475 | 575,500 | 10.8% | 5,803,401 | 476,080 | 8.2% |
| Foreign activities | 15,517,371 | 607,082 | 3.9% | 14,499,546 | 563,957 | 3.9% | 13,435,824 | 714,920 | 5.3% |
| Total | 20,635,169 | 1,164,808 | 5.6% | 19,811,021 | 1,139,457 | 5.8% | 19,239,225 | 1,191,000 | 6.2% |
| | Average statement of financial position and Interest Paid on Interest-Bearing Liabilities for the Fiscal Year Ended December 31,(1) |
| | 2019 | 2018 | 2017 |
| | Average Balance | Interest paid | Average Yield / Rate(2) | Average Balance | Interest paid | Average Yield / Rate(2) | Average Balance | Interest paid | Average Yield / Rate |
| | In millions of COP, except percentages |
| Lease liability(4) | | | | | | | | | |
| Domestic activities | 1,081,141 | 80,016 | 7.4% | - | - | - | - | - | - |
| Foreign activities | 717,035 | 41,931 | 5.8% | - | - | - | - | - | - |
| Total | 1,798,176 | 121,947 | 6.8% | - | - | - | - | - | - |
| Total interest-bearing liabilities | | | | | | | | | |
| Domestic activities | 108,312,887 | 3,969,709 | 3.7% | 98,854,785 | 3,877,087 | 3.9% | 94,076,854 | 4,304,120 | 4.6% |
| Foreign activities | 82,379,722 | 2,352,415 | 2.9% | 72,490,070 | 1,953,889 | 2.7% | 72,438,428 | 2,051,019 | 2.8% |
| Total | 190,692,609 | 6,322,124 | 3.3% | 171,344,855 | 5,830,976 | 3.4% | 166,515,282 | 6,355,139 | 3.8% |
| Total non-interest bearing liabilities | | | | | | | | | |
| Domestic activities | 10,072,053 | - | - | 8,971,908 | - | - | 8,965,995 | - | - |
| Foreign activities(5) | 2,779,104 | - | - | 2,331,603 | - | - | 2,387,904 | - | - |
| Total | 12,851,157 | - | - | 11,303,511 | - | - | 11,353,899 | - | - |
| Stockholders' equity | | | | | | | | | |
| Domestic activities | 20,741,436 | - | - | 19,827,602 | - | - | 18,743,416 | - | - |
| Foreign activities | 6,906,759 | - | - | 4,743,138 | - | - | 4,299,659 | - | - |
| Total | 27,648,195 | - | - | 24,570,740 | - | - | 23,043,075 | - | - |
| Total interest and non-interest bearing liabilities and stockholders’ equity(5) | | | | | | | | | |
| Domestic activities | 139,126,376 | 3,969,709 | 2.9% | 127,654,295 | 3,877,087 | 3.0% | 121,786,265 | 4,304,120 | 3.5% |
| Foreign activities(5) | 92,065,585 | 2,352,415 | 2.6% | 79,564,811 | 1,953,889 | 2.5% | 79,125,991 | 2,051,019 | 2.6% |
| Total | 231,191,961 | 6,322,124 | 2.7% | 207,219,106 | 5,830,976 | 2.8% | 200,912,256 | 6,355,139 | 3.2% |
____________________________
| (1) | The Bank average of total assets and total liabilities and stockholder's equity were calculated considering the last 13 monthly IFRS balances. |
| (2) | Includes both short-term and long-term borrowings. |
| (3) | Includes borrowings from banks located outside Colombia. |
| (4) | As of January 01, 2019 the Bank adopted IFRS 16, this standard establishes the principles of recognition, measurement, presentation and disclosure of leases and requires lessees to account for all their leases under the same balance sheet model similar to the accounting under IAS 17 of the Finance leases. |
| (5) | The percentage of total average liabilities attributable to foreign activities was 41.8%, 41.0% and 42.1% respectively, for the fiscal years ended December 31, 2019, 2018 and 2017. |
CHANGES IN NET INTEREST INCOME AND EXPENSES—VOLUME AND RATE ANALYSIS
The following table allocates, for domestic and foreign activities, changes in the Bank’s net interest income to changes in average volume, changes in nominal rates and the net variance caused by changes in both average volume and nominal rate for the year ended December 31, 2019 compared to the year ended December 31, 2018; and the year ended December 31, 2018, compared to the year ended December 31, 2017. Volume and rate variances have been calculated based on movements in average balances over the period and changes in nominal interest rates on average interest-earning assets and average interest-bearing liabilities. Net changes attributable to changes in both volume and interest rate have been allocated to the change due to changes in volume.
| | December 31, 2019 - December 31, 2018 Increase (Decrease) due to changes in: | December 31, 2018- December 31, 2017 Increase (Decrease) due to changes in: |
| Volume | Rate | Net Change | Volume | Rate | Net Change |
| | In millions of COP |
| Interest-earning assets | | | | | | |
| Funds sold and securities purchased under agreements to resell | | | | | | |
| Domestic activities | (36,962) | (33,164) | (70,126) | 34,682 | 14,953 | 49,635 |
| Foreign activities | 22,871 | 9,539 | 32,410 | (101) | 37,598 | 37,497 |
| Total | (14,091) | (23,625) | (37,716) | 34,581 | 52,551 | 87,132 |
| Investment securities(1) | | | | | | |
| Domestic activities | 50,745 | 163,776 | 214,521 | (2,346) | (190,664) | (193,010) |
| Foreign activities | 69,306 | 94,234 | 163,540 | 62,644 | (65,241) | (2,597) |
| Total | 120,051 | 258,010 | 378,061 | 60,298 | (255,905) | (195,607) |
| Loans and financial leases | | | | | | |
| Domestic activities | 950,393 | (317,901) | 632,492 | 2,350,396 | (2,953,524) | (603,128) |
| Foreign activities | 424,615 | 4,789 | 429,404 | (33,750) | 229,717 | 195,967 |
| Total | 1,375,008 | (313,112) | 1,061,896 | 2,316,646 | (2,723,807) | (407,161) |
| Total interest-earning assets | | | | | | |
| Domestic activities | 964,176 | (187,289) | 776,887 | 2,382,732 | (3,129,235) | (746,503) |
| Foreign activities | 516,792 | 108,562 | 625,354 | 28,793 | 202,074 | 230,867 |
| Total | 1,480,968 | (78,727) | 1,402,241 | 2,411,525 | (2,927,161) | (515,636) |
| Interest-bearing liabilities: | | | | | | |
| Checking deposits | | | | | | |
| Domestic activities | (3,579) | 3,433 | (146) | 582 | (469) | 113 |
| Foreign activities | 863 | 2,082 | 2,945 | 735 | 2,007 | 2,742 |
| Total | (2,716) | 5,515 | 2,799 | 1,317 | 1,538 | 2,855 |
| Savings deposits | | | | | | |
| Domestic activities | 78,467 | (49,274) | 29,193 | 162,165 | (309,688) | (147,523) |
| Foreign activities | 26,330 | 8,391 | 34,721 | 6,229 | (10,893) | (4,664) |
| Total | 104,797 | (40,883) | 63,914 | 168,394 | (320,581) | (152,187) |
| Time deposits | | | | | | |
| Domestic activities | 125,261 | (88,309) | 36,952 | 12,628 | (337,833) | (325,205) |
| Foreign activities | 172,798 | 36,275 | 209,073 | (856) | 48,137 | 47,281 |
| Total | 298,059 | (52,034) | 246,025 | 11,772 | (289,696) | (277,924) |
| Funds purchased and securities sold under agreements to repurchase | | | | | | |
| Domestic activities | 20,389 | (37,923) | (17,534) | 7,321 | 32,448 | 39,769 |
| | December 31, 2019 - December 31, 2018 Increase (Decrease) due to changes in: | December 31, 2018- December 31, 2017 Increase (Decrease) due to changes in: |
| Volume | Rate | Net Change | Volume | Rate | Net Change |
| | In millions of COP |
| Foreign activities | (73) | (1,662) | (1,735) | (5,417) | 4,193 | (1,224) |
| Total | 20,316 | (39,585) | (19,269) | 1,904 | 36,641 | 38,545 |
| Borrowings from development and other domestic banks | | | | | | |
| Domestic activities | (11,409) | (6,676) | (18,085) | (17,638) | (75,968) | (93,606) |
| Foreign activities | (41,071) | 29,710 | (11,361) | (5,723) | 18,677 | 12,954 |
| Total | (52,480) | 23,034 | (29,446) | (23,361) | (57,291) | (80,652) |
| Interbank borrowings | | | | | | |
| Domestic activities | - | - | - | - | - | - |
| Foreign activities | 54,177 | 25,650 | 79,827 | 22,548 | (25,804) | (3,256) |
| Total | 54,177 | 25,650 | 79,827 | 22,548 | (25,804) | (3,256) |
| Long-term debt | | | | | | |
| Domestic-activities | (21,129) | 3,355 | (17,774) | (35,706) | 135,126 | 99,420 |
| Foreign-activities | 39,802 | 3,323 | 43,125 | 62,951 | (213,914) | (150,963) |
| Total | 18,673 | 6,678 | 25,351 | 27,245 | (78,788) | (51,543) |
| Lease liability(2) | | | | | | |
| Domestic-activities | 80,016 | - | 80,016 | - | - | - |
| Foreign-activities | 41,931 | - | 41,931 | - | - | - |
| Total | 121,947 | - | 121,947 | - | - | - |
| Total interest-bearing liabilities | | | | | | |
| Domestic-activities | 268,016 | (175,394) | 92,622 | 129,352 | (556,384) | (427,032) |
| Foreign-activities | 294,757 | 103,769 | 398,526 | 80,467 | (177,597) | (97,130) |
| Total | 562,773 | (71,625) | 491,148 | 209,819 | (733,981) | (524,162) |
____________________________
| (1) | Tax-exempt income of tax-exempt investment securities has not been calculated on a tax equivalent basis because the effect of such calculation would not be material. |
| (2) | As of January 01, 2019 the Bank adopted IFRS 16, this standard establishes the principles of recognition, measurement, presentation and disclosure of leases and requires lessees to account for all their leases under the same balance sheet model similar to the accounting under IAS 17 of the Finance leases. |
INTEREST-EARNING ASSETS — NET INTEREST MARGIN AND SPREAD
The following table presents the levels of average interest-earning assets and net interest income of the Bank and illustrates the comparative net interest margin and interest spread obtained for the fiscal years ended December 31, 2019, 2018 and 2017, respectively.
| | Interest-Earning Assets-Yield For the Fiscal
Year Ended December 31, |
| | 2019 | 2018 | 2017 |
| | In millions of COP, except percentages |
| Total average interest-earning assets | | | |
| Domestic activities | 126,606,892 | 117,199,034 | 105,091,932 |
| Foreign activities | 70,612,826 | 62,561,672 | 63,218,999 |
| Total | 197,219,718 | 179,760,706 | 168,310,931 |
| Net interest income(1) | | | |
| Domestic activities | 8,852,394 | 8,168,129 | 8,487,599 |
| Foreign activities | 2,602,978 | 2,376,150 | 2,048,153 |
| Total | 11,455,372 | 10,544,279 | 10,535,752 |
| Average yield on interest-earning assets | | | |
| Domestic activities | 10.13% | 10.28% | 12.17% |
| Foreign activities | 7.02% | 6.92% | 6.48% |
| Total | 9.01% | 9.11% | 10.04% |
| Net interest margin(2) | | | |
| Domestic activities | 6.99% | 6.97% | 8.08% |
| Foreign activities | 3.69% | 3.80% | 3.24% |
| Total | 5.81% | 5.87% | 6.26% |
| Interest spread(3) | | | |
| Domestic activities | 6.46% | 6.36% | 7.60% |
| Foreign activities | 4.16% | 4.23% | 3.65% |
| Total | 5.70% | 5.71% | 6.22% |
____________________________
| (1) | Net interest income is loan interest income less interest expense and includes interest earned on investments. |
| (2) | Net interest margin is net interest income divided by total average interest-earning assets. |
| (3) | Interest spread is the difference between the average yield on interest-earning assets and the average rate accrued on interest-bearing liabilities. |
The Bank acquires and holds investment securities, including debt instruments and equity securities, for liquidity and other strategic purposes, or when it is required by law.
IFRS 9 requires investments to be classified as either amortized cost, fair value through other comprehensive income or fair value through profit or loss. The classification is based on: (a) the entity’s business model for managing the financial assets, and (b) the contractual cash flow characteristics of the financial asset. Accordingly, an investment is classified and measured as amortized cost if: (i) the asset is held within a business model whose objective is to hold assets in order to collect contractual cash flows and (ii) the contractual terms of the financial asset give rise on specified dates to cash flows that are solely payments of principal and interest on the principal amount outstanding. An investment is classified and measured at fair value through other comprehensive income if: (i) the asset is held within a business model whose objective is achieved by both collecting contractual cash flows and selling financial assets and (ii) the contractual terms of the financial asset give rise on specified dates to cash flows that are solely payments of principal and interest on the principal amount outstanding.
Prior to the date of application of IFRS 9, investment portfolios that were managed only on the basis of fair value through profit or loss and amortized cost. As permitted by the transitional provisions of IFRS 9, the Bank reclassified debt securities from fair value through profit or loss and amortized cost to fair value through comprehensive income based on the Bank’s business model for managing its financial assets portfolio and the contractual cash flow characteristics of the assets.
The Bank’s financial assets in the investment portfolio are classified according to the current business model. Such assets’ allowances are determined by the risk stage and credit risk rating, historical changes in risk factors, fair value, macroeconomic factors and collaterals.
For purposes of measurement and recognition of impairment in associates and joint ventures, Bancolombia applies the impairment test in accordance with IAS 36 once indicators of impairment from IAS 28 are met.
As of December 31, 2019, Bancolombia’s debt instruments investment portfolio had a carrying value of COP 15,594 billion.
The following table sets forth the carrying value of the Bank‘s investments in Colombian Government and foreign Governments and corporate debt instruments and certain other financial investments as of the dates indicated:(1)
| | As of December 31, |
| | 2019(2) | 2018(2) | 2017(2) |
| | In millions of COP |
| Foreign currency-denominated | | | |
| Debt instruments issued by foreign Governments | 4,981,607 | 4,233,200 | 3,522,849 |
| Debt instruments issued or secured by other financial entities | 629,634 | 519,331 | 641,305 |
| Debt instruments issued or secured by Colombian Government | 117,739 | 346,615 | 69,602 |
| Debt instruments issued or secured by Government entities | - | 39,401 | 26,377 |
| Corporate bonds | 1,690,543 | 1,235,542 | 1,000,794 |
| Subtotal | 7,419,523 | 6,374,089 | 5,260,927 |
| Peso-denominated | | | |
| Debt instruments issued or secured by other financial entities | 554,474 | 471,845 | 636,902 |
| Debt instruments issued or secured by the Colombian Government | 5,662,433 | 6,945,796 | 6,946,510 |
| Debt instruments issued or secured by Government entities | 1,898,919 | 1,879,705 | 1,936,215 |
| Corporate bonds | 58,981 | 50,092 | 78,869 |
| Subtotal | 8,174,807 | 9,347,438 | 9,598,496 |
| Total | 15,594,330 | 15,721,527 | 14,859,423 |
____________________________
| (1) | For further information, see Note 5 “Financial assets investments and derivatives” to the Consolidated Financial Statements. |
| (2) | Includes debt instruments only. Net investments in equity securities were COP 1,228,424, COP 1,639,948 and COP 1,517,830 for 2019, 2018 and 2017, respectively. |
As of December 31, 2019, 2018 and 2017, Bancolombia held debt instruments issued by foreign Governments in the following amounts:
| As of December 31, | Issuer | Investment Amount (In millions
of COP) | Investment Amount (thousands
of U.S. dollars)(1) |
| 2019 | U.S. Treasury | 2,093,242 | 638,741 |
| | Republic of Panama | 1,328,040 | 405,244 |
| | Republic of Guatemala | 1,132,770 | 345,659 |
| | Republic of El Salvador | 332,554 | 101,477 |
| | Republic of Mexico | 71,823 | 21,916 |
| | Republic of Costa Rica | 13,966 | 4,262 |
| | Republic of Dominicana | 9,212 | 2,811 |
| As of December 31, | Issuer | Investment Amount (In millions
of COP) | Investment Amount (thousands
of U.S. dollars)(1) |
| 2018 | Republic of Guatemala | 1,403,859 | 431,990 |
| | U.S. Treasury | 1,560,168 | 480,088 |
| | Republic of Panama | 890,075 | 273,890 |
| | Republic of El Salvador | 239,234 | 73,616 |
| | Republic of Mexico | 90,598 | 27,878 |
| | Republic of Costa Rica | 46,786 | 14,397 |
| | Republic of Chile | 1,628 | 501 |
| | Republic of Peru | 852 | 262 |
| 2017 | Republic of Guatemala | 1,462,363 | 490,068 |
| | Republic of Panama | 958,553 | 321,231 |
| | U.S. Treasury | 701,551 | 235,104 |
| | Republic of Mexico | 22,095 | 7,404 |
| | Republic of Costa Rica | 87,800 | 29,424 |
| | Republic of El Salvador | 290,487 | 97,348 |
| (1) | These amounts have been translated at the rate of COP 3,277.14 per USD 1.00 at December 31, 2019, COP 3,249.75 per USD 1.00 at December 31, 2018 and COP 2,984 per USD 1.00 at December 31, 2017, which corresponds to the Representative Market Rate calculated on December 31, the last business day of the year. |
As of December 31, 2019, the Bank’s peso-denominated debt instruments portfolio amounted to COP 8,174 billion, reflecting a 12.54% decrease compared to December 31, 2018 principally because of a reduction in holdings of debt instruments issued or secured by the Colombian Government and Colombian government entities. Peso-denominated debt instruments issued by the Colombian government represented 69.27% of the Bank’s peso-denominated debt instruments portfolio as of December 31, 2019.
Also, as of December 31, 2019, Bancolombia’s portfolio of securities issued by foreign governments amounted to COP 4,981 billion, a 17.68% increase compared to December 31, 2018 as a consequence of an increase in the Bank’s position in securities issued by the U.S. Treasury, Panama, El Salvador and Dominican Republic.
DEBT INSTRUMENTS PORTFOLIO MATURITY
The following table summarizes the maturities and weighted average nominal yields of the Bank’s debt instruments as of December 31, 2019:
| As of December 31, 2019 |
| | Maturity less than 1 year | Maturity between 1 and 5 years | Maturity between 5 and 10 Years | Maturity more than 10 years | Total |
| | Balance | Yield %(1) | Balance | Yield %(1) | Balance | Yield %(1) | Balance | Yield %(1) | Balance | Yield %(1) |
| In millions of COP, except yields |
| Securities issued or secured by: Foreign currency.-denominated(2): |
| Foreign Governments | 2,497,771 | 2.84% | 1,586,135 | 3.95% | 847,170 | 4.27% | 50,531 | 6.18% | 4,981,607 | 3.47% |
| Corporate bonds | 15,916 | 3.56% | 616,280 | 5.08% | 1,037,234 | 5.27% | 21,113 | 4.11% | 1,690,543 | 5.17% |
| Other financial entities | 240,922 | 2.80% | 220,173 | 4.11% | 20,408 | 5.47% | 148,131 | 0.00% | 629,634 | 2.69% |
| Colombian Government | - | - | 113,325 | 3.03% | 4,414 | 3.14% | - | 0.00% | 117,739 | 3.03% |
| Subtotal | 2,754,609 | 2.84% | 2,535,913 | 4.20% | 1,909,226 | 4.82% | 219,775 | 1.82% | 7,419,523 | 3.79% |
| Securities issued or secured by: Peso-denominated(2) |
| Colombian Government | 1,527,762 | 4.76% | 2,601,008 | 5.02% | 441,249 | 3.71% | 140,346 | 6.26% | 4,710,365 | 4.85% |
| Other Government entities | 1,828,660 | 0.72% | 62,144 | 5.89% | 8,115 | 6.88% | - | - | 1,898,919 | 0.92% |
| Other financial entities | 100,214 | 5.54% | 250,145 | 6.64% | 114,177 | 10.54% | 56,844 | 9.25% | 521,380 | 7.57% |
| Corporate bonds | 3,539 | 5.90% | 48,795 | 6.60% | 4,575 | 6.84% | 2,072 | 7.11% | 58,981 | 6.59% |
| Subtotal | 3,460,175 | 2.65% | 2,962,092 | 5.20% | 568,116 | 5.15% | 199,262 | 7.12% | 7,189,645 | 4.02% |
| Securities issued or secured by: UVR-denominated(2) |
| Colombian Government | - | - | 881,941 | 1.56% | 56,799 | 1.84% | 13,328 | 3.00% | 952,068 | 1.60% |
| Other financial entities | - | - | - | - | 4,003 | 2.23% | 29,091 | 5.13% | 33,094 | 4.78% |
| Subtotal | - | - | 881,941 | 1.56% | 60,802 | 1.86% | 42,419 | 4.46% | 985,162 | 1.70% |
| Total (COP) | 6,214,784 | | 6,379,946 | | 2,538,144 | | 461,456 | | 15,594,330 | |
| (1) | Yield was calculated using the internal rate of return (IRR) as of December 31, 2019. |
| (2) | Yields on tax-exempt obligations have not been calculated on a tax equivalent basis because the effect of such calculation would not be material. |
As of December 31, 2019, the Bank had the following investments in debt instruments of issuers that exceeded 10% of the Bank‘s equity:
| | | As of December 31, |
| | | 2019 |
| Debt instruments issued or secured by: | Issuer | Book Value | Fair value |
| | | In millions of COP |
| Colombian Government | Ministry of Finance | 5,780,172 | 5,781,975 |
| Total | | 5,780,172 | 5,781,975 |
Types of Loans
The following table shows the Bank’s loan portfolio classified into commercial, consumer, mortgage, financial leases and small business loans:
| | As of December 31, |
| | 2019 | 2018 | 2017 | 2016 | 2015 |
| | In millions of COP |
| Domestic | | | | | |
| Commercial | | | | | |
| Corporate | 27,001,064 | 31,828,782 | 38,390,733 | 35,344,359 | 35,013,853 |
| SME | 10,006,407 | 14,424,874 | 14,964,891 | 14,405,761 | 13,083,803 |
| Others | 27,660,863 | 19,431,099 | 11,492,310 | 12,566,955 | 13,743,130 |
| Total commercial | 64,668,334 | 65,684,755 | 64,847,934 | 62,317,075 | 61,840,786 |
| Consumer | | | | | |
| Credit cards | 5,763,383 | 4,992,953 | 4,597,677 | 3,827,948 | 3,275,000 |
| Vehicle loans | 3,081,144 | 2,790,681 | 2,456,575 | 2,481,891 | 2,453,458 |
| Payroll loans | 3,198,858 | 3,123,414 | 2,827,298 | 2,741,857 | 2,680,018 |
| Others | 16,882,573 | 11,459,160 | 9,160,995 | 6,310,038 | 4,450,248 |
| Total consumer | 28,925,958 | 22,366,208 | 19,042,545 | 15,361,734 | 12,858,724 |
| Mortgage | | | | | |
| Vis | 3,059,316 | 2,848,572 | 2,834,658 | 2,591,161 | 2,327,222 |
| Non-Vis | 9,471,388 | 9,303,394 | 8,152,922 | 7,579,002 | 6,385,670 |
| Total mortgage | 12,530,704 | 12,151,966 | 10,987,580 | 10,170,163 | 8,712,892 |
| Financial Leases | 23,957,961 | 22,601,474 | 21,728,901 | 20,685,823 | 19,898,665 |
| Small Business Loan | 769,332 | 653,897 | 650,653 | 673,314 | 592,572 |
| Total loans and leases | 130,852,289 | 123,458,300 | 117,257,613 | 109,208,109 | 103,903,639 |
| Allowance for loans and advances and lease losses | (8,553,584) | (8,482,256) | (7,305,563) | (5,529,506) | (4,312,564) |
| Total domestic loans, net | 122,298,705 | 114,976,044 | 109,952,050 | 103,678,603 | 99,591,075 |
| Foreign | | | | | |
| Commercial | | | | | |
| Corporate | 23,107,363 | 23,733,836 | 20,270,534 | 20,517,994 | 18,715,678 |
| SME | 2,203,352 | 2,099,697 | 2,219,168 | 2,116,047 | 2,302,596 |
| Others | 2,789,504 | 3,082,360 | 1,659,605 | 1,308,592 | 3,033,692 |
| Total commercial | 28,100,219 | 28,915,893 | 24,149,307 | 23,942,633 | 24,051,966 |
| Consumer | | | | | |
| Credit cards | 2,315,971 | 2,033,736 | 1,657,600 | 3,956,710 | 3,885,302 |
| Vehicle loans | 516,825 | 462,379 | 459,130 | 576,762 | 636,518 |
| Payroll loans | 4,697,518 | 4,327,967 | 4,143,485 | 2,338,803 | 2,270,762 |
| Others | 3,244,398 | 2,803,091 | 2,343,354 | 1,691,270 | 1,519,309 |
| Total consumer | 10,774,712 | 9,627,173 | 8,603,569 | 8,563,545 | 8,311,891 |
| | As of December 31, |
| | 2019 | 2018 | 2017 | 2016 | 2015 |
| Mortgage | | | | | |
| Vis | 3,152,069 | 2,929,495 | 2,657,268 | 2,426,359 | 1,924,951 |
| Non-Vis | 8,300,510 | 7,789,224 | 6,867,360 | 6,559,330 | 6,480,940 |
| Total mortgage | 11,452,579 | 10,718,719 | 9,524,628 | 8,985,689 | 8,405,891 |
| Financial Leases | 592,868 | 596,730 | 520,050 | 658,100 | 652,911 |
| Small Business Loan | 510,076 | 502,301 | 412,927 | 389,410 | 294,341 |
| Total loans and leases | 51,430,454 | 50,360,816 | 43,210,481 | 42,539,377 | 41,717,000 |
| Allowance for loans and advances and lease losses | (2,375,811) | (1,753,575) | (917,540) | (1,092,405) | (936,191) |
| Total foreign loans, net | 49,054,643 | 48,607,241 | 42,292,941 | 41,446,972 | 40,780,809 |
| Total Foreign and Domestic Loans | 171,353,348 | 163,583,285 | 152,244,991 | 145,125,575 | 140,371,884 |
As of December 31, 2019, the Bank’s total loan portfolio amounted to COP 182,283 billion and increased 4.87% as compared to COP 173,819 billion as of December 31, 2018. The growth in loan volume during 2019 was driven by a growth mainly in Colombia, Guatemala and El Salvador (the latter two partly explained by the devaluation of the Colombian peso against the U.S. dollar). For further discussion of some of these trends, please see Item 5. "Operating and Financial Review and Prospects-D. Trend information".
As of December 31, 2019, commercial loans amounted to COP 92,769 billion, or 50.89% of total loans and decreased 1.94% from COP 94,601 billion at the end 2018.
As of December 31, 2019, consumer loans totaled COP 39,701 billion, or 21.78% of total loans. These loans increased 24.09% over the year as a result of new strategies in the consumer segment and agile loan origination processes, that resulted in an increase in the portfolio during the period.
As of December 31, 2019, mortgage loans totaled COP 23,983 billion and increased 4.86% over the year, from COP 22,871 billion at the end 2018.
Financial leases totaled COP 24,551 billion as of December 31, 2019 and increased 5.83% from COP 23,198 billion in 2018.
As of December 31, 2019, small business loans amounted to COP 1,279 billion, 0.70% of total loans and increased 10.64% from COP 1,156 billion at the end 2018.
Borrowing Relationships
As of December 31, 2019, the aggregate outstanding principal amount of the Bank’s 25 largest credit exposures, on a consolidated basis, represented approximately 7.3% of the loan portfolio of the Bank and no single exposure represented more than 2% of the loan book. In addition, 100% of those loans were corporate loans.
Maturity and Interest Rate Sensitivity of Loans
The following table shows the maturities of the Bank’s loan portfolio as of December 31, 2019:
| | Maturity of one year or less | Maturity of one to five years | Maturity of more than five years | Total |
| | In millions of COP |
| Domestic loans and financial leases | | | | |
| Commercial | | | | |
| Corporate | 5,681,767 | 11,096,005 | 10,223,292 | 27,001,064 |
| | Maturity of one year or less | Maturity of one to five years | Maturity of more than five years | Total |
| | In millions of COP |
| SME | 2,818,040 | 5,850,446 | 1,337,921 | 10,006,407 |
| Others | 10,720,292 | 10,920,492 | 6,020,079 | 27,660,863 |
| Total commercial | 19,220,099 | 27,866,943 | 17,581,292 | 64,668,334 |
| Consumer | | | | |
| Credit cards | 495 | 5,762,888 | 0 | 5,763,383 |
| Vehicle loans | 52,353 | 1,777,586 | 1,251,205 | 3,081,144 |
| Payroll loans | 36,749 | 972,125 | 2,189,984 | 3,198,858 |
| Others | 300,716 | 13,874,624 | 2,707,233 | 16,882,573 |
| Total consumer | 390,313 | 22,387,223 | 6,148,422 | 28,925,958 |
| Mortgage | | | | |
| VIS | 8,237 | 171,126 | 2,879,953 | 3,059,316 |
| Non-VIS | 14,519 | 326,732 | 9,130,137 | 9,471,388 |
| Total mortgage | 22,756 | 497,858 | 12,010,090 | 12,530,704 |
| Financial leases | 3,020,313 | 6,813,735 | 14,123,913 | 23,957,961 |
| Small business loan | 100,153 | 661,907 | 7,272 | 769,332 |
| Total domestic loans and financial leases | 22,753,634 | 58,227,666 | 49,870,989 | 130,852,289 |
| Foreign loans and financial leases: | | | | |
| Commercial | | | | |
| Corporate | 6,696,105 | 9,727,324 | 6,683,934 | 23,107,363 |
| SME | 882,931 | 974,439 | 345,982 | 2,203,352 |
| Others | 898,082 | 677,967 | 1,213,455 | 2,789,504 |
| Total commercial | 8,477,118 | 11,379,730 | 8,243,371 | 28,100,219 |
| Consumer | | | | |
| Credit cards | 160,312 | 1,930,228 | 225,431 | 2,315,971 |
| Vehicle loans | 14,228 | 235,325 | 267,272 | 516,825 |
| Payroll loans | 18,699 | 837,488 | 3,841,331 | 4,697,518 |
| Others | 314,078 | 1,903,910 | 1,026,410 | 3,244,398 |
| Total consumer | 507,317 | 4,906,951 | 5,360,444 | 10,774,712 |
| Mortgage | | | | |
| VIS | 1,435 | 19,151 | 3,131,483 | 3,152,069 |
| Non-VIS | 24,746 | 192,968 | 8,082,796 | 8,300,510 |
| Total mortgage | 26,181 | 212,119 | 11,214,279 | 11,452,579 |
| Financial leases | 32,159 | 386,157 | 174,552 | 592,868 |
| Small business loan | 148,057 | 176,071 | 185,948 | 510,076 |
| Total foreign loans and financial leases | 9,190,832 | 17,061,028 | 25,178,594 | 51,430,454 |
| Total loans | 31,944,466 | 75,288,694 | 75,049,583 | 182,282,743 |
In general, the initial term of a loan will depend on the type of guarantee or collateral, the credit history of the borrower and the purpose of the loan. As of December 31, 2019, 58.83% of the Bank’s loan portfolio has a maturity of five years or less.
Loans interest rate allocation
The following table shows the interest rate allocation of the Bank’s loan portfolio due after one year and within one year or less:
| | As of December 31, 2019 |
| | In millions of COP |
| Loans with term of 1 year or more: | |
| Variable Rate | |
| Domestic-denominated | 68,828,665 |
| Foreign-denominated | 17,937,504 |
| Total | 86,766,169 |
| Fixed Rate | |
| Domestic-denominated | 39,269,990 |
| Foreign-denominated | 24,302,118 |
| Total | 63,572,108 |
| Loans with term of less than 1 year: | |
| Domestic-denominated | 22,753,634 |
| Foreign-denominated | 9,190,832 |
| Total | 31,944,466 |
| Total loans | 182,282,743 |
Loans by Economic Activity
The following table summarizes the Bank’s loan portfolio, for the periods indicated, by the principal activity of the borrower using the primary Standard Industrial Classification (SIC) codes:
| | As of December 31, |
| | 2019 | % | 2018 | % | 2017 | % | 2016 | % | 2015 | % |
| | In millions of COP, except percentages | | |
| Domestic | | | | | | | | | | |
| Agriculture | 3,931,913 | 3.00% | 3,804,075 | 3.10% | 3,533,671 | 3.00% | 3,360,479 | 3.10% | 4,330,757 | 4.20% |
| Petroleum and Mining Products | 923,375 | 0.71% | 1,082,816 | 0.80% | 909,127 | 0.80% | 1,670,126 | 1.50% | 1,791,910 | 1.70% |
| Food, Beverages and Tobacco | 6,107,103 | 4.67% | 5,865,111 | 4.70% | 5,640,910 | 4.80% | 4,992,305 | 4.60% | 5,141,738 | 5.00% |
| Chemical production | 3,383,655 | 2.59% | 3,566,746 | 2.90% | 3,341,248 | 2.90% | 3,184,196 | 2.90% | 2,871,547 | 2.80% |
| Government | 5,626,186 | 4.30% | 4,457,944 | 3.60% | 3,780,686 | 3.20% | 3,426,089 | 3.10% | 3,131,339 | 3.00% |
| Construction | 14,526,616 | 11.10% | 14,508,354 | 11.80% | 15,464,605 | 13.20% | 14,122,163 | 12.90% | 14,577,061 | 14.00% |
| Commerce and Tourism | 17,601,979 | 13.45% | 16,928,137 | 13.70% | 17,115,018 | 14.60% | 15,953,310 | 14.60% | 14,934,712 | 14.40% |
| Transport and Communications | 7,703,609 | 5.89% | 8,331,727 | 6.80% | 8,307,712 | 7.10% | 7,484,105 | 6.90% | 8,189,789 | 7.90% |
| Public services | 5,492,806 | 4.20% | 6,007,483 | 4.90% | 5,180,634 | 4.40% | 5,013,469 | 4.60% | 4,881,297 | 4.70% |
| Consumer services | 42,466,786 | 32.45% | 35,886,645 | 29.10% | 31,367,376 | 26.70% | 28,673,632 | 26.30% | 22,439,817 | 21.60% |
| Commercial services | 16,630,762 | 12.71% | 17,041,170 | 13.80% | 16,248,665 | 13.90% | 15,186,857 | 13.90% | 15,956,430 | 15.30% |
| Other Industries and Manufactured Products | 6,457,499 | 4.93% | 5,978,092 | 4.80% | 6,367,961 | 5.40% | 6,141,378 | 5.60% | 5,657,242 | 5.40% |
| Total domestic loans | 130,852,289 | 100.00% | 123,458,300 | 100.00% | 117,257,613 | 100.00% | 109,208,109 | 100.00% | 103,903,639 | 100.00% |
| Foreign | | | | | | | | | | |
| Agriculture | 1,948,089 | 3.79% | 2,548,078 | 5.00% | 2,171,525 | 5.00% | 2,210,219 | 5.20% | 1,942,147 | 4.70% |
| Petroleum and Mining Products | 148,222 | 0.29% | 181,789 | 0.40% | 65,991 | 0.20% | 96,463 | 0.30% | 355,825 | 0.90% |
| Food, Beverages and Tobacco | 629,948 | 1.22% | 320,596 | 0.60% | 808,493 | 1.90% | 556,798 | 1.30% | 330,038 | 0.80% |
| Chemical production | 62,995 | 0.12% | 12,561 | 0.00% | 172,763 | 0.40% | 218,010 | 0.50% | 331,651 | 0.80% |
| Government | 1,897 | 0.00% | 79,133 | 0.20% | 151,879 | 0.30% | 204,429 | 0.50% | 668,463 | 1.60% |
| Construction | 6,221,753 | 12.10% | 5,513,212 | 11.00% | 5,164,321 | 12.00% | 4,496,434 | 10.60% | 5,424,291 | 13.00% |
| Commerce and Tourism | 8,873,330 | 17.25% | 7,641,117 | 15.20% | 6,520,546 | 15.10% | 6,056,928 | 14.20% | 5,833,248 | 14.00% |
| Transport and Communications | 524,847 | 1.02% | 865,257 | 1.70% | 602,962 | 1.40% | 740,379 | 1.70% | 1,588,048 | 3.80% |
| Public services | 1,326,236 | 2.58% | 966,764 | 1.90% | 2,472,215 | 5.70% | 4,626,201 | 10.90% | 4,807,362 | 11.50% |
| Consumer services | 22,647,495 | 44.04% | 20,813,390 | 41.30% | 16,719,168 | 38.70% | 13,116,938 | 30.80% | 12,634,026 | 30.20% |
| Commercial services | 4,120,883 | 8.01% | 5,540,572 | 11.00% | 3,993,836 | 9.20% | 5,753,166 | 13.50% | 3,049,918 | 7.30% |
| Other Industries and Manufactured Products | 4,924,759 | 9.58% | 5,878,347 | 11.70% | 4,366,782 | 10.10% | 4,463,412 | 10.50% | 4,751,983 | 11.40% |
| Total foreign loans | 51,430,454 | 100.00% | 50,360,816 | 100.00% | 43,210,481 | 100.00% | 42,539,377 | 100.00% | 41,717,000 | 100.00% |
| Total Foreign and Domestic Loans | 182,282,743 | 100.00% | 173,819,116 | 100.00% | 160,468,094 | 100.00% | 151,747,486 | 100.00% | 145,620,639 | 100.00% |
Credit Categories
For the purpose of credit risk evaluation, loans and financial lease contracts are classified in accordance with the regulations of the SFC. For further details please see Note 31 to the Consolidated Financial Statements, section b. Credit Quality Analysis - Loans and Financial Leases.
The following table shows the Bank’s loan portfolio by type of loan for the relevant periods:
| | Loan Portfolio by Type of Loan as of December 31, |
| | 2019 | 2018 | 2017 | 2016 | 2015 |
| | In millions of COP |
| Commercial | 92,768,553 | 94,600,648 | 88,997,241 | 86,259,708 | 85,892,752 |
| Consumer | 39,700,670 | 31,993,381 | 27,646,114 | 23,925,279 | 21,170,615 |
| Small Business | 1,279,408 | 1,156,198 | 1,063,580 | 1,062,724 | 886,913 |
| Financial Leases | 24,550,829 | 23,198,204 | 22,248,951 | 21,343,923 | 20,551,576 |
| Mortgage | 23,983,283 | 22,870,685 | 20,512,208 | 19,155,852 | 17,118,783 |
| Total loans and advances to costumers and financial institutions | 182,282,743 | 173,819,116 | 160,468,094 | 151,747,486 | 145,620,639 |
| Total allowance for loans, advances and lease losses | (10,929,395) | (10,235,831) | (8,223,103) | (6,621,911) | (5,248,755) |
| Total loans and advances to customers and financial institutions, net | 171,353,348 | 163,583,285 | 152,244,991 | 145,125,575 | 140,371,884 |
Risk categories
The SFC provides the following minimum risk classifications, according to the financial situation of the borrower or the past-due days of the obligation. For the year ended December 31, 2019, the credit quality distribution is based on IFRS 9 (Expected credit losses) using the risk classification provided by the SFC. The following table is benchmarked to the SFC’s risk classification but is not designed to be the same. For further details please see Note 31 to the Consolidated Financial Statements, section b. Credit Quality Analysis - Loans and Financial Leases.
| | As of December 31, |
| | 2019 | % | 2018 | % | 2017 | % | 2016 | % | 2015 | % |
| | In millions of COP, except percentages |
| “A” Normal Risk | 141,795,223 | 77.8% | 137,163,996 | 78.9% | 140,558,163 | 87.6% | 136,471,216 | 89.9% | 131,999,143 | 90.6% |
| “B” Acceptable Risk | 21,582,915 | 11.8% | 19,225,526 | 11.1% | 9,189,969 | 5.7% | 7,319,360 | 4.8% | 7,682,616 | 5.3% |
| “C” Appreciable Risk | 6,531,386 | 3.6% | 5,200,350 | 3.0% | 3,844,704 | 2.4% | 3,582,671 | 2.4% | 2,438,541 | 1.7% |
| “D” Significant Risk | 3,413 | 0.0% | 4,032 | 0.0% | 4,456,958 | 2.8% | 2,499,271 | 1.7% | 1,821,582 | 1.3% |
| “E” Unrecoverable Risk | 12,369,806 | 6.8% | 12,225,212 | 7.0% | 2,418,300 | 1.5% | 1,874,968 | 1.2% | 1,678,757 | 1.1% |
| Total loans and financial leases | 182,282,743 | 100.0% | 173,819,116 | 100.0% | 160,468,094 | 100.0% | 151,747,486 | 100.0% | 145,620,639 | 100.0% |
| Loans classified as “C”, “D” and “E” as a percentage of total loans | 10.37% | | 10.03% | | 6.68% | | 5.24% | | 4.08% | |
The following table illustrates Bancolombia’s past-due loan portfolio by type of loan:
| | As of December 31, |
| | 2019 | % | 2018 | % | 2017 | % | 2016 | % | 2015 | % |
| | In millions of COP, except percentages |
| Domestic | | | | | | | | | | |
| Commercial | | | | | | | | | | |
| Corporate | 833,587 | 13.40% | 1,363,568 | 21.50% | 1,038,689 | 17.40% | 241,253 | 6.30% | 504,660 | 14.00% |
| SME | 1,102,487 | 17.73% | 1,145,007 | 18.10% | 1,290,982 | 21.70% | 882,037 | 23.20% | 637,404 | 17.70% |
| Others | 845,764 | 13.60% | 751,927 | 11.80% | 485,251 | 8.20% | 420,549 | 11.10% | 282,095 | 7.80% |
| Total commercial | 2,781,838 | 44.73% | 3,260,502 | 51.40% | 2,814,922 | 47.30% | 1,543,839 | 40.60% | 1,424,159 | 39.50% |
| Consumer | | | | | | | | | | |
| Credit cards | 275,441 | 4.43% | 287,104 | 4.50% | 385,717 | 6.50% | 211,526 | 5.50% | 207,429 | 5.80% |
| Vehicle loans | 155,405 | 2.50% | 177,472 | 2.80% | 203,972 | 3.40% | 201,865 | 5.30% | 133,846 | 3.70% |
| Payroll loans | 62,329 | 1.00% | 71,537 | 1.10% | 96,823 | 1.60% | 82,093 | 2.20% | 80,814 | 2.20% |
| Others | 1,012,702 | 16.28% | 648,135 | 10.20% | 569,176 | 9.50% | 308,457 | 8.10% | 186,994 | 5.20% |
| Total consumer | 1,505,877 | 24.21% | 1,184,248 | 18.60% | 1,255,688 | 21.00% | 803,941 | 21.10% | 609,083 | 16.90% |
| Mortgage | | | | | | | | | | |
| VIS | 254,730 | 4.10% | 277,917 | 4.40% | 294,002 | 4.90% | 243,107 | 6.40% | 197,425 | 5.40% |
| Non-VIS | 738,114 | 11.87% | 783,429 | 12.40% | 726,321 | 12.20% | 507,057 | 13.30% | 384,585 | 10.70% |
| Total mortgage | 992,844 | 15.97% | 1,061,346 | 16.80% | 1,020,323 | 17.10% | 750,164 | 19.70% | 582,010 | 16.10% |
| Financial Leases | 848,265 | 13.63% | 752,367 | 11.90% | 754,965 | 12.80% | 620,686 | 16.30% | 936,382 | 26.00% |
| Small Business Loan | 90,977 | 1.46% | 84,669 | 1.30% | 107,508 | 1.80% | 86,637 | 2.30% | 55,584 | 1.50% |
| Total domestic past due loans | 6,219,801 | 100% | 6,343,132 | 100% | 5,953,406 | 100% | 3,805,267 | 100% | 3,607,218 | 100% |
| Foreign | | | | | | | | | | |
| Commercial | | | | | | | | | | |
| Corporate | 356,240 | 16.03% | 230,902 | 12.90% | 208,000 | 12.40% | 210,395 | 13.30% | 275,131 | 20.80% |
| SME | 230,214 | 10.36% | 171,533 | 9.50% | 151,403 | 9.00% | 122,030 | 7.70% | 81,502 | 6.10% |
| Others | 228,155 | 10.26% | 133,573 | 7.40% | 74,982 | 4.50% | 30,101 | 2.00% | 53,343 | 4.00% |
| Total commercial | 814,609 | 36.65% | 536,008 | 29.80% | 434,385 | 25.90% | 362,526 | 23.00% | 409,976 | 30.90% |
| Consumer | | | | | | | | | | |
| Credit cards | 144,532 | 6.50% | 157,749 | 8.80% | 114,091 | 6.80% | 182,081 | 11.50% | 79,886 | 6.00% |
| Vehicle loans | 24,178 | 1.09% | 25,620 | 1.40% | 50,652 | 3.00% | 45,845 | 2.90% | 41,015 | 3.10% |
| Payroll loans | 182,204 | 8.20% | 150,415 | 8.40% | 151,383 | 9.00% | 176,966 | 11.20% | 142,623 | 10.70% |
| Others | 182,321 | 8.20% | 163,495 | 9.10% | 131,920 | 7.80% | 91,510 | 5.80% | 132,375 | 10.00% |
| Total consumer | 533,235 | 23.99% | 497,279 | 27.70% | 448,046 | 26.60% | 496,402 | 31.40% | 395,899 | 29.80% |
| Mortgage | | | | | | | | | | |
| VIS | 244,890 | 11.02% | 288,936 | 16.10% | 304,979 | 18.20% | 222,117 | 14.10% | 129,917 | 9.80% |
| Non-VIS | 540,265 | 24.31% | 399,198 | 22.20% | 435,784 | 26.10% | 437,407 | 27.70% | 350,552 | 26.40% |
| Total mortgage | 785,155 | 35.33% | 688,134 | 38.30% | 740,763 | 44.30% | 659,524 | 41.80% | 480,469 | 36.20% |
| Financial Leases | 24,156 | 1.09% | 12,647 | 0.70% | 13,824 | 0.80% | 27,620 | 1.70% | 23,381 | 1.80% |
| Small Business Loan | 65,694 | 2.94% | 63,151 | 3.50% | 39,774 | 2.40% | 32,694 | 2.10% | 17,167 | 1.30% |
| Total foreign past due loans | 2,222,849 | 100% | 1,797,219 | 100% | 1,676,792 | 100% | 1,578,766 | 100% | 1,326,892 | 100.00% |
| Total Foreign and Domestic past due loans | 8,442,650 | 100% | 8,140,351 | 100% | 7,630,198 | 100% | 5,384,033 | 100% | 4,934,110 | 100.00% |
Policies for the granting and review of credit
The Bank’s credit standards and policies aim to achieve a high level of credit quality in the Bank’s loan portfolio, efficiency in the processing of loans and the specific assignment of responsibilities for credit risk. For further details please see Note 31 of Consolidated Financial Statements, section a. Credit Risk Management - Loans and Advances.
E.4SUMMARY OF LOAN LOSS EXPERIENCE
Allowance for loans losses and advances and lease losses
The Bank records an allowance for loans and financial lease losses in accordance with IFRS as issued by the IASB. For further details regarding the regulation and methodologies for the calculation of such allowances please see Note 2 to the Consolidated Financial Statements.
The allowance as of December 31, 2018 and 2019 was estimated according to the expected credit loss methodology required by IFRS 9, whereas the estimations for the year ended as of December 31, 2017, 2016 and 2015 were computed under IAS 39. Therefore, the amounts for such periods are not comparable.
The following table sets forth the changes in the allowance for loan and financial lease losses:
| | Year Ended December 31, |
| | 2019 | 2018 | 2017 | 2016 | 2015 |
| | | In millions of COP |
| Balance at beginning of period | 10,235,831 | 8,223,103 | 6,621,911 | 5,248,755 | 4,789,257 |
| Domestic | 8,482,256 | 7,305,563 | 5,529,506 | 4,254,754 | 4,028,866 |
| Foreign | 1,753,575 | 917,540 | 1,092,405 | 994,001 | 760,391 |
| Domestic Discontinued Operations(1) | - | - | - | - | (282,098) |
| Effect of adoption of IFRS 9 | - | 1,035,061 | - | - | - |
| Domestic | - | 511,513 | - | - | - |
| Foreign | - | 523,548 | - | - | - |
| Balance at beginning of period January 1, 2018 | | 9,258,164 | | | |
| Domestic | - | 7,817,076 | - | - | - |
| Foreign | - | 1,441,088 | - | - | - |
| Loan purchases / Loan sales | (5,889) | (2,397) | - | 27,825 | - |
| Domestic | (5,889) | (1,105) | - | 27,825 | - |
| Foreign | - | (1,292) | - | - | - |
| Recovery of charged-off loans | 551,650 | 459,860 | 410,860 | 286,529 | 217,177 |
| Domestic | 390,240 | 311,082 | 241,361 | 176,532 | 140,218 |
| Foreign | 161,410 | 148,778 | 169,499 | 109,997 | 76,959 |
| Provisions for loan losses, net | 3,385,181 | 3,851,625 | 3,468,699 | 2,643,710 | 1,667,682 |
| Domestic | 2,359,177 | 3,351,563 | 3,172,602 | 2,239,239 | 1,502,696 |
| Foreign | 1,026,004 | 500,062 | 296,097 | 404,471 | 164,986 |
| Charge-offs | (3,730,380) | (3,815,912) | (2,275,300) | (1,533,202) | (1,422,055) |
| Domestic | (3,082,418) | (3,237,002) | (1,637,906) | (1,168,844) | (1,134,928) |
| Foreign | (647,962) | (578,910) | (637,394) | (364,358) | (287,127) |
| Adjusted interest Stage 3 | 473,716 | 285,412 | - | - | -s |
| Domestic | 410,218 | 240,642 | - | - | - |
| Foreign | 63,498 | 44,770 | - | - | - |
| Effect of difference in exchange rate | 19,286 | 199,079 | (3,067) | (51,706) | 278,792 |
| Foreign | 19,286 | 199,079 | (3,067) | (51,706) | 278,792 |
| Balance at end of year | 10,929,395 | 10,235,831 | 8,223,103 | 6,621,911 | 5,248,755 |
| Domestic | 8,553,584 | 8,482,256 | 7,305,563 | 5,529,506 | 4,254,754 |
| Foreign | 2,375,811 | 1,753,575 | 917,540 | 1,092,405 | 994,001 |
____________________________ | | | | | |
(1)As of December 31, 2015, Compañía de Financiamiento Tuya S.A. was considered a discontinued operation.
Recoveries of charged-off loans are recorded in the consolidated statement of income and are not included in provisions for loan losses.
The following table sets forth the allocation of the Bank’s allowance for loans and advances and lease losses by type of loan using the classification of the SFC:
| | | As of December 31, |
| | 2019 | 2018 | 2017 | 2016 | 2015 |
| | | In millions of COP |
| Commercial loans | 5,456,993 | 5,360,833 | 4,514,180 | 3,499,791 | 2,694,965 |
| Consumer loans | 3,445,818 | 2,892,891 | 2,291,829 | 1,791,123 | 1,321,281 |
| Small business loans | 140,516 | 137,373 | 140,591 | 110,015 | 80,586 |
| Financial leases | 1,025,403 | 990,970 | 631,402 | 567,046 | 579,151 |
| Mortgage | 860,665 | 853,764 | 645,101 | 653,936 | 572,772 |
| Total allowance for loans and advances and lease losses | 10,929,395 | 10,235,831 | 8,223,103 | 6,621,911 | 5,248,755 |
The following table sets forth the allocation of the Bank‘s allowance for loans and advances and lease losses by type of loan:
| | As of December 31 | | |
| | 2019 | % | 2018 | % | 2017 | % | 2016 | % | 2015 | % |
| (COP Million, except percentages) | | |
| Domestic | | | | | | | | | | |
| Commercial | | | | | | | | | | |
| Corporate | 1,838,476 | 21.49% | 2,342,882 | 27.7% | 1,973,071 | 27.0% | 1,354,366 | 24.5% | 960,222 | 22.2% |
| SME | 1,380,592 | 16.14% | 1,529,358 | 18.0% | 1,627,955 | 22.3% | 1,167,198 | 21.1% | 921,142 | 21.4% |
| Others | 1,026,176 | 12.00% | 816,964 | 9.6% | 594,592 | 8.2% | 582,366 | 10.5% | 472,685 | 11.0% |
| Total commercial | 4,245,244 | 49.63% | 4,689,204 | 55.3% | 4,195,618 | 57.5% | 3,103,930 | 56.1% | 2,354,049 | 54.6% |
| Consumer | | | | | | | | | | |
| Credit cards | 517,025 | 6.04% | 521,088 | 6.1% | 569,039 | 7.8% | 440,487 | 8.0% | 318,074 | 7.3% |
| Vehicle | 229,636 | 2.68% | 266,742 | 3.1% | 260,038 | 3.6% | 240,562 | 4.4% | 179,301 | 4.2% |
| Payroll loans | 203,598 | 2.38% | 202,448 | 2.4% | 178,978 | 2.4% | 166,777 | 3.0% | 149,609 | 3.5% |
| Others | 1,549,121 | 18.11% | 1,034,668 | 12.2% | 814,953 | 11.2% | 494,440 | 8.9% | 303,045 | 7.0% |
| Total consumer | 2,499,380 | 29.21% | 2,024,946 | 23.8% | 1,823,008 | 25.0% | 1,342,266 | 24.3% | 950,029 | 22.0% |
| Mortgage | | | | | | | | | | |
| VIS | 157,463 | 1.84% | 151,105 | 1.8% | 145,761 | 2.0% | 128,434 | 2.3% | 116,606 | 2.7% |
| Non-VIS | 534,733 | 6.25% | 532,866 | 6.3% | 396,662 | 5.4% | 307,174 | 5.6% | 265,927 | 6.2% |
| Total mortgage | 692,196 | 8.09% | 683,971 | 8.1% | 542,423 | 7.4% | 435,608 | 7.9% | 382,533 | 8.9% |
| Financial Leases | 1,002,603 | 11.74% | 973,072 | 11.5% | 617,266 | 8.4% | 546,710 | 9.9% | 553,317 | 12.8% |
| Small Business Loan | 114,161 | 1.33% | 111,063 | 1.3% | 127,248 | 1.7% | 100,992 | 1.8% | 72,636 | 1.7% |
| Total domestic allowance for loans and advances and lease losses | 8,553,584 | 100% | 8,482,256 | 100% | 7,305,563 | 100% | 5,529,506 | 100% | 4,312,564 | 100% |
| Foreign | | | | | | | | | | |
| Commercial | | | | | | | | | | |
| Corporate | 720,954 | 30.35% | 338,268 | 19.3% | 136,143 | 14.8% | 260,437 | 23.8% | 149,197 | 15.9% |
| SME | 177,723 | 7.48% | 166,143 | 9.5% | 92,354 | 10.1% | 84,812 | 7.8% | 73,699 | 7.9% |
| Others | 313,072 | 13.18% | 167,218 | 9.5% | 90,065 | 9.8% | 50,612 | 4.6% | 119,003 | 12.7% |
| Total commercial | 1,211,749 | 51.01% | 671,629 | 38.3% | 318,562 | 34.7% | 395,861 | 36.2% | 341,899 | 36.5% |
| Consumer | | | | | | | | | | |
| Credit card | 262,450 | 11.05% | 235,272 | 13.4% | 113,249 | 12.3% | 198,522 | 18.2% | 169,268 | 18.1% |
| Vehicle | 36,192 | 1.52% | 50,261 | 2.9% | 18,421 | 2.0% | 20,105 | 1.8% | 14,066 | 1.5% |
| Payroll loans | 411,203 | 17.31% | 386,719 | 22.1% | 195,282 | 21.3% | 140,130 | 12.8% | 128,856 | 13.8% |
| Others | 236,593 | 9.96% | 195,693 | 11.1% | 141,869 | 15.5% | 90,100 | 8.3% | 59,062 | 6.3% |
| Total consumer | 946,438 | 39.84% | 867,945 | 49.5% | 468,821 | 51.1% | 448,857 | 41.1% | 371,252 | 39.7% |
| Mortgage | | | | | | | | | | |
| VIS | 31,595 | 1.33% | 34,678 | 2.0% | 10,300 | 1.1% | 46,742 | 4.3% | 33,223 | 3.5% |
| Non-VIS | 136,874 | 5.76% | 135,115 | 7.7% | 92,378 | 10.1% | 171,586 | 15.7% | 157,019 | 16.8% |
| Total mortgage | 168,469 | 7.09% | 169,793 | 9.7% | 102,678 | 11.2% | 218,328 | 20.0% | 190,242 | 20.3% |
| Financial Leases | 22,800 | 0.95% | 17,898 | 1.0% | 14,136 | 1.5% | 20,336 | 1.9% | 24,848 | 2.7% |
| Small Business Loan | 26,355 | 1.11% | 26,310 | 1.5% | 13,343 | 1.5% | 9,023 | 0.8% | 7,950 | 0.8% |
| Total foreign allowance for loans and advances and lease losses | 2,375,811 | 100% | 1,753,575 | 100% | 917,540 | 100% | 1,092,405 | 100% | 936,191 | 100% |
| Total foreign and domestic allowance for loans and advances and lease losses | 10,929,395 | | 10,235,831 | | 8,223,103 | | 6,621,911 | | 5,248,755 | |
As of December 31, 2019, allowances for loans and financial lease losses amounted to COP 10,929 billion (6.00% of total loans), an increase of 6.78% as compared to COP 10,236 billion (5.89% of total loans) at the end of 2018.
Coverage, measured by the ratio of allowances for loans and advances and lease losses to past-due loans (overdue 30 or more days; excluding accrued interest), was 129.45% at December 31, 2019, higher than 125.74% at December 31, 2018. The increase in the coverage ratio is mainly explained by a better trend in the SME portfolio behavior.
CHARGE-OFFS
The following table shows the allocation of the Bank’s charge-offs of domestic and foreign loans by type of loan as of December 31, 2019, 2018, 2017, 2016 and 2015:
| | Year ended December 31, |
| | 2019 | 2018 | 2017 | 2016 | 2015 |
| | In millions of COP |
| Domestic | | | | | |
| Commercial | | | | | |
| Corporate | 961,994 | 518,394 | 113,211 | 41,489 | 122,963 |
| SME | 370,435 | 635,977 | 282,461 | 241,213 | 217,966 |
| Others | 156,984 | 248,681 | 230,705 | 185,756 | 91,742 |
| Total commercial | 1,489,413 | 1,403,052 | 626,377 | 468,458 | 432,671 |
| Consumer | | | | | |
| Credit cards | 787,450 | 934,624 | 274,972 | 213,878 | 167,805 |
| Vehicle loans | 101,926 | 119,030 | 18,734 | 5,971 | 81,139 |
| Payroll loans | 166,332 | 120,843 | 99,473 | 53,896 | 82,056 |
| Others | 315,347 | 370,157 | 468,950 | 298,658 | 137,115 |
| Total consumer | 1,371,055 | 1,544,654 | 862,129 | 572,403 | 468,115 |
| Mortgage | | | | | |
| VIS | 60,824 | 63,617 | 4,617 | 721 | 1,805 |
| Non-VIS | 11,399 | 19,897 | 12,691 | 15,102 | 165,913 |
| Total mortgage | 72,223 | 83,514 | 17,308 | 15,823 | 167,718 |
| Financial Leases | 93,886 | 131,487 | 76,045 | 75,743 | 35,393 |
| Small Business Loan | 55,841 | 74,295 | 56,047 | 36,417 | 31,031 |
| Total domestic charge-offs | 3,082,418 | 3,237,002 | 1,637,906 | 1,168,844 | 1,134,928 |
| Foreign | | | | | |
| Commercial | | | | | |
| Corporate | 48,294 | 49,934 | 159,428 | 15,193 | 22,676 |
| SME | 4,964 | 14,043 | 5509 | 166 | - |
| Others | 29,442 | 1,675 | 831 | 428 | - |
| Total commercial | 82,700 | 65,652 | 165,768 | 15,787 | 22,676 |
| Consumer | | | | | |
| Credit cards | 143,762 | 136,450 | 31,880 | 204,203 | 155,132 |
| Vehicle loans | 9,749 | 17,104 | 61 | 14,358 | 9,968 |
| Payroll loans | 137,622 | 139,203 | 372,363 | 99,328 | 81,089 |
| Others | 228,302 | 174,904 | 36,197 | 12,108 | 5,919 |
| Total consumer | 519,435 | 467,661 | 440,501 | 329,997 | 252,108 |
| Mortgage | | | | | |
| VIS | 8,275 | 6,414 | - | 7,814 | - |
| Non-VIS | 24,222 | 22,489 | 20,369 | 982 | 11,761 |
| Total mortgage | 32,497 | 28,903 | 20,369 | 8,796 | 11,761 |
| Financial Leases | 3,262 | 4,187 | 1,717 | 4,485 | 134 |
| Small Business Loan | 10,068 | 12,507 | 9,039 | 5293 | 448 |
| Total foreign charge-offs | 647,962 | 578,910 | 637,394 | 364,358 | 287,127 |
| Total foreign and domestic charge-offs | 3,730,380 | 3,815,912 | 2,275,300 | 1,533,202 | 1,422,055 |
The ratio of charge-offs to average outstanding loans for the years ended December 31, 2019, 2018, 2017, 2016 and 2015, was as follows:
| | Year ended December 31, |
| | 2019 | 2018 | 2017 | 2016 | 2015 |
| Ratio of charge-offs to average outstanding loans | 2.11% | 2.36% | 1.51% | 1.03% | 1.14% |
The Bank charges off loans that are classified as “unrecoverable”. For further details please see Note 2 of Consolidated Financial Statements, section 7.6.1 “Written-Off loan portfolio balances and related allowances”.
All write-offs must be approved by the Board of Directors, regardless of the amount to be written-off. Even if a loan is written off, management remains responsible for decisions in respect of the loan, and neither the Bank nor its subsidiaries are released from their obligation to pursue recovery as appropriate.
POTENTIAL PROBLEM LOANS
In order to carefully monitor the credit risk associated with clients, the Bank has established a committee that meets periodically to identify current situations or anticipate future situations that might generate a possible deterioration in the client’s ability to pay. In general, the clients are placed on this watchlist when they could face difficulties in the future in the repayment of their obligations with the Bank but who have had a good record of payment behavior. The reasons for placing a client on the watch list could relate to financial weakness factors specific to the client, or to factors such as the general level of economic activity, or any other external or internal events that could affect the client’s business.
As of December 31, 2019, loans included in the watch list amounted to COP 20,196 billion. The increase from COP 17,452 billion as of December 31, 2018, was driven by the addition of significant Corporate and SMEs clients that were classified principally in Level 2 - Medium Risk and Level 3 – High Risk.
| Watch List December 31, 2019 |
| Million COP |
| Risk Level | Amount | % | Allowance |
| Level 1 – Low Risk | 8,781,473 | 1.38% | 120,933 |
| Level 2 – Medium Risk | 3,908,092 | 5.78% | 225,881 |
| Level 3 – High Risk | 3,476,225 | 35.18% | 1,222,837 |
| Level 4 – Default | 4,030,707 | 65.27% | 2,630,816 |
| Total | 20,196,497 | 20.80% | 4,200,467 |
IMPAIRED LOANS
Following the adoption of IFRS 9, we define a credit as an impaired loan when there is an objective evidence of impairment that has an effect on the cash flow of the loan, or the loan is classified as Stage 3. Additionally, this category includes loans that have been restructured because of financial difficulties of the debtor, and for that reason, the Bank must grant a concession to the debtor, that it would not otherwise consider ("Trouble Debt Restructuring loans" - TDRs).
Prior to the adoption of IFRS 9, we used a different definition of impaired loans, as a credit for which there was evidence of impairment that had an effect on the cash flow (although the two definitions are not significantly different). The following investments for impaired loans for the year ended as of December 31, 2017, 2016 and 2015 are disclosed under IAS 39, therefore the amounts are not comparable.
Under IFRS, all credits are accounted for in an accrual status, although they are classified as “impaired loans”.
The following table presents the recorded investment for impaired loans:
| | As of December 31, |
| | 2019 | 2018 | 2017 | 2016 | 2015 |
| | Domestic | Foreign | Total | Domestic | Foreign | Total | Domestic | Foreign | Total | Domestic | Foreign | Total | Domestic | Foreign | Total |
| In millions of COP |
| Commercial | | | | | | | | | | | | | | | |
| Corporate | 2,626,826 | 3,224,696 | 5,851,522 | 3,387,081 | 1,608,805 | 4,995,886 | 3,957,150 | 758,029 | 4,715,179 | 3,001,953 | 1,104,935 | 4,106,888 | 1,468,122 | 401,920 | 1,870,042 |
| SME | 1,521,438 | 376,361 | 1,897,799 | 1,708,709 | 367,142 | 2,075,851 | 2,081,996 | 291,015 | 2,373,011 | 1,499,054 | 138,604 | 1,637,658 | 1,114,816 | 128,125 | 1,242,941 |
| Others | 1,535,320 | 469,255 | 2,004,575 | 1,270,982 | 432,933 | 1,703,915 | 804,266 | 214,645 | 1,018,911 | 894,642 | 151,274 | 1,045,916 | 661,481 | 187,413 | 848,894 |
| Total Commercial | 5,683,584 | 4,070,312 | 9,753,896 | 6,366,772 | 2,408,880 | 8,775,652 | 6,843,412 | 1,263,689 | 8,107,101 | 5,395,649 | 1,394,813 | 6,790,462 | 3,244,419 | 717,458 | 3,961,877 |
| Consumer | | | | | | | | | | | | | | | |
| Credit card | 330,934 | 285,961 | 616,895 | 350,668 | 227,360 | 578,028 | 486,736 | 182,356 | 669,092 | 308,158 | 177,073 | 485,231 | 554,725 | 392,490 | 947,215 |
| Vehicle loans | 202,005 | 63,263 | 265,268 | 214,135 | 76,337 | 290,472 | 286,865 | 16,287 | 303,152 | 244,618 | 19,567 | 264,185 | 201,456 | 9,886 | 211,342 |
| Payroll loan | 92,954 | 410,397 | 503,351 | 100,044 | 358,726 | 458,770 | 144,491 | 238,685 | 383,176 | 127,866 | 469,494 | 597,360 | 118,015 | 24,002 | 142,017 |
| Others | 916,228 | 388,872 | 1,305,100 | 613,385 | 339,299 | 952,684 | 661,521 | 334,643 | 996,164 | 371,018 | 103,617 | 474,635 | 223,080 | 138,428 | 361,508 |
| Total Consumer | 1,542,121 | 1,148,493 | 2,690,614 | 1,278,232 | 1,001,722 | 2,279,954 | 1,579,613 | 771,971 | 2,351,584 | 1,051,660 | 769,751 | 1,821,411 | 1,097,276 | 564,806 | 1,662,082 |
| Residential Mortgage | | | | | | | | | | | | | | | |
| Vis(1) | 204,065 | 49,625 | 253,690 | 201,256 | 52,205 | 253,461 | 172,273 | 61,365 | 233,638 | 156,747 | 54,439 | 211,186 | 136,628 | 305 | 136,933 |
| No Vis | 641,767 | 783,277 | 1,425,044 | 651,177 | 717,611 | 1,368,788 | 474,560 | 407,588 | 882,148 | 356,181 | 647,694 | 1,003,875 | 291,128 | 571,248 | 862,376 |
| Total residential mortgage | 845,832 | 832,902 | 1,678,734 | 852,433 | 769,816 | 1,622,249 | 646,833 | 468,953 | 1,115,786 | 512,928 | 702,133 | 1,215,061 | 427,756 | 571,553 | 999,309 |
| Small Business Loans | 78,241 | 80,669 | 158,910 | 75,559 | 87,487 | 163,046 | 101,955 | 33,050 | 135,005 | 81,769 | 22,705 | 104,474 | 58,875 | 1,365 | 60,240 |
| Financial leases | 1,607,394 | 50,972 | 1,658,366 | 1,669,578 | 49,619 | 1,719,197 | 1,712,023 | 11,319 | 1,723,342 | 1,237,165 | 34,061 | 1,271,226 | 865,412 | 12,547 | 877,959 |
| Total | 9,757,172 | 6,183,348 | 15,940,520 | 10,242,574 | 4,317,524 | 14,560,098 | 10,883,836 | 2,548,982 | 13,432,818 | 8,279,171 | 2,923,463 | 11,202,634 | 5,693,738 | 1,867,729 | 7,561,467 |
____________________________
| (1) | VIS refers in Spanish to “Vivienda de interes Social”, a term used to describe residential mortgages granted by financial institutions in amounts that are less than 135 legal minimum monthly salaries in Colombia ( as of December 31, 2019 cop 112). |
The following table shows the gross interest income that would have been recorded in the period ended if the impaired loans had been current in accordance with their original terms and had been outstanding throughout the period or since origination and the amount of interest income on those loans that were included in net income for the period:
| | 2019 | 2018 | 2017 |
| | In millions of COP |
| | Domestic | Foreign | Total | Domestic | Foreign | Total | Domestic | Foreign | Total |
| Interest income recognized in net income for the period. | 396,663 | 428,267 | 824,930 | 335,650 | 363,659 | 699,309 | 464,723 | 415,354 | 880,077 |
| The gross interest income that would have been recorded in the period that ended if the loans had been current in accordance with their original terms and had been outstanding throughout the period or since origination, if held for part of the period. | 396,552 | 434,605 | 831,156 | 335,434 | 359,561 | 694,994 | 477,708 | 467,915 | 945,623 |
CROSS-BORDER OUTSTANDING LOANS AND INVESTMENTS
As of December 31, 2019, 2018, and 2017, total cross-border outstanding loans and investments amounted to approximately USD 17,831 million, USD 17,670 million, USD 16,309 million, respectively. As of December 31, 2019, total outstanding loans to borrowers in foreign countries amounted to USD 15,694 million, and total investments were USD 2,137 million. As of December 31, 2019, total cross-border outstanding loans and investments represented 24.75% of total assets.
The Bank had no cross-border outstanding acceptances, interest-earning deposits with other banks or any other monetary assets denominated in pesos or other non-local currencies, in which the total exceeded 1% of consolidated total assets at December 31, 2019, 2018 and 2017.
The following table presents information with respect to the Bank’s cross-border outstanding loans and investments at December 31, 2019, 2018 and 2017:
| | As of December 31, |
| | 2019 | 2018 | 2017 |
| | thousands of U.S. dollars |
| Governments and official institutions | | | | | |
| United States | USD | 638,741 | USD | 455,514 | USD | 235,104 |
| Panama | | 405,244 | | 297,822 | | 371,729 |
| Guatemala | | 345,658 | | 431,990 | | 490,068 |
| El Salvador | | 101,477 | | 98,191 | | 97,348 |
| Mexico | | 21,916 | | 27,878 | | 7,404 |
| Costa Rica | | 4,262 | | 14,397 | | 29,424 |
| Dominican Republic | | 2,811 | | - | | - |
| Chile | | - | | 501 | | - |
| Peru | | - | | 262 | | - |
| Banks and other financial institutions | | | | | | |
| Panama | USD | 103,519 | USD | 111,638 | USD | 110,535 |
| Guatemala | | 95,478 | | 156,641 | | 163,347 |
| United States | | 33,325 | | 3,009 | | 3,031 |
| Peru | | 25,207 | | 5,290 | | 15,263 |
| El Salvador | | 20,650 | | 26,048 | | 11,648 |
| Switzerland | | 9,173 | | - | | - |
| Venezuela | | 8,218 | | 9,931 | | 7,885 |
| Brazil | | 5,013 | | 4,949 | | 4,775 |
| Canada | | 4,997 | | - | | - |
| Costa Rica | | 3,864 | | 7,670 | | 39,315 |
| Republic of China | | 1,498 | | - | | - |
| Mexico | | 546 | | - | | - |
| | As of December 31, |
| | 2019 | 2018 | 2017 |
| | thousands of U.S. dollars |
| Chile | | - | | 8,110 | | 10,482 |
| Cayman Islands | | - | | - | | 2,877 |
| Honduras | | - | | - | | 2,546 |
| Commercial and industrial loans | | | | | | |
| Panama | USD | 3,231,436 | USD | 3,835,801 | USD | 3,270,293 |
| Guatemala | | 2,643,755 | | 2,397,652 | | 2,164,020 |
| El Salvador | | 815,009 | | 1,730,204 | | 837,985 |
| Costa Rica | | 294,364 | | 287,602 | | 174,863 |
| Peru | | 89,445 | | 17,432 | | 199,766 |
| Nicaragua | | 77,172 | | 88,342 | | 69,921 |
| England | | 41,250 | | - | | - |
| United States | | 36,105 | | 73,301 | | 68,805 |
| Honduras | | 24,306 | | 28,840 | | 32,834 |
| Brazil | | 18,018 | | 215 | | 215 |
| Cayman Islands | | 16,104 | | 33,659 | | - |
| Belize | | 14,385 | | 14,638 | | 15,232 |
| Ecuador | | 10,205 | | 108 | | 125 |
| Chile | | 9,725 | | 11,814 | | 14,101 |
| Mexico | | 2,425 | | 22,218 | | 734 |
| Dominican Republic | | 1,744 | | 51,647 | | 67,196 |
| Puerto Rico | | 99 | | 103 | | 7 |
| British Virgin Island | | 5 | | - | | - |
| Uruguay | | - | | 819 | | 2,458 |
| Others | | 5,226 | | 3,808 | | 2,134 |
| Other loans | | | | | | |
| Panama | USD | 4,417,099 | USD | 3,761,448 | USD | 4,262,289 |
| El Salvador | | 2,766,868 | | 2,424,953 | | 2,274,746 |
| Guatemala | | 1,116,098 | | 979,027 | | 952,949 |
| United States | | 150,790 | | 104,004 | | 92,668 |
| Costa Rica | | 68,277 | | 39,657 | | 96,141 |
| Spain | | 50,130 | | 38,012 | | 39,492 |
| Canada | | 15,066 | | 9,219 | | 8,937 |
| England | | 12,945 | | 8,313 | | 7,835 |
| Australia | | 12,359 | | 8,204 | | 7,600 |
| Mexico | | 6,678 | | 4,906 | | 5,194 |
| Chile | | 6,256 | | 3,531 | | 2,965 |
| France | | 5,584 | | 3,579 | | 3,324 |
| British Virgin Island | | 5,310 | | - | | - |
| Peru | | 3,622 | | 2,278 | | 2,133 |
| Italy | | 2,863 | | 1,996 | | 1,692 |
| Venezuela | | 2,740 | | 1,902 | | 3,321 |
| Arab Emirates | | 2,664 | | 1,661 | | - |
| Switzerland | | 2,596 | | 1,936 | | - |
| Argentina | | 2,556 | | 1,629 | | 1,772 |
| Germany | | 2,170 | | 1,291 | | 1,148 |
| Brazil | | 2,158 | | 5,695 | | 4,995 |
| Ecuador | | 1,987 | | 1,359 | | 2,041 |
| Honduras | | 1,965 | | 1,251 | | 1,531 |
| Netherland | | 910 | | - | | - |
| Nicaragua | | 840 | | 1,326 | | 4,498 |
| Belgium and Luxembourg | | 753 | | 561 | | 381 |
| Bolivia | | 302 | | 169 | | 252 |
| Uruguay | | 145 | | 138 | | 151 |
| Others | | 7,029 | | 4,370 | | 7,250 |
| Total Cross-Border Outstanding Loans and Investments | USD | 17,831,135 | USD | 17,670,459 | USD | 16,308,775 |
The following table shows the composition of the Bank’s deposits for 2019, 2018 and 2017:
| | As of December 31, 2019 |
| | 2019 | 2018 | 2017 |
| | In millions of COP |
| Non-interest bearing deposits: | | | |
| Checking deposits | 19,071,221 | 18,590,056 | 16,284,742 |
| Other deposits | 1,495,724 | 1,541,878 | 1,676,399 |
| Total | 20,566,945 | 20,131,934 | 17,961,141 |
| Interest bearing deposits: | | | |
| Checking deposits | 6,088,455 | 5,508,017 | 5,780,905 |
| Time deposits | 63,635,078 | 56,853,141 | 53,961,586 |
| Savings deposits | 66,914,834 | 59,635,379 | 54,255,583 |
| Total | 136,638,367 | 121,996,537 | 113,998,074 |
| Total deposits | 157,205,312 | 142,128,471 | 131,959,215 |
The following table shows the time deposits held by the Bank as of December 31 2019, classified by amount and maturity:
| | At December 31, 2019 |
| | Peso - Denominated | Foreign Exchange-
Denominated | Total |
| | In millions of COP |
| Time deposits higher than USD 100,000(1) | | | |
| Up to 3 months | 5,051,454 | 7,141,813 | 12,193,267 |
| From 3 to 6 months | 4,387,417 | 4,418,668 | 8,806,085 |
| From 6 to 12 months | 5,893,055 | 6,948,505 | 12,841,560 |
| More than 12 months | 9,901,198 | 8,787,682 | 18,688,880 |
| Time deposits higher than USD 100,000(1) | 25,233,124 | 27,296,668 | 52,529,792 |
| Time deposits less than USD 100,000(1) | 7,719,193 | 3,386,093 | 11,105,286 |
| Total | 32,952,317 | 30,682,761 | 63,635,078 |
| | ____________________________ |
| (1) | Approximately COP 328 million at the Representative Market Rate as of December 31, 2019. |
As of December 31, 2019, the time deposits greater than USD 100,000 collected by foreign subsidiaries amounted to COP 27,296,668 million.
| E.6 | RETURN ON EQUITY AND ASSETS |
The following table presents certain selected financial ratios of the Bank for the periods indicated:
| Return on equity and assets(1) | Year
Ended December 31, |
| 2019 | 2018 | 2017 |
| | In percentages |
| Net income as a percentage of: | | | |
| Average total assets(2) | 1.35 | 1.28 | 1.30 |
| Average stockholders’ equity attributable to the owners of the parent company(3) | 12.09 | 11.50 | 11.99 |
| Average stockholders’ equity(4) | 11.63 | 11.34 | 11.95 |
| Dividends declared per share as a percentage of consolidated net income per share(5) | 49.62 | 38.65 | 36.69 |
| Average stockholders’ equity as a percentage of average total assets | 11.96 | 11.86 | 11.47 |
| Return on interest-earning assets(6) | 9.01 | 9.11 | 10.04 |
____________________________
| (1) | The Bank´s average total assets and stockholder’s equity were calculated considering the last 13 monthly IFRS balances. |
| (2) | Defined as net income attributable to equity holders of the parent company divided by the average total assets. |
| (3) | Defined as net income attributable to equity holders of the parent company divided by the average stockholders’ equity attributable to the owners of the parent company. |
| (4) | Defined as net income divided by the average stockholders’ equity. |
| (5) | Dividends are paid based on unconsolidated earnings. Net income per share is calculated using the average number of common and preference shares outstanding during the year. |
| (6) | Defined as total interest earned divided by average interest-earning assets. |
The following table sets forth certain information regarding the short-term borrowings by the Bank for the periods indicated:
| | As of December 31,(1) |
| | 2019 | | 2018 | 2017 |
| | Amount | Rate(2) | | Amount | Rate(2) | Amount | Rate(2) |
| In millions of COP, except percentages |
| End of period | 6,634,001 | | 5.06% | | 9,970,304 | | 3.97% | | 7,612,323 | | 4.87% |
| Weighted average during period | 8,551,305 | | 3.93% | | 8,058,680 | | 4.91% | | 9,289,645 | | 3.99% |
| Maximum amount of borrowing at any month end | 9,539,533 | (3) | | | 9,994,669 | (4) | | | 10,513,614 | (5) | |
| Interest paid during the year | 335,790 | | | | 395,574 | | | | 370,353 | | |
____________________________
| (1) | Short-term borrowings with other financial institutions with remaining maturity less than one year. For further information see Note 17 Borrowings from other financial institutions to the Financial Statements. |
| (2) | Corresponds to the ratio of interest paid to short-term borrowings. |
| (3) | The amount corresponds to the end of May. |
| (4) | The amount corresponds to the end of November. |
| (5) | The amount corresponds to the end of August. |
| F. | UNRESOLVED STAFF COMMENTS |
None.
| ITEM 5 | OPERATING AND FINANCIAL REVIEW AND PROSPECTS |
The following discussion should be read in conjunction with Part II, Item 6 “Selected Financial Data” of this Annual Report and the Bank’s Consolidated Financial Statements and the related notes thereto included in this Annual Report.
The following discussion includes information regarding future financial performance and plans, targets, aspirations, expectations, and objectives of management, which constitute forward-looking statements within the meaning of the safe harbor provisions of the U.S. Private Securities Litigation Reform Act of 1995. It is possible that the Bank’s actual results may differ materially from the results discussed in the forward-looking statements because of a number of risks and uncertainties. In addition, please refer to the discussion in Item 3. “Key Information – D. Risk Factors” for a description of risks and uncertainties affecting the Bank’s business and financial results and to Item 4 B. “Business Overview, B.9 – Cybersecurity Framework”, for a description of the Bank’s cybersecurity framework.
The following discussion does not address certain items in respect of 2017 in reliance on amendments to disclosure requirements adopted by the SEC in 2019. A discussion of these items may be found in the Bank’s Annual Report on Form 20-F for the year ended December 31, 2018, filed with the SEC on April 25, 2019.
IMPACT OF ECONOMIC AND MONETARY POLICIES ON BANCOLOMBIA’S RESULTS
Bancolombia’s results of operations are affected by macroeconomic factors principally in Colombia, but also in the other countries where the Bank operates. The most important variables include GDP growth, interest rates, inflation and exchange rates, principally the COP/USD exchange rate. The following discussion summarizes the trends of these measures in Colombia in 2019.
Economic activity
Colombia’s real GDP growth was 3.3% in 2019, higher than the 2.7% reached in 2018. The improvement in the pace of growth is mainly explained by acceleration in gross capital formation from the private sector and a faster growth in private consumption.
The behavior of key GDP components in 2019 compared with 2018 was as follows: investment increased 4.3%, consumption increased 4.6%, imports increased 9.2% and exports increased 3.1%. In 2019, gross capital formation represented 22.3% of GDP, household consumption represented 68.5%, government consumption 15.5%, exports 15.9% and imports 22.2%.
The sectors that led growth during the year were education and healthcare services (4.9% increase), financial services (5.9% increase) and retail sales (4.9% increase).
Interest Rates
As of December 31, 2019, the Colombian Central Bank’s benchmark interest rate stood at 4.25%. This level has not changed since the last two cuts in 2018. The stability in monetary policy reflects an environment of controlled inflation levels that does not represent a concern for the Central Bank’s goals.
The Central Bank aims to maintain long term inflation rates within the long-term targeted range (between 2% and 4%), and in order to do so, it may increase interest rates when the economy grows faster.
Inflation
The year-end inflation rate for 2019 was 3.80%, higher than the 3.18% recorded for 2018. The components that led inflation in 2019 were food and nonalcoholic beverages (5.50% increase), education (5.75% increase), alcoholic beverages and tobacco (5.48% increase) and restaurants and hotels (4.23% increase).
The inflation levels are within the Central Bank´s target and indicates no significant changes to the monetary policy in the short term.
Exchange rate
The Colombian Peso depreciated 0.84% versus the U.S. dollar during 2019, compared to a depreciation of 8.91% in 2018. Even though the depreciation was not as high as in 2018, the exchange rate experimented high volatility throughout 2019 with a maximum of 3,522.48 and a minimum of 3,072.01.
Outlook
Future prospects for the Colombian financial sector in general, and for Bancolombia in particular, are expected to depend on the factors listed below:
| Favorable factors for the Colombian economy – medium-term | Unfavorable factors for the Colombian economy – medium term |
Strength of private consumption, because of tax relief for the low-income households and increase of spending capacity. Better perspective of investment form private sector and main infrastructure projects. Inflation between the central bank´s target. Strong local capital markets, with little exposure to “toxic assets” and with low currency mismatches. Better prospects for growth in the near term, derived from improving macroeconomic conditions. A well-capitalized banking system. Well-developed supervision and regulation of the financial system. Adequate international reserves compared to the level of short-term debt. | Underdeveloped infrastructure that continues to constrain growth. Oil and gas dependent export activity. Despite successful efforts to diversify export markets, continued concentration in specific export destinations, particularly the United States. Exchange rate volatility and depreciation that directly impacts inflation and economic growth. Large current account deficit and fiscal pressures. Introduction of additional tax reform measures due to fiscal burden in the near term. Moderate growth of the US economy that can decrease the demand of Colombian goods. Uncertainties regarding the future post-conflict. High unemployment and household indebtedness. Adverse effects derived from the COVID – 19 pandemic. |
GENERAL DISCUSSION OF THE CHANGES IN RESULTS FOR 2019 VERSUS 2018
Summary
During 2019, Bancolombia maintained its strong competitive position and full-service financial model, including the diversity of its leading franchises. For the year 2019, net income attributable to equity holders of the parent company totaled COP 3,118 billion (COP 3,301 per share, including both common and preferred shares, and USD 3.40 per ADR), which represents an increase of 17.2% as compared to COP 2,659 billion of net income attributable to equity holders of the parent company for the fiscal year 2018.
Bancolombia’s average return on stockholders’ equity for 2019 was 12.09%, up from 11.50% in 2018.
The net interest and valuation income margin decreased in 2019 and stood at 5.67% for the year, down from 5.80% in 2018.
Credit impairment charges, net of recoveries, totaled COP 3,411 billion for 2019, down 11.24% from COP 3,843 billion in 2018. The lower amount of provisions was the result of improvement in the portfolio quality and reduction in new past due loan formation.
Loans and advances to customers and financial Institutions net grew 4.75% during the year. This performance was driven primarily by consumer loans. The total loan book denominated in COP grew 8.70%% while USD-denominated loans declined 3.00% for the year.
Allowance for loans and lease losses represented 5.71% of total loans and 133.94% of 30-day past-due loans (excluding accrued interest) at the end of 2019 compared with 5.55% of total loans and 128.21% of past-due loans (excluding accrued interest) in December 31, 2018.
The bank expects that this coverage will provide adequate coverage for expected credit losses. Capital adequacy was 12.82% (Tier 1 ratio of 9.57%), lower than the 13.47% (Tier 1 ratio of 10.15%) reported at the end of 2018, principally due to the growth of risk weighted assets including market risk and depreciation of the COP against the USD.
Deposits by customers increased 10.61% during 2019, while the ratio of net loans to deposits was 109% at the end of the year, down from 115.1% in December 31, 2018.
Net interest margin and valuation income on financial instruments before impairment on loans and financial leases and off-balance sheet credit instruments
For 2019, net interest income and valuation was COP 11,201 billion, up 7.23% from COP 10,446 billion in 2018. This performance is the result of the combined effect of growth in the consumer loan portfolio during the year and the effort to decrease the funding cost by promoting increases in savings and checking accounts.
The weighted average nominal interest rate on loans and financial leases ended at 9.4% in 2019 down from 9.6% in 2018. At the same time, interest income, which is the sum of interest on loans, financial leases, overnight funds and interest and valuation income from investment securities, totaled COP 17,381 billion in 2019, up 7.84%% as compared to COP 16,117 billion in 2018 because of lower net interest margins partially offset by higher loan balances.
Interest on investment securities, which includes, among other items, the interest paid or accrued on debt instruments and mark-to-market valuation adjustments, totaled COP 524 billion in 2019, 36.1% higher than 2018. During 2019, yields of Colombian treasury securities declined and this contributed to greater positive mark-to-market valuation adjustments on this portfolio. Also, the securities portfolio was larger, on average, in 2019 as compared to 2018.
Net interest margin from continuing operations decreased 14 basis points from 5.80% to 5.67% during the year. This reduction is mainly explained by the adoption of IFRS 16, which increased the interest expenses on liabilities associated to leasing agreements.
The performance of Net Interest income and valuation during 2019 was explained by the evolution of margins, as well as the growth in volumes. The 13 basis points contraction in net interest margins during 2019 was offset by the 4.9% expansion of the gross loan portfolio. As a result of the combination of margins and volumes, the revenues associated to the lending business were down only by a small percentage.
The strategy implemented by Bancolombia in recent years has consisted in increasing the proportion of consumer loans in the portfolio. While in 2018, it represented 18.5% of total loans, in 2019 it represented 21.8%. The way to increase the balance of consumer loans in both, nominal and relative terms, has been focused on the origination of pre-approved loans to selected clients. This way, the customers with the best risk-adjusted returns are granted lines of credit for personal loans, car loans and credit cards. The goal of this strategy is to defend margins, optimize the capital allocation and maintain the credit quality within the risk appetite boundaries.
Bancolombia was active in the deposits markets to secure the necessary funding. Interest rates declined during the first half of the year, releasing pressure from the cost of this funding source. Interest rate cuts tend to put pressure on margins because of the asset-sensitive nature of the Bank’s balance sheet. Nevertheless, during the latter part of 2019, management’s goal has been to maintain a low sensitivity of the balance sheet in order to avoid potential pressures on margins due to decreases in reference rates.
Interest expenses totaled COP 6,180 billion in 2019, up 8.99% as compared to COP 5,670 billion in 2018. The increase in interest expenses is mainly explained by the increase on total deposits and the increase in interest right use of assets. Overall, the average interest rate paid on interest-bearing liabilities was 3.3 % in 2019, lower than the 3.4% of 2018.
Fees and Commissions, Net
The following table lists the principal categories of revenue-producing fees and commissions for the years ended December, 31 2019 and 2018 along with year-to-year variations:
As of December 31, 2019
| | Banking Colombia | Banking Panama | Banking El Salvador | Banking Guatemala | Trust | Investment Banking | Brokerage | Off Shore | All Other Segments | Total before eliminations | Adjustments for consolidation purposes(1) | Total after eliminations |
| Revenue from contracts with customers(1) | In millions of COP |
| Fees and Commissions | | | | | | | | | | | | |
| Banking services | 422,943 | 77,976 | 99,222 | 52,627 | - | - | - | 15,683 | - | 668,451 | - | 668,451 |
| Credit and debit card fees and commercial establishments | 1,421,039 | 200,372 | 117,541 | 78,764 | - | - | - | 4,230 | - | 1,821,946 | - | 1,821,946 |
| Brokerage | - | 7,893 | - | 24 | - | - | 18,617 | - | - | 26,534 | - | 26,534 |
| Acceptances, Guarantees and Standby Letters of Credit | 32,829 | 14,369 | 5,541 | 2,440 | - | - | - | 844 | - | 56,023 | - | 56,023 |
| Trust | - | 13,033 | 1,713 | 572 | 349,402 | - | 80,534 | 41 | 509 | 445,804 | - | 445,804 |
| Securities brokerage | - | 391 | 1,496 | - | - | 30,142 | 6,961 | - | - | 38,990 | - | 38,990 |
| Bancassurance | 607,758 | 35,014 | 160 | - | 36 | 7 | 51 | - | - | 643,026 | - | 643,026 |
| Payment and collections | 623,758 | - | - | - | - | - | - | - | - | 623,758 | - | 623,758 |
| Others | 161,420 | 1,007 | 42,636 | 36,427 | - | 680 | 7,201 | 5,002 | 79 | 254,452 | (12) | 254,440 |
| Total revenue from contracts with customers | 3,269,747 | 350,055 | 268,309 | 170,854 | 349,438 | 30,829 | 113,364 | 25,800 | 588 | 4,578,984 | (12) | 4,578,972 |
| (1) | For further information about composition of the Bank’ operating segments see Note 3 Operating segments. |
As of December 31, 2018
| | Banking Colombia | Banking Panama | Banking El Salvador | Banking Guatemala | Trust | Investment Banking | Brokerage | Off Shore | All Other Segments | Total before eliminations | Adjustments for consolidation purposes(1) | Total after eliminations |
| Revenue from contracts with customers(1) | In millions of COP |
| Fees and Commissions | | | | | | | | | | | | |
| Banking services | 370,671 | 66,569 | 85,615 | 39,610 | - | - | - | 12,783 | - | 575,248 | - | 575,248 |
| Credit and debit card fees and commercial establishments | 1,258,047 | 185,466 | 97,163 | 66,731 | - | - | - | 3,707 | - | 1,611,114 | - | 1,611,114 |
| Brokerage | - | 7,033 | - | 29 | - | - | 20,012 | - | - | 27,074 | - | 27,074 |
| Acceptances, Guarantees and Standby Letters of Credit | 33,313 | 15,352 | 4,749 | 3,055 | - | - | - | 897 | - | 57,366 | - | 57,366 |
| Trust | - | 8,184 | 1,411 | 645 | 313,886 | - | 81,502 | 37 | 104 | 405,769 | - | 405,769 |
| Securities brokerage | - | 1,200 | 1,212 | - | - | 20,262 | 9,530 | - | - | 32,204 | - | 32,204 |
| Bancassurance | 495,232 | 28,466 | 112 | - | - | - | - | - | - | 523,810 | - | 523,810 |
| Payment and collections | 559,139 | - | - | 4,084 | - | - | - | - | - | 563,223 | - | 563,223 |
| Others | 124,900 | 492 | 36,852 | 27,099 | 22 | 9 | 2,926 | 3,416 | 2,884 | 198,600 | (149) | 198,451 |
| Total revenue from contracts with customers | 2,841,302 | 312,762 | 227,114 | 141,253 | 313,908 | 20,271 | 113,970 | 20,840 | 2,988 | 3,994,408 | (149) | 3,994,259 |
| (1) | For further information about composition of the Bank’ operating segments see Note 3 Operating segments. |
| Growth |
| | 2019 | VS | 2018 |
| | COP | | % |
| Revenue from contracts with customers(1) | | | |
| Banking services | 93,203 | | 16.20% |
| Credit and debit card fees and commercial establishments | 210,832 | | 13.09% |
| Brokerage | (540) | | (1.99%) |
| Acceptances, Guarantees and Standby Letters of Credit | (1,343) | | (2.34%) |
| Trust | 40,035 | | 9.87% |
| Securities brokerage | 6,786 | | 21.07% |
| Bancassurance | 119,216 | | 22.76% |
| Payments and collections | 60,535 | | 10.75% |
| Others | 55,989 | | 28.21% |
| Total revenue from contracts with customers | 584,713 | | 14.64% |
| | | | |
Fees and commissions expenses
| | Year | Growth |
| | 2019 | 2018 | 2019-2018 |
| | In millions of COP |
| Banking services | (630,583) | (542,628) | (87,955) | 16.21% |
| Call center and website | (423,630) | (309,403) | (114,227) | 36.92% |
| Others | (499,026) | (361,025) | (138,001) | 38.22% |
| Total fees and commissions expenses | (1,553,239) | (1,213,056) | (340,183) | 28.04% |
| Total fees and commissions income, net | 3,025,733 | 2,781,203 | 244,530 | 8.79% |
Fees and commission income, net
| | Year | Growth |
| | 2019 | 2018 | 2019-2018 |
| | In millions of COP |
| Fees and commission income | 4,578,972 | 3,994,259 | 584,713 | 14.64% |
| Fees and commission expenses | (1,553,239) | (1,213,056) | (340,183) | 28.04% |
| Total fees and commissions income, net | 3,025,733 | 2,781,203 | 244,530 | 8.79% |
In 2018, there was a change in presentation of fees due to the adoption of IFRS 15. Information for previous periods has been reclassified to conform to the new presentation.
For the year 2019, net fees and commissions income totaled COP 3,026 billion, up 8.79 % as compared to COP 2,781 in 2018. This increase was driven primarily by higher commissions from credit and debit cards fees due to a greater transaction volume and higher trust and asset management activities, which increased due to a larger amount of assets under management.
The strategy of Bancolombia in relation to fee and commission income is to promote financial services and other revenue lines that complement the lending business. Activities related to cash management, methods of payment and bancassurance are the main components of this strategy.
The Bank continued to promote and increase the volumes of credit and debit card transactions through initiatives with retailers as well as commercial incentives. This strategy involved advertising campaigns as well as enhanced use of reward and loyalty schemes relating to the use of Bancolombia-issued credit cards and debit cards contributed to a faster expansion of this revenue line. The growth in consumer loans and credit card outstanding also contributed to the growth in fees related to these products.
In the corporate area, the efforts have been focused on the middle and small market, mainly through the promotion of comprehensive banking, cash management services and electronic platforms for treasury management. The pace of growth in these business lines was slow in 2019, despite an acceleration of GDP during 2019, which was mainly driven by consumption instead of investments.
Other Operating Income
For 2019, total other operating income was COP 1,535 billion, 22.67% higher than the COP 1,251 billion in 2018.
The variation in this line item is explained by the increase in 2019, of gains in FX positions.
Revenues from operating leases totaled COP 682 billion in 2019, an increase of 9.37% compared to 2018. Such increase is due to higher volumes in assets under leasing.
Operating expenses
The following table summarizes the principal components of Bancolombia’s operating expenses for the last two fiscal years:
| | For the years ended December 31, | Growth |
| | 2019 | 2018 | 2019-2018 |
| | In millions of COP |
| Operating expenses | | | | |
| Salaries and employee benefits | 3,366,824 | 3,004,054 | 362,770 | 12.08% |
| Other administrative and general expenses | 3,069,058 | 3,024,769 | 44,289 | 1.46% |
| Wealth tax, contributions and other tax burden | 757,820 | 692,666 | 65,154 | 9.41% |
| Impairment, depreciation and amortization | 824,590 | 493,902 | 330,688 | 66.95% |
| Other expenses | 235,525 | 267,507 | (31,982) | (11.96%) |
| Total operating expenses | 8,253,817 | 7,482,898 | 770,919 | 10.30% |
| | | | | |
The following table summarizes the principal components of Bancolombia’s operating expenses for the last two fiscal years:
| | For the years ended December 31, | Growth |
| | 2018 | 2017 | 2018-2017 |
| | In millions of COP |
| Operating expenses | | | | |
| Salaries and employee benefits | 3,004,054 | 2,792,379 | 211,675 | 7.58% |
| Other administrative and general expenses | 3,024,769 | 2,977,884 | 46,885 | 1.57% |
| Wealth tax, contributions and other tax burden | 692,666 | 727,661 | (34,995) | (4.81%) |
| Impairment, depreciation and amortization | 493,902 | 479,111 | 14,791 | 3.09% |
| Other expenses | 267,507 | 249,023 | 18,484 | 7.42% |
| Total operating expenses | 7,482,898 | 7,226,058 | 256,840 | 3.55% |
| | | | | |
For 2019, operating expenses totaled COP 8,254 billion, up 10.3% as compared to COP 7,483 billion in 2018.
Salaries and employee benefits totaled COP 3,366 billion in 2019, up 12.1% as compared to 2018. This performance was primarily driven by the annual increase in salaries and bonuses paid to employees, in particular to those in the sales force.
Other administrative and general expenses totaled COP 3,069 billion in 2019, up 1.46% as compared to 2018, reflecting the efforts in cost control and gains in efficiency and automation of processes.
As a result of the evolution of expenses and revenues, the cost to income ratio of Bancolombia for 2019 was 51.13%, increasing when compared to 50.08% in 2018.
Provision Charges and Credit Quality
For the year 2019, credit impairment charges on loans and advances and financial leases (net of recoveries) totaled COP 3,411 billion (or 1.9% of average loans), which represents a decrease of 11.24% as compared to COP 3,843 billion (or 2.3% of average loans) in 2018. The significant decrease in provision charges was driven by the improvement in credit conditions of the loan portfolio and the fully provisioning of large corporate clients, namely, Electricaribe, Ruta del Sol II and Consorcio Express, which required lower provision charges in 2019.
The deterioration of SMEs segment was lower than in 2018 mainly explained by the better economic conditions during the year.
Net loan charge-offs totaled COP 3,730 billion in 2019, down 2.24% from the 3,815 billion in 2018. The deceleration of charge-offs is due to the improvement of credit performance and lower deterioration of both corporate, and retail customers.
Past-due loans amounted to COP 8,443 billion as of December 31, 2019, up 3.72% as compared to COP 8,140 billion as of December 31, 2018.
The past-due loan ratio (loans overdue more than 30 days divided by total loans) reached 4.27% as of December 31, 2019, down from 4.33 % as of December 31, 2018. The reduction in this ratio is mainly due to charge-offs during the year and a reduction in the formation of past-due loans in the last months of 2018.
Income Tax Expenses
Income tax expense for the fiscal year 2019 totaled COP 1.263 billion, 52.27% higher than COP 829 billion in 2018. The effective tax rate for 2019 was 28.21%.
The increase in income taxes in 2019 is mainly explained by the growth in income before taxes and the fact that in 2018, Bancolombia had a recovery of taxes from previous periods, due to the favorable resolution of certain disputed tax items relating to previous years that were accepted by the Colombian tax authority.
For further details please see Note 11 of Consolidated Financial Statements.
RESULTS BY SEGMENT
The Bank manages its business through 9 main operating segments: Banking Colombia, Banking El Salvador, Banking Panama, Banking Guatemala, Trust, Investment Banking, Brokerage, Off Shore and All Other.
During 2018, the investment in Leasing Perú S.A, Capital Investment Safi S.A. and Arrendamiento Operativo Renting Perú was sold. The investment in Arrendamiento Operativo CIB S.A.C. is classified as Asset held for sale and was sold on March 29, 2019.
In 2018, there was a change in presentation of fees due to the adoption of IFRS 15. Information for previous periods has been reclassified to conform to the new presentation.
Banking Colombia: this segment provides retail and corporate banking products and services to individuals, companies and national and local governments in Colombia. The Bank’s strategy in Colombia is to grow with these clients based on value added and long-term relationships. In order to offer specialized services to individuals, small and medium size enterprises (SMEs) and big size enterprises, the Bank´s retail sales force targets the clients classified as: Personal, Plus and Entrepreneurs.
The Bank´s corporate and government sales force targets and specializes in companies with more than COP 100,000 million in revenue in twelve economic sectors: Agribusiness, Commerce, Manufacturing of Supplies and Materials, Consumer Goods, Financial Services, Health, Education, Construction, Government, Infrastructure, Real Estate, and Natural Resources
This segment is also responsible for the management of the Bank’s proprietary trading activities, liquidity and distribution of treasury products and services to its client base in Colombia.
| | Year ended December 31, |
| | 2019 | 2018 | 2017 | Change 2019-2018 | Change 2018-2017 |
| | In millions of COP |
| Total interest and valuation | 12,970,741 | 12,215,644 | 12,995,017 | 6.18% | (6.00%) |
| Interest income on loans and financial leases | 12,592,221 | 11,990,678 | 12,586,875 | 5.02% | (4.74%) |
| Total debt investments | 716,032 | 366,354 | 602,304 | 95.45% | (39.17%) |
| Derivatives | (172,399) | (17,023) | (54,156) | 912.74% | (68.57%) |
| Total liquidity operations | (165,113) | (124,365) | (140,006) | 32.76% | (11.17%) |
| Interest expenses | (4,408,233) | (4,194,772) | (4,791,976) | 5.09% | (12.46%) |
| Net interest margin and valuation on financial instruments before impairment on loans and financial leases, off balance sheet credit instruments and other financial instruments | 8,562,508 | 8,020,872 | 8,203,041 | 6.75% | (2.22%) |
| Total credit impairment charges, net | (2,564,417) | (3,354,330) | (3,195,837) | (23.55%) | 4.96% |
| Net interest margin and valuation income on financial instruments after impairment on loans and financial leases and off balance sheet credit instruments | 5,998,091 | 4,666,542 | 5,007,204 | 28.53% | (6.80%) |
| Revenues (expenses) from transactions with other operating segments of the Bank | (19,212) | (6,986) | (59,884) | 175.01% | (88.33%) |
| Fee and commission income | 3,269,747 | 2,841,302 | 2,531,221 | 15.08% | 12.25% |
| Fee and commission expense | (1,297,186) | (1,009,573) | (889,481) | 28.49% | 13.50% |
| Total fees and commission income, net | 1,972,561 | 1,831,729 | 1,641,740 | 7.69% | 11.57% |
| Other operating income(1) | 433,887 | 250,598 | 608,025 | 73.14% | (58.78%) |
| Dividends and net income on equity investments | 131,029 | (49,316) | (53,141) | (365.69%) | (7.20%) |
| Total operating income, net | 8,516,356 | 6,692,567 | 7,143,944 | 27.25% | (6.32%) |
| Operating expenses(2) | (5,203,354) | (4,902,500) | (4,715,976) | 6.14% | 3.96% |
| Impairment, depreciation and amortization | (407,102) | (177,779) | (147,262) | 128.99% | 20.72% |
| Total operating expenses | (5,610,456) | (5,080,279) | (4,863,238) | 10.44% | 4.46% |
| Profit before tax | 2,905,900 | 1,612,288 | 2,280,706 | 80.23% | (29.31%) |
| Segment assets | 151,960,187 | 138,901,712 | 130,417,668 | 9.40% | 6.51% |
| Segment liabilities | (139,727,231) | (128,867,654) | (121,432,832) | 8.43% | 6.12% |
| | ____________________________ |
| (1) | Includes derivatives, net foreign exchange, operating leases and gains on sale of assets. |
| (2) | Includes staff costs, other administration and general expenses, contributions and other tax burdens and others. |
Analysis of 2019 versus 2018
In 2019, profit before taxes for Banking Colombia increased by 80.23% to COP 2,906 billion.
Total interest and valuation increased by 6.18% to COP 12,971 billion. This increase was mainly explained by the growth in the loan portfolio of 6.76%. Consumer loans experienced the highest year over year growth, at 29.32%. Interest income from consumer loans grew by 22.56%, mortgages by 3.05%, leasing by 0.69% while interest from commercial loans decreased by 4.17%. Both consumer loan portfolio and net interest income from consumer grew in line with the strategy of focusing growth in the consumer segment, in particular among high-income individuals.
Total credit impairment charges, net decreased by 23.55% to COP 2,564 billion. This decrease is mainly explained by higher provisions registered during 2018 that resulted from specific defaults related to a few corporate clients and SMEs.
Total fees and commission net, increased by 7.69% to COP 1,973 billion, due to the better performance of credit and debit cards, bancassurance business and banking services.
Other operating income increased 73.14% during 2019 to COP 434 billion from COP 251 billion in 2018, mainly explained by higher income from operating lease contracts, due to higher volumes of operations and delivered assets under leasing, and custodian services, as well as the absence losses in unhedged positions in US dollars trading and derivative contracts, which negatively affected other operating income in 2018.
Dividends received, and share of profits of equity method investees, increased to COP 131 billion from a loss of COP (49) billion in 2018, due to a better performance and higher net income generation from equity investments.
Total operating expenses increased by 10.44% to COP 5,610 billion. This increase was mainly explained by the depreciation of the FX that impacted expenses in dollars in Colombia, the annual increase in salaries and higher bonuses paid to employees as a result of the performance during 2019. Also, there was an increase in expenses related to maintenance and depreciation of foreclosures due to an improvement in the collection process. Expenses related to impairment, depreciation and amortization increased during the year because of the implementation of IFRS 16.
Assets attributable to Banking Colombia grew by 9.40% during the year, mainly driven by growth in the loan book. Also, during 2019 there was a recognition of the right of use assets under IFRS 16.
Banking El Salvador through Banco Agrícola S.A.:this segment provides retail and commercial banking products and services to individuals, companies and national and local governments in El Salvador through Banco Agrícola S.A. Banking El Salvador also includes operations of the following subsidiaries: Arrendadora Financiera S.A., Credibac S.A. de CV, Valores Banagricola S.A. de C.V.
This segment is also responsible for the management of Banco Agrícola’s proprietary trading activities, liquidity and distribution of treasury products and services to its client base in El Salvador.
| | Year ended December 31, |
| | 2019 | 2018 | 2017 | Change 2019-2018 | Change 2018-2017 |
| | In millions of COP |
| Total interest and valuation | 1,094,422 | 931,405 | 882,806 | 17.50% | 5.51% |
| Interest income on loans and financial leases | 1,052,680 | 861,174 | 830,050 | 22.24% | 3.75% |
| Total debt investments | 40,915 | 25,081 | 31,582 | 63.13% | (20.58%) |
| Total liquidity operations | 827 | 45,150 | 21,174 | (98.17%) | 113.23% |
| Interest expenses | (295,433) | (252,351) | (256,994) | 17.07% | (1.81%) |
| Net interest margin and valuation on financial instruments before impairment on loans and financial leases, off balance sheet credit instruments and other financial instruments | 798,989 | 679,054 | 625,812 | 17.66% | 8.51% |
| Total credit impairment charges, net | (83,110) | (94,301) | (110,018) | (11.87%) | (14.29%) |
| Net interest margin and valuation income on financial instruments after impairment on loans and financial leases and off balance sheet credit instruments | 715,879 | 584,753 | 515,794 | 22.42% | 13.37% |
| Revenues (Expenses) from transactions with other operating segments of the Bank | (2,154) | (2,029) | (963) | 6.16% | 110.70% |
| Fee and commission income | 268,309 | 227,114 | 211,159 | 18.14% | 7.56% |
| Fee and commission expense | (60,673) | (43,216) | (40,325) | 40.39% | 7.17% |
| Total fees and commissions, net | 207,636 | 183,898 | 170,834 | 12.91% | 7.65% |
| Other operating income(1) | 6,158 | 4,842 | (7,799) | 27.18% | (162.09%) |
| Dividends and net income on equity investments | 211 | 1,894 | 324 | (88.86%) | 484.57% |
| Total operating income, net | 927,730 | 773,358 | 678,190 | 19.96% | 14.03% |
| Operating expenses(2) | (444,933) | (402,831) | (383,002) | 10.45% | 5.18% |
| Impairment, depreciation and amortization | (46,381) | (26,122) | (34,671) | 77.56% | (24.66%) |
| Total operating expenses | (491,314) | (428,953) | (417,673) | 14.54% | 2.70% |
| Profit before tax | 436,416 | 344,405 | 260,517 | 26.72% | 32.20% |
| Segment assets | 15,998,613 | 14,661,091 | 12,987,250 | 9.12% | 12.89% |
| Segment liabilities | (14,127,214) | (12,931,491) | (11,248,123) | 9.25% | 14.97% |
| | ____________________________ |
| (1) | Includes derivatives, net foreign exchange, operating leases and gains on sale of assets. |
| (2) | Includes staff costs, other administration and general expenses, contributions and other tax burdens and others. |
Analysis of 2019 versus 2018
In 2019, profit before taxes for Banking El Salvador increased by 26.72% to COP 436 billion.
Total interest and valuation increased by 17.50% to COP 1,094 billion, mainly explained by the growth of the loan book where consumer grew 9.39% and commercial grew 8.74%. Interest income from commercial loans, consumer loans and leasing operations grew by 16.79%, 1.12% and 2.24%, respectively.
Total credit impairment charges, net were COP 83 billion, decreasing by 11.87% from the level in 2018, due to an improvement in the credit quality of the loan portfolio, as well as, some reversals of provision expenses from prior periods.
Total fees and commissions, net increased by 12.91% to COP 208 billion mainly due to a grow in fees from banking services, credit and debit cards and check remittances, among others.
Total operating expenses increased by 14.54% to COP 491 billion, mainly explained by the annual increase in salaries, other expenses related with salaries and bonuses. Expenses related to impairment, depreciation and amortization increased during the year because of the implementation of IFRS 16.
Assets attributable to Banking El Salvador grew by 9.12% during the year, mainly driven by growth in loans. Also, during 2019 there was a recognition of the right of use assets under IFRS 16.
Banking Panama:this segment provides retail and commercial banking products and services to individuals and companies in Panama through the Banistmo operation. This segment includes all the operations of Banistmo and its subsidiaries, which are managed and monitored by the CODM on a consolidated basis.
This segment is also responsible for the management of the Banistmo’s proprietary trading activities, liquidity and distribution of treasury products and services to its client base in Panama.
| | Year ended December 31, |
| | 2019 | 2018 | 2017 | Change 2019-2018 | Change 2018-2017 |
| | In millions of COP |
| Total interest and valuation | 1,876,925 | 1,573,928 | 1,495,446 | 19.25% | 5.25% |
| Interest income on loans and financial leases | 1,654,600 | 1,449,441 | 1,374,398 | 14.15% | 5.46% |
| Total debt investments | 172,610 | 101,599 | 93,154 | 69.89% | 9.07% |
| Derivatives | 1,625 | (13,250) | 438 | (112.26%) | (3125.11%) |
| Total liquidity operations | 48,090 | 36,138 | 27,456 | 33.07% | 31.62% |
| Interest expenses | (720,587) | (558,126) | (523,312) | 29.11% | 6.65% |
| | Year ended December 31, |
| | 2019 | 2018 | 2017 | Change 2019-2018 | Change 2018-2017 |
| | In millions of COP |
| Net interest margin and valuation on financial instruments before impairment on loans and financial leases, off balance sheet credit instruments and other financial instruments | 1,156,338 | 1,015,802 | 972,134 | 13.83% | 4.49% |
| Total credit impairment charges, net | (408,132) | (269,164) | (46,468) | 51.63% | 479.25% |
| Net interest margin and valuation income on financial instruments after impairment on loans and financial leases and off balance sheet credit instruments | 748,206 | 746,638 | 925,666 | 0.21% | (19.34%) |
| Revenues (expenses) from transactions with other operating segments of the Bank | (36,107) | (30,634) | (26,837) | 17.87% | 14.15% |
| Fee and commission income | 350,055 | 312,762 | 317,753 | 11.92% | (1.57%) |
| Fee and commission expense | (143,616) | (120,520) | (112,986) | 19.16% | 6.67% |
| Total fees and commissions, net | 206,439 | 192,242 | 204,767 | 7.38% | (6.12%) |
| Other operating income(1) | 29,704 | 39,781 | 8,662 | (25.33%) | 359.27% |
| Dividends and net income on equity investments | 5,562 | 4,240 | 7,038 | 31.18% | (39.76%) |
| Total operating income, net | 953,804 | 952,267 | 1,119,296 | 0.16% | (14.92%) |
| Operating expenses(2) | (573,042) | (554,890) | (569,219) | 3.27% | (2.52%) |
| Impairment, depreciation and amortization | (105,232) | (55,127) | (55,197) | 90.89% | (0.13%) |
| Total operating expenses | (678,274) | (610,017) | (624,416) | 11.19% | (2.31%) |
| Profit before tax | 275,530 | 342,250 | 494,880 | (19.49%) | (30.84%) |
| Segment assets | 33,175,638 | 31,006,334 | 28,055,391 | 7.00% | 10.52% |
| Segment liabilities | (28,723,004) | (26,686,169) | (24,014,188) | 7.63% | 11.13% |
| | ____________________________ |
| (1) | Includes derivatives, net foreign exchange, operating leases and gains on sale of assets. |
| (2) | Includes staff costs, other administration and general expenses, contributions and other tax burdens and others. |
Analysis of 2019 versus 2018
In 2019, profit before taxes for Banking Panama decreased by 19.49% to COP 276 billion.
Total interest and valuation increased by 19.25% to COP 1,877 billion, due to the growth in the loan portfolio, mainly in consumer loans by 11.17% and mortgages by 3.93%. Interest income from consumer grew 47.10%, commercial loans 12.26% and mortgages 13.00%.
Total credit impairment charges, net were COP 408 billion, increasing by 51.63% compared with COP 269 billion for 2018. This increase is explained by higher provision charges in corporate clients related to real estate and energy segments in Panama.
Total fees and commission, net increased by 7.38% to COP 206 billion, due to higher income generated by bancassurance, banking services and brokerage.
Total operating expenses increased by 11.19% to COP 678 billion, mainly due to higher expenses related to salaries, foreclosures and IT fees. Expenses related to impairment, depreciation and amortization increased during the year because of the implementation of IFRS 16.
Assets attributable to Banking Panama increased by 7.00% during the year, mainly driven by growth in loans and investments. Also, during 2019 there was a recognition of the right of use assets under IFRS 16.
Banking Guatemala:this segment provides retail and commercial banking and insurance products and services to individuals, companies and national and local governments in Guatemala through Banco Agromercantil de Guatemala S.A.. Banking Guatemala also includes operations of the following subsidiaries: Mercom Bank Ltd., Seguros Agromercantil S.A., Financiera Agromercantil S.A., Agrovalores S.A., Arrendadora Agromercantil S.A., Agencia de Seguros y Fianzas Agromercantil S.A., Asistencia y Ajustes S.A., Serproba S.A., Servicios de Formalización S.A., Conserjería, Mantenimiento y Mensajería S.A. and New Alma Enterprises LTD.
This segment is also responsible for the management of Banco Agromercantil’s proprietary trading activities, liquidity and distribution of treasury products and services to its client base in Guatemala.
| | Year ended December 31, |
| | 2019 | 2018 | 2017 | Change 2019-2018 | Change 2018-2017 |
| | In millions of COP |
| Total interest and valuation | 977,980 | 894,934 | 865,038 | 9.28% | 3.46% |
| Interest income on loans and financial leases | 905,016 | 821,276 | 767,986 | 10.20% | 6.94% |
| Total debt investments | 73,152 | 72,896 | 100,193 | 0.35% | (27.24%) |
| Total liquidity operations | (188) | 762 | (3,141) | (124.67%) | (124.26%) |
| Interest expenses | (388,571) | (360,988) | (348,726) | 7.64% | 3.52% |
| Net interest margin and valuation on financial instruments before impairment on loans and financial leases, off balance sheet credit instruments and other financial instruments | 589,409 | 533,946 | 516,312 | 10.39% | 3.42% |
| Total credit impairment charges, net | (333,699) | (136,289) | (125,877) | 144.85% | 8.27% |
| Net interest margin and valuation income on financial instruments after impairment on loans and financial leases and off balance sheet credit instruments | 255,710 | 397,657 | 390,435 | (35.70%) | 1.85% |
| Revenues (expenses) from transactions with other operating segments of the Bank | (36,255) | (7,574) | (972) | 378.68% | 679.22% |
| Fee and commission income | 170,854 | 141,253 | 126,022 | 20.96% | 12.09% |
| Fee and commission expense | (38,006) | (29,320) | (24,457) | 29.62% | 19.88% |
| Total fees and commissions, net | 132,848 | 111,933 | 101,565 | 18.69% | 10.21% |
| Other operating income(1) | 68,288 | 52,287 | 54,246 | 30.60% | (3.61%) |
| Dividends and net income on equity investments | 668 | 580 | 608 | 15.17% | (4.61%) |
| Total operating income, net | 421,259 | 554,883 | 545,882 | (24.08%) | 1.65% |
| Operating expenses(2) | (358,923) | (373,279) | (343,646) | (3.85%) | 8.62% |
| Impairment, depreciation and amortization | (120,130) | (84,996) | (101,392) | 41.34% | (16.17%) |
| Total operating expenses | (479,053) | (458,275) | (445,038) | 4.53% | 2.97% |
| Profit before tax | (57,794) | 96,608 | 100,844 | (159.82%) | (4.20%) |
| Segment assets | 14,319,054 | 13,556,846 | 12,163,561 | 5.62% | 11.45% |
| Segment liabilities | (12,127,388) | (11,952,105) | (10,593,967) | 1.47% | 12.82% |
| | ____________________________ |
| (1) | Includes derivatives, net foreign exchange, operating leases and gains on sale of assets. |
| (2) | Includes staff costs, other administration and general expenses, contributions and other tax burdens and others. |
Analysis of 2019 versus 2018
In 2019, profit before taxes for Banking Guatemala decreased to a loss of COP (58) billion from profit of COP 97 billion in 2018.
Total interest and valuation increased by 9.28% to COP 978 billion due to a better performance of the loan book. Commercial loans grew by 8.59%, consumer by 17.07% and mortgages by 12.43%. Interest income from consumer loans grew by 30.74%, commercial by 3.45% and mortgages by 2.88%.
Total credit impairment charges, net were COP 334 billion, increasing when compared to COP 136 in 2018. This increase is mainly explained by the update of parameters of the provisioning models under IFRS 9.
Total fees and commission, net increased by 18.69% to COP 133 billion due to higher commissions from banking services and credit and debit cards.
Total operating expenses increased by 4.53% to COP 479 billion, mainly explained by higher expenses related to foreclosures. Expenses related to impairment, depreciation and amortization increased during the year because of the implementation of IFRS 16.
Assets attributable to Banking Guatemala increased by 5.62% during the year, mainly explained by the growth in the loan book. Also, during 2019 there was a recognition of the right of use assets under IFRS 16.
Trust:this segment provides trust and asset management services to clients in Colombia through Fiduciaria Bancolombia S.A. Sociedad Fiduciaria. As of December 31, 2018, this segment also included results of FiduPerú S.A. Sociedad Fiduciaria. This entity was sold in July 2019, and its results are reflected in the Bank’s results for the period prior to the sale date. For further information, see Note 1 Reporting Entity.
The main products offered by this segment include money market accounts, mutual and pension funds, private equity funds, payment trust, custody services, and corporate trust.
| | Year ended December 31, |
| | 2019 | 2018 | 2017 | Change 2019-2018 | Change 2018-2017 |
| | In millions of COP |
| Total interest and valuation | 152 | 404 | 794 | (62.38%) | (49.12%) |
| Interest income on loans and financial leases | 132 | - | - | 0.00% | 0.00% |
| Total Debt investments | 20 | 105 | 193 | (80.95%) | (45.60%) |
| Total liquidity operations | - | 299 | 601 | (100.00%) | (50.25%) |
| Interest expenses | (138) | (39) | (102) | 253.85% | (61.76%) |
| Net interest margin and valuation on financial instruments before impairment on loans and financial leases, off balance sheet credit instruments and other financial instruments | 14 | 365 | 692 | (96.16%) | (47.25%) |
| Total credit impairment charges, net | (716) | (826) | (549) | (13.32%) | 50.46% |
| Net interest margin and valuation income on financial instruments after impairment on loans and financial leases and off balance sheet credit instruments | (702) | (461) | 143 | 52.28% | (422.38%) |
| Revenues (expenses) from transactions with other operating segments of the Bank | (25,529) | (32,509) | (33,024) | (21.47%) | (1.56%) |
| Fee and commission income | 349,438 | 313,908 | 285,648 | 11.32% | 9.89% |
| Fee and commission expense | (2,942) | (2,380) | (1,982) | 23.61% | 20.08% |
| Total fees and commissions, net | 346,496 | 311,528 | 283,666 | 11.22% | 9.82% |
| Other operating income(1) | 13,341 | 19,826 | 13,560 | (32.71%) | 46.21% |
| Dividends and net income on equity investments | 43,498 | 18,572 | 18,249 | 134.21% | 1.77% |
| Total operating income, net | 377,104 | 316,956 | 282,594 | 18.98% | 12.16% |
| Operating expenses(2) | (121,259) | (111,614) | (113,482) | 8.64% | (1.65%) |
| Impairment, depreciation and amortization | (1,031) | (588) | (540) | 75.34% | 8.89% |
| Total operating expenses | (122,290) | (112,202) | (114,022) | 8.99% | (1.60%) |
| Profit before tax | 254,814 | 204,754 | 168,572 | 24.45% | 21.46% |
| Segment assets | 310,373 | 280,720 | 81,928 | 10.56% | 242.64% |
| Segment liabilities | (99,867) | (86,524) | (76,856) | 15.42% | 12.58% |
| | ____________________________ |
| (1) | Includes derivatives, net foreign exchange, operating leases and gains on sale of assets. |
| (2) | Includes staff costs, other administration and general expenses, contributions and other tax burdens and others. |
Analysis of 2019 versus 2018
In 2019, profit before taxes for the Trust segment increased by 24.45% to COP 255 billion.
Total fees and commission, net increased by 11.22% to COP 346 billion driven by higher volume of transactions, higher value of assets under management and corporate trust fees.
Assets attributable to the Trust segment increased by 10.56% during the year to COP 310 billion, mainly explained by the recognition of the right of use assets under IFRS 16.
Investment Banking: this segment provides corporate and project finance advisory, underwriting, capital markets services and private equity management through Banca de Inversión Bancolombia S.A. Corporación Financiera. Its customers include private and publicly-held corporations as well as government institutions.
| | Year ended December 31, |
| | 2019 | 2018 | 2017 | Change 2019-2018 | Change 2018-2017 |
| | In millions of COP |
| Total interest and valuation | 8 | 22 | 94 | (63.64%) | (76.60%) |
| Total debt investments | 8 | 22 | 94 | (63.64%) | (76.60%) |
| Interest expenses | (4) | - | - | 0.00% | 0.00% |
| Net interest margin and valuation on financial instruments before impairment on loans and financial leases, off balance sheet credit instruments and other financial instruments | 4 | 22 | 94 | (81.82%) | (76.60%) |
| Total credit impairment charges, net | (251) | (135) | 466 | 85.93% | (128.97%) |
| Net interest margin and valuation income on financial instruments after impairment on loans and financial leases and off balance sheet credit instruments | (247) | (113) | 560 | 118.58% | (120.18%) |
| Revenues (expenses) from transactions with other operating segments of the Bank | 31,585 | 20,187 | 16,209 | 56.46% | 24.54% |
| Fee and commission income | 30,829 | 20,271 | 28,747 | 52.08% | (29.48%) |
| Fee and commission expense | (154) | (46) | (52) | 234.78% | (11.54%) |
| Total fees and commission income, net | 30,675 | 20,225 | 28,695 | 51.67% | (29.52%) |
| Other operating income(1) | 5,830 | 965 | 1,886 | 504.15% | (48.83%) |
| Dividends and net income on equity investments | 24,810 | (67,990) | (70,114) | (136.49%) | (3.03%) |
| Recovery (Impairment) charges on cash-generating unit(2) | - | 173,339 | (173,339) | (100.00%) | (200.00%) |
| Total operating income, net | 92,653 | 146,613 | (196,103) | (36.80%) | (174.76%) |
| Operating expenses(3) | (32,558) | (24,110) | (34,100) | 35.04% | (29.30%) |
| Impairment, depreciation and amortization | (187) | (131) | (133) | 42.75% | (1.50%) |
| Total operating expenses | (32,745) | (24,241) | (34,233) | 35.08% | (29.19%) |
| Profit before tax | 59,908 | 122,372 | (230,336) | (51.04%) | (153.13%) |
| Segment assets | 139,674 | 94,204 | 223,730 | 48.27% | (57.89%) |
| Segment liabilities | (43,700) | (40,741) | (48,191) | 7.26% | (15.46%) |
| | ____________________________ |
| (1) | Includes derivatives, net foreign exchange, operating leases and gains on sale of assets. |
| (2) | Includes impairment in 2017 of the investment in joint venture Compañía de Financiamiento Tuya S.A., and recovery of the same in 2018. |
| (3) | Includes staff costs, other administration and general expenses, contributions and other tax burdens and others. |
Analysis of 2019 versus 2018
In 2019, profit before taxes for the Investment Banking segment decreased to COP 60 billion from COP 122 billion in 2018. The results for which included a recovery of the Bank’s investment in Tuya, S.A. and there was no comparable recovery in 2019.
Total interest and valuation decreased by 63.64% to COP 8 million, due to lower investments valuation in debt investments.
Total fees and commission, net increased by 51.67% to COP 31 billion driven by higher fees collected by the capital markets division in relation to the listing of securities of companies.
Dividends received, and share of profits of equity method investees, increased to COP 25 billion from COP (68) billion in 2018, largely due to a better performance and higher net income generation from equity investments.
Total operating expenses increased by 35.08% to COP 33 billion, mainly explained by higher expenses related to salaries and bonuses.
Assets attributable to Investment Banking increased by 48.27% to COP 140 billion.
Brokerage:this segment provides brokerage, investment advisory and private banking services to individuals and institutions through Valores Bancolombia S.A. Comisionista de Bolsa. It sells and distributes equities, futures, foreign currencies, fixed income securities, mutual funds and structured products.
| | Year ended December 31, |
| | 2019 | 2018 | 2017 | Change 2019-2018 | Change 2018-2017 |
| | In millions of COP |
| Total interest and valuation | 5,018 | 24,273 | 8,916 | (79.33%) | 172.24% |
| Interest income on loans and financial leases | 96 | - | - | 0.00% | 0.00% |
| Total Debt investments | 14,757 | 14,728 | 15,147 | 0.20% | (2.77%) |
| Derivatives | (10,416) | 7,694 | (7,661) | (235.38%) | (200.43%) |
| Total liquidity operations | 581 | 1,851 | 1,430 | (68.61%) | 29.44% |
| Interest expenses | (26) | (15) | (72) | 73.33% | (79.17%) |
| Net interest margin and valuation on financial instruments before impairment on loans and financial leases, off balance sheet credit instruments and other financial instruments | 4,992 | 24,258 | 8,844 | (79.42%) | 174.29% |
| Total credit impairment charges, net | (4,363) | 155 | (147) | (2914.84%) | (205.44%) |
| Net interest margin and valuation income on financial instruments after impairment on loans and financial leases and off balance sheet credit instruments | 629 | 24,413 | 8,697 | (97.42%) | 180.71% |
| Revenues (expenses) from transactions with other operating segments of the Bank | 62,628 | 55,843 | 53,075 | 12.15% | 5.22% |
| Fee and commission income | 113,364 | 113,970 | 97,185 | (0.53%) | 17.27% |
| Fee and commission expense | (3,229) | (2,734) | (482) | 18.11% | 467.22% |
| Total fees and commissions, net | 110,135 | 111,236 | 96,703 | (0.99%) | 15.03% |
| Other operating income(1) | (9,392) | (10,468) | (11,647) | (10.28%) | (10.12%) |
| Dividends and net income on equity investments | 16,514 | (12,416) | 12,278 | (233.01%) | (201.12%) |
| Total operating income, net | 180,514 | 168,608 | 159,106 | 7.06% | 5.97% |
| Operating expenses(2) | (112,204) | (98,687) | (101,255) | 13.70% | (2.54%) |
| Impairment, depreciation and amortization | (1,738) | (1,402) | (1,398) | 23.97% | 0.29% |
| Total operating expenses | (113,942) | (100,089) | (102,653) | 13.84% | (2.50%) |
| Profit before tax | 66,572 | 68,519 | 56,453 | (2.84%) | 21.37% |
| Segment assets | 232,193 | 102,593 | 194,959 | 126.32% | (47.38%) |
| Segment liabilities | (56,583) | (56,952) | (56,786) | (0.65%) | 0.29% |
| | ____________________________ |
| (1) | Includes derivatives, net foreign exchange, operating leases and gains on sale of assets. |
| (2) | Includes staff costs, other administration and general expenses, contributions and other tax burdens and others. |
Analysis of 2019 versus 2018
In 2019, profit before taxes for the Brokerage segment decreased by 2.84% to COP 67 billion from COP 69 billion in 2018.
Total interest and valuation decreased by 79.33% to COP 5 billion, mainly explained by higher income generated by gains on derivatives related to securities and securities indexes and repurchase transactions than was recorded in 2018.
Total fees and commission, net decreased by 0.99% to COP 110 billion, due to a slightly lower volume of fees related to distribution and intermediation of securities, trust products and asset management.
Total operating expenses increased by 13.84% to COP 114 billion, mainly due to an increase in bonuses and IT related expenses.
Assets attributable to the Brokerage segment increased by 126.32% during the year, mainly due to an increase in the investment portfolio.
Off Shore:this segment provides a complete line of offshore banking services to Colombian and foreign customers through Bancolombia Panamá S.A., Bancolombia Cayman S.A., and Bancolombia Puerto Rico International, Inc. It offers loans to private sector companies, trade financing, leases financing and financing for industrial projects, as well as a complete portfolio of cash management products, such as checking accounts, international collections and payments. Through these subsidiaries, the Bank also offers investment opportunities in U.S. dollars, savings and checking accounts, time deposits, and investment funds to its high net worth clients and private banking customers.
| | Year ended December 31, |
| | 2019 | 2018 | 2017 | Change 2019-2018 | Change 2018-2017 |
| | In millions of COP |
| Total interest and valuation | 614,073 | 547,878 | 444,649 | 12.08% | 23.22% |
| Interest income on loans and financial leases | 411,504 | 434,754 | 412,418 | (5.35%) | 5.42% |
| Total debt investments | 24,682 | 20,559 | 16,329 | 20.05% | 25.90% |
| Derivatives | 169,483 | 86,779 | 6,085 | 95.30% | 1326.11% |
| Total liquidity operations | 8,404 | 5,786 | 9,817 | 45.25% | (41.06%) |
| Interest expenses | (304,519) | (247,666) | (226,304) | 22.96% | 9.44% |
| Net interest margin and valuation on financial instruments before impairment on loans and financial leases, off balance sheet credit instruments and other financial instruments | 309,554 | 300,212 | 218,345 | 3.11% | 37.49% |
| Total credit impairment charges, net | 19,169 | 19,039 | 6,541 | 0.68% | 191.07% |
| Net interest margin and valuation income on financial instruments after impairment on loans and financial leases and off balance sheet credit instruments | 328,723 | 319,251 | 224,886 | 2.97% | 41.96% |
| Revenues (expenses) from transactions with other operating segments of the Bank | 167,419 | 98,987 | 101,327 | 69.13% | (2.31%) |
| Fee and commission income | 25,800 | 20,840 | 19,390 | 23.80% | 7.48% |
| Fee and commission expense | (3,922) | (3,408) | (2,874) | 15.08% | 18.58% |
| Total fees and commissions, net | 21,878 | 17,432 | 16,516 | 25.50% | 5.55% |
| Other operating income(1) | 7,067 | 15,668 | 6,428 | (54.90%) | 143.71% |
| Dividends and net income on equity investments | 27 | (270,523) | (239,328) | (100.01%) | 13.03% |
| Total operating income, net | 525,114 | 180,815 | 109,829 | 190.42% | 64.63% |
| Operating expenses(2) | (61,087) | (53,313) | (56,593) | 14.58% | (5.80%) |
| Impairment, depreciation and amortization | (2,746) | (2,072) | (967) | 32.53% | 114.27% |
| Total operating expenses | (63,833) | (55,385) | (57,560) | 15.25% | (3.78%) |
| Profit before tax | 461,281 | 125,430 | 52,269 | 267.76% | 139.97% |
| Segment assets | 8,856,933 | 10,200,892 | 9,329,498 | (13.17%) | 9.34% |
| Segment liabilities | (11,568,232) | (11,931,294) | (10,636,804) | (3.04%) | 12.17% |
| | ____________________________ |
| (1) | Includes derivatives, net foreign exchange, operating leases and gains on sale of assets. |
| (2) | Includes staff costs, other administration and general expenses, contributions and other tax burdens and others. |
Analysis of 2019 versus 2018
In 2019, profit before taxes for the Off Shore segment increased to COP 461 billion from COP 125 billion in 2018. Mainly explained by higher income from operations with derivatives and higher revenues received by services provided to other segments of the Bank.
Total interest and valuation increased by 12.08% to COP 614 billion, driven by higher revenues from overnight and market funds, debt investments and derivatives.
Total credit impairment charges, net were recoveries of COP 19 billion, essentially stable compared with 2018.
Total fees and commission, net increased by 25.50% to COP 22 billion, mainly due to higher fees from banking services and trust services provided to other segments of the Bank.
Total operating expenses increased by 15.25% to COP 64 billion, mainly due to an increase in salaries, bonuses and taxes.
Assets attributable to the Off Shore segment decreased by 13.17% to COP 8,857 billion.
All Other:this segment provides financial and operational leases activities, including cross-border and international leasing services to clients in Colombia, Central America and Mexico. Bancolombia offers these services mainly through the following Subsidiaries: Renting Colombia S.A.S. and Transportempo S.A.S. This segment also includes results from the operations of investment vehicles of the Bank: Valores Simesa S.A., Pasarela Colombia S.A.S. (before BIBA Inmobiliaria S.A.S,), Inversiones CFNS S.A.S., Sistema de Inversiones y Negocios S.A. Sinesa, Banagrícola S.A., Inversiones Financieras Banco Agrícola and others. As of December 31, 2018, this segment includes Arrendamiento Operativo CIB S.A.C – Renting Perú’s results. This entity was sold in March 2019, and its results of operations are included for the period prior to the sale. For further information, see Note 1 Reporting Entity.
According to the quantitative threshold test required by IFRS 8 Operating Segments, the revenue reported by “all other segments” is less than 10 percent of the combined revenue of all operating segments and its assets represent less than 10 percent of all operating segments combined assets of the Bank.
| | Year ended December 31, |
| | 2019 | 2018 | 2017 | Change 2019-2018 | Change 2018-2017 |
| | In millions of COP |
| Total interest and valuation | 12,160 | 14,737 | 10,201 | (17.49%) | 44.47% |
| Interest income on loans and financial leases | 11,804 | 9,049 | 13,000 | 30.45% | (30.39%) |
| Total debt investments | 9 | 32 | 735 | (71.88%) | (95.65%) |
| Derivatives | - | - | (289) | 0.00% | (100.00%) |
| Total liquidity operations | 347 | 5,656 | (3,245) | (93.86%) | (274.30%) |
| Interest expenses | (62,283) | (56,259) | (85,928) | 10.71% | (34.53%) |
| Net interest margin and valuation on financial instruments before impairment on loans and financial leases, off balance sheet credit instruments and other financial instruments | (50,123) | (41,522) | (75,727) | 20.71% | (45.17%) |
| Total credit impairment charges, net | (6,943) | (7,221) | 1,696 | (3.85%) | (525.77%) |
| Net interest margin and valuation income on financial instruments after impairment on loans and financial leases and off balance sheet credit instruments | (57,066) | (48,743) | (74,031) | 17.08% | (34.16%) |
| Revenues (expenses) from transactions with other operating segments of the Bank | (142,375) | (95,285) | (48,931) | 49.42% | 94.73% |
| Fee and commission income | 588 | 2,988 | 3,989 | (80.32%) | (25.09%) |
| Fee and commission expense | (3,511) | (1,859) | (2,476) | 88.86% | (24.92%) |
| Total fees and commissions, net | (2,923) | 1,129 | 1,513 | (358.90%) | (25.38%) |
| Other operating income(1) | 986,126 | 912,738 | 885,182 | 8.04% | 3.11% |
| Dividends and net income on equity investments | 269,736 | (34,485) | (61,156) | (882.18%) | (43.61%) |
| Recovery (Impairment) charges on cash-generating unit | - | (4,583) | - | (100.00%) | 0.00% |
| Total operating income, net | 1,053,498 | 730,771 | 702,577 | 44.16% | 4.01% |
| Operating expenses(2) | (522,103) | (467,770) | (430,212) | 11.62% | 8.73% |
| Impairment, depreciation and amortization | (138,738) | (144,722) | (137,377) | (4.13%) | 5.35% |
| Total operating expenses | (660,841) | (612,492) | (567,589) | 7.89% | 7.91% |
| Profit before tax | 392,657 | 118,279 | 134,988 | 231.98% | (12.38%) |
| Segment assets | 5,793,349 | 5,432,346 | 4,773,601 | 6.65% | 13.80% |
| Segment liabilities | (1,594,729) | (1,185,302) | (1,440,368) | 34.54% | (17.71%) |
| | ____________________________ |
| (1) | Includes derivatives, net foreign exchange, operating leases and gains on sale of assets. |
| (2) | Includes staff costs, other administration and general expenses, contributions and other tax burdens and others. |
Analysis of 2019 versus 2018
In 2019, profit before taxes for All Other increased to COP 393 billion from COP 118 billion in 2018.
Other operating income, increased to COP 986 billion in 2019 compared to COP 913 billion in 2018. This increase is mainly explained by the growth in income from operating leases by 13.29% and gains on sale of premises and equipment (vehicles) by 51.43%.
Dividends and net income on equity investments increased from COP (34) billion to COP 270 billion, because of a higher net income generated from equity method invesments and the sale of several companies accounted for equity investments at both amortized cost and fair value through OCI.
Assets attributable to All Other increased by 6.65% to COP 5,793 billion.
| B. | LIQUIDITY AND CAPITAL RESOURCES |
Liquidity Management
The Asset and Liability Management Committee, or ALCO, sets the main policies of liquidity and funding for the Bank in accordance with the Bank’s desired statement of financial position.
The Bank uses a variety of funding sources to generate liquidity, taking into consideration market conditions, interest rates, liquidity needs and the desired maturity profile of funding instruments. Consequently, policies are designed to achieve an optimal match between assets and liabilities profile regarding maturities, interest rates and currency exposure.
One of the Bank’s main strategies is to maintain a solid liquidity position; thus, the Risk Committee has established a minimum amount of liquid assets, based on calculations of maximum expected withdrawals of deposits, disbursements and other obligations in order to guarantee the proper operation of banking activities and protect capital. The ALCO has delegated the short-term liquidity assessment task to the Liquidity Committee, which sets strategies and policies regarding liquidity.
Stress tests scenarios are simulated periodically to assess the Bank´s ability to raise funds under adverse market conditions. In addition, the Bank has defined a contingency liquidity plan that allows the organization to raise funds under stressed market scenarios.
Liquid Assets
During 2019, the Bank maintained a solid liquidity position. As mentioned above, the Bank seeks the optimum level of liquid assets to assure not only the proper operation under normal conditions but also to operate under stress market scenarios.
The following table shows the composition of the liquid assets in the last two years:
| Liquid Assets(1) | December 31, 2019 | December 31, 2018 |
| High quality Liquid Assets * | | |
| Cash | 16,594,906 | 15,370,693 |
| High quality liquid securities | 12,054,474 | 9,268,481 |
| Other Liquid Assets | | |
| Other securities ** | 1,982,308 | 1,867,576 |
| Total Liquid Assets | 30,631,688 | 26,506,750 |
| | ____________________________ |
| (1) | Liquid assets are those that are accepted as collateral by the central banks in Colombia and the other jurisdictions in which Bancolombia operates. Liquid assets are adjusted by a haircut. The following are considered as liquid assets: cash, repos held for trading and investments held for trading in listed shares in Colombia’s stock exchange, in investment funds units or in other trading debt instruments. |
*High-quality liquid assets: cash and shares that are eligible to be reportable or repo operations, in addition to those liquid assets that the Central Bank receives for its monetary expansion and contraction operations described in paragraph 3.1.1 of the Foreign Regulatory Circular DODM-142 of the Bank of the Republic.
**Other Securities: Securities issued by financial and corporate entities.
The Bank measures liquid assets on a daily basis and compares this result to an objective target set by the Risk Committee. Under this rule, daily liquid assets must be equal to or higher than such target. In the event the limit is not reached, there is a five-day period to increase liquidity levels.
Cash is important to guarantee branch and ATM operations. The Bank’s expansion across the Colombian territory requires considerable levels of cash; however, cash levels are daily monitored in order to minimize opportunity costs. Additionally, cash is considered in the mandatory bank reserve established by the Central Bank.
Securities that comprise liquid assets are reviewed by the ALCO considering the Bank’s liquidity objective. Even though available for sale and held to maturity debt securities cannot be sold, they can be pledged as collateral in repurchase agreements. Some of them are mandatory investments that can be posted to the Central Bank as collateral.
SFC requires financial entities to have liquid assets greater than the contractual liquidity accumulative one-month gap. This contractual gap reflects the maturity of the current positions of assets and liabilities and does not reflect projections of future operations. The maturity of the loan portfolio for this purpose is affected by the historical default indicator and the maturity of deposits is modeled according to the regulation.
The Bank’s management believes that the current level of liquidity is adequate and will seek to maintain its solid deposit base and the access to alternative sources of funding such as borrowings from domestic and international development and commercial banks, repurchase agreements, bond issuances, overnight funds and Central Bank funds, considering market conditions, interest rates and the desired maturity profile of liabilities.
Funding Structure
As of December 31, 2019, the Bank’s liabilities reached COP 207,282 billion, a 7.17% increase compared to December 31, 2018. Liabilities denominated in Colombian Pesos increased by 9.66%, and liabilities denominated in U.S. dollars increased by 3.89%. This change is principally the result of the increase in COP denominated checking and saving accounts, time deposits and leases (as of January 1, 2019 the Bank adopted IFRS 16 using the modified retrospective adoption method, where the right-of-use assets are measured as if IFRS 16 had always been applied, using the lessee’s incremental borrowing rate known at the date of transition - see Note 7 to the Consolidated Financial Statements, "Leases"), and an increase in USD denominated saving accounts, time deposits and leases, offset by a decline in COP denominated repurchase agreements and USD denominated borrowings from other institutions. However, around 22% of the increase in liabilities denominated in USD, is explained by the depreciation of the USD/COP exchange rate, which was 0.84% in 2019.
| | As of December 31, |
| | 2019 | 2018 |
| | In millions of COP, except percentages |
| Total funding | | |
| Peso-denominated | 120,308,003 | 109,707,245 |
| Dollar-denominated. | 86,974,491 | 83,714,012 |
| Total Liabilities | 207,282,494 | 193,421,257 |
In 2019, the Bank experienced a growth in deposits which reached COP 157,205 billion at year-end, an increase of COP 15,076 billion, or 10.61% compared to the level at December 31, 2018. COP denominated deposits increased by 11.22%, explained mainly by the rise in COP denominated saving accounts and time deposits, while USD denominated deposits increased by 9.55% as a result of the rise in USD denominated saving accounts and time deposits, affected by the exchange rate as mentioned earlier. The ratio of deposits to total assets was 66.59%, increasing by 202 basis points compared to 2018.
| | As of December 31, |
| | 2019 | 2018 |
| | In millions of COP |
| Total Deposits | 157,205,312 | 142,128,471 |
The following table sets forth checking accounts, savings accounts and time deposits as a percentage of the Bank’s total liabilities for the years 2019 and 2018:
| | 2019 | 2018 |
| Checking deposits | 12.1% | 12.5% |
| Time deposits | 30.7% | 29.4% |
| Savings deposits | 32.3% | 30.9% |
| Other deposits | 0.7% | 0.8% |
| Percentage of Total Liabilities | 75.8% | 73.6% |
The Bank’s principal sources of funding are deposits, which are mainly composed of checking accounts, time deposits and savings accounts.
Deposits as a percentage of the Bank’s total liabilities in 2019 were 75.8%, increasing from 73.6% of total liabilities at year-end 2018.
The ratio of net loans to deposits (including borrowings from commercial banks) was 100.11% at the end of 2019, decreasing from 103.23% as compared to 2018. This change is primarily explained by the increase in deposits and borrowings, that rose from COP 158,466 billion in 2018 to COP 171,164 billion in 2019, which was higher compared with the growth in net loans and advances to customers (the increase was COP 7,770 billion reaching an amount of COP 171,353 billion in 2019).
| | As of December 31, |
| | 2019 | 2018 |
| Net Loans to Deposits | 100.11% | 103.23% |
The bank also funds its operations with borrowings from financial institutions. Nevertheless, in order to maintain a lower cost of funds, the growth of loans was financed mainly by deposits, as a result of which USD denominated borrowings decreased by COP 2,384 billion (USD 758 million) in 2019. Additionally, Bancolombia’s borrowings from financial institutions are linked to different market rates/indexes like the IBR, (a short-term benchmark interest rate of Colombian money market liquidity that reflects the price at which banks are willing to lend or borrow funds from financial market), DTF, IPC1 and LIBOR.
In 2017, the U.K. Financial Conduct Authority announced that it would no longer persuade or require banks to submit rates for the calculation of the Libor benchmark after 2021. This announcement has resulted in uncertainty about the future of Libor which is used as interest rate benchmark. On December 31, 2019, Bancolombia had USD 4,089 million of assets linked to LIBOR maturing from January 1, 2022 onwards, which represents 5.68% of total assets as of December 31, 2019. Also, on December 31, 2019, Bancolombia had USD 1,319 million of liabilities linked to LIBOR maturing from January 1, 2022 onwards, which represents 2.09% of total liabilities as of December 31, 2019.
In 2020, the outbreak of the COVID-19 pandemic and lower oil prices have resulted in a significant expansion of the Bank’s deposits, and therefore its liquidity, as investors have used demand deposits as hedges against higher stock market volatility and lower asset prices.
Debt instruments in issue
In 2019, Bancolombia issued USD 550 million aggregate principal of subordinated notes and COP 657 billion aggregate amount of green bonds, while Bancolombia Panamá and Banistmo issued notes in amounts of USD 140 million and USD 152 million, respectively. Included in this amount is the issuance of USD 50 million of the first gender social bond in Latin America. However, the carrying amount of debt securities in issue decreased by COP 365 billion, explained mainly by the maturity of a BAM bond and the repurchases of a portion of Bancolombia securities issued in 2010 and 2012.
As of December 31, 2019, the total outstanding aggregate principal amount of bonds issued by the Bank was COP 19,921 billion.
The following table shows the Bank´s debt securities in issue maturity profile:
1 The IPC refers to the Consumer Price Index certified by the Colombian statistical bureau (“DANE”)
| | 2020 | 2021 | 2022 | 2023 | 2024 | 2025 and thereafter | Total |
| In millions of COP |
| Debt instruments in issue | 3,066,178 | 4,232,659 | 4,325,747 | 1,096,963 | 1,799,137 | 5,400,831 | 19,921,515 |
The following table sets forth the components of the Bank’s liabilities for the years 2019 and 2018:
| | As of December, |
| | 2019 | % of total funding | 2018 | % of total funding |
| | In millions of COP, except percentages |
| Checking accounts | | | | |
| Peso-denominated | 14,320,659 | 6.9% | 13,167,428 | 6.8% |
| Dollar-denominated | 10,839,017 | 5.2% | 10,930,645 | 5.7% |
| Total | 25,159,676 | 12.1% | 24,098,073 | 12.5% |
| Time deposits | | | | |
| Peso-denominated | 32,952,317 | 15.9% | 30,138,408 | 15.6% |
| Dollar-denominated | 30,682,761 | 14.8% | 26,714,733 | 13.8% |
| Total | 63,635,078 | 30.7% | 56,853,141 | 29.4% |
| Savings accounts | | | | |
| Peso-denominated | 52,039,080 | 25.1% | 45,784,382 | 23.7% |
| Dollar-denominated | 14,875,754 | 7.2% | 13,850,997 | 7.2% |
| Total | 66,914,834 | 32.3% | 59,635,379 | 30.9% |
| Other deposits | | | | |
| Peso-denominated | 894,483 | 0.4% | 1,009,482 | 0.5% |
| Dollar-denominated | 601,241 | 0.3% | 532,396 | 0.3% |
| Total | 1,495,724 | 0.7% | 1,541,878 | 0.8% |
| Interbank Deposits | | | | |
| Peso-denominated | - | 0.0% | 117,783 | 0.1% |
| Dollar-denominated | 1,363,679 | 0.7% | 1,256,439 | 0.6% |
| Total | 1,363,679 | 0.7% | 1,374,222 | 0.7% |
| Derivate financial instrument-Liabilities | | | | |
| Peso-denominated | 1,668,941 | 0.8% | 1,278,236 | 0.7% |
| Dollar-denominated | 191,871 | 0.1% | 16,834 | 0.0% |
| Total | 1,860,812 | 0.9% | 1,295,070 | 0.7% |
| Borrowings from other financial institutions(1) | | | | |
| Peso-denominated | 4,552,254 | 2.2% | 4,546,575 | 2.4% |
| Dollar-denominated | 9,407,089 | 4.5% | 11,791,389 | 6.1% |
| Total | 13,959,343 | 6.7% | 16,337,964 | 8.5% |
| Debt instruments in issue | | | | |
| Peso-denominated | 4,614,044 | 2.3% | 4,607,153 | 2.3% |
| Dollar-denominated | 15,307,471 | 7.4% | 15,680,080 | 8.1% |
| Total | 19,921,515 | 9.7% | 20,287,233 | 10.4% |
| Repurchase agreements and other similar secured borrowing | | | | |
| Peso-denominated | 1,306,100 | 0.6% | 2,276,812 | 1.1% |
| Dollar-denominated | 7,637 | 0.0% | 38,743 | 0.0% |
| Total | 1,313,737 | 0.6% | 2,315,555 | 1.1% |
| Leases(2) | | | | |
| Peso-denominated | 1,070,295 | 0.5% | - | - |
| Dollar-denominated | 761,290 | 0.4% | - | - |
| Total | 1,831,585 | 0.9% | - | - |
| | As of December, |
| | 2019 | % of total
funding | 2018 | % of total
funding |
| | In millions of COP, except percentages |
| Other liabilities | | | | |
| Peso-denominated | 6,889,830 | 3.3% | 6,780,986 | 3.5% |
| Dollar-denominated | 2,936,681 | 1.4% | 2,901,756 | 1.5% |
| Total | 9,826,511 | 4.7% | 9,682,742 | 5.0% |
| Total funding | | | | |
| Peso-denominated | 120,308,003 | 58.0% | 109,707,245 | 56.7% |
| Dollar-denominated | 86,974,491 | 42.0% | 83,714,012 | 43.3% |
| Total Liabilities | 207,282,494 | 100.0% | 193,421,257 | 100.0% |
| (1) | Includes borrowings from commercial banks and other non-financial entities. |
| (2) | As of January 1, 2019 the Banck adopted IFRS 16 using the modified retrospective adoption method, in which the right-of-use assets are measured as if IFRS 16 had always been applied, using the lessee’s incremental borrowing rate known at the date of transition. See Note 7 to the Consolidated Financial Statements, Leases. |
Consolidated Statement of Cash Flows
The following table shows net cash provided by operating activities, net cash used in investing activities and net cash used in financing activities, for the years ended December 31, 2019, 2018 and 2017:
| | 2019 | 2018 | 2017 |
| | In millions of COP |
| Operating activities | 12,315,612 | 1,042,858 | 2,939,588 |
| Investing activities | (2,190,832) | (1,381,842) | (1,908,080) |
| Financing activities | (5,260,692) | (732,711) | (3,620,909) |
| Net increase/decrease in cash and cash equivalents | 4,864,088 | (1,071,695) | (2,589,401) |
Operating Activities
In 2019, operating activities resulted in positive net cash as a result of the increase of COP 14,317 billion in deposits by customers, compared with an increase of COP 6,189 billion in 2018, and COP 17,387 billion of interest received, up from COP 15.59 billion in 2018. The increase in loans and advances to customers and financial institutions was COP 12,140 billion, compared with COP 12,952 billion and COP 11,266 billion in 2018 and 2017 respectively. Interest paid was a use of cash of COP 5,996 billion in 2019, COP 5,103 billion in 2018 and COP 5,798 billion in 2017. The net change in value of investment securities recognized at fair value through profit and losses increased by COP 2,626 billion in 2019, compared with an increase of COP 615 billion in 2018 and a decrease of COP 1,599 billion in 2017.
Net income has been positive; COP 3,214 billion, COP 2,786 billion and COP 2,754 billion for 2019, 2018 and 2017, respectively.
Investing Activities
In 2019, 2018 and 2017, investing activities used cash. Purchases of debt securities at amortized cost used COP 2,800 billion in 2019, COP 2,380 billion in 2018 and COP 3,122 billion in 2017; and the purchases of premises and equipment and investment properties used COP 1,555 billion in 2019, compared with COP 1,014 used in 2018 and COP 1,132 billion used in 2017. Proceeds from maturities of debt securities at amortized cost provided COP 2,405 billion in 2019, COP 2,214 in 2018 and COP 2,167 in 2017.
Investing activities related to debt instruments at fair value through OCI used net cash of COP 518 billion during 2019 and COP 126 billion in 2018; Investing activities related to equity securities and interests in associates and joint ventures provided net cash of COP 90 billion during 2019, while in 2018 and 2017, it used COP 259 billion and COP 298 billion respectively; and investing activities related to purchases and sales of premises and equipment and investment properties used net cash of COP 1,323 billion, compared with COP 702 billion used during 2018, and COP 563 billion in 2017. The net cash provided by proceeds from equity instruments and interests in associates and joint ventures is explained by the sale of AVE group, CCSC concessions, CIFI and by residual rights of investments to maturity; while the net cash used in purchases of premises and equipment and investment properties is explained by the purchase of the Atrio building (administrative headquarters in Bogotá), and the purchase of vehicles by Renting Colombia and Bancolombia (For more information, see note 10 to the consolidated financial statements).
Financing Activities
Financing activities required cash during 2019. Proceeds from borrowings from other financial institutions provided COP 11,741 billion in 2019, COP 15,774 billion in 2018 and COP 12,190 billion in 2017. The placement of debt securities in issue provided COP 2,084 billion in 2019, COP 1,150 in 2018 and COP 3,013 in 2017. The repayment of borrowings used COP 14,365 billion in 2019, compared with COP 14,472 used in 2018 and COP 17,042 used in 2017; and the payments of debt securities in issue used COP 2,561 billion during 2019, COP 1,886 billion during 2018 and COP 1,969 during 2017. Cash was also used to pay dividends to stockholders in the amount of COP 1,032 billion, while in 2018 and 2017 this amount was COP 735 billion and COP 1,126 billion, respectively.
Regarding borrowings from other financial institutions, the cash used was offset by funding from deposits received from customers (an operating activity), which grew significantly during 2019. The net cash used related to debt securities is due to redemptions and repurchases of a portion of Bancolombia securities (see Item 4.A. Recent Devlopments).
The decrease in repurchase agreements and other similar secured borrowing used COP 1,002 billion, compared with the COP 922 billion used in 2018 and the COP 1,313 billion provided in 2017.
Capital Adequacy
The Bank and its subsidiaries comply with the capital adequacy requirements in their respective countries of operation.
Stockholders’ equity attributable to the owners of the parent company amounted to COP 26,884 billion at December 31, 2019, up 8.19% from COP 24,849 billion at December 31, 2018. This increase reflects the net effect of dividend payments, earnings during the year 2019 and all the other transactions that directly affect the stockholders’ equity attributable to the owners of the parent company.
The Bank’s capital adequacy ratio on a consolidated basis was 12.82% as of December 31, 2019, down from 13.47% in 2018. This decrease is the result of a higher value on the risk weighted assets, mainly attributed to loans and financial assets investments.
The Bank’s capital adequacy ratio exceeded the requirements of the Colombian government and the SFC by 382 basis points above the minimum 9% required by the Colombian regulator. The basic capital ratio (Tier 1) was 9.57% and the tangible capital ratio, which is equal to the ratio of the difference between equity and goodwill and intangible assets to tangible assets, was 8.44% at the end of 2019. For a full description of the Bank’s capital adequacy requirements, please see Item 4. “Information on the Company – B. Business Overview – B.8 –Supervision and Regulation”.
The following table sets forth certain information regarding the Bank’s consolidated capital adequacy as of December 31, 2019 and 2018:
| | As of December 31, 2019 | As of December 31, 2018 |
| | In millions of COP, except percentages |
| Long-term senior indebtedness | 13,211,938 | 13,715,451 |
| Subscribed capital | 480,914 | 480,914 |
| Legal reserve | 17,849,018 | 17,755,450 |
| Non-controlling interest | 1,818,407 | 1,661,509 |
| Financial statements translation adjustment | 4,132,634 | 4,068,099 |
| Less: | | |
| Long-term investments | (185,579) | (185,579) |
| Intangibles assets acquired after August 23, 2012 | (4,072,061) | (4,065,668) |
| Primary capital (Tier I) | 20,023,333 | 19,714,725 |
| Subordinated bonds | 2,449,295 | 4,134,469 |
| Hybrid bonds | 4,260,282 | 2,437,313 |
| Other comprehensive income related to investments at fair value | (12,434) | (12,434) |
| Non-controlling interest | 103,293 | 144,796 |
| Computed secondary capital (Tier II) | 6,800,436 | 6,704,144 |
| Technical Capital(1) | 26,823,769 | 26,418,869 |
| Capital Ratios | | |
| Primary capital to risk-weighted assets (Tier I) | 9.57% | 10.05% |
| Secondary capital to risk-weighted assets (Tier II) | 3.25% | 3.42% |
| Risk-weighted assets including market risk | 209,182,274 | 196,109,276 |
| Technical capital to risk-weighted assets(2) | 12.82% | 13.47% |
____________________________
| (1) | Technical capital is the sum of basic and additional capital. |
| (2) | Capital adequacy is technical capital divided by risk weighted assets. |
| B.2 | FINANCIAL INSTRUMENTS AND TREASURY ACTIVITIES |
The Bank’s Treasury Division is responsible for the Sales and Trading activities in Bancolombia, Banistmo, Banco Agrícola, Bancolombia Panamá, Bancolombia Caymán, Bancolombia Puerto Rico, and Grupo Agromercantil in Guatemala. It is accountable for the execution of all transactions in domestic and foreign currencies legally authorized in Colombia and in all the countries where the Bank has presence. These includes Derivatives transactions, Fixed Income and Indexed securities trading, repurchase or resale transactions, short sales, temporary securities transfers, as well as FX trading.
The Bank monitors treasury division activities through policies regarding the management of liquidity, market, legal, credit and operational risks. Such policies are monitored by the Vice-President of Risk Management. With the aim to control market and liquidity risks, the Bank sets limits intended to keep its exposure levels and losses within certain ranges determined by the Bank’s Board of Directors. The Bank’s investment policies do not include restrictions regarding the maturity of the securities held in the portfolio, except for those related to the liquidity portfolio and over the counter (“OTC”) derivatives transactions held by Bancolombia and Banistmo.
Before taking any additional position, the Bank’s Treasury Division also verifies, with respect to investments in domestic and in foreign currencies, the availability of funds for investment and each investment’s suitability with the Bank’s liquidity structure.
As mentioned in Item 11. “Quantitative and Qualitative Disclosure about Market Risk”, the market risk stated in the treasury book is measured with value at risk (VaR) metrics, and the position limits are based on the results of these methodologies. The Bank has defined VaR limits that follow a hierarchical structure, which avoids the concentration of market risk in certain groups of assets and also takes advantage of portfolio diversification. In addition to VaR limits, the Bank uses stop loss signals, except for GFAM, to inform senior management when accumulated losses are close to certain pre-defined thresholds in the trading book. Moreover, for the options portfolio in Bancolombia, the Bank has set limits based on the sensitivity of the portfolio to the underlying volatility, underlying currency and interest rates.
As part of its operations, the Bank holds cash and cash equivalents primarily in Colombian pesos, U.S. dollars and Guatemalan quetzals. These positions, as well as any other currency position, are determined by the treasury division in connection with the Bank’s currency risk assessment and management. Specifically, the Bank’s exposure to FX risk primarily arises from changes in the USD/COP exchange rate. The exposure to currency risk is managed by the Bank’s Treasury Division. The Bank estimates VaR metrics to limit the exposure to foreign currency risk of its balance sheet in Bancolombia and Valores Bancolombia. In Banistmo the FX risk limits are based on the net position in each currency. These limits are supervised daily by the Bank’s Market Risk Management Office. The Bank’s Treasury Division manages a derivative portfolio in Bancolombia and Banistmo, which includes forward in FX with the purpose, among others, of hedging its overall currency exposure.
Colombian Chief Treasury Officer (CTO), centralize all the reports from the Treasury Directors in the subsidiaries in all geographies, in which they are responsible for FX, investment and risk taking.
There are several communications channels between the Treasury divisions and the CTO, which are: Investment Committee; the participants in this meeting, which is held monthly, are: CTO, Proprietary Trading Director, Market Risk Director, Treasury Directors from each Bank, Head of Quantitative Analysis and the Head of each desk in Colombia (Fixed Income, FX and Derivatives). This committee reviews the investment strategy portfolios, profit and loss figures, VaR levels, Benchmark portfolios, based on the framework and risk appetite, defined by the Board of Directors.
Performance is measured against the “Benchmark” approved for each treasury, which includes a target position for each asset and limits for every product and market, in which the treasury operation can invest. There is a continuous follow up of the portfolios in the investment committee, which runs monthly.
| B.3 | COMMITMENT FOR CAPITAL EXPENDITURES |
See Item 4. “Information on the Company - A. History and Development of the Company – Capital Acquisitions and Divestitures”.
| C. | RESEARCH AND DEVELOPMENT, PATENTS AND LICENSES, ETC. |
Not Applicable
In an environment of moderate growth in the loan book, during 2019, net interest and valuation income increased 17.97% as a result of the stability in net interest margins and an improvement in the credit cycle. Total credit impairment charges, net decreased significantly over the past year. Future levels of loan volumes, interest margins and cost of credit will be key drivers of the Bank’s performance. The following is a brief discussion of recent trends regarding those three elements.
Loan Volume Performance
Gross loans and financial leases (i.e., before allowance for loans and financial lease losses) increased 4.87% in 2019. During the year, the loan portfolio presented mixed trends in demand. Commercial loans, which represent the largest share of the Bank´s portfolio, remained flat as a result of a weak demand from large corporations. Consumer loans, on the other hand, has shown an important increase mainly explained by the strategy to offer pre-approved loans. During 2019, commercial loans decreased 0.37%, consumer loans grew 23.88%, mortgages increased 4.86%, and Small Business Loans expanded 10.63%.
Banco Agrícola’s loan book expanded 8.17% during 2019. This positive performance was mainly driven by the consumer segment. The bank has increased its share within the local banking market, and it continues to be the leader financial institution in El Salvador.
Credit demand in Banistmo was modest and the loan book grew 3.06%. Economic activity moderated in Panama, presenting a slowdown over the last year.
Loan growth in Guatemala was the highest in Central America, totaling 9.98% for 2019. It is important to underline a significant increase in the consumer book (17.07%). Guatemala is Central America’s largest country and provides a favorable growth environment.
Foreign-denominated loans decreased 2.98% during 2019. Although credit demand in El Salvador and Guatemala presented a good dynamic, corporations in Colombia demanded less U.S. dollar funding, resulting in a net contraction of the dollar denominated portfolio for the consolidated figures.
The Colombian economy presented a recovery and steady growth during 2019, and the trend was positive in the first months of 2020. Nevertheless, the COVID-19 outbreak and the developments that followed together with the drop in oil prices are causing uncertainties in the markets that will impact the credit demand for the year 2020. The commercial segment is particularly sensitive to the macroeconomic scenario and is expected to decelerate under the current circumstances as companies are less incentivized to resume capital investment projects. Personal loans had been an important driver for growth in recent years. However, for the reasons previously explained, the outlook for 2020 suggests a moderation in the retail book demand considering the expected slowdown in the global, regional and local economy.
Net Interest Margin and Valuation
A slight majority of the Bank’s loan book has a fixed rate (47.60% of loans have a maturity of more than one year and earn interest at variable rates) and the re-pricing pace of our assets tends to be faster than that of the Bank’s liabilities.
Net interest margin from continuing operations decreased 14 basis points from 5.80% to 5.67% during the year. This compression is mainly explained by the adoption of IFRS 16, which increased the interest expenses associated to liabilities on leasing agreements.
The Bank has continued developing its strategy to support the net interest margin and valuation on financial instruments by optimizing the cost of funding. For this purpose, the bank has focused on reducing the average life of time deposits in Colombia and increasing the proportion of average demand deposits (savings and checking accounts); aiming to maintain ample liquidity and consistent margins.
Interest rates in Colombia are expected to gradually decrease during 2020 in the the face of a slowdown in the economy, implying ongoing pressure on the net interest margin in the peso denominated loan book.
Cost of credit
For the year 2019, the cost of credit was 1.91% of average loans, which represents an improvement when compared to the 2.34% and 2.22% shown in 2018 and 2017, respectively. During 2019 there was positive evolution in credit quality, which resulted in provisions being 11% lower than charges recorded in 2018. In addition, the rate of deterioration showed a better performance, and the balance sheet is well protected with a high 90-day PDL coverage ratio of 194%.
| E. | OFF-BALANCE SHEET ARRANGEMENTS |
The following are the off-balance sheet arrangements in which the Bank is involved: standby letters of credit, letters of credit and bank guarantees.
Letters of credit and bank guarantees are conditional commitments issued by the Bank to guarantee the performance of a customer to a third party. The Bank typically has recourse to recover from the customer any amounts paid under these guarantees. In addition, the Bank may hold cash or other highly liquid collateral to support these guarantees. We include these guarantees in the Bank’s impairment loss allowance assessment with other forms of credit exposure. The credit recovery (impairment) for the off-balance sheet arrangements amounted to COP (25,940), COP 8,553 and COP 7,082, for the years ended as of December 31, 2019, 2018 and 2017, respectively.
Those off-balance sheet arrangements are required to be considered into the total solvency ratio computation. As of December 31, 2019, the total Bank’s technical capital ratio was 12.82%, exceeding the requirements of the Colombian government and the SFC by 382 basis points. In the event the off-balance sheet arrangements were not considered in the computation, the total ratio would be boosted by approximately 86 basis points.
At December 31, 2019, 2018 and 2017, the fees and other income related to Guarantees and Standby letters of credits amounted to COP 56,023, COP 57,366 and COP 63,470, respectively.
The Bank is not involved in any interest retained and other indebtedness related to those instruments besides the credit risk aforementioned.
The table below summarizes all guarantees issued by the Bank as of December 31, 2019 and 2018. The total amount outstanding represents maximum potential amount (notional amounts) that could be lost under the guarantees if there were a total default by the guaranteed parties, without consideration of possible recoveries under recourse provisions or from collateral held or pledged. Such amounts greatly exceed anticipated losses.
Unused credit lines amounted to COP 13,947,223 and COP 12,707,294 at December 31, 2019 and 2018.
| Off-balance Sheet Arrangements | Expire within one year at December 31, | Expire after one year at December 31, | Total amount outstanding at December 31, | Maximum potential amount of future losses at December 31, |
| 2019 | 2018 | 2019 | 2018 | 2019 | 2018 | 2019 | 2018 |
| | In millions of COP |
| Bank guarantees and letters of credit | 3,660,503 | 3,553,142 | 929,314 | 1,896,043 | 4,589,817 | 5,449,185 | 4,589,817 | 5,449,185 |
| Total | 3,660,503 | 3,553,142 | 929,314 | 1,896,043 | 4,589,817 | 5,449,185 | 4,589,817 | 5,449,185 |
For further information on standby letters of credit and bank guarantees, please see Note 21 Provisions and Contingent Liabilities and Note 25.3 Fees and Commissions to Consolidated Financial Statements.
| F. | TABULAR DISCLOSURE OF CONTRACTUAL OBLIGATIONS |
The following table shows the Bank´s contractual obligations as of December 31, 2019:
| Contractual Obligations | Total | Less than
1 year | 1-3
years | 3-5
years | More than
5 years |
| | In millions of COP |
| Debt instruments in issue | 19,921,515 | 3,066,178 | 8,558,406 | 2,896,100 | 5,400,831 |
| Time deposits(1) | 63,635,078 | 44,458,114 | 13,543,877 | 3,578,910 | 2,054,177 |
| Derivative financial liabilities | 1,860,812 | 1,068,891 | 332,939 | 189,497 | 269,485 |
| Payments of post-employment benefit plans | 753,384 | 72,465 | 145,834 | 158,783 | 376,302 |
| Lease liabilities | 1,831,585 | 12,765 | 28,301 | 90,151 | 1,700,368 |
| Borrowings from other financial institutions | 13,959,343 | 6,634,001 | 2,708,267 | 2,173,334 | 2,443,741 |
| Total | 101,961,717 | 55,312,414 | 25,317,624 | 9,086,775 | 12,244,904 |
____________________________
| (1) | Saving accounts, checking accounts and other deposits do not have a specific maturity date because they are required on demand and therefore are excluded from this table. |
The amounts shown in the table include interest costs on debt. The Bank does not have any uncertain tax positions to report.
Our liabilities recognized on the consolidated statement of financial position as Deposits by customers other than time deposits, Interbank deposits, Repurchase agreements and other similar secured borrowing, Preferred shares and Other liabilities are excluded from the table above. Refer to Notes 15, 16 and 20 to the consolidated financial statements for more information on these liabilities.
| G. | CRITICAL ACCOUNTING POLICIES AND ESTIMATES |
The preparation of consolidated financial statements requires the Bank's management to make judgments, estimates and assumptions that affect the application of accounting policies and the recognized amounts of assets, liabilities, income and expenses.
The estimates and underlying assumptions are reviewed on an ongoing basis. Revisions to accounting estimates are recognized in the period in which the estimate is revised if the revision affects only that period, or in the period of the revision and future periods if the revision affects both current and future periods.
Judgments or changes in assumptions are disclosed in the notes to the consolidated financial statements. Management bases its estimates and judgments on historical experience and on various other factors that are believed to be reasonable under current circumstances. Actual results may differ from these estimates if assumptions and conditions change.
The significant accounting policies that the Bank uses in preparing its consolidated financial statements are detailed below:
Expected credit losses are calculated using individual and collective models and methodologies based on assumptions and judgement considering historical credit data, current situation and reasonable and supportable forecasts of future economic conditions. The estimation of impairment charges is a critical accounting policy because of the significance of this line item, the sensitivity of the charges to changes in assumptions about future events and other somewhat subjective judgments that are incorporated in the individual credit loss models.
Some relevant assumptions must be made to operate the mathematical models behind the expected credit loss assessment. Assumptions such as the time past due payments to consider a client to have a significant risk increase or to be in default are leveraged from historical data and then reviewed by expert panels. Other assumptions such as the future economic conditions, the conformation of plausible future economic scenarios and the likelihood of those scenarios have a high impact on lifetime default probability models. These scenarios are determined and leveraged by the Direction of Economic Research, which operates independently of the Bank’s risk management division.
The main factors considered in collective estimations of credit losses are the definition of significant increase in credit risk, definition of default, collateral values, loan maturity and macroeconomic forecast of variables such as unemployment, GDP, interest rates, among others. It is also important to consider and any other variable that could influence a client´s willingness to pay.
In addition, individual credit losses models consider assumptions on how the financial performance and future cash flow of a client could be affected by the client´s expected future operational and commercial activity, trends of the economic sector, and regulatory changes, in the sector in which the client operates, changes in the collateral value, as well as other internal or external factors.
Given the inherent uncertainties and the high level of subjectivity involved in the assessment of three following factors, it is possible that the outcomes in the next financial year could differ from the expectations on which management’s estimates are based:
| ● | Exposure at default: It is understood as the exposed balance of assets to the current capital balance, interest and accounts receivable. In the case of products whose nature is revolving and that have an available quota that is susceptible to be used in its entirety according to loan contracts subscribed with clients, this parameter indicates over-use which can be incurred in the event of client default. |
| ● | Probability of default (PD): This is the probability that the debtor fails to fulfill their obligations of capital and/or interest payment over a period of twelve months. This is linked to the rating/scoring of each debtor/operation. |
| ● | Loss given default (LGD): This is defined as the economic impairment in which the entity would incur in the event of any instance of default. This depends mainly upon the characteristics of the debtor and upon the valuation of guarantees or collateral associated with the operation. |
Impairment loss models and methodologies, and the related assumptions, are assessed by the Bank’s Risk vice-presidency on a regular basis, using robust validation procedures in order to assure a reasonable coverage of effective losses.
This process enables management to periodically determine whether assumptions and models used to measure credit risk impairment should be adjusted to achieve more precise estimations.
Internal controls, data governance standards and approval processes have been implemented by the Bank to make estimations more accurate.
For further details please see Note 2 Significant Accounting Policies, section 7.4.5 Impairment of financial assets at amortized cost or at fair value through other comprehensive income “FVOCI”.
| 2. | Impairment testing of CGU including goodwill: |
The Bank tests goodwill recognized upon business combinations for impairment at least annually. The impairment test for goodwill involves estimates and significant judgments, including the identification of cash generating units and the allocation of goodwill based on the expectations of which operating segments the Bank will benefit from the acquisition. The fair value of the acquired companies is sensitive to changes in the valuation models’ assumptions. Adverse changes in any of the factors underlying these assumptions could lead the Bank to record a goodwill impairment charge. Management believes that the assumptions and estimates used are reasonable and supportable in the existing market environment and commensurate with the risk profile of the assets valued. See Note 9 Goodwill and intangible assets, net for further information related to carrying amount, valuation methodologies, key assumptions and the allocation of goodwill.
Deferred tax assets and liabilities are recorded on deductible or levied temporary differences originating between tax and accounting bases, taking into account the valid tax rules applicable in each country where the Bank has operations. Due to the changing conditions of the political, social and economic environment, the constant amendments to tax legislation and the permanent changes in the tax principles and changes in interpretations by tax authorities determining the tax bases for the deferred tax items involves difficult judgments including estimates of future gains, offsets or tax deductions.
Accordingly, the determination of the deferred tax is considered a critical accounting policy.
For more information relating to the nature of deferred tax assets and liabilities recognized by the Bank, please see Note 12 to the Consolidated Financial Statements.
| 4. | Provisions and contingent liabilities: |
The Bank is subject to contingent liabilities, including those arising from judicial, regulatory, arbitration proceedings, tax and other claims arising from the conduct of the Bank’s business activities. These contingencies are evaluated based on management’s best estimates and provisions are established for legal and other claims by assessing the likelihood of the loss actually occurring as probable, possible or remote. Provisions are recorded when all the information available indicates that it is probable that an outflow of resources embodying economic benefits will be required to settle the obligation before the statement of financial position date and the amounts may be reasonably estimated. The Bank engages internal and external experts in assessing probability and in estimating any amounts involved.
Throughout the life of a contingency, the Bank may learn of additional information that can affect assessments regarding probability or the estimates of amounts involved; changes in these assessments can lead to changes in recorded provisions.
The Bank considers the estimates used to determine the provisions for contingent liabilities are critical estimates because the probability of their occurrence and the amounts that the Bank may be required to pay are based on the Bank’s judgment and those of its internal and external experts, which will not necessarily coincide with the future outcome of the proceedings. For further information regarding legal proceedings, contingencies and its carrying amounts see Note 21 to the Consolidated Financial Statements.
| 5. | Fair value of financial assets and liabilities: |
Financial assets and liabilities recorded at fair value on the Bank’s statement of financial position include debt, equity securities and derivatives classified at fair value through profit or loss, debt classified at fair value through other comprehensive income and equity securities which the Bank has made an irrevocable election to present in other comprehensive income changes in its fair value.
To increase consistency and comparability in fair value measurements and related disclosures, IFRS 13Fair value measurement specifies different levels of inputs that may be used to measure the fair value of financial instruments. In accordance with this standard, financial instruments are classified as follows:
Level 1:Assets and liabilities are classified as Level 1 if there are observable inputs that reflect quoted prices (unadjusted) for identical assets or liabilities in active markets. An active market is one in which transactions occur with sufficient volume and frequency to provide pricing information on an ongoing basis.
Instruments are valued by reference to unadjusted quoted prices for identical assets or liabilities in active markets where the quoted price is readily available, and the price represents actual and regularly occurring market transactions.
Level 2:Assets and liabilities are classified as Level 2 if in the absence of a market price for a specific financial instrument, its fair value is estimated using models whose input data are observable for recent transactions of identical or similar instruments.
Level 3:Assets and liabilities are classified as level 3 if unobservable input data were used in the measurement of fair value that are supported by little or no market activity and that are significant to the fair value of these assets or liabilities.
All transfers between the aforementioned levels are assumed to occur at the end of the reporting period.
The measurement of the fair value of financial instruments generally involves a higher degree of complexity and requires the application of judgments especially when the models use unobservable inputs (level 3) based on the assumptions that would be used in the market to determinate the price for assets or liabilities.
For further details, as carrying amount and sensitivity disclosures, please see Note 30 to the Consolidated Financial Statements.
| 6. | Measurement of Employee benefits: |
The measurement of post-employment benefit obligations and long-term employee benefits takes into account a range of inputs and it is dependent upon a series of assumptions of future events. The projected unit credit method is used to determine the present value of the obligation for the defined benefits and its associated cost. Future measurements of obligations may differ to those presented in the financial statements, among others, due to changes in economic and demographic assumptions and significant events. For further information, see Note 19 to the Consolidated Financial Statements.
| 7. | Transaction price determination: |
With respect to contracts with the Bank’s customers, for the determination of the transaction price, the Bank allocates to each one of the performance obligations under the contract the price which represents the value expected to be received to each such performance obligation based on its relative stand-alone selling price. Such price is determined based on the cost of each service, related tax and associated risks to the operation and inherent to the transaction, plus the margin expected to be received for the services, considering in each case the market price for the service, the conditions agreed with the customer and the customer’s segment. The bank has fixed and variable prices considering the characteristics of each service, future events, discounts, returns and other variables that may influence the selling price. No significant financing components are factored in the determination of the selling price.
For the periods ended as of December 31, 2019 and 2018 there have been no significant changes in estimates and judgements made at end-year other than those indicated in the financial statements.
Application since January 1, 2019:
The measurement of the right of use asset and of the lease liabilities requires a series of judgments, among which are the determination of the term of the lease and the rate used in discounting the cash flows. The Bank determined the lease term according to the historical information of the contracts and the period over which an asset is expected to be economically usable, which involves a high degree of uncertainty due to the use of relevant information about past events. The Bank’s was not able to determine or obtain an interest rate implicit in the lease; therefore, the weighted average lessee’s incremental borrowing rate was used to discount the cash flows associated with the leases. The Bank performs analyses taking in account the currency, lease term, economic environment and class of underlying assets as to determinate the weighted average lessee’s incremental borrowing rate.
| 9. | Uncertainty over Income Tax Treatments: |
In the process of determining the current and deferred tax for periods subject to review by the tax authority, the applicable rules have been applied and interpretations have been made to take positions, on which different interpretations could arise from those made by the entity. Due to the complexity of the tax system, the continuous modifications of the fiscal rules, the accounting changes with implications in the tax bases and, in general, the legal instability of the country, the tax authority may apply a different criteria to that used by the Bank. Therefore, a dispute or inspection by the tax authority on a specific tax treatment may affect the deferred or current tax asset or liability in the Bank´s accounting, which was calculated in accordance with the requirements of IAS 12.
Senior management of the Bank and its advisors consider that the determinations that the Bank did in relation to estimates and judgments made in each fiscal period correspond to those indicated by the current tax regulations. As a result, the Bank has not considered it necessary to recognize any additional provisions to those indicated in Note 12 Income tax, to the Consolidated Financial Statements.
Application of new accounting standards
| a) | Recently Issued Accounting Pronouncements Applicable in 2019 |
IFRS 16, Leases:On January 13, 2016, the IASB issued IFRS 16 Leases replacing IAS 17 leases, IFRIC 4 Determination of whether a contract contains a lease, SIC 15 Incentives in lease agreements and SIC 27 Evaluation of the substance of the transaction. This standard establishes the principles of recognition, measurement, presentation and disclosure of leases and requires lessees to account for all their leases under the same balance sheet model similar to the accounting under IAS 17 of the Finance leases. The standard includes two recognition exemptions for lessees: leasing of low-value assets (for example, personal computers) and short-term leases (that is, leases with a term of less than 12 months and leases that do not contain a purchase option). At the beginning of the lease, the lessee recognizes a liability for lease payments (liability for lease) and an asset that represent the right to use the underlying asset during the term of the lease (right to use the asset). Lessees must separately recognize the interest expense of the lease liability and the depreciation expense of the right to use.
Lessees must also remeasure the lease liability upon the occurrence of certain events (for example, a change in the term of the lease, a change in the assessment of an option to purchase the underlying asset, a change in the amounts expected to be payable under a residual value guarantee or a change in future lease payments as a result of a change in the rate or rate used to determine such lease payments). The lessee generally recognizes the amount of the remeasurement of the lease liability as an adjustment in the right of use asset.
The accounting of the lessor pursuant to IFRS 16 does not have substantial modifications with respect to the requirements of IAS 17. The lessors continue to classify all their leases using the same classification principles of IAS 17, between financial and operating leases.
For leases previously classified as finance leases the Bank recognized the carrying amount of the lease asset and lease liability immediately before transition as the carrying amount of the right of use asset and the lease liability at the date of initial application. The measurement principles of IFRS 16 are only applied after that date.
The Bank chose to use the following practical expedients when adopting IFRS 16 using the modified adoption method for leases previously classified as operating leases using IAS 17:
| a) | Do not carry out an assessment of the impairment of the value of the assets for the right-to-use lease contracts, because prior to the transition to IFRS 16, said contracts were evaluated and none was determined to be onerous; |
| b) | For contracts whose maturity is within 12 months and do not contain a purchase option following the date of initial application, they will be recognized as short-term leases. |
| c) | The initial direct costs of measuring the asset by right to use were excluded on the date of initial application; and |
| d) | Used hindsight to determine the lease term. |
The implicit interest rate in the leases could not be readily determined. As a result, the Bank performed an analysis taking into count the currency, lease term, economic environment and class of underlying assets to determinate the weighted average lessee’s incremental borrowing rate. The weighted average lessee’s incremental borrowing effective rate applied to the lease liabilities on January 1, 2019 was 7.19%.
As of January 1, 2019, the Bank adopted IFRS 16 using the modified retrospective adoption method, where the right-of-use assets are measured as if IFRS 16 had always been applied, using the lessee’s incremental borrowing rate known at the date of transition. The effects of such adoption are shown in the charts below.
The following table sets the lease liability recognized at January 01, 2019:
| | January 1, 2019 |
| Operating lease commitments disclosed as of December 31, 2018(1) | 3,993,490 |
| Lease liability recognized as of January 01, 2019 | 1,848,833 |
| Of which are: | |
| Current lease liabilities | 7,356 |
| Non-current lease liabilities | 1,841,477 |
| (1) This line does not include short-term leases and low-value leases for value of COP 3,633 and COP 5,040, respectively. |
The recognized right-of-use assets relate to the following types of assets:
| Types of Assets | January 1, 2019 |
| Buildings | 1,487,175 |
| Technological equipment | 49,736 |
| Vehicles | 34,956 |
| Furniture and fixtures | 579 |
| Total right of use assets | 1,572,446 |
The net impact on retained earnings (decrease), on deferred tax and on effect of changes in foreign exchange rate as of January 1, 2019 corresponds to COP 184,248, COP (119,173) and COP (9,560), respectively.
IFRS 9, Financial Instruments: As of January 1, 2019 the Bank adopted IFRS 9 as issued in July 2014 regarding hedge accounting. As permitted by the transitional provisions of IFRS 9.7.2, the Bank elected not to restate comparative figures. No adjustments to the carrying amounts of financial assets and liabilities at the date of transition arise.
All hedge relationships designated under IAS 39 as of December 31, 2018, qualified for hedge accounting considering specified qualifying criteria under requirements provided by IFRS 9 on January 1, 2019. In the process of adopting IFRS 9, Banistmo has not identified impacts on the transition from IAS 39 to IFRS 9 on the hedging relationships currently maintained.
| ITEM 6 | DIRECTORS, SENIOR MANAGEMENT AND EMPLOYEES |
| A. | DIRECTORS AND SENIOR MANAGEMENT |
The following persons acted as directors and senior managers of the Bank:
Directors
| ● | Gonzalo Alberto Pérez Rojas was born in 1958. Mr. Pérez holds a law degree from Universidad de Medellín and a post-graduate degree in insurance from Swiss Re - Zurich and a CEO Management Program certificate from the Kellogg School of Management. Mr. Pérez was recently appointed as CEO of Grupo de Inversiones Suramericana. He previously served as CEO of Suramericana S.A, Insurance and Social Security Company where he also worked as Vice-president of Insurance and Capitalization, Vice-president of Corporate Business, Manager for Corporate Business and Human Resources Manager. Currently he serves as a member of the board of directors of Grupo Nutresa S.A., Celsia S.A., and Fundación Sura and he is a member of the board of directors of Suramericana´s affiliates (Seguros SURA) in nine (9) countries in Latin America. In 2020 he was reelected as a member of the Bank´s Board of Directors. |
| ● | Juan David Escobar Franco was born in 1969. Mr. Escobar is a Systems Engineer from Universidad EAFIT and has a post-graduate degree in Electronic Business from Tecnológico de Monterrey and an MBA from the same institution. He also has master on Actuarial Science from Georgia State, and has studied High Management Studies at the Kellogg School of Management, and Digital Transformation at University of Virginia, amongst other courses related to project management and direction. In 2018 he became as CEO of Seguros Sura Colombia, where he had also previously served as Insurance Vice-president, Actuarial Manager and Director of the Automobile Department. In March 2020, he was appointed as new non-independent member of the Bank´s Board of Directors. |
| ● | Hernando José Gómez Restrepo was born in 1957. Mr. Gómez holds a cum laude degree in economics from Universidad de los Andes. He is a PhD candidate in economics from Yale University, from where he holds a post-graduate degree in currency, banking and international economics. Mr. Gómez Restrepo has a wide range of experience in central banking, government entities and consulting and has been responsible for commercial negotiations, development plans, commercial plans, sustainability and inclusion policies, macro-economy, financial policy and policy related to the coffee industry. Previously, he was a member of the Board of Governors of Colombia´s Central Bank (Banco de la República), CEO of the Consejo Privado de Competitividad, Chief of the Colombian Government negotiation Team for the Free Trade Agreement with the United States and the National Planning Director of Colombia, among other positions. Recently, he has served as a consultant for CEPAL, National Planning Department for the World Bank, Fedesarrollo and the Agencia de Renovación del Territorio. Mr. Gómez is an independent member of the Bank’s Board of Directors since his appointment in 2013. |
| ● | Luis Fernando Restrepo Echavarría was born in 1958. He has a bachelor’s degree on Industrial Management from Georgia Institute of Technology and an MBA degree from University of Chicago. He previously worked at The Marmon Group of Chicago and was part of the Leadership Rotational Program in Chicago at The Rego Company (Planning Production and Industrial Engineer), Hammond Organ Company (Financial Accountability) and Marmom Keystones (sales). Mr. Restrepo currently serves as CEO of Crystal S.A.S., a company dedicated to the production and commercialization in Latin America of brands such as Gef, Punto Blanco, Baby Fresh y Galax. He is currently a member of the board of director of: Constructora Conconcreto S.A, Etiflex S.A (Litography) and Espumas Plásticas S.A.S and in the past was a member of the board of directors of ANDI. He also serves as a member of the Advisory Board of Georgia Tech in the U.S.A. Mr. Restrepo is an independent member of the Bank’s Board of Directors since his appointment in 2016. |
| ● | Andrés Felipe Mejía Cardona was born in 1962. Mr. Mejía is an Economist from Michigan University and has an MBA from Eafit, Studies in Strategic Planning from Universidad de Barcelona, High Managament at Universidad de los Andes and was part of the Program EXPRO of International Business at CBI Rotterdam. Mr. Mejía has substantial professional experience in international commerce and international markets. He is CEO of MU Mecanicos Unidos S.A.S since 1983. He has been member of the board of directors of Fedemetal, Edatel, ISA, Isagen, Fabricato, Internexa and Protección S.A. Mr. Mejia is an independent member of the Bank’s Board of Directors since his appointment in 2016. |
| ● | Sylvia Escovar Gómez was born in 1961. Mrs. Escovar is an economist from Universidad de los Andres. She has worked as head economist for the World Bank´s resident mission in Colombia and was head of the External Credit Division of the National Planning Department. She also served as Chief of Services for Economic Studies of Colombia´s Central Bank (Banco de la República), Chief of Public National Policy Evaluation System of the National Planning Department and was General Director for FES Leadership Foundation. She was also sub secretary for Education and Sub secretary for Finance of Bogotá D.C. and had previously served as Financial VP of Fiduciaria Bancolombia. During the last 18 years she has been affiliated to Organización Terpel S.A., where she has occupied different positions such as Commercial Vice-President, National Fuels Manager, and Financial and Administrative Manager And became CEO in 2012. In 2017 she was selected by Portafolio Magazine as the best executive of the year in Colombia and recognized by Merco as the only woman amongst the top 15 leaders with best reputation in Colombia, occupying the tenth position in 2019.In March, 2020, she was appointed as new independent member of the Bank´s board of directors. |
| ● | Arturo Condo Tamayo was born in 1967. Mr. Condo has a PhD in business administration from Harvard Business School in the fields of business strategy and competitiveness. He is Headmaster at EARTH University in Costa Rica, which educates leaders focused on sustainability of rural areas and in the past has also been headmaster at INCAE Business School and Director of the Centre for Competitiveness and Sustainability Development (LACCSD) as well as worked as a teacher in strategy, competitivity, development and sustainable development. Currently he is a consultant in strategic planning, competitiveness strategy and internationalization for companies and organizations in Latin America and Asia. In 2014, he founded Keyword Centro America, a company dedicated to offer analysis on political and economical enviroments for other companies, as well as strategic communication services where he serves as CEO. He is a founding member of Central American Private Sector Initiative (CAPSI), a group of regional leaders focused on improving the Central Americans quality of life through regional actions and the Global Shapers Community in San Jose, Costa Rica, which is part of the World Economic Forum (entity that recognized him as a Young Global Leader in 2008). He co-founded the Young Global Leader Business Oath and is a member of the board of directors of the Global Business Oath Project, which works in the field of ethical behavior of business leaders. Mr. Condo is an independent member of the Bank’s Board of Directors since his appointment in 2016. |
Former directors
| ● | David Emilio Bojanini García was born in 1956. Mr. Bojanini was a member of the board of directors of the Bank from 2007 until March 2020. He holds a degree in industrial engineering from Universidad de los Andes and an MBA with emphasis on actuary from University of Michigan. He has held several positions in the private sector such as CEO of Administradora de Fondos de Pensiones y Cesantías Protección S.A. from 1991 to 2006, and “Gerente Actuaría” in Suramericana de Seguros S.A. where he worked for 11 years. Mr. Bojanini is a member of the following boards of directors: Grupo Nutresa S.A., Bancolombia S.A., Grupo Argos S.A., Suramericana S.A. and SURA Asset Management S.A. From 2006 to 2020, Mr. Bojanini was CEO of Grupo de Inversiones Suramericana S.A. and, as a result of his resignation to such position he won´t continue to serve as a member of the Bank´s Board of Directors. His resignation was effective on March 13,2020. |
| ● | Roberto Steiner Sampedro was born in 1959. Mr. Steiner was a member of the board of directors of the Bank from 2014 until September 2019. Mr. Steiner holds a bachelor's degree in economics from the Universidad de los Andes and is a PhD candidate from Columbia University. Mr. Steiner has held several positions at the Central Bank, such as Director of the Economic´s Research Department. He has also served as Deputy Director and Executive Director at Fedesarrollo, Director of the Economic Development Studies Center at the Universidad de los Andes. He is currently a Research Associate at Fedesarrollo. Mr. Steiner has been a Professor at Universidad de los Andes, Columbia University, Universidad Javeriana and Universidad Nacional as well as Visiting Scholar at the IMF and at Lehigh University. He has been a consultant for the IDB, the World Bank, the IMF and the ECLAC. |
For additional information regarding the Board of Directors and its functions, see Item 10 “Additional Information – B. Memorandum and Articles of Association – Board of Directors”.
Senior Management
Juan Carlos Mora Uribe was born in 1965. He is CEO of Bancolombia since May 2016. Prior to his appointment as CEO of Bancolombia, he was the Bank´s Corporate Innovation and Digital Transformation Vice President since 2015. He holds a B.A degree from Universidad Eafit and an M.B.A degree from Babson College. Mr. Mora has experience in diverse areas of corporate finance and investment banking and was Vice President of Operations of Corporación Financiera Nacional and Suramericana S.A. in 2004. Most recently, Mr. Mora performed the role of Vice President of Risk in 2005,and was then appointed as Chief Corporate Services Officer until 2015.
Mauricio Rosillo Rojas was born in 1969. He is the Corporate Vice President of Bancolombia since September 2019. Mr. Rosillo holds a law degree from Pontificia Universidad Javeriana, and also obtained a degree in financial law from Universidad de Los Andes, and a master’s degree in commercial and economic law from the University of Georgia. Mr. Rosillo has held several positions in the public and private sectors, including secretary general of Federación Colombiana de Compañías de Leasing (Fedeleasing), Interim Colombian Superintendent of Cooperatives (“Superintendente de Economia Solidaria (encargado)”), director of financial regulation of the Colombian Ministry of Finance, supervisor of the securities market of the Colombian Securities Exchange and president of the Colombian Autoregulador del Mercado de Valores (AMV). He was the Chief Legal Officer of Bancolombia from December 2008 until until his appointment as Corporate Vice President in 2019. The Corporate Vice-presidency oversees the Legal Vice-presidency, Financial and Treasury Vice-presidency, Human Resources Vice-presidency, Compliance Vice-presidency and Reputation and Communications Department.
Maria Cristina Arrastia Uribe was born in 1965. She is the Vice President of Business since April 2019. She holds a business administration degree from Eafit University in Medellin and has worked in various roles in Bancolombia, such as Deputy-Manager of the trading desk, Regional Manager of Corporate Banking of Antioquia and, from 1998 to 2009 as Regional Manager for Personal and SME Banking in Antioquia. In 2009 she was namedas General Manager of Bancolombia´s business line Sufi until 2011 when she was appointed as Vice President of Consumer Mortgage loans. The Business Vice-presidency is responsible for leading the individual banking, small and medium enterprises and corporate business segments, as well as consolidating other support areas such as marketing, products, customer service and analytics, among others.
Jaime Alberto Villegas Gutierrez was born in 1965. He has been the Vice President of Corporate Services since November 2016. He holds an industrial engineering degree from Universidad de los Andes and a graduate degree in finance from the same University. He has worked in the financial, operations and technology department of financial institutions such as Standard Chartered Bank, in Colombia, Peru, United Arab Emirates and Singapore.
Rodrigo Prieto Uribe was born in 1973. He is Vice President of Risk Management since March 2011. Mr. Prieto has worked at Bancolombia holding several positions at different departments of Bancolombia such as analyst, manager of risk administration, planning manager and manager of Capital allocation and risk quantification. Most recently he was the director of planning and projects. He has also been a professor at several universities including Universidad EAFIT, Escuela de Ingeniería de Antioquia and Universidad de los Andes. Mr. Prieto is a civil engineer and has a master’s degree in economics from Universidad de los Andes and a master’s degree in finance from Instituto Tecnológico y de Estudios Superiores de Monterrey.
Carmenza Henao Tisnes was born in 1960. She is Vice President of Internal Audit since January 2013. Mrs. Henao has worked at Bancolombia in several positions at different departments of Bancolombia such as analyst and manager of audit technology. Most recently she was the Audit National Manager of Bancolombia branches. She has also been a professor at various universities including Universidad EAFIT, Universidad Pontificia Bolivariana, Universidad de Medellin and Universidad San Buenaventura. Mrs. Henao is a system engineer and holds a degree in Finance from Universidad EAFIT.
Cipriano López Gonzalez was born in 1974. He is the Innovation Vice President since January 2020. He is a mechanical engineer from Bolivariana Pontifical University, holds an MBA degree from the Burdeos School of Business in France, and has participated in complementary executive programs in the universities of Harvard, Stanford and Pennsilvania (Wharton Business School). He has previously worked for SAB-Miller Group as Negotiating Director, DANONE Group in France as the officer in charge of the cereal products category for Europe, and with L’Oreal in France and Spain. From 2010 to 2018 he was CEO of Haceb Industries, where he led the process of innovation and digital transformation, developing new businesses, alliances and a customer-centered culture.
Enrique Gonzalez Bacci was born in 1965. He is Vice President of Human Resources since October 2015. He holds a law degree from the Universidad Externado de Colombia and holds a degree in business law from the same university. He has taken the Advanced Program in Human Resource Management from the Anderson School at UCLA, and also holds certifications in geopolitics from Universidad EAFIT and a Top Management Program from Universidad de los Andes. In several occasions, he has participated as technical counselor before the International Labour Organization’s International Labour Conference. His career at Grupo Bancolombia started at Conavi and later at BIC – today Bancolombia – holding different positions within the human resources department.
Jose Humberto Acosta was born in 1962. He is Financial Vice President since June 2012 and Bancolombia´s Chief Financial Officer since January 2020. He holds a Bachelor of Business Administration undergraduate degree from Universidad Externado de Colombia and MBA Diploma from Universidad de la Sabana. Prior to becoming Chief Financial Officer of Bancolombia, Mr. Acosta served as International Banking Director, International manager at Corfinsura S.A., Methods and Organization Manager, and Merger General Coordinator, among other positions.
Claudia Echavarria Uribe was born in 1979. She is Bancolombia´s Chief Legal Officer and General Counsel since December 2019. She is a lawyer from Universidad Pontificia Bolivariana, has a master’s of law degree from Columbia University Law School and is a member of the New York Bar. Most recently she was the Corporate Vice-president and the General Counsel of Almacenes Exito and previously she held different positions at the legal department of Bancolombia and in Banca de Inversion Bancolombia between 2004 and 2015.
There are no family relationships between the directors and senior management of Bancolombia listed above.
No arrangements or understandings have been made by major shareholders, customers, suppliers or others pursuant to which any of the above directors or members of senior management were selected.
The Corporate Governance Code of Bancolombia sets an age limit of 65 years for retirement of senior management.
| B. | COMPENSATION OF DIRECTORS AND OFFICERS |
In 2019 the Bank paid each director a fee of approximately COP 6.84 million per month for sitting on the Board, and another fee of approximately COP 6.84 million for attending each session of the committees.
The directors received no other compensation or benefits. There is no stock option plan for directors. Consistent with Colombian law, the Bank does not publish information regarding the compensation of the Bank’s individual officers. The Bank’s stockholders may request that information during the period preceding the annual general stockholders’ meeting. The aggregate amount of remuneration paid by the Bank and consolidated subsidiaries to all directors, alternate directors and senior management during the fiscal year ended December 31, 2019 was COP 77.08 billion. Additionally, the bank has established a retirement bonus for senior management, and at the end of 2019 the provision to this effect was COP 35.61 billion. In 2019 was paid COP 511.93 million of retirement bonus for some senior managers who retired during the year.
The Bank´s senior managers (including the Bank´s CEO) are paid, in addition to a fixed compensation, a variable compensation to be approved by the shareholders at the General Meeting.
The Board of Directors approves the salary increases for corporate vice presidents and authorizes the Chief Executive Officer to readjust the salary of the remaining employees.
The Bank has established an incentive compensation plan that awards bonuses annually or semi-annually to its employees. In determining the amount of any bonuses, the Bank takes into consideration the overall return on equity of the Bank and its executives’ achievement of established goals. Bonuses are paid in cash and stock. The stock component represents shares of Bancolombia, which are purchased in the secondary market and are vested after three years.
The Bank paid a total of COP 2,127.11 billion for salaries of personnel employed directly by the Bank and senior management of its affiliates. Such amount includes the sum of approximately COP 297.98 billion spent in connection with the incentive compensation plan in Colombia.
As of December 31, 2019, the Bank had provisioned 100% of its actuarial obligation corresponding to retirement pension’s payable by the Bank, which amounted to COP 129.02 billion, in accordance with Decree 2496 of December 23, 2015.
The following table reflects the composition of the Board of Directors as of March 13, 2020
| Name | Elected to the Board | Term Expires |
| Gonzalo Alberto Pérez Rojas (1) | 2004 | 2022 |
| Juan David Escobar Franco(2) | 2020 | 2022 |
| Hernando José Gómez Restrepo | 2013 | 2022 |
| Luis Fernando Restrepo Echavarría | 2016 | 2022 |
| Andrés Felipe Mejía Cardona | 2016 | 2022 |
| Sylvia Escovar Gómez(3) | 2020 | 2022 |
| Arturo Condo Tamayo | 2016 | 2022 |
____________________________ | | |
(1) Gonzalo Alberto Pérez Rojas had previously served as the Bank’s Director during the periods of 1990 to 1994. He has been reelected during the periods of 2020-2022 in replacement of David Bojanini Garcia who resigned to his position as a member of the Board of Directors in March 2020 as a result of his resignation as CEO of Grupo de Inversiones Suramericana S.A
(2) Mr. Franco was appointed in replacement of Mr. Pérez Rojas who will be replacing Mr. David Bojanini.
(3) Mrs. Escovar Gomez was appointed in replacement of Roberto Steiner Sampedro who resigned to his position as a member of the Board of Directors as a result of his appointment as Co-director of the Bank of the Republic of Colombia in September 2019
*All the remaining Directors were reelected in 2020 for a two-year period.
Messrs. Hernando José Gómez Restrepo, Luis Fernando Restrepo Echavarría, Andres Felipe Mejía Cardona, Sylvia Esovar Gomez and Arturo Condo Tamayo are independent directors in accordance with the Bank’s by-laws and Colombian laws. Consequently, the majority of the Board of Directors is composed of independent directors.
Neither the Bank nor its Subsidiaries have any type of agreement with the Bank’s directors providing for benefits upon termination of their term.
The following are the current terms of office and the period during which the members of senior management have acted as such in Bancolombia. There are no defined expiration terms. The members of senior management can be removed by a decision of the Board of Directors.
| Name | Period Served |
| President | |
| Juan Carlos Mora Uribe | Since 2016 |
| Vice Presidents | |
| Mauricio Rosillo Rojas | Since 2008 |
| Maria Cristina Arrastia Uribe | Since 2015 |
| Jaime Alberto Villegas Gutierrez | Since 2016 |
| Rodrigo Prieto Uribe | Since 2011 |
| Carmenza Henao Tisnes | Since 2011 |
| Cipriano Lopez Gonzalez | Since 2019 |
For further information about the Bank’s corporate governance practices please see Item 16. “Reserved – B. Corporate Governance and Code of Ethics.”
Audit Committee
The Bank’s Board of Directors, in compliance with Colombian banking regulations, maintains an Audit Committee that is currently comprised of three members. The current members of the Audit Committee are Messrs. Hernando José Gómez Restrepo, Andrés Felipe Mejia Cardona and Arturo Condo Tamayo. The shareholders, in their meeting held on March 13, 2020, reelected them as members of the Board of Directors for a period of two years. The Board of Directors reelected them as members of the Audit Committee. Each of them serve as independent members of the Board of Directors.
Pursuant to the applicable U.S. regulations for foreign private issuers, Mr. Hernando José Gómez Restrepo serves as the financial expert of the Audit Committee. In addition, the Committee has an independent advisor, expert in financial reporting and auditing matters who provides advice to the Committee on such matters.
For a broader description of the experience and qualifications of Messrs. Gomez Restrepo, Mejia Cardona, and Condo Tamayo, see Item 6. “Directors, Senior Management and Employees—A. Directors and Senior Management.”
This Committee has a charter approved by the Board of Directors that establishes its composition, organization, objectives, duties, responsibilities and extension of its activities. The main purpose of this Committee is to support the Board of Directors by overseeing the effectiveness of the Bank’s internal controls implemented by senior management. Other specific responsibilities of the Committee include: (i) overseeing the integrity of the financial statements, financial reporting process and systems of internal accounting and financial controls; (ii) proposing to the Board of Directors and the Shareholder´s General Meeting external auditors candidates and evaluating their qualifications and independence; (iii) reviewing with management and the external auditors the annual and interim financial statements and reporting the results to the Board of Directors; (iv) approving the annual internal audit plan and its modifications; (v) approving the annual budget, overseeing the activities and evaluating the performance of Internal Audit, who reports directly to the audit committee; (vi) receiving and reviewing reports issued by internal and external auditors; (vii) evaluating the design and implementation of programs and controls aimed to prevent, detect and adequately manage risks related to internal fraud and misconduct; (viii) being informed about relevant frauds and misconduct cases related to the Bank´s employees; and (ix) evaluating and following up the programs aimed at preventing cybersecurity risks.
Further, the Internal Audit of Bancolombia and the compliance officer report to the Audit Committee. Likewise, Bancolombia has an ethics committee that reports to the Audit Committee and will be in charge of defining general policy issues and giving guidelines on ethics, conduct and integrity, as well as defining corporate positions in the face of difficult ethical dilemmas. From time to time, the Audit Committee may carry out diagnostic studies of the ethical culture in the Bank.
The Audit Committee meets and reports to the Board of Directors at least monthly and must present an annual report of its activities at the General Stockholders’ Meeting. The Committee met 13 times during 2019.
The shareholders establish the remuneration of the members of the Audit Committee in their general meeting.
Designation, Compensation and Development Committee
This committee is composed of three (3) members of the Board of Directors elected by it. The Vice President of Human Resourses of the Bank acts as secretary of this committee.
The designation, compensation and development committee recommended to the Board of Directors the policies and provisions for the hiring, remuneration, compensation, and development of management and key personnel of the Bank. Likewise, it continuously surveys the goals of the different compensation programs with regard to the performance of the officers, and it assesses the efficacy of such programs.
The duties of the designation, compensation and development committee are: (i) determining the administration policies of human resources, establishing the selection, evaluation, compensation, and development processes for top management, determining their goals; (ii) establishing the objective criteria under which the Bank hires its principal officers; (iii) proposing objective criteria under which the Bank hires senior management and designs succession plans; (iv) determining the criteria for the performance evaluation of senior management; and (v) issuing recommendations for the Board of Directors concerning appointments and compensation of the president and senior management.
The members of the designation, compensation and development committee are Gonzalo Perez Rojas, Luis Fernando Restrepo Echavarria and Sylvia Escobar Gomez. The committee met 4 times during 2019.
Good Governance Committee
The Good Governance Committee consists of at least three (3) members of the Board of Directors, two of them being an independent member. Bancolombia’s President attends this committee on a permanent basis.
The Good Governance Committee has internal regulation to govern aspects such as composition and guests to the meetings, competences, and responsibilities of the Committee and its internal regulations.
The main purpose of this Committee is to assist Bancolombia’s Board of Directors in overseeing compliance with the Corporate Governance measures, review any potential change to such measures, lead the evaluation process of the Board of Directors and evaluate periodically the functioning methodology and the agenda of the Board of Directors.
This Committee shall also support the Board of Directors in cases related to the implementation of succession policies of the Board of Directors and its remuneration.
The members of the Good Governance Committee are Gonzalo Perez Rojas, Sylvia Escovar Gómez and Luis Fernando Restrepo Echavarria. The committee met 3 times during 2019.
Risk Committee
Bancolombia’s Risk Committee consists of three (3) members of the Board of Directors, of which at least two must be independent directors.
The main purpose of this Committee is to serve as a support for approval, follow-up, and control of policies, guidelines, and strategies for risk management. In addition, this Committee supports the Bank’s Board of Directors in aspects such as knowledge and understanding of the risks assumed by the Bank and the monitoring of its risk appetite, including its subsidiaries, and the funds required to administer such risks.
Among other responsibilities, the Risk Committee is in charge of presenting for approval before the Board of Directors the methodology, procedures and tools for the management of cybersecurity risks and the management policies manual; keeping the Board of Directors informed of the cybersecurity risk management effectiveness; and assessing the causes of cybersecurity breaches and assessing the mitigation measures adopted and ongoing basis.
The Risk Committee has a charter approved by the Board of Directors which establishes its composition, organization, objectives, duties, responsibilities and extension of its activities. The stockholders at the General Meeting establish the remuneration of the members of the Risk Committee. The Risk Committee must meet at least quarterly and met a total of 13 times during 2019.
The members of the Risk Committee are Andres Felipe Mejía Cardona, Juan David Escobar Franco and Hernando Jose Gomez Restrepo.
The following table sets forth the number of employees of the Bank for the last three fiscal years:
| As of December 31 | Total number of employees employed by Bancolombia | Number of employees employed by Bancolombia S.A. |
| 2019 | 31,075 | 20,522 |
| 2018 | 31,040 | 20,114 |
| 2017 | 31,061 | 19,987 |
As of December 31 2019, Bancolombia and its consolidated subsidiaries had 31,075 employees, of which 20,522 were employed directly by the Bank; 12,222 are operations personnel and 8,300 are management employees. Of the 20,522 employees, approximately 27.2% are located in Medellin headquarters, 21.2% in the Bogotá Region, 20.6% in the Antioquia Region, 11.2% in the Central Region, 10.4% in the South Region and 9.4% in the Caribbean Region. During 2019, the Bank employed an average of 195 employees per month through temporary personnel service companies.
Of the employees directly hired by Bancolombia S.A., approximately 26.7% are part of a labor union called Sintrabancol, 15.4% are members of an industry union called UNEB, 3.3% belong to an industry labor union called Sintraenfi, and approximately 1.5% belong to another industry labor union called Sintranefi.
Bancolombia entered into a collective bargaining agreement with Uneb and Sintrabancol in October 2017, which became effective on November 1, 2017 and is set to expire on October 31, 2020. This agreement applies to approximately 12,546 of the Bank’s employees regardless of whether they are members of a union or not and it extends to operating personnel hired by the subsidiaries Banca de Inversión Bancolombia, Valores Bancolombia and Fiduciaria Bancolombia. Sintranefi, also submitted a list of petitions on October 31, 2016 without reaching an agreement in the stage of direct settlement and, as a result, on December 14, 2016, Sintraenfi requested the intervention of an arbitral tribunal to solve this pending petition. However, the terms of the agreement reached with UNEB and Sintrabancol apply as well to the members of the Sintraenfi union.
With the execution of such agreement, the Bank, UNEB and Sintrabancol continue to work on the consolidation of long-term labor relationships based on mutual trust and respect.
The most important economic aspects of the agreement are:
1. A pay increase of 7.0% during the first year; an increase equal to the variation in the Colombian consumer price index (“IPC”), as certified by the Colombian statistical bureau (“DANE”) for the period between November 2018 and October 2019, plus 230 basis points and an increase equal to the variation in the Colombian consumer price index (“IPC”), as certified by the Colombian statistical bureau (“DANE”) for the period between November 2019 and October 2020, plus 250 basis points.
For the salary increases corresponding to the second and the third year in which the current collective bargaining agreement is in effect, the Bank will apply whichever is greatest between the variation of the national Consumer Price Index (IPC) for the twelve months ended on October 31 and December 31, of the year in question. The same criteria will be applied for the subsidies and benefits associated to salary increases.
2. Improved benefits, such as: increased amounts for first home mortgage loans, improved health insurance coverage, transportation and food assistance, and an increase in tuition assistance and tuition loan.
Providing welfare conditions and contributing to the improvement of the quality of life of the bank employees and their basic family group are fundamental guidelines of the agreement. In line with these guidelines, mortgages loans are a priority in the portfolio of employee benefits. After four years of tenure, employees can access conventional-mortgages loans.
Bancolombia thinks of its employees as key to its success. For that reason, it has developed a strategy of a healthy and sustainable organization, which allows it to prioritize its action under 3 fundamental premises: Health, Labor Employment Security and Welfare of employees and their families. The Bank delivers different tools which contribute to increase the awareness for the care, minimize the risks and propitiate a balance between the employee’s work and personal life. All of these tools can be evidenced in activities such as:
Health:
| ● | Periodical medical evaluations. |
| ● | Executive medical checks. |
| ● | Health prevention and promotion programs. |
| ● | Accompaniment to employees with special health conditions. |
| ● | Programs that promote mental health and activities that prevent stress and intervene the effects of psychosocial factors. |
| ● | Programs that promote healthy lifestyles that improve cardiovascular health (nutrition and fitness). |
| ● | Epidemiological surveillance systems to monitor the main risks that impact health. |
Labor Employment Security:
| ● | The risks that are potentially harmful to the health of the employees are continuously monitored and the respective controls implemented. |
| ● | Implementation of the strategic road safety plan. |
| ● | Investigation of incidents and implementation of respective remediation actions. |
| ● | Monitoring of occupational safety and health conditions to suppliers of the supply chain. |
| ● | Evacuation drills, emergency prevention plan. |
| ● | Awareness and training of the employees on issues of emergency care and generating awareness to act in situations that create health and safety. |
Welfare:
| ● | Activities with the family: corporate day where the children share with their parents a working day. |
| ● | Activities which allow to highlight the talent of the employees and integrate the different regions of the country and increase the pride for the Bank. |
| ● | Recognizing the work and high performance of the employees. |
| ● | Sport, recreational, cultural and vocational activities. |
| ● | Promotion of financial learning through education and personalized advice according to the monitoring and analysis of financial indicators of employees. |
| ● | Guidance to the elderly in early retirement and retirement plans. |
| ● | Guidance to employees in key life events. |
| ● | Actions that support gender equality and seek to educate in values of zero tolerance towards gender violence. |
The following directors owned common shares in Bancolombia as of December 31, 2019: David Bojanini García and Gonzalo Alberto Pérez Rojas.
None of the directors and members of senior management owned preferred shares in Bancolombia as of December 31, 2019.
None of the directors and members of senior management’s shareholdings, individually or in the aggregate, exceed 1% of Bancolombia’s outstanding common shares, preferred shares or a combination of both classes of shares.
As of December 31, 2019, there are no stock options to acquire any of Bancolombia’s outstanding common shares or preferred shares or share-based payment to any employee.
| ITEM 7 | MAJOR STOCKHOLDERs AND RELATED PARTY TRANSACTIONS |
In accordance with the Bank’s by-laws, there are two classes of stock authorized and outstanding: common shares and preferred shares. Each common share entitles its holder to one vote at meetings of the Bank’s stockholders, and there are no differences in the voting rights conferred by any of the common shares. Under the Bank’s by-laws and Colombian corporate law, holders of preferred shares (and consequently, holders of ADRs) have no voting rights in respect of preferred shares, other than in limited circumstances as described in “Item 10. Additional Information – B. Memorandum and Articles of Association – Description of Share Rights, Preferences and Restrictions – Voting Rights – Preferred Shares”.
The following table sets forth, solely for purposes of United States securities laws, certain information regarding the beneficial ownership of Bancolombia’s capital stock by each person known to Bancolombia to own beneficially more than 5% of each class of Bancolombia’s outstanding capital stock as of March 31, 2020. A beneficial owner includes anyone who has the power to receive the economic benefit of ownership of the securities.
Name | Common Shares | Preferred Shares | % Ownership of Common Shares(1) | % Ownership of Preferred Shares(1) | % Ownership of Total Shares(1) |
| Grupo de Inversiones Suramericana S.A(2) | 235,098,823 | - | 46.12% | 0.00% | 24.44% |
| ADR Program | - | 181,610,396 | 0.00% | 40.17% | 18.88% |
| Fondo de Pensiones Obligatorias Protección | 51,362,149 | 24,212,042 | 10.08% | 5.36% | 7.86% |
| Fondo de Pensiones Obligatorias Porvenir Moderado | 21,394,682 | 52,137,057 | 4.20% | 11.53% | 7.65% |
| | ____________________________ |
| (1) | Common shares have one vote per share; preferred shares have limited voting rights under certain circumstances specified in the by-laws of Bancolombia filed as Exhibit 1 to this Annual Report. |
| (2) | Represents ownership of Grupo de Inversiones Suramericana S.A. directly and through its subsidiaries: Grupo de Inversiones Suramericana Panamá S.A., Inversiones y Construcciones Estrategicas S.A., CIA. Suramericana de Seguros de Vida S.A., Cia. Suramericana de Seguros S.A., Suratep. |
As of March 31, 2020, a total of 509,704,584 common shares and 452,122,416 preferred shares were registered in the Bank’s stockholder registry in the name of 30,357 stockholders. A total of 181,610,396 representing 40.17% of preferred shares were part of the ADR Program and were held by 34 record holders registered in The Bank of New York Mellon’s registered stockholder list. Given that some of the preferred shares and ADSs are held by nominees, the number of record holders may not be representative of the number of beneficial owners.
During the past year, the Bank’s ADR program changed its percentage ownership of the Bank, decreasing from 20.55% as of March 31, 2019 to 18.88% by the end of March 2020. In addition, Fondo de Pensiones Obligatorias Protección Moderado, a Colombian private pension fund manager, decreased its percentage of ownership to 7.65% as of March 31, 2020, compared to 8.12% as of March 31, 2019. Fondo de Pensiones Obligatorias Porvenir Moderado, a Colombian private pension fund manager, decreased its percentage of ownership to 7.86% as of March 31, 2020 compared to 8.98% as of March 31, 2019.
There are no significant changes in the percentage ownership held by major shareholders during the past three years.
There are no arrangements known to the Bank, which may at a subsequent date result in a change in control of the company.
To the extent known to the Bank, and in accordance with Colombian law, Bancolombia is not directly or indirectly owned or controlled by any other entity or person.
B. RELATED PARTY TRANSACTIONS
The Bank’s Corporate Governance Code provides that, in any event, any transaction regarding Bancolombia’s shares that is carried out by any officer, director or manager may not be executed for speculative purposes, which would be presumed if the following three conditions were met: (a) if suspiciously short lapses of time exist between the purchase and the sale of shares; (b) if situations arise proving to be exceptionally favorable for the Bank; and (c) if significant profits are obtained from this transaction.
All transactions that the Bank enters into with its directors, officers and senior executives are subject to the limitations and conditions set forth by the applicable law governing the prevention, handling and resolution of conflicts of interest.
Over time, Bancolombia has granted loans and engaged in other transactions with related parties. Such loans were made in the ordinary course of business, on substantially the same terms, including interest rates and required collateral, as those prevailing at the time for comparable transactions with other persons, and did not involve more than the normal risk of collectability, and do not present any additional unfavorable terms for the Company.
Bancolombia, on a non-consolidated basis, had a total amount of COP 2,152,246 million in loans outstanding to related parties as of February 29, 2020. The principal amounts outstanding as of February 29, 2020 includes in this amount are:
| Entity | Amount outstanding | Accrued Interest | Average Interest rate |
| | In millions of COP, except percentages |
| Renting Colombia S.A. | 737,081 | 1,659 | 6.00% |
| Grupo De Inversiones Suramericana S.A. | 416,083 | 3,453 | 5.99% |
| Sura Asset Management S.A. | 320,693 | 5,796 | 4.85% |
| FCP Fondo Inmobiliario Colombia | 304,998 | 960 | 7.11% |
| Servicios Generales Suramericana S.A.S | 248,384 | 2,938 | 5.45% |
For additional information regarding the Bank’s related party transactions, please see Note 28 to the Consolidated Financial Statements.
C. INTEREST OF EXPERTS AND COUNSEL
Not applicable.
| ITEM 8 | FINANCIAL INFORMATION |
| A. | CONSOLIDATED FINANCIAL STATEMENTS AND OTHER FINANCIAL INFORMATION |
| A.1 | CONSOLIDATED FINANCIAL STATEMENTS |
Reference is made to pages F-1 through F-200.
The Bank is involved in normal collection proceedings and restructuring proceedings with respect to certain borrowers as well as other legal proceedings. For further information regarding legal proceedings, see Note 21 to the Consolidated Financial Statements,” Provisions and Contingent Liabilities”.
The declaration, amount and payment of dividends are based on Bancolombia’s unconsolidated earnings. Dividends must be approved at the ordinary annual shareholders’ meeting upon the recommendation of the Board of Directors. Under the Colombian Commercial Code, after payment of income taxes and appropriation of legal and other reserves, and after setting off losses from prior fiscal years, Bancolombia must distribute to its stockholders at least 50% of its annual net income or 70% of its annual net income if the total amount of reserves exceeds its outstanding capital. Such dividend distribution must be made to all stockholders, in cash or in issued stock of Bancolombia, as may be determined by the stockholders, and within a year from the date of the ordinary annual stockholders’ meeting in which the dividend was declared. According to Colombian law, the minimum dividend per share may be waived by an affirmative vote of the holders of 78% of the voting shares present at the stockholders’ meeting.
The annual net profits of Bancolombia must be applied as follows: (i) first, an amount equal to 10% of Bancolombia’s net profits to a legal reserve until such reserve is equal to at least 50% of the Bank’s paid-in capital; (ii) second, to the payment of the minimum dividend on the preferred shares (for more information, see Item 10. "Additional Information – B. Memorandum and Articles of Association”); and (iii) third, as may be determined in the ordinary annual stockholders’ meeting by the vote of the holders of a majority of the shares entitled to vote.
The following table sets forth the annual cash dividends paid on each common share and each preferred share during the periods indicated:
Dividends declared with respect to net
income earned in: | Cash dividends
per share(1)(2) | Cash dividends
per share(1)(3) |
| | (COP) | (U.S. dollars) |
| 2019 | 1,638 | 0.404 |
| 2018 | 1,092 | 0.344 |
| 2017 | 1,020 | 0.367 |
| 2016 | 950 | 0.329 |
| 2015 | 888 | 0.267 |
| | ____________________________ |
| (1) | Includes common shares and preferred shares. |
| (2) | Cash dividends for 2019, 2018, 2017, 2016 and 2015 were paid in quarterly installments. |
| (3) | Amounts have been translated from pesos at the Representative Market Rate in effect at the end of the month in which the dividends were declared (March). |
There have not been any significant changes since the date of the annual Consolidated Financial Statements included in this document.
| ITEM 9 | THE OFFER AND LISTING |
| A. | OFFER AND LISTING DETAILS |
Bancolombia’s ADRs, each representing four preferred shares, have been listed on the New York Stock Exchange (“NYSE”) since 1995, where they are traded under the symbol “CIB”. Bancolombia’s preferred shares are also listed on the Colombian Securities Exchange.
ADRs evidencing ADSs are issuable by The Bank of New York Mellon (the “Depositary”), as Depositary, pursuant to the Deposit Agreement, dated as of July 25, 1995, entered into by Bancolombia, the Depositary, the owners of ADRs from time to time and the owners and beneficial owners from time to time of ADRs, pursuant to which the ADSs are issued (as amended, the “Deposit Agreement”). The Deposit Agreement was amended and restated on January 14, 2008. Copies of the Deposit Agreement are available for inspection at the Corporate Trust Office of the Depositary, currently located at 101 Barclay Street, New York, New York 10286, and at the office of Fiduciaria Bancolombia, as agent of the Depositary, currently located at Carrera 48, No. 26 - 85, Medellin, Colombia or Calle 30A No. 6-38, Bogotá, Colombia. The Depositary’s principal executive office is located at One Wall Street, New York, New York 10286.
On September 30, 1998, Bancolombia filed a registration statement on Form F-3 with the SEC to register ADSs evidenced by ADRs, each representing four preferred shares, issued in connection with the merger between BIC and Banco de Colombia for resale by the holders into the U.S. public market from time to time. On January 24, 2005, the Board determined to deregister the unsold ADSs registered under the registration statement on Form F-3. On March 14, 2005, Bancolombia filed an amendment to the registration statement deregistering the remaining unsold ADSs. On August 8, 2005, Bancolombia filed, through the Depositary, a registration statement on Form F-6 registering 50,000,000 ADSs evidenced by ADRs in connection with the Conavi/Corfinsura merger.
On May 14, 2007, Bancolombia filed an automatic shelf registration statement on Form F-3 with the SEC to register an indeterminate amount of debt instruments, preferred shares and rights to subscribe for preferred shares in connection with the subsequent offerings which took place in the second and third quarter of 2007. On January 14, 2008, by filing the Form F-6 with the SEC, Bancolombia increased the amount of its ADR program up to 400,000,000 American Depositary Shares and registered some amendments to the Depositary Agreement of ADSs between Bancolombia and The Bank of New York Mellon. On July 13, 2010, Bancolombia filed an automatic shelf registration statement on Form F-3 with the SEC to register an indeterminate amount of debt instruments, preferred shares, American Depositary Shares representing preferred shares and rights to subscribe for preferred shares in connection with the subsequent offering of subordinated debt instruments which took place on July 19, 2010. On February 6, 2012, Bancolombia priced a public offer of 63,999,997 preferred shares without voting rights, which represented an aggregate amount of approximately COP 1,680 billion. On March 3, 2014, Bancolombia priced a public offer of 110,000,000 preferred shares without voting rights, which represented an aggregate amount of approximately COP 2,656 billion.
On April 4, 2019, Bancolombia filed an automatic shelf registration statement on Form F-3 with the SEC to register an indeterminate amount of debt instruments, preferred shares and rights to subscribe for preferred shares.
Not applicable.
The Colombian Securities Exchange is the principal non-U.S. trading market for the preferred shares and the sole market for the common shares. As of December 31, 2019, the market capitalization for Bancolombia’s preferred shares based on the closing price in the Colombian Securities Exchange was COP 20,707 billion (Bancolombia’s total market capitalization, which includes the common and preferred shares, was COP 43,134 billion or USD 13.09 billion as of the same date).
There are no official market makers or independent specialists on the Colombian Securities Exchange to ensure market liquidity and, therefore, orders to buy or sell in excess of corresponding orders to sell or buy will not be executed. The aggregate equity market capitalization of the Colombian Securities Exchange, as of December 31, 2019, was COP 436,786 billion (USD 132,599 billion), with 81 companies listed as of that date.
Not applicable.
Not applicable.
Not applicable.
| ITEM 10 | ADDITIONAL INFORMATION |
Not applicable.
| B. | MEMORANDUM AND ARTICLES OF ASSOCIATION |
Set forth below is certain information concerning the Bank’s capital stock and a brief summary of certain significant provisions of the Bank’s bylaws and Colombian corporate law. This description does not purport to be complete and is qualified by reference to the Bank’s bylaws (an English translation of which is attached as Exhibit 1 to this Annual Report) and to Colombian corporate law.
Bancolombia’s Corporate Purpose
Pursuant to Article 4 of its bylaws, Bancolombia’s corporate purpose consists of all kinds of banking operations, business, acts and services. Subject to applicable law, Bancolombia may carry out all the activities and investments authorized to banks. Bancolombia is also authorized to participate in the capital stock of other companies, subject to any restrictions imposed by applicable law.
Board of Directors
As of the date of filing of this Annual Report, Bancolombia’s board of directors is composed of seven directors, elected for a two-year term, with no alternate directors. For additional information regarding Bancolombia’s current directors please see Item 6.A, “Directors and Senior Management”.
After being designated, all of the members of the Board of Directors need an authorization from the Superintendency of Finance. The SFC assesses whether the director has an adequate profile for the position according to the requirements under Colombian Law.
According to Decree 3923 of 2006, the election of independent directors must be in a separate ballot from the ballot to elect the rest of directors, unless the reaching of the minimum number of independent directors required by law or by the by-laws is assured, or when there is only one list that includes the minimum number of required independent directors.
According to Law 964 of 2005, 25% of the members of the board of directors shall be independent. An “independent director” is a director who is NOT: (i) an employee or director of the issuer or any of its parent or subsidiary companies, including all those persons acting in said capacity during the year immediately preceding that in which they were appointed, except in the case of an independent member of the board of directors being re-elected; (ii) shareholders, who either directly or by virtue of an agreement direct, guide or control the majority of the entity’s voting rights or who determine the majority composition of the administration, the board of directors or other corporate bodies of this same entity; (iii) a partner or employee of any association or firm that provides advisory or consultancy services to the issuer or to companies who belong to the same economic group to which the issuer in question belongs, in the event that income obtained from such services represent for said association or firm twenty percent (20%) or more of its total operating income; (iv) an employee or director of a foundation, association or institution that receives significant donations from the issuer. The term “significant donations” is quantified as being twenty percent (20%) or more of the total amount of donations received by the respective institution; (v) an administrator of any entity on whose board of directors a legal representative of the issuer participates; and (vi) any person who receives from the issuer any kind of remuneration different from fees as a member of the board of directors, of the audit committee or any other committee set up by the board of directors.
Elections are made under a proportional representation voting system. Under that system: (i) each holder of common shares is entitled at the annual general shareholders’ meeting to nominate for election one or more directors; (ii) each nomination of one or more directors constitutes a group for the purposes of the election; (iii) each group of nominees must be listed in the order of preference for nominees in that group to be elected; (iv) once all groups have been nominated, holders of common shares may cast one vote for each common share held in favor of a particular group of nominees. Votes may not be cast for particular nominees in a group; they may be cast only for the entire group; (v) the total number of votes casted in the election is divided by the number of directors to be elected. The resulting quotient is the quota of votes necessary to elect particular directors. For each time that the number of votes cast for a group of nominees is divisible by the quota of votes, one nominee from that group is elected, in the order of the list of that group; and (vi) when no group has enough remaining votes to satisfy the quota of votes necessary to elect a director, any remaining board seat or seats are filled by electing the highest remaining nominee from the group with the highest number of remaining votes cast until all available seats have been filled.
The directors of Bancolombia must abstain from participating, directly or through an intermediary, on their own behalf or on behalf of a third party, in activities that may compete against the Bank or in conflict-of-interest transactions that may generate a conflict of interest situation, unless the general shareholders meeting expressly authorizes such transactions. For such purposes, the directors shall provide the shareholders’ meeting with all the relevant information necessary for the shareholders to reach a decision. If the director is a shareholder, his or her vote shall be excluded from the respective decision process. In any case, the general shareholders meeting could only grant its authorization if the act does not adversely affect Bancolombia’s interests.
In the general annual shareholders meeting the shareholders are responsible for determining, the compensation of the members of the board of directors.
Pursuant to the by-laws of Bancolombia, the board of directors has the power to authorize the execution of any agreement, within the corporate purpose of Bancolombia, and to adopt the necessary measures in order for the Bank to accomplish its purpose. Furthermore, the board of directors must authorize certain transactions such as the issuance of Bank’s bonds.
Description of Share Rights, Preferences and Restrictions
Bancolombia’s bylaws provide for an authorized capital stock of COP 700 billion divided into 1,400,000,000 shares of a par value of COP 500 each, which must belong to one of the following classes: (i) common shares, (ii) privileged shares; and (iii) shares with preferred dividend and no voting rights (“preferred shares”). Pursuant to Article 8 of the bylaws, all shares issued shall have the same nominal value.
As of December 31, 2019, Bancolombia had 509,704,584 common shares and 452,122,416 preferred shares outstanding and a shareholders’ equity of COP 26,884 billion divided into 961,827,000 shares.
Voting Rights
Common Shares
The holders of common shares are entitled to vote on the basis of one vote per share on any matter subject to approval at a general shareholders’ meeting. These general meetings may be ordinary meetings or extraordinary meetings.
Ordinary general shareholder’s meetings occur at least once a year but no later than three months after the end of the prior fiscal year, for the following purposes: (i) to consider the approval of Bancolombia’s annual report, including the financial statements for the preceding fiscal year; (ii) to review the annual report prepared by the external auditor; (iii) to determine the compensation for the members of the board of directors, and the external auditor (the external auditor compensation is determine every two years) (iv) to elect directors, the external auditor and the client representative (“defensor del consumidor financiero”). The client representative’s primary duty is to solve the individual complaints submitted by clients and users and serve as their spokesman, the directors and the external auditor (each for a two-year term); and (v) to determine the dividend policy and the allocation of profits, if any, of the preceding fiscal year, as well as any retained earnings from previous fiscal years.
Extraordinary general shareholders’ meetings may take place when duly called for a specified purpose or purposes, or, without prior notice, when holders representing all outstanding shares entitled to vote on the issues presented are present at the meeting.
Quorum for both ordinary and extraordinary general shareholders’ meetings to be convened at first call requires the presence of two or more shareholders representing at least half plus one of the outstanding shares entitled to vote at the relevant meeting. If a quorum is not present, a subsequent meeting is called at which the presence of one or more holders of shares entitled to vote at the relevant meeting constitutes a quorum, regardless of the number of shares represented. General shareholders’ meetings may be called by the board of directors, the CEO or the external auditor of Bancolombia. In addition, two or more shareholders representing at least 20% of the outstanding shares have the right to request that a general meeting be convened. Notice of ordinary meetings and extraordinary meetings convened to approve fiscal year-end financial statements, the reduction of the outstanding capital, the merger, spin-off or sale of more than 25% of the assets, liabilities and contracts, must be published in one newspaper of wide circulation at Bancolombia’s principal place of business at least 30 calendar days prior to such meeting. Notice of other extraordinary meetings, must be published in one newspaper of wide circulation at Bancolombia’s principal place of business at least 15 calendar days prior to such meeting listing the matters to be addressed at such meeting.
Except when Colombian law or Bancolombia’s bylaws require a special majority, action may be taken at a general shareholder’s meeting by the vote of two or more shareholders representing a majority of common shares present. Pursuant to Colombian law and/or Bancolombia’s bylaws, special majorities are required to adopt the following corporate actions: (i) a favorable vote of at least 70% of the shares represented at a general shareholders’ meeting is required to approve the issuance of shares without preemptive rights available for shareholders; (ii) a favorable vote of at least 78% of the holders of represented common shares to decide not to distribute as dividend at least 50% of the annual net profits of any given fiscal year; (iii) a favorable vote of at least 80% of the holders of represented common shares and 80% of the holders of outstanding preferred shares to approve the payment of the dividend in shares; and (iv) a favorable vote of at least 70% of the holders of common shares and of outstanding preferred shares to effect a decision to impair the conditions or rights established for such preferred shares, or a decision to convert those preferred shares into common shares.
If the Superintendency of Finance determines that any amendment to the bylaws fails to comply with Colombian law, it may demand that the relevant provisions be modified accordingly. Under these circumstances, Bancolombia will be obligated to comply in a timely manner.
Preferred Shares
The holders of preferred shares are not entitled to receive notice of, attend to or vote at any general shareholders’ meeting except as described below.
The holders of preferred shares will be entitled to vote on the basis of one vote per share at any shareholders’ meeting, whenever a shareholders vote is required on the following matters, in addition to those indicated above: (i) when voting the anticipated dissolution, merger or transformation of the corporation or change of its corporate purpose. (ii) when the preferred dividend has not been fully paid during two consecutive annual terms. In this event, holders of such shares shall retain their voting rights until the corresponding dividends have been fully paid to them. (iii) if at the end of a fiscal period, the Bank’s profits are not enough to pay the minimum dividend and the Superintendency of Finance, by its own decision or upon petition of holders of at least ten percent (10%) of preferred shares, determines that benefits were concealed or shareholders were misled with regard to benefits received from the Bank by the Bank’s directors or officers decreasing the profits to be distributed, the Superintendency of Finance may resolve that holders of preferred shares should participate with speaking and voting rights at the general shareholders’ meeting, in the terms established by law. (iv) when the registration of shares at the Colombian Securities Exchange or at the Superintendency of Finance, is suspended or canceled. In this event, voting rights shall be maintained until the irregularities that resulted in such cancellation or suspension are resolved. (v) when voting amendments that could impair the preferred shares’ rights, or the conversion of the preferred shares to common shares, a favorable vote of a minimum of seventy percent (70%) of the subscribe capital stock, including the favorable vote of a minimum of seventy percent (70%) of the preferred shares, is required.
Bancolombia must cause a notice of any meeting at which holders of preferred shares are entitled to vote to be mailed to each record holder of preferred shares. Each notice must include a statement stating: (i) the date of the meeting; (ii) a description of any resolution to be proposed for adoption at the meeting on which the holders of preferred shares are entitled to vote; and (iii) instructions for the delivery of proxies.
Dividends
Common Shares
Once the unconsolidated Financial Statements are approved by the general shareholders meeting, the appropriation for the payment of taxes of the corresponding taxable year has been made, and the transfers to the reserves have been performed, then they can determine the allocation of distributable profits, if any, of the preceding year.
Under the Colombian Commercial Code, a company must distribute at least 50% of its annual net profits to all shareholders, payable in cash, or as determined by the shareholders, within a period of one year following the date on which the shareholders determine the dividends. If the total amount segregated in all reserves of a company exceeds its outstanding capital, this percentage is increased to 70%. The minimum common stock dividend requirement of 50% or 70%, as the case may be, may be waived by a favorable vote of the holders of 78% of a company’s common stock present at the meeting.
Under Colombian law and Bancolombia’s bylaws annual net profits are to be applied as follows: (i) first, an amount equivalent to 10% of net profits is segregated to build a legal reserve until that reserve is equal to at least 50% of Bancolombia’s paid-in capital; (ii) second, payment of the minimum dividend on the preferred shares; and (iii) third, allocation of the net profits is determined by the holders of a majority of the common shares entitled to vote on the recommendation of the board of directors and the President and may, subject to further reserves required by the by-laws, be distributed as dividends. Under the Bank’s bylaws, the dividends payable to the holders of common shares cannot exceed the dividends payable to holders of the preferred shares. Bancolombia’s bylaws requires to maintain a reserve fund equal to 50% of paid-in capital. All common shares that are fully paid in and outstanding at the time a dividend or other distribution is declared are entitled to share equally in that dividend or other distribution. Common shares that are only partially-paid participate in a dividend or distribution in the same proportion than the shares that have been fully paid in at the time of the dividend or distribution.
The general shareholders’ meeting may allocate a portion of the profits to welfare, education or civic services, or to support economic organizations of the Bank’s employees.
Preferred Shares
Holders of preferred shares are entitled to receive dividends based on the net profits of the preceding fiscal year, after deducting losses affecting the capital and once the amount that shall be legally set apart for the legal reserve has been deducted, but before creating or accruing for any other reserve, of a non-cumulative minimum preferred dividend equal to one percent (1%) yearly of the subscription price of the preferred share, provided this dividend is higher than the dividend assigned to common shares. If this is not the case, the dividend shall be increased to an amount that is equal to the per share dividend on the common shares. The dividend received by holders of common shares may not be higher than the dividend assigned to preferred shares.
Payment of the preferred dividend shall be made at the time and in the manner established in the general shareholders’ meeting and with the priority indicated by Colombian law.
In the event that the holders of preferred shares have not received the minimum dividend for a period in excess of two consecutive fiscal years, they will acquire certain voting rights. See Item 10. “Aditional Information – B. Memorandum and Articles of Association – Description of Share Rights, Preferences and Restrictions – Voting Rights – Preferred Shares”.
General Considerations Relating to Dividends
In the general shareholders’ meeting, shareholders will determine the effective date, the system and the place for payment of dividends, including payment in installments.
Dividends declared on the common shares and the preferred shares will be payable to the record holders of those shares, as they are recorded on Bancolombia’s stock registry, on the appropriate record dates as determined in the general shareholders’ meeting.
Any dividend in shares payable by Bancolombia will be paid in common shares to the holders of common shares and in preferred shares to the holders of preferred shares. Nonetheless, Shareholders at the general shareholders’ meeting may authorize the payment in common shares to all shareholders.
Any dividend in shares requires the approval of 80% or more of the shares present at a shareholders’ meeting, which will include 80% or more of the outstanding preferred shares. In the event that such voting majority is not obtained, shareholders may individually elect to receive a stock dividend or a cash dividend.
Liquidation Rights
Bancolombia will be dissolved if certain events take place, including the following: (i) its term of existence, as stated in the by-laws, expires without being extended by the shareholders prior to its expiration date; (ii) losses cause the decrease of its shareholders’ equity below 50% of its outstanding capital stock, unless one or more of the corrective measures described in the Colombian Commercial Code are adopted by the shareholders within six months, (iii) by decision at the general shareholders’ meeting; and (iv) in certain other events expressly provided by law and in the by-laws.
Upon dissolution, a liquidator must be appointed by the general shareholders’ meeting to wind up its affairs. In addition, the Superintendency of Finance has the power to take over the operations and assets of a bank and proceed to its liquidation under certain circumstances and in the manner prescribed in the “Estatuto Orgánico del Sistema Financiero”, Decree 663 of 1993. For more information see Item 4. “Information on the Company – B. Business Overview – B.8. Supervision and Regulation – Bankruptcy Considerations”.
Preemptive Rights and Other Anti-Dilution Provisions
Under the Bank’s bylaws, the holders of common shares determine in their meeting the amount of authorized capital stock, and the board of directors has the power to (a) order the issuance and regulate the terms of subscription of common shares up to the total amount of authorized capital stock and (b) regulate the issuance of shares with rights to a preferential dividend but without the right to vote, when expressly delegated at the general shareholders’ meeting. The issuance of preferred shares must always be first approved at the general shareholders’ meeting, which shall determine the nature and extent of any privileges, according to the bylaws and Colombian law.
The Bank’s bylaws and Colombian law require that, whenever the Bank issues new shares of any outstanding class, it must offer the holders of each class of shares the right to purchase a number of shares of such class sufficient to maintain their existing percentage ownership of the aggregate capital stock of the Bank. These rights are called preemptive rights. See Item 3. “Key Information – D. Risk Factors – Preemptive rights may not be available to holders of American Depositary Receipts (“ADRs”) evidencing ADSs”.
Shareholders at a general meeting of shareholders may suspend preemptive rights with respect to a particular capital increase by a favorable vote of at least 70% of the shares represented at the meeting. Preemptive rights must be exercised within the period stated in the share placement terms of the increase, which cannot be shorter than 15 business days following the publication of the notice of the public offer of that capital increase. From the date of the notice of the share placement terms, preemptive rights may be transferred separately from the corresponding shares.
The Superintendency of Finance will authorize decreases in the outstanding capital stock decided by the holders of common shares only if: (i) Bancolombia has no liabilities; (ii) Bancolombia’s creditors consent in writing; or (iii) the outstanding capital stock remaining after the reduction represents at least twice the amount of Bancolombia’s liabilities.
Limits on Purchases and Sales of Capital Stock by Related Parties
Pursuant to the Colombian Commerce Code, the members of the Bank’s board of directors and certain of the Bank’s principal executive officers may not, directly or indirectly, buy or sell shares of the Bank’s capital stock while they hold their positions, except when dealing with nonspeculative operations and in that case they need to obtain the prior authorization of the board of directors passed with the vote of two-thirds of its members (excluding, in the case of transactions by a director, such director’s vote) or when deemed relevant by the Board of Directors of the Bank with the authorization of the Shareholders Meeting the affirmative vote of the ordinary majority foreseen in the bylaws, excluding the vote of the petitioner.
No Redemption
Colombian law prohibits Bancolombia from repurchasing shares of its capital stock, including the preferred shares.
Limitations on the Rights to Hold Securities
There are no limitations in the Bank’s by-laws or Colombian law on the rights of Colombian residents or foreign investors to own the shares of the Bank, or on the right to hold or exercise voting rights with respect to those shares.
Restrictions on Change of Control Mergers, Acquisitions or Corporate Restructuring of the Company
Under Colombian law and the Bank’s bylaws, the general shareholders’ meeting has full and exclusive authority to approve any corporate restructuring including, mergers, acquisitions or spin-offs upon authorization by the Colombian Superintendency of Finance.
Ownership Threshold Requiring Public Disclosure
We must disclose to the Superintendency of Finance at the end of each fiscal quarter the names of the shareholders of the Bank’s, indicating at least, the twenty-five shareholders with the highest number of shares.
Colombian securities regulations set forth the obligation to disclose any material event or relevant fact. Any transfer of shares equal or greater than 5% of the Bank’s capital stock or any person acquiring a percentage of shares that would make him the beneficial owner of 5% or more of the Bank’s capital stock, is a material event, and therefore, must be disclosed to the Superintendency of Finance.
Changes in the Capital of the Company
There are no conditions in the Bank’s by-laws governing changes in the Bank’s capital stock that are more stringent than those required under Colombian law.
Bancolombia has not entered into any contract, other than those entered in the ordinary course of business or that are not considered to be material, to which it or any of its subsidiaries is a party, for the two years immediately preceding the date of this Annual Report.
The Central Bank has consistently made foreign currency available to Colombian private sector entities to meet their foreign currency obligations. Nevertheless, in the event of shortages, foreign currency may not be available to private sector companies and the amounts needed by the Bank to service foreign currency obligations may not be purchased in the open market without substantial additional costs.
The Foreign Exchange Statute, Law 9 of 1991, outlines the Colombian foreign exchange regime which relates to matters such as imports and exports of goods, foreign indebtedness, and guarantees in foreign currencies, among others. Additionally, Decree 1068 of 2015 and Decree 119 of 2017, as amended, sets forth an International Investments Regime which provides for rules applicable to foreign residents who invest in the Colombian securities markets and undertake other types of investments, prescribes registration with the Central Bank of certain foreign exchange transactions, and specifies procedures pursuant to which certain types of foreign investments are to be authorized and administered. Both, the Foreign Exchange Statute and the International Investments Regime are regulated by External Resolution No. 1 of 2018 and External Regulating Circular DCIN 83 of 2006, both as amended, of the Board of Directors of the Central Bank.
Under Colombian law and the Bank’s by-laws, foreign investors receive the same treatment as Colombian citizens with respect to ownership and the voting rights of ADSs and preferred shares. For a detailed discussion of ownership restrictions see Item 4. “Information on the Company - B. Business Overview - B.8. Supervision and Regulation – Ownership and Management Restrictions”.
Colombian Taxation
ADRs do not have the same tax benefits as other equity investments in Colombia
Although ADRs represent Bancolombia’s preferred shares, they are held through a fund of foreign capital in Colombia which is subject to a specific tax regulatory regime. Accordingly, the regulation applicable in Colombia to equity investments, in particular those relating to dividends and profits from sale, are not applicable to ADRs, including the Bank’s ADRs. For more information see Item 10. “Additional Information. –E. Taxation –Colombia Taxation”.
Under Article 18-1 of the Fiscal Statute, modified by the Law 2010 de 2019, dividends are subject to a dividends tax, as follows:
Abroad Capital investment
To determine the income tax with respect to the profits obtained by the foreign capital investments of the portfolio, regardless of the modality or vehicle used to make the investment by the investor, the following rules shall apply:
i. Dividends from profits that paid the tax in the company, that is, not levied, the rate will be 10%
ii. For the dividends coming from profits that did NOT paid the tax in the company, that is, levied, the following rule will be followed:
Dividends will be levied at the rate of 25% and the retention rate of 10% will be applied to the remnant.
For purposes of Colombian taxation, an individual is considered as a resident if he or she meets any of the following conditions:
| - | Continuous or discontinuous presence in Colombia for more than 183 calendar days including entry and departure days from the country, within any period of 365 consecutive calendar days, provided that, when the continuous or discontinuous presence in the country is exercised in more than one fiscal year, the individual would be considered as a resident in the second fiscal year. |
| - | Those persons working for the Colombian Foreign Service or those serving the Colombian Foreign Service and which, by virtue of the Vienna Conventions on Diplomatic and Consular Relations, are exempt from taxation on all or part of their income and occasional earnings in the country in which they are serving during the respective tax year or period. |
| - | Is a Colombian citizen and during the applicable fiscal year: |
| a) | The spouse or permanent life partner, or underage dependent children, are residents in Colombia for tax purposes; or, |
| b) | 50% or more of their income has a Colombian source; or, |
| c) | 50% or more of their assets are managed in Colombia; or, |
| d) | 50% or more of their assets are held or deemed to be held in Colombia; or, |
| e) | The Colombian taxation authority has requested evidence of the foreign residency status, and it is not provided by the individual; or |
| f) | Had fiscal residence in a jurisdiction non - cooperating, low or no taxation and preferential tax regime. |
Colombian citizens are not considered a tax resident if they meet any of the above conditions and fulfill at least one of the following:
| a) | 50% or more of their annual income has its source in the jurisdiction in which they are domiciled; or, |
| b) | 50% or more of their assets are located in the jurisdiction where they are domiciled. |
Entities
For purposes of Colombian taxation, a legal entity is a resident of Colombia if its principal office is located in Colombia. For this purpose, the principal office means the place where material commercial and management decisions are made.
Companies and entities that comply with any of the following conditions are also considered to be nationals for tax purposes:
| a) | Primary domicile in Colombia; or |
| b) | Incorporated in Colombia, in accordance with Colombian laws. |
Preferred shares
Preferred shares will have the same treatment as financial liabilities for the issuer's tax purposes. The treatment will be the same as financial assets for the holder. This treatment will not be applicable to listed shares that do not comply with the rest of the requirements established by Article 33-3 of the Tax Statute.
Other Tax Considerations
As of the date of this report, there is not an agreement to avoid double taxation between Colombia and the United States.
United States Federal Income Taxation Considerations
This section describes the material United States federal income tax consequences generally applicable to a U.S. holder (as defined below) of owning preferred shares or ADSs. It applies to you only if you hold your preferred shares or ADSs as capital assets for United States federal income tax purposes. This discussion addresses only United States federal income taxation and does not discuss all of the tax consequences that may be relevant to you in light of your individual circumstances, including foreign, state or local tax consequences, estate and gift tax consequences, and tax consequences arising under the Medicare contribution tax on net investment income or the alternative minimum tax. This section does not apply to you if you are a member of a special class of holders subject to special rules, including:
| ● | A dealer in securities or currencies, |
| ● | A trader in securities that elects to use a mark-to-market method of accounting for securities holdings, |
| ● | A tax-exempt organization, |
| ● | A life insurance company, |
| ● | A person that actually or constructively owns 10.00% or more of the combined voting power of the Bank’s voting stock or of the total value of the Bank’s stock, |
| ● | A person that holds preferred shares or ADSs as part of a straddle or a hedging or conversion transaction for United States federal income tax purposes, |
| ● | A person that purchases or sells preferred shares or ADSs as part of a wash sale for United States federal income tax purposes, or |
| ● | A person whose functional currency is not the U.S. dollar. |
This section is based on the Internal Revenue Code of 1986, as amended, its legislative history, existing and proposed regulations, published rulings and court decisions. These laws are subject to change, possibly on a retroactive basis. There is currently no comprehensive income tax treaty between the United States and Colombia. In addition, this section is based in part upon the representations of the Depositary and the assumption that each obligation in the Deposit Agreement and any related agreement will be performed in accordance with its terms.
If an entity or arrangement that is treated as a partnership for United States federal income tax purposes holds the preferred shares or ADSs, the United States federal income tax treatment of a partner will generally depend on the status of the partner and the tax treatment of the partnership. A partner in a partnership holding the preferred shares or ADSs should consult its tax advisor with regard to the United States federal income tax treatment of an investment in the preferred shares or ADSs.
You are a U.S. holder if you are a beneficial owner of preferred shares or ADSs and you are:
| ● | A citizen or resident of the United States, |
| ● | A domestic corporation (or an entity treated as a domestic corporation), |
| ● | An estate whose income is subject to United States federal income tax regardless of its source, or a trust if a United States court can exercise primary supervision over the trust’s administration and one or more United States persons are authorized to control all substantial decisions of the trust. |
In general, and taking into account the earlier assumptions, for United States federal income tax purposes, if you hold ADRs evidencing ADSs, you will be treated as the owner of the preferred shares represented by those ADRs. Exchanges of preferred shares for ADRs, and ADRs for preferred shares generally will not be subject to United States federal income tax.
The tax treatment of your preferred shares or ADSs will depend in part on whether or not we are classified as a passive foreign investment company, or PFIC, for United States federal income tax purposes. Except as discussed below under “PFIC Rules”, this discussion assumes that we are not classified as a PFIC for United States federal income tax purposes.
You should consult your own tax advisor regarding the U.S. federal, state and local and other tax consequences of owning and disposing of preferred shares or ADSs in your particular circumstances.
Taxation of Distributions
Under the United States federal income tax laws, if you are a U.S. holder, the gross amount of any dividend we pay out of the Bank’s current or accumulated earnings and profits (as determined for United States federal income tax purposes), other than certain pro-rata distribution of the Bank’s preferred shares, including the amount of any Colombian tax withheld, will be treated as a dividend that is subject to United States federal income taxation. If you are a non-corporate U.S. holder, dividends paid to you that constitute qualified dividend income will be taxable to you at preferential rates applicable to long-term capital gains provided that you hold the preferred shares or ADSs for more than 60 days during the 121-day period beginning 60 days before the ex-dividend date (or, if the dividend is attributable to a period or periods aggregating over 366 days, provided that you hold the preferred shares or ADSs for more than 90 days during the 181-day period beginning 90 days before the ex-dividend date) and meet other holding period requirements. Dividends we pay with respect to the ADSs generally will be qualified dividend income provided that, in the year that you receive the dividend, the ADSs are readily tradable on an established securities market in the United States. The Bank believes that its ADSs, which are listed on the NYSE, are readily tradable on an established securities market in the United States; however, there can be no assurance that the Bank’s ADSs will continue to be readily tradable on an established securities market. Because the preferred shares are not listed on any United States securities market, it is unclear whether dividends we pay with respect to the preferred shares will also be qualified dividend income. If dividends we pay with respect to the Bank’s preferred shares are not qualified dividend income, then the U.S. dollar amount of such dividends received by a U.S. holder (including dividends received by a non-corporate U.S. holder) will be subject to taxation at ordinary income tax rates.
You must include any Colombian tax withheld from the dividend payment in this gross amount even though you do not in fact receive it. The dividend is taxable to you when you, in the case of preferred shares, or the Depositary, in the case of ADSs, receive the dividend, actually or constructively. The dividend will not be eligible for the dividends-received deduction generally allowed to United States corporations in respect of dividends received from other United States corporations. The amount of the dividend distribution that you must include in your income as a U.S. holder will be the U.S. dollar value of the Colombian Peso payments made, determined at the spot Colombian Peso / U.S. dollar rate on the date the dividend distribution is includible in your income, regardless of whether the payment is in fact converted into U.S. dollars. Generally, any gain or loss resulting from currency exchange fluctuations during the period from the date you include the dividend payment in income to the date you convert the payment into U.S. dollars will be treated as ordinary income or loss and will not be eligible for the special tax rate applicable to qualified dividend income. The gain or loss generally will be income or loss from sources within the United States for foreign tax credit limitation purposes. Distributions in excess of current and accumulated earnings and profits, as determined for United States federal income tax purposes, will be treated as a non-taxable return of capital to the extent of your basis in the preferred shares or ADSs and thereafter as capital gain. However, we do not expect to calculate earnings and profits in accordance with U.S. federal income tax principles. Accordingly, you should expect to generally treat distributions with respect to preferred shares or ADSs as dividends.
Subject to certain limitations, the Colombian tax withheld and paid over to Colombia will be creditable or deductible against your United States federal income tax liability. Special rules apply in determining the foreign tax credit limitation with respect to dividends that are subject to preferential rates. To the extent a refund of the tax withheld is available to you under Colombian law, the amount of tax withheld that is refundable will not be eligible for credit against your United States federal income tax liability. The rules governing foreign tax credits are complex, and U.S. holders should consult their tax advisors regarding the creditability of foreign taxes in their particular circumstances.
For foreign tax credit purposes, dividends will generally be income from sources outside the United States and will generally be “passive” income for purposes of computing the foreign tax credit allowable to you.
The rules governing the foreign tax credit are complex. You are urged to consult your tax advisors regarding the availability of the foreign tax credit under your particular circumstances.
Taxation of Capital Gains
If you are a U.S. holder and you sell or otherwise dispose of your preferred shares or ADSs, you will recognize capital gain or loss for United States federal income tax purposes equal to the difference between the U.S. dollar value of the amount that you realize and your tax basis, determined in U.S. dollars, in your preferred shares or ADSs. Capital gain of a non-corporate U.S. holder is generally taxed at preferential rates where the property is held for more than one year. The deductibility of capital losses is subject to limitations. The gain or loss will generally be income or loss from sources within the United States for foreign tax credit limitation purposes.
PFIC Rules
We believe that preferred shares and ADSs should not be treated as stock of a PFIC for United States federal income tax purposes, and we do not expect to become a PFIC in the foreseeable future. However, this conclusion is a factual determination that is made annually and thus may be subject to change. It is therefore possible that we could become a PFIC in a future taxable year. If we were to be treated as a PFIC, unless you elect to be taxed annually on a mark-to-market basis with respect to your preferred shares or ADSs, the following rules would apply. With certain exceptions, your preferred shares or ADSs would be treated as stock in a PFIC if we were a PFIC at any time during your holding period in your preferred shares or ADSs.
Any “excess distributions,” which would include any distributions during a taxable year that are greater than 125% of the average annual distributions received by you in respect of the preferred shares or ADSs during the three preceding taxable years or, if shorter, your holding period for the preferred shares or ADSs that preceded the taxable year in which you receive the distribution, and any gain realized on the sale or other disposition of your preferred shares or ADSs would be allocated ratably over your holding period for the preferred shares or ADSs and would generally be taxed at the highest tax rate in effect for each such year to which the gain was allocated, together with an interest charge in respect of the tax attributable to each such year. Any gain recognized would not be treated as capital gain.
If you own preferred shares or ADSs in a PFIC that are treated as marketable stock, you may make a mark-to-market election. If you make this election, you will not be subject to the PFIC rules described above. Instead, in general, you will include as ordinary income each year the excess, if any, of the fair market value of your preferred shares or ADSs at the end of the taxable year over your adjusted basis in your preferred shares or ADSs. These amounts of ordinary income will not be eligible for the favorable tax rates applicable to qualified dividend income or long-term capital gains. You will also be allowed to take an ordinary loss in respect of the excess, if any, of the adjusted basis of your preferred shares or ADSs over their fair market value at the end of the taxable year (but only to the extent of the net amount of previously included income as a result of the mark-to-market election). Your basis in the preferred shares or ADSs will be adjusted to reflect any such income or loss amounts.
In addition, notwithstanding any election you make with regard to the preferred shares or ADSs, dividends that you receive from us would not be eligible for the special tax rates applicable to qualified dividend income if we are treated as a PFIC with respect to you either in the taxable year of the distribution or the preceding taxable year, but instead would be taxable at rates applicable to ordinary income.
Information with Respect to Foreign Financial Assets
Owners of “specified foreign financial assets” with an aggregate value in excess of USD 50,000 (and in some circumstances, a higher threshold) may be required to file an information report with respect to such assets with their tax returns. “Specified foreign financial assets” include any financial accounts maintained by foreign financial institutions, as well as any of the following, but only if they are held for investment and not held in accounts maintained by financial institutions: (i) stocks and securities issued by non-United States persons (including the preferred shares and ADSs), (ii) financial instruments and contracts that have non-United States issuers or counterparties, and (iii) interests in foreign entities. U.S. holders are urged to consult their tax advisors regarding the application of this reporting requirement to their ownership of the preferred shares or ADSs.
FATCA Withholding
Under FATCA, a 30% withholding tax will be imposed on certain payments to certain non-U.S. financial institutions that fail to comply with information reporting requirements or certification requirements in respect of their direct and indirect United States shareholders and/or United States accountholders. To avoid becoming subject to the 30% withholding tax on payments to them, we and other non-U.S. financial institutions may be required to report information to the IRS regarding the holders of preferred shares or ADSs and to withhold on a portion of payments under the preferred shares or ADSs to certain holders that fail to comply with the relevant information reporting requirements (or hold preferred shares or ADSs directly or indirectly through certain non-compliant intermediaries). However, under proposed Treasury regulations, such withholding will not apply to payments made before the date that is two years after the date on which final regulations defining the term “foreign passthru payment” are enacted. The rules for the implementation of this legislation have not yet been fully finalized, so it is impossible to determine at this time what impact, if any, this legislation will have on holders of the preferred shares and ADSs.
FATCA is particularly complex and its application is uncertain at this time. The above description is based in part on regulations, the intergovernmental agreement between the United States and Colombia and official guidance, which are subject to change, and the provisions described above may be implemented in a materially different form. Holders of preferred shares or ADSs should consult their own tax advisors regarding how these rules may apply to their investment in the preferred shares or ADSs.
| F. | DIVIDENDS AND PAYING AGENTS |
Not applicable.
Not applicable.
Bancolombia files reports and other information with the SEC pursuant to the rules and regulations of the SEC that apply to foreign private issuers. You may view the Bank’s SEC filings on the SEC’s website at http://www.sec.gov.
Not applicable.
| ITEM 11 | QUANTITATIVE AND QUALITATIVE DISCLOSURES ABOUT MARKET RISK |
Introduction
The following section describes the market risks to which Bancolombia is exposed and the tools and methodology used to measure these risks as of December 31, 2019. Bancolombia faces market risk as a consequence of its lending, trading and investments businesses. Market risk represents the potential loss due to adverse changes in market prices of financial instruments as a result of movements in interest rates, foreign exchange rates, equity prices and other risk factors, such as sovereign risk.
Bancolombia’s risk management strategy, called the Integrated Risk Management Strategy, is based on principles set by international bodies and by Colombian regulations, and is guided by Bancolombia’s corporate strategy. The main objective of the Integrated Risk Management Strategy is to identify measure, coordinate, monitor, report and propose policies for market and liquidity risks of the Bank, which in turn serve to facilitate the efficient administration of Bancolombia’s assets and liabilities. Bancolombia’s board of directors and senior management have formalized the policies, procedures, strategies and rules of action for market risk administration in its “Market Risk Manual”. This manual defines the roles and responsibilities within each subdivision of the Bank and their interaction to ensure adequate market risk administration.
The Bank’s Market Risks Management Office is responsible for: (a) identifying, measuring, monitoring, analyzing and controlling the market risk inherent in the Bank’s businesses, (b) analyzing the Bank’s exposure under stress scenarios and confirming compliance with Bancolombia’s risk management policies, (c) analyzing the methodologies design by the official price vendor for valuation of the market value securities and financial instruments, (d) reporting to senior management and the board of directors any violation of Bancolombia’s risk management policies, (e) reporting to the senior management on a daily basis the levels of market risk associated with the trading instruments recorded in its treasury book (the “Treasury Book”), and (f) proposing policies to the board of directors and to senior management that ensure the maintenance of predetermined risk levels. The Bank has also implemented an approval process for new products across each of its subdivisions. This process is designed to ensure that every subdivision is prepared to incorporate the new product into their procedures, that every risk is considered before the product is incorporated and that approval is obtained from the board of directors before the new product can be sold.
The Bank’s assets include both trading and non-trading instruments. Trading instruments are recorded in the Treasury Book and include fixed income securities, foreign exchange (FX) and bond futures, and over-the-counter plain vanilla and exotic derivatives. Trading in derivatives includes forward contracts on foreign currency operations, forward contracts on fixed income securities, plain vanilla options on foreign currency, Asian options on U.S. dollar/COP, cross currency swaps and interest rate swaps. Non-trading instruments are recorded in the Bank’s banking book (the “Banking Book”), which includes primarily loans, time deposits, checking accounts and savings accounts.
The Bank uses a value at risk (“VaR”) calculation to limit its exposure to the market risk of its Treasury Book. The board of directors is responsible for establishing the maximum VaR based on its assessment of the appropriate level of risk for Bancolombia. The Risks Committee is responsible for establishing the maximum VaR by type of investment (e.g., local government debt) and by type of risk (e.g., currency risk). These limits are supervised daily by the Market Risk Management Office.
The Bank is exposed to foreign currency exchange rate risk as a result of mismatches between assets and liabilities and off-balance sheet items denominated in different currencies, either as a result of trading or in the normal course of business. Our principal foreign currency exposure is the U.S. dollar, which is managed by Treasury Division and monitored by measuring positions, VaR and daily results.
For managing the interest rate risk from banking activities, the Bank analyzes the interest rate mismatches between its interest earning assets and its interest-bearing liabilities. In addition, the foreign currency exchange rate exposures arising from the Banking Book are provided to the Treasury Division where these positions are aggregated and managed.
Trading Instruments Market Risk Measurement
The Bank currently measures the Treasury Book exposure to market risk (including over-the-counter derivatives positions) as well as the currency risk exposure of the Banking Book, which is provided to the Treasury Division, using a VaR methodology established in accordance with “Chapter XXI of the Basic Accounting Circular”, issued by the SFC.
The VaR methodology established by “Chapter XXI of the Basic Accounting Circular” is based on the model recommended by the Amendment to the Capital Accord to Incorporate Market Risks of Basel Committee of 2005, which focuses on the Treasury Book and excludes investments measure under amortized cost which are not being given as collateral and any other investment that comprises the Banking Book, such as non-trading positions. In addition, the methodology aggregates all risks by the use of correlations, through an allocation system based on defined zones and bands, affected by given sensitivity factors.
The total market risk for the Bank is calculated by the arithmetical aggregation of the VaR calculated for each subsidiary. The aggregated VaR is reflected in the Bank’s Capital Adequacy (Solvency) ratio, in accordance with Decree 2555 de 2010.
For purposes of VaR calculations, a risk exposure category is any market variable that is able to cause potential changes in the portfolio value. Taking into account a given risk exposure, the VaR model assesses the maximum loss not exceeded at a specified confidence level over a given period of time. The fluctuations in the portfolio’s VaR depend on volatility, modified duration and positions changes relating to the different instruments that are subject to market risk.
The relevant risk exposure categories for which VaR is computed by Bancolombia according to the “Chapter XXI, appendix 1 of the Basic Accounting Circular” are: (i) interest rate risks relating to local currency, foreign currency and UVR; (ii) currency risk; (iii) stock price risk; (iv) fund risk and (v) credit default swaps.
Interest Rate Risk (Treasury Book)
The interest rate risk is the probability of decrease in the market value of the position due to fluctuations in market interest rates. Bancolombia calculates the interest rate risk for positions in local currency, foreign currency and UVR separately, in accordance with Chapter XXI of the Basic Accounting Circular issued by the Financial Superintendence. The calculation of the interest rate risk begins with determining the net position in each instrument and estimating its sensitivity, which is calculated by multiplying its net present value (“NPV”) by its “modified duration” and by the interest rate’s estimated fluctuation (as defined by the Financial Superintendence of Colombia.). The interest rate’s fluctuations are established by the Financial Superintendence of Colombia according to historical market performance, as shown in the following table:
Figure 1. Interest Risk – Sensitivity by Bands and Zones
Zone | Band | Modified Duration | Interest rate fluctuations (basis points) |
| Low | High | Pesos | URV | USD |
| Zone 1 | 1 | 0 | 0.08 | 274 | 274 | 100 |
| 2 | 0.08 | 0.25 | 268 | 274 | 100 |
| 3 | 0.25 | 0.5 | 259 | 274 | 100 |
| 4 | 0.5 | 1 | 233 | 274 | 100 |
| Zone 2 | 5 | 1 | 1.9 | 222 | 250 | 90 |
| 6 | 1.9 | 2.8 | 222 | 250 | 80 |
| 7 | 2.8 | 3.6 | 211 | 220 | 75 |
| Zone 3 | 8 | 3.6 | 4.3 | 211 | 220 | 75 |
| 9 | 4.3 | 5.7 | 172 | 200 | 70 |
| 10 | 5.7 | 7.3 | 162 | 170 | 65 |
| 11 | 7.3 | 9.3 | 162 | 170 | 60 |
| 12 | 9.3 | 10.6 | 162 | 170 | 60 |
| 13 | 10.6 | 12 | 162 | 170 | 60 |
| 14 | 12 | 20 | 162 | 170 | 60 |
| 15 | 20 | - | 162 | 170 | 60 |
Once the sensitivity factor is calculated for each position, the modified duration is then used to classify each position within its corresponding band. A net sensitivity is then calculated for each band, by determining the difference between the sum of all long-positions and the sum of all short-positions. Then a net position is calculated for each zone (which consists of a series of bands) determined by the Financial Superintendence. The final step is to make adjustments within each band, across bands and within each zone, which results in a final number that is the interest rate risk VaR by currency. Each adjustment is performed following the guidelines established by the Financial Superintendence.
The Bank’s exposure to interest risk primarily arises from investments in Colombian government’s treasury bonds (TES) and other securities issued by the Colombian government.
The interest rate risk VaR increased from COP 249 billion on December 31, 2018 to COP 359 billion on December 31, 2019, due to the increase in the position in Colombian government’s treasury bonds (TES) in the liquidity portfolio. During the year 2019, the average interest rate risk VaR was COP 325 billion, the maximum value COP 409 billion, and the minimum value COP 243 billion.
Currency (Treasury and Banking Book), Equity (Treasury Book) and Fund Risk (Treasury Book)
The VaR model uses a sensitivity factor to calculate the probability of loss due to fluctuations in the price of stocks, funds and currencies in which the Bank maintains a position. As previously indicated, the methodology used in this Annual Report to measure such risk consists of computing VaR, which is derived by multiplying the position by the maximum probable variation in the price of such positions (“Δp”). The Δp is determined by the Financial Superintendence, as shown in the following table:
Figure 2. Sensitivity Factor for Currency Risks, Equity Risks and Fund Risks
| USD | 12.49% |
| Euro | 11.00% |
| Other currencies | 13.02% |
| Funds | 14.70% |
| Stock Price | 14.70% |
Currency exposure include positions in trading and banking book. The currency risk VaR increase from COP 910 billion as of December 31, 2018 to COP 1016 billion as of December 31, 2019 due mainly to an increase of 11.79% in the net U.S. dollars position in Colombia. Between December 31, 2018 and December 31, 2019, the average currency risk VaR was COP 874 billion, the maximum value COP 1,056 billion, and the minimum value COP 497 billion. Current currency risk primarly arises from the USD exposure as a result of the investments on Central America affiliates.
The equity risk VaR increased from COP 92 billion as of December 31, 2018 to COP 110 billion as of December 31, 2019 due to the surge in the brokerage firm’s trading position and the increase in the market value of the Bank’s equity positions. The equity risk exposure comes mainly from investment in Proteccion, a pension and severance fund, which represents 39% of the equity risk VaR.
Between December 31, 2018 and December 31, 2019, the average equity VaR was COP 106 billion, the maximum value COP 110 billion, and the minimum value COP 102 billion.
The fund risk, which arises from investment in mutual funds, increased from COP 197 billion as of December 31, 2018 to COP 207 billion as of December 31, 2019. Between December 31, 2018 and December 31, 2019, the average fund risk VaR was COP 204 billion, the maximum value COP 208 billion, and the minimum value COP 196 billion.
Total Market Risk VaR
The total market risk VaR is calculated as the algebraic sum of the interest rate risk, the currency risk, the stock price risk, fund risk and the credit default swaps risk which are calculated as the algebraic sum of the Parent Company and each of its subsidiaries’ exposure to these risks. Currently Bancolombia Group does not present exposure to credit default swaps risk.
The total market risk VaR, rose 17%, going from COP 1,447 billion in December 31, 2018 to COP 1,692 billion as of December 31, 2019, and due mainly to increase in the interest risk and currency risk mentioned above.
Assumptions and Limitations of VaR Models:Although VaR models represent a recognized tool for risk management, they have inherent limitations, including reliance on historical data that may not be indicative of future market conditions or trading patterns. Accordingly, VaR models should not be viewed as predictive of future results. The Bank may incur in losses that could be materially in excess of the amounts indicated by the models on a particular trading day or over a period of time, and there have been instances when results have fallen outside the values generated by the Bank’s VaR models. A VaR model does not calculate the greatest possible loss. The results of these models and analysis thereof are subject to the reasonable judgment of the Bank’s risk management personnel.
The chart below provides information about Bancolombia’s consolidated VaR for trading instruments at the end of December 2018 and December 2019.
| | As of December 31, |
| | 2019 | 2018 |
| | In millions of COP |
| Interest Rate Risk VaR | 359,654 | 249,070 |
| Currency Risk VaR | 1,015,874 | 909,648 |
| Equity Risk VaR | 110,386 | 91,847 |
| Fund Risk VaR | 206,602 | 196,819 |
| Total VaR | 1,692,516 | 1,447,384 |
| Includes Grupo Agromercantil’s market risk exposure at a 100% |
Between December 31, 2018 and December 31, 2019, the average Total VaR was COP 1,509 billion, the maximum value COP 1,712 billion, and the minimum value COP 1,092 billion.
Non-Trading Instruments Market Risk Measurement
The Banking Book’s relevant risk exposure is interest rate risk, which is the probability of unexpected changes in net interest income as a result of a change in market interest rates. Changes in interest rates affect Bancolombia’s earnings as a result of timing differences on the repricing of the assets and liabilities. The Bank manages the interest rate risk arising from banking activities in non-trading instruments by analyzing the interest rate mismatches between its interest earning assets and its interest-bearing liabilities. The foreign currency exchange rate exposures arising from the Banking Book are provided to the Treasury Division where these positions are aggregated and managed.
Interest Risk Exposure (Banking Book)
The Bank has performed a sensitivity analysis of market risk sensitive instruments estimating the impact on the net interest income of each position in the Banking Book, using a repricing model and assuming positive parallel shifts of 50 basis points (bps).
The table 1 provides information about Bancolombia’s interest rate sensitivity for the statement of financial position items comprising the Banking Book:
Table 1. Sensitivity to Interest Rate Risk of the Banking Book
The chart below provides information about Bancolombia’s interest rate risk sensitivity in local currency (COP) at December 31, 2019 and 2018:
| Interest Rate Risk |
| | As of December 31, |
| | 2019 | 2018 |
| | In millions of COP |
| Assets sensitivity 50 bps | 377,918 | 361,427 |
| Liabilities sensitivity 50 bps | 200,650 | 185,477 |
| Net interest income sensitivity 50 bps | 177,268 | 175,950 |
The chart below provides information about Bancolombia’s interest rate risk sensitivity in foreign currency (USD) at December 31, 2019 and 2018:
| Interest Rate Risk |
| | As of December 31, |
| | 2019 | 2018 |
| | In millions of US dollars |
| Assets sensitivity 50 bps | USD 35 | USD 39 |
| Liabilities sensitivity 50 bps | USD 34 | USD 36 |
| Net interest income sensitivity 50 bps | USD 1 | USD 3 |
A positive net sensitivity denotes a higher sensitivity of assets than of liabilities and implies that a rise in interest rates will positively affect the Bank´s net interest income. A negative sensitivity denotes a higher sensitivity of liabilities than of assets and implies that a rise in interest rates will negatively affect the Bank´s net interest income. In the event of a decrease in interest rates, the impacts on net interest income would be opposite to those described above.
Total Exposure
As of December 31, 2019, the net interest income sensitivity in local currency for the banking book instruments, entered for other than trading purposes with positive parallel shifts of 50 basis points was COP 177,269. The change in the net interest income sensitivity between 2019 and 2018 is due to the increase in the sensitivity of floating rate loans due to the surge in IBR indexed loans.
On the other hand, the net interest income sensitivity in foreign currency, assuming the same parallel shift of 50 basis points, was USD 1 at December 31, 2019, compared with USD 3 at December 31, 2018. The decrease in net interest income sensitivity due to interest rate risk between 2019 and 2018 occurred due to the reduction in the sensitivity of floating rate loans due the decrease in Libor indexed loans.
Assumptions and Limitations
Net interest income sensitivity analysis is based on the repricing model and is based on the following key assumptions: (a) does not consider prepayments, new operations, defaults, etc., (b) the fixed rate instruments sensitivity, includes the amounts with maturity lower than one year and assumes these will be disbursed at market interest rates and (c) changes in interest rate occur immediately and parallel in the yield curves from assets and liabilities for different maturities.
Structural Equity Risk Exposure (Banking Book)
Bancolombia’s investment banking affiliate, in its role of financial corporation, has, directly and through its affiliated companies, structural equity investments. These positions are maintained mostly in Industrial and financial sectors. The market value of those investments decreased by 76% during the year, going from COP 163 billion as of December 31, 2018 to COP 38 billion as of December 31, 2019 as a result of the sale of Empresa de Energía del Pacífico S.A (EPSA) shares.
The structural equity positions are exposed to market risk. Sensitivity calculations are made for those positions:
| | As of December 31, |
| | 2019 | 2018 |
| | In millions of COP |
| Market Value | 38,428 | 163,136 |
| Delta | 14.7% | 14.7% |
| Sensitivity | 5,649 | 23,981 |
A negative impact of 14.7%, applied to the market value, produces a decrease of COP 5 billion in the structural equity investments market value, from COP 38 billion to COP 32 billion.
| ITEM12 | DESCRIPTION OF SECURITIES OTHER THAN EQUITY SECURITIES |
| D. | American Depositary Shares |
| D.3. | Fees and charges applicable to holders of American Depositary Receipts |
The depositary collects its fees for delivery and surrender of ADSs directly from investors depositing shares or surrendering ADSs for the purpose of withdrawal or from intermediaries acting for them. The depositary may generally refuse to provide fee-attracting services until its fees for those services are paid.
The following are the fees charged by the depositary:
| Persons depositing or withdrawing shares must pay: | For: |
| USD 5.00 per 100 ADSs (or portion of 100 ADSs) | • Issuance of ADSs, including issuances resulting from a distribution of shares or rights or other property. • Cancellation of ADSs for the purpose of withdrawal, including if the deposit agreement terminates. |
| Registration or transfer fees | • Transfer and registration of shares on the Bank’s share register to or from the name of the depositary or its agent when you deposit or withdraw shares. |
| Expenses of the depositary | • Cable, telex and facsimile transmissions (when expressly provided in the deposit agreement). • Converting foreign currency to U.S. dollars. |
| Taxes and other Governmental charges the depositary or the custodian has to pay on any ADSs or share underlying a ADSs, for example, stock transfer taxes, stamp duty or withholding taxes. | • As necessary. |
| Any charges incurred by the depositary or its agents for servicing the deposited securities. | • As necessary. |
| D.4.i. | FEES INCURRED IN PAST ANNUAL PERIOD |
From January 1, 2019 to December 31, 2019, the depositary reimbursed Bancolombia USD 350,000 for expenses related to the administration and maintenance of the ADR facility, investor relations activities, annual listing fees and any other ADR program-related expenses incurred by Bancolombia directly associated with the Bank’s preferred share ADR program. In addition, Fiduciaria Bancolombia, a subsidiary of the Bank, received COP 221 million from The Bank of New York Mellon during the same period in connection with its role as local custodian of the depositary bank.
| D.4.ii. | FEES TO BE PAID IN THE FUTURE |
The Bank of New York Mellon, as depositary, has agreed to reimburse the Bank for expenses incurred that are related to establishment and maintenance expenses of the ADS program. The depositary has agreed to reimburse the Company for its continuing annual stock exchange listing fees. The depositary has also agreed to pay the standard out-of-pocket maintenance costs for the ADRs, which consist of the expenses of postage and envelopes for mailing annual and interim financial reports, printing and distributing dividend checks, electronic filing of U.S. federal tax information, mailing required tax forms, stationery, postage, facsimile, and telephone calls. It has also agreed to reimburse the Company annually for certain investor relationship programs or special investor relations promotional activities. In certain instances, the depositary has agreed to provide additional payments to the Company based on any applicable performance indicators relating to the ADR facility. There are limits on the amount of expenses for which the depositary will reimburse the Company, but the amount of reimbursement available to the Company is not necessarily tied to the amount of fees the depositary collects from investors.
The depositary collects its fees for delivery and surrender of ADSs directly from investors depositing shares or surrendering ADSs for the purpose of withdrawal or from intermediaries acting for them. The depositary collects fees for making distributions to investors by deducting those fees from the amounts distributed or by selling a portion of distributable property to pay the fees. The depositary may collect its annual fee for depositary services by deduction from cash distributions or by directly billing investors or by charging the book-entry system accounts of participants acting for them. The depositary may generally refuse to provide fee-attracting services until its fees for those services are paid.
PART II
| ITEM13 | DEFAULTS, DIVIDEND ARREARAGES AND DELINQUENCIES |
There has not been any default, arrearage or delinquency neither in the payment of principal, interest, a sinking or purchase fund installment, nor in any payment relating to indebtedness or dividends by the Bank or any of its subsidiaries.
| ITEM14 | MATERIAL MODIFICATIONS TO THE RIGHTS OF SECURITY HOLDERS AND USE OF PROCEEDS |
There has not been any modification to the rights of security holders and use of proceeds.
| ITEM15 | CONTROLS AND PROCEDURES |
The Bank carried out an evaluation under the supervision and with the participation of the Bank’s management, including the Chief Executive Officer and Chief Financial Officer, of the effectiveness of the Bank’s disclosure controls and procedures. As a result, the Chief Executive Officer and Chief Financial Officer have concluded that, as of the end of the period covered by this report, the disclosure controls and procedures were effective to provide reasonable assurance that information required to be disclosed in the reports the Bank files and submits under the Exchange Act is recorded, processed, summarized and reported within the time periods specified in the rules and regulations of the SEC and to provide reasonable assurance that such information is accumulated and communicated to management, including the Chief Executive Officer and Chief Financial Officer, to allow timely decisions regarding disclosure.
There are inherent limitations to the effectiveness of any system of disclosure controls and procedures, including the possibility of human error and the circumvention or overriding of the controls and procedures. Accordingly, even effective disclosure controls and procedures can only provide reasonable assurance of achieving their control objectives.
Management's Report on Internal Control Over Financial Reporting
Management is responsible for establishing and maintaining adequate internal control over financial reporting. The Bank's internal control over financial reporting is a process designed to provide reasonable assurance regarding the reliability of financial reporting and the preparation of consolidated financial statements for external purposes in accordance with IFRS.
The Bank's internal control over financial reporting includes those policies and procedures that:
| ● | Pertain to the maintenance of records that in reasonable detail accurately and fairly reflect the transactions and dispositions of the assets of the Bank; |
| ● | Provide reasonable assurance that transactions are recorded as necessary to permit preparation of consolidated financial statements in accordance with generally accepted accounting principles, and that receipts and expenditures of the Bank are being made only in accordance with authorizations of the Bank's management and directors; and |
| ● | Provide reasonable assurance regarding prevention or timely detection of unauthorized acquisition, use or disposition of the Bank's assets that could have a material effect on the financial statements. |
Because of its inherent limitations, internal control over financial reporting may not prevent or detect misstatements. Projections of any evaluation of effectiveness to future periods are subject to the risk that controls may become inadequate because of changes in conditions, or that the degree of compliance with the policies or procedures may deteriorate.
Management assessed the effectiveness of internal control over financial reporting as of December 31, 2019 based on criteria established in the Internal Control-Integrated Framework issued by the Committee of Sponsoring Organizations of the Treadway Commission (2013 Framework version). On this assessment, management concluded that the Bank's internal control over financial reporting was effective as of December 31, 2019.
The effectiveness of the Bank's internal control over financial reporting as of December 31, 2019 has been audited by PricewaterhouseCoopers LTDA, an independent registered public accounting firm, which report is included on page F-4 of this annual report.
In addition, there were no changes in Bank´s internal control over financial reporting occurred during the period covered by this annual report that has materially affected or is reasonable likely to materially affect the bank´s internal control over financial reporting.
| A. | AUDIT COMMITTEE FINANCIAL EXPERT |
The board of directors of Bancolombia appointed Hernando José Gomez Restrepo as the audit committee financial expert in accordance with SEC rules and regulations.
The Bank’s audit committee financial expert, along with the other members of the Bank’s Audit Committee, is considered to be independent according to applicable NYSE criteria.
Mr. Gomez has served as the Bank’s audit committee financial expert since April 2016. There is no business relationship between him and the Bank, except for standard personal banking services. Further, there is no fee arrangement between Mr. Gomez and the Bank, except in connection with his capacity as a member of the Bank’s board of directors and as a member of the Audit Committee. Mr. Gomez is considered an independent director under Colombian law and the Bank’s Corporate Governance Code, as well as under NYSE’s director independence standards. The Audit Committee and the financial expert also have an independent advisor, who provides advice on financial reporting and auditing matters. For more information regarding the Bank’s audit committee, see Item 6. “Directors, Senior Management and Employees— C. Board Practices—Audit Committee”.
| B. | CORPORATE GOVERNANCE AND CODE OF ETHICS |
Bancolombia has adopted a Code of Ethics and a Corporate Governance Code, both of which apply to all employees, including the Bank’s Chief Executive Officer, Chief Financial Officer and Chief Accounting Officer, as well as to the directors of the Bank.
English translations of the Code of Ethics and the Corporate Governance Code are posted at Bancolombia’s website at www.grupobancolombia.com. The Spanish versions of these codes will prevail for all legal purposes.
The Bank also has a phone line called the “ethics line” (“línea ética”) which is available for anonymous reporting of any evidence of improper conduct.
Under the NYSE’s Corporate Governance Standards, Bancolombia, as a listed foreign private issuer, must disclose any significant ways in which its corporate governance practices differ from those followed by U.S. companies under NYSE listing standards. See Item 16. “G Corporate Governance”.
| C. | PRINCIPAL ACCOUNTANT FEES AND SERVICES |
Audit Fees
The aggregate fees billed under the caption audit fees for professional services rendered to Bancolombia for the audit of its financial statements and for services that are normally provided to Bancolombia, in connection with statutory or regulatory filings or engagements totaled COP 16,060 and COP 10,887 million audited by PricewaterhouseCoopers for the years 2019 and 2018, respectively.
Additionally, the amount of fees not billed as of December 31, 2019 and 2018 for the audit of fiscal by PricewaterhouseCoopers is approximately to COP 2,700 and COP 4,900, respectively.
Tax Fees
For the years ended December 31, 2019 and 2018, Bancolombia did not contract professional services related with tax compliance, tax advice or tax planning rendered by PricewaterhouseCoopers.
All Other Fees
In 2019 and 2018, Bancolombia paid no other fees to PricewaterhouseCoopers.
Pre-Approval Policies and Procedures
The Bank’s audit committee´s charters and the Bank’s good Governance Code includes the following pre-approval policies and procedures:
In those events in which additional services are required to be provided by the external auditors, such services must be previously approved by the audit committee. Whenever this approval is not obtained at a meeting held by the audit committee, the approval will be obtained through the Legal Vice Presidency, who will be responsible for soliciting the consent from each of the audit committee members. The approval will be obtained with the favorable vote of the majority of its members.
Every request of approval of additional services must be adequately supported, including complete and effective information regarding the characteristics of the service that will be provided by the external auditors. Pursuant to the Bank’s Good Governance Code, the external auditor cannot provide additional services to Bancolombia and its subsidiaries that are not directly or indirectly related to the audit.
During 2019, there were no services approved by the audit committee pursuant to paragraph (c) (7) (i) (C) of Rule 2-01 of Regulation S-X.
| D. | EXEMPTIONS FROM THE LISTING STANDARDS FOR AUDIT COMMITTEES |
There are no exceptions from the listing standards for audit committees.
| E. | PURCHASES OF EQUITY SECURITIES BY THE ISSUER AND AFFILIATED PURCHASERS |
There have not been any purchases by Bancolombia or any affiliated purchaser (as defined in 17CFR240.10b-18(a) (3)) of shares or any other units of any class of equity securities issued by Bancolombia.
Colombian law prohibits the repurchase of shares issued by entities supervised by the SFC. Therefore, neither Bancolombia nor any of its Subsidiaries that are under supervision of such Superintendency may repurchase securities issued by them.
| F. | CHANGE IN REGISTRANT’S CERTIFYING ACCOUNTANT |
Not applicable.
Bancolombia, as a listed company that qualifies as a foreign private issuer under the NYSE listing standards in accordance with the NYSE corporate governance rules, is permitted to follow home-country practice in some circumstances in lieu of the provisions of the corporate governance rules contained in Section 303A of the NYSE Listed Company Manual that are applicable to U.S. companies. The Bank follows corporate governance practices applicable to Colombian companies and those described in the Bank’s Corporate Governance Code, which in turn follows Colombian corporate governance rules. An English translation of the Corporate Governance Code is available at Bancolombia’s website at www.grupobancolombia.com.co. The Spanish prevails for all legal purposes.
In Colombia, a series of laws and regulations set forth corporate governance requirements. External Circular 028 of 2014, issued by the SFC, contains the corporate governance standards to be followed by companies issuing securities that may be purchased by Colombian pension funds, and determines that entities under supervision of the SFC, when making investment decisions, must take into account the recommendations established by the “Country Code” (“Código País”) and the corporate governance standards followed by the entities who are beneficiaries of the investment.
Additionally, Law 964 of 2005 established mandatory corporate governance requirements for all issuers whose securities are publicly traded in the Colombian market, and Decree 2555 of 2010 regulates the information disclosure requirements for the Colombian securities market SIMEV (“Sistema Integral de Información del Mercado de Valores”). Bancolombia’s corporate governance standards comply with these legal requirements and Bancolombia has implemented additional corporate governance measures pursuant to regional recommendations including the OECD White Paper on Corporate Governance for Latin America and the Andean Development Corporation’s (CAF) Corporate Governance Code.
The following is a summary of the significant differences between the corporate governance practices followed by Bancolombia and those applicable to domestic issuers under the NYSE listing standards:
| ● | Independence of Directors. Under NYSE corporate governance rules, a majority of a U.S. company’s board of directors must be composed of independent directors. Regarding Colombian legislation, Law 964 of 2005 requires that at least 25% of the members of the Bank’s board of directors are independent directors, and Decree 3923 of 2006 regulates their election. Additionally, Colombian law requires that all directors exercise independent judgment under all circumstances. Bancolombia’s Corporate Governance Code includes a provision stating that directors shall exercise independent judgment and requires that Bancolombia’s management recommend to its shareholders lists of director nominees of which at least 25% are independent directors. As of December 31, 2019, the Bank’s board of directors included a majority of independent members (5 members of 7). For the independence test applicable to directors of Bancolombia, see Item 10. “Additional Information. – B. Memorandum and Articles of Association – Board of Directors”. |
| ● | Non-Executive Director Meetings. Pursuant to the NYSE listing standards, non-executive directors of U.S. listed companies must meet on a regular basis without management present. There is no prohibition under Colombian regulations for officers to be members of the board of directors; however, it is customary for Colombian companies to maintain separation between the directors and management. Bancolombia’s board of directors does not include any management members; however, the CEO attends the monthly meetings of the Bank’s board of directors, and members of senior management may attend the meetings of the board of directors and committees to guarantee an adequate flow of information between employees, management and directors; in both cases, the CEO and members of senior management are not allowed to vote. In accordance with Law 964 of 2005 and the Bank’s by-laws, no executive officer can be elected as chairman of the Bank’s board of directors. |
| ● | Committees of the Board of Directors. Under NYSE listing standards, all U.S. companies listed on the NYSE must have an audit committee, a compensation committee, and a nominating/corporate governance committee and all members of such committees must be independent. In each case, the independence of directors must be established pursuant to highly detailed rules enacted by the NYSE and, in the case of the audit committee, the NYSE and the SEC. The Bank’s board of directors has a Designation, Compensation and Development Committee, a Corporate Governance Committee, a Risk Committee and an Audit Committee, each of which is composed exclusively of directors. For a description of the Designation, Compensation and Development Committee, Corporate Governance Committee, Audit Committee and Risk Committee, see Item 6. “Directors, Senior Management and Employees – C. Board Practices”. |
| ● | Stockholders’ Approval of Dividends. While NYSE corporate governance standards do not require listed companies to have stockholders approve or declare dividends, in accordance with the Colombian Code of Commerce, all dividends must be approved by Bancolombia’s stockholders. |
| H. | MINE SAFETY DISCLOSURES |
Not applicable.
PART III
| ITEM17 | FINANCIAL STATEMENTS |
See Item 18.
| ITEM18 | FINANCIAL STATEMENTS |
Reference is made to pages F-1 through F-200.
The following exhibits are filed as part of this Annual Report.
| 1.1 | English translation of the corporate by-laws (estatutos sociales) of the registrant, as amended on October 30, 2015.(1) |
| 2.1 | Deposit Agreement entered into between Bancolombia and The Bank of New York, as amended and restated on January 14, 2008.(2) |
| 2.2 | Instruments defining the rights of the holders of long-term debt issued by Bancolombia S.A. and its subsidiaries. |
| | The Bank agrees to furnish to the SEC upon request, copies of the instruments, including indentures, defining the rights of the holders of the Bank’s long-term debt and of the Bank’s subsidiaries’ long-term debt. |
| 8.1 | List of Subsidiaries. |
| 12.1 | CEO Certification pursuant to Section 302 of the Sarbanes-Oxley Act of 2002, dated April 27, 2020. |
| 12.2 | CFO Certification pursuant to Section 302 of the Sarbanes-Oxley Act of 2002, dated April 27, 2020. |
| 13.1 | CEO Certification pursuant to Section 906 of the Sarbanes-Oxley Act of 2002, dated April 27, 2020. |
| 13.2 | CFO Certification pursuant to Section 906 of the Sarbanes-Oxley Act of 2002, dated April 27, 2020. |
| 15.1 | Consent of Deloitte & Touche Ltda. |
| 15.2 | Consent of PricewaterhouseCoopers Ltda. |
| 101.INS | XBRL Instance Document |
| 101.SCH | XBRL Taxonomy Extension Schema Document |
| 101.CAL | XBRL Taxonomy Extension Calculation Linkbase Document |
| 101.DEF | XBRL Taxonomy Extension Definition Linkbase Document |
| 101.LAB | XBRL Taxonomy Extension Label Linkbase Document |
| 101.PRE | XBRL Taxonomy Extension Presentation Linkbase Document |
| (1) | Incorporated by reference to the Bank’s annual report on Form 20-F (File No. 001 – 32535) filed on April 22, 2016. |
| (2) | Incorporated by reference to the Registration Statement in Form F-6, filed by Bancolombia on January 14, 2008 |
The registrant hereby certifies that it meets all of the requirements for filing on Form 20-F and that it has duly caused and authorized the undersigned to sign this annual report on its behalf.
BANCOLOMBIA S.A.
/s/ JOSE HUMBERTO ACOSTA MARTIN
Name: Jose Humberto Acosta Martin
Title: Chief Financial Officer
Date: April 27, 2020

CONSOLIDATED FINANCIAL STATEMENTS
2019, 2018 and 2017

Report of Independent Registered Public Accounting Firm
To the Board of Directors and Stockholders of Bancolombia S. A.
Opinions on the Financial Statements and Internal Control over Financial Reporting
We have audited the accompanying consolidated statement of financial position Bancolombia S. A. and its subsidiaries (the “Bank”) as of December 31, 2019 and 2018, and the related consolidated statements of income, other comprehensive income, changes in equity and cash flow for each of the two years in the period ended December 31, 2019, including the related notes (collectively referred to as the “consolidated financial statements”). We also have audited the Company's internal control over financial reporting as of December 31, 2019, based on criteria established in Internal Control - Integrated Framework (2013) issued by the Committee of Sponsoring Organizations of the Treadway Commission (COSO).
In our opinion, the consolidated financial statements referred to above present fairly, in all material respects, the financial position of the Bank as of December 31, 2019 and 2018, and the results of its operations and its cash flows for each of the two years in the period ended December 31, 2019 in conformity with International Financial Reporting Standards as issued by the International Accounting Standards Board. Also in our opinion, the Bank maintained, in all material respects, effective internal control over financial reporting as of December 31, 2019, based on criteria established in Internal Control - Integrated Framework (2013) issued by the COSO.
Basis for Opinions
The Company's management is responsible for these consolidated financial statements, for maintaining effective internal control over financial reporting, and for its assessment of the effectiveness of internal control over financial reporting, included in Management’s Report on Internal Control Over Financial Reporting appearing under Item 15. Our responsibility is to express opinions on the Company’s consolidated financial statements and on the Company's internal control over financial reporting based on our audits. We are a public accounting firm registered with the Public Company Accounting Oversight Board (United States) (PCAOB) and are required to be independent with respect to the Bank in accordance with the U.S. federal securities laws and the applicable rules and regulations of the Securities and Exchange Commission and the PCAOB.
We conducted our audits in accordance with the standards of the PCAOB. Those standards require that we plan and perform the audits to obtain reasonable assurance about whether the consolidated financial statements are free of material misstatement, whether due to error or fraud, and whether effective internal control over financial reporting was maintained in all material respects.
Our audits of the consolidated financial statements included performing procedures to assess the risks of material misstatement of the consolidated financial statements, whether due to error or fraud, and performing procedures that respond to those risks. Such procedures included examining, on a test basis, evidence regarding the amounts and disclosures in the consolidated financial statements. Our audits also included evaluating the accounting principles used and significant estimates made by management, as well as evaluating the overall presentation of the consolidated financial statements. Our audit of internal control over financial reporting included obtaining an understanding of internal control over financial reporting, assessing the risk that a material weakness exists, and testing and evaluating the design and operating effectiveness of internal control based on the assessed risk. Our audits also included performing such other procedures as we considered necessary in the circumstances. We believe that our audits provide a reasonable basis for our opinions.
PricewaterhouseCoopers Ltda., Edificio Forum, Calle 7 Sur No. 42-70, Torre 2, Piso 11, Medellín, Colombia, |
| Tel: (57-4) 325 4320, Fax: (57-4) 325 4322, www.pwc.com/co |
Report of Independent Registered Public Accounting Firm
To the Board of Directors and Stockholders of Bancolombia S. A.
Definition and Limitations of Internal Control over Financial Reporting
A company’s internal control over financial reporting is a process designed to provide reasonable assurance regarding the reliability of financial reporting and the preparation of financial statements for external purposes in accordance with generally accepted accounting principles. A company’s internal control over financial reporting includes those policies and procedures that (i) pertain to the maintenance of records that, in reasonable detail, accurately and fairly reflect the transactions and dispositions of the assets of the company; (ii) provide reasonable assurance that transactions are recorded as necessary to permit preparation of financial statements in accordance with generally accepted accounting principles, and that receipts and expenditures of the company are being made only in accordance with authorizations of management and directors of the company; and (iii) provide reasonable assurance regarding prevention or timely detection of unauthorized acquisition, use, or disposition of the company’s assets that could have a material effect on the financial statements.
Because of its inherent limitations, internal control over financial reporting may not prevent or detect misstatements. Also, projections of any evaluation of effectiveness to future periods are subject to the risk that controls may become inadequate because of changes in conditions, or that the degree of compliance with the policies or procedures may deteriorate.
Critical Audit Matters
The critical audit matters communicated below are matters arising from the current period audit of the consolidated financial statements that were communicated or required to be communicated to the audit committee and that (i) relate to accounts or disclosures that are material to the consolidated financial statements and (ii) involved our especially challenging, subjective, or complex judgments. The communication of critical audit matters does not alter in any way our opinion on the consolidated financial statements, taken as a whole, and we are not, by communicating the critical audit matters below, providing separate opinions on the critical audit matters or on the accounts or disclosures to which they relate.
Allowance for loans, advances and lease losses
As described in Notes 2 (section D.7.4.5 and E.1), and 6 to the consolidated financial statements, management assesses the adequacy of the allowance for loan losses based on evaluations of the loan portfolio utilizing objective and subjective criteria. As of December 31, 2019, the allowance for loan losses was COP$10,929,395 million on total loans of COP$182,282,743 million. As disclosed by management, expected credit losses are calculated using individual and collective models and methodologies based on assumptions and judgement considering historical credit data, current borrower situation and reasonable and supportable forecasts of future economic conditions. Collective models include parameters of probability of default at 12 months, probability of default throughout the lifetime of the obligation, loss given default, and exposure at default with the inclusion of the forward-looking basis that include assumptions of future macroeconomic conditions in plausible future scenarios. In addition, for loans individually assessed in stage 3, the Bank will evaluate defaulted significant loans, analyzing the debt profile of each debtor, the fair value of guarantees granted, information on the credit behavior and the future cash flows expected from the client.
The principal considerations for our determination that performing procedures relating to the Bank’s allowance for loans, advances and lease losses is a critical audit matter are, (i) there was significant judgment used by management in determining the expected credit losses, in particular the assumptions used in determining: probability of default 12 months, probability of default throughout the lifetime of the obligation, loss given default, exposure at default with the inclusion of the forward-looking basis that includeassumptions of future macroeconomic conditions in plausible future scenarios and for loans individually assessed in Stage 3 analysis of the debt profile of each debtor, the fair value of guarantees granted, information on the credit behavior and the future cash flows expected from the client, which in turn led to a high degree of auditor judgment, subjectivity and effort in performing procedures and in evaluating audit evidence obtained relating to these assumptions;and(ii) the audit effort involved the use of professionals with specialized skill and knowledge to assist in performing procedures and evaluating the audit evidence obtained.
PricewaterhouseCoopers Ltda., Edificio Forum, Calle 7 Sur No. 42-70, Torre 2, Piso 11, Medellín, Colombia, |
| Tel: (57-4) 325 4320, Fax: (57-4) 325 4322, www.pwc.com/co |
Report of Independent Registered Public Accounting Firm
To the Board of Directors and Stockholders of Bancolombia S. A.
Addressing the matter involved performing procedures and evaluating audit evidence in connection with forming our overall opinion on the consolidated financial statements. These procedures included testing the effectiveness of controls relating to the Bank’s allowance for loans, advances and leasing losses estimation process, which included controls over the data, models and assumptions used in the estimation process. These procedures also included, among others: testing management’s process for estimating the allowance for loan, advances and lease losses by (i) evaluating the appropriateness of the models utilized for the estimation of the expected loss parameters and the reasonableness of the significant assumptions, such as default 12 months and lifetime, loss given default and exposure at default with the inclusion of the forward-looking basis that include assumptions of future macroeconomic conditions in plausible future scenarios; (ii) testing the completeness and accuracy of the data used in the estimate and the mathematical accuracy of the impairment calculation for the credit portfolios; and (iii) evaluating individual credit files to determine the reasonableness of management’s estimation of future cash flows expected from de client and estimation of fair value of guarantees granted estimated by management in the impairment for the credit portfolios. The procedures included the use of professionals with specialized skill and knowledge to assist in evaluating the appropriateness of the models utilized by management, methodologies and the reasonableness of the assumptions used in the statistical credit loss estimates.
Goodwill Impairment Assessment
As described in Notes 2 (sections D.13 and E.2) and 9.2 to the consolidated financial statements, the Bank’s consolidated goodwill balance was COP$6,694,354 as of December 31, 2019. The Bank tests goodwill recognized upon business combinations for impairment at least annually or more frequently if events or changes in circumstances indicate that the carrying value of the cash generating units may not be recoverable. An impairment loss is recognized for the amount by which the carrying amount of the cash generating unit exceeds its recoverable amount. Recoverable amount is determined by management by reference to market value, if available, by pricing models, or with the assistance of a valuation specialist. Determination of recoverable amount requires management to make assumptions and use estimates to forecast cash flow for periods that are beyond the normal requirements of management reporting; the assessment of the appropriate discount rate and growth rate, estimation of the recoverable amount of cash generation units and the valuation of the separable assets of each business whose goodwill is being reviewed.
The principal considerations for our determination that performing procedures relating to the goodwill impairment assessment of all reporting units is a critical audit matter are there was significant judgment by management when developing the recoverable amount measurement of the cash generating units. This in turn led to a high degree of auditor judgment, subjectivity, and effort in performing procedures to evaluate management’s cash flow projections and significant assumptions, including discount rate and growth rate. In addition, the audit effort involved the use of professionals with specialized skill and knowledge to assist in performing these procedures and evaluating the audit evidence obtained.
Addressing the matter involved performing procedures and evaluating audit evidence in connection with forming our overall opinion on the financial statements. These procedures included testing the effectiveness of controls relating to management’s goodwill impairment assessment, including controls over the valuation of the Bank’s cash generating units. These procedures also included, among others, testing management’s process for developing the recoverable amount estimate; evaluating the appropriateness of the discounted cash flow model; testing the completeness, accuracy and relevance of underlying data used in the model; and evaluating the assumptions used by management were reasonable considering: (i) the current and past performance of the cash generating unit, (ii) the consistency with external market and industry data, and (iii) whether these assumptions were consistent with evidence obtained in other areas of the audit. Professionals with specialized skill and knowledge were used to assist in the evaluation of the Bank’s discounted cash flow model and certain significant assumptions, including the discount rate and growth rate.
/s/PricewaterhouseCoopers Ltda.
Medellín, Colombia
April 27, 2020
We have served as the Company’s auditor since 2018
PricewaterhouseCoopers Ltda., Edificio Forum, Calle 7 Sur No. 42-70, Torre 2, Piso 11, Medellín, Colombia, |
| Tel: (57-4) 325 4320, Fax: (57-4) 325 4322, www.pwc.com/co |
 | Deloitte & Touche Ltda. Calle 16 sur No. 43A – 49 Piso 9 - 10 Nit. 860.005.813-4 Medellín Colombia Tel: +57 (4) 313 8899 Fax: +57 (4) 313 9343 www.deloitte.com/co |
REPORT OF INDEPENDENT REGISTERED PUBLIC ACCOUNTING FIRM
To the Shareholders and the Board of Directors of Bancolombia S.A.
Opinion on the Financial Statements
We have audited the accompanying consolidated statements of income, comprehensive income, changes in equity, and cash flow of BANCOLOMBIA S.A. and subsidiaries (the “Company”) for the year in the period ended December 31, 2017 and the related notes (collectively referred as to the “financial statements”). In our opinion, the financial statements present fairly, in all material respects, the results of its operations and its cash flows for the year in the period ended December 31, 2017 in conformity with the International Financial Reporting Standards, as issued by the International Accounting Standards Board (“IFRS”).
Basis for Opinion
These financial statements are the responsibility of the Company’s Management. Our responsibility is to express an opinion on Company’s financial statements based on our audits. We are a public accounting firm registered with the PCAOB and are required to be independent with respect to the Company in accordance with the U.S. federal securities laws and the applicable rules and regulations of the Securities and Exchange Commission and the PCAOB.
We conducted our audits in accordance with the standards of the PCAOB. Those standards require that we plan and perform the audit to obtain reasonable assurance about whether the financial statements are free of material misstatement, whether due to error or fraud. Our audits included performing procedures to assess the risk of material misstatement of the financial statements, whether due to error or fraud, and performing procedures that respond to those risks. Such procedures included examining, on test basis, evidence regarding the amounts and disclosures in the financial statements. Our audits also included evaluating the accounting principles used and significant estimates made by management, as well as evaluating the overall presentation of the financial statements. We believe that our audits provide a reasonable basis for our opinion.
/s/ Deloitte & Touche Ltda.
Medellin, Colombia
April 29, 2018
We began serving as the Company's auditor in 2016. In 2018 we became the predecessor auditor.
CONSOLIDATED STATEMENT OF FINANCIAL POSITION
BANCOLOMBIA S.A. AND ITS SUBSIDIARIES
As of December 31, 2019 and 2018
(Stated in millions of Colombian pesos)
| | Note | December 31, 2019 | December 31, 2018 |
| ASSETS | | | |
| Cash and cash equivalents | 4 | 23,738,042 | 18,730,810 |
| Financial assets investments | 5.1 | 16,822,754 | 17,361,475 |
| Derivative financial instruments | 5.2 | 1,902,955 | 1,843,708 |
| Financial assets investments and derivative financial instruments | | 18,725,709 | 19,205,183 |
| Loans and advances to customers and financial institutions | | 182,282,743 | 173,819,116 |
| Allowance for loans, advances and lease losses | | (10,929,395) | (10,235,831) |
| Loans and advances to customers and financial institutions, net | 6 | 171,353,348 | 163,583,285 |
| Assets held for sale and inventories, net | 13 | 518,749 | 636,028 |
| Investment in associates and joint ventures | 8 | 2,367,757 | 2,149,579 |
| Investment properties | 11 | 1,992,964 | 1,732,873 |
| Premises and equipment, net | 10 | 3,827,865 | 3,368,647 |
| Right of use assets, lease | 7.2 | 1,692,116 | - |
| Goodwill and intangible assets, net | 9 | 7,233,312 | 7,201,855 |
| Deferred tax, net | 12.3.3 | 401,002 | 271,177 |
| Other assets, net | 14 | 4,237,249 | 3,197,045 |
| TOTAL ASSETS | | 236,088,113 | 220,076,482 |
| LIABILITIES AND EQUITY | | | |
| LIABILITIES | | | |
| Deposits by customers | 15 | 157,205,312 | 142,128,471 |
| Interbank deposits | 16 | 1,363,679 | 1,374,222 |
| Repurchase agreements and other similar secured borrowing | 16 | 1,313,737 | 2,315,555 |
| Liabilities relating to assets held for sale | 13 | - | 163,596 |
| Derivative financial instruments | 5.2 | 1,860,812 | 1,295,070 |
| Borrowings from other financial institutions | 17 | 13,959,343 | 16,337,964 |
| Debt instruments in issue | 18 | 19,921,515 | 20,287,233 |
| Lease liabilities | 7.2 | 1,831,585 | - |
| Preferred shares | | 584,204 | 583,997 |
| Current tax | | 195,757 | 166,472 |
| Deferred tax, net | 12.3.3 | 1,521,958 | 1,318,295 |
| Employee benefit plans | 19 | 768,947 | 682,129 |
| Other liabilities | 20 | 6,755,645 | 6,768,253 |
| TOTAL LIABILITIES | | 207,282,494 | 193,421,257 |
| EQUITY | | | |
| Share capital | 22 | 480,914 | 480,914 |
| Additional paid-in-capital | | 4,857,454 | 4,857,454 |
| Appropriated reserves | 23 | 10,413,092 | 9,741,774 |
| Retained earnings | | 4,695,010 | 3,906,945 |
| Net income attributable to equity holders of the Parent Company | | 3,117,351 | 2,658,864 |
| Accumulated other comprehensive income, net of tax | | 3,320,098 | 3,202,969 |
| STOCKHOLDERS’ EQUITY ATTRIBUTABLE TO THE OWNERS OF THE PARENT COMPANY | | 26,883,919 | 24,848,920 |
| Non-controlling interest | | 1,921,700 | 1,806,305 |
| TOTAL EQUITY | | 28,805,619 | 26,655,225 |
| TOTAL LIABILITIES AND EQUITY | | 236,088,113 | 220,076,482 |
The accompanying notes form an integral part of these Consolidated Financial Statements.
CONSOLIDATED STATEMENT OF INCOME
BANCOLOMBIA S.A. AND ITS SUBSIDIARIES
For the years ended December 31, 2019, 2018 and 2017
(Stated in millions of Colombian pesos, except EPS stated in units of pesos)
| | Note | 2019 | 2018 | 2017 |
| Interest on loans and financial leases | | | | |
| Commercial | | 7,319,318 | 7,322,453 | 8,027,598 |
| Consumer | | 5,273,101 | 4,220,032 | 3,822,743 |
| Small business loans | | 144,585 | 229,446 | 237,266 |
| Mortgage | | 1,972,661 | 1,881,297 | 1,831,716 |
| Financial leases | | 1,918,655 | 1,913,196 | 2,064,978 |
| Interest income on loans and financial leases | | 16,628,320 | 15,566,424 | 15,984,301 |
| Interest on debt instruments using the effective interest method | 25.1 | 160,200 | 129,017 | 159,890 |
| Total Interest of debt instruments using the effective interest method | | 16,788,520 | 15,695,441 | 16,144,191 |
| Interest income on overnight and market funds | | 67,724 | 36,449 | 26,779 |
| Interest and valuation on financial instruments | 25.1 | 524,440 | 384,610 | 525,423 |
| Total interest and valuation on financial instruments | | 17,380,684 | 16,116,500 | 16,696,393 |
| Interest expenses | 25.2 | (6,179,794) | (5,670,216) | (6,232,986) |
| Net interest margin and valuation on financial instruments before impairment on loans and financial leases, off balance sheet credit instruments and other financial instruments | | 11,200,890 | 10,446,284 | 10,463,407 |
| Credit impairment charges on loans, advances and financial leases, net | 6 | (3,385,181) | (3,851,625) | (3,468,699) |
| Credit recovery (impairment) for other financial instruments | | (25,940) | 8,553 | 7,082 |
| Total credit impairment charges, net | | (3,411,121) | (3,843,072) | (3,461,617) |
| Net interest margin and valuation on financial instruments after impairment on loans and financial leases and off balance sheet credit instruments and other financial instruments | | 7,789,769 | 6,603,212 | 7,001,790 |
| Fees and commissions income | 25.3 | 4,578,972 | 3,994,259 | 3,621,114 |
| Fees and commissions expenses | 25.3 | (1,553,239) | (1,213,056) | (1,075,115) |
| Total fees and commissions, net | | 3,025,733 | 2,781,203 | 2,545,999 |
| Other operating income | 25.4 | 1,535,247 | 1,251,567 | 1,553,737 |
| Dividends and net income on equity investments | 25.5 | 380,599 | 294,030 | 290,642 |
| Recovery (Impairment) charges on cash-generating unit | | - | 168,756 | (173,339) |
| Total operating income, net | | 12,731,348 | 11,098,768 | 11,218,829 |
| Operating expenses | | | | |
| Salaries and employee benefits | 26.1 | (3,366,824) | (3,004,054) | (2,792,379) |
| Other administrative and general expenses | 26.2 | (3,069,058) | (3,024,769) | (2,977,884) |
| Wealth tax, contributions and other tax burden | 26.2 | (757,820) | (692,666) | (727,661) |
| Impairment, depreciation and amortization | 26.3 | (824,590) | (493,902) | (479,111) |
| Other operating expenses | | (235,525) | (267,507) | (249,023) |
| Total operating expenses | | (8,253,817) | (7,482,898) | (7,226,058) |
| Profit before tax | | 4,477,531 | 3,615,870 | 3,992,771 |
| Income tax | 12.3.5 | (1,262,964) | (829,435) | (1,238,598) |
| Net income | | 3,214,567 | 2,786,435 | 2,754,173 |
| Net income attributable to equity holders of the Parent Company | | 3,117,351 | 2,658,864 | 2,615,000 |
| Non-controlling interest | | 97,216 | 127,571 | 139,173 |
| Basic and Diluted earnings per share to common shareholders, stated in units of pesos | 27 | 3,301 | 2,825 | 2,780 |
| From continuing operations | | 3,301 | 2,825 | 2,780 |
The accompanying notes form an integral part of these Consolidated Financial Statements.
CONSOLIDATED STATEMENT OF OTHER COMPREHENSIVE INCOME
BANCOLOMBIA S.A. AND ITS SUBSIDIARIES
For the years ended December 31, 2019, 2018 and 2017
(Stated in millions of Colombian pesos)
| | Note | 2019 | 2018 | 2017 |
| Net income | | 3,214,567 | 2,786,435 | 2,754,173 |
| Other comprehensive income/(loss) that will not be reclassified to net income | | | | |
| Remeasurement income related to defined benefit liability | | (38,451) | 37,325 | 3,753 |
| Income tax | 12.2 | 14,835 | (7,663) | (3,725) |
| Net of tax amount | | (23,616) | 29,662 | 28 |
| Investments in equity instruments measured at fair value through other comprehensive income (FVTOCI) | | | | |
| Transfer within equity upon merger of equity investments(1) | | - | - | (38,420) |
| Unrealized gain | | 56,496 | 23,648 | 67,515 |
| Income tax | 12.2 | (12,607) | 10,190 | 9,789 |
| Net of tax amount | | 43,889 | 33,838 | 38,884 |
| Total other comprehensive income that will not be reclassified to net income, net of tax | | 20,273 | 63,500 | 38,912 |
| Other comprehensive income/(loss) that may be reclassified to net income | | | | |
| Investments in debt instruments measured at fair value through other comprehensive income (FVTOCI) | | | | |
| Gain on investments recycled to profit or loss upon disposal | | (1,533) | 1,965 | - |
| Unrealized gain/(loss) | | 28,884 | (24,286) | - |
| Changes in loss allowance for credit losses | | 324 | 2,444 | - |
| Net of tax amount | | 27,675 | (19,877) | - |
| Foreign currency translation adjustments: | | | | |
| Exchange differences arising on translating the foreign operations | | 104,955 | 1,043,593 | 412,878 |
| Gain/(loss) on net investment hedge in foreign operations | | (60,258) | (584,650) | 36,762 |
| Income tax | 12.2 | 20,213 | 172,870 | (6,895) |
| Net of tax amount | | 64,910 | 631,813 | 442,745 |
| Unrealized gain/(loss) on investments in associates and joint ventures using equity method | | 8,151 | 2,581 | (11,547) |
| Income tax | 12.2 | (32) | (663) | - |
| Net of tax amount | | 8,119 | 1,918 | (11,547) |
| Total comprehensive income that may be reclassified to net income, net of tax | | 100,704 | 613,854 | 431,198 |
| Other comprehensive income, attributable to the owners of the Parent Company, net of tax | | 120,977 | 677,354 | 470,110 |
| Other comprehensive income, attributable to the Non-controlling interest | | 6,056 | 25,911 | - |
| Total comprehensive income attributable to: | | 3,341,600 | 3,489,700 | 3,224,283 |
| Equity holders of the Parent Company | | 3,238,328 | 3,336,218 | 3,085,110 |
| Non-controlling interest | | 103,272 | 153,482 | 139,173 |
| (1) | During 2017, the Bank transferred from OCI to retained earnings the amount of COP 38,420 mainly due to the merger between Bolsa de Valores de Colombia BVC and Deceval. The Bank held equity investments of both issuers designated as at FVTOCI. |
The accompanying notes form an integral part of these Consolidated Financial Statements.
CONSOLIDATED STATEMENT OF CHANGES IN EQUITY
BANCOLOMBIA S.A. AND ITS SUBSIDIARIES
For the years ended December 31, 2019, 2018 and 2017
(Stated in millions of Colombian pesos, except per share amounts)
| | Attributable to owners of Parent Company | |
| | | | | Accumulated other comprehensive income | | | | |
| | | | | | | | | | | | Attributable | | |
| | Share | | Appropiated | | Equity | Debt instruments | | | | | to owners | Non- | |
| | Capital | Additional | Reserves | Translation | Securities | at fair value | | Employee | Retained | Net | of Parent | Controlling | Total |
| | (Note 22) | Paid in capital | (Note 23) | adjustment | through OCI | through OCI | Associates | Benefits | earnings | Income | Company | interest | equity |
| Balance as of January 1, 2019 | 480,914 | 4,857,454 | 9,741,774 | 2,882,202 | 392,707 | (19,877) | (1,107) | (50,956) | 3,906,945 | 2,658,864 | 24,848,920 | 1,806,305 | 26,655,225 |
| Effect of adoption of new accounting standards (Note 32 Impacts on application of new standards) | - | - | - | - | - | - | - | - | (181,100) | - | (181,100) | (3,148) | (184,248) |
| Shareholders' equity as of January 1, 2019 (adjusted) | 480,914 | 4,857,454 | 9,741,774 | 2,882,202 | 392,707 | (19,877) | (1,107) | (50,956) | 3,725,845 | 2,658,864 | 24,667,820 | 1,803,157 | 26,470,977 |
| Transfer to profit from previous years | - | - | - | - | - | - | - | - | 2,658,864 | (2,658,864) | - | - | - |
| Dividend payment corresponding to 509,704,584 common shares and 452,122,416 preferred shares without voting rights, subscribed and paid as of December 31, 2018, at a rate of COP 1,092 per share. | - | - | - | - | - | - | - | - | (992,613) | - | (992,613) | - | (992,613) |
| Release of reserves by law | - | - | (6,561) | - | - | - | - | - | 6,561 | - | - | - | - |
| Other reserves | - | - | 677,879 | - | - | - | - | - | (694,948) | - | (17,069) | - | (17,069) |
| Realization of retained earnings | - | - | - | - | (3,848) | - | - | - | 3,848 | - | - | - | - |
| Others | - | - | - | - | - | - | - | - | (12,547) | - | (12,547) | - | (12,547) |
| Non-controlling interest | - | - | - | - | - | - | - | - | - | - | - | 15,271 | 15,271 |
| Net Income | - | - | - | - | - | - | - | - | - | 3,117,351 | 3,117,351 | 97,216 | 3,214,567 |
| Other comprehensive income | - | - | - | 64,910 | 43,889 | 27,675 | 8,119 | (23,616) | - | - | 120,977 | 6,056 | 127,033 |
| Balance as of December 31, 2019 | 480,914 | 4,857,454 | 10,413,092 | 2,947,112 | 432,748 | 7,798 | 7,012 | (74,572) | 4,695,010 | 3,117,351 | 26,883,919 | 1,921,700 | 28,805,619 |
The accompanying notes form an integral part of these Consolidated Financial Statements.
CONSOLIDATED STATEMENT OF CHANGES IN EQUITY
BANCOLOMBIA S.A. AND ITS SUBSIDIARIES
For the years ended December 31, 2019, 2018 and 2017
(Stated in millions of Colombian pesos, except per share amounts)
| | Attributable to owners of Parent Company | | |
| | | | | Accumulated other comprehensive income | | | | | |
| | | | | | | | | | | | Attributable | | |
| | Share | | Appropiated | | Equity | Debt instruments | | | | | to owners | Non- | |
| | Capital | Additional | Reserves | Translation | Securities | at fair value | | Employee | Retained | Net | of Parent | Controlling | Total |
| | (Note 22) | Paid in capital | (Note 23) | adjustment | through OCI | through OCI | Associates | Benefits | earnings | Income | Company | interest | equity |
| Balance as of January 1, 2018 | 480,914 | 4,857,454 | 9,045,155 | 2,250,389 | 379,513 | - | (3,025) | (80,618) | 3,568,182 | 2,615,000 | 23,112,964 | 1,316,586 | 24,429,550 |
| Effect of adoption of new accounting standards (Note 32 Impacts on application of new standards) | - | - | - | - | - | - | - | - | (731,640) | - | (731,640) | (18,141) | (749,781) |
| Shareholders' equity as of January 1, 2018 (adjusted) | 480,914 | 4,857,454 | 9,045,155 | 2,250,389 | 379,513 | - | (3,025) | (80,618) | 2,836,542 | 2,615,000 | 22,381,324 | 1,298,445 | 23,679,769 |
| Transfer to profit from previous years | - | - | - | - | - | - | - | - | 2,615,000 | (2,615,000) | - | - | - |
| Dividend payment corresponding to 509,704,584 common shares and 452,122,416 preferred shares without voting rights, subscribed and paid as of December 31, 2017, at a rate of COP 1,020 per share. | - | - | - | - | - | - | - | - | (923,362) | - | (923,362) | - | (923,362) |
| Legal reserve movements | - | - | 579,254 | - | - | - | - | - | (579,254) | - | - | - | - |
| Disposal of debt/equity instruments | - | - | - | - | (20,644) | - | - | - | 20,644 | - | - | - | - |
| Subsidiaries’ liquidation | - | - | - | - | - | - | - | - | 512 | - | 512 | - | 512 |
| Realization of retained earnings | - | - | - | - | - | - | - | - | 1,090 | - | 1,090 | | 1,090 |
| Non-controlling interest | - | - | - | - | - | - | - | - | - | - | - | 354,378 | 354,378 |
| Other reserves(1) | - | - | 117,365 | - | - | | - | - | (117,365) | - | - | - | - |
| Changes in shareholdings subsidiaries | - | - | - | - | - | - | - | - | 53,138 | - | 53,138 | - | 53,138 |
| Net income | - | - | - | - | - | - | - | - | - | 2,658,864 | 2,658,864 | 127,571 | 2,786,435 |
| Other comprehensive income | - | - | - | 631,813 | 33,838 | (19,877) | 1,918 | 29,662 | - | - | 677,354 | 25,911 | 683,410 |
| Balance as of December 31, 2018 | 480,914 | 4,857,454 | 9,741,774 | 2,882,202 | 392,707 | (19,877) | (1,107) | (50,956) | 3,906,945 | 2,658,864 | 24,848,920 | 1,806,305 | 26,655,225 |
| (1) | This item corresponds to the dynamic reserves of Banistmo S.A., which correspond to an additional provision recognized on its low credit risk loan portfolio. |
The accompanying notes form an integral part of these Consolidated Financial Statements
CONSOLIDATED STATEMENT OF CHANGES IN EQUITY
BANCOLOMBIA S.A. AND ITS SUBSIDIARIES
For the years ended December 31, 2019, 2018 and 2017
(Stated in millions of Colombian pesos, except per share amounts)
| | | Attributable to owners of Parent Company | | |
| | Accumulated other comprehensive income | | | | |
| | | | | | Equity | | | | | Attributable | | |
| | Share | | Appropiated | | Securities | | | | | To owners | Non- | |
| | Capital | Additional | Reserves | Translation | at fair value | | Employee | Retained | Net | Of Parent | Controlling | Total |
| | (Note 22) | Paid in capital | (Note 23) | adjustment | through OCI | Associates | Benefits | earnings | Income | Company | interest | equity |
| Balance as of January 1, 2017 | 480,914 | 4,857,454 | 7,472,409 | 1,807,644 | 340,629 | 8,522 | (80,646) | 3,515,329 | 2,865,328 | 21,267,583 | 1,209,397 | 22,476,980 |
| Transfer to profit from previous years | - | - | - | - | - | - | - | 2,865,328 | (2,865,328) | - | - | - |
| Dividend payment corresponding to 509,704,584 common shares and 452,122,416 preferred shares without voting rights, subscribed and paid as of December 31, 2016, at a rate of COP 950 per share. | - | - | - | - | - | - | - | (856,419) | - | (856,419) | - | (856,419) |
| Legal reserve movements | - | - | 1,914,464 | - | - | - | - | (1,914,464) | - | - | - | - |
| Release of reserves by law | - | - | (421,730) | - | - | - | - | - | - | (421,730) | - | (421,730) |
| Increase of reserves by law | - | - | 77,398 | - | - | - | - | (77,398) | - | - | - | - |
| Sale of financial instruments | - | - | - | - | (38,420) | - | - | 38,420 | - | - | - | - |
| Non-controlling interest | - | - | - | - | - | - | - | - | - | - | (31,984) | (31,984) |
| Other reserves(1) | - | - | 2,614 | - | - | - | - | (2,614) | - | - | - | - |
| Net income | - | - | - | - | - | - | - | - | 2,615,000 | 2,615,000 | 139,173 | 2,754,173 |
| Other comprehensive income | - | - | - | 442,745 | 77,304 | (11,547) | 28 | - | - | 508,530 | - | 508,530 |
| Balance as of December 31, 2017 | 480,914 | 4,857,454 | 9,045,155 | 2,250,389 | 379,513 | (3,025) | (80,618) | 3,568,182 | 2,615,000 | 23,112,964 | 1,316,586 | 24,429,550 |
| (1) | This item corresponds mainly to the dynamic reserves of Banistmo S.A., which correspond to an additional provision recognized on its low credit risk loan portfolio. |
The accompanying notes form an integral part of these Consolidated Financial Statements
CONSOLIDATED STATEMENT OF CASH FLOW
BANCOLOMBIA S.A. AND ITS SUBSIDIARIES
For the years ended December 31, 2019, 2018 and 2017
(Stated in millions of Colombian pesos)
| | 2019 | | 2018 | | 2017 | |
| Net income | 3,214,567 | | 2,786,435 | | 2,754,173 | |
| Adjustments to reconcile net income to net cash provided by operating activities: | | | | | | |
| Depreciation and amortization | 677,253 | | 467,777 | | 433,033 | |
| Other assets impairment (Reversal) | 147,337 | | (141,011) | | 219,189 | |
| Equity method | (249,231) | | (187,814) | | (253,602) | |
| Deferred tax expense | 215,992 | | 223,544 | | 193,568 | |
| Credit impairment charges on loans and advances and financial leases | 3,385,181 | | 3,851,625 | | 3,468,699 | |
| Credit impairment (recovery) charges on off balance sheet credit and other financial instruments | 25,940 | | (8,553) | | (6,854) | |
| Gain on sales on assets held for sale and inventories | (93,548) | | (75,976) | | (40,600) | |
| Gains on sale of loan portfolio | - | | (12,556) | | - | |
| Valuation gain on investment securities | (1,113,392) | | (630,904) | | (736,075) | |
| (Gain) loss upon disposal of investment in subsidiary and associates | (77,916) | | 510 | | 2,700 | |
| Valuation (losses) on derivative financial instruments | 285,220 | | (244,613) | | 39,750 | |
| Wealth tax(1) | - | | - | | 51,220 | |
| Income tax | 1,046,972 | | 605,891 | | 1,045,030 | |
| Other non-cash ítems | 70,833 | | 90,251 | | (16,360) | |
| Net interest | (10,448,526) | | (10,371,051) | | (9,919,699) | |
| Change in operating assets and liabilities: | | | | | | |
| Decrease (Increase) in derivative financial instruments | 219,259 | | (132,684) | | 135,595 | |
| (Increase) Decrease in accounts receivable | (185,220) | | (423,960) | | 338,211 | |
| Increase in loans and advances to customers | (12,140,001) | | (12,952,529) | | (11,266,789) | |
| Increase in other assets | (986,022) | | (282,703) | | (23,083) | |
| Decrease in accounts payable | (977,266) | | (273,855) | | (629,990) | |
| (Decrease) Increase in other liabilities | 41,234 | | 189,868 | | 189,655 | |
| Increase in deposits by customers | 14,317,297 | | 6,188,577 | | 8,456,681 | |
| Decrease in estimated liabilities and provisions | (3,378) | | (12,919) | | (16,608) | |
| Net changes in investment securities recognized at fair value through profit or loss | 2,626,620 | | 615,093 | | (1,599,641) | |
| Proceeds from sales of assets held for sale | 429,906 | | 363,407 | | 331,645 | |
| Proceed from sale of loan portfolio | - | | 511,864 | | - | |
| Wealth tax paid(1) | - | | - | | (51,220) | |
| Recovery of charged-off loans | 551,650 | | 459,860 | | 410,860 | |
| Income tax paid | (251,712) | | (167,856) | | (199,127) | |
| Dividend received | 195,046 | | 124,754 | | 80,651 | |
| Interest received | 17,387,534 | | 15,585,632 | | 15,347,265 | |
| Interest paid | (5,996,017) | | (5,103,246) | | (5,798,689) | |
| Net cash provided by operating activities | 12,315,612 | | 1,042,858 | | 2,939,588 | |
| Cash flows from investment activities: | | | | | | |
| Purchases of debt instruments at amortized cost | (2,800,997) | | (2,380,202) | | (3,122,872) | |
| Proceeds from maturities of debt instruments at amortized cost | 2,405,509 | | 2,214,457 | | 2,167,450 | |
| Purchases of debt instruments at fair value through OCI | (5,945,285) | | (1,652,050) | | - | |
| Proceeds from debt instruments at fair value through OCI | 5,426,410 | | 1,525,435 | | - | |
| Purchases of equity instruments and interests in associates and joint ventures | (40,712) | | (289,361) | | (305,650) | |
| Proceeds from equity instruments and interests in associates and joint ventures | 131,173 | | 29,752 | | 7,479 | |
| Restitution of associates' capital contributions | - | | - | | 2,495 | |
| Purchases of premises and equipment and investment properties | (1,555,453) | | (1,014,093) | | (1,132,015) | |
| Proceeds from sales of premises and equipment and investment properties | 232,438 | | 311,430 | | 568,744 | |
| Net cash inflow (outflow) from sale and liquidation of investments in subsidiaries | 70,306 | (3) | 26 | | (1,534) | (2) |
| Purchase of other long-term assets | (114,221) | | (127,236) | | (92,177) | |
| Net cash (used in) provided by investing activities | (2,190,832) | | (1,381,842) | | (1,908,080) | |
| Cash flows from financing activities: | | | | | | |
| (Decrease) Increase in repurchase agreements and other similar secured borrowing | (1,002,196) | | (922,840) | | 1,313,442 | |
| Proceeds from borrowings from other financial institutions | 11,741,311 | | 15,774,251 | | 12,190,496 | |
| Repayment of borrowings from other financial institutions | (14,365,716) | | (14,472,128) | | (17,042,665) | |
| Payment of lease liability(4) | (124,817) | | - | | - | |
| Placement of debt instruments in issue(5) | 2,084,743 | | 1,150,485 | | 3,013,426 | |
| Payment of debt instruments in issue | (2,561,525) | | (1,886,850) | | (1,969,399) | |
| Dividends paid | (1,032,492) | | (735,798) | | (1,126,209) | |
| Transactions with non-controlling interests(6) | - | | 360,169 | | - | |
| Net cash used in financing activities(7) | (5,260,692) | | (732,711) | | (3,620,909) | |
| Effect of exchange rate changes on cash and cash equivalents | 143,144 | | 1,636,861 | | 294,800 | |
| Increase (Decrease) in cash and cash equivalents | 4,864,088 | | (1,071,695) | | (2,589,401) | |
| Cash and cash equivalents at beginning of year | 18,730,810 | | 18,165,644 | | 20,460,245 | |
| Cash and cash equivalents at end of year | 23,738,042 | | 18,730,810 | | 18,165,644 | |
| (1) | The Bank was required to pay the wealth tax contribution until the tax year of 2017, in accordance with the Law 1739 of 2014. See Note 12 Income Tax. |
| (2) | Corresponds to the net amount of cash received from the liquidation of Leasing Perú S.A. and Fondo de Inversión en Arrendamiento Operativo - Renting Perú amounting to COP 16,838 and COP 3,757, respectively, and the balance of cash and cash equivalents held by the companies at the transaction date amounting to COP 17,903 and COP 4,226, respectively. |
| (3) | In March 2019, the Bank’s subsidiaries Renting Colombia S.A.S and Inversiones CFNS S.A.S closed the sale to Arval Relsa of 100% of the shares of Arrendamiento Operativo CIB S.A.C – Renting Peru, a leasing company incorporated and with operations in Peru. Arval Relsa is the joint venture between Arval (subsidiary of BNP Paribas, with more than one million vehicles under operating leases) and Relsa (company with 15 years of experience in the Peruvian market) that seeks to strengthen the car leasing and vehicle fleet management businesses in Peru and Chile. The sale price amounted to USD 21.8 million. |
| (4) | See Note 32 Impacts on application of new standards. |
| (5) | For further information see Note 18 Debt instruments in issue. |
| (6) | In 2018, this item corresponds mainly to the capitalization of Fondo Colombia Inmobiliario. |
| (7) | For further information about the reconciliation of the balances of liabilities from financing activities, see Note 29 Liabilities from financing activities. |
During the years ended December 31, 2019, 2018 and 2017, the Group entered into non-cash operating and investing activities related with restructured loans and returned goods that were transferred to assets held for sale and inventories amounting to COP 508,441, COP 521,718 and COP 331,057, respectively which are not reflected in the consolidated statement of cash flows.
The accompanying notes form an integral part of these Consolidated Financial Statements.
NOTE 1. REPORTING ENTITY
Bancolombia S.A., hereinafter the Parent Company or the Group, is a credit establishment, listed on the Colombia Stock Exchange (BVC) and, as well as on the New York Stock Exchange (NYSE), since 1981 and 1995, respectively. The Parent Company's main location is in Medellin (Colombia), main address Carrera 48 # 26-85, Avenida Los Industriales, was originally constituted under the name Colombian Industrial Bank (BIC) according to public deed number 388, date January 24, 1945, from the First Notary's Office of Medellin, authorized by the Superintendence of Finance of Colombia (“SFC”). On April 3, 1998, by means of public deed No. 633, BIC merged with Bank of Colombia S.A., and the resulting organization of that merger was named Bancolombia S.A.
Bancolombia S.A.’s business purpose is to carry out all operations, transactions, acts and services inherent to the Banking business through banking establishments that carry its name and according to all applicable legislation. The Parent Company may own interests in other corporations, wherever authorized by law, according to all terms and requirements, limits or conditions established therein.
The Parent Company and its subsidiaries (on consolidated basis referred to as the “Bank”) include the following operating segments: Banking Colombia, Banking Panama, Banking El Salvador, Banking Guatemala, Trust, Investment banking, Brokerage, Off Shore and Others. The activities carried out by each operating segment of the Bank are described in Note 3 Operating segments.
The duration of the Parent Company contemplated in the bylaws is until December 8, 2044, but it can be dissolved or renewed before the conclusion of that period. The operating license was authorized definitively by the SFC according to Resolution number 3140 on September 24, 1993.
Through public deed number 1,124 of September 30, 2016, from the fourthteenth Notary’s Office of Medellin, duly registered in the Camara de Comercio de Medellín, a merger was completed between the Parent Company (absorbing entity) and Leasing Bancolombia S.A. (absorbed entity). As a result of the merger, the Parent Company became the holder of all the rights and obligations of Leasing Bancolombia S.A. and continues to offer its clients the portfolio of leasing products and services under the brand "Leasing Bancolombia, una marca Bancolombia".
The Bank has 31,075 employees, and operates through 975 offices, 16,740 banking correspondents and 6,169 ATMs.
In March 2019 the subsidiaries Renting Colombia S.A.S and Inversiones CFNS S.A.S, closed the sale to Arval Relsa of 100% of the shares of Arrendamiento Operativo CIB S.A.C. – Renting Perú, an operational leasing company incorporated and with operations in Peru, and then, in July 2019 the Bank’s subsidiaries Fiduciaria Bancolombia and Banca de Inversion Bancolombia, closed the sale to TMF Group Americas B.V. of 100% of the shares of FiduPeru S.A, a trust services company incorporated and with operations in Peru.
The Bank through its subsidiaries has banking, operational and international presence in Puerto Rico, Panama, Guatemala, Cayman, Barbados and El Salvador.
NOTE 2. SIGNIFICANT ACCOUNTING POLICIES
The consolidated financial statements of the Bank are prepared in accordance with the International Financial Reporting Standards (hereinafter, IFRS) issued by the International Accounting Standards Board (hereinafter, IASB), as well as the interpretations issued by the International Financial Reporting Interpretations Committee (hereinafter, IFRS-IC).
The preparation of financial statements in conformity with IFRS requires the use of accounting estimates which, by definition, will seldom equal the actual results. Therefore, the estimates and assumptions are constantly reviewed. Any revision is recognized in the same period if it affects the reviewed period; or in the reviewed period and future periods if it affects all the current and future periods.
Assets and liabilities are measured at cost or amortized cost, except for some financial assets and liabilities and investment properties that are measured at fair value. Financial assets and liabilities measured at fair value comprise those classified as assets and liabilities at fair value through profit or loss, debt instruments and equity securities measured at fair value through other comprehensive income (“OCI”) and derivative instruments. Likewise, the carrying value of assets and liabilities recognized as a fair value hedge are adjusted for changes in fair value attributable to the hedged risk.
The consolidated financial statements are stated in Colombian pesos and its figures are stated in millions, except earnings per share, diluted earnings per share and the market exchange rate, which are stated in Colombian pesos, while other currencies (dollars, euro, pounds, etc.) are stated in thousands.
The Parent Company’s financial statements, which have been prepared in accordance with “Normas de Contabilidad e Información Financiera” (NCIF) applicable to separate financial statements, are those that serve as the basis for the distribution of dividends and other appropriations by the stockholders.
The separate financial statements are those presented by the Parent Company in which the entity elected to account for its investments in joint ventures and associates at cost, and the recognition and measurement of credit risk reserves are accounted for as required by the Superintendency of Finance of Colombia.
| B. | Presentation of financial statements |
The Bank presents the consolidated statement of financial position ordered by liquidity and the consolidated statement of income is prepared based on the nature of expenses. Revenues and expenses are not offset, unless such compensation is permitted or required by any accounting standard or interpretation and are described in the Bank's policies.
The statement of comprehensive income presents net income and items of other comprehensive income classified by nature and grouped into those that will not be reclassified subsequently to profit or loss and those that will be reclassified when specific conditions are met. The Bank discloses the amount of income tax relating to each item of OCI.
The consolidated statement of cash flows was prepared using the indirect method, whereby net income is adjusted for the effects of transactions of a non-cash nature, changes during the period in operating assets and liabilities, and items of income or expense associated with investing or financing cash flows.
The consolidated financial statements include the financial statements of Bancolombia S.A. and its subsidiaries as of December 31, 2019 and 2018. The Parent Company consolidates the financial results of the entities on which it exerts control.
In accordance with IFRS 10, a subsidiary is an entity controlled by any of the entities that comprise The Bank, as long as the controlling entity has:
| · | Power over the investee that give it the ability to direct their relevant activities that significantly affect the investee’s returns. |
| · | Exposure or rights to variable returns for its involvement with the investee. |
| · | Ability to use its power over the investee to affect the investor’s returns. |
The Parent Company has the following subsidiaries making up the Bank´s organizational structure, which is currently registered as a corporate group:
| ENTITY | JURISDICTION OF INCORPORATION | BUSINESS | PROPORTION OF
OWNERSHIP
INTEREST AND
VOTING POWER
HELD BY THE
BANK 2019 | PROPORTION OF
OWNERSHIP
INTEREST AND
VOTING POWER
HELD BY THE
BANK 2018 | PROPORTION OF
OWNERSHIP
INTEREST AND
VOTING POWER
HELD BY THE
BANK 2017 |
| Fiduciaria Bancolombia S.A. Sociedad Fiduciaria | Colombia | Trust | 98.81% | 98.81% | 98.81% |
| Banca de Inversión Bancolombia S.A. Corporación Financiera | Colombia | Investment banking | 100.00% | 100.00% | 100.00% |
| Valores Bancolombia S.A. Comisionista de Bolsa | Colombia | Securities brokerage | 100.00% | 100.00% | 100.00% |
| Renting Colombia S.A.S. | Colombia | Operating leasing | 100.00% | 100.00% | 100.00% |
| Transportempo S.A.S. | Colombia | Transportation | 100.00% | 100.00% | 100.00% |
| Valores Simesa S.A.(1) | Colombia | Investments | 67.11% | 67.73% | 68.57% |
| Inversiones CFNS S.A.S. | Colombia | Investments | 99.94% | 99.94% | 99.94% |
| Pasarela Colombia S.A.S (before BIBA Inmobiliaria S.A.S.) | Colombia | Real estate broker | 100.00% | 100.00% | 100.00% |
| Fondo de Capital Privado Fondo Inmobiliario Colombia(2) | Colombia | Real estate broker | 49.96% | 51.29% | 63.47% |
| Fideicomiso "Lote Abelardo Castro" | Colombia | Mercantil trust | 66.77% | 67.39% | 68.23% |
| Fideicomiso Lote Distrito Vera B1B2(3) | Colombia | Mercantil trust | 66.77% | - | - |
| Fideicomiso Lote Distrito Vera B3B4(3) | Colombia | Mercantil trust | 66.77% | - | - |
| Bancolombia Panamá S.A. | Panama | Banking | 100.00% | 100.00% | 100.00% |
| Sistemas de Inversiones y Negocios S.A. Sinesa | Panama | Investments | 100.00% | 100.00% | 100.00% |
| Banagrícola S.A. | Panama | Investments | 99.17% | 99.16% | 99.16% |
| Banistmo S.A. | Panama | Banking | 100.00% | 100.00% | 100.00% |
| Banistmo Investment Corporation S.A. | Panama | Trust | 100.00% | 100.00% | 100.00% |
| Financomer S.A. | Panama | Financial services | 100.00% | 100.00% | 100.00% |
| Leasing Banistmo S.A. | Panama | Leasing | 100.00% | 100.00% | 100.00% |
| ENTITY | JURISDICTION OF INCORPORATION | BUSINESS | PROPORTION OF
OWNERSHIP
INTEREST AND
VOTING POWER
HELD BY THE
BANK 2019 | PROPORTION OF
OWNERSHIP
INTEREST AND
VOTING POWER
HELD BY THE
BANK 2018 | PROPORTION OF
OWNERSHIP
INTEREST AND
VOTING POWER
HELD BY THE
BANK 2017 |
| Valores Banistmo S.A. | Panama | Purchase and sale of securities | 100.00% | 100.00% | 100.00% |
| Banistmo Panama Fondo de Inversión S.A. (Before Suvalor Panamá Fondos de Inversión S.A.) | Panama | Holding | 100.00% | 100.00% | 100.00% |
| Fondo Renta Fija Valor, S.A. (before Suvalor Renta Fija Internacional Largo Plazo S.A.)(4) | Panama | Collective investment fund | - | 100.00% | 100.00% |
| Suvalor Renta Fija Internacional Corto Plazo S.A. | Panama | Collective investment fund | 100.00% | 100.00% | 100.00% |
| Suvalor Renta Variable Colombia,S.A.(5) | Panama | Collective investment fund | 100.00% | - | - |
| Banistmo Capital Markets Group Inc.(6) | Panama | Purchase and sale of securities | 100.00% | 100.00% | 100.00% |
| Anavi Investment Corporation S.A.(6) | Panama | Real estate broker | 100.00% | 100.00% | 100.00% |
| Desarrollo de Oriente S.A.(6) | Panama | Real estate broker | 100.00% | 100.00% | 100.00% |
| Steens Enterpresies S.A.(6) | Panama | Portfolio holder | 100.00% | 100.00% | 100.00% |
| Ordway Holdings S.A.(6) | Panama | Real estate broker | 100.00% | 100.00% | 100.00% |
| Van Dyke Overseas Corp.(7) | Panama | Real estate broker | - | - | 100.00% |
| Inmobiliaria Bickford S.A.(7) | Panama | Real estate broker | - | - | 100.00% |
| Williamsburg International Corp.(7) | Panama | Real estate broker | - | - | 100.00% |
| Grupo Agromercantil Holding S.A. | Panama | Holding | 60.00% | 60.00% | 60.00% |
| Banco Agrícola S.A. | El Salvador | Banking | 97.36% | 97.36% | 97.36% |
| Arrendadora Financiera S.A. Arfinsa | El Salvador | Leasing | 97.37% | 97.37% | 97.37% |
| Credibac S.A. de C.V. | El Salvador | Credit card services | 97.36% | 97.36% | 97.36% |
| Valores Banagrícola S.A. de C.V. | El Salvador | Securities brokerage | 98.89% | 98.89% | 98.89% |
| Inversiones Financieras Banco Agrícola S.A IFBA | El Salvador | Investments | 98.89% | 98.89% | 98.89% |
| Gestora de Fondos de Inversión Banagricola S.A. | El Salvador | Administers investment funds | 98.89% | 98.89% | 98.89% |
| Arrendamiento Operativo CIB S.A.C.(8) | Peru | Operating leasing | - | 100.00% | 100.00% |
| FiduPerú S.A. Sociedad Fiduciaria(8) | Peru | Trust | - | 98.81% | 98.81% |
| Fondo de Inversión en Arrendamiento Operativo - Renting Perú(7) | Peru | Car Rental | - | - | 100.00% |
| Capital Investments SAFI S.A.(7) | Peru | Trust | - | - | 100.00% |
| Leasing Perú S.A.(7) | Peru | Leasing | - | - | 100.00% |
| Banagrícola Guatemala S.A.(7) | Guatemala | Outsourcing | - | - | 99.16% |
| Banco Agromercantil de Guatemala S.A. | Guatemala | Banking | 60.00% | 60.00% | 60.00% |
| Seguros Agromercantil de Guatemala S.A. | Guatemala | Insurance company | 59.17% | 59.17% | 59.17% |
| ENTITY | JURISDICTION OF INCORPORATION | BUSINESS | PROPORTION OF
OWNERSHIP
INTEREST AND
VOTING POWER
HELD BY THE
BANK 2019 | PROPORTION OF
OWNERSHIP
INTEREST AND
VOTING POWER
HELD BY THE
BANK 2018 | PROPORTION OF
OWNERSHIP
INTEREST AND
VOTING POWER
HELD BY THE
BANK 2017 |
| Financiera Agromercantil S.A. | Guatemala | Financial services | 60.00% | 60.00% | 60.00% |
| Agrovalores S.A. | Guatemala | Securities brokerage | 60.00% | 60.00% | 60.00% |
| Tarjeta Agromercantil S.A.(7) | Guatemala | Credit Card | - | - | 60.00% |
| Arrendadora Agromercantil S.A. | Guatemala | Operating Leasing | 60.00% | 60.00% | 60.00% |
| Agencia de Seguros y Fianzas Agromercantil S.A. | Guatemala | Insurance company | 60.00% | 60.00% | 60.00% |
| Asistencia y Ajustes S.A. | Guatemala | Services | 60.00% | 60.00% | 60.00% |
| Serproba S.A. | Guatemala | Maintenance and remodelling services | 60.00% | 60.00% | 60.00% |
| Servicios de Formalización S.A. | Guatemala | Loans formalization | 60.00% | 60.00% | 60.00% |
| Conserjeria, Mantenimiento y Mensajería S.A. | Guatemala | Maintenance services | 60.00% | 60.00% | 60.00% |
| Media Plus S.A.(7) | Guatemala | Advertising and marketing | - | - | 60.00% |
| Mercom Bank Ltd. | Barbados | Banking | 60.00% | 60.00% | 60.00% |
| New Alma Enterprises Ltd. | Bahamas | Investments | 60.00% | 60.00% | 60.00% |
| Bancolombia Puerto Rico Internacional Inc. | Puerto Rico | Banking | 100.00% | 100.00% | 100.00% |
| Bancolombia Caymán S.A. | Cayman Islands | Banking | 100.00% | 100.00% | 100.00% |
| Bagrícola Costa Rica S.A. | Costa Rica | Outsourcing | 99.17% | 99.16% | 99.16% |
| (1) | The decrease in the shareholding is due to the repurchase outstanding stock carried out by the subsidiary during 2018 and 2019. |
| (2) | The Bank's shareholding decreased during 2018 and 2019. However, It is defined as a Subsidiary, given the significant control and influence over the PA. Management Board responsible for appointing the management staff and the employees of the PA. |
| (3) | Investments effected in 2019. |
| (4) | Investment not consolidated during 2019 because it does not meet control requirements. |
| (5) | Investment consolidated by Banistmo during 2019. |
| (6) | Investments in non-operational stage. |
| (7) | Investment liquidated during 2018. |
| (8) | Companies sold during 2019. For more information see Note 1. Reporting Entity |
When necessary, adjustments are made to the accounting principles in the financial statements of subsidiaries to bring their accounting policies into line with the Bank’s accounting policies.
All intragroup assets and liabilities, equity, income, expenses and cash flows relating to transactions between members of the Bank are eliminated in full on consolidation.
Non-controlling interests in controlled entities are presented in profit or loss and equity separately from the Parent Company stockholders´ equity and profit or loss. When the Bank loses control over a subsidiary, any residual interest remaining on the Bank’s balances is measured at fair value; gains or losses arising from this measurement are recognized in net income.
There are restrictions on the ability of the Parent Company to obtain distributions of capital, due to the regulatory requirements of its subsidiaries in Panama. Banistmo and Bancolombia Panama have net assets before intercompany eliminations amounting to COP 9,487,725 and COP 8,186,449 as of December 31, 2019 and 2018, respectively.
The loans and financial leases granted by those subsidiaries are subject to prudential regulation in Panama issued by the Panamanian Superintendency of Banks including a requirement to maintain minimum reserves as a countercyclical capital buffer. For the years ended as of December 31, 2019 and 2018, the reserves recognized amounted to COP 684,698 and COP 670,169. These requirements restrict the ability of the aforementioned subsidiaries to make remittances of dividends to Bancolombia S.A., the ultimate parent, except in the event of liquidation.
| 2. | Transactions between entities under common control |
Combination of entities under common control, i.e. transactions in which all the combining entities are under the control of the Bank both before and after the combination, and that control is not transitory, are outside the scope of the IFRS 3- Business combinations. Currently, there is no specific guidance for these transactions under IFRS, therefore, as permitted by IAS 8, the Bank has developed an accounting policy considering the pronouncements of other standard-setting bodies. The assets and liabilities recognized as a result of transactions between entities under common control are recognized at the carrying value of the acquirer’s financial statements. The Bank presents the net assets received prospectively from the date of the transfer.
| 3. | Investments in associates and joint ventures |
An associate is an entity over which the Bank has significant influence. Significant influence is the power to participate in the financial and operating policy decisions of the investee but is not control or joint control over those policies.
A joint venture is an entity that the Bank controls jointly with other participants, where the parties maintain a contractual agreement that establishes joint control over the relevant activities of the entity (which only exists when decisions about those activities require unanimous consent of the parties sharing control) and the parties have rights to the net assets of the joint arrangement.
At the acquisition date, the excess of the acquisition cost of the associate or joint venture shares exceeding the Bank´s share of the net fair value of identifiable assets and liabilities of the investee is recognized as goodwill and it is included in the carrying amount of the investment and it is not amortized. When necessary, the entire carrying amount of the investment (including goodwill) is tested for impairment a single asset in accordance with IAS 36 Impairment of Assets Impairment losses are recognized in net income and are calculated as the difference between the recoverable amount of the associate or joint venture, using the higher of its value in use and its fair value less costs of disposal, and its carrying value.
The results and assets and liabilities of associates or joint ventures are incorporated in the consolidated financial statements using the equity method of accounting, except when the investment, or a portion thereof, is classified as held for sale, in which case it is accounted for in accordance with IFRS 5. When an investment in an associate or joint venture is held by, or is held indirectly through, an entity that is a venture capital organization, or a mutual fund, unit trust or similar entities, and such investment is measured at fair value through profit or loss in that entity, the Bank may elect to measure investments in those associates and joint ventures at fair value through profit or loss in the consolidated financial statements. This election is applied on an investment by investment basis.
Under the equity method, the investment is initially recorded at cost and adjusted thereafter to recognize the Bank’s share of the profits or loss and other comprehensive income of the associate or join venture. When the Bank's share of losses of an associate or joint venture exceeds the Bank's interest in that associate or joint venture (which includes any long-term interests that, in substance, form part of the Bank's net investment in the associate or joint venture), the Bank discontinues recognizing its share of further losses. Additional losses are recognized only to the extent that the Bank has incurred legal or constructive obligations or made payments on behalf of the associate or joint venture.
When the equity method is applicable, adjustments are considered in order to adopt uniform accounting policies of the associate or joint venture with the Bank. The portion that corresponds to the Bank for changes in the investee´s other comprehensive income items is recognized in the consolidated statement of comprehensive income as “Unrealized gain/ (loss) on investments in associates and joint ventures using equity method” and gains or losses of the associate or joint venture are recognized in the consolidated statement of income as “Dividends received and share of profits of equity method investees”, in accordance with the Bank's participation. Gains and losses resulting from transactions between the Bank and its associate or joint venture are recognized in the Bank´s consolidated financial statements only to the extent of the unrelated investor´s interest in the associate or joint venture. The equity method is applied from the acquisition date until the significant influence or joint control over the entity is lost.
The unrealized gain or loss of an associate or joint venture is presented in the consolidated statement of comprehensive income, net of tax. Changes in the investment´s participation that arise from changes in other comprehensive income of an associate or joint venture are recognized directly in the investor’s statement of other comprehensive income.
The dividends received from the associate or joint venture reduce the investment carrying value.
When the significant influence on the associate or the joint venture is lost, the Bank measures and recognizes any residual investment that remained at its fair value. The difference between the associate or joint venture carrying value (taking into account the relevant items of other comprehensive income), the fair value of the retained residual investment and any proceeds from disposing of a part interest in the associate or joint venture, is recognized in the Statement of income. The currency translation adjustments recognized in equity are reclassified to net income at the moment of disposal.
For further information please see Note 8 Investments in associates and joint ventures.
A joint operation is a joint arrangement whereby the parties that have joint control of the arrangement have rights to the assets, and obligations for the liabilities, relating to the arrangement.
The Bank recognizes and measures assets, liabilities, revenues and expenses in relation to its interest in joint operations in accordance with the applicable IFRS for the particular assets, liabilities, revenues and expenses.
If the Bank acquires an interest in a joint operation in which the activity constitutes a business, as defined in IFRS 3 Business Combinations or when an existing business is contributed to the joint operation on its formation by one of the parties that participate in the joint operation, the Bank will apply all of the principles of IFRS 3 Business Combinations. In this case the Bank recognizes goodwill in the event that consideration transferred exceeds the net of the acquisition date amounts of the identifiable assets acquired and the liabilities assumed. Goodwill is tested for impairment at least annually.
When the Bank transacts with a joint operation in which the Parent Company or its subsidiaries is a joint operator (such as a sale or contribution of assets), the Bank is considered to be conducting the transaction with the other parties to the joint operation, and gains and losses resulting from the transactions are recognized in the Bank’s consolidated financial statements only to the extent of other parties’ interests in the joint operation.
When the Bank transacts with a joint operation in which the Parent Company or its subsidiaries is a joint operator (such as a purchase of assets), the Bank does not recognize its share of the gains and losses until it resells those assets to a third party.
The Bank manages assets held in mutual funds and other forms of investment. Assets managed by the Bank’s subsidiaries and owned by third parties are not included in the consolidated financial statements unless control exists as structured entities.
The Bank consolidates the following funds:
| Name | Country | % of ownership
interest held by
the Bank, 2019 | % of ownership
interest held by
the Bank, 2018 | % of ownership
interest held by
the Bank, 2017 | Assets managed |
December 31,
2019 | December 31,
2018 |
| Fondo de Capital Privado Fondo Inmobiliario Colombia | Colombia | 49.96% | 51.29% | 63.47% | 3,751,981 | 3,205,133 |
| Fideicomiso “Lote Abelardo Castro” | Colombia | 66.77% | 67.39% | 68.23% | 12,900 | 11,616 |
| Fideicomiso Lote Distrito Vera B1B2 | Colombia | 66.77% | - | - | 63,010 | - |
| Fideicomiso Lote Distrito Vera B3B4 | Colombia | 66.77% | - | - | 60,684 | - |
Banistmo Panama Fondo de Inversión S.A.
(Before Suvalor Panamá Fondos de Inversión S.A.) | Panamá | 100.00% | 100.00% | 100.00% | 246 | 244 |
For all the aforementioned funds, the Bank has participated in the design of the structured entity, establishes operating and financial decisions of the funds and it is exposed to variable returns such as dividends or returns paid in quarterly installments.
The commissions earned by the management of funds that are not consolidated are included in the statement of income as “Fees and commissions income”.
| 6. | Non-controlling interest |
Non-controlling interests in the net assets of consolidated subsidiaries are presented separately within the Bank’s equity. Similarly, net income and other comprehensive income are also attributed to non-controlling interest and equity holders of the Parent Company. The amount of non-controlling interest may be initially measured either at fair value or at the non-controlling interest’s proportionate share of the acquirer’s identifiable net assets. The option for recognition is made on an investment by investment basis.
Any purchase or sale of shares in subsidiaries that does not imply a loss or gain of control is directly recognized in equity.
| 6.1. | Significant non-controlling interest |
FCP Fondo Inmobiliario Colombia
As of December 31, 2019, and 2018, the portion of non-controlling interest in the FCP Fondo Inmobiliario Colombia was 50.04% and 48.71%, respectively, which is considered as a significant non-controlling interest for the Bank and its subsidiaries. The principal place of business of FCP Fondo Inmobiliario Colombia is Bogotá (Colombia).
As of December 31, 2019, and 2018, there were no dividends declared by this subsidiary. In contrast, there were returns paid in quarterly installments due to the nature of its business, which mainly comprises long- term investment in real state which is considered a low-risk portfolio.
The following table summarizes the assets, liabilities, net assets, net income and cash flows as of December 31, 2019, 2018 and 2017, related to the FCP Fondo Inmobiliario Colombia:
| | As of December 31, 2019 | As of December 31, 2018 | |
| | In millions of COP |
| Assets | 3,751,981 | 3,205,133 | |
| Liabilities | 1,254,123 | 963,841 | |
| Net assets | 2,497,858 | 2,241,292 | |
| | Year-Ended 2019 | Year-Ended 2018 | Year-Ended 2017 |
| | In millions of COP |
| Condensed statement of income | | | |
| Income | | | |
| Valuation of investment properties | 77,527 | 70,933 | 81,816 |
| Valuation of trust rights | 52,215 | 29,161 | 53,143 |
| Rents | 161,263 | 147,324 | 135,135 |
| Profits of equity method investees | 138,100 | 96,201 | 144,146 |
| Other income | 2,034 | 6,940 | 4,493 |
| Total Income | 431,139 | 350,559 | 418,733 |
| Expenses | | | |
| Interest on loans | (73,088) | (67,593) | (68,900) |
| Trust fees | (999) | (554) | (322) |
| Other expenses | (169,375) | (121,162) | (86,270) |
| Total Expenses | (243,462) | (189,309) | (155,492) |
| Net Income | 187,677 | 161,250 | 263,241 |
| Condensed cash flow | | | |
| Net cash used in operating activities | (258) | (351) | (394) |
| Net cash provided by financing activities | 257 | 334 | 409 |
| Cash and cash equivalents at beginning of year | 1 | 18 | 3 |
| Cash and cash equivalents at end of year | - | 1 | 18 |
The information above are the amounts before inter-company eliminations.
As of December 31, 2019, 2018 and 2017, the profit allocated to non-controlling interest amounted to COP 93,946, COP 78,570 and COP 96,179, respectively.
As of December 31, 2019, 2018 and 2017, the accumulated non-controlling interest of the FCP Fondo Inmobiliario Colombia amounted to COP 1,250,131, COP 1,091,802 and COP 602,548, respectively.
Grupo Agromercantil Holding S.A.
As of December 31, 2019, the portion of ownership in Grupo Agromercantil Holding by the non-controlling interest was 40.00%, which is considered as a significant non-controlling interest for the Bank and its subsidiaries. Guatemala is the principal place of business of GAH and its subsidiaries.
The following table summarizes the assets, liabilities, net assets, net income and cash flows as of December 31, 2019, 2018 and 2017 of GAH:
| | As of December 31, 2019 | As of December 31, 2018 | |
| In millions of COP |
| Assets | 14,333,631 | 13,556,250 | |
| Liabilities | 13,093,981 | 12,209,984 | |
| Equity | 1,239,650 | 1,346,266 | |
| | Year-Ended 2019 | Year-Ended 2018 | Year-Ended 2017 |
| In millions of COP |
| Condensed statement of income |
| Net interest margin and valuation income on financial instruments after impairment on loans and financial leases and off-balance sheet credit instruments | 218,536 | 388,932 | 389,463 |
| Total fees and commission, net | 132,845 | 111,932 | 101,565 |
| Other operating income | 68,288 | 52,286 | 54,246 |
| Dividends received and equity method | 668 | 579 | 608 |
| Total operating income, net | 420,337 | 553,729 | 545,882 |
| Operating expenses | (478,133) | (458,277) | (445,038) |
| Income tax | 19,367 | (15,910) | (21,546) |
| Net income | (38,429) | 79,542 | 79,298 |
| Condensed cash flow |
| Net cash used in operating activities | (62,327) | (66,235) | 192,850 |
| Net cash provided by investing activities | 273,604 | 244,949 | (1,427) |
| Net cash (used in) financing activities | (26,926) | (2,983) | (87,103) |
| Cash and cash equivalents at beginning of year | 1,513,295 | 1,324,893 | 1,098,861 |
| Cash and cash equivalents at end of year | 1,697,646 | 1,500,624 | 1,203,181 |
| Other comprehensive income | | | |
| Investments at fair value through OCI | (3,362) | (6,598) | 2,241 |
| Translation adjustment | 9,281 | 43,803 | 15,758 |
| Others | (8,093) | (3,922) | (3,042) |
| Total other comprehensive income | (2,174) | 33,283 | 14,957 |
For the year 2019, 2018 and 2017, the dividends received from Grupo Agromercantil amounted to COP 31,936, COP 50,341 and COP 39,482, respectively.
| D. | Significant Accounting Policies |
The significant accounting policies that the Bank uses in preparing its consolidated financial statements are detailed below:
| 1. | Functional and presentation currency |
Items included in the financial statements of each of the Bank’s entities are measured using the currency of the primary economic environment in which the entity operates (‘the functional currency’). The consolidated financial statements are presented in Colombian pesos, which is the functional currency for the Parent Company, and the presentation currency for the consolidated financial statements. All transactions and balances in other currency than pesos are considered as foreign currency.
| 2. | Transactions and balances in foreign currency |
Foreign currency transactions are translated into the functional currency using the exchange rates at the dates of the transactions. Foreign exchange gains and losses resulting from the settlement of such transactions and from the translation of monetary assets and liabilities denominated in foreign currencies at period end exchange rates are generally recognized in net income. They are deferred in equity if they relate to qualifying cash flow hedges and qualifying net investment hedges or are attributable to part of the net investment in a foreign operation.
Non-monetary items that are measured at cost are held at the exchange rate at the transaction date, while those which are measured at fair value in a foreign currency are translated using the exchange rates at the date when the fair value was determined. When a gain or loss on a non-monetary item is recognized in Statement of other comprehensive income, any exchange component of that gain or loss is recognized in other comprehensive income. Conversely, when a gain or loss on a non-monetary item is recognized in net income, any exchange component of that gain or loss shall be recognized in net income.
The results and financial position of foreign operations (none of which has the currency of a hyperinflationary economy) that have a functional currency different from the Bank´s presentation currency is translated into the presentation currency as follows:
· Assets and liabilities for each statement of financial position presented are translated at the closing rate at the date of that statement of financial position.
· Income and expenses for each statement of income and statement of other comprehensive income are translated at average exchange rates, and
· All resulting exchange differences are recognized in other comprehensive income in Translation adjustment reserve.
As part of the consolidation process, exchange differences arising from debt securities in issue and the portion of other financial securities designated as hedges of foreign operations that are determined to be an effective hedge, are recognized in other comprehensive income in Translation adjustment reserve. When a foreign operation is sold or any debt securities in issue forming part of the net investment are repaid, the associated exchange differences are reclassified to net income, as part of the gain or loss on sale.
Goodwill and fair value adjustments arising on the acquisition of a foreign operation are treated as assets and liabilities of the foreign operation and translated at the closing exchange rate.
The table below sets forth the exchange rate used by the Bank and its subsidiaries to convert statement of financial position accounts and transactions in U.S. dollar into Colombian pesos:
| | December 31, 2019 | December 31, 2018 | December 31, 2017 |
| Year end exchange rate | 3,277.14 | 3,249.75 | 2,984.00 |
| Average rate for the period ended at | 3,282.39 | 2,956.55 | 2,951.21 |
| 4. | Cash and cash equivalents |
The Bank considers cash and cash equivalents to include cash and balances at banks and central bank, interbank assets and reverse repurchase agreements and other similar secured lending that have original maturities up to 90 days, as shown in Note 4 Cash and cash equivalents.
Security deposits are assets pledged as collateral that correspond to cash guarantees made by the Bank to other financial institutions. The carrying amount is increased when a margin call is issued or when it is necessary to increase the trading quota; conversely, it is decreased when the aim is to lower that quota. The security deposits are recognized as other assets in the consolidated statement of financial position at the amount paid in favor of the counterpart and these assets are not subject to interest recognition.
| 6. | Business combinations and goodwill |
Business combinations are those transactions where an acquirer obtains control of a business (e.g. an acquisition or merger).
Business combinations are accounted for using the acquisition method as follows: a) Identifiable acquired assets, liabilities and contingent liabilities assumed in the acquisition are recognized at fair value at the date of acquisition; b) Acquisition costs are recognized in the consolidated statement of income as expenses in the periods in which the costs are incurred and the services are received; c) and goodwill is recognized as an asset in the consolidated statement of financial position or a gain from a bargain purchase.
The consideration transferred for the acquisition of a subsidiary is the fair value of the assets transferred, the liabilities incurred to the former owners of the acquiree and the equity interests issued by the Bank (If any).
Goodwill is measured as the excess of the sum of the consideration transferred, the value of any non-controlled interest and, when applicable, the fair value of any previous equity interest in the acquired entity, over the net fair value of the acquired assets, liabilities or contingent liabilities assumed at the date of acquisition.
For each business combination, at the date of acquisition, the Bank measures the non-controlling interest by the proportional share of the identifiable assets acquired, as well as liabilities and contingent liabilities assumed by the acquired company, or by their fair value.
Any contingent consideration in a business combination is classified as a liability or as equity and is recognized at fair value at the date of acquisition, the liability is remeasured at subsequent reporting dates in accordance with IAS 37, Provisions, Contingent Liabilities and Contingent Assets, and the consideration classified as equity is not remeasured at subsequent reporting dates and its subsequent settlement is accounted for within equity.
The goodwill acquired in a business combination is allocated, at the date of acquisition, to the Bank's cash-generating units (or group of cash generating units) which are expected to benefit from the combination, regardless of whether other assets or liabilities of the acquiree are assigned to those units or group of units.
For business combinations achieved in stages, any previous equity interest held by the Bank in the acquiree is remeasured at its fair value at the date of acquisition and any resulting gain (or loss) is reported in the consolidated statement of income or other comprehensive income, as appropriate. Amounts related to such investments previously recognized in other comprehensive income that must be recycled through net income are reclassified to the consolidated statement of income, as if such investment had been sold. When the associate had other comprehensive income, which was not reclassified to profit or loss, the amounts were reclassified within equity to retained earnings once the investment was sold.
When the Bank enters into an option contract to acquire totally or partially the amount of shares in a subsidiary held by non-controlling interest, that entitles the non-controlling interest to sell its interest in the subsidiary to the Bank (put option), the Bank analyzes whether the ownership risks and rewards remain with the non-controlling interest or have been transferred to the Bank. The non-controlling interest is recognized to the extent the risks and rewards of ownership of those shares remain with them. Irrespective of whether the non-controlling interest is recognized, a financial liability is recorded for the present value of the redemption amount. Subsequent changes to the liability are recognized in net income. The Bank will reclassify the liability to equity if the put option expires unexercised.
A financial instrument is a contract that gives rise to a financial asset of one entity and a financial liability or equity instrument of another entity.
| 7.1. | Recognition of financial assets and liabilities |
Financial assets and liabilities are recognized in the statement of financial position when the Bank becomes party of the contractual provisions of the instrument. This includes regular way purchases and sales, which are those purchases and sales of financial assets that require the delivery of assets within the time frame established by regulation or convention in the marketplace. The Bank uses settlement date accounting for regular way contracts when recording financial asset transactions.
| 7.2. | Offsetting of financial instruments |
Financial assets and financial liabilities are reported on a net basis on the statement of financial position if and only if (i) there is currently a legally enforceable right to set off the recognized amounts and (ii) there is intention to settle on a net basis, or to realize the asset and settle the liability simultaneously. The Bank does not offset income and expenses, unless required or permitted by an IFRS.
The fair value of all financial assets and liabilities is determined at the statement of financial position date, for recognition or disclosure in the notes to the financial statements.
To determine fair value, characteristics of the asset or liability are taken into account in the same way that market participants would use when pricing the asset or liability at the measurement date; the following items are taken into consideration to assess the estimates:
| · | Based on quoted prices (unadjusted) in active markets for identical assets or liabilities to which the Bank can access at the measurement date (level 1). |
| · | Based on inputs of valuation methodologies commonly used by the market participants, these inputs are other than quoted prices that are observable for the assets or liabilities, either directly or indirectly; considering inputs as quoted prices for similar assets or liabilities in active markets, quoted prices for identical or similar assets or liabilities in markets that are not active, inputs other than quoted prices that are observable for the assets or liabilities like interest rates and yield curves observable at commonly quoted intervals, implied volatilities and credit spreads, and market-corroborated inputs (level 2). |
| · | Based on internal valuation techniques of discounted cash flow and other valuation methodologies, where one or more inputs are unobservable and therefore estimated by the Bank for the assets or liabilities, in the absence of observable inputs (level 3). |
The accounting judgments used in determining fair value relate to matters such as liquidity risk, credit risk and volatility. The changes in estimates related to these factors could affect the recognized fair value of the financial instruments.
In Note 30 Fair Value of assets and liabilities an analysis is provided of the fair values of financial instruments and non-financial assets and liabilities, including further details about the measurement of fair value, hierarchy levels and transfers between levels, if any.
At initial recognition, the Bank measures financial assets at fair value plus, in the case of a financial asset that is not measured at fair value through profit or loss, the transaction costs directly attributable to the acquisition of the financial assets. Financial assets are then classified considering their subsequent measurement at fair value through profit or loss, fair value through OCI or amortized cost on the basis of the business model for managing the financial assets and the contractual cash flow characteristics of the instrument. In addition, for particular investments in equity instruments, in accordance with IFRS 9, the Bank made the irrevocable election to present subsequent changes in fair value in other comprehensive income.
7.4.1 Money market operations
Interbank assets and interbank deposits
These are funds that the Bank lends to other financial institutions or borrows from the Central Bank and other financial institutions. The transactions in an asset position with maturity of up to ninety days are classified as cash equivalents. The operations in an asset position with maturity greater than ninety days and all the operations in a liability position are measured at amortized cost and presented as “Other assets, net” or “interbank deposits”, respectively.
Repurchase agreements and other similar secured transactions
Asset position refers to transactions accounted for as collateralized lending in which the Bank purchases securities with an agreement to resell them back to the seller at a stated price plus interest at a specified date, not exceeding one year. Repos in asset position are initially recognized at the consideration paid and they are subsequently measured at amortized cost. The difference between the purchase value and resale price is recorded in net interest income and accrued over the life of the agreement using the effective interest rate method.
Liability position refers to transactions accounted for as collateralized borrowing in which the Bank sells debt securities with an agreement to repurchase them back from the buyer at a stated price plus interest at a specified date, not exceeding one year.
The securities sold under those agreements are not derecognized from the statement of financial position when the Bank substantially retains all of the risks and rewards of the securities. However, the securities are disclosed as pledged assets. The amounts received are initially recognized, at fair value, as a financial liability and subsequently measured at amortized cost. The difference between the sale value and the repurchase value is treated as interest expense and accrued over the life of the agreement by the effective interest rate method.
7.4.2 Debt and equity securities
Securities at amortized cost
Debt securities are classified at amortized cost only if the asset is maintained within a business model whose objective is to hold it in order to collect contractual cash flows and the contractual terms of the security give rise on specified dates to cash flows that are solely payments of principal and interest on the principal amount outstanding. The subsequent measurement of its interest income is recognized using the effective interest rate method.
The effective interest method is a method used to calculate the amortized cost of an asset and to assign the income or cost in interest during the relevant period. The effective interest rate is the discount rate at which the present value of future estimated cash payments or those received through the expected life of the financial instrument, or, when appropriate, in a shorter time frame, are equal to the net carrying value at the beginning. To calculate the effective interest rate, the Bank estimates cash flows considering all the contractual terms of the financial instrument, including transaction costs and premiums granted minus commissions and discounts, but without considering future credit losses.
Securities at fair value through profit or loss
These are equity securities and debt securities that are not subsequently measured at amortized cost or at fair value through other comprehensive income. The difference between the current fair value and the immediately preceding fair value of the respective security is recorded as a higher or lower value of the asset, affecting the statement of income.
Investments at fair value through other comprehensive income
Investments in debt securities are classified as measured at fair value through other comprehensive income if they are maintained under a business model whose objective is achieved by both obtaining the contractual cash flows and selling the instruments and, in addition, the instruments give rise, on specific dates to cash flows that correspond only to payments of capital and interest on the principal amount outstanding.
Changes in fair value of the investment are recognized in other comprehensive income, except for impairment gains or losses, interest income and foreign exchange gains or losses which are recognized in profit or loss. When the financial asset is written off, the accumulated gain or loss previously recognized in other comprehensive income is reclassified from equity to the statement of income. Interest income from these financial assets is recognized in the statement of income as ‘Interest and valuation on financial instruments’ using the effective interest rate method.
7.4.3 Equity instruments at fair value through other comprehensive income
The Bank has made an irrevocable election to present in other comprehensive income, subsequent changes in fair value of some equity instruments that are not held for trading; dividends from this type of instrument are recognized in net income only when the entity’s right to receive payment of the dividend is established.
7.4.4 Loans and advances to customers and financial institutions, leases and other receivables
These are financial assets that consist primarily of corporate loans, personal loans (including mainly consumer finance and overdrafts), residential mortgage loans and financial leases. The Bank established that loans, advances to customers and other receivables are held within a business model whose objective is to hold them in order to collect contractual cash flows and the contractual terms give rise on specified dates to cash flows that are solely payments of principal and interest on the principal amount outstanding. They are initially measured at fair value, plus transaction costs and origination fees that are directly attributable to the acquisition. They are subsequently measured at amortized cost using the effective interest rate method.
7.4.5 Impairment of financial assets at amortized cost or at fair value through other comprehensive income “FVOCI”
7.4.5.1 Impairment of loans
Applied from January 1, 2018 onwards:
At the end of each period, The Bank assesses the impairment model based on the expected loss of a financial asset or a group of them measured at amortized cost, or at fair value through other comprehensive income, where the impairment loss will be measured from “day 1” after its initial recognition. The model is structured in three phases in which the financial asset can be categorized, from its initial recognition, considering the degree of credit risk and the circumstances that have produced a significant increase in it.
Stage 1
(Initial recognition)
12-month expected credit losses | Stage 2
(Significant increase in credit risk
since initial recognition)
Lifetime expected credit losses | Stage 3
(Credit-impaired assets)
Lifetime expected credit losses |
The expected loss is based on estimates of losses based on reasonable information about past events, present conditions and forecasts about future economic conditions.
The Bank determined that the measurement of impairment of the loan portfolio and financial leasing operations can be made through a collective or individual assessment in accordance with the amount of and characteristics of the loan.
Collective models include parameters of probability of default at 12 months, probability of default throughout the lifetime of the obligation, loss resulting at default, and exposure at default with the inclusion of the prospective criterion. The individual analysis methodology is applied to significant exposures and includes the evaluation of weighted loss scenarios, taking into account the macroeconomic expectations and the particular conditions of each debtor for the future generation of the cash flow.
Significant Increase in Risk
To establish whether an asset presents a significant increase in risk since the initial recognition, the Bank performs an evaluation of quantitative and qualitative factors and reviews for each portfolio the rebuttable presumption of more than 30 days of default. The way in which the Bank determines whether the credit risk of financial instruments has increased significantly since the initial recognition is as follows:
Quantitative Criteria
Lifetime PD assessment: the Bank has defined that the most suitable quantitative way to establish the significant increase in credit risk is by comparing the residual lifetime PD at the initial recognition and the current lifetime PD. In order to measure this difference, two thresholds are defined:
| § | Absolute Threshold: is the absolute difference between the value of the residual lifetime PD at the initial recognition and the current lifetime PD. This threshold determines the value from which a positive absolute variation identifies an increase in the risk of the instrument. |
| § | Relative Threshold: it is a percentage variation between the value of the residual lifetime PD at the initial recognition and the current lifetime PD. This threshold determines the value from which a positive percentage variation identifies an increase in the risk of the instrument. |
In case the comparison of PDs produces the surpassing of one threshold but not of the other, it is not considered that there is a significant increase in the risk for the instrument.
If the instrument does not exceed the threshold, other qualitative criteria are evaluated, which can identify a significant increasecredit risk even when the obligation is very close to expiration, this criteria are the following:
Qualitative Criteria
| § | The assets restructured by risk, where clients experience financial difficulties are classified in Stage 2 and provisioned by lifetime expected credit loss until the instrument is canceled, or cured, or it is transferred to Stage 3 because it fulfills the definition of default. The following table shows the cure period for each portfolio and country for the assets restructured by risk: |
| Country | Portfolio | Months |
| Colombia | SME Commercial | 36 |
| Corporate | - |
| Mortgage | 34 |
| Consumer | 22 |
| Panamá | Consumer | 19 |
| Mortgage | 14 |
| El Salvador | Commercial | 18 |
| Consumer | 18 |
| Mortgage | 34 |
| § | Clients on the watch list with medium risk level. |
| § | The Bank additionally reviews each semester if there are collective criteria for the migration of a group of clients to stage 2, for example, if a significant change has occurred from the origin in a specific product or geographic region or the occurrence of industry events, regulatory, market or any other that is considered a significant event with impact on the generation of future cash flow of the customer's operation. |
Refutable presumption of more than 30 days of default
The Bank has reviewed for each portfolio the presumption of a significant increase in 30 days of default, and finds historical evidence that there is a relationship between this presumption and default, except for Banistmo's mortgage portfolio, where the Bank has refuted the presumption of the rule. The basis for refuting this presumption is that there is reasonable and sustainable information that shows that when the contractual payments are more than 30 days past due, this does not represent a significant increase in the credit risk of a financial instrument, the main causes are:
| § | Banistmo has a percentage of the mortgage portfolio that remains in the delinquency range of 31-60 for operational issues due to the collection of checks (which generate a high operational burden), so that the payment usual practice culture exceeds 30 days, in accordance with IFRS 9.B5.5.20, when a non-payment is an administrative oversight, instead of a financial difficulty of the borrower it is possible to refute this presumption. |
| § | There is no relationship between mortgages whose payments are past due for more than 30 days and the default, since only 19.5% arriving at default. |
In accordance with the previous paragraph, the significant increase in credit risk for Banistmo's mortgage portfolio is defined at 60 days past due.
The following table show the participation for each of the stages. The distribution of stage 2 loans are detailed according to the reasons that represent the significant increase in credit risk.
| Portfolio | Stage 1 | Stage 2 | Stage 3 |
| Threshold | Watch List | Restructured | More Than
30 Days* | Total | |
| Commercial | 87.40% | 26.77% | 66.46% | 3.76% | 3.02% | 4.84% | 7.70% |
| Consumer | 90.25% | 57.62% | 0.59% | 18.36% | 23.43% | 5.05% | 4.70% |
| Mortgage | 89.86% | 71.10% | 0.03% | 6.75% | 22.12% | 5.94% | 4.21% |
| Total Portfolio | 88.37% | 40.93% | 41.00% | 7.42% | 10.66% | 5.04% | 6.55% |
*The significant increase in credit risk for Banistmo's mortgage portfolio is 60 days past due.
Definition of Default
To establish whether an asset is default, the Bank performs an assessment of quantitative and qualitative factors and reviews for each portfolio the rebuttable presumption of more than 90 days of default.
The way in which the Bank determines if there is a breach is the following:
Quantitative criteria:
| § | Clients who present at least one written off loan. |
| § | Clients who present 90 or more days past due. |
Qualitative Criteria:
| § | Clients in special states of restructuring or business reorganization and insolvency agreements. |
| § | Clients on the observation list with high risk level. |
| § | The Bank additionally aligns all the products of the same modality of the client to stage 3 when one of its obligations is in default. |
Refutable presumption of more than 90 days of default
The Bank has reviewed for each portfolio the presumption of default in 90 days of default, and finds historical evidence of high probability of loss in the 90 days, except for Banistmo's mortgage portfolio, where the Bank has refuted the presumption of norm, given that there is historical evidence that the default occurs at 180 days through the analysis of transition matrices, therefore the default for this portfolio is given at 180 days of default.
Measurement of expected credit losses by Collective methodology:
The Quantification of the expected credit losses collectively is done according to: the classification of the stages, the homogeneous groups defined in each type of portfolio and the client’s risk level.
The segmentation of homogeneous groups is carried out by type of client, for individuals it is grouped by product and for companies by industry segments defined from the sales level of the client.
Similarly, the risk level is assigned by type of client, for individuals the risk is measured using a behavioral scoring model for consumer products and a behavioral scoring for housing products, the function of these models is to rank the clients according to risk and thus have a better follow-up with them, the scoring is fed by historical behavior and management variables for each one of the products. In 2019, a new rating system for consumer portfolio in Colombia and Panama was implemented, using Random Forest methodology, these are mathematical models which allows to use a greater number of variables related to the client, and have more precise rating consistent with the level of risk. These methodologies have a fundamental role in the evaluation and monitoring of credit risk.
For companies, the level of risk is measured based on an internal rating model, which uses qualitative and quantitative variables as financial indicators of the client and then ranks client on a scale between 8 and 19 levels. Each country’s rating procedures, in addition to factors of the local market and the knowledge of the client in the market, beyond their financial figures, are involved in this process. In 2019, a new rating model for SME portfolio in Colombia was implemented, using a Random Forest methodology, these are mathematical models which allows to use a greater number of variables related to the client, and have more precise rating consistent with the level of risk. These methodologies have a fundamental role in the evaluation and monitoring of credit risk.
For further details please see Note 31 Risk Management, section: Description of Loans and Financial Leases.
To estimate the expected credit losses (ECL) under the collective methodology the following formula is used:
ECL = Probability of Default * Loss Given Default * Esposure At Default
The factors are estimated using statistical models developed from internal historical information of the entity and then adjusted with forward-looking information as described below:
| · | Probability of Default (PD). Estimated probability of occurrence of a default of an instrument. IFRS 9 proposes the specification of this parameter and its application according to the classification of Stages 1, 2 and 3. |
| o | PD 12 months: Is the estimated probability of occurrence of a default in the next 12 months of the instrument’s life as of the date of analysis. The Bank, according to the standard, defines its use for current portfolio that do not present a significant increase in risk or any evidence of impairment, that is, a portfolio classified in Stage 1. To estimate the probability of default for 12 months, The Bank uses traditional techniques such as logistic regression, modeling the behavior of the portfolio by level of risk for each of the segments. |
| o | Lifetime PD: It is the estimated probability of occurrence of a default over the remaining life of an instrument, being dependent on the conditions of the product and the level of risk. The Bank defines its use for the portfolio with a significant increase in credit risk, that is, classified in Stage 2. The Bank estimates this factor using survival models which propose a statistical analysis to quantify the survival rate of a portfolio for a given period. One of the advantages of the model is the inclusion of censored data within the analysis, that is, those instruments that leave the portfolio during the observation period for various reasons (cancellations, sales, etc.). |
| o | PD Stage 3: The customers evaluated by the collective methodology in Stage 3 have an associated probability of default of 100%. |
| · | Loss Given Default (LGD) The severity or Loss Given Default is the percentage of exposure that the entity ultimately expects to lose in the event of a default in a financial instrument. The general formulation for the calculation of the LGD is = 1- Recovery Percentage, where the recovery percentage refers to the sum of the flows received from the transaction discounted at the rate for the client on the date of analysis on the total of the exposure at the time of default, including contractual debt sales and other recovery strategy. For secured products, this is primarily based on collateral type and projected collateral values, historical discounts to market/book values due to forced sales, the use of appraisals to determine the value of the collateral and time to repossession and recovery costs observed. |
| · | Exposure at default: It is the exposed value of the asset valued at amortized cost (includes the balance of capital, interest and accounts receivable), this is based on the contractual repayments owed by the borrower over a 12month or lifetime basis. |
For revolving products and those with an available quota that is likely to be used in its entirety, the Exposure At Default (EAD) estimate considers the use of the CCF (risk conversion factor), in order to find a relationship corresponding to the used and unused component of the instrument.
To estimate the expected credit losses (ECL) of guarantees and loan commitments it's considered a component of probability of becoming loan.
In order to estimate the expected credit loss life time, the exposed balance is projected annually, taking into account the discount of contractual payments agreed with the client for each year. The discount of the flows is made at the effective interest rate or an approximation of it.
Forward-looking information incorporated in the ECL models
To incorporate the Prospective information to the factors defined for the estimation of the expected loss, The Bank uses methodologies that correlate the historical behavior of the portfolio with certain economic variables. The Bank has made the projection of three macro scenarios (base, pessimistic and optimistic); each scenario has a plausible probability of occurrence to evaluate the best estimate of the expected loss under possible future economic conditions.
To make the projections, the Corporate Economic Research team has defined a process for the generation of estimates under two perspectives: thematic and analytical.
Thematic Perspective: in the first instance, a series of external variables are defined, which are those whose values are established at a global level and in whose definition the idiosyncratic dynamics of the analyzed country have no incidence. As these are issues whose detailed study is beyond the scope of this team, the estimates made by external analysts are taken as reference.
Analytical Perspective: it consists in the compilation of the historical information for the most important economic and financial variables of the country. The information bases are compiled from official sources, which mostly correspond to official authorities, such as the Superintendency or Central Bank of each country. The Bank estimates forecasts based on time series models widely used in econometrics.
As a result, projections are obtained for the economic variables of interest, which are formulated monthly in a time horizon that includes the current year and five subsequent years, after five years, given the technical difficulties and the high uncertainty, the projection of the economic variables for the total remaining useful life of each instrument corresponds to the value of the last projection.
The Bank considers that keeping the projection of the fifth year onwards is the best estimate given that the average of the economic cycle is approximately between 4 and 4.5 years.(referenced by the area of economic research of the Group Bancolombia, taken from the history between 1906 and 2018) 5 years of projection is enough to collect its dynamics, where last year already has the tendency to equilibrium level, which means that at longer horizons can not be justified a different behavior than the stationary situation.
Economic Scenario Weightings
To incorporate not only a perspective, but also to recognize the uncertainty surrounding the short and medium-term economic context that the country will experience, the projection work incorporates three scenarios: base, optimistic and pessimistic.
It is intended that each one of them is based on reasonable expectations and that each has a relevant level of probability associated with it. In other words, we seek to formulate possible, not extreme, scenarios. The projections of the base scenario correspond to the average estimate of the analysts, while for the pessimistic scenario the observation of the 20th percentile is taken and for the optimistic scenario the 80th percentile.
The base scenario corresponds to the one with the highest probability of occurrence and comes directly from the results of the projection models developed for each indicator. This scenario has a weighting of 60%. On the other hand, both the optimistic and the pessimistic scenarios are determined based on the values of the base scenario adjusted according to the standard error of the projections, and each scenario has a weighting of 20%.
The following table sets forth the main macroeconomic variables that are used to incorporate the prospective information and its projections:
| Scenarios Macroeconomic Projections Colombia |
| Base Scenario |
| Year | GDP
growth | Inflation | Repurchase
agreements
rate | Unemployment | Current
Account
Balance | Fiscal
Balance |
| 2017 | 1.44% | 4.09% | 4.75% | 10.62% | -3.35% | -3.66% |
| 2018 | 2.44% | 3.18% | 4.25% | 10.77% | -3.94% | -3.10% |
| 2019 | 3.11% | 3.90% | 4.25% | 11.16% | -4.40% | -2.46% |
| 2020 | 3.27% | 3.50% | 4.50% | 10.80% | -4.50% | -2.57% |
| 2021 | 3.27% | 3.62% | 4.75% | 10.95% | -4.40% | -2.46% |
| 2022 | 3.43% | 3.08% | 4.75% | 10.77% | -4.20% | -2.26% |
| 2023 | 3.49% | 3.23% | 4.50% | 10.73% | -4.05% | -2.05% |
| 2024 | 3.51% | 3.47% | 4.50% | 10.57% | -3.95% | -2.15% |
| Optimistic Scenario |
| Year | GDP
growth | Inflation | Repurchase
agreements
rate | Unemployment | Current
Account
Balance | Fiscal
Balance |
| 2017 | 1.44% | 4.09% | 4.75% | 10.62% | -3.35% | -3.66% |
| 2018 | 2.44% | 3.18% | 4.25% | 10.77% | -3.94% | -3.10% |
| 2019 | 3.28% | 3.50% | 4.25% | 11.06% | -4.10% | -2.20% |
| 2020 | 3.58% | 2.60% | 3.50% | 10.53% | -4.10% | -2.26% |
| 2021 | 3.57% | 2.40% | 3.00% | 10.58% | -4.00% | -1.85% |
| 2022 | 3.73% | 1.90% | 3.00% | 10.26% | -3.85% | -1.64% |
| 2023 | 3.79% | 2.00% | 3.25% | 10.10% | -3.70% | -1.54% |
| 2024 | 3.87% | 2.30% | 3.50% | 9.79% | -3.40% | -1.44% |
| Pessimistic Scenario |
| Year | GDP
growth | Inflation | Repurchase
agreements
rate | Unemployment | Current
Account
Balance | Fiscal
Balance |
| 2017 | 1.44% | 4.09% | 4.75% | 10.62% | -3.35% | -3.66% |
| 2018 | 2.44% | 3.18% | 4.25% | 10.77% | -3.94% | -3.10% |
| 2019 | 3.00% | 4.20% | 4.50% | 11.29% | -4.82% | -2.98% |
| 2020 | 2.89% | 4.30% | 5.25% | 11.01% | -5.00% | -3.18% |
| 2021 | 2.95% | 4.80% | 5.50% | 11.31% | -4.90% | -3.49% |
| 2022 | 3.10% | 4.30% | 5.50% | 11.26% | -4.90% | -3.59% |
| 2023 | 3.14% | 4.40% | 5.50% | 11.37% | -4.70% | -3.59% |
| 2024 | 3.14% | 4.70% | 5.75% | 11.38% | -4.50% | -3.49% |
| Scenarios Macroeconomic Projections Panama |
| Base Scenario |
| Year | GDP
growth | Inflation | Unemployment | Current
Account
Balance | Fiscal
Balance |
| 2017 | 5.33% | 0.48% | 5.85% | -6.01% | -1.90% |
| 2018 | 3.68% | 0.16% | 5.90% | -10.48% | -2.06% |
| 2019 | 3.33% | -0.52% | 6.75% | -9.02% | -3.69% |
| 2020 | 4.19% | 0.70% | 5.91% | -8.25% | -2.50% |
| 2021 | 4.56% | 1.75% | 5.01% | -6.50% | -2.03% |
| 2022 | 5.09% | 2.24% | 4.24% | -5.94% | -1.90% |
| 2023 | 5.00% | 2.40% | 3.59% | -5.94% | -1.90% |
| 2024 | 5.00% | 2.43% | 3.03% | -5.94% | -1.90% |
| Optimistic Scenario |
| Year | GDP
growth | Inflation | Unemployment | Current
Account
Balance | Fiscal Balance |
| 2017 | 5.33% | 0.48% | 5.85% | -6.01% | -1.90% |
| 2018 | 3.68% | 0.16% | 5.90% | -10.48% | -2.06% |
| 2019 | 3.42% | -0.13% | 6.75% | -8.47% | -3.49% |
| 2020 | 4.40% | 1.04% | 5.32% | -7.01% | -2.25% |
| 2021 | 4.78% | 2.63% | 4.50% | -5.53% | -1.62% |
| 2022 | 5.60% | 2.64% | 3.81% | -4.75% | -1.52% |
| 2023 | 5.50% | 2.84% | 3.23% | -4.75% | -1.33% |
| 2024 | 5.50% | 2.87% | 2.73% | -4.75% | -1.33% |
| Pessimistic Scenario |
| Year | GDP
growth | Inflation | Unemployment | Current
Account
Balance | Fiscal
Balance |
| 2017 | 5.33% | 0.48% | 5.85% | -6.01% | -1.90% |
| 2018 | 3.68% | 0.16% | 5.90% | -10.48% | -2.06% |
| 2019 | 3.23% | -0.79% | 6.75% | -9.57% | -3.88% |
| 2020 | 3.99% | 0.49% | 6.50% | -9.48% | -2.75% |
| 2021 | 4.33% | 1.23% | 5.51% | -8.45% | -2.27% |
| 2022 | 4.58% | 1.57% | 4.66% | -7.72% | -2.13% |
| 2023 | 4.50% | 1.68% | 3.94% | -7.72% | -2.19% |
| 2024 | 4.50% | 1.70% | 3.34% | -7.72% | -2.19% |
| Scenarios Macroeconomic Projections El Salvador |
| Base Scenario |
| Year | GDP
growth | Inflation | Current
Account
Balance | Fiscal
Balance |
| 2017 | 2.26% | 2.04% | -1.81% | -2.41% |
| 2018 | 2.54% | 0.40% | -4.75% | -2.46% |
| 2019 | 2.17% | -0.20% | -2.68% | -1.50% |
| 2020 | 2.38% | 0.85% | -3.02% | -3.00% |
| 2021 | 2.38% | 1.24% | -3.07% | -2.67% |
| 2022 | 2.38% | 1.50% | -3.08% | -2.46% |
| 2023 | 2.38% | 1.50% | -3.08% | -2.38% |
| 2024 | 2.38% | 1.50% | -3.08% | -2.38% |
| Optimistic Scenario |
| Year | GDP
growth | Inflation | Current
Account
Balance | Fiscal
Balance |
| 2017 | 2.26% | 2.04% | -1.81% | -2.41% |
| 2018 | 2.54% | 0.40% | -4.75% | -2.46% |
| 2019 | 2.34% | -0.05% | -2.35% | -1.28% |
| 2020 | 2.74% | 1.27% | -2.41% | -2.55% |
| 2021 | 2.74% | 1.86% | -2.46% | -2.27% |
| 2022 | 2.74% | 1.77% | -2.46% | -2.09% |
| 2023 | 2.74% | 1.77% | -2.46% | -2.02% |
| 2024 | 2.74% | 1.77% | -2.46% | -2.02% |
| Pessimistic Scenario |
| Year | GDP
growth | Inflation | Current
Account
Balance | Fiscal
Balance |
| 2017 | 2.27% | 2.04% | -1.81% | -2.41% |
| 2018 | 2.53% | 0.40% | -4,75% | -2.46% |
| 2019 | 1.94% | -0.30% | -3.01% | -1.73% |
| 2020 | 1.90% | 0.59% | -3.62% | -3.45% |
| 2021 | 1.90% | 0.87% | -3.69% | -3.07% |
| 2022 | 1.90% | 1.05% | -3.69% | -2.83% |
| 2023 | 1.90% | 1.05% | -3.69% | -2.73% |
| 2024 | 1.90% | 1.05% | -3.70% | -2.73% |
| Scenarios Macroeconomic Projections Guatemala |
| Base Scenario |
| Year | GDP
growth | Inflation | Repurchase
agreements
rate | Current
Account
Balance | Fiscal
Balance |
| 2017 | 2.76% | 5.68% | 2.75% | 0.23% | -1.21% |
| 2018 | 3.13% | 2.31% | 2.75% | 0.17% | -1.65% |
| 2019 | 3.51% | 3.00% | 2.75% | 0.36% | -1.96% |
| 2020 | 3.50% | 3.33% | 3.00% | 0.33% | -1.93% |
| 2021 | 3.61% | 3.50% | 3.00% | 0.32% | -1.90% |
| 2022 | 3.63% | 4.00% | 3.25% | 0.24% | -1.90% |
| 2023 | 3.61% | 4.00% | 3.50% | 0.21% | -1.91% |
| 2024 | 3.61% | 4.00% | 3.50% | 0.23% | -1.86% |
| Optimistic Scenario |
| Year | GDP
growth | Inflation | Repurchase
agreements
rate | Current
Account
Balance | Fiscal
Balance |
| 2017 | 2.76% | 5.68% | 2.75% | 0.23% | -1.21% |
| 2018 | 3.13% | 2.31% | 2.75% | 0.17% | -1.65% |
| 2019 | 3.69% | 3.36% | 3.00% | 0.43% | -1.81% |
| 2020 | 3.85% | 3.73% | 3.25% | 0.50% | -1.64% |
| 2021 | 3.97% | 3.92% | 3.25% | 0.48% | -1.62% |
| 2022 | 4.00% | 4.48% | 3.50% | 0.36% | -1.62% |
| 2023 | 3.97% | 4.48% | 3.75% | 0.40% | -1.63% |
| 2024 | 3.97% | 4.48% | 3.75% | 0.40% | -1.58% |
| Pessimistic Scenario |
| Year | GDP
growth | Inflation | Repurchase
agreements
rate | Current
Account
Balance | Fiscal
Balance |
| 2017 | 2.76% | 5.68% | 2.75% | 0.23% | -1.21% |
| 2018 | 3.13% | 2.31% | 2.75% | 0.17% | -1.65% |
| 2019 | 3.33% | 2.55% | 2.50% | 0.30% | -2.11% |
| 2020 | 3.15% | 2.83% | 2.75% | 0.17% | -2.21% |
| 2021 | 3.25% | 2.98% | 2.75% | 0.16% | -2.19% |
| 2022 | 3.27% | 3.40% | 3.00% | 0.10% | -2.19% |
| 2023 | 3.24% | 3.40% | 3.25% | 0.00% | -2.20% |
| 2024 | 3.25% | 3.40% | 3.25% | 0.00% | -2.14% |
Special methodologies applied in Stage 3
Collateral Methodology
For defaulted loans (stage 3) when it is determined that the fundamental source of collection of the loan is a guarantee, the amount of the loss is estimated as the balance owed less the weighted net present value of the market value of the collateral, estimated through appraisals with an age no longer than one year, less the costs of obtaining and selling the collateral, and affected by several macroeconomic scenarios with an expected probability of occurrence that result in a weighted expected loss.
Individual Methodology:
The Bank will individually evaluate defaulted loans (stage 3) more than COP 15,000 (US 5 for foreign subsidiaries), analyzing the debt profile of each debtor, the guarantees granted and information on the credit behavior of the client and of the sector. Significant financial assets are considered in default when, based on current or past information and events, it is probable that the entity will not be able to recover all the amounts described in the original contract, including the interest and commissions agreed to in the contract. When a significant financial asset has been identified as being in default, the amount of the loss is measured as the balance due minus the weighted net present value of the expected future cash flows under two minimum macroeconomic scenarios with an expected probability of occurrence.
Customers classified as individual NPV will be evaluated at least twice a year and additionally each time a relevant event occurs that is reflected in significant changes in their level of risk and that leads to a change in the scenarios previously analyzed, the relevant events can be:
| § | Significant changes in the value of the guarantee |
| § | Expected or adverse changes in the business |
| § | Potentially significant regulatory changes for the business |
| § | Changes they make in their commercial and operational dynamics |
| § | Significant amount payments made by the client. |
To establish the future cash flows expected from the client, two approaches are presented, which may be via cash flow generation or via execution of some type of guarantee or liquidation of assets, that is, “Going Concern” or “Gone Concern” approach.
Approach via Cash Flow: It refers to an analysis under the premise of "GOING CONCERN", that is, it is considered that the payment of the obligation will be made through the client's cash flow. The expected NPV calculation with a cash flow approach includes:
| · | Financial projections of the client. |
| · | Expected NPV calculation. |
Approach via Guarantee Recovery: It refers to the "GONE CONCERN", it is considered that the payment of the obligation will be given through the execution of guarantees, liquidation of assets, the execution of personal guarantees / Guarantees and adjudication of assets through judicial processes. The calculation of the NPV with guarantee approach should include:
| · | Analysis of the guarantee. |
| · | Future value of the guarantee. |
| | · | Calculation of NPV. |
Future cash flows are estimated based on two scenarios (base and alternative) that can be affected by the aforementioned variables.
Accounting policy applied until December 31, 2017 (IAS 39, 2011):
The Bank individually reviews impaired loans with balances greater than COP 5,000 (USD 1.5 for foreign subsidiaries), analyzing the debt profile of each debtor, the guarantees granted and information on the credit behavior in the sector. Significant financial assets are considered impaired when, based on current
or past information and events, it is probable that the Bank will not be able to recover the amounts described in the original contract, including the interests and commissions agreed upon in the contract.
When a significant financial asset has been identified as impaired, the amount of the loss is measured as the balance due minus the current net value of the estimated future cash flows. To estimate these flows, basic projected hypotheses are used based on qualitative analysis and backed up by information obtained from the Special Client Administration Committee as well as approvals made with Commerce Managers.
When it is determined that a fundamental source of credit collection is a guarantee, the amount of loss is estimated as the balance due minus the fair value of the guarantee minus the estimated selling costs.
For credits that are not considered individually significant and for the portfolio of individually significant credits that are not considered impaired, a collective evaluation is carried out. Portfolios of financial assets with similar characteristics are grouped, using statistical techniques based on the analysis of historical losses to determine an estimated percentage of losses that have been incurred by those assets on the balance date. The percentages of historical losses used in the process are updated to incorporate the most recent data of the current economic conditions, the performance trends by industry or region, or the concentration of obligations in each portfolio of financial assets by segment, and any other relevant information that may affect the provision of loss estimate for financial assets.
The financial assets are removed from the balance from the provision when they are considered non-recoverable. The recoveries of financial assets previously discounted are recorded as an increase in the provision.
Quantification of the losses incurred takes into account three fundamental factors: exposure at default, the probability of default and the loss caused by default:
| · | Exposure at default: It is understood as the exposed balance of assets to the current capital balance, interest and accounts receivable. In the case of products whose nature is revolving and that have an available quota that is susceptible to be used in its entirety according to loan contracts subscribed with clients, this parameter indicates over-use which can be incurred in the event of client default. |
| · | Probability of default (PD): This is the probability that the debtor fails to fulfill their obligations of capital and/or interest payment over a period of twelve months. This is linked to the rating/scoring of each debtor/operation. |
A hybrid model is used to estimate the probabilities of defaulting based on a through-the-cycle defaulting probability model, and then these probabilities are changed using the following parameters:
– The LIP (Loss identification Period) parameter changes the probability of defaulting to losses incurred. LIP is the time between the moment of an event that causes a loss and the moment when that loss becomes significant on an individual level. The analysis of LIPs is made based on homogeneous risk portfolios.
– Macroeconomic adjustment: this parameter converts the through-the-cycle (TTC) defaulting probability model into a point-in-time (PIT) model, using an adjustment that reflects the effect of the current conditions. Given that defaulting probability is estimated using a database that contains precedents of historical losses in a complete economic cycle, the macroeconomic adjustment allows suppression of effects from the conditions of the historical period that no longer exist.
In the specific case of default assets, the allocated probability of default is 100%. The classification of an asset as “default” is made because of a non-payment of 90 days or more (180 days for the Banistmo mortgage portfolio), as well as in cases that there is no non-payment, but where there are doubts about the solvency of the debtor.
Loss given default (LGD): This is defined as the economic impairment in which the entity would incur in the event of any instance of default. This depends mainly upon the characteristics of the debtor and upon the valuation of guarantees or collateral associated with the operation.
Once a debt or collection of debts is classed as impaired, the interest revenues are still accounted for using the applicable rate of interest for the discount for future cashflows in order to measure loss due to depreciation.
7.4.5.2 Investment Impairment:
Applied from January 1, 2018 onwards:
Investments are classified in stages according to the risk level (rating) as follows:
Stage 1:
| § | Investments rated at investment grade. |
| § | Investments rated at speculative grade if: |
| · | The current external rating is maintained or improved against the rating granted on the date of purchase. |
| · | If there is a deterioration of the rating by fewer notches than those that determine a significant increase in risk. |
Stage 2:
| § | Investments that pass from an investment grade rating to speculative level. |
| § | If there is a deterioration of rating in the notches that determine a significant increase in risk. |
Stage 3:
| § | Investments that are classified as default. |
Significant Increase in Risk
Investments classified in stage 2, include those instruments that meet the corporate definition of a significant increase in risk. To establish whether a security has a significant increase in risk since the initial recognition, an assessment of the deterioration of the rating as of the current date is made against the rating granted at the time of purchase, according to the original classification there may be an increase with 1, 2 or 3 notches as shown in the following table:
| ORIGINAL EXTERNAL RATING | SIGNIFICANT INCREASE IN
RISK |
| Ba1/BB+ | 3 Notches |
| Ba2/BB | 3 Notches |
| Ba3/BB- | 3 Notches |
| B1/B+ | 2 Notches |
| B2/B | 2 Notches |
| B3/B- | 1 Notch |
| Caa/CCC | 1 Notch |
Measurement of expected losses:
[Amortized Cost or Market Position (Exposure)] * PD (Probability of default) * LGD (Loss given default)
| § | All instruments classified in Stage 1 will be assigned a default probability for 12 months. |
| § | All instruments classified in Stage 2 will be assigned a probability of default for the life of the instrument. |
| § | All instruments classified in Stage 3 will be assigned a default probability of 100%. |
To estimate the impairment of the instruments if the issue has an external rating, provision is made with the PD (Probability of default) of the external rating agency, if it does not have an external rating, it is provided with the internal rating model and the default probability of the portfolio.
In all cases, the LGD (Loss given default) is the parameter calculated by Moody´s for the non-secured bonds.
7.4.6 Restructured financial assets
Loan restructuring is an alternative to achieve a proper collection management. It must be understood as a resource of atypical use to standardize the behavior of a portfolio, using a new contractual agreement between the parties. Such agreement aims to modify the originally established conditions in order to allow the proper attention to the loan in the light of the real or potential impairment in the debtor’s payment ability. The loan restructuring is implemented through amendments to the contractual terms, rates and payment terms. In any case, at the restructuring time, all the collateral must be preserved and if possible, the Bank’s position should be improved by obtaining new guarantees or guarantors that support the obligations.
In the restructuring, real and personal property can be received as foreclosed assets to cancel partially the obligations. Likewise, the Bank can grant discounts on interest or other related receivables. If necessary, the discount can be applied to loan principal, either because the guarantees or payment sources do not fully cover the total loan or because the agreement does not permit full recovery of the total balance. The terms are reviewed in each negotiation to determine if the client should continue in the portfolio and if so, the terms to restore the business relationship after a certain time.
A loan that is renegotiated is derecognized if the existing agreement is cancelled and a new agreement made on substantially different terms or if the terms of an existing agreement are modified such that the renegotiated loan is a substantially different instrument. Where such loans are derecognized, the renegotiated contract is a new loan and impairment is assessed in accordance with the Bank accounting policy. Where such loans are not derecognized, impairment continues to be assessed for significant increases in credit risk compared to the credit risk rating at the time the loan was originated.
If as a result of restructuring, the financial asset is derecognized, costs and fees are recognized in net income, as well the difference between the value in the balance sheet and the consideration received. In the case in which the modified financial asset is not derecognized, the costs and fees are deferred and will be amortized by the remaining life of the modified asset. The amount of the modified asset is recalculated, and the effect of the modification is recognized in profit or loss.
Before the commencement of the restructuring process, the Bank should perform an analysis of the debtor’s projected cash flow in order to evaluate the capacity to pay the proposed plan. Restructuring loans are classified as follows:
Private Agreement
These are restructuring based on agreement with the client resulting from negotiations between the two parties, without any legal special scheme adopted by the debtor.
Regulated by the law agreements
These are restructurings that result from legal bankruptcy and insolvency procedures or corporate restructuring agreements entered into by the client.
7.4.7 Leasing
7.4.7.1 The Bank as lessee
Application since January 1, 2019:
On entering a new lease contract, the Bank recognizes a right of use asset and a liability. Both the right-of-use asset and the lease liability are measured at the present value of the remaining lease payments, discounted using the lessee’s incremental borrowing rate. Additionally, the right-of-use asset includes 1) the amount of the initial measurement of the lease liability; 2) lease payments made or cost incurred by the lessee at or before the commencement date, less any lease incentives received 3) costs to be incurred in dismantling and removing the underlying asset, restoring the site on which it is located or restoring the underlying asset to the condition required.
Subsequently, the Bank measures the right of use asset at cost less any accumulated depreciation and any accumulated impairment losses; and adjusted for any remeasurement of the lease liability. The Bank measures the lease liability by increasing the carrying amount to reflect interest on the lease liability; reducing the carrying amount to reflect the lease payments made; and remeasuring the carrying amount to reflect any new expectation or lease modifications. Each lease payment has been allocated between the liability and interest expenses. The accrued interest on the lease liability for each period over the lease term will be the amount that produces a constant periodic rate of interest (incremental borrowing rate) on the remaining balance of the liability for each period.
The Bank does not recognize right of use assets and lease liabilities for 1) leases for a period of less than 12 months that do not contain a purchase option; and 2) leases in which the underlying asset is of low value. The lease payments related to these exemptions are recognized as an expense in the Consolidated Statement of Operations on a straight-line basis over the lease term.
Accounting policy applied until December 31, 2018:
The assets taken for lease under financial leases are recognized at the lower of the fair value of the leased assets and the present value of the minimum lease payments. Such assets are recognized as premises and equipment in the statement of financial position.
The assets leased under financial leases are depreciated throughout their life using the straight-line method. However, if there is no reasonable certainty that the Bank will obtain the property at the end of the lease term, the asset is depreciated throughout its life or the lease term, whichever is shorter. The lease payments are divided between interest and debt reduction. The finance charges are recorded in the consolidated statement of income.
The payments for operating leases are recognized on a straight-line basis over the term of the lease as expenses in the statement of income during the lease term. Lease incentives received are recognized as an integral part of the total lease expenses over the term of the lease.
7.4.7.2 The Bank as lessor
The lease agreements entered into by the Bank are classified at the initial recognition as financial or operating leases.
The Bank classifies a lease as a financial lease when according to the agreement substantially all the inherent risks and benefits are transferred to the lessee. Financial leases are recognized as the sum of the minimum payments to be received and any unguaranteed residual value, discounted at the lease interest rate. Otherwise, the lease is classified as an operating lease, which is classified in the statement of financial position as premises and equipment. The initial direct costs incurred in the negotiation of an operating lease are added to the carrying value of the leased assets and recorded as a cost during the lease term on the same basis as the lease income. The contingent rents of the leases are recorded as income in the period in which they are obtained.
Among the risks transferred are the possibilities of losses through underutilization, technological obsolescence, decrease in profitability or changes in the economic environment. Among the benefits derived from the use are the expectation of profit over the economic life of the asset and eventually, the appreciation of the changes of its residual value or realization of the asset.
The following are indications of transfer of risk and rewards of ownership to the lessee:
| · | The agreement indicates that the lessee has the option to purchase the asset at a price that is expected to be equal to or less than 10% of the fair value of the asset upon termination of the lease. |
| · | The term of the lease covers most of the economic life of the asset even when the lease does not transfer the ownership of the underlying asset to the lessee at the end of the lease term, i.e. when the minimum lease term represents 75% or more of the economic life of the leased asset. |
| · | At the inception of the lease, the present value of the minimum lease payments amounts to at least 90% of the fair value of the leased asset. |
| · | The leased assets are of such a specialized nature that only the lessee has the possibility of using them without making significant modifications. |
If during the lease term, the lessor and the lessee decide to modify the initial conditions, and the agreed changes result in a different classification, then the modified agreement will be considered a new lease with new clauses that will lead to the classification of a financial or operating lease, as appropriate.
7.5. Financial liabilities
At initial recognition, the Bank measures its financial liabilities at fair value. The transaction costs that are directly attributable to the financial liability are deducted from its fair value if the instruments are subsequently recognized at amortized cost or will be recognized in the statement of income if the liabilities are measured at fair value.
Derivative liabilities are measured at fair value through profit and loss and the gains or losses of those liabilities are recognized in the statement of income for subsequent measurements. Non-derivative financial liabilities are measured at amortized cost using the effective interest rate. Interest expenses are recognized in the statement of income unless the financial liability is designated as at fair value through profit or loss, for which is required to present the effects of changes in the liability’s credit risk in other comprehensive income.
7.5.1 Compound instruments
Compound financial instruments that comprise both a liability and equity component must be separated and accounted for separately. Therefore, for initial measurement, the liability component is the fair value of a similar liability which doesn´t have an equity component (determined by discounting future cash flows using the market rate at the date of the issuance). The difference between the fair value of the liability component and the fair value of the compound financial instrument considered as a whole is the residual value assigned to the equity component. Subsequent to initial recognition, the liability component of a compound financial instrument is measured at amortized cost using the effective interest method. The equity component of a compound financial instrument is not re-measured subsequent to initial recognition. The liability component corresponds to the preferred dividend related to 1% of the subscription price, which is the payment of the minimum dividend on the preferred shares for each period in accordance with the Bank’s bylaws.
7.5.2 Financial guarantee contracts and loan commitments
In order to meet the needs of its customers, the Bank issues financial standby letters of credit, bank guarantees and loan commitments. Loan commitments are those agreements under which the bank has an irrevocable obligation to grant the loan. The financial guarantee contracts issued by the Bank are contracts that require the issuer to make specified payments to reimburse the holder for a loss it incurs because a specified debtor fails to make payment when due to accordance with the original or modified terms of a debt instrument.
Both financial guarantee contracts and loan commitments are initially recognized as liabilities at fair value, which is normally the fee received, adjusted for the directly attributable transaction costs incurred. Subsequently, liabilities are measured at the higher of the provision amount measured according to IFRS 9 Financial instruments and the amount initially recognized, less the accumulated amortization recognized according IFRS 15 - Revenue from contracts with customers.
Income derived from guarantees is recognized as fees and commission income in the statement of income over the term of the contract.
7.6 Derecognition of financial assets and liabilities
Financial assets are derecognized when the rights to receive cash flows from the financial assets have expired or have been transferred and the Bank has transferred substantially all the risks and rewards of ownership or in which the Bank neither transfers nor retains substantially all of the risks and rewards of ownership and it does not retain control of the financial asset.
On derecognition of a financial asset, the difference between: (a) the carrying amount (measured at the date of derecognition) and (b) the consideration received (including any new asset obtained less any new liability assumed) is recognized in net income.
In transactions in which the Bank neither transfers nor retains substantially all the risks and rewards of ownership of a financial asset, the Bank continues to recognize the asset to the extent of its continuing involvement, determined by the extent to which it is exposed to changes in the value of the transferred financial asset.
A financial liability is removed from the statement of financial position when it is extinguished, that is when the obligation is discharged, cancelled or expired.
Debt exchange
The Bank assesses whether the instruments subject to exchange are substantially different from each other, considering qualitative aspects such as currencies, terms, rates, conditions of subordination, regulatory framework, among others; and quantitative aspects, including whether the present value of discounted cash flows under the conditions of the new instruments (including any commission paid net of any commission received) and using the original effective interest rate to calculate the discount, is at least 10 percent different from the discounted present value of the cash flows that still remain of the original financial liability.
When it is determined that the instruments subject to debt exchange are not substantially different, the transaction is recognized as a debt modification. In this case, the amortized cost of the modified liability is adjusted to the present value of the estimated contractual cash flows which are discounted at the original effective interest rate of the financial instrument and a gain or loss is recognized immediately in profit or loss. Incremental costs and commissions adjust the carrying amount of the liability and are amortized over the remaining life of the modified liability; its subsequent measurement continues at amortized cost. In debt exchanges where the new instrument is considered substantially different, the liability is derecognized with charged to the income statement, and a new financial liability arises.
7.6.1 Written-Off loan portfolio
Loans are written off when the Bank concludes there is no realistic expectation of recovery of the loans and receivables balances from a client or third party. In general, this characteristic will be fulfilled when the following delinquency conditions are present:
| Type | Length of delinquency |
| Consumer | 180 days, 450 days for vehicles in GAH, 720 days for loans with mortgage guarantee in Banco Agricola |
| Commercial | 360 days |
| Small Business Loan | 180 days, 720 days for loans with guarantee in Banistmo |
| Mortgage | For Banistmo and Banco Agrícola from 720 days. GAH 1440 days. |
Among the reasons underlying a loan's non-recoverability are the estimated recovery time of the obligation and the probable recovery percentage given the existence or lack of collateral. When default conditions are present, it is initially necessary to evaluate whether the collateral that support the loan generate a reasonable expectation of recovery; if so, the necessary steps are taken to realize on the collateral prior to writing-off the loan. In cases where the collateral net fair value indicates that there are no reasonable expectations of recovery, loans are written-off in the financial statements.
7.7. Derivatives financial instruments
A financial derivative is an instrument whose value changes in response to changes in a variable such as an interest rate, exchange rate, the price of a financial instrument, a credit rating or a credit index. This instrument requires no initial payment, or a smaller investment than would be required for other financial instruments with a similar response to changes in market conditions, and it is generally settled at a future date.
The Bank carries out derivative transactions to facilitate the business of clients related to the management of their market and credit risk; managing the exposure in its own position to changes in interest rates and risks in exchange rates; or to obtain benefits from changes in valuations experienced by these instruments in the market. Derivatives are recognized and measured at fair value through profit or loss, unless such derivatives are designated as hedging instruments in cash flow hedges or as a hedge of a net investment in a foreign operation. In those cases, the effective portion of changes in the fair value of the derivatives are recognized in other comprehensive income. All derivatives are carried as assets when fair value is positive and as liabilities when fair value is negative.
7.7.1 Hedge accounting
Accounting policy applied from January 01, 2019:
Fair value hedges are used by the Bank, through its Panamanian subsidiary, Banistmo, to protect against changes in the fair value of investment securities that are attributable to interest rate variability. Cash flow hedges are used mainly to reduce the variability in cash flows of deposits issued by the Parent Company and the changes in fair value of the Parent’s investment portfolio caused by interest rate changes. The Bank applied the hedge accounting provisions required by IFRS 9 prospectively and assessed that all qualifying criteria under IFRS 9 were met at the date when it ceased to apply hedge requirements of IAS 39. When the hedging relationship is considered to be highly effective, the changes in value of the hedging derivative are accounted for according to their classification as fair value hedges, cash flow hedges and hedges of net investment in foreign operations, as set out in the paragraph below.
The Bank assesses at the inception of the hedge and on a monthly basis during the life of the instrument, whether the hedge used in the transaction is expected to be aligned with the hedge effectiveness requirement (prospective effectiveness):
| • | Economic relationship between the hedging instrument and the hedged item. |
| • | The effect of credit risk does not predominate over the value of the economic relationship. |
| • | Designated hedge ratio is consistent with risk management strategy. |
The Bank discontinues the hedge accounting when the hedging relationship no longer meets the criteria provided for the hedge effectiveness requirements or when the hedging instrument expires or is sold, terminated or exercised. Consequently, the item no longer complies with the hedge accounting conditions or the hedging relationship no longer complies with the risk management objective. When hedge accounting for a fair value hedge is terminated the previous adjustments related to the changes in fair value of the hedged item are subsequently recorded in the consolidated statement of income in the same manner as other components of the carrying amount of that asset. When hedge accounting for a cash flow hedge is terminated the accumulated gains and losses recorded in equity will be reclassified to the Statement of Income in the same period or periods during which the hedged expected future cash flows are realized.
Before the establishment of the hedge accounting, the Bank documents the relationship between hedged items and hedging instruments, as well as its risk management objectives and hedging strategies, which are approved by the Risk Management Committee as the body designated by the Board of Directors.
Hedge relationships are classified and accounted for in the following way:
Fair value hedgesare designated to protect against the exposure to changes in the fair value of recognized assets or liabilities or unrecognized firm commitments.
Changes in the fair value of derivatives that are designated and qualify as hedging instruments in fair value hedges are recognized in the statement of income as interest and valuation on financial instruments. The change in fair value of the hedged item attributable to the hedged risk is included as part of the carrying value of the hedged item, and it is also recognized in the aforementioned item of statement of income.
For fair value hedges that are related to items accounted for at amortized cost, the adjustments to the carrying value are amortized through the statement of income during the remaining term until their expiry.
The amortization of the effective interest rate shall begin as long as there is an adjustment to the carrying value of the hedged item and shall begin no later than when the hedged item ceases to be adjusted for changes in its fair value attributable to the risk being hedged. The adjustment is based on a recalculated effective interest rate at the date amortization begins. If the hedged item is derecognized, the non-amortized fair value is recognized immediately in the statement of income. If the hedge instrument expires or it is sold, terminated or exercised, or when the hedge no longer meets the criteria for hedge accounting, the Bank discontinues prospectively the hedge accounting. For the items hedged at amortized cost, the difference between the carrying value of the item hedged at the termination of the hedge and the nominal value are amortized using the effective rate method during the time beyond the original terms of the hedge. If the hedged item is derecognized, the remaining value to amortize is recognized immediately in the statement of income.
When an unrecognized firm commitment is designated as a hedged item, the subsequent cumulative change in the fair value of the firm commitment attributable to the hedged risk is recognized as an asset or liability with corresponding gain or loss recognized in net income.
Cash flow hedges are used mainly to manage the exposure to variability related to the cash flow attributable to a specific risk associated with an asset or liability recognized on statement of financial position or to a highly probable forecast transaction.
The portion of the gain or loss on the hedging instrument that is determined to be an effective hedge is recognized in other comprehensive income. The ineffective portion of the gain or loss on the hedging instrument is recognized in the statement of income.
If the hedging instrument expires or is sold, terminated or exercised, without replacement or rollover into another hedging instrument, or if the hedging designation no longer meets the criteria provided for the hedge effectiveness requirements after any subsequent rebalancing adjustment, any accumulated gain or loss previously recognized in OCI remains in OCI, until the planned operation or the firm commitment affects the result.
The Bank ceases hedge accounting when the hedging relationship ceases to meet the objective of managing the hedged risk when the hedging instrument expires or is sold, terminated, or exercised, or when no longer qualifies for hedge accounting. Any gain or loss recognized in other comprehensive income and accumulated in equity at that time remains in equity and is recognized in other comprehensive income when the forecast transaction is ultimately recognized in net income. When a forecasted transaction is no longer expected to occur, the gain or loss accumulated in equity is recognized immediately in net income.
– Hedges of a net investment in a foreign operation: In accordance with IFRS 9 ‘Financial instruments’ and IFRIC 16 ‘Hedges of a net investment in a foreign operation’, the Bank has decided to apply the hedge accounting of the foreign currency risk arising from currency translation of financial statements and goodwill of its net investment in Banistmo, designating as a hedging instrument of certain debt securities issued by the Parent Company. The hedge accounting requires that the Bank accounts for the gain or loss derived from the foreign exchange differences related to the debt securities that is determined to be an effective hedge is recognized in other comprehensive income, as is the currency translation adjustment of the Banistmo operation into the presentation currency as required by IAS 21 as detailed in 2. Transactions and balances in foreign currency.
Accounting policy applied until December 31, 2018:
The Bank assesses at the inception of the hedge and on a monthly basis during the life of the instrument, whether the hedge used in the transaction is expected to be highly effective (prospective effectiveness) and considers the actual effectiveness of the hedge on an ongoing basis (retrospective effectiveness). The Bank discontinues the hedge accounting when the hedging instrument expires or is sold, terminated or exercised, the hedge no longer meets the criteria for hedge accounting or if hedge designation is revoked. When hedge accounting for a fair value hedge is terminated the previous adjustments related to the changes in fair value of the hedged item are subsequently recorded in the consolidated statement of income in the same manner as other components of the carrying amount of that asset.
8. Premises and equipment
Premises and equipment include tangible items that are held for use, for rental to others, or for administrative purposes and are expected to be used for more than one period.
Items of premises and equipment are expressed at cost less accumulated depreciation and impairment losses. Depreciation is calculated using the straight-line method, in order to derecognize the depreciable amount of promises and equipment over the estimated useful lives of the assets. The depreciable amount is the cost of an asset less its residual value. The estimated useful lives for each asset group are:
| Asset group | Useful life range |
| Buildings | 10 to 75 years |
| Furniture and fixtures | 5 to 20 years |
| Computer equipment | 3 to 20 years |
| Equipment and machinery | 3 to 40 years |
| Vehicles | 3 to 6 years |
The assets’ residual values and useful lives are reviewed, and adjusted if appropriate, at the end of each reporting period. When there is a significant change, the depreciation and the charge to the statement of income are adjusted based on the new estimation.
The Bank assess at the end of each year whether there is any indication of external or internal reduction in the asset’s recoverable value. If there is any indication of impairment, the Bank estimates the recoverable amount of the assets and then recognizes the impairment loss in the consolidated statement of income.
An impairment loss is recognized for the amount by which the asset’s carrying amount exceeds its recoverable amount and is recognized in the statement of income as ‘impairment, depreciation and amortization’.
When the carrying value exceeds the recoverable value, the carrying value is adjusted to its recoverable value, modifying the future charges for depreciation, according to its new remaining useful life.
In a similar way, when indications exist that the value of an asset has been recovered, reversal of an impairment loss is recognized immediately in the statement of income and consequently the future charges for the asset’s depreciation are adjusted. In any case, the reversal of the impairment loss of assets cannot increase it carrying value above the amount that it would have if impairment losses in previous periods had not been recognized.
For the purposes of assessing impairment, assets are grouped at the smallest identifiable group that generates cash inflows that are largely independent of the cash inflows from other assets or groups of assets (cash-generating units). The evaluation can be carried out at individual asset level when the fair value less the cost of sale can be reliably determined and the value in use is estimated to be close to its fair value less costs to sell and fair value less costs to sell can be determined.
Maintenance expenses of the premises and equipment are recognized as an expense in the period in which they are incurred and are registered in the consolidated statement of income asadministrative and general expenses.
Gains and losses in the sale of premises and equipment are registered in the consolidated statement of income asother operating incomeorother expenses.
9. Investment properties
Land and buildings that the Bank holds to earn rentals or for capital appreciation or both rather than for their use in the supply of services or sale in the ordinary course of business are recognized as investment properties.
The investment properties are measured initially at cost, including the transaction costs. The carrying value includes the cost of replacement or substitution of a part of an investment property at the time the cost is incurred, if the cost meets the recognition criteria; and it excludes the daily maintenance costs of the investment property which are included in the statement of income as “Other operating expenses”.
After the initial recognition, the investment properties are measured at fair value which reflects the market conditions at the statement of financial position date. The gains and losses that arise from changes in the fair values of investment properties are included in the statement of income as ‘Other operating income’.
The investment properties are derecognized, either at the moment of their disposal or when they are permanently withdrawn from use and no future economic benefits are expected. The difference between the net disposal proceeds of the investment properties and the carrying value is recognized in net income in the period the disposal occurs.
Transfers of an asset to or from the investment properties are only made when there is a change in its use. For a transfer from an investment property to premises and equipment, the cost taken into account for its subsequent accounting is the fair value at the time of the change in use. If a premise and equipment becomes an investment property, it will be accounted for at its fair value.
10. Intangible assets
An intangible asset is an identifiable non-monetary asset with no physical appearance. Separately acquired intangible assets are measured initially at their cost. The cost of intangible assets acquired in business combinations is their fair value at the date of acquisition. After the initial recognition, the intangible assets are accounted for at cost less any accumulated amortization and any accumulated impairment loss. The costs of internally generated intangible assets, excluding the costs from development that meet the recognition criteria, are not capitalized and the expense is reflected in the statement of income as it is incurred.
The useful lives of intangible assets are determined as finite or indefinite. The intangible assets with finite useful lives are amortized using the straight-line method over their estimated useful lives. The amortization period and the amortization method for intangible assets with a finite useful life are reviewed at least annually. The expected changes in the useful life or in the pattern of consumption of the future economic benefits of the asset are accounted for when changing the period or amortization method, as appropriate, and they are treated as changes in the accounting estimates. The amortization expense of intangible assets with finite useful lives is recognized in the statement of income. The useful lives of the intangible assets with finite life ranges between 1 and 10 years.
The Bank assesses annually its intangible assets with finite life in order to identify whether any indications of impairment exist, as well as possible reversal of previous impairment losses.
Intangible assets with indefinite useful lives are not subject to amortization but are periodically tested in order to identify any impairment, either individually or at the cash-generating unit level. The assessment of the indefinite life is reviewed annually to determine if it continues being supportable. In the event that the assessment was not valid, the change from indefinite useful life to finite useful life is recognized prospectively.
The gain or loss that arises when an intangible asset is derecognized are measured as the difference between the disposal value and the carrying value of the asset and is recognized in the statement of income.
The Bank’s intangible assets comprise mainly intangibles of finite useful life: licenses, software and computer applications, client relationships and the legal stability agreement signed with the Ministry of Finance and Public Credit (See Note 9 Goodwill and intangible assets, net), customer relationships and patents. Intangibles of indefinite useful life include Goodwill.
10.1 Research and development costs
The research costs are recorded as expenses as they are incurred.
Costs directly related to the development of a stand-alone project are recognized as intangible assets when the following criteria are met:
| · | It is technically feasible of to complete the intangible asset so that it will be available for use or sale; |
| · | Management intends to complete the intangible asset and use or sell it; |
| · | There is an ability to use or sell the intangible asset; |
| · | It can be demonstrated how the asset will generate probable future economic benefits; |
| · | Adequate technical, financial and other resources to complete the development and to use or sell the intangible asset are available; and |
| · | The expenditure attributable to the intangible asset during its development can be reliably measured. |
In the statement of financial position, the related capitalized costs are recorded at cost less accumulated depreciation and accumulated impairment losses.
Costs are capitalized during the application development stage and amortized on a straight-line basis from the beginning of the production stage over the period of expected future economic benefits. During the development period, the asset is subjected to impairment testing at least annually to determine if impairment indications exists. The research and development costs that do not qualify for capitalization are recorded as expenses in the statement of income of the period (see “Recovery (Impairment) charges on cash-generating unit”).
11.Inventories
The inventories of returned property are those assets that come from an early termination of a lease (returned properties) or those upon which the lease has already concluded (premises and equipment), which are expected to be sold in the normal course of business. These are controlled by the Bank and are expected to generate future economic benefits.
The inventories of returned property are recognized as an asset from the date in which the Bank assumes the risks and benefits of the inventories, provided that the cost of the asset can be reliably measured, and it is probable that it will generate future economic benefits.
The inventories of returned property are valued using the specific identification method and their costs include the carrying value at the time the asset is returned.
The carrying value of returned property is measured at the lower of cost and net realisable value (NRV). The net realisable value is the estimated selling price in the ordinary course of business less its estimated costs to sell. The adjustment in the carrying value to reflect the NRV, is recognized in the statement of income of the period in which the goods are returned. The value of any reversion that comes from an increase in the NRV in which the increase occurs is recognized as a lower expense in the period.
Other new inventories are measured initially at acquisition cost which comprises the sum of the purchase price, the import costs (if applicable), the non-recoverable taxes paid, the storage, the transport costs, and other attributable or necessary costs for their acquisition, less discounts, reductions or similar items. Those inventories do not include selling costs.
The Bank must review the NRV of its inventories, at least annually or whenever necessary if indicated by market conditions. Any write-down adjustment must be recognized directly in the statement of income.
12.Assets held for sale and discontinued operations
A non-current asset or a disposal group of assets are classified as held for sale if their carrying value will be recovered through a sale transaction, rather than through continuing use. These assets or groups of assets are shown separately in the statement of financial position at the lower of their carrying value and their fair value less costs to sell and they are not depreciated nor amortized from the date of their classification.
The held for sale condition is met if the assets or group of assets are available, in their current condition, for immediate sale and the sale transaction is highly probable and is expected to be completed within the year following the date of classification.
The Bank performs the measurement of the assets held for sale at the statement of financial position date. However, these assets are evaluated quarterly if impairment indicators exist that imply review of the carrying value recorded in the accounts. If those indications are identified, impairment losses are recognized for the difference between the carrying and recoverable amount of an asset as ‘Impairment, depreciation and amortization’ in the statement of income.
Gains and losses in the sale of premises and equipment are recognized in the consolidated statement of income as “other operating income” or “other operating expenses”. A discontinued operation is a component of an entity that has been disposed of, or is classified as held for sale and represents a separate major line of business or a geographical area of operations, is part of a single coordinated and individual plan to dispose of a separate major line of business or geographical area of operations, or is a subsidiary acquired exclusively with a view to resale.
Income and expenses coming from a discontinued operation must be disclosed separately from those coming from continued operations, in a single item after the income tax, in the consolidated statement of income of the current period and comparatively with previous period even though the Bank retains a non-controlling interest in the subsidiary after the sale.
13. Impairment of non-financial assets and cash-generating units and goodwill
The Bank evaluates at the end of each period whether there is any indication that on a stand-alone basis non-financial assets and cash-generating units are impaired. If some indication of impairment does exist, the Bank estimates the recoverable amount of the assets and the loss by impairment. Regardless of whether impairment indicators exist, impairment of goodwill is assessed annually.
If an asset does not generate cash flows that are independent from the rest of the assets or group of assets, the recoverable amount is determined by the cash-generating unit to which the asset belongs.
A cash-generating unit is the smallest identifiable group of assets that generates cash inflows that are largely independent of the cash inflows from other assets or groups of assets.
The amount of impairment losses recognized in net income during the period are included in the Statement of income as “Impairment, depreciation and amortization”.
14. Other assets
The Bank presents as other assets, among other things, (a) the expenses paid in advance incurred in the development of its business, in order to receive future services, which are amortized during the period in which services are received or the costs or expenses are recorded and (b) foreclosed assets that do not comply with what is required to be recognized as assets held for sale and where there are no plans to use them in the supply of services or for administrative purposes.
Foreclosed assets are initially recognized at the lower of net amount of the charged-off financial assets to which the foreclosed and net realizable value of the foreclosed asset (the net realizable value will be the estimated selling price of the asset or its awarding value, less the estimated costs necessary to carry out its sale), pending the obtaining of a plan for its commercialization. For this group of assets, it is evidence of impairment that they remain in the statement of financial position for a period greater than one year from their reception date without obtaining a buyer, despite permanently seeking their realization, even adjusting their selling price.
Foreclosed assets are subsequently assessed to determine whether an impairment lost must be recognized. In the case of arising events that are beyond the control of the Bank and that make remote the realization of these assets, they are identified as "non-tradable" and a completely impairment is carried out.
15. Employee benefits
15.1 Short term benefits
The Bank grants to its employee´s short-term benefits such as bonuses, salaries, accrued performance costs and social security that are expected to be wholly settled within 12 months. Expenses related to these benefits are recognized over the period in which the employees provide the services to which the payments relate.
15.2 Other long-term employee benefits
The Bank grants to its employee’s seniority bonuses as long-term employee benefits whose payment is not expected within the 12 months following the end of the annual period in which the employees have rendered their services. These benefits are projected up to the date of payment and are discounted through the Projected Unit Credit method. The cost of long-term employee benefits is allocated across the period from the time the employee was hired the Bank and the expected date of obtaining the benefit.
15.3 Pensions and other post-employment benefits
− Defined contribution plans
The Bank pays contribution monthly to pension funds, due to legal requirements and it will have no legal obligation to pay further contributions.
The Bank recognizes contributions in the statement of income, once the contribution is accrued. Any contributions unpaid at the statement of financial position date are included as a liability.
− Defined benefit plans
They are post-employment benefit plans in which the Bank has the legal or constructive obligation to take responsibility for the payments of benefits that have agreed, for example severance obligation, retirement pension premium plan and senior management pension plan premium and pension plan. The Bank makes an actuarial valuation on the basis of the projected unit credit method and a risk-free rate which reflects current market assessments of the time value of money in each country, related to the characteristics and the benefit flows weighted average, to discount such obligation.
16. Provisions, contingent liabilities and contingent assets
Provisions are recorded when the Bank has a present obligation (legal or constructive) as a result of past events, it is probable that an outflow of resources embodying economic benefits will be required to settle the obligation, and a reliable estimate can be made of the amount of the obligation.
Provisions are determined by the management’s best estimate of the expenditure required to settle the present obligation at the end of the reporting period, which estimate is discounted using a risk-free rate which reflects current market assessments of the time value of money in each country, which for Colombia is the interest rate on treasury bonds (TES)1. The corresponding expense of any provision is recorded in the statement of income, as a provision, net of all expected reimbursement. The increase of the provision due to the time value of money is recognized as a financial expense.
The amounts recognized in the statement of financial position, correspond mainly to:
− Provisions for loan commitments and financial guarantee contracts; and
− Provisions for legal proceedings, classified as probable to be decided against the Bank.
Possible obligations that arise from past events and whose existence will be confirmed only by the occurrence or non-occurrence of one or more uncertain future events, not wholly within the control of the Bank, or present obligations that arise from past events but are not recognized because they are not probable, that an outflow of resources embodying economic benefits will be required to settle the obligations or the amount of the obligations cannot be measured with sufficient reliability, are not recognized in the financial statement but instead are disclosed as contingent liabilities, unless the possibility of an outflow of resources embodying economic benefits is remote, in which case no disclosure is required.
Possible assets that arise from past events whose existence will be confirmed only by the occurrence or non-occurrence of one or more uncertain future events, not wholly within the control of the Bank, are not recognized in the financial statement; instead these are disclosed as contingent assets where an inflow of economic benefits is probable. When the realization of income is virtually certain, then the related asset is not a contingent asset and its recognition is appropriate.
| 1 | It refers to the interest rate of treasury bonds (TES), representative of the nation's public debt. |
17. Customer loyalty program
The Bank maintains a credit card loyalty program to provide incentives to its customers. The program allows customers to purchase goods and services, based on the exchange of awards points, which are awarded based on purchases using the Bank's credit cards and the fulfillment of certain conditions established in such program. Point’s redemption for prizes is carried out by a third party. According to IFRS 15, the expenses of the Bank's commitments with its clients arising from this program are recognized as a lower value of the fees and commission income, considering the total number of points that can be redeemed over the accumulated prizes and taking into account the probability of redemptions.
18. Revenue recognition
Accounting policy applied from January 01, 2018
Bank recognizes revenue from ordinary activities, which represent the transfer of goods or services committed with customers in exchange for an amount that reflects the consideration to which the entity expects to be entitled in exchange for such assets or services. The recognition and measurement of interest income and dividend income from debt and equity instruments not within the scope of IFRS 15. Instead, they are within the scope of IFRS 9.
The Bank evaluates the contracts and commitments established with customers, identifying compliance with the five steps established in IFRS 15 as follows:
| 1. | Identifying the contract: the parties' rights, payment conditions, evaluation of the commercial basis and characteristics of the compensations are identified, and the Bank evaluates if there are modifications or combinations that apply. |
| 2. | Identifying performance obligations:The Bank evaluates the commitments included in the entity's contracts to identify when the customer makes use of the service and whether the obligations are identifiable separately. |
| 3. | Determining the transaction price: The characteristics of the amounts for which the agreed services were exchanged are reviewed in the Bank's contracts, to estimate the effect of the variable consideration in kind, or others payable to the customer. |
| 4. | Allocating the transaction price to performance obligations: In the evaluation of prices to the Bank's contracts, these are designated individually to the services provided by the Bank, even in the products where there are commitments packaged. |
| 5. | Satisfaction of performance obligations: The obligations established in contracts with customers are satisfied when the control of the service is transferred to the customer and the recognition is performed as established in IFRS 15 over time or at a point in time. |
The Bank satisfies a performance obligation and recognizes revenue over time, if one of the following criteria is met:
| a) | The Bank's performance does not create an asset with an alternative use for the entity, and it has an enforceable right to receive payment for the performance completed to date. |
| b) | The Bank's performance creates or enhances an asset that the customer controls as the asset is created or enhanced. |
| c) | The customer simultaneously receives and consumes the benefits provided by the Bank’s performance as the Bank performs. |
For performance obligations where none of the indicated conditions is fulfilled, the Bank satisfies the performance obligation at a point in time, at which the customer obtains control of the promised services and the entity satisfies a performance obligation. When the Bank fulfills a performance obligation through the delivery of promised goods or services, it creates a contractual asset for the consideration amount obtained with the performance.
A contract asset is the right of the Bank to receive a payment in exchange for goods or services that the Bank has transferred to a customer, when that right is dependent on another thing different than the passage of time (for example, billing or delivery of other elements part of the contract). The Bank recognizes the contractual assets as current assets, as they are expected to be realized within the normal operating cycle.
The costs of contracts eligible for capitalization as incremental costs when obtaining a contract are recognized as a contractual asset. Contractual costs are capitalized when incurred if the Bank expects to recover those costs. Contractual costs constitute non-current assets to the extent that the Bank expects to receive the economic benefits of those assets in a period greater than twelve months. The contractual costs are amortized systematically and consistently with the transfer of the services to the customer once the corresponding revenue has been recognized. The capitalized contractual costs are impaired if the customer withdraws or if the carrying amount of the asset exceeds the projection of the discounted cash flows that are related to the contract.
When the amount of consideration received from a customer exceeds the amount of the recognized revenue, this creates a contractual liability. Contract liabilities constitute the Bank's obligation to transfer goods or services to a customer, for which the Bank has received a payment from the end customer or if the amount is past due. They also include deferred income related to goods or services that shall be delivered or provided in the future, which will be billed to the customer in advance, but which are not yet past due.
Revenue is measured based on the consideration specified in the contract with the customer, and excludes amounts received on behalf of third parties when the Bank is an agent. The Bank recognizes revenue when it transfers control over a good or service to a customer. Revenue is presented net of reimbursements and discounts and after eliminating inter-group sales. The Bank evaluates its revenue categories will based on specific criteria in order to determine whether it acts as principal or agent. Revenue is recognized to the extent that it is probable that economic benefits will flow to the Bank and it is possible to reliably measure the related revenues and costs.
Policy applicable until December 31, 2018
Revenue under IAS 18 applicable to the accounting information presented up to the year 2017, was recognized as it was probable that the economic benefits flowed to the entity and the revenues could be measured reliably.
18.1. Interest income and expenses
For all financial instruments measured at amortized cost, interest income and interest expenses are recognized using the effective interest rate. The effective interest rate is the rate that exactly discounts future estimated cash flows payments through the expected life of the financial instrument or, when appropriate, a shorter period, to the net carrying value of the financial liability or asset. The computation takes into account all the contractual conditions of the financial instrument (for example, prepayment options) and includes incremental fees or expenses that are directly attributed to the instrument and are an integral part of the Effective Interest Rate (EIR), but not future credit losses.
For debt securities at fair value, gains and losses arising from changes in fair value are included in the statement of income as ‘Interest and valuation on financial instruments’.
18.2. Fees and commission income
The Bank charges fees for the services it provides to its customers. Fee income can be divided into the following three categories:
Income from fees that are an integral part of the effective interest rate of a financial instrument:
Commissions for loan commitments that have a high probability of being used are deferred (together with any incremental cost) via the effective interest rate once the loan is granted (in accordance with section 18.1). If the commitment expires and no loan is made, the fee is recognized as income at the time of termination.
The opening fees received for the issuance of a financial liability measured at amortized cost are included in the effective interest rate of the financial instrument and its recognition as income is generated during the estimated life of the asset.
Income from fees obtained from the services that are provided during a certain period of time:
These payments include income from commissions and asset management, custody and other administration and advisory commissions. In loan commitments when it is not possible to demonstrate the probability that a loan will be used, the opening fees of the loan are recognized in income statement during the commitment period on a straight-line basis.
Income from the provision services:
Fees arising from the negotiation or participation in the negotiation of a transaction for a third party, such as the acquisition of shares or other securities or the purchase or sale of businesses, are recognized at the closing of the underlying transaction. Commissions or fee components that are linked to a specified performance are recognized after the corresponding criteria are met.
18.3. Dividend revenue
For the investments that are not associates or joint ventures, dividends are recognized when the right to payment of the Bank is established, which is generally when the stockholders declares the dividend. These are included in the statement of income as Dividends received and share of profits of equity method investees.
18.4. Total operating income, net
The income derived from commercial operations (trading) includes all profits and losses from variations in the fair value and revenue or expenses for related interests from financial liabilities or assets. This includes any ineffectiveness registered in the hedging transactions.
19. Income tax
The Bank recognizes, when appropriate, deferred tax assets and liabilities by estimating the future tax effects attributable to differences between book values of assets, liabilities and their tax bases. Deferred tax assets and liabilities are measured based on the tax rate that, in accordance with the valid tax laws in each country where the Bank has operations, must be applied in the year in which the deferred tax assets and liabilities are expected to be realized or settled. The future effects of changes in tax laws or tax rates are recognized in the deferred taxes as from the date of publication of the law providing for such changes.
Tax bases for deferred tax must be calculated by factoring in the definition of IAS 12 and the value of the assets and liabilities that will be realized or settled in the future according to the valid tax laws of each of the countries where The Bank has operations.
Deferred tax liabilities due to deductible temporary differences associated with investments in subsidiary and associated entities or shares in joint ventures, are recognized except when the Bank is able to control the period in which the deductible temporary difference is reverted, and it is likely that the temporary difference will not be reverted in the foreseeable future.
Deferred tax assets, identified with temporary differences, are only recognized if it is considered likely that The Bank will have sufficient taxable income in the future that allow it to be recovered.
Tax credit from fiscal losses and surplus amounts from the presumptive income on the net income are recognized as a deferred asset, provided that it is likely that the Bank will generate future net income to allow their offset.
The deferred tax is recorded as debit or credit according to the result of each of the companies that form the Bank and for the purpose of disclosure on the Statement of Financial Position it is disclosed as net.
The deferred tax expense is recognized in the statement of income under the heading Income Tax, except when referring to amounts directly recognized in the OCI (Other Comprehensive Income).
Regulatory changes in tax laws and in tax rates are recognized in the statement of income under the heading Income Tax in the period when such rule becomes enforceable. Interest and fines are recognized in the consolidated income statement under the other administrative and general expenses.
The Bank periodically assesses the tax positions adopted in tax returns and according to the results of the tax audits conducted by the tax authorities determines possible tax outcomes provided it has a present obligation and it is more likely than not that the Bank will have to dispose of the economic resources to cancel the obligation, and the Bank can reliable estimate of the amount of the obligation. The recorded sums are based on the estimated fair amount that is expected to cover the amount expected to be paid in the future.
Revisions of tax returns must be documented, as well as any uncertain tax positions that are taken in them.
Transfer pricing policy
The Bank has as a general policy that each of its companies be responsible for their income, costs and expenses independently. The above taking into account the regulation for the Matrix provided for in the Organic Statute of the Financial System (article 119 numeral 4) which in relation to the autonomy of the subsidiaries states that: "The activity of the subsidiaries of entities subject to the control and supervision of the Colombian Superintendency of Finance must be carried out in conditions of independence and administrative autonomy, so that they have sufficient capacity of own decision to carry out the operations that constitute their object”.
The Bank recognizes operations with economic links applying the Arm's Length Principle. These operations are documented and reported to the tax administration.
20. Operating segments
Operating segments are defined as components of the Bank that are engaged in business activities from which they may earn revenues and incur expenses, for which separate financial information is available that is regularly used by the chief operating decision maker in deciding how to allocate resources and assessing performance.
The Bank manages and measures the performance of its operations through the operating segments using the same accounting policies described in the summary of significant accounting policies described in Note 3 Operating segments.
21. Earnings per share
The basic earnings per share are calculated by dividing net income attributable to the ordinary equity holders of the Parent Company by the weighted average number of ordinary shares outstanding during the period.
To calculate diluted earnings per share, the net income attributable to ordinary equity holders, and the weighted average number of outstanding shares is adjusted by the dilutive effects inherent to potential ordinary shares. Currently, the Bank does not have any dilutive instruments as to be considered in the diluted earnings per share due to the fact that the Bank’s shares are anti-dilutive.
22. Paid-in capital
Corresponds to the amount paid by the shareholders in excess of the nominal value of the share.
| E. | Use of estimates and judgments |
The preparation of consolidated financial statements requires the Bank's management make judgments, estimates and assumptions that affect the application of accounting policies and the recognized amounts of assets, liabilities, income and expenses.
The estimates and underlying assumptions are reviewed on an ongoing basis. Revisions to accounting estimates are recognized in the period in which the estimate is revised if the revision affects only that period, or in the period of the revision and future periods if the revision affects both current and future periods.
Judgments or changes in assumptions are disclosed in the notes to the consolidated financial statements. Management bases its estimates and judgments on historical experience and on various other factors that are believed to be reasonable under current circumstances. Actual results may differ from these estimates if assumptions and conditions change.
The significant accounting policies that the Bank uses in preparing its consolidated financial statements are detailed below:
1. Credit risk Impairment:
Expected credit losses are calculated using individual and collective models and methodologies based on assumptions and judgement considering historical credit data, current situation and reasonable and supportable forecasts of future economic conditions. The estimation of impairment charges is a critical accounting policy because of the significance of this line item, the sensitivity of the charges to changes in assumptions about future events and other somewhat subjective judgments that are incorporated in the individual credit loss models.
Some relevant assumptions must be made to operate the mathematical models behind the expected credit loss assessment. Assumptions such as the time past due payments to consider a client to have a significant risk increase or to be in default are leveraged from historical data and then reviewed by expert panels. Other assumptions such as the future economic conditions, the conformation of plausible future economic scenarios and the likelihood of those scenarios have a high impact on lifetime default probability models. These scenarios are determined and leveraged by the Direction of Economic Research, which operates independently of the Bank’s risk management division.
The main factors considered in collective estimations of credit losses are the definition of significant increase in credit risk, definition of default, collateral values, loan maturity and macroeconomic forecast of variables such as unemployment, GDP, interest rates, among others. It is also important to consider and any other variable that could influence a client´s willingness to pay.
In addition, individual credit losses models consider assumptions on how the financial performance and future cash flow of a client could be affected the client´s expected future operational and commercial activity, if generate sufficient cash to pay debt obligations and trends and regulatory changes in the economic sector in which the client operates, changes in the collateral value, as well as other internal or external factors.
Given the inherent uncertainties and the high level of subjectivity involved in the assessment of three following factors, it is possible that the outcomes in the next financial year could differ from the expectations on which management’s estimates are based:
| o | Exposure at default: It is understood as the exposed balance of assets to the current capital balance, interest and receivable accounts. In the case of products whose nature is revolving and that have an available quota that is susceptible to be used in its entirety according to loan contracts subscribed with clients, this parameter includes an estimation of the use of those products after the client’s default. |
| o | Probability of default (PD): This is the probability that the debtor fails to fulfill their obligations of capital and/or interest payment over a period of twelve months. This is linked to the rating/scoring of each debtor/operation. |
| o | Loss given default (LGD): This is defined as the economic impairment in which the entity would incur in the event of any instance of default. This depends mainly upon the characteristics of the debtor and upon the valuation of guarantees or collateral associated with the operation. |
Impairment loss models and methodologies, and the related assumptions, are assessed by the Bank’s Risk vice-presidency on a regular basis, using robust validation procedures in order to assure a reasonable coverage of effective losses.
This process enables management to periodically determine whether assumptions and models used to measure credit risk impairment should be adjusted to achieve more preciseestimations.
Internal controls, data governance standards and approval processes have been implemented by the Bank to make estimations more accurate.
For further details please see Note 2 Significant Accounting Policies, section 7.4.5 Impairment of financial assets at amortized cost or at fair value through other comprehensive income “FVOCI”.
2. Impairment testing of CGU including goodwill:
The Bank tests goodwill recognized upon business combinations for impairment at least annually. The impairment test for goodwill involves estimates and significant judgments, including the identification of cash generating units and the allocation of goodwill based on the expectations of which operating segments the Bank will benefit from the acquisition. The fair value of the acquired companies is sensitive to changes in the valuation models’ assumptions. Adverse changes in any of the factors underlying these assumptions could lead the Bank to record a goodwill impairment charge. Management believes that the assumptions and estimates used are reasonable and supportable in the existing market environment and commensurate with the risk profile of the assets valued. See Note 9 Goodwill and intangible assets, net for further information related to carrying amount, valuation methodologies, key assumptions and the allocation of goodwill.
3. Deferred tax:
Deferred tax assets and liabilities are recorded on deductible or levied temporary differences originating between tax and accounting bases, taking into account the valid tax rules applicable in each country where the Bank has operations. Due to the changing conditions of the political, social and economic environment, the constant amendments to tax legislation and the permanent changes in the tax principles and changes in interpretations by tax authorities determining the tax bases for the deferred tax items involves difficult judgments including estimates of future gains, offsets or tax deductions.
Accordingly, the determination of the deferred tax is considered a critical accounting policy.
For more information relating to the nature of deferred tax assets and liabilities recognized by the Bank, please see Note 12 Income tax.
4. Provisions and contingent liabilities:
The Bank is subject to contingent liabilities, including those arising from judicial, regulatory, arbitration proceedings, tax and other claims arising from the conduct of the Bank’s business activities. These contingencies are evaluated based on management’s best estimates and provisions are established for legal and other claims by assessing the likelihood of the loss actually occurring as probable, possible or remote. Contingences are provisioned are recorded when all the information available indicates that it is probable that an outflow of resources embodying economic benefits will be required to settle the obligation before the statement of financial position date and the amounts may be reasonably estimated. The Bank engages internal and external experts in assessing probability and in estimating any amounts involved.
Throughout the life of a contingency, the Bank may learn of additional information that can affect assessments regarding probability or the estimates of amounts involved; changes in these assessments can lead to changes in recorded provisions.
The Bank considers the estimates used to determine the provisions for contingent liabilities are critical estimates because the probability of their occurrence and the amounts that the Bank may be required to pay are based on the Bank’s judgment and those of its internal and external experts, which will not necessarily coincide with the future outcome of the proceedings. For further information regarding legal proceedings and contingencies and it is carrying amounts. See Note 21 Provisions and contingent liabilities.
5. Fair value of financial assets and liabilities:
Financial assets and liabilities recorded at fair value on the Bank’s statement of financial position include debt, equity securities and derivatives classified at fair value through profit or loss, debt classified at fair value through other comprehensive income and equity securities which the Bank has made an irrevocable election to present changes in its fair value in other comprehensive income.
To increase consistency and comparability in fair value measurements and related disclosures, IFRS 13Fair value measurement specifies different levels of inputs that may be used to measure the fair value of financial instruments. In accordance with this standard, financial instruments are classified as follows:
Level 1: Assets and liabilities are classified as Level 1 if there are observable inputs that reflect quoted prices (unadjusted) for identical assets or liabilities in active markets. An active market is one in which transactions occur with sufficient volume and frequency to provide pricing information on an ongoing basis.
Instruments are valued by reference to unadjusted quoted prices for identical assets or liabilities in active markets where the quoted price is readily available, and the price represents actual and regularly occurring market transactions.
Level 2: Assets and liabilities are classified as Level 2 if in the absence of a market price for a specific financial instrument, its fair value is estimated using models whose input data are observable for recent transactions of identical or similar instruments.
Level 3: Assets and liabilities are classified as level 3 if unobservable input data were used in the measurement of fair value that are supported by little or no market activity and that are significant to the fair value of these assets or liabilities.
All transfers between the aforementioned levels are assumed to occur at the end of the reporting period.
The measurement of the fair value of financial instruments generally involves a higher degree of complexity and requires the application of judgments especially when the models use unobservable inputs (level 3) based on the assumptions that would be used in the market to determinate the price for assets or liabilities.
For further details, as carrying amount and sensitivity disclosures, please see Note 30 Fair value of assets and liabilities.
6. Measurement of Employee benefits:
The measurement of post-employment benefit obligations and long-term employee benefits takes into account a range of inputs and it is dependent upon a series of assumptions of future events. The projected unit credit method is used to determine the present value of the obligation for the defined benefits and its associated cost. Future measurements of obligations may differ to those presented in the financial statements, among others, due to changes in economic and demographic assumptions and significant events. For further information, see Note 19 Employee benefit plans.
7. Transaction price determination
With respect to contracts with the Bank’s customers, for the determination of the transaction price, the Bank allocates to each one of the performance obligations under the contract the price which represents the value expected to be received to each such performance obligation based on its relative stand-alone selling price. Such price is determined based on the cost of each service, related tax and associated risks to the operation and inherent to the transaction, plus the margin expected to be received for the services, considering in each case the market price for the service, the conditions agreed with the customer and the customer’s segment. The bank has fixed and variable prices considering the characteristics of each service, future events, discounts, returns and other variables that may influence the selling price. No significant financing components are factored in the determination of the selling price.
8. Leases
Application since January 1, 2019:
The measurement of the right of use asset and of the lease liabilities requires a series of judgments, among which are the determination of the term of the lease and the rate used in discounting the cash flows. The term of the lease was defined according to the historical information of the contracts and the period over which an asset is expected to be economically usable, which involves a high degree of uncertainty due to the use of relevant information about past events. For the Bank’s case, it was not possible to determine or obtain an interest rate implicit in the lease; therefore, the weighted average lessee’s incremental borrowing rate was used to discount the cash flows associated with the leases. The Bank performs analyses taking in account the currency, lease term, economic environment and class of underlying assets as to determinate the weighted average lessee’s incremental borrowing rate.
9. Uncertainty over Income Tax Treatments
In the process of determining the current and deferred tax for periods subject to review by the tax authority, the applicable rules have been applied and interpretations have been made to take positions, on which different interpretations could arise from those made by the entity. Due to the complexity of the tax system, the continuous modifications of the fiscal rules, the accounting changes with implications in the tax bases and in general the legal instability of the country, at any time the tax authority could have different criteria from the Bank. Therefore, a dispute or inspection by the tax authority on a specific tax treatment may affect the deferred or current tax asset or liability bank´s accounting, in accordance with the requirements of IAS 12.
The Management and its advisors consider that their actions taken about the estimates and judgments made in each fiscal period correspond to those indicated by the current tax regulations, therefore have not considered it necessary to recognize any additional provisions to those indicated in Note 12 Income tax.
| F. | Recently issued accounting pronouncements |
| a) | Accounting Pronouncements Applicable in 2019 |
IFRS 16 Leases:On January 13, 2016 the IASB issued IFRS 16 Leases that replaces IAS 17 leases, IFRIC 4 Determination of whether a contract contains a lease, SIC 15 Incentives in lease agreements and SIC 27 Evaluation of the substance of the transaction. This standard is effective as of January 1, 2019 and establishes the principles of recognition, measurement, presentation and disclosure of leases and requires lessees to account for all their leases under the same balance sheet model similar to the accounting under IAS 17 on financial leases. At the beginning of the lease, the lessee will recognize a liability for the lease payments (liability for lease) and an asset that would represent the right to use the underlying asset during the term of the lease (right to use the asset). Lessees must separately recognize the interest expense of the lease liability and the depreciation expense of the right to use.
Lessees must also adjust the lease liability from the occurrence of certain events (for example, a change in the term of the lease, a change in the assessment of an option to purchase the underlying asset, a change in the amounts expected to be payable under a residual value guarantee or a change in future lease payments as a result of a change in the rate or rate used to determine such lease payments).
The lessee will generally recognize the amount of the adjustment to the lease liability as an adjustment to the right-to-use asset.
The standard includes two recognition exemptions for lessees: leasing of low-value assets (for example, personal computers) and short-term leases (that is, leases with a term of less than 12 month and leases that do not contain a purchase option). The accounting of the lessor under IFRS 16 does not have substantial modifications with respect to that made under the requirements of IAS 17. The lessors will continue to classify all their leases using the same classification principles of IAS 17, between financial and operating leases.
For further information about the adoption of IFRS 16 and the impacts recognized in the Bank´s financial statements, please see Note 32. Impacts on application of new standards.
IFRS 9, Financial Instruments: In July 2014 the IASB issued the final version of IFRS 9 that completed the replacement project of IAS 39 –Financial instruments: Classification and measurement mainly introducing new criteria for classification and subsequent measurement of financial assets and liabilities, impairment requirements related to expected loss accounting and hedge accounting. The effective application of the final version of this IFRS will be from January 1, 2018, except for hedge accounting which has been adopted by the Bank since January 1, 2019.
Hedge accounting: These requirements align hedge accounting more closely with risk management, establishing a more principle-based approach to hedge accounting and addressing inconsistencies and weaknesses in the hedge accounting model in IAS 39. Entities have been provided with an accounting policy option between applying the hedge accounting requirements of IFRS 9 or continuing with the application of the existing hedge accounting requirements of IAS 39 for all hedge accounting, as the project on macro hedge accounting has not yet been completed.
For further information about the impact of transition to IFRS 9, 2014 version in the Bank´s financial statements, please see Note 32 Impacts on application of new standards.
Annual improvements to IFRS Cycle 2015-2017
| · | Amendments to IFRS 3 Business combination:The amendments to IFRS 3 clarify that when an entity obtains control of a business that is a joint operation, it remeasures previously held interests in that business. |
| · | Amendments to IFRS 11 Joint Arrangements: The amendments to IFRS 11 clarify that when an entity obtains joint control of a business that is a joint operation, the entity does not remeasure previously held interests in that business. |
| · | Amendments to IAS 12 Income taxes: The amendments to IAS 12 clarify the recognition of the tax effects for dividends as defined in IFRS 9, when a liability is recognized for payment of the dividend. The tax effects of dividends are linked more directly to past transactions or events that generate distributable profits than to distributions to owners. Therefore, an entity shall recognize the income tax consequences of dividends in profit or loss, other comprehensive income or equity according to where the entity originally recognized those past transactions or events. |
| · | Amendments to IAS 23 Borrowing Costs:The amendments clarify that if any specific borrowing remains outstanding after the related asset is ready for its intended use or sale, that borrowing becomes part of the funds that an entity borrows generally when calculating the capitalization rate on general borrowings. During 2019, no impact was recognized in the Bank's financial statements as a result of this amendments. An entity shall apply those amendments for annual reporting periods beginning on or after January 01, 2019. |
IFRIC 23 uncertainty over income tax treatments: This interpretation has the object of reducing the diversity there is in the recognition and calculation of a tax liability or an asset when there is uncertainty about tax treatment.
According to IASB, this interpretation applies to all accounting aspects of the income tax when there is uncertainty regarding the treatment of an element, including the tax gain or loss, the assets and liabilities tax bases, tax loss and credit and tax rates. This interpretation is mandatory for the annual periods beginning on or after January 1, 2019.
The Bank shall reflect the effect of an uncertain tax position about the income tax, when it will be concludes that it is unlikely that the tax authority will accept an uncertain tax treatment and, therefore, it will likely pay amounts relating to the uncertain tax treatment.
In the determination of the current and deferred tax for periods subject to review by the tax authority, the applicable rules have been applied and interpretations have been made to take positions, on which different interpretations could be taken. As of result of the complexity of the tax system, the continuous modifications to fiscal rules, the accounting changes with implications in the tax bases and in general the legal instability of the country in some issues such as deductible expenses such as provisions, depreciation, amortization and expenses in general or in untaxed income that at any time could the tax authority have different interpretation from that of the Bank; However, the Bank and its advisors consider that their actions judgments and estimates made in each fiscal period correspond to those indicated by the tax regulations in force and, therefore, they have not considered it necessary to recognize any additional provision to those indicated in Note 21 Provisions and contingent liabilities to the financial statements.
Improvements to IAS 28 Long-term interests in associates and joint ventures: The board clarifies that long-term interests in an associate or joint venture which, in essence, are part of a net investment in the associate or joint venture, are within IFRS 9, and thus, the value impairment requirements of IFRS 9 apply to these interests. An entity shall apply these amendments retroactively, in accordance with IAS 8 to the annual periods which are to be reported starting on or after January 1, 2019.
From Management’s point of view the amendments eliminates ambiguity in the wording of the standard IAS 28, and applying IFRS 9 to other financial instruments held by the Bank and its subsidiaries at the beginning of this annual reporting period, that, in substance, form part of the Bank’s net investment in its associates or joint ventures, no impacts were identified to be recognized in the opening retained earnings.
Amendments to IAS 19: The amendments clarify that an entity first determines any past service cost, or a gain or loss on settlement, without considering the effect of the asset ceiling. This clarification provides that entities might have to recognize a past service cost, or a gain or loss on settlement, that reduces a surplus that was not recognized before. Changes in the effect of the asset ceiling are not netted with such amounts. This amount is recognized in profit or loss. An entity then determines the effect of the asset ceiling after the plan amendment, curtailment or settlement. Any change in that effect, excluding amounts included in the net interest, is recognized in other comprehensive income. The Bank expect no impacts due to this modification, since its application is prospective and to date these events have not been presented.
The amendments to this accounting standard implied an adjustment to the deferred tax calculated as of December 31, 2018, when the accounting basis of the liability (asset) was modified using updated actuarial assumptions to determine the cost of services for the current period and the net interest, for the rest of the annual period. The amendment is effective for annual periods beginning on or after January 1, 2019.
| b) | Recently Issued Accounting Pronouncements Applicable in Future Periods |
Conceptual Framework: The IASB issued the Conceptual Framework in March 2018, effective for annual periods beginning on or after January 01, 2020. It sets out a comprehensive set of concepts for financial reporting, standard setting, guidance for preparers in developing consistent accounting policies and assistance to others in their efforts to understand and interpret the standards.
The Conceptual Framework includes some new concepts, provides updated definitions and recognition criteria for assets and liabilities and clarifies some important concepts.
Management evaluated the impact of the changes that the amendment of Conceptual Framework would have on the Bank and its financial statements and disclosures, and no impact is expected.
Annual improvements to IFRS Cycle 2018-2020
During 2019, the following amendments have been evaluated by the Bank. Their impacts and the implementation dates will be decided after exposure by IASB:
| · | IFRS 1 First-time Adoption of International Financial Reporting Standards:The Board proposes to require a subsidiary that elects to apply paragraph D16(a) of IFRS 1 First-time Adoption of International Financial Reporting Standards to measure cumulative translation differences using the amounts reported by the parent, based on the parent’s date of transition to IFRSs. |
This proposed amendment would also apply to an associate or joint venture that elects to apply paragraph D16 (a) of IFRS 1.
| · | IFRS 9 Financial Instruments:In determining whether to derecognize a financial liability that has been modified or exchanged, an entity assesses whether the terms are substantially different. The Board proposes to clarify the fees that an entity includes when assessing whether the terms of a new or modified financial liability are substantially different from the terms of the original financial liability. |
| · | Illustrative Examples accompanying IFRS 16 Leases:The Board proposes to amend Illustrative Example 13 accompanying IFRS 16 Leases to remove the illustration of payments from the lessor relating to leasehold improvements. The proposed amendment would remove potential for confusion regarding the treatment of lease incentives applying IFRS 16. |
Amendments to IAS 1 Presentation of Financial Statements:On January 23, 2020, the IASB issued amendments to IAS 1 Presentation of Financial Statements (the amendments) to clarify the requirements for classifying liabilities as current or non-current. More specifically:
- The amendments specify that the conditions which exist at the end of the reporting period of an obligation are those which will be used to determine if a right to defer settlement of a liability exists.
- Management expectations about events after the balance sheet date, for example on whether a covenant will be breached, or whether early settlement will take place, are not relevant
- The amendments clarify the situations that are considered settlement of a liability.
Currently, IAS 1 requires a company to classify a liability as current unless, among other things, the company has an unconditional right to defer settlement of the liability for at least 12 months after the reporting period.
The amendments clarify that the classification of liabilities as current or noncurrent is solely based on the entity’s right to defer settlement at the end of the reporting period. The entity’s right to defer settlement for at least for 12 months from the reporting date must not be unconditional but must have substance. The classification is not affected by management’s intentions or expectations about whether the entity will exercise its right.
The amendments to IAS 1 are required to be applied for annual periods beginning on or after 1 January 2022. The amendments must be applied retrospectively in accordance with IAS 8. Early application is permitted.
Management is evaluating the impact of the modification in the Bank´s statement of financial position and disclosures.
NOTE 3. OPERATING SEGMENTS
Operating segments are defined as components of an entity about which separate financial information is available and that is evaluated regularly by the chief operating decision maker (CODM) in deciding how to allocate resources and assessing performance; the CODM is constituted by the Bank’s President (CEO) and Financial Vicepresident (CFO). The segment information has been prepared following the Bank’s accounting policies as described in the summary of significant accounting policies in Note 2 Significant accounting policies and has been presented consistently with the internal reports provided to the CODM.
The CODM uses a variety of information and key financial data on a segment basis to assess the performance and make decision regarding the investment and allocation of resources, such as:
| · | Net interest margin (Net margin on financial instruments divided by average interest-earning assets). |
| · | Return on average total assets (Net income divided by average total assets). |
| · | Return on average stockholders’ equity. |
| · | Efficiency ratio (Operating expenses as a percentage of interest, fees, services and other operating income). |
| · | Asset Quality and loans coverage ratios. |
The Bank includes the following segments: Banking Colombia, Banking Panama, Banking El Salvador, Banking Guatemala, Trust, Investment Banking, Brokerage, Off Shore and All other segments. The factors used to identify the Bank’s reportable segments are the nature of the products and services provided by the subsidiaries and the geographical locations where the subsidiaries are domiciled, in line with the CODM’s operating decisions related to the results of each segment.
The Bank’s operating segments are comprised as follows:
This segment provides retail and corporate banking products and services to individuals, companies and national and local governments in Colombia. The Bank’s strategy in Colombia is to grow with these clients based on value added and long-term relationships. In order to offer specialized services to individuals, small and medium size enterprises (SMEs) and big size enterprises, the Bank´s retail sales force targets the clients classified as: Personal, plus and Entrepreneurs.
The Bank´s corporate and government sales force targets and specializes in companies with more than COP 100,000 million in revenue in twelve economic sectors: Agribusiness, Commerce, Manufacturing of Supplies and Materials, Consumer goods, Financial Services, Health, Education, Construction, Government, Infrastructure, Real state, and Natural Resources
This segment is also responsible for the management of the Bank’s proprietary trading activities, liquidity and distribution of treasury products and services to its client base in Colombia.
This segment provides retail and commercial banking products and services to individuals and companies in Panama through the Banistmo operation. This segment includes all the operations of Banistmo and its subsidiaries, which are managed and monitored by the CODM on a consolidated basis.
This segment is also responsible for the management of the Banistmo’s proprietary trading activities, liquidity and distribution of treasury products and services to its client base in Panama.
This segment provides retail and commercial banking products and services to individuals, companies and national and local governments in El Salvador through Banco Agrícola S.A. Banking El Salvador also includes operations of the following subsidiaries: Arrendadora Financiera S.A., Credibac S.A. de CV, Valores Banagricola S.A. de C.V.
This segment is also responsible for the management of Banco Agrícola’s proprietary trading activities, liquidity and distribution of treasury products and services to its client base in El Salvador.
This segment provides retail and commercial banking and insurance products and services to individuals, companies and national and local governments in Guatemala through Banco Agromercantil de Guatemala S.A.. Banking Guatemala also includes operations of the following subsidiaries: Mercom Bank Ltd., Seguros Agromercantil S.A., Financiera Agromercantil S.A., Agrovalores S.A., Arrendadora Agromercantil S.A., Agencia de Seguros y Fianzas Agromercantil S.A., Asistencia y Ajustes S.A., Serproba S.A., Servicios de Formalización S.A., Conserjería, Mantenimiento y Mensajería S.A. and New Alma Enterprises LTD.
This segment is also responsible for the management of Banco Agromercantil’s proprietary trading activities, liquidity and distribution of treasury products and services to its client base in Guatemala.
This segment provides trust and asset management services to clients in Colombia through Fiduciaria Bancolombia S.A. Sociedad Fiduciaria. As of December 31, 2018, this segment includes FiduPerú S.A. Sociedad Fiduciaria’s results. This entity was sold in July 2019. For further information, see Note 1 Reporting Entity.
The main products offered by this segment include money market accounts, mutual and pension funds, private equity funds, payment trust, custody services, and corporate trust.
This segment provides corporate and project finance advisory, underwriting, capital markets services and private equity management through Banca de Inversión Bancolombia S.A. Corporación Financiera. Its customers include private and publicly-held corporations as well as government institutions.
This segment provides brokerage, investment advisory and private banking services to individuals and institutions through Valores Bancolombia S.A. Comisionista de Bolsa. It sells and distributes equities, futures, foreign currencies, fixed income securities, mutual funds and structured products.
This segment provides a complete line of offshore banking services to Colombian and foreign customers through Bancolombia Panamá S.A., Bancolombia Cayman S.A., and Bancolombia Puerto Rico International, Inc. It offers loans to private sector companies, trade financing, leases financing and financing for industrial projects, as well as a complete portfolio of cash management products, such as checking accounts, international collections and payments. Through these subsidiaries, the Bank also offers investment opportunities in U.S. dollars, savings and checking accounts, time deposits, and investment funds to its high net worth clients and private banking customers.
This segment provides financial and operating leases activities, including cross-border and international leasing services to clients in Colombia, Central America and Mexico. Bancolombia offers these services mainly through the following Subsidiaries: Renting Colombia S.A.S. and Transportempo S.A.S. This segment also includes results from the operations of investment vehicles of the Bank: Valores Simesa S.A., Pasarela Colombia S.A.S. (before BIBA Inmobiliaria S.A.S,), Inversiones CFNS S.A.S., Sistema de Inversiones y Negocios S.A. Sinesa, Banagrícola S.A., Inversiones Financieras Banco Agrícola and others. As of December 31, 2018, this segment includes Arrendamiento Operativo CIB S.A.C – Renting Perú’s results. This entity was sold in March 2019. For further information, see Note 1 Reporting Entity.
According to the quantitative threshold test required by IFRS 8 Operating Segments, the revenue reported by “all other segments” is less than 10 per cent of the combined revenue of all operating segments and its assets represent less than 10 per cent of all operating segments combined assets of the Bank.
Financial performance by operating segment:
The CODM reviews the performance of the Bank using the following financial information by operating segment:
| | For the year ended December 31, 2019 |
| | Banking
Colombia | Banking
Panama | Banking El
Salvador | Banking
Guatemala | Trust | Investment
banking | Brokerage | Off shore | All other
segments | Total before
eliminations | Adjustments for
consolidation | Total after
eliminations |
| | In millions of COP |
| Total interest and valuation | 12,970,741 | 1,876,925 | 1,094,422 | 977,980 | 152 | 8 | 5,018 | 614,073 | 12,160 | 17,551,479 | (170,795) | 17,380,684 |
| Interest income on loans and financial leases | 12,592,221 | 1,654,600 | 1,052,680 | 905,016 | 132 | - | 96 | 411,504 | 11,804 | 16,628,053 | 267 | 16,628,320 |
| Total debt investments | 716,032 | 172,610 | 40,915 | 73,152 | 20 | 8 | 14,757 | 24,682 | 9 | 1,042,185 | - | 1,042,185 |
| Derivatives | (172,399) | 1,625 | - | - | - | - | (10,416) | 169,483 | - | (11,707) | (171,062) | (182,769) |
| Total liquidity operations | (165,113) | 48,090 | 827 | (188) | - | - | 581 | 8,404 | 347 | (107,052) | - | (107,052) |
| Interest expenses | (4,408,233) | (720,587) | (295,433) | (388,571) | (138) | (4) | (26) | (304,519) | (62,283) | (6,179,794) | - | (6,179,794) |
| Net interest margin and valuation on financial instruments before impairment on loans and financial leases, off balance sheet credit instruments and other financial instruments | 8,562,508 | 1,156,338 | 798,989 | 589,409 | 14 | 4 | 4,992 | 309,554 | (50,123) | 11,371,685 | (170,795) | 11,200,890 |
| Total credit impairment charges, net | (2,564,417) | (408,132) | (83,110) | (333,699) | (716) | (251) | (4,363) | 19,169 | (6,943) | (3,382,462) | (28,659) | (3,411,121) |
| Net interest margin and valuation income on financial instruments after impairment on loans and financial leases and off balance sheet credit instruments | 5,998,091 | 748,206 | 715,879 | 255,710 | (702) | (247) | 629 | 328,723 | (57,066) | 7,989,223 | (199,454) | 7,789,769 |
| Revenues (Expenses) from transactions with other operating segments of the Bank | (19,212) | (36,107) | (2,154) | (36,255) | (25,529) | 31,585 | 62,628 | 167,419 | (142,375) | - | - | - |
| Fees and commission income(1) | 3,269,747 | 350,055 | 268,309 | 170,854 | 349,438 | 30,829 | 113,364 | 25,800 | 588 | 4,578,984 | (12) | 4,578,972 |
| Fees and commission expenses | (1,297,186) | (143,616) | (60,673) | (38,006) | (2,942) | (154) | (3,229) | (3,922) | (3,511) | (1,553,239) | - | (1,553,239) |
| Total fees and commission income, net | 1,972,561 | 206,439 | 207,636 | 132,848 | 346,496 | 30,675 | 110,135 | 21,878 | (2,923) | 3,025,745 | (12) | 3,025,733 |
| Other operating income | 433,887 | 29,704 | 6,158 | 68,288 | 13,341 | 5,830 | (9,392) | 7,067 | 986,126 | 1,541,009 | (5,762) | 1,535,247 |
| Dividends and net income on equity investments | 131,029 | 5,562 | 211 | 668 | 43,498 | 24,810 | 16,514 | 27 | 269,736 | 492,055 | (111,456) | 380,599 |
| Total operating income, net | 8,516,356 | 953,804 | 927,730 | 421,259 | 377,104 | 92,653 | 180,514 | 525,114 | 1,053,498 | 13,048,032 | (316,684) | 12,731,348 |
| Operating expenses(2) | (5,203,354) | (573,042) | (444,933) | (358,923) | (121,259) | (32,558) | (112,204) | (61,087) | (522,103) | (7,429,463) | 236 | (7,429,227) |
| Impairment, depreciation and amortization | (407,102) | (105,232) | (46,381) | (120,130) | (1,031) | (187) | (1,738) | (2,746) | (138,738) | (823,285) | (1,305) | (824,590) |
| Total operating expenses | (5,610,456) | (678,274) | (491,314) | (479,053) | (122,290) | (32,745) | (113,942) | (63,833) | (660,841) | (8,252,748) | (1,069) | (8,253,817) |
| Profit before tax | 2,905,900 | 275,530 | 436,416 | (57,794) | 254,814 | 59,908 | 66,572 | 461,281 | 392,657 | 4,795,284 | (317,753) | 4,477,531 |
| (1) | For further information about income from contracts with customers, see Note 25.3 Fees and commissions. |
| (2) | Includes staff costs, other administration and general expenses, contributions and other tax burdens and others. |
| | For the year ended December 31, 2018 |
| | Banking
Colombia | Banking
Panama | Banking El
Salvador | Banking
Guatemala | Trust | Investment
banking | Brokerage | Off shore | All other
segments | Total before
eliminations | Adjustments for
consolidation | Total after
eliminations |
| | In millions of COP |
| Total interest and valuation | 12,215,644 | 1,573,928 | 931,405 | 894,934 | 404 | 22 | 24,273 | 547,878 | 14,737 | 16,203,225 | (86,725) | 16,116,500 |
| Interest income on loans and financial leases | 11,990,678 | 1,449,441 | 861,174 | 821,276 | - | - | - | 434,754 | 9,049 | 15,566,372 | 52 | 15,566,424 |
| Total Debt investments | 366,354 | 101,599 | 25,081 | 72,896 | 105 | 22 | 14,728 | 20,559 | 32 | 601,376 | (2) | 601,374 |
| Derivatives | (17,023) | (13,250) | - | - | - | - | 7,694 | 86,779 | - | 64,200 | (86,775) | (22,575) |
| Total liquidity operations | (124,365) | 36,138 | 45,150 | 762 | 299 | - | 1,851 | 5,786 | 5,656 | (28,723) | - | (28,723) |
| Interest expenses | (4,194,772) | (558,126) | (252,351) | (360,988) | (39) | - | (15) | (247,666) | (56,259) | (5,670,216) | - | (5,670,216) |
| Net interest margin and valuation on financial instruments before impairment on loans and financial leases, off balance sheet credit instruments and other financial instruments | 8,020,872 | 1,015,802 | 679,054 | 533,946 | 365 | 22 | 24,258 | 300,212 | (41,522) | 10,533,009 | (86,725) | 10,446,284 |
| Total credit impairment charges, net | (3,354,330) | (269,164) | (94,301) | (136,289) | (826) | (135) | 155 | 19,039 | (7,221) | (3,843,072) | - | (3,843,072) |
| Net interest margin and valuation income on financial instruments after impairment on loans and financial leases and off balance sheet credit instruments | 4,666,542 | 746,638 | 584,753 | 397,657 | (461) | (113) | 24,413 | 319,251 | (48,743) | 6,689,937 | (86,725) | 6,603,212 |
| Revenues (Expenses) from transactions with other operating segments of the Bank | (6,986) | (30,634) | (2,029) | (7,574) | (32,509) | 20,187 | 55,843 | 98,987 | (95,285) | - | - | - |
| Fees and commission income(1) | 2,841,302 | 312,762 | 227,114 | 141,253 | 313,908 | 20,271 | 113,970 | 20,840 | 2,988 | 3,994,408 | (149) | 3,994,259 |
| Fees and commission expenses | (1,009,573) | (120,520) | (43,216) | (29,320) | (2,380) | (46) | (2,734) | (3,408) | (1,859) | (1,213,056) | - | (1,213,056) |
| Total fees and commission income, net | 1,831,729 | 192,242 | 183,898 | 111,933 | 311,528 | 20,225 | 111,236 | 17,432 | 1,129 | 2,781,352 | (149) | 2,781,203 |
| Other operating income | 250,598 | 39,781 | 4,842 | 52,287 | 19,826 | 965 | (10,468) | 15,668 | 912,738 | 1,286,237 | (34,670) | 1,251,567 |
| Dividends and net income on equity investments | (49,316) | 4,240 | 1,894 | 580 | 18,572 | (67,990) | (12,416) | (270,523) | (34,485) | (409,444) | 703,474 | 294,030 |
| Recovery (Impairment) charges on cash-generating unit | - | - | - | - | - | 173,339(2) | - | - | (4,583) | 168,756 | - | 168,756 |
| Total operating income, net | 6,692,567 | 952,267 | 773,358 | 554,883 | 316,956 | 146,613 | 168,608 | 180,815 | 730,771 | 10,516,838 | 581,930 | 11,098,768 |
| Operating expenses(3) | (4,902,500) | (554,890) | (402,831) | (373,279) | (111,614) | (24,110) | (98,687) | (53,313) | (467,770) | (6,988,994) | (2) | (6,988,996) |
| Impairment, depreciation and amortization | (177,779) | (55,127) | (26,122) | (84,996) | (588) | (131) | (1,402) | (2,072) | (144,722) | (492,939) | (963) | (493,902) |
| Total operating expenses | (5,080,279) | (610,017) | (428,953) | (458,275) | (112,202) | (24,241) | (100,089) | (55,385) | (612,492) | (7,481,933) | (965) | (7,482,898) |
| Profit before tax | 1,612,288 | 342,250 | 344,405 | 96,608 | 204,754 | 122,372 | 68,519 | 125,430 | 118,279 | 3,034,905 | 580,965 | 3,615,870 |
| (1) | For further information about income from contracts with customers, see Note 25.3 Fees and commissions. |
| (2) | Includes imparment recovery in joint venture Compañía de Financiamiento Tuya S.A. For more information see Note 8 Investments in associates and joint ventures. |
| (3) | Includes staff costs, other administration and general expenses, contributions and other tax burdens and others. |
| | For the year ended December 31, 2017(1) |
| | Banking
Colombia | Banking
Panama | Banking El
Salvador | Banking
Guatemala | Trust | Investment
Banking | Brokerage | Off shore | All other
segments | Total before
eliminations | Adjustments for
consolidation | Total after
eliminations |
| | In millions of COP |
| Total interest and valuation | 12,995,017 | 1,495,446 | 882,806 | 865,038 | 794 | 94 | 8,916 | 444,649 | 10,201 | 16,702,961 | (6,568) | 16,696,393 |
| Interest income on loans and financial leases | 12,586,875 | 1,374,398 | 830,050 | 767,986 | - | - | - | 412,418 | 13,000 | 15,984,727 | (426) | 15,984,301 |
| Total Debt investments | 602,304 | 93,154 | 31,582 | 100,193 | 193 | 94 | 15,147 | 16,329 | 735 | 859,731 | - | 859,731 |
| Derivatives | (54,156) | 438 | - | - | - | - | (7,661) | 6,085 | (289) | (55,583) | (6,084) | (61,667) |
| Total liquidity operations | (140,006) | 27,456 | 21,174 | (3,141) | 601 | - | 1,430 | 9,817 | (3,245) | (85,914) | (58) | (85,972) |
| Interest expenses | (4,791,976) | (523,312) | (256,994) | (348,726) | (102) | - | (72) | (226,304) | (85,928) | (6,233,414) | 428 | (6,232,986) |
| Net interest margin and valuation on financial instruments before impairment on loans and financial leases, off balance sheet credit instruments and other financial instruments | 8,203,041 | 972,134 | 625,812 | 516,312 | 692 | 94 | 8,844 | 218,345 | (75,727) | 10,469,547 | (6,140) | 10,463,407 |
| Total credit impairment charges, net | (3,195,837) | (46,468) | (110,018) | (125,877) | (549) | 466 | (147) | 6,541 | 1,696 | (3,470,193) | 8,576 | (3,461,617) |
| Net interest margin and valuation income on financial instruments after impairment on loans and financial leases and off balance sheet credit instruments | 5,007,204 | 925,666 | 515,794 | 390,435 | 143 | 560 | 8,697 | 224,886 | (74,031) | 6,999,354 | 2,436 | 7,001,790 |
| Revenues (Expenses) from transactions with other operating segments of the Bank | (59,884) | (26,837) | (963) | (972) | (33,024) | 16,209 | 53,075 | 101,327 | (48,931) | - | - | - |
| Fees and commission income(2) | 2,531,221 | 317,753 | 211,159 | 126,022 | 285,648 | 28,747 | 97,185 | 19,390 | 3,989 | 3,621,114 | - | 3,621,114 |
| Fees and commission expenses | (889,481) | (112,986) | (40,325) | (24,457) | (1,982) | (52) | (482) | (2,874) | (2,476) | (1,075,115) | - | (1,075,115) |
| Total fees and commission income, net | 1,641,740 | 204,767 | 170,834 | 101,565 | 283,666 | 28,695 | 96,703 | 16,516 | 1,513 | 2,545,999 | - | 2,545,999 |
| Other operating income | 608,025 | 8,662 | (7,799) | 54,246 | 13,560 | 1,886 | (11,647) | 6,428 | 885,182 | 1,558,543 | (4,806) | 1,553,737 |
| Dividends and net income on equity investments | (53,141) | 7,038 | 324 | 608 | 18,249 | (70,114) | 12,278 | (239,328) | (61,156) | (385,242) | 675,884 | 290,642 |
| Recovery (Impairment) charges on cash-generating unit | - | - | - | - | - | (173,339)(3) | - | - | - | (173,339) | - | (173,339) |
| Total operating income, net | 7,143,944 | 1,119,296 | 678,190 | 545,882 | 282,594 | (196,103) | 159,106 | 109,829 | 702,577 | 10,545,315 | 673,514 | 11,218,829 |
| Operating expenses(4) | (4,715,976) | (569,219) | (383,002) | (343,646) | (113,482) | (34,100) | (101,255) | (56,593) | (430,212) | (6,747,485) | 538 | (6,746,947) |
| Impairment, depreciation and amortization | (147,262) | (55,197) | (34,671) | (101,392) | (540) | (133) | (1,398) | (967) | (137,377) | (478,937) | (174) | (479,111) |
| Total operating expenses | (4,863,238) | (624,416) | (417,673) | (445,038) | (114,022) | (34,233) | (102,653) | (57,560) | (567,589) | (7,226,422) | 364 | (7,226,058) |
| Profit before tax | 2,280,706 | 494,880 | 260,517 | 100,844 | 168,572 | (230,336) | 56,453 | 52,269 | 134,988 | 3,318,893 | 673,878 | 3,992,771 |
| (1) | Some figures in the performance by operating segment disclosure for the year ended as of December 31, 2017 disclosed in the Bank’s annual report in 2017 have been reclassified in the process of adopting IFRS 15. |
| (2) | For further information about income from contracts with customers, see Note 25.3 Fees and commissions. |
| (3) | Includes imparment recognition in joint venture Compañía de Financiamiento Tuya S.A. For more information see Note 8 Investments in associates and joint ventures. |
| (4) | Includes staff costs, other administration and general expenses, contributions and other tax burdens and others. |
The following table presents financial information of the total assets and liabilities by operating segment:
| As of December 31, 2019 |
| In millions of COP |
| | Banking
Colombia | Banking
Panama | Banking El
Salvador | Banking
Guatemala | Trust | Investment
banking | Brokerage | Off shore | All other
segments | Total before
eliminations | Adjustments
for
consolidation | Total after
eliminations |
| Total assets | 162,531,140 | 33,196,996 | 16,035,662 | 14,333,631 | 638,147 | 1,763,260 | 304,211 | 18,283,107 | 9,923,085 | 257,009,239 | (20,921,126) | 236,088,113 |
| Total liabilities | (145,013,642) | (29,632,112) | (14,154,533) | (13,093,982) | (99,867) | (43,700) | (56,583) | (11,833,818) | (2,738,052) | (216,666,289) | 9,383,795 | (207,282,494) |
| As of December 31, 2018 |
| In millions of COP |
| | Banking
Colombia | Banking
Panama | Banking El
Salvador | Banking
Guatemala | Trust | Investment
banking | Brokerage | Off shore | All other
segments | Total before
eliminations | Adjustments
for
consolidation | Total after
eliminations |
| Total assets | 149,185,338 | 31,116,800 | 14,704,427 | 13,556,250 | 580,205 | 1,779,618 | 301,851 | 17,963,675 | 9,638,514 | 238,826,678 | (18,750,196) | 220,076,482 |
| Total liabilities | (132,722,635) | (27,761,479) | (12,963,237) | (12,209,984) | (86,524) | (40,741) | (57,765) | (12,640,349) | (2,336,273) | (200,818,987) | 7,397,730 | (193,421,257) |
The following table presents financial information of the investments in associates and joint ventures by operating segment:
| As of December 31, 2019(1) |
| | Banking
Colombia | BankingEl
Salvador | Trust | Investment
banking | All other
segments | Total |
| In millions of COP |
| Investments in associates and joint ventures | 358,822 | 13,859 | 262,958 | 481,801 | 1,250,317 | 2,367,757 |
| Equity method | 59,998 | 201 | 43,707 | 3,067 | 142,258 | 249,231 |
| (1) | As of December 31, 2019, Banking Panama, Banking Guatemala, Brokerage and off shore did not have investments in associates and joint ventures. |
| As of December 31, 2018(1) |
| | Banking
Colombia | BankingEl
Salvador | Trust | Investment
banking | All other
segments | Total |
| In millions of COP |
| Investments in associates and joint ventures | 313,081 | 13,544 | 230,211 | 451,113 | 1,141,630 | 2,149,579 |
| Equity method | 32,859 | 1,887 | 20,235 | 27,909 | 104,924 | 187,814 |
| (1) | As of December 31, 2018, Banking Panama, Banking Guatemala, Brokerage and off shore did not have investments in associates and joint ventures. |
For additional information related to investment in associates and joint ventures, see Note 8 Investments in associates and joint ventures.
The following table presents material non-cash items other than depreciation and amortization by segment:
| For the year ended December 31, 2019 |
| | Banking
Colombia | Banking
Panamá | Banking
El Salvador | Banking
Guatemala | Trust | Investment
Banking | Brokerage | Off
shore | All other
segments | Total |
| In millions of COP |
| Foreclosed assets received from impaired loans | 267,989 | 59,096 | 17,566 | 13,882 | - | - | - | 1,057 | - | 359,590 |
| Provisions | 2,566,925 | 415,339 | 80,758 | 330,161 | 205 | 251 | 4,363 | (20,356) | 7,535 | 3,385,181 |
| For the year ended December 31, 2018 |
| | Banking
Colombia | Banking
Panamá | Banking
El Salvador | Banking
Guatemala | Trust | Investment
Banking | Brokerage | Off
shore | All other
segments | Total |
| In millions of COP |
| Foreclosed assets received from impaired loans | 271,695 | 84,390 | 15,782 | 9,377 | - | - | - | 6,376 | 12,373 | 399,993 |
| Provisions | 3,368,901 | 258,983 | 97,182 | 136,923 | 826 | 135 | (155) | (18,300) | 7,130 | 3,851,625 |
| For the year ended December 31, 2017 |
| | Banking
Colombia | Banking
Panamá | Banking
El Salvador | Banking
Guatemala | Trust | Investment
Banking | Brokerage | Off
shore | All other
segments | Total |
| In millions of COP |
| Foreclosed assets received from impaired loans | 163,274 | 39,486 | 16,191 | 7,157 | - | - | - | - | 24,030 | 250,138 |
| Provisions | 3,182,198 | 62,502 | 109,846 | 124,978 | 548 | (467) | 147 | (5,477) | (5,576) | 3,468,699 |
Information about products and services
The Bank does not report revenues from external customers for each product and service or each group of similar products and services, because the information is not available and the cost to develop it is excessive.
Geographic information
The following summarizes the Bank’s total interest and valuation and long-lived assets attributable to Colombia and other foreign countries based on the country where the interest and valuation was originated:
| Geographic information | 2019 | 2018 | 2017 |
| Interest and valuation | Long-lived assets(1) | Interest and valuation | Long-lived assets(1) | Interest and valuation | Long-lived assets(1) |
| In millions of COP |
| Colombia | 13,129,674 | 7,095,848 | 12,379,140 | 4,788,744 | 13,111,518 | 4,353,782 |
| Panama | 2,592,875 | 792,841 | 2,166,482 | 378,021 | 1,986,741 | 297,832 |
| Puerto Rico | 83,303 | 1,586 | 77,917 | 321 | 68,556 | 388 |
| Peru(2) | - | - | 253 | 165,076 | 658 | 115,840 |
| El Salvador | 1,097,976 | 373,378 | 932,444 | 296,040 | 883,538 | 280,562 |
| Costa Rica | - | 107 | - | 131 | - | 80 |
| Guatemala | 978,101 | 288,794 | 895,693 | 170,078 | 866,049 | 166,662 |
| Total | 17,881,929 | 8,552,554 | 16,451,929 | 5,798,411 | 16,917,060 | 5,215,146 |
| Eliminations and translation adjustment | (501,245) | 6,173,494 | (335,429) | 6,533,616 | (220,667) | 5,999,471 |
| Total, net | 17,380,684 | 14,726,048 | 16,116,500 | 12,332,027 | 16,696,393 | 11,214,617 |
| (1) | Included assets held for sale, premises and equipment, investment property and goodwill. |
| (2) | Investments in FiduPerú S.A. and Arrendamiento Operativo CIB S.A.C were sold in 2019 and classified as Assets held for sale in the Consolidated Statement of Financial Position as of December 31, 2018. For Further information, see Note 13 Assets held for sale and inventories. |
NOTE 4. CASH AND CASH EQUIVALENTS
For purposes of the consolidated statement of cash flow and the consolidated statement of financial position, the following assets are considered as cash and cash equivalents:
| | December 31, 2019 | December 31, 2018 |
| In millions of COP |
| Cash and balances at central bank | | |
| Cash | 6,658,688 | 5,192,182 |
| Due from central banks(1) | 8,299,656 | 6,603,500 |
| Due from other private financial entities | 3,033,898 | 3,713,481 |
| Checks on hold | 154,985 | 216,323 |
| Remittances of domestic negotiated checks in transit | 108,838 | 107,531 |
| Total cash and due from banks | 18,256,065 | 15,833,017 |
| Money market transactions | | |
| Interbank borrowings | 2,465,913 | 1,965,973 |
| Reverse repurchase agreements and other similar secured loans | 3,016,064 | 931,820 |
| Total money market transactions | 5,481,977 | 2,897,793 |
| Total cash and cash equivalents | 23,738,042 | 18,730,810 |
| (1) | According to External Resolution Number 005 of 2008 issued by the Colombian Central Bank, the Parent Company must maintain the equivalent of 4.50% of its customer’s deposits with a maturity term less than 18 months as a legal banking reserve, represented in deposits at the Central Bank or as cash in hand. In addition, according to Resolution Number 177 of 2002 issued by the Guatemalian Monetary Board, Grupo Agromercantil Holding through its subsidiary Banco Agromercantil de Guatemala must maintain the equivalent of 14.60% of its customer’s deposits daily balances as a legal banking reserve, represented in unrestricted deposits at the Bank of Guatemala. For its part, according to the norm of the banks Number 3-06 of 2000 issued by the Financial System Superintendency of El Salvador, Banco Agrícola must mantain an equivalent amount between 1.00% and 25.00% of its average daily balance of deposits and debt securities in issue as a liquidity reserve, represented in unrestricted deposits or debt securities issued by El Salvador Central Bank. Finally, in accordance with the Agreement 004 of 2008 issued by the Superintendency of Banks of Panama, all Panamanian banks must maintain a minimum legal liquidity rate established at 30.00%. |
As of December 31, 2019 and 2018, there is restricted cash amounting to COP 334,190 and COP 248,662, respectively, included in other assets on the statement of financial position. For further information see Note 14 Other assets, net. Which represents margin deposits pledged as collateral for derivative contracts traded through clearing houses.
As of December 31, 2018, cash and cash equivalents held by FiduPerú S.A. Sociedad Fiduciaria COP 5,830 and Arrendamiento Operativo CIB S.A.C COP 6,646, were classified as assets held for sale in 2018, these entities were sold in 2019. For further information see Note 13 Assets held for sale and inventories, net.
NOTE 5. FINANCIAL ASSETS INVESTMENTS AND DERIVATIVES
5.1 Financial assets investments
The Bank’s securities portfolios at fair value through profit or loss, other comprehensive income and at amortized cost are listed below, as of December 31, 2019 and 2018:
As of December 31, 2019
| Financial assets investments | | Measurement methodology | Total carrying
value |
Fair value through
profit or loss | Fair value through other
comprehensive income | Amortized cost |
| In millions of COP |
| Securities issued by the Colombian Government | 5,688,942 | - | 91,230 | 5,780,172 |
| Securities issued by foreign governments | 1,076,231 | 3,595,773 | 309,603 | 4,981,607 |
| Securities issued by government entities | 71,792 | - | 1,827,127 | 1,898,919 |
| Securities issued by other financial institutions(1) | 724,880 | 254,025 | 205,203 | 1,184,108 |
| Corporate bonds | 108,904 | 55,059 | 1,585,561 | 1,749,524 |
| Total debt instruments | 7,670,749 | 3,904,857 | 4,018,724 | 15,594,330 |
| Total equity securities | 718,270 | 510,154 | | 1,228,424 |
| Total financial assets investments | | | | 16,822,754 |
| (1) | Includes mortgage-backed securities (TIPS) measured at fair value through profit or loss amounting to COP 198,115. For further information on TIPS’ fair value measurement see Note 30 fair value of assets and liabilities. |
As of December 31, 2018
| Financial assets investments | Measurement methodology | Total carrying
value |
Fair value through
profit or loss | Fair value through other
comprehensive income | Amortized cost |
| In millions of COP |
| Securities issued by the Colombian Government | 7,242,168 | - | 50,243 | 7,292,411 |
| Securities issued by foreign governments | 817,639 | 3,143,488 | 272,073 | 4,233,200 |
| Securities issued by government entities | 43,846 | - | 1,875,260 | 1,919,106 |
| Securities issued by other financial institutions(1) | 661,176 | 186,250 | 143,750 | 991,176 |
| Corporate bonds | 145,032 | - | 1,140,602 | 1,285,634 |
| Total debt instruments | 8,909,861 | 3,329,738 | 3,481,928 | 15,721,527 |
| Total equity securities | 1,101,461 | 538,487 | - | 1,639,948 |
| Total financial assets investments | | | | 17,361,475 |
| (1) | Includes mortgage-backed securities (TIPS) measured at fair value through profit or loss amounting to COP 196,920 and amortized cost amounting to COP 7. For further information on TIPS’ fair value measurement see Note 30 fair value of assets and liabilities. |
The following tables set forth the debt instruments portfolio by maturity:
As of December 31, 2019
| | Less than 1
year | Between 1 and 3
years | Between 3 and 5
years | Greater than 5
years | Total |
| In millions of COP |
| Securities at fair value through profit or loss |
| Securities issued by the Colombian Government | 1,527,763 | 3,379,950 | 125,094 | 656,135 | 5,688,942 |
| Securities issued by foreign governments | 827,285 | 17,009 | 13,600 | 218,337 | 1,076,231 |
| Securities issued by government entities | 1,533 | 61,776 | 368 | 8,115 | 71,792 |
| Securities issued by other financial institutions | 157,976 | 281,681 | 60,699 | 224,524 | 724,880 |
| Corporate bonds | 10,003 | 34,468 | 24,998 | 39,435 | 108,904 |
| Subtotal | 2,524,560 | 3,774,884 | 224,759 | 1,146,546 | 7,670,749 |
| Fair value through other comprehensive income | | | | | |
| Securities issued by foreign governments | 1,664,182 | 1,119,316 | 414,961 | 397,314 | 3,595,773 |
| Securities issued by other financial institutions | 105,894 | - | - | 148,131 | 254,025 |
| Corporate bond | 9,453 | - | - | 45,606 | 55,059 |
| Subtotal | 1,779,529 | 1,119,316 | 414,961 | 591,051 | 3,904,857 |
| Securities at amortized cost |
| Securities issued by the Colombian Government | - | 13,635 | 77,595 | - | 91,230 |
| Securities issued by foreign governments | 6,304 | 19,963 | 1,285 | 282,051 | 309,603 |
| Securities issued by government entities | 1,827,127 | - | - | - | 1,827,127 |
| Securities issued by other financial institutions | 77,264 | 127,939 | - | - | 205,203 |
| Corporate bonds | - | 244,498 | 361,111 | 979,952 | 1,585,561 |
| Subtotal | 1,910,695 | 406,035 | 439,991 | 1,262,003 | 4,018,724 |
| Total debt instruments | 6,214,784 | 5,300,235 | 1,079,711 | 2,999,600 | 15,594,330 |
For further information related to disclosures of the fair value of securities, please see Note 30 Fair value of assets and liabilities.
As of December 31, 2018
| | Less than 1
year | Between 1 and 3
years | Between 3 and 5
years | Greater than 5
years | Total |
| In millions of COP |
| Securities at fair value through profit or loss |
| Securities issued by the Colombian Government | 2,376,212 | 2,142,086 | 884,248 | 1,839,622 | 7,242,168 |
| Securities issued by foreign governments | 511,149 | 25,165 | 55,041 | 226,284 | 817,639 |
| Securities issued by government entities | 27,905 | 10,488 | 109 | 5,344 | 43,846 |
| Securities issued by other financial institutions | 169,615 | 164,208 | 105,231 | 222,122 | 661,176 |
| Corporate bonds | 28,539 | 20,739 | 47,415 | 48,339 | 145,032 |
| Subtotal | 3,113,420 | 2,362,686 | 1,092,044 | 2,341,711 | 8,909,861 |
| Fair value through other comprehensive income | | | | | |
| Securities issued by foreign governments | 1,334,351 | 1,018,119 | 593,346 | 197,672 | 3,143,488 |
| Securities issued by other financial institutions | 5,807 | - | - | 180,443 | 186,250 |
| Subtotal | 1,340,158 | 1,018,119 | 593,346 | 378,115 | 3,329,738 |
| Securities at amortized cost |
| Securities issued by the Colombian Government | 50,243 | - | - | - | 50,243 |
| Securities issued by foreign governments | 12,534 | 9,897 | 2,661 | 246,981 | 272,073 |
| Securities issued by government entities | 1,875,260 | - | - | - | 1,875,260 |
| Securities issued by other financial institutions | 85,366 | 23,650 | 34,734 | - | 143,750 |
| Corporate bonds | - | 56,546 | 265,853 | 818,203 | 1,140,602 |
| Subtotal | 2,023,403 | 90,093 | 303,248 | 1,065,184 | 3,481,928 |
| Total debt instruments | 6,476,981 | 3,470,898 | 1,988,638 | 3,785,010 | 15,721,527 |
For further information related to disclosures of the fair value of securities, please see Note 30 Fair value of assets and liabilities.
The following table shows the fair value of equity securities:
| Equity securities | Carrying amount |
| December 31, 2019 | December 31, 2018 |
| In millions of COP |
| Total of securities at fair value through profit or loss(1) | 718,270 | 1,101,461 |
| Total of securities at fair value through OCI | 510,154 | 538,487 |
| Total equity securities | 1,228,424 | 1,639,948 |
| (1) | Most of the decrease is due to the sale of Sura Asset Management by (USD 135,173) COP 423,996 in April 15, 2019 to Caisse de Dépôt et Placement du Québec (CDPQ). |
The Bank has recognized in the consolidated statement of comprehensive income COP 43,889 in 2019, COP 33,838 in 2018 and COP 38,884 in 2017 related to equity securities and trust funds at fair value through OCI. See Consolidated Statement of Comprehensive Income.
Equity securities that have been designated to be measured at fair value through OCI are considered strategic for the Bank and, thus, there is no intention to sell them in the foreseeable future and that is the main reason for using this presentation alternative.
The following table details the equity instruments designated at fair value through other comprehensive income analyzed by listing status:
| Equity securities | Carrying amount |
| December 31, 2019 | December 31, 2018 |
| In millions of COP |
| Securities at fair value through OCI: | | |
| Equity securities listed in Colombia | 69,279 | 71,626 |
| Equity securities listed in foreign countries | 6,352 | 5,319 |
| Equity securities unlisted: | | |
| TELERED | 114,906 | 100,126 |
| Asociación Gremial de Instituciones Financieras Credibanco S.A. | 96,539 | 84,807 |
| CIFI | - | 23,663 |
| Compañía De Procesamiento de Medios de Pago Guatemala (Bahamas), S. A. | 19,012 | 17,408 |
| Transacciones y Transferencias, S. A. | 4,557 | 6,424 |
| CADENALCO | 3,163 | 2,964 |
| Others | 196,346 | 226,150 |
| Total equity securities at fair value through OCI | 510,154 | 538,487 |
| (1) | During 2019 CIFI was totally sold for USD 6,122. This transaction transferred from OCI to retained earnings the amount of COP 3,685. |
During 2019, 2018 and 2017 no impairment loss was recognized on equity securities. Dividends received from equity investments at fair value through OCI held as of December 31, 2019, 2018 and 2017 amounted to COP 10,498, COP 13,105 and COP 11,951, respectively. See Note 25.5 Dividends and net income on equity investments.
Equity investments do not have a specific maturity date; therefore, they are not included in the maturity detail.
The detail of the securities pledged as collateral as of December 31, 2019 and 2018 is as follows:
As of December 31, 2019
| Pledged financial assets | Term | Security pledged | Carrying amount |
| In millions of COP |
| Investments pledged as collateral in money market |
| Securities issued by the Colombian Government | Less than 3 months | TES-Treasury instruments | 49,591 |
| Securities issued by the Colombian Government | Greater than 12 months | TES-Treasury instruments | 709,439 |
| Securities issued by foreign governments | Greater than 12 months | Bonds | 131,086 |
| Subtotal investments pledged as collateral in money market | 890,116 |
| Investments pledged as collateral in derivative operations | |
| Securities issued by the Colombian Government | Less than 3 months | TES - Treasury instruments | 114,060 |
| Securities issued by the Colombian Government | Between 6 and 12 months | TES - Treasury instruments | 8,150 |
| Securities issued by the Colombian Government | Greater than 12 months | TES - Treasury instruments | 101,229 |
| Equity securities listed in stock market | Permanent | Stocks | 7,664 |
| Subtotal investments pledged as collateral in derivative operations | 231,103 |
| Total securities pledged as collateral | 1,121,219 |
As of December 31, 2018
| Pledged financial assets | Term | Security pledged | Carrying amount |
| In millions of COP |
| Investments pledged as collateral in money market |
| Equity securities listed in stock market | Less than 3 months | Stocks | 2,855 |
| Securities issued by the Colombian Government | Less than 3 months | TES-Treasury instruments | 264,292 |
| Securities issued by the Colombian Government | Between 3 and 6 months | TES-Treasury instruments | 67,658 |
| Securities issued by the Colombian Government | Between 6 and 12 months | TES-Treasury instruments | 713,974 |
| Securities issued by the Colombian Government | Greater than 12 months | TES-Treasury instruments | 1,131,623 |
| Securities issued by foreign governments | Greater than 12 months | Bonds | 285,463 |
| Securities issued by other financial institutions | Greater than 12 months | CDT | 181,951 |
| Subtotal investments pledged as collateral in money market | 2,647,816 |
| Investments pledged as collateral in derivative operations | |
| Equity securities listed in stock market | Less than 3 months | Stocks | 91 |
| Securities issued by the Colombian Government | Between 3 and 6 months | TES - Treasury instruments | 1,353 |
| Securities issued by the Colombian Government | Between 6 and 12 months | TES - Treasury instruments | 168,375 |
| Securities issued by the Colombian Government | Greater than 12 months | TES - Treasury instruments | 10,182 |
| Subtotal investments pledged as collateral in derivative operations | 180,001 |
| Total securities pledged as collateral | 2,827,817 |
The following table shows the breakdown of the changes in the gross carrying amount of the debt securities at Fair value through other comprehensive income and Amortized cost, in order to explain their significance to the changes in the loss allowance for the same portfolio as discussed above:
As of December 31, 2019
| Debt instruments portfolio | Stage 1 | Stage 2 | Total |
| In millions of COP |
| Gross carrying amount as at 1 January 2019 | 6,785,507 | 26,159 | 6,811,666 |
| Change in measurement(1) | 12,645 | - | 12,645 |
| Financial assets derecognized during the period other than write-offs | (3,596,773) | (393) | (3,597,166) |
| New financial assets purchased | 4,670,615 | 69,592 | 4,740,207 |
| Valuation on investments and Write-offs | (71,124) | 260 | (70,864) |
| Foreign exchange | 26,876 | 217 | 27,093 |
| Gross carrying amount as at 31 December 2019 | 7,827,746 | 95,835 | 7,923,581 |
| (1) | Change in measurement took place on a corporate bond of Banco Agrícola S.A. debt instruments portfolio from fair value through profit or loss to amortized cost. |
As of December 31, 2018
| Debt instruments portfolio measure at fair value through OCI and amortized cost | Stage 1 | Stage 2 | Total |
| In millions of COP |
| Gross carrying amount as at 1 January 2018 | 5,673,059 | 440,273 | 6,113,332 |
| Transfers: | | | |
| Transfer from Stage 2 to Stage 1 | 153,447 | (153,447) | - |
| Change in measurement(1) | 130,671 | - | 130,671 |
| Financial assets derecognized during the period other than write-offs | (3,124,605) | (279,488) | (3,404,093) |
| New financial assets purchased | 3,859,206 | 393 | 3,859,599 |
| Valuation on investments and Write-offs | (133,232) | 4,109 | (129,123) |
| Foreign exchange | 226,961 | 14,319 | 241,280 |
| Gross carrying amount as at 31 December 2018 | 6,785,507 | 26,159 | 6,811,666 |
| (1) | Changes in measurement correspond to transfer a certain debt instruments of Grupo Agromercantil Holding from fair value through profit or loss to amortized cost. |
The following shows provisions detail for the debt instruments portfolio using the expected credit losses model:
As of December 31, 2019
| Concept | Stage 1 | Stage 2 | Total |
| In millions of COP |
| Securities at amortized cost | 3,922,889 | 95,835 | 4,018,724 |
| Carrying amount | 3,933,039 | 97,423 | 4,030,462 |
| Loss allowance | (10,150) | (1,588) | (11,738) |
| Securities at fair value through other comprehensive income | 3,904,857 | - | 3,904,857 |
| Carrying amount | 3,907,720 | - | 3,907,720 |
| Loss allowance | (2,863) | - | (2,863) |
As of December 31, 2018
| Concept | Stage 1 | Stage 2 | Total |
| In millions of COP |
| Securities at amortized cost | 3,456,164 | 25,764 | 3,481,928 |
| Carrying amount | 3,467,285 | 26,373 | 3,493,658 |
| Loss allowance | (11,121) | (609) | (11,730) |
| Securities at fair value through other comprehensive income | 3,329,345 | 393 | 3,329,738 |
| Carrying amount | 3,332,398 | 393 | 3,332,791 |
| Loss allowance | (3,053) | - | (3,053) |
The changes in the allowance are mainly due to the application of the expected credit losses model to debt instruments measured at amortized cost.
The following table sets forth the changes in the allowance for debt instruments measured at amortized cost and fair value through other comprehensive income:
As of December 31, 2019
| Concept | Stage 1 | Stage 2 | Total |
| In millions of COP |
| Balance of January 1, 2019 | 14,174 | 609 | 14,783 |
| Net effect of loss allowance changes | (38) | - | (38) |
| New debt instruments purchased | 5,512 | 975 | 6,487 |
| Debt instruments that have been derecognized | (6,704) | - | (6,704) |
| Translation adjustment | 69 | 4 | 73 |
| Balance of December 31, 2019 | 13,013 | 1,588 | 14,601 |
The increase in stage 2 is due to purchases of Securities issued by the Guatemalan government.
As of December 31, 2018
| Concept | Stage 1 | Stage 2 | Total |
| In millions of COP |
| Balance of January 1, 2018 | 8,932 | 6,797 | 15,729 |
| Net effect in loss allowance changes | 4,730 | (1,956) | 2,774 |
| Transfer to stage 1 | 488 | (488) | - |
| New debt instruments purchased | 6,693 | - | 6,693 |
| Debt instruments that have been derecognized | (6,673) | (3,750) | (10,423) |
| Translation adjustment | 4 | 6 | 10 |
| Balance of December 31, 2018 | 14,174 | 609 | 14,783 |
The decrease in stage 2 is due to changes in debt instruments to stage 1 due to improvements in portfolio’s credit risk and a better performance of the Salvadorian economy due to an increase of the received remittances.
5.2 Derivative financial instruments
The Bank derivative activities do not give rise to significant open positions in portfolios of derivatives. The Bank enters into derivative transactions to facilitate customer business, for hedging purposes and arbitrage activities, such as forwards, options or swaps where the underlying are exchange rates, interest rates and securities.
A swap agreement is a contract between two parties to exchange cash flows based on specified underlying notional amounts, assets and/or indices. Financial futures and forward settlement contracts are agreements to buy or sell a quantity of a financial instrument (including another derivative financial instrument), index, currency or commodity at a predetermined rate or price during a period or at a date in the future. Futures and option contracts are standardized agreements for future delivery, traded on exchanges that typically act as a platform.
For further information related to the objectives, policies and processes for managing the Bank’s risk, please see Note 31 Risk management.
The following table sets forth the carrying values of the Bank’s derivatives by type of risk as of December 31, 2019 and 2018:
| Derivatives | December 31, 2019 | December 31, 2018 |
| In millions of COP |
| Forwards |
| Assets | | |
| Foreign exchange contracts | 715,365 | 294,345 |
| Equity contracts | 2,143 | 981 |
| Subtotal assets | 717,508 | 295,326 |
| Liabilities | | |
| Foreign exchange contracts | (768,015) | (299,015) |
| Equity contracts | (4,346) | (7,585) |
| Subtotal liabilities | (772,361) | (306,600) |
| Total forwards | (54,853) | (11,274) |
| Swaps | | |
| Assets | | |
| Foreign exchange contracts | 757,296 | 1,199,236 |
| Interest rate contracts | 372,553 | 252,928 |
| Subtotal assets | 1,129,849 | 1,452,164 |
| Liabilities | | |
| Foreign exchange contracts | (652,610) | (700,903) |
| Interest rate contracts | (377,341) | (257,978) |
| Subtotal liabilities | (1,029,951) | (958,881) |
| Total swaps | 99,898 | 493,283 |
| Options | | |
| Assets | | |
| Foreign exchange contracts | 55,598 | 96,218 |
| Subtotal assets | 55,598 | 96,218 |
| Liabilities | | |
| Foreign exchange contracts | (58,500) | (29,589) |
| Subtotal liabilities | (58,500) | (29,589) |
| Total options | (2,902) | 66,629 |
| Derivative assets | 1,902,955 | 1,843,708 |
| Derivative liabilities | (1,860,812) | (1,295,070) |
The table below present the notional amounts of the derivatives contracts as of December 31, 2019 and 2018:
| Derivatives | December 31, 2019 | December 31, 2018 |
| In millions of COP |
| Forwards |
| Assets | | |
| Foreign exchange contracts | 14,682,330 | 10,968,445 |
| Equity contracts | 790,715 | 495,124 |
| Subtotal assets | 15,473,045 | 11,463,569 |
| Liabilities | | |
| Foreign exchange contracts | (16,753,243) | (11,482,549) |
| Equity contracts | (1,781,398) | (2,278,708) |
| Subtotal liabilities | (18,534,641) | (13,761,257) |
| Total forwards | (3,061,596) | (2,297,688) |
| Swaps | | |
| Assets | | |
| Foreign exchange contracts | 8,974,412 | 10,504,017 |
| Interest rate contracts | 27,128,780 | 21,281,866 |
| Subtotal assets | 36,103,192 | 31,785,883 |
| Liabilities | | |
| Foreign exchange contracts | (8,322,241) | (4,962,024) |
| Interest rate contracts | (17,995,622) | (16,997,169) |
| Subtotal liabilities | (26,317,863) | (21,959,193) |
| Total swaps | 9,785,329 | 9,826,690 |
| Options | | |
| Assets | | |
| Foreign exchange contracts | 2,445,445 | 1,797,496 |
| Subtotal assets | 2,445,445 | 1,797,496 |
| Liabilities | | |
| Foreign exchange contracts | (2,412,778) | (1,638,795) |
| Subtotal liabilities | (2,412,778) | (1,638,795) |
| Total options | 32,667 | 158,701 |
| Futures | | |
| Assets | | |
| Foreign exchange contracts | 5,826,363 | 1,426,478 |
| Equity contracts | 4 | 54,002 |
| Subtotal assets | 5,826,367 | 1,480,480 |
| Liabilities | | |
| Foreign exchange contracts | (492) | (1,434,115) |
| Equity contracts | (4) | (3,000) |
| Subtotal liabilities | (496) | (1,437,115) |
| Total futures | 5,825,871 | 43,365 |
| Derivative assets | 59,848,049 | 46,527,428 |
| Derivative liabilities | (47,265,778) | (38,796,360) |
The following table sets forth the remaining contractual life of the derivatives portfolio:
As of December 31, 2019
| | Forwards | Swaps | Options | Total |
| In millions of COP |
| Assets | 717,508 | 1,129,849 | 55,598 | 1,902,955 |
| Less than 1 year | 712,990 | 281,412 | 51,475 | 1,045,877 |
| Between 1 and 3 years | 4,518 | 364,797 | 4,123 | 373,438 |
| Greater than 3 years | - | 483,640 | - | 483,640 |
| Liabilities | (772,361) | (1,029,951) | (58,500) | (1,860,812) |
| Less than 1 year | (757,560) | (259,645) | (51,686) | (1,068,891) |
| Between 1 and 3 years | (14,801) | (311,324) | (6,814) | (332,939) |
| Greater than 3 years | - | (458,982) | - | (458,982) |
| Total | (54,853) | 99,898 | (2,902) | 42,143 |
As of December 31, 2018
| | Forwards | Swaps | Options | Total |
| In millions of COP |
| Assets | 295,326 | 1,452,164 | 96,218 | 1,843,708 |
| Less than 1 year | 277,578 | 645,735 | 69,292 | 992,605 |
| Between 1 and 3 years | 17,741 | 345,321 | 26,926 | 389,988 |
| Greater than 3 years | 7 | 461,108 | - | 461,115 |
| Liabilities | (306,600) | (958,881) | (29,589) | (1,295,070) |
| Less than 1 year | (292,585) | (270,900) | (17,305) | (580,790) |
| Between 1 and 3 years | (14,015) | (262,848) | (12,284) | (289,147) |
| Greater than 3 years | - | (425,133) | - | (425,133) |
| Total | (11,274) | 493,283 | 66,629 | 548,638 |
Collateral for derivatives
The table below presents the cash collateral amounts posted under derivatives contracts as of December 31, 2019 and 2018:
| | December 31, 2019 | December 31, 2018 |
| In millions of COP |
| Collateral paid | 291,150 | 213,677 |
| Collateral received | (324,768) | (471,340) |
Hedge accounting
The Bank, through Banistmo, has entered into derivatives to manage its interest risk. Those derivatives are designated as hedging instruments to protect the Bank against changes in the fair value of Banistmo´s position in debt instruments issued by the Panamanian Government (fair value hedge). The hedge effectiveness assessment is performed on a monthly basis consistently throughout the hedging relationship. For fair value hedges, the changes in value of the hedging derivative, as well as the changes in value of the related hedged item concerning to the risk hedged, are reflected in the statement of income in the line “Interest and valuation on investments”.
Fair value hedging
As of December 31, 2019 and 2018, Banistmo has designated 8 derivative contracts (Interest rate swaps), as fair value hedging instruments with maturity dates ranging from July 2022.
The following table contains details of the hedged expresures covered by the Group's hedging strategies:
| December 31, 2019 |
| In millions of COP |
| | Carrying amount of hedged
item | Accumulated amount of fair value
adjustments on the hedged item | Balance sheet line item |
| | Assets | Liabilities | |
| Fair value hedges | | | |
| Interest rate | | | |
| - Fixed rate | 287,670 | (4,955) | Financial assets investments |
| December 31, 2019 |
| In thousands of USD |
| | Carrying amount of hedged
item | Accumulated amount of fair value
adjustments on the hedged item | Balance sheet line item |
| | Assets | Liabilities | |
| Fair value hedges | | | |
| Interest rate | | | |
| -Fixed rate | 87,781 | (1,512) | Financial assets investments |
| December 31, 2018 |
| In millions of COP |
| | Carrying amount of hedged
item | Accumulated amount of fair value
adjustments on the hedged item | Balance sheet line item |
| | Assets | Assets | |
| Fair value hedges | | | |
| Interest rate | | | |
| - Fixed rate | 285,463 | 1,829 | Financial assets investments |
| December 31, 2018 |
| In thousands of USD |
| | Carrying amount of hedged
item | Accumulated amount of fair value
adjustments on the hedged item | Balance sheet line item |
| | Assets | Assets | |
| Fair value hedges | | | |
| Interest rate | | | |
| -Fixed rate | 87,841 | 563 | Financial assets investments |
The following table sets forth the notional amount and fair value of the hedged item recognized in the statement of financial position as ‘Financial assets investments’, as of December 31, 2019 and 2018:
| | December 31, 2019 | December 31, 2018 |
| In millions of COP |
| Notional amount | 260,696 | 258,518 |
| Fair value | 287,670 | 285,463 |
| | December 31, 2019 | December 31, 2018 |
| In thousands of USD |
| Notional amount | 79,550 | 79,550 |
| Fair value | 87,781 | 87,841 |
The following table contains information regarding the effectiveness of the hedging relationships designated by the Group, as well as the impacts on profit or loss and other comprehensive income:
| December 31, 2019 |
| In millions of COP |
| | Gains / (loss) recognized in
OCI | Hedge Ineffectiveness recognized in
P&L | P&L line item that includes hedge
ineffectiveness |
| Fair value hedges | | | |
| Interest rate | | | |
| - Fixed rate | - | 663 | Other operating income |
| December 31, 2018 |
| In millions of COP |
| | Gains / (loss) recognized in
OCI | Hedge Ineffectiveness recognized in
P&L | P&L line item that includes hedge
ineffectiveness |
| Fair value hedges | | | |
| Interest rate | | | |
| - Fixed rate | - | 14,158 | Other operating income |
December 31, 2017 |
| In millions of COP |
| | Gains / (loss) recognized in
OCI | Hedge Ineffectiveness recognized in
P&L | P&L line item that includes hedge
ineffectiveness |
| Fair value hedges | | | |
| Interest rate | | | |
| - Fixed rate | - | (3,678) | Other operating income |
Net foreign investment
The Bank has designated debt securities in issue for USD 2,200,000 as a hedged instrument for hedging a portion of the net assets of Banistmo S.A.. Consequently, the exchange difference relating to the translation of the net assets of Banistmo from its functional currency (dollar) to the Bank's presentation currency (Colombian pesos) are recognized directly in other comprehensive income by the Parent Company. The adjustment recognized in other comprehensive income amounted to COP (60,258), COP (584,650) and COP 36,762, for the years ended at December 31, 2019, 2018 and 2017, respectively.
For further information see note 18 Debt instruments in issue.
Offsetting of derivatives
The Bank enters into International Swaps and Derivatives Association (ISDA) master netting agreements or similar agreements with substantially all of the Bank’s derivative counterparties. Where legally enforceable, and depending on the Bank’s intention, these master netting agreements give the Bank, in the event of default by the counterparty, the right to liquidate securities and cash equivalents held as collateral and to offset receivables and payables with the same counterparty.
The table below presents derivative instruments subject to enforceable master netting agreements and other similar agreements but not offset in the statement of financial position as of December 31, 2019 and 2018 by derivative and by risk:
As of December 31, 2019
| | Derivatives Assets | Derivatives Liabilities |
| In millions of COP |
| Over-the-counter |
| Foreign exchange contracts |
| Swaps | 757,296 | (652,610) |
| Forwards | 715,365 | (768,015) |
| Options | 55,598 | (58,500) |
| Interest rate contracts | | |
| Swaps | 372,553 | (377,341) |
| Equity contracts | | |
| Forwards | 2,143 | (4,346) |
| Gross derivative assets/liabilities | 1,902,955 | (1,860,812) |
| Offseting of derivates | - | - |
| Derivative financial instruments in statement of financial position | 1,902,955 | (1,860,812) |
| Master netting agreements | (1,803,407) | 1,787,511 |
| Cash collateral received/paid | (99,548) | 73,301 |
| Total derivative financial instruments assetss/ liabilities before collateral and Master netting agreements | - | - |
As of December 31, 2018
| | Derivatives Assets | Derivatives Liabilities |
| In millions of COP |
| Over-the-counter |
| Foreign exchange contracts |
| Swaps | 1,199,236 | (700,903) |
| Forwards | 294,345 | (299,015) |
| Options | 96,218 | (29,589) |
| Interest rate contracts | | |
| Swaps | 252,928 | (257,978) |
| Equity contracts | | |
| Forwards | 981 | (7,585) |
| Gross derivative assets/liabilities | 1,843,708 | (1,295,070) |
| Offseting of derivates | - | - |
| Derivative financial instruments in statement of financial position | 1,843,708 | (1,295,070) |
| Master netting agreements | (1,179,503) | 1,295,070 |
| Cash collateral received/paid | (471,340) | - |
| Total derivative financial instruments assetss/ liabilities before collateral and Master netting agreements | 192,865 | - |
For further information about offsetting of other financial assets and liabilities see Note 16 Interbank deposits and repurchase agreements and other similar secured borrowing.
NOTE 6. LOANS AND ADVANCES TO CUSTOMERS AND FINANCIAL INSTITUTIONS, NET
Loans and financial leasing operating portfolio
The following is the composition of the loans and financial leasing operations portfolio, net as of December 31, 2019 and 2018:
| Composition | December 31, 2019 | December 31, 2018 |
| In millions of COP |
| Commercial(1) | 92,768,553 | 94,600,648 |
| Consumer | 39,700,670 | 31,993,381 |
| Mortgage | 23,983,283 | 22,870,685 |
| Financial Leases(2) | 24,550,829 | 23,198,204 |
| Small Business Loans | 1,279,408 | 1,156,198 |
| Total gross loans and advances to customers and financial institutions | 182,282,743 | 173,819,116 |
| Total allowance | (10,929,395) | (10,235,831) |
| Total Net loans and advances to customers and financial institutions | 171,353,348 | 163,583,285 |
| (1) | Includes loans to financial institutions amounting to COP 9,686,637 and COP 8,154,507 as of December 31, 2019 and 2018, respectively. |
The following table shows the breakdown of loans to financial institutions by stage:
As of December 31, 2019
| | Stage 1 | Stage 2 | Stage 3 | TOTAL |
| Total loans to Financial institutions | 9,685,938 | 38 | 661 | 9,686,637 |
| Allowance | (23,820) | (9) | (328) | (24,157) |
| Total Net Loans with financial institutions | 9,662,118 | 29 | 333 | 9,662,480 |
As of December 31, 2018
| | Stage 1 | Stage 2 | Stage 3 | TOTAL |
| Total loans to Financial institutions | 8,140,354 | 13,812 | 341 | 8,154,507 |
| Allowance | (15,048) | (1,123) | (267) | (16,438) |
| Total Net Loans with financial institutions | 8,125,306 | 12,689 | 74 | 8,138,069 |
For more details on the composition of the loans and financial leasing operations portfolio, see Note 31 Risk Management.
Allowance for loans losses
The following table sets forth the changes in the allowance for loans and advances and lease losses as of December 31, 2019, 2018 and 2017:
As of December 31, 2019
| Concept | Commercial | Consumer | Mortgage | Financial
Leases | Small
business
loans | Total |
| | In millions of COP |
| +Balance at beginning of period January 1, 2019 | 5,360,833 | 2,892,891 | 853,764 | 990,970 | 137,373 | 10,235,831 |
| +/- Loan purchases / Loan sales (1) | (4,332) | - | - | (1,557) | - | (5,889) |
| + Recovery of charged - off loans | 139,268 | 317,722 | 33,869 | 57,057 | 3,734 | 551,650 |
| + Credit impairment charges on loans, advances and financial leases, net | 1,299,379 | 1,971,037 | 33,808 | 25,130 | 55,827 | 3,385,181 |
| + Adjusted stage 3 | 223,824 | 148,001 | 42,495 | 50,119 | 9,277 | 473,716 |
| - Charges-off | (1,572,113) | (1,890,490) | (104,720) | (97,148) | (65,909) | (3,730,380) |
| +/- Translation adjustment | 10,134 | 6,657 | 1,449 | 832 | 214 | 19,286 |
| Balance at December 31, 2019 | 5,456,993 | 3,445,818 | 860,665 | 1,025,403 | 140,516 | 10,929,395 |
| (1) | This item includes portfolio purchase/sales operation held between Bancolombia S.A. and Titularizadora Colombiana. |
As of December 31, 2018
| Concept | Commercial | Consumer | Mortgage | Financial
Leases | Small
business
loans | Total |
| | In millions of COP |
| Balance of period December 31, 2017 | 4,514,180 | 2,291,829 | 645,101 | 631,402 | 140,591 | 8,223,103 |
| + Effect of adoption of IFRS 9 | 512,959 | 237,515 | 106,692 | 176,521 | 1,374 | 1,035,061 |
| +Balance at beginning of period January 1, 2018 | 5,027,139 | 2,529,344 | 751,793 | 807,923 | 141,965 | 9,258,164 |
| +/- Loan purchases / Loan sales (1) | (2,020) | - | - | (377) | - | (2,397) |
| + Recovery of charged - off loans | 124,865 | 251,632 | 22,373 | 51,808 | 9,182 | 459,860 |
| + Credit impairment charges on loans, advances and financial leases, net | 1,463,097 | 1,943,323 | 150,873 | 231,668 | 62,664 | 3,851,625 |
| Adjusted stage 3 | 158,396 | 71,157 | 26,502 | 22,230 | 7,127 | 285,412 |
| - Charges-off | (1,468,704) | (2,012,315) | (112,417) | (135,674) | (86,802) | (3,815,912) |
| +/- Translation adjustment | 58,060 | 109,750 | 14,640 | 13,392 | 3,237 | 199,079 |
| Balance at December 31, 2018 | 5,360,833 | 2,892,891 | 853,764 | 990,970 | 137,373 | 10,235,831 |
| (1) | This item includes portfolio purchase/sales operation held between Bancolombia S.A. and Titularizadora Colombiana. |
As of December 31, 2017 (under IAS 39)
| Concept | Commercial | Consumer | Mortgage | Financial
Leases | Small
business
loans | Total |
| | In millions of COP |
| +Balance at beginning of period | 3,499,791 | 1,791,123 | 653,936 | 567,046 | 110,015 | 6,621,911 |
| + Recovery of charged - off loans | 144,852 | 197,971 | 13,933 | 45,434 | 8,670 | 410,860 |
| + Credit impairment charges on loans, advances and financial leases, net | 1,665,809 | 1,601,863 | 16,881 | 97,267 | 86,879 | 3,468,699 |
| - Charges-off | (792,145) | (1,302,630) | (37,677) | (77,762) | (65,086) | (2,275,300) |
| +/- Translation adjustment | (4,127) | 3,502 | (1,972) | (583) | 113 | (3,067) |
| = Balance at end of year | 4,514,180 | 2,291,829 | 645,101 | 631,402 | 140,591 | 8,223,103 |
The following explains the significant changes in the loans and the allowance for loans losses by category during the periods ended at December 31, 2019 and 2018 as a result of applying the expected credit loss model according to IFRS 9:
As of December 31, 2019
Commercial
| | Stage 1 | Stage 2 | Stage 3 | Total |
| | Gross
carrying | Allowance | Gross
carrying | Allowance | Gross
carrying | Allowance | Gross
carrying | Allowance |
| Balance at January 1, 2019 | 83,632,770 | (522,230) | 3,214,860 | (358,473) | 7,753,018 | (4,480,130) | 94,600,648 | (5,360,833) |
| Transfers of financial instruments: | (3,379,040) | (59,345) | 1,490,896 | (16,514) | 1,888,144 | 75,859 | - | - |
| Transfers from stage 1 to stage 2 | (2,346,307) | 20,143 | 2,346,307 | (20,143) | - | - | - | - |
| Transfers from stage 1 to stage 3 | (1,639,408) | 25,881 | - | - | 1,639,408 | (25,881) | - | - |
| Transfers from stage 2 to stage 1 | 567,870 | (90,503) | (567,870) | 90,503 | - | - | - | - |
| Transfers from stage 2 to stage 3 | - | - | (531,867) | 49,065 | 531,867 | (49,065) | - | - |
| Transfers from stage 3 to stage 1 | 38,805 | (14,866) | - | - | (38,805) | 14,866 | - | - |
| Transfers from stage 3 to stage 2 | - | - | 244,326 | (135,939) | (244,326) | 135,939 | - | - |
| Remeasurement arising from transfer of stage | (69,103) | 73,117 | (180,970) | (35,733) | (79,264) | (975,050) | (329,337) | (937,666) |
| Remeasurement from remaining in the stage | (6,053,045) | 51,741 | (107,835) | 28,901 | (329,883) | (394,399) | (6,490,763) | (313,757) |
| Remeasurement due to changes in economics factors | - | (10,026) | - | (22,778) | - | 1,184 | - | (31,620) |
| Remeasurement due to changes in model inputs | - | (3,710) | - | 17,351 | - | (9,551) | - | 4,090 |
| Remeasurement due to methodological changes | - | 39,705 | - | (25,887) | - | (4,023) | - | 9,795 |
| New financial assets purchased/originated | 45,168,819 | (288,705) | 1,158,765 | (183,524) | 1,801,096 | (1,110,945) | 48,128,680 | (1,583,174) |
| Financial assets that have been derecognized | (39,407,782) | 178,138 | (788,746) | 71,301 | (1,636,411) | 944,754 | (41,832,939) | 1,194,193 |
| Charges-off | (63,585) | 1,946 | (37,362) | 11,779 | (1,471,166) | 1,558,388 | (1,572,113) | 1,572,113 |
| Foreign Exchange and other movements | 239,722 | (5,627) | 13,415 | (653) | 11,240 | (3,854) | 264,377 | (10,134) |
| Balance at December 31, 2019 | 80,068,756 | (544,996) | 4,763,023 | (514,230) | 7,936,774 | (4,397,767) | 92,768,553 | (5,456,993) |
Consumer
| | Stage 1 | Stage 2 | Stage 3 | Total |
| | Gross
carrying | Allowance | Gross
carrying | Allowance | Gross
carrying | Allowance | Gross
carrying | Allowance |
| Balance at January 1, 2019 | 28,666,461 | (980,423) | 1,758,162 | (520,976) | 1,568,758 | (1,391,492) | 31,993,381 | (2,892,891) |
| Transfers of financial instruments: | (1,019,225) | (80,128) | 283,945 | 43,795 | 735,280 | 36,333 | - | - |
| Transfers from stage 1 to stage 2 | (795,809) | 50,864 | 795,809 | (50,864) | - | - | - | - |
| Transfers from stage 1 to stage 3 | (739,010) | 54,799 | - | - | 739,010 | (54,799) | - | - |
| Transfers from stage 2 to stage 1 | 436,178 | (115,024) | (436,178) | 115,024 | - | - | - | - |
| Transfers from stage 2 to stage 3 | - | - | (167,143) | 56,945 | 167,143 | (56,945) | - | - |
| Transfers from stage 3 to stage 1 | 79,416 | (70,767) | - | - | (79,416) | 70,767 | - | - |
| Transfers from stage 3 to stage 2 | - | - | 91,457 | (77,310) | (91,457) | 77,310 | - | - |
| Remeasurement arising from transfer of stage | (98,739) | 133,169 | (102,200) | (121,934) | 253,224 | (1,695,509) | 52,285 | (1,684,274) |
| | Stage 1 | Stage 2 | Stage 3 | Total |
| | Gross
carrying | Allowance | Gross
carrying | Allowance | Gross
carrying | Allowance | Gross
carrying | Allowance |
| Remeasurement from remaining in the stage | (2,511,256) | 1,038 | (70,576) | 35,413 | (32,301) | 10,533 | (2,614,133) | 46,984 |
| Remeasurement due to changes in economics factors | - | (9,591) | - | 3,802 | - | 735 | - | (5,054) |
| Remeasurement due to changes in model inputs | - | 126,465 | - | (47,491) | - | 4,103 | - | 83,077 |
| Remeasurement due to methodological changes | - | (32,531) | - | 2,937 | - | (7,881) | - | (37,475) |
| New financial assets purchased/originated | 19,784,995 | (664,927) | 764,355 | (258,400) | 497,769 | (434,371) | 21,047,119 | (1,357,698) |
| Financial assets that have been derecognized | (8,422,375) | 253,971 | (355,731) | 99,012 | (189,520) | 164,697 | (8,967,626) | 517,680 |
| Charges-off | (511,958) | 48,659 | (315,056) | 111,948 | (1,063,476) | 1,729,883 | (1,890,490) | 1,890,490 |
| Foreign Exchange and other movements | 69,728 | (2,393) | 6,390 | (1,532) | 4,016 | (2,732) | 80,134 | (6,657) |
| Balance at December 31, 2019 | 35,957,631 | (1,206,691) | 1,969,289 | (653,426) | 1,773,750 | (1,585,701) | 39,700,670 | (3,445,818) |
Financial Leases
| | Stage 1 | Stage 2 | Stage 3 | Total |
| | Gross
carrying | Allowance | Gross
carrying | Allowance | Gross
carrying | Allowance | Gross
carrying | Allowance |
| Balance at January 1, 2019 | 20,355,961 | (104,429) | 1,145,165 | (179,668) | 1,697,078 | (706,873) | 23,198,204 | (990,970) |
| Transfers of financial instruments: | (1,061,321) | (22,213) | 731,304 | 42,010 | 330,017 | (19,797) | - | - |
| Transfers from stage 1 to stage 2 | (1,048,366) | 7,688 | 1,048,366 | (7,688) | - | - | - | - |
| Transfers from stage 1 to stage 3 | (264,298) | 4,497 | - | - | 264,298 | (4,497) | - | - |
| Transfers from stage 2 to stage 1 | 233,500 | (26,504) | (233,500) | 26,504 | - | - | - | - |
| Transfers from stage 2 to stage 3 | - | - | (186,146) | 46,019 | 186,146 | (46,019) | - | - |
| Transfers from stage 3 to stage 1 | 17,843 | (7,894) | - | - | (17,843) | 7,894 | - | - |
| Transfers from stage 3 to stage 2 | - | - | 102,584 | (22,825) | (102,584) | 22,825 | - | - |
| Remeasurement arising from transfer of stage | (28,895) | 22,751 | (63,900) | (58,729) | (31,375) | (143,003) | (124,170) | (178,981) |
| Remeasurement from remaining in the stage | (1,524,336) | 7,477 | (72,455) | 32,405 | (10,924) | (41,790) | (1,607,715) | (1,908) |
| Remeasurement due to changes in economics factors | - | (1,822) | - | (3,044) | - | (42) | - | (4,908) |
| Remeasurement due to changes in model inputs | - | 2,083 | - | 661 | - | (22,147) | - | (19,403) |
| Remeasurement due to methodological changes | - | 13,701 | - | (23,672) | - | (8,793) | - | (18,764) |
| New financial assets purchased/originated | 4,760,874 | (30,539) | 262,832 | (4,919) | 23,518 | (10,862) | 5,047,224 | (46,320) |
| Financial assets that have been derecognized | (1,481,828) | 9,126 | (143,203) | 21,104 | (291,926) | 109,305 | (1,916,957) | 139,535 |
| Charges-off | (713) | 7 | (2,974) | 580 | (93,461) | 96,561 | (97,148) | 97,148 |
| Foreign Exchange and other movements | 50,142 | (104) | 658 | (240) | 591 | (488) | 51,391 | (832) |
| Balance at December 31, 2019 | 21,069,884 | (103,962) | 1,857,427 | (173,512) | 1,623,518 | (747,929) | 24,550,829 | (1,025,403) |
Mortgage
| | Stage 1 | Stage 2 | Stage 3 | Total |
| | Gross
carrying | Allowance | Gross
carrying | Allowance | Gross
carrying | Allowance | Gross
carrying | Allowance |
| Balance at January 1, 2019 | 20,280,416 | (110,722) | 1,513,063 | (157,016) | 1,077,206 | (586,026) | 22,870,685 | (853,764) |
| Transfers of financial instruments: | (78,120) | (75,570) | (20,302) | 6,849 | 98,422 | 68,721 | - | - |
| Transfers from stage 1 to stage 2 | (609,598) | 9,392 | 609,598 | (9,392) | - | - | - | - |
| Transfers from stage 1 to stage 3 | (177,154) | 4,876 | - | - | 177,154 | (4,876) | - | - |
| Transfers from stage 2 to stage 1 | 631,692 | (57,920) | (631,692) | 57,920 | - | - | - | - |
| Transfers from stage 2 to stage 3 | - | - | (167,345) | 24,239 | 167,345 | (24,239) | - | - |
| Transfers from stage 3 to stage 1 | 76,940 | (31,918) | - | - | (76,940) | 31,918 | - | - |
| Transfers from stage 3 to stage 2 | - | - | 169,137 | (65,918) | (169,137) | 65,918 | - | - |
| Remeasurement arising from transfer of stage | (50,316) | 54,296 | (35,924) | (15,576) | 38,394 | (154,824) | (47,846) | (116,104) |
| Remeasurement from remaining in the stage | (1,116,457) | (22) | (28,542) | 2,899 | 36,226 | (86,293) | (1,108,773) | (83,416) |
| Remeasurement due to changes in economics factors | - | 2,356 | - | 5,127 | - | 7,967 | - | 15,450 |
| Remeasurement due to changes in model inputs | - | 11,908 | - | (19,835) | - | 13,992 | - | 6,065 |
| Remeasurement due to methodological changes | - | 14,185 | - | 5,684 | - | (737) | - | 19,132 |
| New financial assets purchased/originated | 4,076,279 | (22,365) | 32,271 | (5,581) | 12,444 | (5,631) | 4,120,994 | (33,577) |
| Financial assets that have been derecognized | (1,598,993) | 10,316 | (123,901) | 11,462 | (110,191) | 60,500 | (1,833,085) | 82,278 |
| Charges-off | (6,645) | 56 | (1,330) | 117 | (96,745) | 104,547 | (104,720) | 104,720 |
| Foreign Exchange and other movements | 78,510 | (255) | 5,045 | (385) | 2,473 | (809) | 86,028 | (1,449) |
| Balance at December 31, 2019 | 21,584,674 | (115,817) | 1,340,380 | (166,255) | 1,058,229 | (578,593) | 23,983,283 | (860,665) |
Small business loans
| | Stage 1 | Stage 2 | Stage 3 | Total |
| | Gross
carrying | Allowance | Gross
carrying | Allowance | Gross
carrying | Allowance | Gross
carrying | Allowance |
| Balance at January 1, 2019 | 958,491 | (41,971) | 80,805 | (15,421) | 116,902 | (79,981) | 1,156,198 | (137,373) |
| Transfers of financial instruments: | (67,212) | 3,457 | 203 | 364 | 67,009 | (3,821) | - | - |
| Transfers from stage 1 to stage 2 | (37,819) | 2,575 | 37,819 | (2,575) | - | - | - | - |
| Transfers from stage 1 to stage 3 | (61,169) | 5,299 | - | - | 61,169 | (5,299) | - | - |
| Transfers from stage 2 to stage 1 | 30,270 | (3,779) | (30,270) | 3,779 | - | - | - | - |
| Transfers from stage 2 to stage 3 | - | - | (17,119) | 3,920 | 17,119 | (3,920) | - | - |
| Transfers from stage 3 to stage 1 | 1,506 | (638) | - | - | (1,506) | 638 | - | - |
| Transfers from stage 3 to stage 2 | - | - | 9,773 | (4,760) | (9,773) | 4,760 | - | - |
| Remeasurement arising from transfer of stage | (7,671) | 2,635 | (9,868) | (1,008) | (29,962) | (46,609) | (47,501) | (44,982) |
| Remeasurement from remaining in the stage | (145,152) | 5,502 | (2,408) | 697 | (941) | (4,000) | (148,501) | 2,199 |
| Remeasurement due to changes in economics factors | - | 51 | - | 15 | - | 55 | - | 121 |
| Remeasurement due to changes in model inputs | - | 5,476 | - | 757 | - | 1,940 | - | 8,173 |
| Remeasurement due to methodological changes | - | 1,407 | - | 349 | - | (160) | - | 1,596 |
| New financial assets purchased/originated | 620,375 | (25,971) | 24,173 | (7,891) | 25,901 | (22,041) | 670,449 | (55,903) |
| Financial assets that have been derecognized | (260,493) | 8,775 | (11,664) | 2,339 | (17,402) | 8,844 | (289,559) | 19,958 |
| | Stage 1 | Stage 2 | Stage 3 | Total |
| | Gross
carrying | Allowance | Gross
carrying | Allowance | Gross
carrying | Allowance | Gross
carrying | Allowance |
| Charges-off | (13,142) | 1,250 | (11,400) | 3,214 | (41,367) | 61,445 | (65,909) | 65,909 |
| Foreign Exchange and other movements | 3,460 | (67) | 378 | (30) | 393 | (117) | 4,231 | (214) |
| Balance at December 31, 2019 | 1,088,656 | (39,456) | 70,219 | (16,615) | 120,533 | (84,445) | 1,279,408 | (140,516) |
As of December 31, 2018
Commercial
| | Stage 1 | Stage 2 | Stage 3 | Total |
| | Gross
carrying | Allowance | Gross
carrying | Allowance | Gross
carrying | Allowance | Gross
carrying | Allowance |
| Balance at January 1, 2018 | 77,206,675 | (547,510) | 4,417,841 | (365,329) | 7,455,598 | (4,114,300) | 89,080,114 | (5,027,139) |
| Transfers of financial instruments: | (170,929) | (79,849) | (1,165,507) | 61,654 | 1,336,436 | 18,195 | - | - |
| Transfers from stage 1 to stage 2 | (1,092,962) | 17,502 | 1,092,962 | (17,502) | - | - | - | - |
| Transfers from stage 1 to stage 3 | (1,011,851) | 29,190 | - | - | 1,011,851 | (29,190) | - | - |
| Transfers from stage 2 to stage 1 | 1,779,812 | (93,242) | (1,779,812) | 93,242 | - | - | - | - |
| Transfers from stage 2 to stage 3 | - | - | (704,844) | 71,608 | 704,844 | (71,608) | - | - |
| Transfers from stage 3 to stage 1 | 154,072 | (33,299) | - | - | (154,072) | 33,299 | - | - |
| Transfers from stage 3 to stage 2 | - | - | 226,187 | (85,694) | (226,187) | 85,694 | - | - |
| Remeasurement arising from transfer of stage | (238,688) | 99,339 | (175,846) | 1,682 | (161,112) | (842,752) | (575,646) | (741,731) |
| Remeasurement from remaining in the stage | (5,814,291) | 74,226 | (79,870) | 16,984 | (68,573) | (726,064) | (5,962,734) | (634,854) |
| Remeasurement due to changes in economics factors | - | 2,414 | - | 10,787 | - | (614) | - | 12,587 |
| Remeasurement due to changes in model inputs | - | 22,329 | - | (21,882) | - | 5,611 | - | 6,058 |
| Remeasurement due to methodological changes | - | - | - | - | - | (50,109) | - | (50,109) |
| New financial assets purchased/originated | 46,523,819 | (259,527) | 1,223,859 | (139,665) | 1,601,125 | (758,851) | 49,348,803 | (1,158,043) |
| Financial assets that have been derecognized | (36,023,150) | 174,914 | (1,143,923) | 55,118 | (1,123,364) | 591,722 | (38,290,437) | 821,754 |
| Charges-off | (33,044) | 1,663 | (83,195) | 25,496 | (1,352,465) | 1,441,545 | (1,468,704) | 1,468,704 |
| Foreign Exchange and other movements | 2,182,378 | (10,229) | 221,501 | (3,318) | 65,373 | (44,513) | 2,469,252 | (58,060) |
| Balance at December 31, 2018 | 83,632,770 | (522,230) | 3,214,860 | (358,473) | 7,753,018 | (4,480,130) | 94,600,648 | (5,360,833) |
Consumer
| | Stage 1 | Stage 2 | Stage 3 | Total |
| | Gross
carrying | Allowance | Gross
carrying | Allowance | Gross
carrying | Allowance | Gross
carrying | Allowance |
| Balance at January 1, 2018 | 24,374,639 | (794,615) | 1,618,496 | (451,838) | 1,461,976 | (1,282,891) | 27,455,111 | (2,529,344) |
| Transfers of financial instruments: | (1,146,891) | (27,935) | 306,465 | 55,361 | 840,426 | (27,426) | - | - |
| Transfers from stage 1 to stage 2 | (798,766) | 44,260 | 798,766 | (44,260) | - | - | - | - |
| Transfers from stage 1 to stage 3 | (764,505) | 56,905 | - | - | 764,505 | (56,905) | - | - |
| Transfers from stage 2 to stage 1 | 361,202 | (84,650) | (361,202) | 84,650 | - | - | - | - |
| Transfers from stage 2 to stage 3 | - | - | (185,178) | 55,859 | 185,178 | (55,859) | - | - |
| Transfers from stage 3 to stage 1 | 55,178 | (44,450) | - | - | (55,178) | 44,450 | - | - |
| Transfers from stage 3 to stage 2 | - | - | 54,079 | (40,888) | (54,079) | 40,888 | - | - |
| | Stage 1 | Stage 2 | Stage 3 | Total |
| | Gross
carrying | Allowance | Gross
carrying | Allowance | Gross
carrying | Allowance | Gross
carrying | Allowance |
| Remeasurement arising from transfer of stage | (76,599) | 88,547 | (99,563) | (118,750) | 186,827 | (1,691,495) | 10,665 | (1,721,698) |
| Remeasurement from remaining in the stage | (2,232,650) | 1,889 | (66,101) | 22,297 | (33,036) | 2,528 | (2,331,787) | 26,714 |
| Remeasurement due to changes in economics factors | - | 4,788 | - | (1,311) | - | - | - | 3,477 |
| Remeasurement due to changes in model inputs | - | (27,434) | - | (29,817) | - | 1,363 | - | (55,888) |
| Remeasurement due to methodological changes | - | - | - | - | - | - | - | - |
| New financial assets purchased/originated | 13,904,647 | (418,266) | 613,209 | (178,986) | 319,557 | (271,327) | 14,837,413 | (868,579) |
| Financial assets that have been derecognized | (6,277,295) | 167,811 | (285,672) | 66,802 | (140,490) | 115,249 | (6,703,457) | 349,862 |
| Charges-off | (523,623) | 48,290 | (388,119) | 133,313 | (1,100,573) | 1,830,712 | (2,012,315) | 2,012,315 |
| Foreign Exchange and other movements | 644,233 | (23,498) | 59,447 | (18,047) | 34,071 | (68,205) | 737,751 | (109,750) |
| Balance at December 31, 2018 | 28,666,461 | (980,423) | 1,758,162 | (520,976) | 1,568,758 | (1,391,492) | 31,993,381 | (2,892,891) |
Financial leases
| | Stage 1 | Stage 2 | Stage 3 | Total |
| | Gross
carrying | Allowance | Gross
carrying | Allowance | Gross
carrying | Allowance | Gross
carrying | Allowance |
| Balance at January 1, 2018 | 19,219,292 | (134,349) | 1,230,431 | (89,988) | 1,662,653 | (583,586) | 22,112,376 | (807,923) |
| Transfers of financial instruments: | (374,358) | (14,466) | 23,228 | (546) | 351,130 | 15,012 | - | - |
| Transfers from stage 1 to stage 2 | (678,005) | 9,194 | 678,005 | (9,194) | - | - | - | - |
| Transfers from stage 1 to stage 3 | (398,842) | 6,978 | - | - | 398,842 | (6,978) | - | - |
| Transfers from stage 2 to stage 1 | 678,497 | (24,103) | (678,497) | 24,103 | - | - | - | - |
| Transfers from stage 2 to stage 3 | - | - | (111,253) | 20,270 | 111,253 | (20,270) | - | - |
| Transfers from stage 3 to stage 1 | 23,992 | (6,535) | - | - | (23,992) | 6,535 | - | - |
| Transfers from stage 3 to stage 2 | - | - | 134,973 | (35,725) | (134,973) | 35,725 | - | - |
| Remeasurement arising from transfer of stage | (48,145) | 18,824 | (45,780) | (56,854) | (68,422) | (137,850) | (162,347) | (175,880) |
| Remeasurement from remaining in the stage | (1,423,679) | 25,665 | (18,183) | (11,927) | (17,047) | (65,577) | (1,458,909) | (51,839) |
| Remeasurement due to changes in economics factors | - | (166) | - | 5,826 | - | (362) | - | 5,298 |
| Remeasurement due to changes in model inputs | - | 15,975 | - | (31,606) | - | (11,963) | - | (27,594) |
| Remeasurement due to methodological changes | - | - | - | - | - | (64,497) | - | (64,497) |
| New financial assets purchased/originated | 4,294,172 | (24,463) | 90,609 | (9,411) | 80,951 | (31,035) | 4,465,732 | (64,909) |
| Financial assets that have been derecognized | (1,422,584) | 9,297 | (169,079) | 16,974 | (206,794) | 47,821 | (1,798,457) | 74,092 |
| Charges-off | (14,014) | 158 | (276) | 29 | (121,384) | 135,487 | (135,674) | 135,674 |
| Foreign Exchange and other movements | 125,277 | (904) | 34,215 | (2,165) | 15,991 | (10,323) | 175,483 | (13,392) |
| Balance at December 31, 2018 | 20,355,961 | (104,429) | 1,145,165 | (179,668) | 1,697,078 | (706,873) | 23,198,204 | (990,970) |
Mortgage
| | Stage 1 | Stage 2 | Stage 3 | Total |
| | Gross
carrying | Allowance | Gross
carrying | Allowance | Gross
carrying | Allowance | Gross
carrying | Allowance |
| Balance at January 1, 2018 | 18,351,658 | (92,885) | 1,454,894 | (147,874) | 950,961 | (511,034) | 20,757,513 | (751,793) |
| Transfers of financial instruments: | (345,042) | (57,398) | 136,231 | 14,747 | 208,811 | 42,651 | - | - |
| Transfers from stage 1 to stage 2 | (749,203) | 10,312 | 749,203 | (10,312) | - | - | - | - |
| Transfers from stage 1 to stage 3 | (207,887) | 5,056 | - | - | 207,887 | (5,056) | - | - |
| Transfers from stage 2 to stage 1 | 552,708 | (49,312) | (552,708) | 49,312 | - | - | - | - |
| Transfers from stage 2 to stage 3 | - | - | (200,281) | 27,034 | 200,281 | (27,034) | - | - |
| Transfers from stage 3 to stage 1 | 59,340 | (23,454) | - | - | (59,340) | 23,454 | - | - |
| Transfers from stage 3 to stage 2 | - | - | 140,017 | (51,287) | (140,017) | 51,287 | - | - |
| Remeasurement arising from transfer of stage | (46,059) | 51,842 | (43,554) | (30,301) | 65,548 | (178,864) | (24,065) | (157,323) |
| Remeasurement from remaining in the stage | (1,057,494) | 771 | (34,744) | (7,423) | 31,643 | (71,719) | (1,060,595) | (78,371) |
| Remeasurement due to changes in economics factors | - | 1,132 | - | 19,196 | - | (2,753) | - | 17,575 |
| Remeasurement due to changes in model inputs | - | 4,289 | - | (2,185) | - | (4,589) | - | (2,485) |
| Remeasurement due to methodological changes | - | - | - | - | - | (5,242) | - | (5,242) |
| New financial assets purchased/originated | 3,976,575 | (25,673) | 46,565 | (8,806) | 12,512 | (6,192) | 4,035,652 | (40,671) |
| Financial assets that have been derecognized | (1,353,978) | 8,575 | (100,322) | 9,063 | (101,239) | 49,131 | (1,555,539) | 66,769 |
| Charges-off | (996) | 25 | (336) | 24 | (111,085) | 112,368 | (112,417) | 112,417 |
| Foreign Exchange and other movements | 755,752 | (1,400) | 54,329 | (3,457) | 20,055 | (9,783) | 830,136 | (14,640) |
| Balance at December 31, 2018 | 20,280,416 | (110,722) | 1,513,063 | (157,016) | 1,077,206 | (586,026) | 22,870,685 | (853,764) |
Small business loans
| | Stage 1 | Stage 2 | Stage 3 | Total |
| | Gross
carrying | Allowance | Gross
carrying | Allowance | Gross
carrying | Allowance | Gross
carrying | Allowance |
| Balance at January 1, 2018 | 868,593 | (31,773) | 70,082 | (12,775) | 124,305 | (97,417) | 1,062,980 | (141,965) |
| Transfers of financial instruments: | (102,128) | 3,994 | 24,315 | 1,086 | 77,813 | (5,080) | - | - |
| Transfers from stage 1 to stage 2 | (53,513) | 2,328 | 53,513 | (2,328) | - | - | - | - |
| Transfers from stage 1 to stage 3 | (64,371) | 4,163 | - | - | 64,371 | (4,163) | - | - |
| Transfers from stage 2 to stage 1 | 14,771 | (1,842) | (14,771) | 1,842 | - | - | - | - |
| Transfers from stage 2 to stage 3 | - | - | (18,593) | 3,599 | 18,593 | (3,599) | - | - |
| Transfers from stage 3 to stage 1 | 985 | (655) | - | - | (985) | 655 | - | - |
| Transfers from stage 3 to stage 2 | - | - | 4,166 | (2,027) | (4,166) | 2,027 | - | - |
| Remeasurement arising from transfer of stage | (3,674) | 2,024 | (13,083) | (1,493) | (35,259) | (44,344) | (52,016) | (43,813) |
| Remeasurement from remaining in the stage | (134,481) | 8,292 | (3,527) | 868 | (2,329) | (924) | (140,337) | 8,236 |
| Remeasurement due to changes in economics factors | - | (99) | - | (593) | - | - | - | (692) |
| Remeasurement due to changes in model inputs | - | (1,899) | - | (560) | - | 298 | - | (2,161) |
| Remeasurement due to methodological changes | - | - | - | - | - | - | - | - |
| New financial assets purchased/originated | 556,933 | (29,753) | 25,216 | (6,441) | 27,945 | (21,347) | 610,094 | (57,541) |
| Financial assets that have been derecognized | (243,809) | 6,903 | (15,087) | 2,064 | (15,489) | 8,031 | (274,385) | 16,998 |
| | Stage 1 | Stage 2 | Stage 3 | Total |
| | Gross
carrying | Allowance | Gross
carrying | Allowance | Gross
carrying | Allowance | Gross
carrying | Allowance |
| Charges-off | (13,882) | 926 | (10,096) | 2,690 | (62,824) | 83,186 | (86,802) | 86,802 |
| Foreign Exchange and other movements | 30,939 | (586) | 2,985 | (267) | 2,740 | (2,384) | 36,664 | (3,237) |
| Balance at December 31, 2018 | 958,491 | (41,971) | 80,805 | (15,421) | 116,902 | (79,981) | 1,156,198 | (137,373) |
Impact of movements in loans and provision for Stage
Stage 1 (12 months expected credit losses): the exposure in stage 1 increased by COP 5,875,502 and the allowance increased by COP 251,147. The growth of the portfolio at this stage is mainly due to the new disbursement of 2019, mostly in consumer and mortgage portfolio. The variation in the allowance is consistent with the growth on the portfolio.
Stage 2: (Lifetime expected credit losses): the exposure in stage 2 increased by COP 2,288,283, and the allowance increased by COP 292,484. The increase in the exposure is explained by the migration of clients the commercial portfolio from stage 1 to stage 2, mainly to clients in the natural resource sector. Regarding the allowance, the increase is concentrated in the provision of the clients of the commercial portfolio that migrated to stage 2 and consumer portfolio with more than 30 past due days.
Stage 3 (Lifetime expected credit losses): the exposure in stage 3 increased by COP 299,842, and the allowance increased by COP 149,933, the increase in the exposure is explained by the migration of clients of the consumer portfolio with more than 90 past due days and the commercial portfolio in default, the increase is due mainly to clients in the natural resource and non-financial service sectors. Regarding the allowance, the increase is due mainly to clients in the infrastructure, transport and commercial sectors that increased the provision level, arrival of new clients of commercial portfolio in default and consumer portfolio with more than 90 past due days.
Charges-off
As of December 31, 2019 and 2018 the write off loans amounted to COP 3,730,380 and COP 3,815,912, respectively.
NOTE 7. LEASES
7.1. Lessor
Finance leases
The Bank has subscribed lease agreements as the lessor. These leases arrangements involve machinery and equipment, computer equipment, automobile and furniture and fixtures and their terms range between one and ten years, as follows:
As of December 31, 2019
| Period | Gross investment in finance lease
receivable | Present value of minimum
payments |
| In millions of COP |
| Less than 1 year | 872,949 | 375,999 |
| Between 1 and 5 years | 11,156,112 | 8,725,805 |
| Greater than 5 years | 22,112,482 | 15,449,025 |
| Total gross investment in finance lease receivable/ present value of minimum payments | 34,141,543 | 24,550,829 |
| Less: Future financial income(1) | (9,590,714) | - |
| Present value of payments receivable(2) | 24,550,829 | 24,550,829 |
| Minimum non-collectable payments impairment | (1,025,403) | (1,025,403) |
| Total | 23,525,426 | 23,525,426 |
| (1) | Future financial income: Total Gross Investment - Total Present Value of minimum payments |
| (2) | See note 6 loans and advances to customers and financials institutions, net |
As of December 31, 2018
| Period | Gross investment in finance lease
receivable | Present value of minimum
payments |
| In millions of COP |
| Less than 1 year | 735,187 | 526,581 |
| Between 1 and 5 years | 8,194,658 | 6,677,063 |
| Greater than 5 years | 22,738,577 | 15,994,560 |
| Total gross investment in finance lease receivable/ present value of minimum payments | 31,668,422 | 23,198,204 |
| Less: Future financial income(1) | (8,470,218) | - |
| Present value of payments receivable | 23,198,204 | 23,198,204 |
| Minimum non-collectable payments impairment | (990,970) | (990,970) |
| Total | 22,207,234 | 22,207,234 |
| (1) | Future financial income: Total Gross Investment - Total Present Value of minimum payments |
Unsecured residual value(*)
The following table sets the unsecured residual values by type of asset as of December 31, 2019 and 2018:
| Type of asset | December 31, 2019 | December 31, 2018 |
| In millions of COP |
| Technological equipment | 27,769 | 25,229 |
| Vehicles | 19,330 | 22,680 |
| Machinery and equipment | 10,743 | 11,300 |
| Furniture and fixtures | 209 | 189 |
| Total | 58,051 | 59,398 |
(*)The unsecured residual value is the part of the residual value of the leased asset, whose realization is not secured or is secured by a third party related to the lessor.
Contingent income
The following table presents the income relating to variable lease payments not included in the measurement of the net investment in the lease:
| Type of asset | December 31, 2019 | December 31, 2018 |
| In millions of COP |
| Technological equipment | 16,727 | 9,586 |
| Vehicles | 1,542 | 967 |
| Buildings | 1,484 | 44 |
| Machinery and equipment | 1,435 | 637 |
| Furniture and fixtures | 1 | - |
| Total | 21,189 | 11,234 |
As of December 31, 2019 and 2018 the financial leases amounted to COP 1,918,655 and COP 1,913,196.
Operating leases – lessor
Certain of the Bank’s subsidiaries lease assets to third parties under non-cancelable operating leases arrangements. Assets provided through operating leases are recorded as premises and equipment. The terms established for these agreements range from one to ten years.
The following table presents the information of minimum payments by lease to be received:
| | December 31, 2019 | December 31, 2018 |
| In millions of COP |
| Less than 1 year | 357,541 | 216,039 |
| Between 1 and 5 years | 753,653 | 934,816 |
| Greater than 5 years | 65,545 | 139,493 |
| Total | 1,176,739 | 1,290,348 |
As of December 31, 2019 and 2018 the operating leases income amounted to COP 682,525 and COP 624,062.
Risk management associated with leases
The Bank, acting as a lessor of operating leases, has a comprehensive asset management model for those assets classified as property, plant and equipment. This model includes the impairment test evaluating indicators that impact the assets, which is carried out annually. The test evaluates both external indicators (economic, environmental and legal), and internal ones (insurance, maintenance and used market sales). Moreover, the Bank performs a detailed review process at the time of return of the asset by the lessees in order to guarantee its operating conditions. Additionally, it has the participation of experts apart from the sales force, who constantly monitor the conditions of the second-hand market, and carry out back-testing in order to determine the consistency of the residual value model, and periodically review the results together with key managers. All of the above is complemented by agreements with suppliers, which allow the exchange of information, knowledge and in some cases, the structuring of residual risk mitigation mechanisms.
In order to manage the risks associated with the assets, the Bank also employs an insurance department, and engages an international broker and insurance companies. They all serve as support to design and define the strategies for the different types of protection that cover the lessor's risks, assets and customers.
Additionally, in Renting Colombia’s vehicle rental business, assets are managed seeking the preservation of commercial value through the necessary maintenance, which avoids deterioration beyond that generated by regular use. Service indicators with suppliers are periodically reviewed in order to ensure their quality and compliance with the expected levels. Safe mobility strategies are also defined based on the permanent analysis of the road safety indicators. These strategies aim at ensuring the status and useful life of the asset.
7.2. Lessee
As of January 01, 2019 the Bank adopted IFRS 16, this standard establishes the principles of recognition, measurement, presentation and disclosure of leases and requires lessees to account for all their leases under the same balance sheet model similar to the accounting under IAS 17 of the Finance leases. The standard includes two recognition exemptions for lessees: leasing of low-value assets (for example, personal computers) and short-term leases (that is, leases with a term of less than 12 months and without a bargain purchase option). At the beginning of the lease, the lessee recognizes a liability for lease payments (liability for lease) and an asset that represent the right to use the underlying asset during the term of the lease (right to use the asset). The Bank used the modified retrospective adoption method, where the right-of-use assets are measured as if IFRS 16 had always been applied, using the lessee’s incremental borrowing rate known at the date of transition. The change in accounting policy affected the following items in the consolidate statement of financial position as of January 01, 2019:
| Concepts | January 01, 2019 |
| Increase in right of use assets(1) | 1,543,427 |
| Net of deferred tax assets | (119,173) |
| Increase in lease liabilities | 1,848,833 |
| Net of effect of changes in foreign exchange rate | (9,560) |
| Decrease in retained earnings | 184,248 |
| (1) | The increase in right of use assets for COP 1,543,427 differs from the COP 1,572,446 presented in the right of use assets at January 01, 2019, in the amount of COP 29,019 due the financial leases recognized by Transportempo S.A.S. under IAS 17 at December 31, 2018. |
The Bank has subscribed lease agreements as a lessee. These arrangements involve offices, branches and administrative offices as well as some technological equipment. As of December 31, 2019, the rollforward of right of use assets was as follows:
| Right of use assets | Balance at
January
01, 2019 | | Roll - forward | Balance at
December
31, 2019 |
| Acquisitions | Additions | Expenses
depreciation
(1) | Disposals | Revaluation | Effect of changes
in foreign
exchange rate |
| In millions of COP |
| Buildings | | | | | | | | |
| Cost | 1,487,175 | 125,882 | 179,045(2) | - | (40,432) | (3,029) | 5,425 | 1,754,066 |
| Accumulated depreciation | - | - | - | (155,246) | 20,769 | - | 171 | (134,306) |
| Furniture and fixtures | | | | | | | | |
| Cost | 579 | 3,781 | - | - | (153) | (362) | (3) | 3,842 |
| Accumulated depreciation | - | - | - | (985) | 78 | - | 1 | (906) |
| Technological equipment | | | | | | | | |
| Cost | 49,736 | 11,210 | - | - | (305) | (3,663) | 138 | 57,116 |
| Accumulated depreciation | - | - | - | (16,833) | 34 | - | 4 | (16,795) |
| Vehicles | | | | | | | | |
| Cost | 34,956 | 8,355 | 2,572 | - | (11,492) | (1,283) | (5) | 33,103 |
| Accumulated depreciation | - | - | (737) | (4,645) | 1,376 | - | 2 | (4,004) |
| Total right of use assets – cost | 1,572,446 | 149,228 | 181,617 | - | (52,382) | (8,337) | 5,555 | 1,848,127 |
| Total right of use assets - accumulated depreciation | - | - | (737) | (177,709) | 22,257 | - | 178 | (156,011) |
| Total right of use assets, net | 1,572,446 | 149,228 | 180,880 | (177,709) | (30,125) | (8,337) | 5,733 | 1,692,116 |
| (1) | See Note 26.3 Impairment, depreciation and amortization. |
| (2) | Reclassification from Leasehold improvements which are an integral part of the asset by right of use during the year 2019. See Note 10 Premises and equipment, net |
The following table sets forth the changes in lease liabilities as of December 31, 2019 according to IFRS 16:
| Concept | | Total |
| In millions of COP |
| Balance at January 01, 2019 | | 1,848,833 |
| (+) New contracts | | 135,633 |
| (+/-) Reassessment of the lease liability | | (34,755) |
| (-) Payments | | (252,432) |
| (+) Accrued Interest | | 127,558 |
| (+/-) Effect of changes in foreign exchange rate | | 6,748 |
| Balance at December 31, 2019 | | 1,831,585 |
The following table shows maturity analysis of lease liabilities as of December 31, 2019:
| Type of assets | Maturity less
than 1
year | Maturity
between 1 and
3 years | Maturity
between 3 and
5 years | Maturity more
than
5 years | Total lease
liabilities |
| In millions of COP |
| Buildings | 6,255 | 22,036 | 73,252 | 1,685,676 | 1,787,219 |
| Vehicles | - | 986 | 158 | - | 1,144 |
| Technological equipment | 6,510 | 3,956 | 15,343 | 14,692 | 40,501 |
| Furniture and fixtures | - | 1,323 | 1,398 | - | 2,721 |
| Total lease liabilities | 12,765 | 28,301 | 90,151 | 1,700,368 | 1,831,585 |
The weighted average rates and average useful life of right of use assets are as follows:
As ofDecember 31, 2019
| Right of use assets | Weighted average life | Weighted average
remaining lease terms | Weighted average discount
rates |
| Buildings | 273 | 148 | 5.78% |
| Technological equipment | 83 | 54 | 3.99% |
| Furniture and fixtures | 45 | 36 | 6.56% |
| Vehicles | 40 | 34 | 5..65% |
As of December 31, 2019, the lease payments associated with those assets amounted to COP 252,432.
The future cash outflows of variable lease payments that are not reflected in the measurement of lease liabilities amount to COP 2,388 as of December 31, 2019.
The following table shows the detail of leases in the Consolidated Statement of Income as of December 31, 2019:
| Right of use assets | Financial
interest(1) | Expenses
depreciation(2) | Payments of
penalties | Effect of
changes in
foreign
exchange rate | Short-term leases(3) | Leases for which
the underlying
asset is of low
value(3) |
| In millions of COP |
| Buildings | 119,951 | 155,246 | 363 | 207 | 1,729 | 2,287 |
| Vehicles | 63 | 4,645 | - | - | 89 | 34 |
| Technological equipment | 1,766 | 16,833 | - | - | 10 | 1,282 |
| Furniture and fixtures | 166 | 985 | - | - | - | 3,240 |
| Total | 121,946(4) | 177,709 | 363 | 207 | 1,828 | 6,843 |
(1) See Note 25.2 Interest expenses.
(2)See Note 26.3 Impairment, depreciation and amortization.
(3)See Note 26.2 Other administrative and general expenses
(4)The amount includes the expense generated by the difference between the carrying amount of the asset for the right to use and the liability for leasing at the time of the early termination of lease contracts by COP 5,612.
NOTE 8. INVESTMENTS IN ASSOCIATES AND JOINT VENTURES
The following table presents information regarding the Bank’s investments in associates and joint ventures:
| Composition | December 31, 2019 | December 31, 2018 |
| In millions of COP |
| Investments in associates(1) | 1,894,024 | 1,710,969 |
| Investments in Joint ventures | 473,733 | 438,610 |
| Total | 2,367,757 | 2,149,579 |
| (1) | As of December 31, 2019 and 2018, the amount includes investments in associates at fair value for COP 1,249,818 and COP 1,119,973, respectively and investments in associates at equity method value for COP 644,206 COP 590,996 respectively. See Note 30 Fair value of assets and liabilities. |
The following are the investments in associates that the Bank holds as of December 31, 2019 and 2018:
As of December 31, 2019
| Investments in Associates |
| Company name | Main activity | Country | % of
Ownership
interest | Included in
earnings(1) | Total
OCI(2) | OCI
(Equity method)(3) | OCI
(CTA)(4) | OCI
(Deferred tax)(5) | Carrying
amount |
| In millions of COP |
| Investments in associates |
| PA Viva Malls | Development and operation of commercial spaces | Colombia | 49.00% | 138,100 | - | - | - | - | 1,249,818 |
| Protección S.A. | Administration of pension funds and severances | Colombia | 20.58% | 90,844 | 15,264 | (159) | - | (81) | 546,545 |
| Titularizadora Colombiana S.A. Hitos* | Mortgage portfolio securities | Colombia | 26.98% | 3,383 | (1,569) | (86) | - | 1 | 37,048 |
| Redeban Multicolor S.A.* | Network data transmission services | Colombia | 20.36% | 3,305 | (651) | - | - | 2 | 21,440 |
| Internacional Ejecutiva de Aviación S.A.S. | Aircraft and aircraft travel | Colombia | 33.33% | (100) | 350 | 354 | - | (12) | 12,758 |
| ACH Colombia S.A. * | Electronic transfer services | Colombia | 19.94% | 6,252 | (952) | - | - | 3 | 10,187 |
| Servicio Salvadoreño de Protección, S. A. de C.V. * | Custodial services and transfer of monetary types | El Salvador | 25.00% | 311 | (727) | - | (1) | 50 | 9,252 |
| Servicios Financieros, S.A. de C.V. * | Processing of financial transactions and electronic payment methods | El Salvador | 47.86% | (276) | 9 | - | (1) | - | 3,173 |
| Investments in Associates |
| Company name | Main activity | Country | % of
Ownership
interest | Included in
earnings(1) | Total
OCI(2) | OCI
(Equity method)(3) | OCI
(CTA)(4) | OCI
(Deferred tax)(5) | Carrying
amount |
| In millions of COP |
| Servicios de Identidad Digital S.A.S.(6) | Provide digital citizens services | Colombia | 33.00% | - | - | - | - | - | 2,369 |
| ACH de El Salvador, S. A. de C.V. * | Electronic transfer services | El Salvador | 25.00% | 166 | 6 | - | (6) | - | 1,434 |
| Reintegra S.A.S.*(7) | Collections and recovery of portfolio | Colombia | 46.00% | 2,099 | 1,742 | - | - | 26 | - |
| Concesiones CCFC S.A.(8) | Construction of public works through an awarding system | Colombia | 25.50% | 2,069 | - | 757 | - | (34) | - |
| Net investments in associates | 246,153 | 13,472 | 866(9) | (8) | (45)(9) | 1,894,024 |
| (1) | Corresponds to the income recognized as equity method in the statement of income for the year ended December 31, 2019. See Note 25.5 Dividends and net income on equity investments. |
| (2) | Corresponds to the accumulated other comprehensive income as of December 31, 2019. |
| (3) | Corresponds to the other comprehensive income recognized as equity method for the year ended December 31, 2019. |
| (4) | Corresponds to the other comprehensive income recognized as Cumulative Translation Adjustment of Foreign Currency (CTA) for the year ended December 31, 2019. |
| (5) | Corresponds to the other comprehensive income recognized as deferred tax for the year ended December 31, 2019. |
| (6) | In December 2019, Bancolombia S.A signed an agreement with Banco de Bogota and Davivienda to formed the associate Servicios de identidad digital S.A.S with purpose of providing digital citizens services. |
| (7) | In 2019, the Bank increased its capital contribution in Reintegra S.A.S by COP 3,775. The carrying amount at the end of the year is zero, because the amount of downstream transactions between Bancolombia S.A. and Reintegra made during 2019, exceeds the net investment on the entity. |
| (8) | In April, 2019, The Bank sold Concesiones CCFC S.A. See Note 25.5 Dividends and net income on equity investments. |
| (9) | See Consolidated Statement of Comprehensive Income. |
(*) For the purposes of applying the equity method of accounting, financial statements as of November 30, 2019 have been used. However, the Bank does not consider that any adjustments have to be made since no significant transactions took place between that date and December 31, 2019.
As of December 31, 2018
| Company name | Main activity | Country | % of
Ownership
interest | Included in
earnings(1) | Total
OCI(2) | OCI
(Equity method)(3) | OCI
(CTA)(4) | OCI
(Deferred tax)(5) | Carrying
amount |
| In millions of COP |
| Investments in associates |
| PA Viva Malls(6) | Development and operation of commercial spaces | Colombia | 49.00% | 96,201 | - | - | - | - | 1,119,973 |
| Protección S.A. | Administration of pension funds and severances | Colombia | 20.58% | 42,057 | 15,423 | 2,958 | - | (819) | 478,482 |
| Titularizadora Colombiana S.A. Hitos* | Mortgage portfolio securities | Colombia | 26.98% | 4,962 | (1,483) | (94) | - | 40 | 37,391 |
| Redeban Multicolor S.A.* | Network data transmission services | Colombia | 20.36% | 2,203 | (651) | - | - | 45 | 19,105 |
| Concesiones CCFC S.A.* | Construction of public works through an awarding system | Colombia | 25.50% | 6,794 | (757) | (1) | - | 34 | 13,063 |
| Internacional Ejecutiva de Aviación S.A.S. | Aircraft and aircraft travel | Colombia | 33.33% | 2,008 | (4) | (213) | - | - | 12,503 |
| Servicio Salvadoreño de Protección, S. A. de C.V. * | Custodial services and transfer of monetary types | El Salvador | 25.00% | 1,905 | (727) | - | (30) | (16) | 8,867 |
| Reintegra S.A.S.*(7) | Collections and recovery of portfolio | Colombia | 46.00% | 1,939 | 1,742 | - | - | (26) | 8,594 |
| ACH Colombia S.A. * | Electronic transfer services | Colombia | 19.94% | 3,871 | (952) | - | - | 79 | 8,313 |
| Servicios Financieros, S.A. de C.V. * | Processing of financial transactions and electronic payment methods | El Salvador | 47.86% | (160) | 9 | - | (7) | - | 3,420 |
| ACH de El Salvador, S. A. de C.V. * | Electronic transfer services | El Salvador | 25.00% | 143 | 6 | - | (64) | - | 1,258 |
| Investments in associates classified as assets held for sale(8) |
| Company name | Main activity | Country | % of
Ownership
interest | Included in
earnings(1) | Total
OCI(2) | OCI
(Equity method)(3) | OCI
(CTA)(4) | OCI
(Deferred tax)(5) | Carrying
amount |
| In millions of COP |
| Panamerican Pharmaceutical Holding Inc. | Advisory services, consultation, representation, agent for individuals or company | Panama | 21.00% | - | (1,486) | (69) | (785) | - | - |
| Avefarma S.A.S. | Manufacture and distribution of glass packing for pharmaceutical products | Colombia | 21.00% | - | (11,704) | - | - | - | - |
| Glassfarma Tech S.A.S. | Manufacturing, elaboration and commercialization of packages and pharmaceutical products | Colombia | 21.00% | - | 127 | - | - | - | - |
| Net investments in associates | 161,923 | (457) | 2,581(9) | (886) | (663)(9) | 1,710,969 |
| (1) | Corresponds to the income recognized as equity method in the statement of income for the year ended December 31, 2018. See Note 25.5 Dividends and net income on equity investments. |
| (2) | Corresponds to the accumulated other comprehensive income as of December 31, 2018. |
| (3) | Corresponds to the other comprehensive income recognized as equity method for the year ended December 31, 2018. |
| (4) | Corresponds to the other comprehensive income recognized as Cumulative Translation Adjustment of Foreign Currency (CTA) for the year ended December 31, 2018. |
| (5) | Corresponds to the other comprehensive income as deferred tax for the year ended December 31, 2018. |
| (6) | During 2018, the Bank increases its capital contribution in P.A Viva Malls by COP 274,951. |
| (7) | During 2018, the Bank increases its capital contribution in Reintegra S.A.S by COP 1,152. |
| (8) | As of December 31, 2018 the investment in Avefarma S.A.S., Glassfarma Tech S.A.S and Panamerican Pharmaceutical Holding inc. are still classified as "assets held for sale". See Note 13 Assets held for sale and inventories, net. |
| (9) | See Consolidated Statement of Comprehensive Income. |
(*) For the purposes of applying the equity method of accounting, financial statements as of November 30, 2018 have been used. However, the Bank does not consider that any adjustments have to be made since no significant transactions took place between that date and December 31, 2018.
The following is additional information regarding the Bank’s most significant associates as of December 31, 2019 and 2018:
As of December 31, 2019
| Company name | Assets | Liabilities | Income from
ordinary
activities | Profits | Dividends |
| In millions of COP |
| PA Viva Malls | 2,563,824 | 13,176 | 568,971 | 393,292 | 71,212 |
| Protección S.A.(1) | 2,632,761 | 804,911 | 1,422,061 | 442,789 | 22,622 |
| Titularizadora Colombiana S.A. Hitos | 149,737 | 16,471 | 36,193 | 12,472 | 3,639 |
| (1) | The difference between the net assets of Protección S.A. multiplied by the Bank’s percentage of ownership, which amounted to COP 376,111 for the year ended December 31, 2019, and the carrying amount of the Bank’s interest in the associate, represents the goodwill recognized by the Bank amounting to COP 170,434. |
As of December 31, 2018
| Company name | Assets | Liabilities | Income from
ordinary
activities | Profits | Dividends |
| In millions of COP |
| PA Viva Malls | 2,301,567 | 11,304 | 417,942 | 271,648 | 9,064 |
| Protección S.A.(1) | 2,172,208 | 675,135 | 1,387,294 | 205,134 | 37,861 |
| Titularizadora Colombiana S.A. Hitos | 151,447 | 16,911 | 50,213 | 14,923 | 2,824 |
| (1) | The difference between the net assets of Protección S.A. multiplied by the Bank’s percentage of ownership, which amounted to COP 308,048 for the year ended December 31, 2018, and the carrying amount of the Bank’s interest in the associate, represents the goodwill recognized by the Bank amounting to COP 170,434. |
As of December 31, 2019 and 2018, there are no restrictions on the ability of the associates to transfer funds to the Bank in the form of cash dividends.
The following are the Joint ventures that the Bank holds as of December 31, 2019 and 2018:
As of December 31, 2019
| Company name | Main activity | Country | % of
Ownership
interest | Included in
earnings(1) | Total OCI(2) | OCI | Carrying
amount |
(Deferred
tax)(3) |
| Compañía de financiamiento Tuya S.A(4) | Financing company | Colombia | 50% | 8,630 | - | 13 | 466,456 |
| Vlipco S.A.S(5) | Technology services provider | Colombia | 49% | (79) | - | - | 4,190 |
| Puntos Colombia S.A.S | Administration of the customers loyalty | Colombia | 50% | (4,228) | - | - | 1,373 |
| P.A Proyecto CRECE(6) | Non-financial products and services platform | Colombia | 50% | (1,191) | - | - | 1,009 |
| P.A Proyecto Dinamarca(7) | Sustainable mobility services | Colombia | 33% | - | - | - | 500 |
P.A Servicios Tecnológicos Arus- Bancolombia | Technology services provider | Colombia | 50% | (45) | - | - | 205 |
| Fideicomiso Ruta del Sol - compartimento A | Investment in infrastructure projects | Colombia | 50% | (9) | 13 | - | - |
| Servicios de Aceptación S.A.S.(8) | Network data transmission services | Colombia | - | - | - | - | - |
| Net investments in joint ventures | | 3,078 | 13 | 13 | 473,733 |
| (1) | Corresponds to the income recognized as equity method in the statement of income for the year ended December 31, 2019. |
| (2) | Corresponds to the accumulated other comprehensive income as of December 31, 2019. |
| (3) | Corresponds to the other comprehensive income as deferred tax for the year ended December 31, 2019. |
| (4) | During 2019, The Bank increases its capital contribution in Compañia de Financiamiento TUYA S.A for COP 26,317. |
| (5) | In July, 2019, the Bank acquired a 48.91% interest in Vlipco S.A.S. The objective is have joint control to the net assets of Vlipco S.A.S. The purpose of the entity is to provide technology services. |
| (6) | In October 2019, Banca de Inversión Bancolombia, a Bank's subsidiary, entered into an agreement with Grupo Sura whereby both parties have joint control over the net assets of PA Project CRECE. The purpose of the entity is to provide a non- financial products and services platform. |
| (7) | In November 2019, Inversiones CFNS S.A.S., a Bank's subsidiary, entered into an agreement with Grupo Sura and CELSIA S.A whereby both parties have joint control over the net assets of PA Project Dinamarca. The purpose of the entity is to provide sustainable mobility services. |
| (8) | The liquidation process was ended in April 2019, see Note 25.5 Dividends and net income on equity investments. |
As of December 31, 2018
| Company name | Main activity | Country | % of
Ownership
interest | Included in
earnings(1) | Total OCI(2) | OCI | Carrying
amount |
(Equity
method)(3) |
| Compañía de financiamiento Tuya S.A(4)(5) | Financing company | Colombia | 50.00% | 27,623 | - | - | 431,510 |
| Puntos Colombia S.A.S | Administration of the customers loyalty | Colombia | 50.00% | (1,613) | - | - | 5,600 |
| P.A Servicios Tecnológicos Arus- Bancolombia(6) | Technology services provider | Colombia | 50.00% | - | - | - | 1,500 |
| Servicios de Aceptación S.A.S (in liquidation)(7) | Network data transmission services | Colombia | 50.00% | (110) | - | - | - |
| Fideicomiso Ruta del Sol - compartimento A | Investment in infrastructure projects | Colombia | 50.00% | (9) | 13 | - | - |
| Net investments in joint ventures | | 25,891 | 13 | - | 438,610 |
| (1) | Corresponds to the income recognized as equity method in the statement of income for the year ended December 31, 2018. |
| (2) | Corresponds to the accumulated other comprehensive income as of December 31, 2018. |
| (3) | Corresponds to the other comprehensive income recognized as equity method for the year ended December 31, 2018. |
| (4) | The revaluation of the consumer loan portfolio in Colombia increased significantly during 2018, and there was an improvement in loan coverage rates due to the economic cycle in the country and the current payment behavior in the consumer segment. |
| As a result, management measured the recoverable amount of Tuya's Cash Generation Unit (CGU). The measurement was estimated by determining the fair value of the asset which implies the professional services of a business valuation specialist; as a result of the valuation the Bank recognized a recovery of the impairment loss of COP 173,339. For more information about the applied valuation technique, see Note 30 Fair value of assets and liabilities. |
| (5) | In March 2018, The Bank increases its capital contribution in Compañia de Financiamiento TUYA S.A. for COP 5,000. |
| (6) | In December 2018, Banca de Inversión Bancolombia, a Bank’s subsidiary, entered into an agreement with ARUS whereby both parties have joint control to the net assets of P.A Servicios Tecnológicos Arus- Bancolombia. The purpose of the entity is to provide technology services. |
| (7) | The joint venture of Servicios de Aceptación S.A.S. was derived from the alliance between Bancolombia and First Data for improving the development of the credit card business for individuals, however the strategy was refocused in 2018. Consequently, both parties agreed to advance in the development of this business considering First Data as the Bank’s service provider of processing data and to dissolve the joint venture. |
The following is additional information regarding the Bank’s most significant joint ventures as of December 31, 2019 and 2018:
As of December 31, 2019
| Company name | Assets | Liabilities | Income from
ordinary activities | (loss) | Dividends |
| In millons of COP |
| Compañía de financiamiento TUYA S.A. | 3,289,299 | 2,876,294 | 1,700,009 | (19,345) | - |
As of December 31, 2018
| Company name | Assets | Liabilities | Income from
ordinary activities | Profits | Dividends |
| In millons of COP |
| Compañía de financiamiento TUYA S.A. | 2,790,596 | 2,447,483 | 1,450,242 | 55,258 | - |
As of December 31, 2019 there are no contingent liabilities incurred by the Bank regarding its interests in the joint ventures and associates aforementioned.
As of December 31, 2017 the Bank has recognized COP 253,602 as equity method in the statement of income, COP (11,547) as other comprehensive income from equity method and COP 80 as other comprehensive income from currency translation adjustment. Additionally, during 2017, the Bank received dividends amounting to COP 75,224 from its significant associates.
NOTE 9. GOODWILL AND INTANGIBLE ASSETS, NET
Intangibles assets and goodwill net are as follows:
| | December 31, 2019 | December 31, 2018 |
| In millions of COP |
| Intangible assets | 538,958 | 563,452 |
| Goodwill | 6,694,354 | 6,638,403 |
| Total | 7,233,312 | 7,201,855 |
9.1. Intangible assets
The following table sets forth the Bank's intangible assets as of December 31, 2019 and 2018, including the reconciliation of initial and final balances of the cost and accrued amortization:
As of December 31, 2019
| Cost | Trademarks | Licenses, software
and computer
applications | Client
relationships | Total |
| In millions of COP |
| Balance at January 1, 2019 | 19,213 | 654,394 | 374,658 | 1,048,265 |
| Acquisitions | - | 114,230 | - | 114,230 |
| Write off | - | (2,121) | - | (2,121) |
| Foreign currency translation adjustment | 162 | 2,420 | 3,157 | 5,739 |
| Balance at December 31, 2019 | 19,375 | 768,923 | 377,815 | 1,166,113 |
| Amortization | Trademarks | Licenses, software
and computer
applications | Client
relationships | Total |
| In millions of COP |
| Balance at January 1, 2019 | (8,234) | (256,694) | (219,885) | (484,813) |
| Write off | - | 2,085 | - | 2,085 |
| Amortization expense | (2,772) | (86,132) | (52,200) | (141,104) |
| Foreign currency translation adjustment | (65) | (1,488) | (1,770) | (3,323) |
| Balance at December 31, 2019 | (11,071) | (342,229) | (273,855) | (627,155) |
| | | | | |
| Intangible assets at December 31, 2019, net | 8,304 | 426,694 | 103,960 | 538,958 |
As of December 31, 2018
| Cost | Trademarks | Licenses, software
and computer
applications | Client
relationships | Total |
| In millions of COP |
| Balance at January 1, 2018 | 17,642 | 526,923 | 344,020 | 888,585 |
| Acquisitions | - | 133,376 | - | 133,376 |
| Write off | - | (29,663) | - | (29,663) |
| Foreign currency translation adjustment | 1,571 | 23,758 | 30,638 | 55,967 |
| Balance at December 31, 2018 | 19,213 | 654,394 | 374,658 | 1,048,265 |
| Amortization | Trademarks | Licenses, software
and computer
applications | Client
relationships | Total |
| In millions of COP |
| Balance at January 1, 2018 | (5,040) | (203,554) | (144,526) | (353,120) |
| Write off | - | 25,929 | - | 25,929 |
| Amortization expense | (2,497) | (64,204) | (56,850) | (123,551) |
| Foreign currency translation adjustment | (697) | (14,865) | (18,509) | (34,071) |
| Balance at December 31, 2018 | (8,234) | (256,694) | (219,885) | (484,813) |
| | | | | |
| Intangible assets at December 31, 2018, net | 10,979 | 397,700 | 154,773 | 563,452 |
As of December 31, 2019 and 2018, the assessment made by the Bank indicates there is no evidence of impairment of intangible assets.
As of December 31, 2019, and 2018, the Bank does not have intangible assets with restricted ownership, intangible assets pledged as collateral or contractual agreements for the acquisition of this class of assets.
Research and development costs related to software development
During the period ending at December 31, 2019, 2018 and 2017, the Bank incurred costs that are directly related to software development amounted to COP 85,532, COP 78,222 and COP 105,145. These costs were the result of the analysis and design and implementation of the transformation projects, the most representative of which are: change in core collections, transactional switch and technology modernization project. The expenses were recorded mainly as fees paid in the line ‘Other administrative and general expenses’ of the consolidated statement of income.
Intangibles which did not meet the criteria to be recognized as assets
During the period ended December 31, 2019, 2018 and 2017, the Bank has recognized in the statement of income the amount of COP 48,584, COP 41,690 and 23,180, related to expenditures which were not recognized as intangible assets. These expenses were not recorded as assets due to the lack of characterists to be reliably identifiable, and those assets do not support critical processes to be recognized as intangible assets.
9.2 Goodwill
The following table sets forth an analysis of the activity in the goodwill account:
| | December 31, 2019 | December 31, 2018 |
| In millions of COP |
| Balance at beginning of the year, net | 6,638,403 | 6,095,959 |
| Effect of change in foreign exchange rate | 55,951 | 542,444 |
| Balance at end of the year, net | 6,694,354 | 6,638,403 |
The Bank tests goodwill recognized as a result of business combinations for impairment at least annually using a process that begins with an estimation of the recoverable amount of a group of cash-generation units equal to the operating segment. Recoverable amount is determined by management by reference to market value, if available, by pricing models, or with the assistance of a valuation specialist. Determination of recoverable amount requires management to make assumptions and use estimates to forecast cash flow for periods that are beyond the normal requirements of management reporting; the assessment of the appropriate discount rate; estimation of the recoverable amount of cash-generation units; and the valuation of the separable assets of each business whose goodwill is being reviewed.
The key assumptions used by management in determining the recoverable amount are:
| Operating segment | Goodwill
2019 | Valuation Methodology | Key
Assumptions | Discount
Rate (real) | Growth
rate (real) |
| In millions of COP |
| Banking El Salvador | 924,399 | Discounted Cash flow | 5 years plan | 12.00% | 4.10% |
| Banking Panama | 5,005,084 | Discounted Cash flow | 5 years plan | 8.40% | 6.70% |
| Banking Guatemala | 764,871 | Discounted Cash flow | 5 years plan | 10.40% | 5.20% |
In 2019 and 2018, the Bank tested the aforementioned goodwill for impairment purposes at operating segment levels: Banking Panama, Banking El Salvador and Banking Guatemala. Each operating segment represent a group of cash generating units. Evaluating the goodwill impairment at an operating segment level ensure the alignment with the approach used by the CODM to make decisions about resources to be allocated to the segments and assess its performance.
Sensitivity analysis:
In order to assess the impact of changes in certain significant inputs as the discount rate and the growth rate in the operating segments’ recoverable amount, the Bank made a sensitivity analysis of these inputs through the definition of alternative scenarios with their future evolution.
The tables below present the estimated recoverable amount of each operating segment obtained as a result of sensitivity analysis:
As of December 31, 2019
Banking Panama
| Growth rate | Discount rate |
| 8.90% | 8.40% | 7.90% |
| 6.70% | COP 9,801,900 | COP 12,864,721 | COP 18,487,028 |
| | | | |
| Discount rate | Growth rate |
| 6.20% | 6.70% | 7.20% |
| 8.40% | COP 10,827,366 | COP 12,864,721 | COP 16,599,874 |
Banking El Salvador
| Growth rate | Discount rate |
| 12.50% | 12.00% | 11.50% |
| 4.10% | COP 3,110,435 | COP 3,310,969 | COP 3,538,828 |
| | | | |
| Discount rate | Growth rate |
| 3.60% | 4.10% | 4.60% |
| 12.00% | COP 3,232,992 | COP 3,310,969 | COP 3,399,482 |
Banking Guatemala
| Growth rate | Discount rate |
| 10.90% | 10.40% | 9.90% |
| 5.20% | COP 2,099,213 | COP 2,325,334 | COP 2,600,045 |
| | | | |
| Discount rate | Growth rate |
| 4.70% | 5.20% | 5.70% |
| 10.40% | COP 2,196,032 | COP 2,325,334 | COP 2,482,145 |
As of December 31, 2018
Banking Panama
| Growth rate | Discount rate |
| 9.35% | 9.10% | 8.85% |
| 6.70% | COP 10,044,682 | COP 11,157,929 | COP 12,531,296 |
| | | | |
| Discount rate | Growth rate |
| 6.45% | 6.70% | 6.95% |
| 9.10% | COP 10,458,284 | COP 11,157,929 | COP 12,020,283 |
Banking El Salvador
| Growth rate | Discount rate |
| 12.65% | 12.40% | 12.15% |
| 3.90% | COP 2,893,147 | COP 2,975,432 | COP 3,062,694 |
| | | | |
| Discount rate | Growth rate |
| 3.65% | 3.90% | 4.15% |
| 12.40% | COP 2,945,601 | COP 2,975,432 | COP 3,007,065 |
Banking Guatemala
| Growth rate | Discount rate |
| 11.95% | 11.70% | 11.45% |
| 5.20% | COP 1,649,883 | COP 1,719,017 | COP 1,793,745 |
| | | | |
| Discount rate | Growth rate |
| 4.95% | 5.20% | 5.45% |
| 11.70% | COP 1,684,998 | COP 1,719,017 | COP 1,755,758 |
The Bank considers goodwill as an asset with indefinite useful life.
NOTE 10. PREMISES AND EQUIPMENT, NET
As of December 31, 2019 and 2018 the premises and equipment consisted of the following:
As of December 31, 2019
| Premises and equipment | Balance at
January
1, 2019 | Roll -forward | Balance at
December 31, 2019 |
| Acquisitions | Expenses
depreciation(1) | Disposals | Assets classified as
held for
sale | Effect of changes in
foreign exchange rate |
| In millions of COP |
| Land | | | | | | | |
| Cost | 361,732 | 127,302(2) | - | (3,662) | - | 1,543 | 486,915 |
| Construction in progress | | | | | | | |
| Cost | 2,453 | 34,457 | - | (6,011) | - | (1) | 30,898 |
| Buildings | | | | | | | |
| Cost | 1,344,517 | 264,031(2) | - | (6,840) | - | 4,712 | 1,606,420 |
| Accumulated depreciation | (330,991) | - | (32,415) | 4,794 | - | (2,309) | (360,921) |
| Furniture and fixtures | | | | | | | |
| Cost | 629,428 | 66,746 | - | (50,879) | - | 2,086 | 647,381 |
| Accumulated depreciation | (358,934) | - | (40,593) | 28,687 | - | (1,716) | (372,556) |
| Computer equipment | | | | | | | |
| Cost | 896,811 | 148,244 | - | (92,273) | (3,668) | 3,021 | 952,135 |
| Accumulated depreciation | (567,726) | - | (100,653) | 82,777 | 3,796 | (2,297) | (584,103) |
| Vehicles | | | | | | | |
| Cost | 1,671,850 | 736,568 | - | (199,566) | (271,827) | 111 | 1,937,136 |
| Accumulated depreciation | (444,027) | (6,347) | (179,643) | 14,562 | 91,603 | (59) | (523,911) |
| Ongoing Imports | | | | | | | |
| Cost | 1,267 | - | - | (1,267) | - | - | - |
| Leasehold improvements | | | | | | | |
| Cost | 314,412 | 30,915 | - | (338,115)(3) | - | 2,290 | 9,502 |
| Accumulated depreciation | (152,145) | - | (146) | 152,298(3) | - | (1,038) | (1,031) |
| Total premises and equipment - cost | 5,222,470 | 1,408,263 | - | (698,613) | (275,495) | 13,762 | 5,670,387 |
| Total premises and equipment - accumulated depreciation | (1,853,823) | (6,347) | (353,450) | 283,118 | 95,399 | (7,419) | (1,842,522) |
| Total premises and equipment, net | 3,368,647 | 1,401,916 | (353,450) | (415,495) | (180,096) | 6,343 | 3,827,865 |
| (1) | See Note 26.3 Impairment, depreciation and amortization. |
| (2) | Corresponds to the acquisition of a new headquarters in Bogotá. |
| (3) | It mainly corresponds to the reclassification to Assets by right of use as an integral part of the leased assets during the year 2019. See note 7.2 Lessee. |
For 2019 there are no premises and equipment related to investments held for sale.
As of December 31, 2018
| Premises and equipment | Balance at
January
1, 2018 | Roll -forward | Balance at
December 31,
2018 |
| Acquisitions | Expenses
depreciation(1) | Disposals | Assets classified
as held for
sale | Effect of changes
in foreign
exchange rate |
| In millions of COP |
| Land | | | | | | | |
| Cost | 337,362 | 20,924 | - | (6,079) | - | 9,525 | 361,732 |
| Construction in progress | | | | | | | |
| Cost | 5,129 | 6,485 | - | (8,448) | - | (713) | 2,453 |
| Buildings | | | | | | | |
| Cost | 1,304,539 | 21,817 | - | (34,850) | (5,916) | 58,927 | 1,344,517 |
| Accumulated depreciation | (285,118) | - | (29,199) | 2,913 | - | (19,587) | (330,991) |
| Furniture and fixtures | | | | | | | |
| Cost | 601,275 | 28,221 | - | (24,861) | - | 24,793 | 629,428 |
| Accumulated depreciation | (334,054) | - | (36,073) | 18,695 | - | (7,502) | (358,934) |
| Computer equipment | | | | | | | |
| Cost | 782,476 | 142,451 | - | (50,282) | (4,708) | 26,874 | 896,811 |
| Accumulated depreciation | (497,976) | - | (80,980) | 47,345 | 4,578 | (40,693) | (567,726) |
| Vehicles | | | | | | | |
| Cost | 1,410,709 | 679,356 | - | (249,771) | (170,145) | 1,701 | 1,671,850 |
| Accumulated depreciation | (371,276) | (231) | (145,529) | 11,673 | 61,988 | (652) | (444,027) |
| Ongoing Imports | | | | | | | |
| Cost | 3,502 | 3,053 | - | (5,288) | - | - | 1,267 |
| Leasehold improvements | | | | | | | |
| Cost | 297,500 | 19,180 | - | (7,737) | - | 5,469 | 314,412 |
| Accumulated depreciation | (126,663) | - | (25,970) | 7,188 | - | (6,700) | (152,145) |
| Total premises and equipment - cost | 4,742,492 | 921,487 | - | (387,316) | (180,769) | 126,576 | 5,222,470 |
| Total premises and equipment - accumulated depreciation | (1,615,087) | (231) | (317,751) | 87,814 | 66,566 | (75,134) | (1,853,823) |
| Total premises and equipment, net | 3,127,405 | 921,256 | (317,751) | (299,502) | (114,203) | 51,442 | 3,368,647 |
(1)See Note 26.3 Impairment, depreciation and amortization.
As of December 31, 2018 the premises and equipment of Assets held for sale consist of:
| Premises and equipment | Balance at
January
1, 2018 | Roll - forward | Balance at
December 31,
2018 |
| Acquisitions | Expenses
depreciation | Disposals | Assets
classified as
held for
sale | Effect of
changes in
foreign exchange rate |
| In millions of COP |
| Furniture and Fixtures | | | | | | | |
| Cost | 111 | - | - | - | - | (1) | 110 |
| Accumulated depreciation | (95) | - | (9) | - | - | 2 | (102) |
| Computer equipment | | | | | | | |
| Cost | 113 | - | - | - | - | 7 | 120 |
| Accumulated depreciation | (86) | - | (12) | - | - | (14) | (112) |
| Vehicles | | | | | | | |
| Cost | 142,647 | 84,344 | - | (1,850) | (26,913) | 12,453 | 210,681 |
| Accumulated depreciation | (33,221) | (54) | (24,833) | 365 | 13,446 | (2,044) | (46,341) |
| Total premises and equipment - cost | 142,871 | 84,344 | - | (1,850) | (26,913) | 12,459 | 210,911 |
| Total premises and equipment - accumulated depreciation | (33,402) | (54) | (24,854) | 365 | 13,446 | (2,056) | (46,555) |
| Total premises and equipment, net | 109,469 | 84,290 | (24,854) | (1,485) | (13,467) | 10,403 | 164,356 |
As of December 31, 2019 and 2018, there were no contractual commitments for the purchase of premises and equipment, or premises and equipment pledged as collateral.
As of December 31, 2019 and 2018, the assessment made by the Bank indicates there is no evidence of impairment of its premises and equipment.
As of December 31, 2019, the amount of fully depreciated property and equipment that is still in use is COP 384,847, mainly comprised of computer equipment, office equipment and Furniture and fixtures.
NOTE 11. INVESTMENT PROPERTIES
The table below sets forth the reconciliation between the initial balance account and the balance at the end of the period, at fair value:
| | December 31, 2019 | December 31, 2018 |
| In millions of COP |
| Balance at the beginning of the year | 1,732,873 | 1,657,409 |
| Acquisitions | 116,503 | 8,536 |
| Sales/Write-offs | (17,667) | (10,422) |
| Amount reclassified from inventories(1) | 68,058 | - |
| Gains on valuation(2) | 93,197 | 77,350 |
| Balance at the end of the period(3) | 1,992,964 | 1,732,873 |
| (1) | In 2019, returned goods from financial leasing operations were reclassified from inventories to investment property, because they are held for obtaining profits and capital appreciation. |
| (2) | See Note 25.4 Other operating income, net. |
| (3) | Between December 31, 2019 and 2018, there were no transfers in and out of Level 3 fair value hierarchy related with investment properties. See Note 30 Fair value of assets and liabilities. |
The valuation adjustments recorded by the Bank's related to its investment properties are detailed below:
As of December 31, 2019
| Type of asset | Balance at the
beginning of
the year | Appraisals | Net increase
(decrease) in
investment properties | Amount reclassified
from inventories(1) | Adjusted fair value at
the end of the year |
| In millions of COP |
| Buildings | 1,483,594 | 74,210 | 98,857 | 68,058 | 1,724,719 |
| Lands | 249,279 | 18,987 | (21) | - | 268,245 |
| Total | 1,732,873 | 93,197 | 98,836 | 68,058 | 1,992,964 |
(1)In 2019, returned goods from financial leasing operations were reclassified from inventories to investment property, because they are held for obtaining profits and capital appreciation
As of December 31, 2018
| Type of asset | Balance at the
beginning of the
year | Appraisals(1) | Net increase (decrease) in
investment properties | Adjusted fair value at the
end of the year |
| In millions of COP |
| Buildings | 1,425,585 | 59,895 | (1,886) | 1,483,594 |
| Lands | 231,824 | 17,455 | - | 249,279 |
| Total | 1,657,409 | 77,350 | (1,886) | 1,732,873 |
(1) Corresponds to the change in the commercial estimate of real estate due to the change in the consumer price index (IPC).
Amounts recognized in the statement of income for the period.
The table sets forth the main income recorded by the Bank related to its investment properties:
| | | December
31, 2019 | December
31, 2018 | December
31, 2017 |
| | | In millions of COP |
| Income from rentals | | 85,507 | 79,756 | 77,964 |
| Operating expenses due to: | | | | |
| Investment properties that generated income through rentals | | (15,669) | (16,531) | (21,012) |
| Investment properties that did not generate income through rentals | | (2,183) | (1,630) | (2,295) |
Currently, there are no restrictions on the use or income derived from the buildings or lands that the Bank has as investment property.
The fair value of the Bank’s investment properties for the year ending at December 31, 2019 and 2018, has been recorded according to the assessment made by independent external consulting companies that have the appropriate capacity and experience in performing those assessments. The appraisers are either approved by the Property Market Auctions of Colombia or foreign appraisers, who are required to provide a second signature by a Colombia appraiser accredited by the Property Market Auctions.
Fair value appraisals are carried out in accordance with IFRS 13. The reports made by the external consulting company contain the description of the valuation methodologies used, and key assumptions such as: discount rates, calculation of applied expenses and income approach, among others. The fair value of the investment properties is based on the comparative market approach, which reflects the prices of recent transactions with similar characteristics. Upon determining the fair value of these investment properties, the greater and best use of these investment properties is their present use. For further information about measurements techniques and inputs used by consulting companies, see Note 30 Fair Value of assets and liabilities.
As of December 31, 2019 and 2018, the Bank does not have investment properties held under financial leases.
NOTE 12. INCOME TAX
The income tax is recognized in each of the countries where the Bancolombia Group has operations, in accordance with the tax regulations in force in each of the jurisdictions.
| 12.1. | Components recognized in the income statement of the period: |
| | December 31,
2019 | December 31,
2018 | December 31,
2017 |
| In millions of Colombian pesos | |
| Current tax | | | |
| Fiscal term | 1,040,558 | 752,728 | 1,041,454 |
| Prior fiscal terms(1) | 7,908 | (146,837) | 3,967 |
| Total current tax | 1,048,466 | 605,891 | 1,045,421 |
| Deferred tax | | | |
| Fiscal term | 214,498 | 223,544 | 193,177 |
| Total deferred tax | 214,498 | 223,544 | 193,177 |
| Total income tax | 1,262,964 | 829,435 | 1,238,598 |
(1) The recoveries of previous periods for $ 85,921 was recognized in 2017 in Bancolombia as income.
| 12.2. | Components recognized in Other Comprehensive Income (OCI) |
| December 31, 2019 |
| In millions of Colombian pesos |
| | Amounts before taxes | Deferred tax | Net taxes |
| Losses related to the defined benefit liability | (38,451) | 14,835 | (23,616) |
| Net income from financial instruments measured at fair value | 84,171 | (12,607) | 71,564 |
| Unrealized gains on investments in associates and joint ventures using equity method. | 8,151 | (32) | 8,119 |
| Loss net investment coverage in operations abroad | (60,258) | 20,213 | (40,045) |
| Exchange differences arising on translating the foreign operations | 104,955 | - | 104,955 |
| Net | 98,568 | 22,409 | 120,977 |
See status of Other Comprehensive Income
| December 31, 2018 |
| In millions of Colombian pesos |
| | Amounts before taxes | Deferred tax | Net taxes |
| Revaluation related to the defined benefit liability | 37,325 | (7,663) | 29,662 |
| Net incomefrom financial instruments measured at fair value | 3,771 | 10,190 | 13,961 |
| Unrealized gains on investments in associates and joint ventures using equity method. | 2,581 | (663) | 1,918 |
| Loss net investment coverage in operations abroad | (584,650) | 172,870 | (411,780) |
| Exchange differences arising on translating the foreign operations | 1,043,593 | - | 1,043,593 |
| Net | 502,620 | 174,734 | 677,354 |
See status of Other Comprehensive Income
| December 31, 2017 |
| In millions of Colombian pesos |
| | Amounts before taxes | Deferred tax | Net taxes |
| Revaluation related to the defined benefit liability | 3,753 | (3,725) | 28 |
| Net income from financial instruments measured at fair value | 17,548 | 9,789 | 27,337 |
| Net profit investment coverage in operations abroad | 36,762 | (6,895) | 29,867 |
| Exchange differences arising on translating the foreign operations | 412,878 | - | 412,878 |
| Net | 470,941 | (831) | 470,110 |
See status of Other Comprehensive Income
| 12.3.1. | Explanation of applicable fees |
The following are the nominal rates of the current tax in each of the countries where Grupo Bancolombia has operations subject to income tax:
Companies domiciled in Colombia
The tax provisions in force in Colombia in relation to the current income tax applicable for taxable years 2019, 2018 and 2017, establish the following:
| | 2019 | 2018 | 2017 |
| Income tax | 33% | 33% | 34% |
| Additional points | 0%* | 4% | 6% |
| Total | 33% | 37% | 40% |
* For 2019, Law 1943 of 2018 established for the financial institutions, a surcharge of 4 additional points on the general income tax. However, Decision C-510 of 2019 of the constitutional count declared this surcharge to be unenforceable.
The deferred tax as of December 31, 2019 was calculated based on the temporary differences, taking into account the applicable rates for 2020 and following years, as follows:
| | 2020 | 2021 | 2022 | 2023 onwards |
| Income tax | 32% | 31% | 30% | 30% |
| Additional points | 4% | 3% | 3% | 0% |
| Total | 36% | 34% | 33% | 30% |
* Law 2010 of 2019 (Law on economic growth) established for financial institutions, certain additional points on the general income tax. This surcharge is subject to an advance payment of 100%.
Domiciled companies in other countries
The tax rates used for the calculation of income tax, for the taxable periods 2018 and 2019 was:
| | | 2018 | 2019 | 2020 onwards |
| Companies in Peru | Income tax | 29.5% | 29.5% | - |
| Companies in Panama | Income tax | 25% | 25% | 25% |
| Companies in El Salvador | Income tax | 30% | 30% | 30% |
| Companies in Guatemala | Income tax | 25% | 25% | 25% |
| 12.3.2. | Amount of temporary differences in subsidiaries, branches, associates over which deferred tax was not recognized is: |
| | December 31, 2019 | December 31, 2018 |
| In millions of Colombian pesos |
| Temporary differences | | |
| Local Subsidiaries | (1,159,387) | (442,739) |
| Foreign Subsidiaries | (4,547,635) | (4,547,635) |
In accordance with IAS 12 no deferred tax credit was recorded with respect to the amounts shown in the table above, because the administration can control the future time in which such differences are reversed and this is not expected to occur in the foreseeable future.
| 12.3.3. | Temporary differences as of December 31, 2019 |
-Net effect of deferred tax assets and liabilities by company disclosed in the Financial Position Statement:
| | December 31,
2019 | December 31,
2019 | December 31,
2018 | December 31,
2018 |
| In millions of Colombian pesos |
| Company | Deferred Tax Asset | Deferred Tax Liability | Deferred Tax Asset | Deferred Tax Liability |
| Arrendadora Financiera S.A. | | (53) | 94 | |
| Bagrícola Costa Rica S.A. | 102 | | 74 | |
| Grupo Agromercantil Holding | 50,063 | | | (13,566) |
| Banca de Inversión Bancolombia S.A. | | (20,567) | | (20,300) |
| Banco Agrícola S.A. | 72,436 | | 67,527 | |
| Bancolombia S.A. | | (1,452,087) | | (1,245,807) |
| Banistmo SA and Subsidiaries | 271,057 | | 198,958 | |
| Pasarela Colombia S.A.S(1). | 118 | | | (19) |
| Fideicomiso “Lote Abelardo Castro” | | - | | (123) |
| Fiduciaria Bancolombia S.A. | | (5,918) | | (4,265) |
| Gestora de Fondo de Inversión S.A | 21 | | | |
| Inversiones CFNS S.A.S. | | (452) | | (1,011) |
| Renting Colombia S.A. | | (30,656) | | (22,450) |
| Transportempo S.A.S | 1,238 | | 163 | |
| Valores Banagrícola S.A. | 8 | | 19 | |
| Valores Bancolombia S.A. | 5,959 | | 4,342 | |
| Valores Simesa S.A. | | (12,225) | | (10,754) |
| Net Deferred Tax by Company | 401,002 | (1,521,958) | 271,177 | (1,318,295) |
| Net Deferred Tax | | (1,120,956) | | (1,047,118) |
(1)Before Biba Colombia Inmobiliaria S.A.S
This section shows the net deferred tax resulting from each company and differs from the information in section 12.3.4, because there the deferred tax is disclosed according to its nature.
| 12.3.4. | Asset and liability deferred tax detail without netting by company |
This section shows the deferred tax according to its nature and differs from the information in section 12.3.3, because there the deferred tax is shown net by company.
Assets deferred tax with effect on Income Statement, OCI and Equity
Deferred tax summary in
balance sheet accounts | December
31, 2018 | With effects
on Results | With effects on
OCI and
Retained Profits | Eliminations | Reclassifications | December 31,
2019 |
| In millions of Colombian pesos |
| Assets deferred tax Results | 704,801 | (79,475) | | (14,192) | 8,979 | 620,113 |
| Assets deferred tax OCI and Equity | 477,876 | | 153,409 | | 1,062 | 632,347 |
| Net Deferred Tax | 1,182,677 | (79,475) | 153,409 | (14,192) | 10,041 | 1,252,460 |
| | December 31, 2018 | Implementation | Increase | December 31, 2019 |
| In millions of Colombian pesos |
| Asset Deferred Tax with effect on Income Statement: | | | | |
| Property and equipment | 18,117 | 11,232 | 453 | 7,338 |
| Employee Benefits | 172,327 | 1,083 | 21,387 | 192,631 |
| Deterioration assessment | 56,920 | 37,894 | 99,869 | 118,895 |
| Tax credits settlement | 74,189 | 3,513 | - | 70,676 |
| Financial Obligations | 291,865 | 200,450 | 135 | 91,550 |
| Investments evaluation | 73,863 | 1,452 | 14,026 | 86,437 |
| Other deductions | 17,520 | 1,467 | 36,533 | 52,586 |
| Total Asset Deferred Tax with effect on Income Statement | 704,801 | 257,091 | 172,403 | 620,113 |
| | December 31, 2018 | Implementation | Increase | December 31, 2019 |
| In millions of Colombian pesos |
| Asset Deferred Tax with effect on OCI and Equity: | | | | |
| Net investment coverage in operations abroad | 179,765 | - | 20,213 | 199,978 |
| Employee Benefits | 28,603 | - | 10,919 | 39,522 |
| Investments evaluation | - | 70,034 | 75,005 | 4,971 |
| implementation adjustment(1) | 269,508 | - | 118,368 | 387,876 |
| Total Asset Deferred Tax with effect on OCI and Equity | 477,876 | 70,034 | 224,505 | 632,347 |
(1)Value recorded against retained earnings, not other comprehensive income (OCI). The increase is due to the adoption of IFRS 16.
In accordance with the financial projections, it is expected in the future to generate sufficient liquid income to offset the items recorded as deductible deferred tax. These estimates start from the financial projections that were prepared taking into account information from the Bancolombia Group's economic research records, the expected economic environment for the next five years. The main indicators on which the models are based are GDP growth, loans growth and interest rates. In addition to these elements, the long-term Group's strategy is taken into account.
Liability deferred tax with effect on Income Statement, OCI and Equity
Deferred tax summary in
balance sheet accounts | December 31,
2018 | With effects
on Results | With effects on
OCI and
Retained Profits | Eliminations | Reclassifications | December 31,
2019 |
| In millions of Colombian pesos |
| Liability deferred tax Results | (2,122,001) | (219,631) | - | 44,897 | 44,901 | (2,251,834) |
| Liability deferred tax OCI and Equity | (107,794) | - | (14,354) | - | 566 | (121,582) |
| Net Deferred Tax | (2,229,795) | (219,631) | (14,354) | 44,897 | 45,467 | (2,373,416) |
| | December 31, 2018 | Implementation | Increase | December 31, 2019 |
| In millions of Colombian pesos |
| Liability Deferred Tax with effect on Income Statement: | | | | |
| Property and equipment | (243,330) | 36,002 | 7,220 | (214,548) |
| Lease restatement | (213,359) | - | 42,072 | (255,431) |
| Deterioration assessment | (375,178) | 33,716 | 11,374 | (352,836) |
| Participatory titles evaluation | (139,963) | 84,335 | 68,136 | (123,764) |
| Derivatives' evaluation | (178,470) | 178,466 | - | (4) |
| Goodwill | (858,849) | 16,252 | 177,373 | (1,019,970) |
| Properties received in payment | (77,043) | 41 | 15,711 | (92,713) |
| Other deductions | (35,809) | 1,203 | 157,962 | (192,568) |
| Total Liability Deferred Tax with effect on Income Statement: | (2,122,001) | 350,015 | 479,848 | (2,251,834) |
| | December 31, 2018 | Implementation | Increase | December 31, 2019 |
| In millions of Colombian pesos |
| Liability Deferred Tax with effect on OCI and Equity | | | | |
| Employee Benefits | (3,917) | 3,950 | 33 | - |
| Investments evaluation | (95,283) | 70,051 | 87,629 | (112,861) |
| Investments in associates. Adjustment for equity method | (663) | 663 | 695 | (695) |
| IFRS 9 implementation adjustment(1)(2) | (7,931) | - | 95 | (8,026) |
| Total Liability Deferred Tax with effect on OCI and Equity: | (107,794) | 74,664 | 88,452 | (121,582) |
(1)Value recorded against retained earnings, not other comprehensive income (OCI)
(2)Effect on Grupo Agromercantil Holding due to an increase in the investments
Total deferred tax
Deferred tax summary in
balance sheet accounts | December 31, 2018 | With effects
on Results | With effects on
OCI and
Retained Profits | Eliminations | Reclassifications | December 31,
2019 |
| In millions of Colombian pesos |
| Asset Deferred Tax | 1,182,677 | (79,475) | 153,409 | (14,192) | 10,041 | 1,252,460 |
| Liability Deferred Tax | (2,229,795) | (219,631) | (14,354) | 44,897 | 45,467 | (2,373,416) |
| Net Deferred Tax | (1,047,118) | (299,106) | 139,055 | 30,705 | 55,508 | (1,120,956) |
The deferred tax disclosed in section 12.1, corresponds to assets and liabilities deferred tax without eliminations amounting to COP 299,106 million, less eliminations and reclassifications amounting to COP 84,585 million.
| 12.3.5. | Reconciliation of the effective tax rate |
| Reconciliation of the tax rate | December 31,
2019 | December 31,
2018 | December 31,
2017 |
| In millions of Colombian pesos | |
| Accounting profit | 4,477,531 | 3,615,870 | 3,992,771 |
| Applicable tax with nominal rate | 1,477,585 | 1,337,872 | 1,597,108 |
| Non-deductible expenses to determine taxable profit (loss) | 281,633 | 266,246 | 356,350 |
| Accounting and non-tax expense (income) to determine of taxable profit (loss) | (822,683) | (168,134) | (179,605) |
| Base Differences | 304,871 | 486,193 | 341,828 |
| Fiscal and non-accounting expense (income) to determine of taxable profit (loss)(1) | 434,929 | (579,660) | (23,844) |
| Ordinary activities income exempt from taxation | (258,622) | (235,560) | (181,406) |
| Ordinary activities income not constituting income or occasional tax gain | (173,791) | (133,211) | (130,272) |
| Tax deductions | (128,211) | (25,398) | (184,620) |
| Goodwill Depreciation | (194,679) | (218,277) | (233,004) |
| Tax depreciation surplus | (100,286) | (118,046) | (177,936) |
| Tax rate effect in other countries(2) | 27,038 | (92,125) | (218,785) |
| Prior fiscal terms | 7,908 | (146,837) | 3,967 |
| Other effects of the tax rate by reconciliation between accounting profit and tax expense (income) | 407,272 | 456,372 | 268,817 |
| Total income tax | 1,262,964 | 829,435 | 1,238,598 |
(1)The variation originates mainly from the Participation Method (current tax) and the treatment of derivatives
(2)The variation originates in adjustments for eliminations in the consolidated financial statements.
If the parent company or any of its subsidiaries were to distribute dividends, they would be subject to the tax regulations of each of the countries where they are decreed.
| 12.4.2. | Dividends received from Colombian Subsidiary Companies |
In accordance with the past practice the Bank as Parent of its national subsidiaries which are part of the Business Group expects to receive dividends not subject to the income tax from these subsidiaries, and will not be subject to withholding tax, in accordance with Law 2010 of 2019.
| 12.5. | Tax contingent Liabilities and assets |
In the determination of the effective current and deferred taxes subject to review by the tax authority, the relevant regulations have been applied and interpretations have been made to take positions on those positions for which different interpretations may arise against those made by the entity. Due to the complexity of the tax system, ongoing amendments to the tax regulations, accounting changes with implications on tax bases and in general the legal instability of the country, the tax authority may at any time have different criteria to that of the Bancolombia Group. Consequently, a dispute or inspection by the tax authority on a particular tax treatment may affect the Bancolombia Group accounting of assets or liabilities for deferred or current taxes, in accordance with the requirements of IAS 12.
In 2019, the Bancolombia Group reversed and updated the uncertain positions in accordance with the administrative acts received during the year:
| Balance December 2018 | Update | Payments | Reversal | Balance December
2019 |
| 114,968 | 12,700 | 6,085 | 19,031 | 102,552 |
The following is the detail of the fiscal losses and presumptive income excesses over net income in the Group's entities, which have not been used, as of December 31, 2019.
| Base | Deferred tax recognized
asset |
| In millions of Colombian pesos |
| 235,585 | 70,676 |
In the implementation of the provisions of IAS 12 "Income Tax", a deferred tax asset is recognized, since the group companies are expected to have future taxable profits with which to charge this temporary difference.
| 12.7. | Tax regulation applicable to current and deferred tax corresponding to fiscal periods 2018 and 2019. |
| 12.7.1. | Domiciled companies in Colombia |
Current tax
| a) | The tax regulations applicable to the 2018 and 2019 terms were those established by Law 1819 of 2016 and Law 1943 of 2018, as well as by their Regulatory Decrees and other prevailing regulations established in the Tax Code. |
| b) | Windfalls are taxed separately from ordinary income and are taxed at the 10% rate. |
| c) | Income tax is determined through the higher value between the taxable net income calculated by the ordinary system and the presumptive income determined on 3.5% of the previous year net assets for 2018 and 1.5% of the previous year net assets for 2019. |
Deferred tax
The assets and liabilities deferred tax as of December 2018 was measured taking into account the rates for the income tax established by Act 1943 of 2018. As of December 31, 2019, the measurement of the deferred tax was determined with the income tax, indicated in Act 2010 of 2019; taking into account the future periods in which the temporary differences are expected to be reverted.
| 12.7.2. | Domiciled companies outside of Colombia |
The current tax is calculated based on the accounting information expressed under the accounting technical frameworks in force in each one of the jurisdictions where the Bancolombia Group has operations.
The deferred tax as of December 31, 2019, was determined taking into account the fiscal regulations in force and applicable in each of the countries where the financial operations are carried out, using the tax rates applicable in the taxable years in which the Company expects to execute the assets or settle the liabilities.
| 12.7.3. | Future tax impacts from regulatory changes |
Companies domiciled in Colombia
Law 1943 of 2018 was declared unenforceable by the Constitutional Court as of January 01, 2020 (Decision C-481 of 2019). Later on December 27, 2019 the National Government issued Law 2010 (Law on economic growth) for the purpose of providing continuity to many matters relating to taxation that were imposed in the previous Law and introducing certain changes into the tax system which shall be effective as of January 01, 2020:
| a) | For financial institutions, the income and supplementary tax rates were amended and certain points were added to the general income tax, provided that the taxable income is equal to or greater than 120,000 TVUs (Tax Value Unit), thus: |
| Income and supplementary taxes |
| | 2020 | 2021 | 2022 | 2023
onwards |
| Income tax | 32% | 31% | 30% | 30% |
| Additional points | 4% | 3% | 3% | 0% |
| Total income tax | 36% | 34% | 33% | 30% |
| b) | The presumptive income rate on net assets is gradually reduced, thus: 0.5% for the 2020 tax year and 0% from the 2021 tax year. |
| c) | The thin capitalization rules are amended, which shall apply to interest from domestic or foreign third party debt. |
The thin capitalization rule does not apply to taxpayers subject to the oversight of the Financial Superintendency.
| d) | The list of income that is not considered as a national source is amended as follows: Credit for the importation of goods, services, and in banking overdrafts the term of which is greater than 6 months are considered as national source income. |
| e) | In private equity funds, income shall be distributed between subscribers or shareholders to the same instrument received by the fund, under the same tax conditions that they would have as if directly received by the subscriber or shareholder, with the following rules being met: |
| i. | Where the fund’s shares are traded on a stock exchange that is subject to the inspection and oversight of Financial Superintendency of Colombia, or |
| ii. | Where the fund meets the following requirements: |
| ü | Not being more than directly or indirectly 50% or more owned by a single effective beneficiary, or related investor group or by members of a single family within the 4th degree of consanguinity or affinity, that are income tax taxpayers and; |
| ü | Where none of the effective beneficiaries of the fund or related investor group or family group, individually or jointly, have control or discretion over its distributions. |
Without compliance to these requirements, the shareholder income shall be incurred in the same fiscal year in which it is received by the private equity fund.
The definition of what should be understood as an effective beneficiary is incorporated and the single registry of effective, final or real beneficiaries is created.
| f) | The deduction to income tax of 100% of the taxes, rates and contributions effectively paid during the tax year or period, which have a causal relationship, is established as a general rule, and it is not possible for tax deductions such as: income, equity and tax normalizations. |
| g) | Tax on industries and businesses and notices and bulletin boards may be taken as a tax discount on income tax, up to 50% of tax, for the years 2020 and 2021. From 2022, 100% may be discounted. |
| h) | The tax discount is created for sales tax paid in the acquisition, construction, or formation and importation of productive real fixed assets, including those associated with necessary services for bringing them into good working order. |
| i) | The minimum sales price rules are amended to include services and to establish that it may not be less than 85% of its commercial value. |
For shares that are not listed on stock exchanges, the sale price may not be less than the intrinsic value by more than 30%.
| j) | A first employment deduction is created equivalent to 120% of salary payments made to persons under the age 28. |
| k) | The 2% excise tax is eliminated for real estate sales with a value greater than 26,800 Tax Value Unit - TVUs. |
Withholding at source for dividends shall have the treatment as summarized below, according to the dividend status and the dividend’s beneficial taxpayer rate, thus:
| 1. | For dividends from profits that have paid the tax in the company, i.e. not taxable, the following rules shall be followed: |
| i. | Dividends received by natural persons residing in Colombia: |
If the dividends are distributed to natural persons residing in Colombia, they shall be taxable at a marginal rate of 0% to 10%.
| ii. | Dividends received by domestic legal persons: |
The withholding rate at source shall be 7.5%
| iii. | Dividends received by non-resident natural persons, foreign corporations and permanent establishments: |
The withholding rate at source shall be 10%
| 2. | For dividends from profits that have NOT paid tax in the company, i.e. taxable, the following rule shall be followed: |
These shall be taxed at the general income tax rate according to the year in which they are paid or offset (32% for 2020, 31% for 2021 and 30% from 2022). Once this withholding is discounted, the withholding rate mentioned in numeral 1 shall be applied.
Dividends distributed within companies of a Corporate Group or within societies in control situation duly registered with the Chamber of Commerce are not subject to withholding.
| 3. | Foreign capital investment. |
For the determination of income tax related to profits obtained from capital investments external to the portfolio, irrespective of the mode or vehicle used to make the investment by the investor, the following rules shall apply:
| i. | Dividends from profits that have paid tax in the company, i.e. non-taxable, the rate shall be 10%. |
| ii. | For dividends from profits that did NOT pay tax in the company, i.e. taxable, the following rule shall be followed: |
The dividends shall be taxable at a rate of 25% and the remainder shall be applied a withholding rate of 10%.
| m) | Colombian Holding Company regime |
A new Colombian Holding Company regime has been created, for companies whose principal activity is holding securities, investments or shareholdings in Colombian and/or foreign corporations and the administration of such investments.
To become a beneficiary of this regime, they must guarantee a minimum direct or indirect shareholding of 10% in the capital of two or more of the corporations described above, for a minimum period of 12 months.
In addition, they must employ at least 3 people, have their own management and make strategic decisions in Colombia related to their investments and assets.
Among its main benefits, it is noted that dividends received from entities not resident in Colombia shall be in turn exempt from income tax in Colombia and shall not be subject to tax on industries and Businesses.
Dividends distributed by CHCs (Colombian Holding Companies) to residents, are taxable with a right to discount for taxes paid abroad on foreign source income, those distributed to non-residents shall be understood as foreign source income.
When the CHC (Colombian Holding Companies) transfers its shares in a foreign entity, it shall be exempt from income tax and its supplementary tax.
Domiciled companies outside of Colombia
For the term of December 2019, there were no changes in the countries where Grupo Bancolombia has operations.
NOTE 13. ASSETS HELD FOR SALE AND INVENTORIES, NET
The breakdown of inventories and assets held for sale, net of the Bank is as follows:
| Assets held for sale and inventories | December 31, 2019 | December 31, 2018 |
| In millions of COP |
| Inventories, net | 394,354 | 290,605 |
| Assets held for sale | 124,395 | 345,423 |
| Total assets held for sale and inventories, net | 518,749 | 636,028 |
13.1. Inventories
Due to the nature of the financial services provided by some subsidiaries of the Bank, when assets provided through operating or financial leases to third parties that do not exercise the purchase option or do not have a purchase option, once the agreement expires those assets are recorded as inventories, considering that in the course of the ordinary activities performed by such subsidiaries, those assets are routinely sold.
The Bank's inventories at December 31, 2019 and 2018, are summarized as follows:
| Inventories | December 31, 2019 | December 31, 2018 |
| In millions of COP |
| Lands and buildings | 356,480 | 250,543 |
| Vehicles | 49,951 | 41,853 |
| Machinery | 31,307 | 20,527 |
| Total inventory cost | 437,738 | 312,923 |
| Impairment | (43,384) | (22,318) |
| Total inventories, net | 394,354 | 290,605 |
Impairment is recognized based on market price fluctuation due to the fact that the fair value is determined by the offering price less cost to sell.
There are no inventories pledged as collateral for liabilities as of December 31, 2019 and 2018.
13.2. Assets held for sale
The assets recognized by the Bank as assets held for sale correspond to machinery, equipment, motor vehicles, technology, and investment property, among others that have been received as foreclosed assets.
The Bank's assets are subject to a current plan for their sale, which contains the details of the selling price allocation and the advertising and marketing plan. Furthermore, the plan specifies the conditions to proceed with the selling process.
The total balance of assets held for sale, by operating segment, are detailed below:
As of December 31, 2019
| Assets held for sale | Banking | Banking | Banking | Banking Guatemala | Others Segment | Total |
| Colombia | Panama | El Salvador |
| In millions of COP |
| Machinery and equipment | 2,554 | 2,245 | - | - | - | 4,799 |
| Cost | 2,622 | 2,648 | - | - | - | 5,270 |
| Impairment | (68) | (403) | - | - | - | (471) |
| Real estate for residential purposes | 61,973 | 43,940 | 5,301 | 1,575 | - | 112,789 |
| Cost | 63,417 | 45,068 | 5,424 | 1,709 | - | 115,618 |
| Impairment | (1,444) | (1,128) | (123) | (134) | - | (2,829) |
| Real estate different from residential properties | - | 5,918 | 889 | - | - | 6,807 |
| Cost | - | 5,964 | 909 | - | - | 6,873 |
| Impairment | - | (46) | (20) | - | - | (66) |
| Total assets held for sale - cost | 66,039 | 53,680 | 6,333 | 1,709 | - | 127,761 |
| Total assets held for sale -impairment | (1,512) | (1,577) | (143) | (134) | - | (3,366) |
| Total assets held for sale | 64,527 | 52,103 | 6,190 | 1,575 | - | 124,395 |
| (1) | For 2019 there are no assets related to investments held for sale. |
In October 2019, the sale of Avefarma S.A.S, Glassfarma Tech S.A.S. y Panamerican Pharmaceutical Holding Inc., was perfected, generating a net profit of COP 7,068. These investments were classified as investments held for sale since december 2017.
In March 2019 Arrendamiento Operativo CIB S.A.C. was sold, generating a net profit of COP 36,338 and in July 2019 FiduPerú S.A. Sociedad Fiduciaria was sold generating a loss of COP 602. These investments were classified as investments held for sale since december 2017. The breakdown of the major classes of assets and liabilities classified as held for sale as of December 31, 2018 is as follows:
| | December 31, 2018 |
| Assets | |
| Cash and cash equivalents | 12,476 |
| Financial assets investment | - |
| Premises and equipment, net | 164,356 |
| Prepaid expenses | 412 |
| Tax receivables | 7,093 |
| Deferred tax | 1,551 |
| Assets held for sale | 721 |
| Other assets | 22,393 |
| Total assets | 209,002 |
| Liabilities | |
| Borrowings from other financial institutions | 150,254 |
| Tax liabilities | 1,054 |
| Deferred tax liabilities | 4,832 |
| Other liabilities | 7,456 |
| Total liabilities | 163,596 |
As of December 31, 2018
| Assets held for sale | Banking | Banking | Banking | Banking Guatemala | Others Segment | Total |
| Colombia | Panama | El Salvador |
| In millions of COP |
| Machinery and equipment | 2,696 | 2,860 | - | - | - | 5,556 |
| Cost | 3,065 | 3,090 | - | - | - | 6,155 |
| Impairment | (369) | (230) | - | - | - | (599) |
| Real estate for residential purposes | 29,562 | 59,241 | 1,762 | 1,487 | - | 92,052 |
| Cost | 30,472 | 61,286 | 1,800 | 1,487 | - | 95,045 |
| Impairment | (910) | (2,045) | (38) | - | - | (2,993) |
| Real estate different from residential properties | 452 | 23,624 | - | - | - | 24,076 |
| Cost | 998 | 23,822 | - | - | - | 24,820 |
| Impairment | (546) | (198) | - | - | - | (744) |
| Investments held for sale | - | - | - | - | 19,128 | 19,128 |
| Cost | - | - | - | - | 19,128 | 19,128 |
| Impairment | - | - | - | - | - | - |
| Assets related to Investments held for sale | - | - | - | - | 204,611 | 204,611 |
| Cost | - | - | - | - | 209,002 | 209,002 |
| Impairment | - | - | - | - | (4,391) | (4,391) |
| Total assets held for sale - cost | 34,535 | 88,198 | 1,800 | 1,487 | 228,130 | 354,150 |
| Total assets held for sale -impairment | (1,825) | (2,473) | (38) | - | (4,391) | (8,727) |
| Total assets held for sale | 32,710 | 85,725 | 1,762 | 1,487 | 223,739 | 345,423 |
Assets held for sale had an impairment amounting to COP 3,366 and COP 8,727 as of December 31, 2019 and 2018, respectively. Impairment losses are recognized for the difference between the carrying and recoverable amount of the asset.
NOTE 14. OTHER ASSETS, NET
As of December 31, 2019 and 2018 the Bank’s other assets, net consist of:
| Other Assets | December 31, 2019 | December 31, 2018 |
| In millions of COP |
| Tax advance | 838,721 | 867,120 |
| Marketable and non-marketable for sale assets, net | 828,382 | 654,207 |
| Other receivables(1) | 766,251 | 286,583 |
| Prepaid expenses | 365,143 | 346,012 |
| Assets pledged as colateral | 334,190 | 248,662 |
| Receivables related to abandoned accounts(2) | 206,027 | 172,671 |
| Accounts receivable from contracts with customers(3) | 169,109 | 86,759 |
| Receivable Sales of goods and service | 136,139 | 141,098 |
| Commission receivables | 123,306 | 99,185 |
| Balance in credit card clearning house | 111,905 | 61,539 |
| Operating leases | 74,938 | 55,450 |
| Interbank Borrowings not classified as cash equivalents | 51,701 | 55,690 |
| Taxes receivable | 38,001 | 4,882 |
| Commission for letters of credit | 25,607 | 25,399 |
| Debtors | 19,348 | 22,054 |
| Others | 273,253 | 133,873 |
| Total other assets | 4,362,021 | 3,261,184 |
| Allowance others | (124,772) | (64,139) |
| Total other assets, net | 4,237,249 | 3,197,045 |
| (1) | As of December 31, 2019, corresponds to receivables from importations product, bank acceptances, reconciling entries from correspondent banks, tax receivables from DIAN, derivative receivables, debt securities and spot transactions, TIP interests, and others. |
| (2) | Corresponds to receivables related to the application of the Colombian Law 1777 of February 1, 2016, which establishes that entities holding accounts deemed abandoned must transfer the related amounts to a fund constituted and regulated by the Icetex (Governmental entity responsible for promoting high quality education in Colombia). |
| (3) | See Note 25.3 Fees and commissions. |
NOTE 15. DEPOSITS BY CUSTOMERS
The detail of the deposits as of December 31, 2019 and 2018 is as follows:
| Deposits | December 31, 2019 | December 31, 2018 |
| In millions of COP |
| Saving accounts | 66,914,834 | 59,635,379 |
| Time deposits | 63,635,078 | 56,853,141 |
| Checking accounts | 25,159,676 | 24,098,073 |
| Other deposits | 1,495,724 | 1,541,878 |
| Total | 157,205,312 | 142,128,471 |
The following table details the time deposits issued by the Bank:
| Time deposits | Effective interest rate | December 31, 2019 |
| Modality | Minimum | Maximum | Carrying Value | Fair value(1) |
| In millions of COP |
| Less than 6 months | 0.10% | 6.60% | 8,611,317 | 8,608,691 |
| Between 6 months and 12 months | 0.10% | 7.25% | 8,267,750 | 8,287,504 |
| Between 12 months and 18 months | 0.25% | 6.75% | 9,458,863 | 9,534,399 |
| Greater than 18 months | 0.01% | 13.50% | 37,297,148 | 38,235,068 |
| Total | | | 63,635,078 | 64,665,662 |
| (1) | See Note 30 Fair value of assets and liabilities. |
| Time deposits | Effective interest rate | December 31, 2018 |
| Modality | Minimum | Maximum | Carrying Value | Fair value(1) |
| In millions of COP |
| Less than 6 months | 0.10% | 6.75% | 9,549,206 | 9,554,429 |
| Between 6 months and 12 months | 0.25% | 7.50% | 5,572,051 | 5,577,962 |
| Between 12 months and 18 months | 0.25% | 7.25% | 7,323,840 | 7,368,860 |
| Greater than 18 months | 0.01% | 13.50% | 34,408,044 | 35,084,415 |
| Total | | | 56,853,141 | 57,585,666 |
| (1) | See Note 30 Fair value of assets and liabilities. |
The detail of Time deposits issued by the Bank by maturity is as follows:
| December 31, 2019 |
| Period | Carrying value | Fair value(1) |
| In millions of COP |
| Less than 1 year | 44,458,114 | 44,993,854 |
| Between 1 and 3 years | 13,543,877 | 13,790,539 |
| Between3 and 5 years | 3,578,910 | 3,669,471 |
| Greaterthan 5 years | 2,054,177 | 2,211,798 |
| Total | 63,635,078 | 64,665,662 |
| (1) | See Note 30 Fair value of assets and liabilities. |
| December 31, 2018 |
| Period | Carrying value | Fair value(1) |
| In millions of COP |
| Less than 1 year | 37,911,658 | 38,216,970 |
| Between 1 and 3 years | 12,753,264 | 12,965,241 |
| Between3 and 5 years | 4,559,122 | 4,663,087 |
| Greaterthan 5 years | 1,629,097 | 1,740,368 |
| Total | 56,853,141 | 57,585,666 |
| (1) | See Note 30 Fair value of assets and liabilities. |
NOTE 16. INTERBANK DEPOSITS AND REPURCHASE AGREEMENTS AND OTHER SIMILAR SECURED BORROWING
The following table sets forth information regarding the money market operations recognized as liabilities in the statement of financial position:
| Interbank and repurchase agreements and other similar secured borrowing | December 31, 2019 | December 31, 2018 |
| In millions of COP |
| Interbank Deposits | | |
| Interbank liabilities | 1,363,679 | 1,374,222 |
| Total interbank | 1,363,679 | 1,374,222 |
| Repurchase agreements and other similar secured borrowing | | |
| Short selling operations | 555,337 | 136,786 |
| Temporary transfer of securities | 758,400 | 2,178,769 |
| Total Repurchase agreements and other similar secured borrowing(1) | 1,313,737 | 2,315,555 |
| Total money market transactions | 2,677,416 | 3,689,777 |
| (1) | Total repo liabilities have maturities of less than 30 days. |
Offsetting of Repurchase and Resale Agreements
The Bank's assets are subject to a current plan for their sale, which contains the details of the selling price allocation and the advertising and marketing plan. Furthermore, the plan specifies the conditions to proceed with the selling process.
The Bank does not offset repurchase and resale transactions with the same counterparty in the consolidated statement of financial position.
The table below presents repurchases and resale transactions included in the consolidated statement of financial position at December 31, 2019 and 2018:
As of December 31, 2019
| | Assets /
liabilities gross | Amounts offset in
the statement of
financial position | Net balance
presented in the
statement of financial
position | Financial
instruments as
collaterals | Assets /
liabilities net |
| In millions of COP |
| Securities purchased under resale agreements | 3,016,064 | - | 3,016,064 | (3,016,064) | - |
| Securities sold under repurchase agreements | (1,313,737) | - | (1,313,737) | 1,313,737 | - |
| Total repurchase and resale agreements | 1,702,327 | - | 1,702,327 | (1,702,327) | - |
As of December 31, 2018
| | Assets /
liabilities gross | Amounts offset in
the statement of
financial position | Net balance
presented in the
statement of financial
position | Financial
instruments as
collaterals | Assets /
liabilities net |
| In millions of COP |
| Securities purchased under resale agreements | 931,820 | - | 931,820 | (931,820) | - |
| Securities sold under repurchase agreements | (2,315,555) | - | (2,315,555) | 2,315,555 | - |
| Total repurchase and resale agreements | (1,383,735) | - | (1,383,735) | 1,383,735 | - |
For further information about offsetting of other financial assets and liabilities see Note 5 Financial assets investments and derivatives.
NOTE 17. BORROWINGS FROM OTHER FINANCIAL INSTITUTIONS
As of December 31, 2019 and 2018, the composition of the borrowings from other financial institutions measured at amortized cost is the following:
| Borrowings from other financial institutions | December 31, 2019 | December 31, 2018 |
| In millions of COP |
| Obligations granted by foreign banks(1) | 9,200,571 | 11,217,308 |
| Obligations granted by domestic banks | 4,758,772 | 5,120,656 |
| Total | 13,959,343 | 16,337,964 |
| (1) | The Bank has recognized a financial liability with BAM Financial Corporation (BFC) amounting to USD 290,4 millions as of December 31, 2019 and USD 259.4 million as of December 31, 2018, due to its obligation to pay cash in future to purchase the non-controlling shares of Grupo Agromercantil Holding pursuant to an outstanding put option expiring in 2024. The Bank will reclassify the liability to equity if the put expires unexercised. |
Obligations granted by domestic banks
As of December 31, 2019
| Financial entity | Rate
Maximum | Rate
Minimum | December 31, 2019 | |
| |
| In millions of COP | |
| Financiera de desarrollo territorial (Findeter) | 10.02% | 0.21% | 2,527,879 | |
| Banco de comercio exterior de Colombia (Bancoldex) | 16.66% | 2.13% | 846,874 | |
| Fondo para el financiamiento del sector agropecuario (Finagro) | 14.40% | 0.63% | 578,665 | |
| Other private financial entities | 8.51% | 6.08% | 805,354 | |
| Total | | | 4,758,772 | |
As of December 31, 2018
| Financial entity | Rate
Maximum | Rate
Minimum | December 31, 2018 | |
| |
| In millions of COP | |
| Financiera de desarrollo territorial (Findeter) | 10.19% | 0.24% | 2,591,423 | |
| Banco de comercio exterior de Colombia (Bancoldex) | 15.46% | 2.17% | 1,205,958 | |
| Fondo para el financiamiento del sector agropecuario (Finagro) | 14.54% | 0.85% | 634,048 | |
| Other private financial entities | 7.92% | 5.82% | 689,227 | |
| Total | | | 5,120,656 | |
The maturities of financial obligations with domestic banks as of December 31, 2019 and 2018, are the following:
| Domestic | December 31, 2019 | December 31, 2018 |
| In millions of COP |
| Amount expected to be settled: | | |
| More than twelve months after the reporting period | 4,411,393 | 4,894,259 |
| No more than twelve months after the reporting period | 347,379 | 226,397 |
| Total | 4,758,772 | 5,120,656 |
Obligations granted by foreign banks
As of December 31, 2019
| Financial entity | Rate Maximum | Rate Minimum | December 31, 2019 |
| In millions of COP |
| Financing with correspondent banks | 4.81% | 2.05% | 8,340,378 |
| Corporación Andina de Fomento (CAF) | 4.33% | 2.29% | 333,095 |
| Banco Latinoamericano de Comercio Exterior (Bladex) | 4.75% | 2.71% | 457,228 |
| Banco Interamericano de Desarrollo (BID) | 4.91% | 3.28% | 69,870 |
| Total | | | 9,200,571 |
As of December 31, 2018
| Financial entity | Rate Maximum | Rate Minimum | December 31, 2018 |
| In millions of COP |
| Financing with correspondent banks | 5.66% | 2.81% | 10,140,356 |
| Corporación Andina de Fomento (CAF) | 5.01% | 2.93% | 529,464 |
| Banco Latinoamericano de Comercio Exterior (Bladex) | 4.89% | 3.15% | 473,549 |
| Banco Interamericano de Desarrollo (BID) | 5.64% | 4.32% | 73,939 |
| Total | | | 11,217,308 |
The maturities of the financial obligations with foreign entities as of December 31, 2019 and 2018 are the following:
| Foreign | December 31, 2019 | December 31, 2018 |
| In millions of COP |
| Amount expected to be settled: |
| No more than twelve months after the reporting period | 6,286,622 | 9,743,905 |
| More than twelve months after the reporting period | 2,913,949 | 1,473,403 |
| Total | 9,200,571 | 11,217,308 |
NOTE 18. DEBT INSTRUMENTS IN ISSUE
Duly authorized by the authority in each country bonds have been issued as follows:
As of December 31, 2019
| Issuer | Currency | Face value(1) | Balance | Rate Range |
| Bancolombia S.A. | Local | COP | 4,571,386 | 4,614,044 | 5.86%-10.27% |
| Bancolombia S.A. | Foreign | USD | 3,311,481 | 10,668,375 | 2.15%-6.22% |
| Banco Agrícola S.A. | Foreign | USD | 514,000 | 1,676,517 | 5.27%-7.17% |
| Bancolombia Panamá S.A. | Foreign | USD | 140,351 | 467,837 | 2.25%-3.70% |
| Grupo Agromercantil Holding S.A. | Foreign | USD | 915 | 3,000 | 0.25%-7.25% |
| Banistmo S.A. y filiales | Foreign | USD | 749,363 | 2,473,666 | 2.65%-5.00% |
| Bancolombia Puerto Rico Internacional Inc. | Foreign | USD | 5,471 | 18,076 | 2.65%-2.95% |
| Total | | | | 19,921,515 | |
| (1) | Face value is in US dollar for foreign currency bonds. |
As of December 31, 2018
| Issuer | Currency | Face value(1) | Balance | Rate Range |
| Bancolombia S.A. | Local | COP | 4,533,392 | 4,607,153 | 5.91%-10.89% |
| Bancolombia S.A. | Foreign | USD | 3,237,466 | 10,452,432 | 2.60%-6.22%% |
| Banco Agrícola S.A. | Foreign | USD | 549,000 | 1,774,852 | 5.27%-7.17% |
| Bancolombia Panamá S.A. | Foreign | USD | 139,280 | 457,495 | 2.60%-3.50% |
| Grupo Agromercantil Holding S.A. | Foreign | USD | 300,939 | 986,476 | 0.25%-7.25% |
| Banistmo S.A. y filiales | Foreign | USD | 606,635 | 1,980,824 | 2.65%-5.00% |
| Bancolombia Puerto Rico Internacional Inc. | Foreign | USD | 8,499 | 28,001 | 2.70%-3.00% |
| Total | | | | 20,287,233 | |
| (1) | Face value is in US dollar for foreign currency bonds. |
The breakdown of the Bank securities in issue by term is as follows:
As of December 31, 2019
| Issuer | Less than
1 year | Between 1 and 3 years | Between 3 and 5 years | Greater than 5 years | Total amortized cost |
| In millions of COP |
| Local currency | | | | | |
| Subordinated bonds(1) | - | - | - | 1,216,533 | 1,216,533 |
| Ordinary bonds | - | - | 155,102 | 3,242,409 | 3,397,511 |
| Foreign currency | | | | | |
| Subordinated bonds(1) | - | - | - | 6,925,854 | 6,925,854 |
| Ordinary bonds | 259,503 | 879,255 | 261,020 | 6,981,839 | 8,381,617 |
| Total | 259,503 | 879,255 | 416,122 | 18,366,635 | 19,921,515 |
| (1) | The subordinated bonds, in the event of default of the Bank, will be subordinated to the claims of depositors and all other creditors of the issuer, other than creditors whose claims rank equally with, or are junior to, the claims of the holders of the subordinated liabilities. |
Green Bonds Offering
On June 25, 2019 Bancolombia S.A. completed the offering of ordinary bonds in an aggregate principal amount of COP 657,000. The bonds will mature 5 years from the date of issue. This issuance was allocated through a public offering aimed at institutional investors authorized to operate in the second market exchange, including multilateral organizations.
Subordinated Notes Offering
On December 18, 2019, the Bank priced the public offering of USD 550,000 in aggregate principal amount of its Subordinated Notes due December 18, 2029.
The Notes have a 10-year maturity, an optional redemption right on the fifth year and a coupon of 4.625%, payable semi-annually on December 18 and June 18 of each year, beginning on June 18, 2020.
In relation to the Bond offer made, the bank acquired a portion of its Bonds maturing in 2020 and 2022, issued on July 26, 2010 and September 4, 2012 respectively, through a private bond exchange agreement followed by a “Tender Offer” intermediary bond public offering.
In connection with the Notes Offering, the Bank acquired a portion of its Bonds maturing in 2020 and 2022, issued on July 26, 2010 and September 4, 2012, respectively, through a private exchange followed by a Dealer Intermediated Tender Offer.
During the transaction, the Bank maintained a third party financial entity as a principal, which was responsible for the execution of the transfer and the exchange. In this regard the Bank has recognized as non-extinguishment the modification of the debt instruments in issue corresponding to a portion of the Notes due 2020 and Notes due 2022. therefore, the modified debt instruments are adjusted with effect in the result of the period to the present value of the new terms, discounted at the original effective interest rate and the costs associated with the transaction will be amortized as an adjustment of interest expense over the remaining term of the replacement or modified debt instruments using the interest method.
Giving application to IFRS 9 financial instruments and IFRIC 16 hedges of a net investment in a business abroad, the Bank arranged to cover the exchange rate risk that arises from the date of acquisition of its investment in the subordinate Banistmo S.A, designating bonds issued in foreign currency for USD 2.2 billion, as hedging instruments.
For information related with the disclosures of fair value of the debt securities in issued, see Note 30 Fair value of assets and liabilities.
As of December 31, 2018
| Issuer | Less than 1 year | Between 1 to 3 years | Between 3 to 5 years | Greaterthan 5 years | Total amortized cost |
| In millions of COP |
| Local currency | | | | | |
| Subordinated bonds(1) | - | - | - | 1,425,034 | 1,425,034 |
| Ordinary bonds | - | - | 154,813 | 3,027,306 | 3,182,119 |
| Foreign currency | | | | | |
| Subordinated bonds(1) | - | - | - | 6,790,506 | 6,790,506 |
| Ordinary bonds | 652,579 | 339,419 | 159,721 | 7,737,855 | 8,889,574 |
| Total | 652,579 | 339,419 | 314,534 | 18,980,701 | 20,287,233 |
| (1) | The subordinated bonds, in the event of default of the Bank, will be subordinated to the claims of depositors and all other creditors of the issuer, other than creditors whose claims rank equally with, or are junior to, the claims of the holders of the subordinated liabilities. |
Sustainable Bonds Offering
In July 19, 2019 the Bank announced that it completed the issuance and placement of an offering of sustainable bonds (Bonos sostenibles) in an aggregate principal amount of COP 657,000 in the Segundo Mercado exchange, with a term of 5 years and an interest rate of IBR + 1.60%. The proceeds from the offering will be used to finance sustainability projects including renewable energy, energetic efficiency, cleaner production, social infrastructure, and access to housing, among others, in accordance with international standards contemplated by the Sustainability Bond Guidelines. The IIC (Interamerican Investment Corporation) and the IDB (Interamerican Development Bank), acquired all the bonds in the offering.
The following is a schedule of the debt instruments in issue by maturity:
| Issuer | December 31, 2019 | December 31, 2018 |
| In millions of COP |
| Amount expected to be settled: | | |
| No more than twelve months after the reporting period | 3,228,110 | 2,854,161 |
| More than twelve months after the reporting period | 16,693,405 | 17,433,072 |
| Total | 19,921,515 | 20,287,233 |
As of December 31, 2019 and 2018, there were no covenants linked to the aforementioned securities in issue, nor were any of these instruments past due by the Bank in relation to its financial obligations.
NOTE 19. EMPLOYEE BENEFIT PLANS
The following table shows liabilities relating to post-employment benefit and long-term benefit plans:
| Post-employment and long-term benefit plans | December 31, 2019 | December 31, 2018 |
| In millions of COP |
| 19.1 Defined benefit pension plan | 163,152 | 155,075 |
| 19.2 Severance obligation | 26,547 | 30,732 |
| 19.3 Retirement Pension Premium Plan and Senior Management Pension Plan Premium | 198,260 | 170,596 |
| 19.4 Other long term benefits | 416,969 | 362,862 |
| Total Post-employment and long-term benefit plans | 804,928 | 719,265 |
| Fair value Plan assets | 35,981 | 37,136 |
| Total Unfunded Post-employment and long-term benefit plans | 768,947 | 682,129 |
These benefits include all types of payments that the Bank provides to its employees. The recognition of liabilities related to post-employment and long-term employee benefit plans is based on actuarial computations which involve judgments and assumptions made by management (with the assistance of external actuaries) related to the future macroeconomic and employee demographic factors, among others, which will not necessarily coincide with the future outcome of such factors.
Short-term employment benefit plans recognized in the statement of financial position in the line “other liabilities” consist of the following:
| Other employment benefit plans | December 31, 2019 | December 31, 2018 |
| In millions of COP |
| Current severance obligation(1) | 125,255 | 113,654 |
| Bonuses and short-term benefits | 403,872 | 351,697 |
| Other employment benefit plans | 529,127 | 465,351 |
| (1) | See 19.2 Severance obligation. |
As of December 31, 2017, the amount recognized through profit or loss, due to benefit employee plans' current service cost and interest cost, was COP 109,126; on the other hand, COP 1,007 was recognized through other comprehensive income as a result of the net actuarial gain or loss due to change in assumptions, demographic experience and foreign currency translation effect.
Bonuses and short-term benefits
As of December 31, 2019, and 2018, the amounts of COP 403,872 and COP 351,697, respectively, were recognized by the Bank as bonuses related to private agreements in connection with the employees' variable compensation.
Post-employment benefits
19.1 Defined benefit pension plan
Colombia
Under Colombian law, employee pension obligations are managed as a defined contribution plan since 1990. The Bank’s legal retirement benefit obligation as of December 31, 2019 and 2018 relates to retired employees who rendered services to the Bank before the current regulations took effect. Under this unfunded plan, benefits are based on length of service and level of compensation. As of December 2019, 623 participants were covered by this plan, and as of December 2018, 644 participants.
For purposes of the projected assessment of the pension plan obligation, in the absence of a deep market of high-quality corporate debt, the sovereign bond curve of the Colombian Government is used, with maturity similar to the residual life of the obligation of the projected benefit. The net cost of pensions is accounted for in the statement of income as “salaries and employee benefits”, and includes the interest costs and cost of current service.
| Defined benefit pension plan | 2019 | 2018 |
| In millions of COP |
| Present value of the obligation as of January 1 | 122,383 | 125,480 |
| Interest cost | 7,880 | 7,547 |
| Benefits paid | (11,857) | (11,795) |
| Net actuarial loss / (gain) due to changes in demographic assumptions | 10,518 | (2,220) |
| Net actuarial loss due to plan experience | 104 | 3,371 |
| Defined obligation, unfunded as of December 31 | 129,028 | 122,383 |
Panama
The pension plan for Banistmo and its subsidiaries provides defined benefits based on average salary paid during the most recent 120 months before retirement and years of service of certain employees entitled to receive the benefits. The pension benefit vests after 10 years of service. As of December 31, 2019, and 2018, there were 58 participants (28 participants with deferred benefits and 30 participants receiving benefits), and 60 participants (30 participants with deferred benefits and 30 participants receiving benefits), respectively.
| Defined benefit pension plan | 2019 | 2018 |
| In millions of COP |
| Present value of the obligation as of January 1 | 5,863 | 6,109 |
| Interest cost | 229 | 177 |
| Actuarial loss / (gain) – experience | 620 | (536) |
| Actuarial (gain)/loss - financial assumptions | (610) | 46 |
| Benefits paid from plan assets | (782) | (405) |
| Foreign currency translation effect | 51 | 472 |
| Defined obligation, funded as of December 31 | 5,371 | 5,863 |
Guatemala
Grupo Agromercantil Holding has established a retirement pension plan for its employees. Under this plan, the employees are entitled to receive a lifetime payment of 50% of their monthly nominal wage, if they are 70 years old and have 30 years of service, or if they are 65 years old and have 40 years of service. On the other hand, the employees are entitled to receive a lifetime payment of 70% of their monthly nominal wage, if they are 70 years old and have 40 years of service, or they are 65 years old and have 45 years of service.
| Defined benefit pension plan | 2019 | 2018 |
| In millions of COP |
| Present value of the obligation as of January 1 | 26,829 | 18,279 |
| Current cost of service | 1,219 | 878 |
| Interest cost | 2,215 | 1,410 |
| Benefits paid | (1,097) | (401) |
| Actuarial (gain)/loss - financial assumptions | (770) | 5,384 |
| Foreign currency translation effect | 357 | 1,279 |
| Defined obligation, funded as of December 31 | 28,753 | 26,829 |
19.2 Severance obligation
Colombia
Under Colombian labor regulations, employees hired before 1990 are entitled to receive one month’s salary for each year of service. This benefit accumulates and is paid to the employees upon their termination or retirement from the Bank, calculated based on the employees’ last salary base; however, employees may request advances against this benefit at any time. In 1990, the Colombian government revised its labor regulations for new employees to permit companies, subject to the approval of the employees, to transfer this severance obligation annually to private pension funds (this scheme of employee benefits is known as the current severance obligation). The Bank’s severance obligations relate to employees hired before 1990.
As of December 2019, and 2018, 353 and 453 participants respectively, were covered by this plan.
The balances recognized in the statement of financial position are listed below:
| Defined benefit severance obligation plan | 2019 | 2018 |
| In millions of COP |
| Present value of the obligation as of January 1 | 30,732 | 38,041 |
| Current cost of service | 862 | 1,598 |
| Interest cost | 1,952 | 2,333 |
| Benefits paid | (8,414) | (11,586) |
| Net actuarial loss due to assumption changes and plan experience | 1,415 | 346 |
| Defined obligation, unfunded as of December 31 | 26,547 | 30,732 |
| Current severance regimen(1) | 125,255 | 113,654 |
| Total | 151,802 | 144,386 |
| (1) | Corresponds to the amounts pending to transfer to private funds. See Note 20 Other liabilities |
19.3 Retirement Pension Premium Plan and Senior Management Pension Plan Premium
Colombia
Under Colombian labor regulations, employers and employees are entitled to negotiate compensation, other than the retirement benefit prescribed by law, by means of private agreements. The Bank’s employees participating in defined contribution plans are entitled to receive, on their retirement date, a one-time payment at the time based on the salary of the employee at their retirement date.
On the other hand, the Bank has established a retirement benefit plan for its senior management executives. Under this plan, the executives are entitled to receive a one-off payment on their retirement date based on the number of years of service to the organization.
El Salvador
By means of Decree 592 of 2013, under Salvadorian labor regulations, employees are entitled to receive 15 days of salary for each year of service. This benefit is payable upon retirement, resignation, unjustified dismissal, death and disability. As of December 31, 2019, and 2018, there were 2,850 and 2,837 participants respectively, covered by the plan.
Since 2018, Banagrícola S.A established a retirement benefit plan for its senior management executives. Under this plan, the executives are entitled to receive a one-off payment on their retirement date, death or disability based on the number of years of service to the organization. As of December 31, 2019, there was 1 participant covered by the plan.
Guatemala
Grupo Agromercantil Holding has established a defined benefit plan for its employees. Under this plan, the employees are entitled to receive a one-off payment based on the number of years of service to the organization in the event of waiver before retirement. As of December 31, 2019, and 2018, there were 3,075 and 3,577 participants respectively, covered by the plan.
Panama
Since 2018, Banistmo S.A established a retirement benefit plan for its senior management executives. Under this plan, the executives are entitled to receive a one-off payment on their retirement date, death or disability based on the number of years of service to the organization. As of December 31, 2019, there was 1 participant covered by the plan.
The annual change of the present value of the obligations of defined benefit plans is as follows:
| Retirement Pension Premium Plan and Senior Management Pension Plan Premium | 2019 | 2018 |
| In millions of COP |
| Present value of the obligation as of January 1 | 170,596 | 167,646 |
| Current service cost | 16,687 | 14,546 |
| Interest cost | 11,161 | 10,535 |
| Benefits paid | (31,784) | (18,829) |
| Past service cost | 75 | - |
| First time application effect of IAS 19 to new defined benefit obligation of Banistmo at December 31, 2018(1) | - | 2,479 |
| First time application effect of IAS 19 to new defined benefit obligation of Banagrícola at Decembre 31, 2018(2) | - | 821 |
| Net actuarial (gain) / loss due to assumption changes and plan experience(3) | 30,875 | (9,059) |
| Foreign currency translation effect | 650 | 2,457 |
| Defined obligation, unfunded as of December 31 | 198,260 | 170,596 |
| (1) | Banistmo S.A has decided to recognize a new employee benefit plan for its senior management executives based on the number of years of service to the organization. |
| (2) | Banagrícola S.A has decided to recognize a new employee benefit plan for its senior management executives based on the number of years of service to the organization. |
| (3) | The increase in actuarial losses from experience adjustment is mainly due to a reduction of the discount rate used in actuarial valuation of 2019 against 2018. |
19.4 Other long term benefits
In addition to legal benefits and the aforementioned post-employment benefits, the Bank grants to its employees other benefits based on the employees’ seniority. For the periods ended December 31, 2019 and December 31, 2018, the reconciliation of the other long term benefits is set below:
| Other long term benefits | 2019 | 2018 |
| In millions of COP |
| Present value of the obligation as of January 1 | 362,862 | 341,846 |
| Current service cost | 33,944 | 34,382 |
| Interest cost | 24,122 | 21,598 |
| Benefits paid | (36,884) | (32,464) |
| Net actuarial loss / (gain) due to assumption changes and plan experience(1) | 32,850 | (3,237) |
| Foreign currency translation effect | 75 | 737 |
| Defined obligation, unfunded as of December 31 | 416,969 | 362,862 |
| (1) | The increase in actuarial losses from experience adjustment, is mainly due to a reduction of the discount rate used in actuarial valuation of 2019 against 2018. |
19.5 Plan Assets
Bancolombia
As of December 2018, the Bank established an asset plan to secure the benefits promised in the Senior Management Pension Plan Premium. The assets plan is managed by a Private Pension Fund.
The plan assets’ fair value as of December 31, 2019 and 2018 is as follow:
| Bancolombia’s Plan assets | 2019 | 2018 |
| In millions of COP |
| Fair value of assets as of January 1 | 32,252 | - |
| Employer contributions | - | 32,252 |
| Interest income on plan assets | 2,118 | - |
| Return on plan assets greater/(less) than discount rate | 2,038 | - |
| Benefits paid | (4,647) | - |
| Fair value assets at the end of the year | 31,761 | 32,252 |
Banistmo
The Bank, through its subsidiary Banistmo, has established a plan with assets to secure benefits promised by Banistmo to the employees entitled to receive the Pension Plan under the terms described above and to comply with Panama labor code, which specify the terms for securing the payments to be made in the event of an employee’s termination (voluntary or involuntary) or upon retirement (termination indemnity plan).
Banistmo’s pension and post-retirement plan assets consider investments in fixed-term deposits and cash and due from banks, in order to reduce the investment risk. The plan assets are managed by a trustee (third party). Likewise, the assets allocation is periodically reviewed by Banistmo and, when necessary, adjusted according to the investment strategy. The plan's investment assets are measured at fair value using significant, unobservable market data and, therefore, are classified as Level 3.
The expected return on assets assumption represents the long term rate of return based on analysis of historical returns, historical asset class volatilities and the fund’s past experience.
The components of the periodic net cost of the plans previously mentioned and the total of charges (credits) recognized in the consolidated statement of income are as follows:
The following table details the change in plan assets:
| Banistmo’s Plan assets | 2019 | 2018 |
| In millions of COP |
| Fair value of assets as of January 1 | 4,884 | 4,765 |
| Interest income on plan assets | 101 | 161 |
| Return on plan assets less than discount rate | (25) | (33) |
| Benefits paid | (782) | (405) |
| Foreign currency translation effect | 42 | 396 |
| Fair value assets as of December 31 | 4,220 | 4,884 |
Defined contribution plans
The expense recognized in the line “Salaries and employee benefits” of the consolidated statement of income for defined contribution plans, for current severance regimen and pension benefits, is as follows:
| Defined contribution plans | 2019 | 2018 |
| In millions of COP |
| Pension | 200,615 | 182,991 |
| Current severance regimen | 60,777 | 57,130 |
| Total | 261,392 | 240,121 |
The economic assumptions used in the determination of the present value of the defined benefit plans, in nominal terms, are as follows:
Colombia
| Main projected assumptions | December 31, 2019 | December 31, 2018 |
| Discount rate | 5.70% | 6.90% |
| Rate of wage increase | 5.95% | 5.70% |
| Projected inflation | 3.45% | 3.40% |
| Rate of pension increase | 3.45% | 3.40% |
Bancolombia Panama
| Main projected assumptions | December 31, 2019 | December 31, 2018 |
| Discount rate | 2.80% | 4.00% |
| Rate of wage increase | 2.00% | 2.00% |
| Projected inflation | 1.00% | 1.00% |
Banistmo
| Main projected assumptions | December 31, 2019 | December 31, 2018 |
| Discount rate | 4.00% | 4.00% |
| Expected long-term rate of return on plan assets | 3.40% | 2.30% |
| Rate of wage increase | 3.00% | 3.00% |
El Salvador
| Main projected assumptions | December 31, 2019 | December 31, 2018 |
| Discount rate | 3.00% | 4.10% |
| Rate of wage increase | 2.00% | 2.50% |
| Projected inflation | 1.00% | 1.50% |
Guatemala
| Main projected assumptions | December 31, 2019 | December 31, 2018 |
| Discount rate | 8.20% | 8.20% |
| Rate of wage increase | 5.00% | 5.00% |
| Projected inflation | 4.00% | 4.00% |
In 2019, the assumption of mortality used in the preparation of the assessment of the estimated liabilities is based on tables RP-2000, CSO-80 and RV-08, which reflect average ages of mortality from 32-75 years. The rate used to discount the obligation of the defined benefit plan to reflect the duration of the labor liabilities as of December 2019 corresponds to the yield of sovereign bonds of each country where the plan is established, either Colombia, Panama, Guatemala and El Salvador, as applicable, since the market transactions of these countries involving corporate bonds of high quality have no high levels of activity. The assumption of the rate of inflation is based on the long term projection of the Central Bank of Colombia, Panama, Guatemala and El Salvador.
The nature of the risks related to the obligations aforementioned are summarized below:
| Investment risk | The present value of the obligation for the defined benefits plan is calculated using a discount rate determined with reference to high quality sovereign yields of each country. Currently, the plan includes investment in financial instruments that are not vulnerable to market risks |
| Interest rate risks | A reduction of the bond interest rates will increase the obligation of the plan |
| Longevity risk | The present value of the obligation of the defined benefit plan is calculated with reference to the highest estimate of the mortality of participants during their time of employment. An increase in the life expectancy of the participants will increase the plan obligation |
| Salary risk | The present value of the obligation of the benefit plan is calculated with reference to the future salaries of the participants. As such, an increase in the participants' wages will increase the obligation of the plan |
Estimated payment of future benefits
The payments of benefits, which reflect future service rendered, are considered to be paid as follows:
| Years | Pension Benefits | Other benefits |
| In millions of COP |
| 2020 | 12,710 | 59,755 |
| 2021 | 12,725 | 59,913 |
| 2022 | 12,639 | 60,557 |
| 2023 | 12,477 | 68,510 |
| 2024 | 12,241 | 65,555 |
| 2025 a 2029 | 55,563 | 320,739 |
Sensitivity analysis
Defined Benefit Obligations (DBO) was calculated using the Projected Unit Credit method. Obligations and expenses will change in the future as a result of future changes in the methods of projection and assumption, participant information, plan provisions and regulations, or as resulting from future gains and losses.
Colombia
Pension plan
| Assumption | Value | (Increase/Decrease) | Effect on DBO |
| In millions of COP |
| Discount rate | 6.20% | 0.50% increase | (4,798) |
| Discount rate | 5.20% | 0.50% decrease | 5,153 |
| Salary increases | 3.95% | 0.50% increase | 5,540 |
| Salary increases | 2.95% | 0.50% decrease | (5,197) |
| Mortality Table | RV-08 ("Rentistas Validos") | One year increase in life expectancy | 5,764 |
Retirement Pension Premium Plan
| Assumption | Value | (Increase/Decrease) | Effect on DBO |
| In millions of COP |
| Discount rate | 6.20% | 0.50% increase | (6,349) |
| Discount rate | 5.20% | 0.50% decrease | 7,013 |
| Salary increases | 6.45% | 0.50% increase | 6,998 |
| Salary increases | 5.45% | 0.50% decrease | (6,396) |
Severance obligation
| Assumption | Value | (Increase/Decrease) | Effect on DBO |
| In millions of COP |
| Discount rate | 6.20% | 0.50% increase | (626) |
| Discount rate | 5.20% | 0.50% decrease | 652 |
| Salary increases | 6.45% | 0.50% increase | 1,465 |
| Salary increases | 5.45% | 0.50% decrease | (1,424) |
Senior Management Pension Plan Premium
| Assumption | Value | (Increase/Decrease) | Effect on DBO |
| In millions of COP |
| Discount rate | 6.20% | 0.50% increase | (997) |
| Discount rate | 5.20% | 0.50% decrease | 1,046 |
| Salary increases | 6.45% | 0.50% increase | 1,033 |
| Salary increases | 5.45% | 0.50% decrease | (994) |
Panama
Pension Plan
| Assumption | Value | (Increase/Decrease) | Effect on DBO |
| In millions of COP |
| Discount rate | 4.50% | 0.50% increase | (257) |
| Discount rate | 3.50% | 0.50% decrease | 279 |
| Mortality Table | RP-2000 | One year increase in life expectancy | 187 |
Guatemala
Pension Plan
| Assumption | Value | (Increase/Decrease) | Effect on DBO |
| In millions of COP |
| Discount rate | 8.70% | 0.50% increase | (2,324) |
| Discount rate | 7.70% | 0.50% decrease | 2,645 |
| Salary increases | 5.50% | 0.50% increase | 1,645 |
| Salary increases | 4.50% | 0.50% decrease | (1,490) |
| Mortality Table | RP-2000 | One year increase in life expectancy | 817 |
Retirement Pension Premium Plan
| Assumption | Value | (Increase/Decrease) | Effect on DBO |
| In millions of COP |
| Discount rate | 8.70% | 0.50% increase | (883) |
| Discount rate | 7.70% | 0.50% decrease | 929 |
| Salary increases | 5.50% | 0.50% increase | 953 |
| Salary increases | 4.50% | 0.50% decrease | (913) |
El Salvador
Retirement Pension Premium Plan
| Assumption | Value | (Increase/Decrease) | Effect on DBO |
| In millions of COP |
| Discount rate | 3.50% | 0.50% increase | (744) |
| Discount rate | 2.50% | 0.50% decrease | 808 |
| Salary increases | 2.50% | 0.50% increase | 113 |
| Salary increases | 1.50% | 0.50% decrease | (146) |
Other long term benefits
Colombia
| Assumption | Value | (Increase/Decrease) | Effect on DBO |
| In millions of COP |
| Discount rate | 6.20% | 0.50% increase | (14,685) |
| Discount rate | 5.20% | 0.50% decrease | 15,743 |
| Salary increases | 6.45% | 0.50% increase | 15,612 |
| Salary increases | 5.45% | 0.50% decrease | (14,708) |
El Salvador
| Assumption | Value | (Increase/Decrease) | Effect on DBO |
| In millions of COP |
| Discount rate | 3.50% | 0.50% increase | (183) |
| Discount rate | 2.50% | 0.50% decrease | 196 |
NOTE 20. OTHER LIABILITIES
Other liabilities consist of the following:
| Other liabilities | December 31, 2019 | December 31, 2018 |
| In millions of COP |
| Payables | 1,927,945 | 1,638,010 |
| Suppliers | 1,495,415 | 1,386,809 |
| Advances(1) | 946,488 | 1,043,611 |
| Collection services | 438,490 | 884,805 |
| Bonuses and short-term benefits(2) | 403,872 | 351,697 |
| Security contributions | 363,802 | 341,872 |
| Salaries and other labor obligations | 292,570 | 265,337 |
| Dividends(3) | 279,125 | 267,468 |
| Advances in leasing operations and loans | 207,045 | 133,377 |
| Provisions(4) | 190,690 | 168,033 |
| Liabilities from contracts with customers(5) | 60,791 | 75,845 |
| Deferred interests | 34,290 | 44,598 |
| Other | 115,122 | 166,791 |
| Total | 6,755,645 | 6,768,253 |
| (1) | For the year 2019 and 2018 advances includes the amount received by the Bank in balances related to insurance operations amounting to COP 78,203 and COP 67,136, respectively, balances held by court order amounting to COP 60,584 and COP 62,861, respectively, gain on derivatives first day valuation amounting to COP 50,317 and COP 55,573, respectively, excess cash amounting to COP 6,518 and COP 5,161, respectively and balances of credit cards charges pending to be applied amounting to COP 4,869 and COP 7,214. Additionally, for the years 2019 and 2018, the line includes guaranteed deposits for capital market transactions in foreign currency for COP 324,768 and COP 459,966, respectively. |
| (2) | For further information, see Note 19 Employee benefit plans (Bonuses and short-term benefits). |
| (3) | The increase is due to the last installement payment effective for the dividends approved by the annual shareholders’ meeting that took place in 2019 and 2018, respectively. |
| (4) | See Note 21 Provisions and contingent’s liabilities. |
| (5) | See Note 25.3 Fees and commissions. |
NOTE 21. PROVISIONS AND CONTINGENT LIABILITIES
21.1. Provisions
The following tables show the detail of the provisions:
As of December 31, 2019
| | Judicial
proceedings | Administrative
proceedings | Financial
guarantees(1) | Loan
commitments(1) | Onerous
contracts(2) | Total |
| In millions of COP |
| Balance at January 1, 2019 | 36,873 | 468 | 23,100 | 104,559 | 3,033 | 168,033 |
| Additions recognized in the year | 7,272 | 6,139 | 16,210 | 73,101 | - | 102,722 |
| Provisions used during the period | (3,122) | - | - | - | (2,796) | (5,918) |
| Provisions reversed during the period | (5,729) | - | (22,365) | (46,835) | (267) | (75,196) |
| Foreign currency translation adjustment | 395 | - | - | 561 | - | 956 |
| Effect of discounted cash flows | 63 | - | - | - | 30 | 93 |
| Final balance at December 31, 2019 | 35,752 | 6,607 | 16,945 | 131,386 | - | 190,690 |
| (1) | The provisions for financial guarantees and loan commitments as of December 31, 2019 were estimated according to the expected credit losses methodology required by IFRS 9. |
| (2) | During 2019, the onerous contracts were finished. |
As of December 31, 2018
| | Judicial
proceedings | Administrative
proceedings | Financial
guarantees(1) | Loan
commitments(1) | Onerous
contracts | Total |
| In millions of COP |
| Balance at December 31, 2017 | 30,412 | 1,592 | 52,290 | 99,500 | - | 183,794 |
| Effect of adoption of IFRS 9 | - | - | (3,215) | (8,574) | - | (11,789) |
| Balance at January 1, 2018 | 30,412 | 1,592 | 49,075 | 90,926 | - | 172,005 |
| Additions recognized in the year | 22,281 | 7,272 | 7,708 | 21,922 | 2,759 | 61,942 |
| Provisions used during the period | (6,489) | - | (5) | - | - | (6,494) |
| Provisions reversed during the period | (10,176) | (8,396) | (33,686) | (13,713) | - | (65,971) |
| Foreign currency translation adjustment | 606 | - | 8 | 5,424 | 274 | 6,312 |
| Effect of discounted cash flows | 239 | - | - | - | - | 239 |
| Final balance at December 31, 2018 | 36,873 | 468 | 23,100 | 104,559 | 3,033 | 168,033 |
| (1) | The provisions for financial guarantees and loan commitments as of December 31, 2018 were estimated according to the expected credit losses methodology required by IFRS 9. |
The following explains the significant changes in the provisions of financial guarantees and loan commitments during period at December 31, 2019 and 2018 with the expected credit loss model:
| | Stage 1 | Stage 2 | Stage 3 | TOTAL |
| Balance at January 1, 2019 | 112,754 | 14,890 | 15 | 127,659 |
| Net remeasurement of loss allowance | 10,530 | 15,810 | 28 | 26,368 |
| Transfer 12-month ECL | 44,126 | (35,204) | - | 8,922 |
| Transfer Lifetime ECL not credit-impaired | (28,589) | 70,573 | (3) | 41,981 |
| Transfer Lifetime ECL credit-impaired | (5,007) | (19,559) | 31 | (24,535) |
| Provisions used during the period | 57,377 | 5,564 | 2 | 62,943 |
| Provisions reversed during the period | (61,265) | (7,923) | (12) | (69,200) |
| Translation adjustment | 469 | 92 | - | 561 |
| Balance at December 31, 2019 | 119,865 | 28,433 | 33 | 148,331 |
| | Stage 1 | Stage 2 | Stage 3 | TOTAL |
| Balance at January 1, 2018 | 125,189 | 14,502 | 310 | 140,001 |
| Net remeasurement of loss allowance | (24,851) | 3,239 | 17,602 | (4,010) |
| Transfer 12-month ECL | (16,727) | (20,644) | (3,528) | (40,899) |
| Transfer Lifetime ECL not credit-impaired | (5,216) | 33,702 | (7,769) | 20,717 |
| Transfer Lifetime ECL credit-impaired | (2,908) | (9,819) | 28,899 | 16,172 |
| Provisions used during the period | 28,360 | 988 | 6,741 | 36,089 |
| Provisions reversed during the period | (20,459) | (4,757) | (24,637) | (49,853) |
| Translation adjustment | 4,515 | 918 | (1) | 5,432 |
| Balance at December 31, 2018 | 112,754 | 14,890 | 15 | 127,659 |
Judicial proceedings
The judicial provisions refer to pending legal proceedings on employment matters, ordinary lawsuits, class actions suits, civil actions within criminal prosecutions and executive proceedings against the Bank. In the opinion of management, after receiving pertinent legal advice, the payments that will be made by these processes will not generate significant losses in addition to the provisions recognized as of December 31, 2019 and 2018, the Bank does not expect to obtain any kind of reimbursement from judicial proceedings raised against it and, therefore, has not recognized any assets for that purpose, see Note 21.2 Contingent liabilities.
Administrative proceedings
It corresponds mainly to COP 5,467 as a result through government channels about discussion by difference of criteria in ICA tax.
Loan commitments
In order to meet the needs of its customers, the Bank issues loan commitments, letters of credit and bank guarantees. Loan commitments are those approved irrevocable loans, in which, despite having acquired a commitment to grant them, due to the contract or agreement or for any other reason they are still pending disbursement.
Financial guarantees
The Bank grants bank guarantees on behalf of its customers. A bank guarantee represents an irrevocable commitment where the Bank will monetarily cover up to the maximum amount guaranteed, the breach of the client's contractual obligations to third parties for a certain period of time. These are commitments issued by the Bank to guarantee the performance of a customer to a third party and are mainly issued to guarantee agreements established between parties from the energy sector, hydrocarbons sector, private sector and public procurement contracts. The Bank expects most of those guarantees provided to expire before they are used.
The events or circumstances that would require the Bank to perform under a guarantee are determined by the type of guarantee:
Guarantees for the energy sector
The Bank shall be responsible before the guarantee’s beneficiary in the following situations:
• Lack of energy supply due to a low availability from the generating company (the guaranteed entity).
• Non-compliance with the contract signed by the guaranteed entity.
• Non-compliance with the payment of energy supply.
• Non-compliance with the construction and operating of power plants.
• Non-compliance with the construction and operating of transmission lines.
Guarantees for the hydrocarbons sector
The Bank shall be responsible before the guarantee’s beneficiary in the following situations:
• Non-compliance with the contractual obligations in the Minimum Exploration Program.
• Non-compliance with the contractual obligations in the Additional Exploratory Program
• Non-compliance with the contractual obligations in the Post Exploratory Program.
• Non-compliance with the comply with the Technical Evaluation obligations.
Guarantees for public procurement
The amount guaranteed should be reimbursed by the Bank to the beneficiary of the guarantee which is a Government entity, in case the contractor breaches the agreed terms or its legal obligations.
Commitment issued by the Bank to guarantee the performance of a customer from the private sector
The amount guaranteed should be reimbursed to the beneficiary of the guarantee in case of breach of agreed covenants by the customer guaranteed or upon its financial insolvency.
As of December 31, 2019
| Maturity | Financial Guarantees |
| In millions of COP |
| Guarantees under 1 month | 320,004 |
| Guarantees greater than 1 month and up to 3 months | 486,485 |
| Guarantees greater than 3 months and up to 1 year | 2,579,639 |
| Guarantees greater than 1 year and up to 3 years | 696,768 |
| Guarantees greater than 3 year and up to 5 years | 68,150 |
| Guarantees greater than 5 years | 144,904 |
| Total | 4,295,950 |
As of December 31, 2018
| Maturity | Financial Guarantees |
| In millions of COP |
| Guarantees under 1 month | 303,308 |
| Guarantees greater than 1 month and up to 3 months | 780,103 |
| Guarantees greater than 3 months and up to 1 year | 2,287,434 |
| Guarantees greater than 1 year and up to 3 years | 1,426,992 |
| Guarantees greater than 3 year and up to 5 years | 277,710 |
| Guarantees greater than 5 years | 177,828 |
| Total | 5,253,375 |
The total amount outstanding is the maximum potential payments which represent a “worse-case scenario”, and do not reflect expected results.
Onerous contracts
For the Bank an onerous contract is a contract in which the unavoidable costs of meeting the obligations under the contract exceed the economic benefits expected to be received under it.
21.2. Contingent liabilities
The contingencies with a claimed amount higher than USD 5,000 by claimed amount against the Bank, with significant importance to be disclosed in notes to the financial statements as of December 31, 2019 are presented below:
BANCOLOMBIA
Constitutional Public Interest Action (“Acción Popular”) of Carlos Julio Aguilar, et al.
This constitutional public interest action (“Acción Popular”) was filed by the plaintiff arguing that the restructuring of the Departamento del Valle’s financial obligations and the performance plan executed, allegedly violates the collective rights of the public administration’s morality and of the public funds of the Departamento del Valle.
This action was on hold due to its consolidation with the constitutional public interest action filed by Carlos Aponte against various financial institutions. As of December 31, 2019, such proceeding is in the evidentiary stage, specifically in the practice of the expert opinion and no provisions have been made.
Fiscal Responsibility Lawsuit (“Proceso de responsabilidad fiscal”) between Contraloría Departamental de Cundinamarca vs. GEHS, Bancolombia, et al.
The Wastewater Treatments Plant Chía I Delicias Sur of the Municipality of Chía’s development was defined through a leasing agreement entered on September 28, 2015 by and between the Municipality of Chia (tenant) and Bancolombia S.A., valued at USD 5,846. The object of such agreement was into the financing of the project, optimization, design and construction of the wastewater treatment plant PTAR Chía I Delicias Sur; as of December 31, 2018, the agreement was in the stage of advances (with payment of interest on the disbursements made to the supplier), which refers to the contractual stage in which the resources are delivered for the execution of the project in advance of the final payment. The current Mayor of the Municipality of Chía has conveyed anomalies he has found in the execution of the aforementioned project and, as a consequence of the aforementioned anomalies, the Contraloría de Cundinamarca initiated a fiscal responsibility lawsuit for an alleged patrimonial detriment in public funds of the amount of USD 5,846 against GEHS Global Environment and Health Solutions of Colombia (provider), Guillermo Varela Romero, Rafael Antonio Ballesteros Gómez, Luis Alejandro Prieto González and Bancolombia S.A.
As of December 31, 2019, the fiscal responsibility lawsuit is in the evidentiary stage and has a provision of USD 1,126.
Bancolombia´s Judicial Litigations concluded during 2019
The following contingencies listed below are contingencies reported as of December 31, 2018 that were concluded in the Bank’s favor as of December 31, 2019:
| Case/Procedure | Amount | Termination/Decision |
| Miles of USD |
| Colombian National Tax Office (DIAN) Resolution 04 of 2017 | 6,101 | Favorable |
BANITSMO
Ordinary claim filed by Melenao Mora and Said Diaz:
The plaintiffs claim the payment of the costs of the material and moral damages resulting from a criminal proceeding filed by Banistmo (28-10-2004) against them for alleged criminal acts that caused damage to the bank because of the issuance of credit lines to enterprises where they figured as legal representatives.
The plaintiffs seek the payment of material and moral damages which according to their valuation amounts to USD 20,000. By means of the judgement made by the first instance, the bank should repair the material damages, product of the criminal process imposed against the plaintiffs, as well as to pay the sum of USD 2,300 to each of the plaintiffs for moral damages.
The Bank filed an appeal against the judgement made by the first instance, motivated by the errors made in the admission of the evidence and legal grounds in which the decision was based on. The external counsel has labeled this contingency as possible.
Ordinary claim filed by Deniss Rafael Perez Perozo, Carlos Pérez Leal and others.
Promotora Terramar (a HSBC client) received USD 299 in payments through Visa Gift Cards issued by U.S Bank, as partial payment for two apartments in Panama City.
The Credit Card Securities and Fraud Prevention department of the HSBC bank detected an irregular activity promoted by Promotora Terramar, when a deposit monitoring alert was activated due to the high number of cards with the same BIN and Bank. Therefore, pursuant to the Business Establishments Affiliate Agreement, HSBC held USD 287 from Promotora Terramar´s accounts; nevertheless, after further investigations the money was refunded.
The plaintiffs' claim a compensation of the material and moral damages caused, which according to their valuation amounts to USD 5,252. As of December 31, 2019, the process is suspended and pending the initiation of the evidentiary stage. The external counsel has labeled this contingency as remote.
BANCO AGRÍCOLA
The authority on taxes of El Salvador, in accordance with the resolution of October 2018, determined that Banco Agrícola failed to pay and declare income taxes related to fiscal year 2014 for a total of USD 11,116 and the corresponding fine of USD 5.5.
The Bank filed an appeal. In the Bank´s opinion, the General Directorate of Internal Tax made some law and fact errors. The attorneys have labeled this contingency as remote.
ARRENDADORA FINANCIERA S.A. ARFINSA SUBSIDIARY OF BANCO AGRÍCOLA
Corporación de Alimentos S.A. de CV
The plaintiffs filed a claim for alleged damages derived from funds wrongfully delivered to third parties that were not entitled to receiving said funds. The claim seeks USD 6,454. As of December 31, 2019, the process is the evidentiary stage. The external counsel has labeled this contingency as remote.
BANCO AGROMERCANTIL
Superintendencia de Administración Tributaria
The Superintendence of Tax Administration of Guatemala (STA) contested the income tax return corresponding to the year 2014 and demanded an adjustment from the Bank valued in USD 13.617 (USD 6.808 tax plus a fine of USD 6.808). The Bank disagrees with the STA´s adjustment and initiated a judicial proceeding against the STA asking the court to declare the illegality of the adjustment. As of December 31, 2019, the claim is currently in the evidentiary stage. The external counsel has labeled this contingency as remote.
Delicarnes, Sociedad Anónima
Delicarnes, Sociedad Anónima, acquired a mortgage loan in BAM and failed its obligation to pay it on the agreed date, so BAM filed a collection action against it. Delicarnes, opposed the collection action, and filed against BAM, an ordinary claim for damages because it argues considers that did not breach the contract and therefore, should not have been sued, Delicarnes claims compensation from BAM of USD 70,379. The Bank opposed to Delicarne´s claim and as of December 31, 2019, this process is in the evidentiary stage. The external counsel has labeled this contingency as remote.
Dany Ward Mcnab Valladares
North Shore Development Company, S.A (NSDC) acquired several credits with BAM and Mercom Bank Ltd. (BAM ‘subsidiary company) that did not pay in the agreed upon terms, so to pay the debts, NSDC gave BAM and Mercom Bank Ltd., with the express authorization of its shareholders (including the shareholder Dany Ward Mcnab Valladares), some properties for the sum of USD 23,800.
After giving the assets in payment, Dany Ward Mcnab Valladares, a shareholder of North Shore Development Company, S.A (NSDC), filed a claim for the annulment of non- recourse debts in favor of BAM and Mercom Bank, that were made by North Shore Development Company, S.A. and the recognition of damages. His claim was based on the fact that, when North Shore Development Company, S.A, paid with its goods to BAM and Mercom Bank it was left without sufficient assets to pay him a debt for USD 18,200. As of December 31, 2019, the process is in the notification stage of the claim response. This legal procedure is carried out in the Courts of the Island of Roatan, Republic of Honduras and in the opinion of the external counsel; the probability of this contingency is remote.
NOTE 22. SHARE CAPITAL
The subscribed and paid-in capital is the following:
| Share capital | December 31, 2019 | December 31, 2018 |
| Authorized shares | 1,400,000,000 | 1,400,000,000 |
| Subscribed and paid-in shares: | | |
| Ordinary shares with a nominal value of COP 500 pesos | 509,704,584 | 509,704,584 |
| Preferred shares with dividend without voting rights with nominal value of COP 500 pesos | 452,122,416 | 452,122,416 |
| Total shares | 961,827,000 | 961,827,000 |
| Subscribed and paid capital (nominal value) | 480,914 | 480,914 |
Dividends declared
The declaration, amount and payment of dividends are based on Bancolombia S.A.’s unconsolidated net income. Dividends must be approved at the ordinary annual shareholders’ meeting upon the recommendation of the Board of Directors. Under the Colombian Commercial Code, after payment of income taxes and appropriation of legal and other reserves, and after setting off losses from prior fiscal years, Bancolombia must distribute to its stockholders at least 50.00% of its annual net income or 70.00% of its annual net income if the total amount of reserves exceeds its outstanding capital, unless such minimum percentages are waived by an affirmative vote of the holders of 78.00% of the shares present at the stockholders’ meeting. Such dividend distribution must be made to all stockholders, in cash or in issued stock of Bancolombia, as may be determined by the stockholders, and within a year from the date of the ordinary annual stockholders’ meeting in which the dividend was declared.
The payment of dividends must be made in cash during the next year since the date when the Annual Meeting takes place and for all the stockholders. If the payment is made in the Bank's own equity securities instead of cash, that situation has to be approved by the 80.00% of the subscribed common shareholders and the 80.00% of the subscribed preferred shares.
The annual net profits of Bancolombia must be applied as follows: (i) first, an amount equal to 10.00% of Bancolombia’s net profits to a legal reserve until such reserve is equal to at least 50.00% of the Bank’s paid-in capital; (ii) second, to the payment of the minimum dividend on the preferred shares; and (iii) third, as may be determined in the ordinary annual stockholders’ meeting by the vote of the holders of a majority of the shares entitled to vote.
Dividends declared with respect to
net income earned in: | Cash dividends per share
(Stated in COP) |
| 2019 | 1,638 |
| 2018 | 1,092 |
| 2017 | 1,020 |
| 2016 | 950 |
| 2015 | 888 |
| 2014 | 830 |
Preferred shares
Holders of preferred shares are entitled to receive dividends based on the profits of the preceding fiscal year, after deducting losses affecting the capital and once the amount that shall be legally set apart for the legal reserve has been deducted, but before creating or accruing for any other reserve, of a minimum preferred dividend equal to one per cent (1.00%) yearly of the subscription price of the preferred share, provided this dividend is higher than the dividend assigned to common shares. If this is not the case, the dividend shall be increased to an amount that is equal to the per share dividend on the common shares. The dividend received by holders of common shares may not be higher than the dividend assigned to preferred shares.
Payment of the preferred dividend shall be made at the time and in the manner established in the general shareholders’ meeting and with the priority indicated by Colombian law.
Any stock dividend payable in common shares requires the approval of 80.00% or more of the shares present at a shareholders’ meeting, which will include 80.00% or more of the outstanding preferred shares. In the event that none of the holders of preferred shares is present at such meeting, a stock dividend may only be paid to the holders of common shares that approve such a payment.
NOTE 23. APPROPRIATED RESERVES
As of December 31, 2019 and December 31, 2018 the appropriated retained earnings consist of the following:
| Concept | December 31, 2019 | December 31, 2018 |
| In millions of COP |
| Appropriation of net income(1) | 9,406,792 | 9,312,009 |
| For Fiscal provisions(2) | 262,673 | 276,640 |
| Others | 743,627 | 153,125 |
| Total Appropiated reserves | 10,413,092 | 9,741,774 |
| (1) | The legal reserve fulfills two objetives: to increase and maintain the company's capital and to absorb economic losses. Based on the aforementioned, this amount shall not be distributed in dividends to the stockholders. |
| (2) | Pursuant to Article 130 of Tax Statute, a non-distributable reserve to the shareholders was established for the 70% of the excess of the tax depreciation over accounting depreciation. The article 130 of Tax Statute was abolished by Law 1819 of 2016. |
NOTE 24. UNCONSOLIDATED STRUCTURED ENTITIES
Nature and risks associated with the Bank’s interests in unconsolidated structured entities
The term "unconsolidated structured entities" refers to all structured entities that are not controlled by the Bank. The Bank manages transactions with unconsolidated structured entities in the normal course of business to facilitate customer transactions and for specific investment opportunities.
The table below shows the total assets of unconsolidated structured entities in which the Bank had an interest at the reporting date and its maximum exposure to loss in relation to those interests.
As of December 31, 2019
| | Securitisations | The Bank’s managed funds | Total |
| In millions of COP |
| Total assets of the entities | 2,842,268 | 148,307,065 | 151,149,333 |
| The Bank’s interest-assets | |
| Investments at fair value through profit or loss | 198,115 | - | 198,115 |
| Investments at fair value through other comprehensive income | 179,405 | - | 179,405 |
| Loans and advances to customers | - | 4,748,233 | 4,748,233 |
| Total assets in relation to The Bank’s interests in the unconsolidated structured entities | 377,520 | 4,748,233 | 5,125,753 |
| The Bank’s maximum exposure | 377,520 | 4,748,233 | 5,125,753 |
As of December 31, 2018
| | Securitisations | The Bank’s managed funds | Total |
| In millions of COP |
| Total assets of the entities | 1,969,887 | 128,257,719 | 130,227,606 |
| The Bank’s interest-assets | |
| Investments at fair value through profit or loss | 196,927 | - | 196,927 |
| Investments at fair value through other comprehensive income | 209,164 | - | 209,164 |
| Loans and advances to customers | - | 5,417,235 | 5,417,235 |
| Total assets in relation to The Bank’s interests in the unconsolidated structured entities | 406,091 | 5,417,235 | 5,823,326 |
| The Bank’s maximum exposure | 406,091 | 5,417,235 | 5,823,326 |
The Bank invests in asset-backed securities issued by securitization entities for which underlying assets are mortgages originated by financial institutions. The Bank does not have a significant exposure to sub-prime securities. The asset-backed securities are denominated in local market TIPS and accounted for as investment at fair value through profit or loss. These asset-backed securities have different maturities and are generally classified by credit ratings. The Bank does not expect significant changes in those ratings. Also, the Bank retain beneficial interests in the form of servicing fees on the securitized mortgages.
Revenues generated by the Bank´s asset management, are derived from the following type of business lines: related trusts, mutual funds sold to individuals, corporate trusts, escrow accounts, private equity funds, and delegated tailor-made mandates from third parties. Generally, the revenues correspond to the fees received from the management of resources that are invested in several instruments and management of properties and premises related to real estate projects in progress.
Likewise, the Bank receive fees for management assets pledged as collateral for clients’ commitments and obligations, and fees from management of resources of government agencies and entities.
On the other hand, there is not an additional exposure to loss, such as funding commitments with regards to the Bank’s involvement with those entities.
NOTE 25. OPERATING INCOME
25.1. Interest and valuation on financial instruments
The following table sets forth the detail of interest and valuation on financial asset instruments for the years ended December 31, 2019, 2018 and 2017:
| | 2019 | | 2018 | 2017 |
| In millions of COP |
| Interest on debt instruments using the effective interest method | 160,200 | | 129,017 | 159,890 |
| Interest and valuation on financial instruments | | | | |
| Debt investments | 881,985 | | 472,357 | 699,841 |
| Derivatives | (182,769) | | (22,575) | (61,667) |
| Spot transactions | 483 | | (13,734) | 3,517 |
| Repos | (175,259) | | (51,438) | (116,268) |
| Total Interest and valuation on financial instruments | 524,440 | | 384,610 | 525,423 |
25.2. Interest expenses
The following table sets forth the detail of interest on financial liability instruments for the years ended December 31, 2019, 2018 and 2017:
| | 2019 | | 2018 | 2017 |
| In millions of COP |
| Deposits | (4,164,798) | | (3,852,061) | (4,279,316) |
| Debt instruments in issue | (1,164,808) | | (1,139,456) | (1,191,000) |
| Borrowing costs | (627,058) | (1) | (583,321) | (672,472) |
| Interest right of use assets(2) | (121,946) | | - | - |
| Preferred shares | (57,908) | | (58,714) | (58,714) |
| Borrowings from other financial institutions | (21,663) | | (18,134) | (15,860) |
| Other interest | (21,613) | | (18,530) | (15,624) |
| Interest expenses | (6,179,794) | | (5,670,216) | (6,232,986) |
| (1) | Includes the expense recognized for borrowing cost of the subsidiaries sold during 2019 for COP 1,224. |
| (2) | For more information refer to Note 7 Leases and Note 32 Impacts on application of new standars. |
Net interest income includes interest earned on loans, “reverse repos” and investments less interest expense of deposits by customers, debt securities in issued, borrowing from other financial institutions and ‘repos’. At December 31, 2019, 2018 and 2017, net interest income amounted to COP 11,538,582, COP 10,541,522 and COP 10,584,976, respectively.
25.3. Fees and commissions
The Bank has elected to present the income from contracts with costumes as an element in a line named “Fees and commissions income” in the consolidated statement of income separated from the other income sources.
The information contained in this section about the fees and commission’s income presents information on the nature, amount, timing and uncertainty of the income from ordinary activities which arise from a contract with a customer under the regulatory framework of IFRS 15 Revenue from Ordinary activities from Contracts with Customers.
In the following table, the description of the principle activities through which the Bank generates revenue from contracts with customers is presented:
Fees and
Commissions | Description |
| Banking services | Banking Services are related to commissions from the use of digital physical channels or once the customer makes a transaction. The performance obligation is fulfilled once the payment is delivered to its beneficiary and the proof of receipt of the payment is sent, in that moment, the collection of the commission charged to the customer is generated, which is a fixed amount. The commitment is satisfied during the entire validity of the contract with the customer. The Bank acts as principal. |
| Credit and debit card fees | In debit card product contracts, it is identified that the price assigned to the services promised by the Bank to the customers is fixed. Given that no financing component exists, it is established on the basis of the national and international interbank rate. Additionally, the product charges to the customers commissions for handling fees, at a determined time and with a fixed rate. For Credit Cards, the commissions are the handling fees and depend on the card franchise. The commitment is satisfied in so far that the customer has capacity available on the card. Other revenue received by the (issuer) credit card product, is advance commission; this revenue is the charge generated each time the customer makes a national or international advance, at owned or non-owned ATMs, or through a physical branch. The exchange bank fee is a revenue for the Issuing Bank of the credit card for the services provided to the business for the transaction effected at the point of sale. The commission is accrued and collected immediately at the establishment and has a fixed amount. In the credit cards product there is a customer loyalty program, in which points are awarded for each transaction made by the customer in a retail establishment. The program is administrated by a third party who assumes the inventory and claims risks, for which it acts as agent. The Bank, recognized it as a lower value of the revenue from the exchange bank fee. The rights and obligations of each party in respect of the goods and services for transfer are clearly identified, the payment terms are explicit, and it is probable, that is it takes into consideration the capacity of the customer and the intention of having to pay the consideration at termination to those entitled to change the transferred goods or services. The revenue is recognized at a point in time: the Bank satisfies the performance obligation when the “control” of the goods or services was transferred to the customers. |
| Deposits | Deposits are related to the services generated from the offices network of the Bank once a customer makes a transaction. The Bank generally commits to maintain active channels for the products that the customer has with the Bank, with the purpose of making payments and transfers, sending statements and making transactions in general. The commissions are deducted from the deposit account, and they are incurred at a point in time. The Bank acts as principal. |
| Electronic services and ATMs | Revenue received from electronic services and ATMs arises through the provision of services so that the customers may make required transactions, and which are enabled by the Bank. These include online and real-time payments by the customers of the Bank holding a checking or savings accounts, with a debit or credit card for the products and services that the customer offers. Each transaction has a single price, for a single service. The provision of collection services or other different services provided by the Bank, through electronic equipment, generates consideration chargeable to the customer established contractually by the Bank as a fee. The Bank acts as principal and the revenue is recognized at a point in time. |
| Brokerage | Brokerage is a group of services for the negotiation and administration of operations for purchasing fixed revenue securities, equities and operations with derivatives in its own name, but on the account of others. The performance obligations are fulfilled at a point in time when the commission agent in making its best effort can execute the business entrusted by the customer in the best conditions. The performance obligations are considered satisfied once the service stipulated in the contract is fulfilled, as consideration fixed, or variable payments are agreed, depending on the service. The Bank acts generally as principle and in some special cases as agent. |
| Remittance | Revenue for remittance is received as consideration for the commitment established by the Bank to pay remittances sent by the remitting companies to the beneficiaries of the same. The commitment is satisfied at a point in time to the extent that the remittance is paid to the beneficiary. The price is fixed, but may vary in accordance to the transferred amount, due to the operation being dependent on the volume of operations generated and the transaction type. There is no component of financing, nor the right to receive consideration dependent on the occurrence or not of a future event. |
| Acceptances, Guarantees and Standby Letters of Credit | Banking Service from acceptances, guarantees and standby letters of credit which are not part of the portfolio of the Bank. There exist different performance obligations; the satisfaction of performance obligations occurs when the service is given to the customer. The consideration in these types of contracts may include fixed amounts, variable amounts, or both, and the Bank acts as principal. The revenue is recognized at a point in time. |
| Trust | Revenue related to Trust are received from the administration of the customer resources in the business of investment trusts, property trusts, management trusts, guarantee trusts, for the resources of the general social security system, Collective portfolios and Private Equity Funds (PEF). The commitments are established in contracts independently and in an explicit manner, and the services provided by the Bank are not inter-related between the contracts. The performance obligation corresponds to performing the best management in terms of the services to be provided in relation to trust characteristics, thus fixed and variable prices are established depending on the complexity of the business, similarly, revenues are recognized throughout or at a determined time. In all the established businesses it acts as principal. |
| Securities brokerage | Valores Bancolombia makes available its commercial strength for the deposit, reinvestment of resources through financial instruments to the issuing company. It receives a payment for deposits made. The commitment of the contract is satisfied to the extent that the resources requested by the issuer are obtained through the distribution desks of Valores Bancolombia. The collection is made monthly. It is established that Valores Bancolombia may undertake collection of these commissions at the end of the month through a collection account charged to the issuer, acting as principal. |
| Bancassurance | The Bank receives a commission for collecting insurance premiums at a determined time and for permitting the use of its network to sell the insurances of different insurance companies over a period of time. The Bank in these bancassurance contracts acts as agent (intermediary between the customer and the insurance company), since it is the insurance company which assumes the risks, and which handles the complaints and claims of the customers inherent in each insurance. Therefore, the insurance company acts as principal before the customer. The prices agreed in bancassurance are defined as a percentage on the value of the policy premiums. The payment shall be tied to the premiums collected, sold or taken for the case of employees’ insurance. The aforementioned then means that the price is variable, since, the revenue will depend on the quantity of policies or calculations made by the insurance companies. |
| Collections | The Bank acting as principal, commits to collect outstanding invoices receivable by the collecting customers through the different channels offered by the bank, send the information of the collections made and credit the money to the savings or checking account defined by the collecting customer. The commitment is satisfied at a point in time to the extent that the money is collected by the different channels, the information of the said collections is delivered appropriately, and the resources are credited in real-time to the account agreed with the customer. For the service, the Bank receives a fixed payment, which is received for each transaction once the contract is in effect. |
| Services | These are the maintenance services performed on the fleet owned by the customers, these services are performed on demand, and the value of the service cost is invoiced plus an intermediation margin. The collection is made by the amount of expense invoiced by the provider plus an intermediation percentage, which ranges between 4% and 12% depending on the customer. The contract is written, is based on a framework contract which is held between the customers which contains the general terms of negotiation and the payment terms are generally 30 days after generating the invoice. The revenue is recognized when the service is provided. There is no financing nor sanctions for early cancellations. In logistic operation services the contract is written, with a defined duration, and details the rights and obligations of the parties. In general terms, the Bank commits to provide to customers merchandise transport services, which includes the driver, fuel, maintenance, tolls and other elements required to carry out the routes requested by the customer. Once the trip is finished, the price is variable and is determined by the average cost per route, which is updated at the start of the year. At the end of the month an adjustment is made to this price, with the actual costs incurred in the operation, such as the fuel, tolls, handling, maintenance, administrative expenses, among others. To view the details of the balance, refer to line ‘Services’ in Note25.4 Other operational Income. |
| Gains on sale of assets | These are the revenue from the sale of assets, where the sale value is higher than the book value recorded in the accounts, the difference representing the gains. The recognition of the revenue is at a point in time once the sale is realized. The Bank acts as principal in this type of transactions and the transaction price is determined by the market value of the asset being sold. To view the details of the balance, refer to line ‘Gain on sale of assets’ in Note25.4 Other operational Income. |
| Investment Banking | Investment Banking offers to customer’s financial advisory services in the structuring of businesses in accordance to the needs of each one of them. The advisory services consist in realizing a financial structuring of a credit or bond in which the Investment Bank offers the elements so that the company decides the best option for structuring the instrument. In the financial advisory contract, a best efforts clause is included. The promises given to the customers are established in the contracts independently and explicitly. The services provided by the Invesment Bank are not interrelated between the contracts, correspond to the independent advice agreed and do not include additional services in the commission agreed with the customer. The advisory services offered in each one of the contracts are identifiable separately from the other performance commitments that the Investment Bank may have with the customers. The Investment Bank does not have a standard contract for the provision of advisory services, given than each contract is tailored to the customer’s needs. The transaction price is defined at the start of the contract and is assigned to each service provided independently. The price contains a fixed and a variable portion which is provided in the contracts. The variation depends on the placement amount for the case of a financial structuring contract and coordination of the issuance and conditions of the same. In these operations Banca de Inversion Bancolombia provides advice to the customers and the price shall depend at times on the success and amount of the operation. In the contracts subject to evaluation there are no incremental costs associated with the satisfaction of the commitments of the Bank with the customers provided for. In the contracts signed with the customers, a penalty clause is established in case of a customer withdrawing from continuing with the provision of the services established in the commercial offer. The penalty shall be recognized in the financial statements once the Investment Bank is notified on the withdrawal under the concept of charges for early termination of the contract. |
In accordance with IFRS 15, the tables below disaggregate in more detail than disclosed in the Bank’s annual report in 2017, revenue from contracts with customers, considering the nature of the services offered by the Bank and the information regularly reviewed by the chief operating decision maker.
The Bank presents the information on revenue from contracts with customers in accordance with its operating segments defined earlier in Note 3 Operating Segments for each of the principal services offered.
The following table shows the balances categorized by nature and by segment of revenue from ordinary activities from contracts with customers as at December 31, 2019, 2018 and 2017:
As of December 31, 2019
| | Banking
Colombia | Banking
Panama | Banking El
Salvador | Banking
Guatemala | Trust | Investment
Banking | Brokerage | Off Shore | All Other
Segments | Total before
eliminations | Adjustments for
consolidation
purposes(1) | Total after
eliminations |
| Revenue from contracts with customers | In millions of COP |
| Fees and Commissions | | | | | | | | | | | | |
| Banking services | 422,943 | 77,976 | 99,222 | 52,627 | - | - | - | 15,683 | - | 668,451 | - | 668,451 |
| Credit and debit card fees and commercial estabilshments | 1,421,039 | 200,372 | 117,541 | 78,764 | - | - | - | 4,230 | - | 1,821,946 | - | 1,821,946 |
| Brokerage | - | 7,893 | - | 24 | - | - | 18,617 | - | - | 26,534 | - | 26,534 |
| Acceptances, Guarantees and Standby Letters of Credit | 32,829 | 14,369 | 5,541 | 2,440 | - | - | - | 844 | - | 56,023 | - | 56,023 |
| Trust | - | 13,033 | 1,713 | 572 | 349,402 | - | 80,534 | 41 | 509 | 445,804 | - | 445,804 |
| Securities brokerage | - | 391 | 1,496 | - | - | 30,142 | 6,961 | - | - | 38,990 | - | 38,990 |
| Bancassurance | 607,758 | 35,014 | 160 | - | 36 | 7 | 51 | - | - | 643,026 | - | 643,026 |
| Payment and collections | 623,758 | - | - | - | - | - | - | - | - | 623,758 | - | 623,758 |
| Others | 161,420 | 1,007 | 42,636 | 36,427 | - | 680 | 7,201 | 5,002 | 79 | 254,452 | (12) | 254,440 |
| Total revenue from contracts with customers(1) | 3,269,747 | 350,055 | 268,309 | 170,854 | 349,438 | 30,829 | 113,364 | 25,800 | 588 | 4,578,984 | (12) | 4,578,972 |
| (1) | For further information about composition of Bank’ segments see Note 3 Operating segments. |
As of December 31, 2018
| | Banking
Colombia | Banking
Panama | Banking El
Salvador | Banking
Guatemala | Trust | Investment
Banking | Brokerage | Off Shore | All Other
Segments | Total before
eliminations | Adjustments for
consolidation
purposes(1) | Total after
eliminations |
| Revenue from contracts with customers | In millions of COP |
| Fees and Commissions | | | | | | | | | | | | |
| Banking services | 370,671 | 66,569 | 85,615 | 39,610 | - | - | - | 12,783 | - | 575,248 | - | 575,248 |
| Credit and debit card fees and commercial estabilshments | 1,258,047 | 185,466 | 97,163 | 66,731 | - | - | - | 3,707 | - | 1,611,114 | - | 1,611,114 |
| Brokerage | - | 7,033 | - | 29 | - | - | 20,012 | - | - | 27,074 | - | 27,074 |
| Acceptances, Guarantees and Standby Letters of Credit | 33,313 | 15,352 | 4,749 | 3,055 | - | - | - | 897 | - | 57,366 | - | 57,366 |
| Trust | - | 8,184 | 1,411 | 645 | 313,886 | - | 81,502 | 37 | 104 | 405,769 | - | 405,769 |
| Securities brokerage | - | 1,200 | 1,212 | - | - | 20,262 | 9,530 | - | - | 32,204 | - | 32,204 |
| Bancassurance | 495,232 | 28,466 | 112 | - | - | - | - | - | - | 523,810 | - | 523,810 |
| Payment and collections | 559,139 | - | - | 4,084 | - | - | - | - | - | 563,223 | - | 563,223 |
| Others | 124,900 | 492 | 36,852 | 27,099 | 22 | 9 | 2,926 | 3,416 | 2,884 | 198,600 | (149) | 198,451 |
| Total revenue from contracts with customers(1) | 2,841,302 | 312,762 | 227,114 | 141,253 | 313,908 | 20,271 | 113,970 | 20,840 | 2,988 | 3,994,408 | (149) | 3,994,259 |
| (1) | For further information about composition of Bank’ segments see Note 3 Operating segments. |
As of December 31, 2017
| | Banking
Colombia | Banking
Panama | Banking El
Salvador | Banking
Guatemala | Trust | Investment
Banking | Brokerage | Off Shore | All Other
Segments | Total before
eliminations | Adjustments for
consolidation
purposes | Total after
eliminations |
| Revenue from contracts with customers(1) | In millions of COP |
| Fees and Commissions | | | | | | | | | | | | |
| Banking services | 335,101 | 177,930 | 80,672 | 38,643 | - | - | - | 15,821 | - | 648,167 | - | 648,167 |
| Credit and debit card fees and comercial | 1,080,814 | 80,348 | 89,330 | 51,175 | - | - | - | 2,876 | - | 1,304,543 | - | 1,304,543 |
| Brokerage | - | 2,302 | - | 35 | - | - | 20,593 | - | - | 22,930 | - | 22,930 |
| Acceptances, Guarantees and Standby Letters of Credit | 41,077 | 15,699 | 4,080 | 2,210 | - | - | - | 404 | - | 63,470 | - | 63,470 |
| Trust | - | 4,510 | 1,335 | 713 | 285,648 | - | 68,180 | 36 | (58) | 360,364 | - | 360,364 |
| Securities brokerage | - | 2,702 | - | - | - | 28,747 | 6,778 | - | 843 | 39,070 | - | 39,070 |
| Bancassurance | 427,190 | 23,847 | - | - | - | - | - | - | 85 | 451,122 | - | 451,122 |
| Payments and collections | 531,567 | - | - | 4,369 | - | - | - | - | - | 535,936 | - | 535,936 |
| Others | 115,472 | 10,415 | 35,742 | 28,877 | - | - | 1,634 | 253 | 3,119 | 195,512 | - | 195,512 |
| Total revenue from contracts with customers(1) | 2,531,221 | 317,753 | 211,159 | 126,022 | 285,648 | 28,747 | 97,185 | 19,390 | 3,989 | 3,621,114 | - | 3,621,114 |
| (1) | For further information about composition of Bank’ segments see Note 3 Operating segments. |
For the determination of the transaction price, the Bank assigns to each one of the services the amount which represents the value expected to be received as consideration for each independent commitment, which is based on the relative price of independent sale. The price that the Bank determines for each performance obligation is done by defining the cost of each service, related tax and associated risks to the operation and inherent to the transaction plus the margin expected to be received in each one of the services, taking as references the market prices and conditions, as well as the segmentation of the customer.
In the transactions evaluated in the contracts, changes in the price of the transaction are not identified.
Contract Assets
The Bank receives payments from customers based on the provision of the service, in accordance to that established in the contracts. When the Bank incurs costs for providing the service prior to the invoicing, and if these are directly related with a contract, they improve the resources of the entity and are expected to recuperate, these costs correspond to a contract asset. Currently, the Group does not have assets related to contracts with customers.
As a practical expedient, the Bank recognizes the incremental costs of obtaining a contract as an expense when the amortisation period of the asset is one year or less.
Contract Liabilities
The contract liabilities constitute the obligation of the Bank to transfer the services to a customer, for which the Group has received a payment on the part of the final customer or if the amount is due before the execution of the contract. They also include deferred income related to services that shall be delivered or provided in the future, which will be invoiced to the customer in advance, but which are still not due.
The contract liabilities decreased COP 15,054 in 2019.The changes in contract liabilities are due to performance circumscribed in the contract.
The following table shows the detail of accounts receivable, and contract liabilities balances as at December 31, 2019, 2018 and 2017:
| | 2019 | 2018 | 2017 |
| In millions of COP |
| Accounts receivable from contracts with customers, net(1) | 169,109 | 86,759 | 90,590 |
| Contract liabilities | 60,791 | 75,845 | 118,857 |
| (1) | The impairment corresponding to the receivable accounts from contracts from customers is COP 9,769, COP 11,975 and COP 9,639 for the year 2019, 2018 and 2017, respectively. |
Fees and Commissions Expenses
| Fees and Commissions Expenses | 2019 | 2018 | 2017 |
| In millions of COP |
| Banking services | (630,583) | (542,628) | (508,462) |
| Call center and web page | (423,630) | (309,403) | (291,602) |
| Others | (499,026) | (361,025) | (275,051) |
| Expenses for commissions | (1,553,239) | (1,213,056) | (1,075,115) |
25.4. Other operating income
The following table sets forth the detail of other operating income net for the years ended December 31, 2019, 2018 and 2017:
| Other operating income | 2019 | 2018 | 2017 |
| In millions of COP |
| Leases | 682,525 | 624,062 | 563,861 |
| Net foreign exchange and Derivatives Foreign exchange contracts(1) | 219,835 | 61,391 | 315,985 |
| Services | 170,494 | 170,459 | 164,150 |
| Gains on sale of assets | 93,548 | 75,976 | 40,600 |
| Investment property valuation(2) | 93,197 | 77,350 | 55,573 |
| Insurance(3) | 60,452 | 54,679 | 49,640 |
| Other reversals | 49,079 | 47,657 | 140,012 |
| Penalties for failure to contracts | 28,554 | 16,302 | 19,881 |
| Hedging | 663 | 14,158 | (3,678) |
| Others | 136,900 | 109,533 | 207,713 |
| Total Other operating income | 1,535,247 | 1,251,567 | 1,553,737 |
| (1) | Corresponds to the management of assets and liabilities in foreign currency. |
| (2) | See Note 11 Investment properties. |
| (3) | Corresponds to income from Seguros Agromercantil Guatemala insurance operations. See Note 9 Goodwill and intangible assets, net. |
25.5. Dividends and net income on equity investments
The following table sets forth the detail of dividends received, and share of profits of equity method investees for the years ended December 31, 2019, 2018 and 2017:
| | 2019 | 2018 | 2017 |
| In millions of COP |
| Dividends(1) | 84,183 | 67,582 | 32,248 |
| Equity investments(2) | 71,207 | 86,399 | (19,680) |
| Equity method(3) | 249,231 | 187,814 | 253,602 |
| Gains on sale of investments is subsidiarys and associates(3) (4) | 77,916 | - | - |
| Others(5) | (101,938) | (47,765) | 24,472 |
| Total dividends received, and share of profits of equity method investees | 380,599 | 294,030 | 290,642 |
| (1) | Dividends received from equity investments at fair value through profit or loss as of December 31, 2019, 2018 and 2017 amount COP 73,685, COP 54,477 and COP 20,297, respectively. Dividends from equity investments at fair value through OCI amount COP 10,498, COP 13,105 and COP 11,951, respectively. As of December 31, 2019, 2018 and 2017, the amount includes dividends of investments derecognised for COP 4,100, COP 950 and COP 1,556, respectively. |
| (2) | As of December 31, 2018, there is a profit on capital investments due to the increase in fair value in the portfolio measured at fair value through the profit or loss held by Banagricola S.A. |
| (3) | For further information, see Note 8 investments in associates and joint ventures. |
| (4) | Corresponds to gains on sale of investments in associates Concesiones CCFC, Avefarma S.A.S, Glashfarma Tech S.A.S and Panamerican Pharmaceutical Holding Inc. for COP 33,253, the winding up of joint venture Servicios de Aceptación S.A.S for COP 8,927 and the sale of subsidiaries Arrendamiento Operativo CIB and Fiduperú S.A, for COP 35,736. |
| (5) | For further information see Note 17 Borrowings from other financial institutions. |
NOTE 26. OPERATING EXPENSES
26.1. Salaries and employee benefit
The detail for salaries and employee benefits for the years ended December 31, 2019, 2018 and 2017 is as follows:
| Salaries and employee benefit | 2019 | 2018 | 2017 |
| In millions of COP |
| Salaries | 1,449,765 | 1,350,956 | 1,253,787 |
| Bonuses | 560,149 | 440,493 | 374,056 |
| Private premium | 378,979 | 322,420 | 315,983 |
| Social security contributions | 319,424 | 308,116 | 287,693 |
| Indemnization payment | 140,633 | 107,992 | 129,849 |
| Other benefits | 517,874 | 474,077 | 431,011 |
| Total Salaries and employee benefit | 3,366,824 | 3,004,054 | 2,792,379 |
26.2. Other administrative and general expenses
The detail for administrative and general expenses for the years ended December 31, 2019, 2018 and 2017 is as follows:
| Other administrative and general expenses | 2019 | 2018 | 2017 |
| In millions of COP |
| Maintenance and repairs | 599,519 | 585,377 | 530,284 |
| Others Fees | 470,457 | 429,121 | 427,517 |
| Insurance | 423,785 | 331,430 | 303,501 |
| Data processing | 214,307 | 147,294 | 130,125 |
| Transport | 212,582 | 183,857 | 158,561 |
| Advertising | 151,246 | 144,900 | 127,142 |
| Public services | 116,837 | 108,420 | 107,727 |
| Cleaning and security services | 100,593 | 97,848 | 92,359 |
| Useful and stationery | 83,891 | 63,321 | 58,145 |
| Communications | 77,375 | 73,072 | 67,201 |
| Contributions and affiliations | 73,689 | 66,636 | 60,320 |
| Frauds and claims | 65,589 | 117,032 | 134,087 |
| Trust | 59,334 | 31,100 | 25,901 |
| Properties improvements and installation | 51,187 | 52,937 | 59,121 |
| Travel expenses | 42,973 | 37,006 | 38,037 |
| Legal and financial consultant | 38,972 | 31,072 | 25,855 |
| Real estate management. | 25,012 | 23,694 | 21,817 |
| Board of directors and audit fee | 22,240 | 21,733 | 20,450 |
| Disputes, fines and sanctions | 18,077 | 63,685 | 139,146 |
| Storage services | 17,135 | 15,664 | 16,162 |
| Leasing(1) | 8,671 | 256,872 | 244,956 |
| Activities joint operations | 8,142 | 8,719 | 9,650 |
| Legal expenses | 7,165 | 3,570 | 4,112 |
| Donations | 4,781 | 17,402 | 17,048 |
| Temporary services | 3,544 | 3,724 | 3,907 |
| Public relations | 2,895 | 2,899 | 5,912 |
| Others | 169,060 | 106,384 | 148,841 |
| Total other administrative and general expenses | 3,069,058 | 3,024,769 | 2,977,884 |
| Wealth tax, contributions and other tax burden(2) | 757,820 | 692,666 | 727,661 |
| (1) | The decrease corresponds to the accounting of the leasing contracts under IFRS 16 Leases. See Note 7.1 Lessor and Note 32 Impacts on application of new standards. |
| (2) | See Note 12 Income tax. |
26.3. Impairment, depreciation and amortization
The detail for Impairment, depreciation and amortization for the years ended December 31, 2019, 2018 and 2017 is as follows:
| Impairment, depreciation and amortization | 2019 | 2018 | 2017 |
| In millions of COP |
| Depreciation of premises and equipment(1) | 358,439 | 342,605 | 316,281 |
| Depreciation of right-of-use assets(2) | 177,709 | - | - |
| Amortization of intangible assets(3) | 141,104 | 123,551 | 116,752 |
| Impairment of other assets, net(4) | 147,338 | 27,746 | 46,078 |
| Total impairment, depreciation and amortization | 824,590 | 493,902 | 479,111 |
| (1) | Includes the expense recognized for depreciation premises and equipment of the subsidiaries sold during 2019 and classified as held for sale in 2018 for COP 4,898 and COP 24,854, respectively |
| (2) | Adoption of IFRS 16 Leases. See Note 7.1 Lessor and Note 32 Impacts on application of new standards. |
| (3) | See Note 9 Goodwill and intangibles assets, net |
| (4) | The detail of the impairment of other assets net by operating segments for the years ended December 31, 2019, 2018 and 2017 is presented in the table below: |
| Impairment of other assets, net | 2019 | 2018 | 2017 |
| In millions of COP |
| Banking Colombia(1) | 108,861 | 20,036 | 33,889 |
| Banking Guatemala | 29,930 | 2,672 | 1,939 |
| Banking Panamá | 17,869 | 6,523 | 5,495 |
| Off Shore | 933 | (173) | (126) |
| All other segments | 792 | 812 | 1,418 |
| Brokerage | 1 | 13 | - |
| Banking El Salvador | (11,048) | (2,137) | 3,363 |
| Total | 147,338 | 27,746 | 46,078 |
| (1) | Corresponds to impairment of foreclosed assets. |
During 2019, 2018 and 2017 there were no significant cybersecurity breaches according to the data security policies established by the management.
NOTE 27. EARNING PER SHARE (‘EPS’)
Basic EPS is calculated by reducing the income from continuing operations by the amount of dividends declared in the current period for each class of stock and by the contractual amount of dividends that must be paid for the current period, considering the allocation of remaining earnings to common stock and participating securities to the extent that each security may share in earnings as if all of the earnings for the period had been distributed. EPS is determined by dividing the total earnings allocated to each security by the weighted average number of common shares outstanding.
Diluted EPS assumes the issuance of common shares for all dilutive potential common shares outstanding during the reporting period. The Bank has no dilutive potential common shares as of December 31, 2019, 2018 and 2017.
The following table summarizes information related to the computation of basic EPS for the years ended December 31, 2019, 2018 and 2017 (in millions of pesos, except per share data):
| | 2019 | 2018 | 2017 |
| Income from continuing operations before attribution of non-controlling interests | 3,214,567 | 2,786,435 | 2,754,173 |
| Less: Non-controlling interests from continuing operations | 97,216 | 127,571 | 139,173 |
| Net income from continuing operations | 3,117,351 | 2,658,864 | 2,615,000 |
| Less: Preferred dividends declared | 435,810 | 402,451 | 370,983 |
| Less: Allocation of undistributed earnings to preferred stockholders | 998,864 | 816,277 | 827,126 |
| Continuing operations | 998,864 | 816,277 | 827,126 |
| Net income allocated to common shareholders for basic and diluted EPS | 1,682,677 | 1,440,136 | 1,416,891 |
| Weighted average number of common shares outstanding used in basic EPS calculation (In millions) | 510 | 510 | 510 |
| Basic and Diluted earnings per share to common shareholders | 3,301 | 2,825 | 2,780 |
| From continuing operations | 3,301 | 2,825 | 2,780 |
NOTE 28. RELATED PARTY TRANSACTIONS
IAS 24 Related Party Disclosures requires that an entity discloses:
| (a) | Transactions with its related parties; and |
| (b) | Relationships between a parent and its subsidiaries irrespective of whether there have been transactions between them. |
Under IAS 24, an entity must disclose transactions with its related parties, outstanding balances, including commitments, recognized in the consolidated and separate financial statements of a parent or investors with joint control or significant influence over, an investee presented in accordance with IFRS 10.
Under this standard parties are considered to be related if one party has the ability to control the other party or exercise significant influence over the other party in making financial or operational decisions, or one other party controls both. This definition applies to the Bank in the cases below:
| · | Stockholders with ownership interest higher than 20% of the Bank’s capital: |
| − | Grupo de Inversiones Suramericana S.A. |
| − | Fondo Bancolombia ADR Program. |
| · | Members of Board of Directors and Senior Management, understood as the president and corporate Vice-presidents, as well as their close relatives (spouse and children) and the companies in which they have a participation of 10% or more of the Bank’s capital. |
| · | Associates and joint ventures for which the Bank provides commercial banking services and deposits. For these purposes all companies in which the Bank has significant influence (in all cases, the Bank has between 20% and 50% share of capital), have been included. |
The Parent Company provides banking and financial services to its related parties in order to satisfy their liquidity needs, and except for the intercompany merger agreement described below, these transactions are conducted on similar terms to third-party transactions and are not individually material.
Between the Parent Company and its related parties, during the periods ending at December 31, 2019, 2018 and 2017, there were no:
| − | Loans that for its contractual terms do not represent a lending transaction. |
| − | Loans with interest rates different to those that are ordinarily paid or charged to third parties in similar conditions of term, risk, etc. |
| − | No guarantees, pledges or commitments have been given or received in respect of the aforementioned transactions. |
As of December 31, 2019
| | Stockholders with an interest equal or higher than 20% of the Bank’s capital | Directors and senior management | Associates and joint ventures |
| In millions of COP |
| |
| Assets | | | |
| Investments | - | 235 | 2,374,338 |
| Loans and advances to customers and financial entities, net | 419,630 | 21,426 | 140,352 |
| Other assets | - | 182 | 43,488 |
| Total assets | 419,630 | 21,843 | 2,558,178 |
| | | | |
| Liabilities | | | |
| Deposits | 522,986 | 4,345 | 156,516 |
| Other liabilities | - | - | 33,705 |
| Total liabilities | 522,986 | 4,345 | 190,221 |
| | | | |
| Income | | | |
| Interest and other operating income | 6,505 | 231 | 10,830 |
| Dividends | - | - | 110,863 |
| Others | - | 19 | 350,004 |
| Net income | 6,505 | 250 | 471,697 |
| | | | |
| Expenses | | | |
| Interests and other operating expenses | 5,368 | 160 | 6,893 |
| Fees | - | 1,236 | 15,366 |
| Others | - | 130 | 6,837 |
| Total expenses | 5,368 | 1,526 | 29,096 |
As of December 31, 2018
| | Stockholders with an interest equal or higher than 20% of the Bank’s capital | Directors and senior management | Associates and joint ventures | |
| In millions of COP |
| | |
| Assets | | | | |
| Investments | - | 11 | 2,450,467 | |
| Loans and advances to customers and financial entities, net | 642,319 | 21,331 | 108,833 | |
| Assets held for sale and inventories, net | - | - | 19,128 | (1) |
| Other assets | - | - | 177,537 | (2) |
| Total assets | 642,319 | 21,342 | 2,755,965 | |
| | | | | |
| Liabilities | | | | |
| Deposits | 386,467 | 5,028 | 190,046 | |
| Other liabilities | - | - | 35,581 | |
| Total liabilities | 386,467 | 5,028 | 225,627 | |
| | | | | |
| Income | | | | |
| Interest and other operating income | 29,998 | 558 | 11,214 | |
| Dividends | - | - | 101,091 | (3) |
| Others | - | - | 41,985 | |
| Net income | 29,998 | 558 | 154,290 | |
| | | | | |
| Expenses | | | | |
| Interests and other operating expenses | 10,844 | 239 | 5,790 | |
| Fees | - | 1,145 | 3 | |
| Others | - | 54 | 80,312 | |
| Total expenses | 10,844 | 1,438 | 86,105 | |
| (1) | Investment classified as held for sale. See Note 12. Assets held for sale and Inventories. |
| (2) | This item includes portfolio purchase operation held between Bancolombia S.A. and Titularizadora Colombiana and the outstanding dividend on the preferred shares of the Compañía de Financiamiento TUYA S.A. |
| (3) | Includes dividend received for preferred shares in Compañía de Financiamiento TUYA S.A. |
As of December 31, 2017
| | Stockholders with an interest equal or higher than 20% of the Bank’s capital | Directors and senior management | Associates and joint ventures | |
| In millions of COP |
| | |
| Assets | | | | |
| Investments | - | - | 1,855,511 | |
| Loans and advances to customers and financial entities, net | 423,706 | 17,342 | 124,592 | |
| Assets held for sale and inventories | - | - | 18,413 | (1) |
| Other assets | - | 2 | 127,022 | (2) |
| Total assets | 423,706 | 17,344 | 2,125,538 | |
| | | | | |
| Liabilities | | | | |
| Deposits | 363,335 | 4,363 | 163,932 | |
| Other liabilities | - | 3 | 92 | |
| Total liabilities | 363,335 | 4,366 | 164,024 | |
| | | | | |
| Income | | | | |
| Interest and other operating income | 6,989 | 419 | 11,224 | |
| Dividends | - | - | 48,403 | |
| Others | - | - | 51,613 | |
| Net income | 6,989 | 419 | 111,240 | |
| | | | | |
| Expenses | | | | |
| Interest and other operating expenses | 5,603 | 269 | 20,139 | |
| Fees | - | 1,109 | 19 | |
| Others | - | 53 | 29,431 | |
| Total expenses | 5,603 | 1,431 | 49,589 | |
| (1) | Investment classified as held for sale. See Note 12. Assets held for sale and Inventories |
| (2) | This ítem includes portfolio purchase operation held between Bancolombia S.A. and Titularizadora Colombiana |
During the years ending December 31, 2019, 2018 and 2017, the Bank paid fees to the directors COP 1,236, COP 1,145 and COP 1,109, respectively, as compensation for attending meetings of Board and Support Committees (Audit Committee, etc.).
The Payments to senior management in the same periods were COP 16,488, COP 17,245, and COP 14,320 for short-term benefits, COP 439, COP 427 and COP 922 for long-term benefits COP 2,112, COP 590 and COP 460 for other payments for post – employemnet benefits, respectively.
The Parent company, which is also the ultimate parent company, is Bancolombia S.A. Transactions between companies included in consolidation Note 2.C.1 and the Parent company meet the definition of related party transactions and were eliminated from the consolidated financial statements.
Financial Conglomerate Operations
The following table shows the operations carried out in 2018 and 2017 on the related party chart of the Grupo Sura conglomerate:
| | December 31, 2019 | December 31, 2018 | December 31, 2017 | |
| In millions of COP |
| | |
| Assets | | | | |
| Investments(1) | 14,369 | 440,294 | 376,171 | |
| Loans and advances to customers and financial entities, net | 741,539 | 455,675 | 191,278 | |
| Other assets | 6,538 | 2 | 8 | |
| Total assets | 762,446 | 895,971 | 567,457 | |
| | | | | |
| Liabilities | | | | |
| Deposits | 1,238,376 | 1,347,005 | 1,015,523 | |
| Other liabilities | 1,379 | 5,818 | 1,882 | |
| Total liabilities | 1,239,755 | 1,352,823 | 1,017,405 | |
| | | | | |
| Income | | | | |
| Interest and other operating income | 732,089 | 602,831 | 488,190 | |
| Dividends | 33 | 14,909 | 15,021 | |
| Net income | 732,122 | 617,740 | 503,211 | |
| | | | | |
| Expenses | | | | |
| Interests and other operating expenses | 60,918 | 54,758 | 32,568 | |
| Fees | 540 | 2 | 4 | |
| Others | 35,636 | 3,025 | 4,788 | |
| Total expenses | 97,094 | 57,785 | 37,360 | |
| (1) | The variation compared to 2018 is mainly due to the sale of the investment in Sura Asset Management during 2019. |
NOTE 29. LIABILITIES FROM FINANCING ACTIVITIES
The following table presents the reconciliation of the balances of liabilities from financing activities as of December 31, 2019 and 2018:
| | Balance as of
January 1,
2019 | Cash flows | Non-cash changes | Balance as of
December 31,
2019 |
Foreign
currency
translation
adjustment | Interests
accrued | Other
movements |
| In millions of COP |
| Liabilities from financing activities |
| Repurchase agreements and other similar secured borrowing | 2,315,555 | (1,002,196) | 378 | - | - | 1,313,737 |
| Borrowings from other financial institutions(1) | 16,337,964 | (3,219,257) | 132,959 | 625,834 | 81,843 | 13,959,343 |
| Debt instruments in issue(1) | 20,287,233 | (1,657,913) | 127,387 | 1,164,808 | - | 19,921,515 |
| Preferred shares(2) | 583,997 | (57,701) | - | - | 57,908 | 584,204 |
| Total liabilities from financing activities | 39,524,749 | (5,937,067) | 260,724 | 1,790,642 | 139,751 | 35,778,799 |
| (1) | The cash flows disclosed in this table related with Borrowings from other financial institutions and Debt securities in issue include the interests paid during the year amounting to COP 594,851 and COP 1,181,131, respectively, which are classified as cash flows from operating activities in the consolidated statement of cash flow. |
| (2) | The cash flow amounting to COP 57,701 corresponds to the fixed minimum dividend paid to the preferred shares' holders and is included in the line "dividends paid" of the consolidated statement of cash flow, which includes the divideds paid during the year to both preferred and common shares holders. |
| | Balance as of
January 1,
2018 | Cash flows | Non-cash changes | Balance asof
December 31,
2018 |
Foreign
currency
translation
adjustment | Interests
accrued | Other
movements |
| In millions of COP |
| Liabilities from financing activities |
| Repurchase agreements and other similar secured borrowing | 3,236,128 | (922,840) | 2,267 | - | - | | 2,315,555 |
| Borrowings from other financial institutions(1) | 13,822,152 | 513,244 | 1,297,690 | 783,349 | (78,471) | (2) | 16,337,964 |
| Debt instruments in issue(1) | 19,648,714 | (1,697,698) | 1,255,806 | 961,903 | 118,508 | | 20,287,233 |
| Preferred shares(3) | 582,985 | (57,701) | - | - | 58,713 | | 583,997 |
| Total liabilities from financing activities | 37,289,979 | (2,164,995) | 2,555,763 | 1,745,252 | 98,750 | | 39,524,749 |
| (1) | The cash flows disclosed in this table related with Borrowings from other financial institutions and Debt securities in issue include the interests paid during the year amounting to COP 788,879 and COP 961,333, respectively, which are classified as cash flows from operating activities in the consolidated statement of cash flow. |
| (2) | The amount of COP (78,471) is mainly comprised by the decrease of the liabilities related to assets held for sale. |
| (3) | The cash flow amounting to COP 57,701 corresponds to the fixed minimum dividend paid to the preferred shares' holders and is included in the line "dividends paid" of the consolidated statement of cash flow, which includes the divideds paid during the year to both preferred and common shares holders. |
NOTE 30. FAIR VALUE OF ASSETS AND LIABILITIES
The following table presents the carrying amount and the fair value of the assets and liabilities as of December 31, 2019 and 2018:
| | December 31, 2019 | December 31, 2018 |
| Carrying amount | Fair Value | Carrying amount | Fair Value |
| In millions of COP |
| Assets | | | | |
| Debt instruments at fair value through profit or loss | 7,670,749 | 7,670,749 | 8,909,861 | 8,909,861 |
| Debt instruments at fair value through OCI | 3,904,857 | 3,904,857 | 3,329,738 | 3,329,738 |
| Debt instruments at amortized cost | 4,018,724 | 4,011,398 | 3,481,928 | 3,461,616 |
| Derivative financial instruments | 1,902,955 | 1,902,955 | 1,843,708 | 1,843,708 |
| Equity securities at fair value | 1,228,424 | 1,228,424 | 1,639,948 | 1,639,948 |
| Loans and advances to customers and financial institutions, net | 171,353,348 | 174,326,657 | 163,583,285 | 167,551,429 |
| Investment property | 1,992,964 | 1,992,964 | 1,732,873 | 1,732,873 |
| Investments in associates(1) | 1,249,818 | 1,249,818 | 1,119,973 | 1,119,973 |
| Total | 193,321,839 | 196,287,822 | 185,641,314 | 189,589,146 |
| | December 31, 2019 | December 31, 2018 |
| Carrying amount | Fair Value | Carrying amount | Fair Value |
| In millions of COP |
| Liabilities | | | | |
| Deposits by customers | 157,205,312 | 158,235,896 | 142,128,471 | 142,860,996 |
| Interbank deposits | 1,363,679 | 1,363,679 | 1,374,222 | 1,374,222 |
| Repurchase agreements and other similar secured borrowing | 1,313,737 | 1,313,737 | 2,315,555 | 2,315,555 |
| Derivative financial instruments | 1,860,812 | 1,860,812 | 1,295,070 | 1,295,070 |
| Borrowings from other financial institutions | 13,959,343 | 13,959,343 | 16,337,964 | 16,337,964 |
| Preferred shares | 584,204 | 673,564 | 583,997 | 602,597 |
| Debt instruments in issue | 19,921,515 | 20,966,755 | 20,287,233 | 20,759,456 |
| Total | 196,208,602 | 198,373,786 | 184,322,512 | 185,545,860 |
| (1) | It corresponds investments in associates P.A Viva Malls. See Note 8 Investments in associates and joint ventures |
IFRS 13 establishes a fair value hierarchy of valuation techniques based on whether the inputs to those valuation techniques are observable or unobservable, that reflects the significance of inputs adopted in the measurement process. In accordance with IFRS the financial instruments are classified as follows:
Level 1: Observable inputs that reflect quoted prices (unadjusted) in active markets for identical assets or liabilities. An active market is a market in which transactions for the asset or liability being measured take place with sufficient frequency and volume to provide pricing information on an ongoing basis.
Level 2: Inputs other than quoted prices included in Level 1 that are observable for the asset or liability either directly or indirectly. Level 2 generally includes: (i) quoted prices for similar assets or liabilities in active markets; (ii) quoted prices for identical or similar assets or liabilities in markets that are not active, that is, markets in which there are few transactions for the asset or liability.
Level 3: Unobservable inputs that are supported by little or no market activity and that are significant to the fair value of the assets or liabilities. Level 3 assets and liabilities include financial instruments whose value is determined using pricing models, discounted cash flow methodologies, or similar techniques, as well as instruments for which the determination of fair value requires significant management judgment or estimation. This category generally includes certain retained residual interests in securitizations, asset-backed securities (ABS) and highly structured or long-term derivative contracts where independent pricing information was not able to be obtained for a significant portion of the underlying assets.
| · | Valuation process for fair value measurements |
The valuation to fair value prices is performed using prices, methodologies and inputs provided by the official pricing services provider (Precia) to the Bank. All methodologies and procedures developed by the pricing services provider are supervised by the Financial Superintendence of Colombia, which has not objected to them.
On a daily basis, the back-office Service Valuation Officer (SVO) verifies the valuation of investments, and the Credit and Financial Risk Manager area reports the results of the portfolio’s valuation.
Fair value measurement
Assets and liabilities
a. Debt instruments
The Bank assigns prices to those debt investments, using the prices provided by the official pricing services provider (Precia) and assigns the appropriate level according to the procedure described above. For securities not traded or over-the-counter such as certain bonds issued by other financial institutions, the Bank generally determines fair value utilizing internal valuation and standard techniques. These techniques include determination of expected future cash flows which are discounted using curves of the applicable currencies and the Colombian consumer price index (interest rate in this case), modified by the credit risk and liquidity risk. The interest rate is generally computed using observable market data and reference yield curves derived from quoted interest in appropriate time bandings, which match the timings of the cash flows and maturities of the instruments.
b. Equity securities
The Bank performs the market price valuation of its investments in variable income using the prices provided by the official pricing services provider (Precia) and classifies those investments according to the procedure described above (Hierarchy of fair value section). Likewise, the fair value of unlisted equity securities is based on an assessment of each individual investment using methodologies that include publicly-traded comparables derived by multiplying a key performance metric (e.g., earnings before interest, taxes, depreciation and amortization) of the portfolio company by the relevant valuation multiple observed for comparable companies, acquisition comparables, and if necessary considered, are subject to appropriate discounts for lack of liquidity or marketability. Interests in investment funds, trusts and collective portfolios are valued using the investment unit value determined by the fund management company. For investment funds where the underlying assets are investment properties, the investment unit value depends on the investment properties value, determined as described below in “i. Investment property”.
c. Derivative financial instruments
The Bank holds positions in standardized derivatives, such as futures over local stocks, and over the representative exchange rate (TRM). These instruments are evaluated according to the information provided by Precia, which perfectly matches the information provided by the Central Counterparty Clearing House – CCP.
Additionally, the Bank holds positions in OTC derivatives, which in the absence of prices, are valued using the inputs and methodologies provided by the pricing services provider.
The key inputs depend upon the type of derivative and the nature of the underlying instrument and include interest rate yield curves, foreign exchange rates, the spot price of the underlying volatility, credit curves and correlation of such inputs.
d. Credit valuation adjustment
The Bank measures the effects of the credit risk of its counterparties and its own creditworthiness in determining fair value of the swap, option and forward derivatives.
Counterparty credit-risk adjustments are applied to derivatives when the Bank’s position is a derivative asset and the Bank’s credit risk is incorporated when the position is a derivative liability. The Bank attempts to mitigate credit risk to third parties which are international banks by entering into master netting agreements. The agreements allow to offset or bring net amounts that are liabilities, derivates from transactions carried out by the different agreements. Master netting agreements take different forms and may allow payments to be made under a variety of other master agreements or other negotiation agreements between the same parties; some may have a monthly basis and others only apply at the time the agreements are terminated.
When assessing the impact of credit exposure, only the net counterparty exposure is considered at risk, due to the offsetting of certain same-counterparty positions and the application of cash and other collateral.
The Bank generally calculates the asset’s credit risk adjustment for derivatives transacted with international financial institutions by incorporating indicative credit related pricing that is generally observable in the market (“CDS”). The credit-risk adjustment for derivatives transacted with non-public counterparties is calculated by incorporating unobservable credit data derived from internal credit qualifications to the financial institutions and corporate companies located in Colombia. The Bank also considers its own creditworthiness when determining the fair value of an instrument, including OTC derivative instruments if the Bank believes market participants would take that into account when transacting the respective instrument. The approach to measuring the impact of the Bank’s credit risk on an instrument transacted with international financial institutions is done using the asset swap curve calculated for subordinated bonds issued by the Bank in foreign currency. For derivatives transacted with local financial institutions, the Bank calculates the credit risk adjustment by incorporating credit risk data provided by rating agencies and released in the Colombian financial market.
e. Impaired loans measured at fair value
The Bank measured certain impaired loans based on the fair value of the associated collateral less costs to sell. The fair values were determined as follows using external and internal valuation techniques or third party experts, depending on the type of underlying asset.
For vehicles under leasing arrangements, the Bank uses an internal valuation model based on price curves for each type of vehicle. Such curves show the expected price of the vehicle at different points in time based on the initial price and projection of economic variables such as inflation, devaluation and customs. The prices modelled in the curves are compared every six months with market information for the same or similar vehicles and in the case of significant deviation; the curve is adjusted to reflect the market conditions.
Other vehicles are measured using matrix pricing from a third party. This matrix is used by most of the market participants and is updated monthly. The matrix is developed from values provided by several price providers for identical or similar vehicles and considers brand, characteristics of the vehicles, and manufacturing date among other variables to determine the prices.
For real estate assets, a third-party qualified appraiser is used. The methodologies vary depending on the date of the last appraisal available for the property (the appraisal is estimated based on either of three approaches: cost, sales comparison and income approach, and is required every three years). When the property has been valued in the last 12 months and the market conditions have not shown significant changes, the most recent valuation is considered the fair value of the property.
For all other cases (for example, appraisals older than 12 months) the value of the property is updated by adjusting the value in the last appraisal for weighted factors such as location, type and characteristics of the property, size, structural conditions and the expected sales prices, among others. The factors are determined based on current market information gathered from several external real estate specialists.
f. Assets held for sale measured at fair value less cost of sale
The Bank measures certain impaired foreclosed assets and premises and equipment held for sale based on fair value less costs to sell. The fair values were determined using external and internal valuation techniques, depending on the type of underlying asset. Those assets are comprised mainly of real estate properties for which the appraisal is conducted by experts considering factors such as the location, type and characteristics of the property, size, physical conditions and expected selling costs, among others. Likewise, in some cases the fair value is estimated considering comparable prices or promises of sale and offering prices from auctions process.
g. Mortgage-backed securities (“TIPS”) and Asset-Backed securities
The Bank invests in asset-backed securities for which underlying assets are mortgages and earnings under contracts issued by financial institutions and corporations, respectively. The Bank does not have a significant exposure to sub-prime securities. The asset-backed securities are denominated in local market TIPS and are classified as fair value through profit or loss. These asset-backed securities have different maturities and are generally classified by credit ratings.
Fair values were estimated using discounted cash flows models where the main key economic assumptions used are estimates of prepayment rates and resultant weighted average lives of the securitized mortgage portfolio, probability of default and interest rate curves. These items are classified as level 2 and level 3.
h. Investments in associates measured at fair value
The Bank recognizes its investment in PA Viva Malls as an associate at fair value. The estimated amount is provided by the fund manager as the variation of the units according to the units owned by the Fondo Colombia Inmobiliario. The associate’s assets are comprised of investment properties which are measured using the following techniques: comparable prices, discounted cash flows, replacement cost and direct capitalization. For further information about techniques methodologies and inputs used by the external party see “Quantitative Information about Level 3 Fair Value Measurements”.
i. Investment property
The Bank’s investment property is valued by external experts, who use valuation techniques based on comparable prices, direct capitalization, discounted cash flows and replacement costs.
Assets and liabilities measured at fair value on a recurring basis
The following table presents for each of the fair-value hierarchy levels the Bank’s assets and liabilities that are measured at fair value on a recurring basis at December 31, 2019 and 2018:
| Financial Assets |
| Type of instrument | December 31, 2019 | December 31, 2018 |
| Fair value hierarchy | Total fair
value | Fair value hierarchy | Total fair
value |
| Level 1 | Level 2 | Level 3 | Level 1 | Level 2 | Level 3 |
| In millions of COP |
| Investment securities |
| Debt instruments at fair value through profit or loss |
| Securities issued by the Colombian Government | 5,248,352 | 440,590 | - | 5,688,942 | 7,170,085 | 72,083 | - | 7,242,168 |
| Securities issued or secured by government entities | - | 71,792 | - | 71,792 | 24,588 | 12,851 | 6,407 | 43,846 |
| Securities issued by other financial institutions | 97,107 | 501,724 | 126,049 | 724,880 | 115,234 | 338,992 | 206,950 | 661,176 |
| Securities issued by foreign governments | 683,469 | 392,762 | - | 1,076,231 | 397,115 | 420,524 | - | 817,639 |
| Corporate bonds | 37,856 | 69,018 | 2,030 | 108,904 | 61,556 | 83,317 | 159 | 145,032 |
| Total debt instruments at fair value through profit or loss | 6,066,784 | 1,475,886 | 128,079 | 7,670,749 | 7,768,578 | 927,767 | 213,516 | 8,909,861 |
| Debt instruments at fair value through OCI | | | | | | | | |
| Securities issued by other financial institutions | 87,010 | 167,015 | - | 254,025 | - | 186,250 | - | 186,250 |
| Securities issued by foreign governments | 2,207,864 | 1,387,909 | - | 3,595,773 | 1,630,379 | 1,513,109 | - | 3,143,488 |
| Corporate bonds | 45,606 | 9,453 | - | 55,059 | - | - | - | - |
| Total debt instruments at fair value through OCI | 2,340,480 | 1,564,377 | - | 3,904,857 | 1,630,379 | 1,699,359 | - | 3,329,738 |
| Total debt instruments | 8,407,264 | 3,040,263 | 128,079 | 11,575,606 | 9,398,957 | 2,627,126 | 213,516 | 12,239,599 |
| Equity securities | | | | | | | | |
| Equity securities | 78,487 | 70,237 | 1,079,700 | 1,228,424 | 100,233 | 115 | 1,539,600 | 1,639,948 |
| Total equity securities | 78,487 | 70,237 | 1,079,700 | 1,228,424 | 100,233 | 115 | 1,539,600 | 1,639,948 |
| Derivative financial instruments |
| Forwards |
| Foreign exchange contracts | - | 479,407 | 235,958 | 715,365 | - | 96,426 | 197,919 | 294,345 |
| Equity contracts | - | 2,001 | 142 | 2,143 | - | 968 | 13 | 981 |
| Total forwards | - | 481,408 | 236,100 | 717,508 | - | 97,394 | 197,932 | 295,326 |
| Swaps |
| Foreign exchange contracts | - | 645,891 | 111,405 | 757,296 | - | 1,053,684 | 145,552 | 1,199,236 |
| Interest rate contracts | 4,571 | 311,928 | 56,054 | 372,553 | 2,935 | 198,697 | 51,296 | 252,928 |
| Total swaps | 4,571 | 957,819 | 167,459 | 1,129,849 | 2,935 | 1,252,381 | 196,848 | 1,452,164 |
| Options |
| Foreign exchange contracts | 144 | 8,537 | 46,917 | 55,598 | - | 6,707 | 89,511 | 96,218 |
| Total options | 144 | 8,537 | 46,917 | 55,598 | - | 6,707 | 89,511 | 96,218 |
| Total derivative financial instruments | 4,715 | 1,447,764 | 450,476 | 1,902,955 | 2,935 | 1,356,482 | 484,291 | 1,843,708 |
| Investment properties |
| Buildings | - | - | 1,724,720 | 1,724,720 | - | - | 1,483,594 | 1,483,594 |
| Lands | - | - | 268,244 | 268,244 | - | - | 249,279 | 249,279 |
| Total investment properties | - | - | 1,992,964 | 1,992,964 | - | - | 1,732,873 | 1,732,873 |
| Investment in associates |
| PA Viva Malls | - | - | 1,249,818 | 1,249,818 | - | - | 1,119,973 | 1,119,973 |
| Total investment in associates and joint ventures | - | - | 1,249,818 | 1,249,818 | - | - | 1,119,973 | 1,119,973 |
| Total | 8,490,466 | 4,558,264 | 4,901,037 | 17,949,767 | 9,502,125 | 3,983,723 | 5,090,253 | 18,576,101 |
| Financial liabilities |
| Type of instrument | December 31, 2019 | December 31, 2018 |
| Fair value hierarchy | Total fair
value | Fair value hierarchy | Total fair
value |
| Level 1 | Level 2 | Level 3 | Level 1 | Level 2 | Level 3 |
| In millions of COP |
| Derivative financial instruments | |
| Forwards | |
| Foreign exchange contracts | - | (658,776) | (109,239) | (768,015) | - | (242,844) | (56,171) | (299,015) |
| Equity contracts | - | (4,147) | (199) | (4,346) | - | (7,325) | (260) | (7,585) |
| Total forwards | - | (662,923) | (109,438) | (772,361) | - | (250,169) | (56,431) | (306,600) |
| Swaps | |
| Foreign exchange contracts | - | (642,206) | (10,404) | (652,610) | - | (654,093) | (46,810) | (700,903) |
| Interest rate contracts | (6,895) | (369,070) | (1,376) | (377,341) | (3,887) | (248,436) | (5,655) | (257,978) |
| Total swaps | (6,895) | (1,011,276) | (11,780) | (1,029,951) | (3,887) | (902,529) | (52,465) | (958,881) |
| Options | �� |
| Foreign exchange contracts | - | (58,500) | - | (58,500) | - | (29,589) | - | (29,589) |
| Total options | - | (58,500) | - | (58,500) | - | (29,589) | - | (29,589) |
| Total derivative financial instruments | (6,895) | (1,732,699) | (121,218) | (1,860,812) | (3,887) | (1,182,287) | (108,896) | (1,295,070) |
| Total | (6,895) | (1,732,699) | (121,218) | (1,860,812) | (3,887) | (1,182,287) | (108,896) | (1,295,070) |
Fair value of assets and liabilities that are not measured at fair value in the Statement of Financial Position
The following table presents for each of the fair-value hierarchy levels the Bank’s assets and liabilities that are not measured at fair value in the statement of financial position, but for which the fair value is disclosed at December 31, 2019 and 2018:
| Assets |
| Type of instrument | December 31, 2019 | December 31, 2018 |
| Fair value hierarchy | Total fair
value | Fair value hierarchy | Total fair
value |
| Level 1 | Level 2 | Level 3 | Level 1 | Level 2 | Level 3 |
| In millions of COP |
| Debt instruments | |
| Securities issued by the Colombian Government | 93,033 | - | - | 93,033 | 36,847 | 13,424 | - | 50,271 |
| Securities issued or secured by government entities | - | 345,239 | 1,452,231 | 1,797,470 | 17,744 | 386,396 | 1,449,333 | 1,853,473 |
| Securities issued by other financial institutions | 145,798 | - | 63,773 | 209,571 | 107,959 | 23,375 | 12,326 | 143,660 |
| Securities issued by foreign governments | 169,423 | 141,282 | - | 310,705 | 130,913 | 141,652 | - | 272,565 |
| Corporate bonds | 394,055 | 12,873 | 1,193,691 | 1,600,619 | 259,904 | 53,395 | 828,348 | 1,141,647 |
| Total – Debt instruments | 802,309 | 499,394 | 2,709,695 | 4,011,398 | 553,367 | 618,242 | 2,290,007 | 3,461,616 |
| Loans and advances to customers and financial institutions, net | - | - | 174,326,657 | 174,326,657 | - | - | 167,551,429 | 167,551,429 |
| Total | 802,309 | 499,394 | 177,036,352 | 178,338,055 | 553,367 | 618,242 | 169,841,436 | 171,013,045 |
| Liabilities |
| Type of instruments | December 31, 2019 | December 31, 2018 |
| Fair value hierarchy | Total fair
value | Fair value hierarchy | Total fair
value |
| Level 1 | Level 2 | Level 3 | Level 1 | Level 2 | Level 3 |
| In millions of COP |
| Deposits by customers | - | (33,655,920) | (124,579,976) | (158,235,896) | - | (30,490,414) | (112,370,582) | (142,860,996) |
| Interbank deposits | - | - | (1,363,679) | (1,363,679) | - | - | (1,374,222) | (1,374,222) |
| Repurchase agreements and other similar secured borrowing | - | - | (1,313,737) | (1,313,737) | - | - | (2,315,555) | (2,315,555) |
| Borrowings from other financial institutions | - | - | (13,959,343) | (13,959,343) | - | - | (16,337,964) | (16,337,964) |
| Preferred shares | - | - | (673,564) | (673,564) | - | - | (602,597) | (602,597) |
| Debt instruments in issue | (8,277,170) | (9,953,028) | (2,736,557) | (20,966,755) | (9,503,793) | (8,486,088) | (2,769,575) | (20,759,456) |
| Total | (8,277,170) | (43,608,948) | (144,626,856) | (196,512,974) | (9,503,793) | (38,976,502) | (135,770,495) | (184,250,790) |
IFRS requires entities to disclose the fair value of financial instruments, both assets and liabilities recognized and not recognized in the statement of financial position, for which it is practicable to estimate fair value. Certain categories of assets and liabilities, however, are not eligible for fair value accounting. The financial instruments below are not measured at fair value on a recurring and nonrecurring basis:
Short-term financial instruments
Short-term financial instruments are valued at their carrying amounts included in the consolidated statement of financial position, which are reasonable estimates of fair value due to the relatively short period to maturity of the instruments. This approach was used for cash and cash equivalents, accrued interest receivable, customers’ acceptances, accounts receivable, accounts payable, accrued interest payable and bank acceptances outstanding.
Deposits from customers
The fair value of time deposits was estimated based on the discounted value of cash flows using the appropriate discount rate for the applicable maturity. Fair value of deposits with no contractual maturities represents the amount payable on demand as of the statement of financial position date.
Interbank deposits and repurchase agreements and other similar secured borrowings
Short-term interbank borrowings and repurchase agreements have been valued at their carrying amounts because of their relatively short-term nature. Long-term and domestic development bank borrowings have also been valued at their carrying amount because they bear interest at variable rates.
Borrowings from other financial institutions
The fair value of borrowings from other financial institutions were determined using discounted cash flow models. The cash flows projection of capital and interest was made according to the contractual terms, considering capital amortization and interest bearing. Subsequently, the cash flows were discounted using reference curves formed by the weighted average of the Bank’s deposit rates.
Debt instruments in issue
The fair value of debt instruments in issue, comprised of bonds issued by Bancolombia S.A. and its subsidiaries, was estimated substantially based on quoted market prices. The fair value of certain bonds which do not have a public trading market, were determined based on the discounted value of cash flows using the rates currently offered for bonds of similar remaining maturities and the Bank’s creditworthiness.
Preferred shares
In the valuation of the liability component of preferred shares related to the minimum dividend of 1% of the subscription price, the Bank uses the Gordon Model to price the obligation, taking into account its own credit risk, which is measured using the market spread based on observable inputs such as quoted prices of sovereign debt. The Gordon Model is commonly used to determine the intrinsic value of a stock based on a future series of dividends that are estimated by the Bank and growth at a constant rate considering the Bank’s own perspectives of the payout ratio.
Loans and advances to customers and financial institutions
Estimating the fair value of loans and advances to customers is considered an area of considerable uncertainty as there is no observable market. The loan portfolio is stratified into tranches and loans segments suchs as commercial, small business loans, mortgage and consumer. The fair value of loans and advances to customers and financial institutions is determined using a discounted cash flow methodology, considering each credit’s principal and interest projected cash flows to the prepayment date. The projected cash flows are discounted using reference curves according to the type of loan and its maturity date.
Items Measured at fair value on a non-recurring basis
The Bank measures assets held for sale based on fair value less costs to sell. This category includes certain foreclosed assets and investments in associates held for sale. The fair values were determined using external and internal valuation techniques or third party experts, depending on the type of underlying asset. The following breakdown sets forth the fair value hierarchy of those assets classified by type:
| | December 31, 2019 | December 31, 2018 |
| Fair-value hierarchy | Total fair Value | Fair-value hierarchy | Total fair Value |
| Level 1 | Level 2 | Level 3 | Level 1 | Level 2 | Level 3 |
| In millions of COP |
| Machinery and equipment | - | - | 4,799 | 4,799 | - | - | 5,556 | 5,556 |
| Real estate for residential purposes | - | - | 112,789 | 112,789 | - | - | 92,052 | 92,052 |
| Real estate different from residential properties | - | - | 6,807 | 6,807 | - | - | 24,076 | 24,076 |
| Total | - | - | 124,395 | 124,395 | - | - | 121,684 | 121,684 |
Changes in Level 3 Fair-Value Category
The table below presents reconciliation for all assets and liabilities measured at fair value on a recurring basis using significant unobservable inputs (Level 3) during 2019 and 2018:
As of December 31, 2019
| | Balance,
January 1,
2019 | Included
in
earnings | OCI | Purchases | Settlement | Reclassifications(1) | Transfers
in to
Level 3 | Transfers
out of
Level 3 | Balance,
December 31,
2019 |
| In millions of COP |
| Assets | | | | | | | | | |
| Debt instruments at fair value though profit or loss | | | | | | | | | |
| Securities issued or secured by Government entities | 6,407 | 19 | - | - | (6,426) | - | - | - | - |
| Securities issued or secured by other financial entities | 206,950 | (27,912) | - | - | (16,606) | - | 4,746 | (41,129) | 126,049 |
| Corporate bonds | 159 | - | - | - | (159) | - | 2,030 | - | 2,030 |
| Total | 213,516 | (27,893) | - | - | (23,191) | - | 6,776 | (41,129) | 128,079 |
| Derivative financial instruments | | | | | | | | | |
| Foreign exchange contracts | 432,982 | (9,939) | - | 267,452 | (291,571) | 1,507 | 599 | (6,750) | 394,280 |
| Interest rate contracts | 51,296 | 15,213 | - | 11,968 | (5,210) | (4,992) | 11,893 | (24,114) | 56,054 |
| Equity contracts | 13 | - | - | 142 | (13) | - | - | - | 142 |
| Total | 484,291 | 5,274 | - | 279,562 | (296,794) | (3,485) | 12,492 | (30,864) | 450,476 |
| Equity securities | | | | | | | | | |
| Equity securities | 1,539,600 | 148,269 | (3,436) | 8,298 | (613,031) | - | - | - | 1,079,700 |
| Total | 1,539,600 | 148,269 | (3,436) | 8,298 | (613,031) | - | - | - | 1,079,700 |
| Investment in associates | | | | | | | | | |
| PA Viva Malls(2) | 1,119,973 | 66,888 | - | - | - | - | - | - | 1,249,818 |
| Total | 1,119,973 | 66,888 | - | - | - | - | - | - | 1,249,818 |
| Total Assets | 3,357,380 | 192,538 | (3,436) | 287,860 | (933,016) | (3,485) | 19,268 | (71,993) | 2,908,073 |
| Liabilities | | | | | | | | | |
| Derivative financial instruments | | | | | | | | | |
| Foreign exchange contracts | (102,981) | (292) | - | (113,046) | 55,956 | (1,507) | (5,792) | 48,019 | (119,643) |
| Interest rate contracts | (5,655) | 14 | - | (1,374) | 330 | 4,992 | - | 317 | (1,376) |
| Equity contracts | (260) | | | (199) | 260 | | | | (199) |
| Total | (108,896) | (278) | | (114,619) | 56,546 | 3,485 | (5,792) | 48,336 | (121,218) |
| Total liabilities | (108,896) | (278) | | (114,619) | 56,546 | 3,485 | (5,792) | 48,336 | (121,218) |
| (1) | From derivative assets to derivative liabilities classified in level 3 and viceversa. |
| (2) | The amount of COP 66,888 differs from the COP 138,100 presented as "included in earnings" in the Note 8 Investments in associates and joint ventures, due to the recognition of a contingent consideration. |
As of December 31, 2018
| | Balance,
January 1,
2018 | Included
in
earnings | OCI | Purchases | Settlement | Reclassifications(1) | Transfers
in to
Level 3 | Transfers
out of
Level 3 | Balance,
December 31,
2018 |
| In millions of COP |
| Debt instruments at fair value though profit or loss | | | | | | | | | |
| Securities issued or secured by Government entities | - | 53 | - | 1,383 | - | - | 4,971 | - | 6,407 |
| Securities issued or secured by other financial entities | 297,049 | (54,595) | - | 29,149 | (64,014) | - | 5,394 | (6,033) | 206,950 |
| Corporate bonds | 3,118 | (3,983) | - | 4,159 | (2,518) | - | - | (617) | 159 |
| Total | 300,167 | (58,525) | - | 34,691 | (66,532) | - | 10,365 | (6,650) | 213,516 |
| Derivative financial instruments | | | | | | | | | |
| Foreign exchange contracts | 298,598 | 20,691 | - | 286,371 | (132,824) | 2,574 | 10,418 | (52,846) | 432,982 |
| Interest rate contracts | 45,939 | (11,538) | - | 17,549 | (10,705) | (117) | 20,638 | (10,470) | 51,296 |
| Equity contracts | 15 | - | - | 13 | (15) | - | - | - | 13 |
| Total | 344,552 | 9,153 | - | 303,933 | (143,544) | 2,457 | 31,056 | (63,316) | 484,291 |
| Equity securities | | | | | | | | | |
| Equity securities | 1,343,604 | 131,446 | 38,648 | 41,459 | (15,557) | - | - | - | 1,539,600 |
| Total | 1,343,604 | 131,446 | 38,648 | 41,459 | (15,557) | - | - | - | 1,539,600 |
| Investment in associates | | | | | | | | | |
| PA Viva Malls | 757,886 | 87,136 | - | 274,951 | - | - | - | - | 1,119,973 |
| Total | 757,886 | 87,136 | - | 274,951 | - | - | - | - | 1,119,973 |
| Equity securities - Assets held for sale | | | | | | | | | |
| Assets held for sale | 2,486 | - | - | - | (2,486) | - | - | - | - |
| Total | 2,486 | - | - | - | (2,486) | - | - | - | - |
| Total Assets | 2,748,695 | 169,210 | 38,648 | 655,034 | (228,119) | 2,457 | 41,421 | (69,966) | 3,357,380 |
| Liabilities | | | | | | | | | |
| Derivative financial instruments | | | | | | | | | |
| Foreign exchange contracts | (66,586) | 4,326 | - | (55,502) | 24,933 | (2,574) | (51,316) | 43,738 | (102,981) |
| Interest rate contracts | (13,634) | (1,782) | - | 12 | 1,553 | 117 | (1,532) | 9,611 | (5,655) |
| Equity contracts | (515) | - | - | (260) | 515 | - | - | - | (260) |
| Total | (80,735) | 2,544 | - | (55,750) | 27,001 | (2,457) | (52,848) | 53,349 | (108,896) |
| Total liabilities | (80,735) | 2,544 | - | (55,750) | 27,001 | (2,457) | (52,848) | 53,349 | (108,896) |
| (1) | From derivative assets to derivative liabilities classified in level 3 and viceversa. |
Level 3 fair value rollforward
The following were the significant Level 3 transfers for the period December 31, 2018 to 2019:
Transfer of COP 6,700 and COP (21,792) in 2019 and 2018 respectively, from Level 2 to Level 3 of the derivative foreign exchange contracts and Interest rate contracts, was presented due to the transfer of the credit risk from the Bank to the credit risk of the counterparty.
As of December 31, 2019 and 2018, unrealized gains and losses on debt instruments were COP (26,820) and COP 58,736; Equity Securities COP 152,801 and COP 130,453, respectively.
Transfers between Level 1 and Level 2 of the Fair Value Hierarchy
The table below presents the transfers for all assets and liabilities measured at fair value on a recurring basis between Level 1 and Level 2 as of December 31, 2019 and 2018:
| | December 31, 2019 | December 31, 2018 |
Transfers Level 1
to Level 2 | Transfers Level 2
to Level 1 | Transfers Level 1
to Level 2 | Transfers Level 2
to Level 1 |
| Debt instruments at fair value though profit or loss | | | | |
| Securities issued or secured by other financial entities | 2,577 | - | - | - |
| Securities issued or secured by Foreign Government | - | 84 | 199,224 | - |
| Total | 2,577 | 84 | 199,224 | - |
| Debt instruments at fair value through OCI | | | | |
| Securities issued or secured by Foreign Government | - | 287,939 | 627,395 | - |
| Total | - | 287,939 | 627,395 | - |
| Equity securities | | | | |
| Equity securities | 72,423 | - | - | - |
| Total | 72,423 | - | - | - |
During the years ended December 31, 2019 and 2018, the Bank transferred securities from Level 1 to Level 2 primarily, because such securities had lower liquidity and lower traded in an active market.
All transfers are assumed to occur at the end of the reporting period.
Quantitative Information about Level 3 Fair Value Measurements
The fair value of financial instruments is, in certain circumstances, measured using valuation techniques that incorporate assumptions that are not evidenced by prices from observable market transactions in the same instrument and are not based on observable market data. Changing one or more of the inputs to the valuation models to reasonably possible alternative assumptions would change the fair values and therefore a valuation adjustment would be recognized in profit or loss. Favorable and unfavorable changes are determined on the basis of changes in the value of the instrument as a result of varying the levels of the unobservable input as described in the table below. The following table sets forth information about significant unobservable inputs related to the Bank’s material categories of Level 3 financial assets and liabilities and the sensitivity of these fair values to reasonably possible alternative assumptions.
As of December 31, 2019
| Financial instrument | Fair Value | Valuation technique | Significant
unobservable
input | Range of inputs | Weighted
average | Sensitivity
100
basis point
increase | Sensitivity
100
basis point
decrease |
| Amounts in millions of COP |
| Debt instruments |
| Securities issued by other financial institutions |
| TIPS | | Discounted cash flow | Yield | 0.48% to 6.41% | 3.24% | 90,111 | 92,906 |
| 91,671 | Liquidity risk | Price | n/a | n/a | n/a |
| | Prepayment Speed | n/a | n/a | 93,882 | 91,278 |
| Other bonds | 34,378 | Discounted cash flow | Yield | 0.81% to 1.06% | 0.92% | 33,364 | 35,448 |
| Liquidity risk | 2.81% to 3.88% | 3.21% | 33,107 | 35,135 |
| Securities issued by other financial institutions | 126,049 | | | | | | |
| Corporate bonds | | | | | |
| Corporate bonds | 2,030 | Discounted cash flow | Yield | 0.51% | 0.51% | 2,005 | 2,063 |
| Total debt instruments | 128,079 | | | | | | |
| Equity securities | | | | | | | |
| Equity securities | 1,079,700 | Price-based | Price | n/a | n/a | n/a | n/a |
| Derivative financial instruments | | | | | | | |
| Swaps | 155,679 | Discounted cash flow | Credit spread | 0% to 40% | 5.52% | 150,683 | 149,630 |
| Forward | 126,662 | Discounted cash flow | Credit spread | 0% to 19.8% | 3.73% | 126,289 | 127,036 |
| Options | 46,917 | Black-Scholes | Credit spread | 0% to 32% | 83.00% | 46,561 | 47,134 |
| Total derivative financial instruments | 329,258 | | | | | | |
| Investment in associates | | | | | | | |
| P.A Viva Malls | 1,249,818 | Price-based | Price | n/a | n/a | n/a | n/a |
As of December 31, 2018
| Financial instrument | Fair Value | Valuation technique | Significant unobservable input | Range of inputs | Weighted average | Sensitivity 100 basis point increase | Sensitivity 100 basis point decrease |
| In millions of COP |
| Debt instruments |
| Securities issued by other financial institutions |
| TIPS | | Discounted cash flow | Yield | 0.16% to 0.90% | 0.69% | 160,056 | 168,000 |
| 164,401 | Liquidity risk | 0% to 9.38% | 3.58% | 160,162 | 167,881 |
| | Prepayment Speed | n/a | n/a | 164,102 | 163,602 |
| Other bonds | 34,961 | Discounted cash flow | Yield | 0.14% to 0.89% | 0.60% | 33,700 | 36,299 |
| Liquidity risk | 2.80% to 3.48% | 3.04% | 33,142 | 35,678 |
| Securitizations | 5,394 | Discounted cash flow | Yield | 2.04% | 2.04% | 5,376 | 5,421 |
| Multilateral bonds | 2,194 | Discounted cash flow | Yield | (0.05%) | (0.05%) | 2,187 | 2,197 |
| Securities issued by other financial institutions | 206,950 | | | | | | |
| Securities issued by foreign governments | | | | | |
| Governments bonds | 6,407 | Discounted cash flow | Yield | 0.32% | 0.32% | 6,406 | 6,413 |
| Securities issued by foreign governments | 6,407 | | | | | | |
| Corporate bonds | 159 | Discounted cash flow | Yield | 0.27% | 0.27% | 159 | 160 |
| Total debt instruments | 213,516 | | | | | | |
| Equity securities | | | | | | | |
| Equity securities | 1,539,600 | Price-based | Price | n/a | n/a | n/a | n/a |
| Derivative financial instruments | | | | | | | |
| Options | 141,501 | Black-Scholes | Credit spread | 0% to 21.55% | 2.96% | 140,844 | 155,113 |
| Forward | 144,383 | Discounted cash flow | Credit spread | 0% to 54.30% | 2.58% | 139,506 | 136,941 |
| Swaps | 89,511 | Discounted cash flow | Credit spread | 0% to 18.81% | 0.77% | 88,834 | 89,876 |
| Total derivate financial instruments | 375,395 | | | | | | |
| Investment in associates | | | | | | | |
| P.A Viva Malls | 1,119,973 | Price-based | Price | n/a | n/a | n/a | n/a |
The following table sets forth information about valuation techniques used in the measurement of the fair value investment properties of the Bank, the significant unobservable inputs and the respective sensivity:
| Methodology | Valuation technique | Significant unobservable input | Description of sensitivity |
Sales Comparison Approach – SCA The fair value assessment is based on the examination of prices at which similar properties in the same area recently sold. Since no two properties are identical the measurement valuation must take into account adjustments for the differences between the sold properties and those held by the Bank to earn rentals or for capital appreciation. | Comparable Prices | The weighted average rates used in the capitalization methodology for revenues for 2018 are: • Direct capitalization: initial rate 8.05% • Discounted cash flow: discount rate: 11.19%, terminal rate: 8.33%. The same weighted rates at December 31, 2019 were: • Direct capitalization: initial rate 8.06% • Discounted cash flow: discount rate: 11.17%, terminal rate: 8.25%. The ratio between monthly gross income and real estate value (rental rate) considering the differences in placements and individual factors between properties and in a weighted way is 0.76% for 2018 and 0.71% for 2019. | An increase (Light, normal, considerable, significant) in the capitalization rate used would generate a decrease (significant, considerable, normal, light) in the fair value of the asset, and vice versa. An increase (Light, normal, considerable, significant) in the leases used in the valuation would generate a (significant, light, considerable) increase in the fair value of the asset, and vice versa. |
Income Approach Used to estimate the fair value of the property by taking future net cash flows and discounting them at the capitalization rate. | Direct Capitalization Discounted Cash Flows |
Cost approach Used to estimate the fair value of the property considering the cost to replace or build a property at the same or equal conditions of the asset to be measured, deducting the accumulated depreciation charge and adding-up the amount of the land. | Replacement cost |
There has been no change to the valuation technique during the year for each asset.
NOTE 31. RISK MANAGEMENT
The Bank’s comprehensive risk management is developed in compliance with current regulations and internal standards as defined by the Board of Directors, in relation to market, credit/ counterparty, liquidity and operational risk. This management is strengthened with the three lines of defense model, with a cohesive and coordinated approach, in which its independence is guaranteed. Within the Corporate Governance Framework, the roles of the responsible areas in each line are defined, according to the level of responsibility in Grupo Bancolombia, in order to guarantee effective and efficient coordination among them for risk management (in its different stages) and internal control.
First line of defense: is the owner of risks and its management, focused on self-control. Performs the commercial and operational management and the administration of controls; including the implementation of actions that ensure processes compliance for risk management.
Second line of defense: supports the construction and monitoring of the controls from the first line of defense; performs a transversal management of risks, assisting the areas of Grupo Bancolombia in the definition of mitigation actions and in the monitoring of the exposure; In addition, it is responsible for consolidating the risk information in order to perform the accountability to the governance structures and senior management as appropriate.
Specifically, the Board of Directors reviews and approves the resources, structure and processes of the Bank associated with risk management; in addition, it evaluates, through periodic reports from the administration, the levels of exposure to the different risks, their impact and the mitigation strategies, in accordance with the functions established in the current regulation and the Corporate Governance Code regarding the risk management. For the development of its supervisory functions has the support of the Risk Committee in charge of the approval, monitoring and control of policies, methodologies, tools, guidelines and strategies for the identification, measurement, control and mitigation of risks. According to the corporate guidelines, the Risk Committee has the participation of members from the Board of Directors.
The main function of the Corporate Risk Vicepresidency is to design and propose risk management strategies to the Board of Directors and Senior Management, lead its execution and define the risk appetite, in such a way as to ensure alignment with the corporate strategy of the Group. In addition, it defines the risk guidelines in policies, methodologies and tools for the Group.
The Risk Corporate Vicepresidency professionals manage the different risks inherent to the activities undertaken in the fulfillment of their responsibilities.
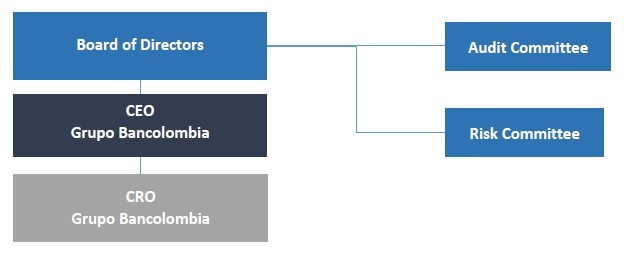
Third line of defense: Review the first two lines of defense, through a risk-based approach, guaranteeing governance effectiveness, risk management and internal control. It provides the Governance structures and senior management with an adequate, independent and objective assurance of compliance within the organization.
Specifically, the Internal Audit periodically evaluates the execution of the processes and the application of the methodologies for measurement and control of risks that support the operations carried out by the entity, in accordance with current regulations and internal regulations defined by the Board of Directors and Senior Management.
31.1 Credit risk
Credit risk is the risk of an economic loss to the Bank due to a non-fulfillment of financial obligations by a customer or counterparty and arises principally from the decline on borrower´s creditworthiness or changes in the business climate. Credit risk is the single largest risk for the Bank's business; the Bank manages its exposure to credit risk.
The information below contains the maximum exposure to credit risk:
December 31, 2019
| Maximum exposure to credit risk - Financial instruments subject to impairment |
| In millions of COP |
| | Stage 1 | Stage 2 | Stage 3 | Total |
| Loans and Advances | 159,769,601 | 10,000,338 | 12,512,804 | 182,282,743 |
| Commercial | 80,068,756 | 4,763,023 | 7,936,774 | 92,768,553 |
| Consumer | 35,957,631 | 1,969,289 | 1,773,750 | 39,700,670 |
| Mortgage | 21,584,674 | 1,340,380 | 1,058,229 | 23,983,283 |
| Small Business Loans | 1,088,656 | 70,219 | 120,533 | 1,279,408 |
| Financial Leases | 21,069,884 | 1,857,427 | 1,623,518 | 24,550,829 |
| Off-Balance Sheet Exposures | 41,082,637 | 323,225 | 311,633 | 41,717,495 |
| Financial Guarantees | 5,176,418 | 13,603 | 516 | 5,190,537 |
| Loan Commitments | 35,906,219 | 309,622 | 311,117 | 36,526,958 |
| Loss Allowance | (2,130,787) | (1,552,470) | (7,394,468) | (11,077,725) |
| Total | 198,721,451 | 8,771,093 | 5,429,969 | 212,922,513 |
December 31, 2018
| Maximum exposure to credit risk - Financial instruments subject to impairment |
| In millions of COP |
| | Stage 1 | Stage 2 | Stage 3 | Total |
| Loans and Advances | 153,894,099 | 7,712,055 | 12,212,962 | 173,819,116 |
| Commercial | 83,632,770 | 3,214,860 | 7,753,018 | 94,600,648 |
| Consumer | 28,666,461 | 1,758,162 | 1,568,758 | 31,993,381 |
| Mortgage | 20,280,416 | 1,513,063 | 1,077,206 | 22,870,685 |
| Small Business Loans | 958,491 | 80,805 | 116,902 | 1,156,198 |
| Financial Leases | 20,355,961 | 1,145,165 | 1,697,078 | 23,198,204 |
| Off-Balance Sheet Exposures | 38,831,993 | 349,228 | 354,525 | 39,535,746 |
| Financial Guarantees | 5,641,482 | 18,340 | 1,839 | 5,661,661 |
| Loan Commitments | 33,190,511 | 330,888 | 352,686 | 33,874,085 |
| Loss Allowance | (1,872,529) | (1,246,444) | (7,244,517) | (10,363,490) |
| Total | 190,853,563 | 6,814,839 | 5,322,970 | 202,991,372 |
| Maximum Exposure to Credit Risk - Other Financial Instruments |
| | Maximum Exposure | Collateral * | Net Exposure |
| | 2019 | 2018 | 2019 | 2018 | 2019 | 2018 |
| Maximum Exposure to Credit Risk |
| Debt instruments | 15,614,134 | 15,745,530 | (974,436) | (2,352,276) | 14,639,698 | 13,393,254 |
| Derivatives ** | 549,836 | 894,001 | (63) | (97) | 549,773 | 893,905 |
| Equity | 1,228,423 | 1,639,949 | - | - | 1,228,423 | 1,639,949 |
| Total | 17,392,393 | 18,279,480 | (974,499) | (2,352,373) | 16,417,894 | 15,927,108 |
See Notes on this table:
* Collateral Held (-) and Collateral Pledged (+)
**Exposure in Derivatives with base in MTM (only positive values), netting by counterparty is applied
* Debt instruments Book value 100%
* Equity Instruments:
- Shares:100%
- Investment funds: Book value 100%
Maximum exposure to credit risk of the loans and advances refers to the carrying amount at the end of the period. It does not take into account any collateral received or any other credit risk mitigates.
Maximum exposure to credit risk of financial guarantees corresponds to the total amount guaranteed at the end of the period. It does not take into account any collateral received or any other credit risk mitigates.
Maximum exposure to derivatives refers to the fair value at the end of the period, without considering any guarantee received or any other credit risk mitigates.
Maximum exposure to credit risk of debt instruments and equity securities refers to the carrying amount at the end of the period without considering any guarantee received.
| a. | Credit Risk Management - Loans and Advances |
Risk management during the credit life cycle is developed through the fulfillment of the policies, procedures and methodologies stipulated in the Credit Risk Administration System, in accordance with the strategy approved by the Board of Directors for monitoring and controlling credit risk.
The Credit Risk Administration System also contains the general criteria to evaluate, classify, measure and mitigate credit risk. In addition, the credit risk department has developed methodologies and manuals that specify the policies and procedures for different products and segments managed by the Bank.
To maintain credit quality and manage the risk arising from its lending activities, the Bank has established general loan policies, including the following:
| · | Credit exposure limits:It contains guidelines with regards to the establishment of credit exposure limits. It is set in fulfillment of legal requirements and according to the Bank’s internal guidelines. |
| · | Origination policies:These policies aim to acquire ample and sufficient knowledge of the characteristics of potential borrowers and to select them properly. The riskiness of the borrowers is determined using credit rating models. These models use information such as the credit history of the borrower, the type of business the borrower engages in, the borrower’s ability to repay the loan, and information received from the credit risk bureaus. Loan applications, depending on their amount and risk level, are presented for approval at the level of management authority required. |
| · | Collaterals policies:For the purpose of mitigating risk associated with non-fulfillment of obligations agreed upon by the borrower, the Bank has established policies for the valuation of collateral received as well as for the determination of the maximum loan amount that can be granted against the value of the collateral. |
| · | Allowance policies:the objective of this policy is to fulfil legal requirements and the Bank’s business policies. In addition, this policy is meant to provide the guidelines to perform client’s status analysis and take the necessary actions in order to mitigate credit risk the Bank is exposed to. For further information please see Note 2. |
| · | Monitoring policies:Contains various monitoring procedures, portfolio reports and policies for the purpose of overseeing, in an adequate and timely manner, the evolution of credit risk. These procedures include a continuous process of classification and reassessment of credit operations and they maintain consistency with the policies implemented for granting loans. |
| · | Portfolio recovery policies:Through the definition of these policies, the Bank aims to establish those mechanisms that allow it to anticipate the action to be taken in the event of possible delays and minimize the impact resulting from non-fulfillment of payment or delays by the borrower. Additionally, the aspects established in this policy delimit what the Bank has defined as collection management and that make it possible to obtain information to improve the origination policies and the allowances for loans and advances and lease losses models. |
Management of credit risk is carried out in all of the credit life cycle. These processes are defined in the following way:
| · | Origination:Knowing the borrower, payment capacity analysis, payment behavior and credit approval and structure. |
| · | Monitoring:Knowing the borrower’s situation during the life of the credit. |
| · | Recovery:Collection management during the different stages of the same credit. |
In order to support the credit origination processes, the Bank develops scoring and rating models based on statistical information or criteria from experts, which differentiate the risk levels of potential borrowers in order to support the decision-making process.
The Risk Corporate Vice Presidency is in charge of defining and documenting the specific characteristics of the models being utilized, as well as the parameters, variables to use in each case and the cut-off points that are applied per situation in the process of issuing credit. On an annual basis at the minimum, the Risk Corporate Vice Presidency must perform backtesting2 of the scoring and rating models used in the granting process in order to evaluate their effectiveness. Additionally, on a periodically basis, the entire credit portfolio will be rated taking into account the established internal models for the purpose of evaluating the credit risk of each borrower and constitute the required allowance for loans and advances and lease losses.
In addition to the evaluation and qualification of the portfolio, the monthly allowance for loans and advances and lease losses serves to measure the present condition of the portfolio and the methodologies used for its calculation serve as a tool to evaluate risk, be it in a collective or individual manner. Collective evaluation of the portfolio applies the following parameters for measuring risk: probability of default (PD), loss given default (LGD) and exposure at default (EAD). For further details please see Note 2 Significant Accounting Policies, section 7.4.5 Impairment of financial assets at amortized cost.
For the evaluation of individual risk, parameters such as recovery rates estimated by score sheets that include financial, behavioral information, collaterals and qualitative variables, serve as elements for measuring risk and defining an allowance for loans and advances and lease losses for that borrower.
Annual backtesting must be performed on the allowances for loans and advances and lease losses models for the purpose of maintaining suitable hedge levels in accordance with the Bank’s risk appetite.
The Bank is continuously monitoring the concentration of the risk groups, as well as carrying out a daily control of the exposure to different economic groups, evaluating the legal limits of indebtedness in order to fulfill the norms established about the concentration limits.
The Bank performs international references determined by the rankings of external risks that allow the analysis of concentration levels in different geographic areas. On the other hand, at the legal level, the Bank is governed by the concepts and methodologies established by the external norms regarding the construction, administration and control of the concentration of economic groups.
The following classifications are established for the analysis of concentration:
| · | By country: based on the country that the loans were originated. |
| · | By sector:according to the sectorial sub-segmentation defined by the Bank based mainly on the code CIIU1. |
| · | By categories:according to the portfolio category of each agreement (commercial, financial leases, consumer loans, small business loans and mortgages). |
2 CIIU: International Standard Industrial Classification of All Economic Activities.
| · | By economic group:according to the characteristics of economic groups as established by regulations. |
| · | By maturity:according with the remaining term to loan maturity. |
| · | By past due days:this concentration evaluates loans that are more than one month overdue. |
| b. | Credit Quality Analysis - Loans and Financial Leases |
Rating System for Credit Risk Management
Its principal aim is to determine the risk profile of the borrower, which is obtained through a rating.
The rating for corporate loans is assigned principally based on the analysis of the interrelation of both qualitative and quantitative elements that can affect the fulfillment of the financial commitments acquired by a borrower. They take information on the financial statements, profit and loss statement, historical payment behavior both with the Bank and with other entities, and qualitative information on variables that are not explicit in the financial statements. The rating model is applied at the origination of the loan and is updated by a central qualification office to undertake a periodical evaluation of the loan portfolio, during the months of May and November each year. In 2019, a new rating model for SME portfolio in Colombia was implemented, using a random forest methodology, these are mathematical models which allows to use a greater number of variables related to the client, and have more precise rating consistent with the level of risk. These methodologies have a fundamental role in the evaluation and monitoring of credit risk.
In the case of a retail customer, granting and behavior scoring models are used in order to identify the level of risk associated with the borrower. These models include information such as personal details, financial information, historical behavior, the total number of credit products and external information from credit bureaus. In 2019, a new rating system for the consumer portfolio in Colombia and Panama was implemented, using Random Forest methodology, these are mathematical models which allows to use a greater number of variables related to the client, and have more precise rating consistent with the level of risk. These methodologies have a fundamental role in the evaluation and monitoring of credit risk.
Description of Loans and Financial Leases
In order to evaluate and manage credit risk, the credits and financial leasing operations have been classified as:
| · | Commercial and Financial Leases: |
Loans granted to individuals or companies in order to carry out organized economic activities and are not classified as small business loans.
The borrowers in this portfolio are mainly made up of companies, segmented in homogenous groups that are constituted according to size, annual sales or main activity. The following variables are part of this classification:
| Segment | Incomes/Sales |
| Corporate | Companies with annual sales >= COP 100,000 M. Banistmo places borrowers with annual sales >= USD 10 M. Banco Agrícola and BAM place borrowers with annual sales >= USD 25 M. |
| Business | Companies with annual sales > = COP 13,000 M and < COP 100,000 M except for Banco Agrícola and BAM, which place borrowers with annual sales >= USD 5 M and < USD 25 M. |
| Business Construction | Constructors who dedicate themselves professionally to the construction of buildings to be sold or rented as their main activity, with annual sales >= COP 20,000 M and <= COP 45,000 M. They must have more than 3 projects executed as previous experience. |
| Corporate Construction | Constructors who dedicate themselves to the construction of buildings to be sold or rented as their main activity, with annual sales > COP 45,000 M. They must have more than 3 projects executed as previous experience. |
| SME Construction | Constructors who dedicate themselves professionally to the construction of buildings to be sold or rented as their main activity with annual sales >= COP 380 M and <= COP 20,000 M. They must have more than 3 projects executed as previous experience. |
| Institutional Financing | Financial sector institutions. |
| Government | Municipalities, districts, departments with their respective decentralized organizations and entities at the national level with incomes >= COP 20,000 M. |
| SME | Annual sales < COP 13,000 M, with a classification between small, medium, large and plus except for Banistmo which places borrowers < USD 10 M in annual sales. For Banco Agrícola and BAM < USD 5 M. |
Loans and advances, regardless of amount, granted to individuals for the purchase of consumer goods or to pay for non-commercial or business services.
These loans are classified as follows:
| Classification |
| Vehicles | Credits granted for the acquisition of vehicles. The vehicle financed is used as collateral for the loan. |
| Credit cards | Revolving credit limits for the acquisition of consumer goods, utilized by means of a plastic card. |
| Payroll loans | It is a credit line attached to an authorized individual payroll amount. |
| Other loans | Loans granted for the acquisition of consumer goods other than vehicles and Payroll loans Credit cards are not included in this segment. |
The counterparties in this portfolio are mainly individuals, segmented in homogenous groups, which are formed according to their size, which is calculated by their monthly income.
These are loans, regardless of amount, granted to individuals for the purchase of a new or used house, commercial real estate or to build a home. These loans include loans denominated in local units or local currency that are guaranteed by a senior mortgage on the property and that are financed with a total repayment term of 5 to 30 years.
The counterparties in the mortgage portfolio are mainly made up of individuals segmented in homogenous groups, which are formed according to their size, which is calculated by their monthly income.
These are issued for the purpose of encouraging the activities of small business and are subject to the following requirements: their indebtedness with all entities cannot exceed 120 minimum wages (excluding mortgage obligations for housing financing); (ii) the staff must not exceed 10 employees; (iii) the client's total assets, excluding mortgage assets, are less than 500 minimum wages. For the classification of those small business that present combinations of number of employees parameters and total assets different from those indicated, the determining factor will be that of total assets.
The borrowers in this portfolio are mainly individuals, segmented in homogenous groups, which are formed according to their commercial size, which is calculated by their monthly income.
Analysis of the behavior and impairment of the loan portfolio and financial lease operations
As of December 31, 2019, Bank’s total loan portfolio valued in Colombian pesos registered an increase of 4.87% compared to December 2018, driven by a growth mainly in Colombia, Guatemala and El Salvador (The last ones influenced by the devaluation of the Colombian peso against the U.S. dollar). The 30-day past due loan ratio (consolidated) stood at 4.63% in december 2019 compared to 4.68% in December 2018, driven by a decrease in the past-due portfolio of Personal and SME Banking consequently to the improvement in the strategies of origination and recovery, while the Corporate Banking was attributed to strategies for continuous monitoring and restructuring in clients of certain segments.
| · | Commercial loans and finance lease amounted to COP 117,319 billion, which represented a decrease of 0.41% with respect to 2018. Its 30-day past due loan ratio was 3.81%. |
| · | Consumer loans stood at COP 39,700 billion, which represented an increase of 24.09% with respect to 2018. Its 30-day past due loan ratio was 5.14%. |
| · | Mortgage loans came to COP 23,983 billion, which represented an increase of 4.86 with respect to 2018. Its 30-day past due loan ratio was 7.41%. |
| · | Small Business loans ended at COP 1,279 billion, which represented an increase of 10.66% with respect to 2018. Its 30-day past due loan ratio was 12.25%. |
In order to monitor credit risk associated with clients, the Bank has established regular meetings conducted by a committee to identify events that can lead to a reduction in borrowers’ ability to pay. Generally, clients with good credit behavior could be included in the watch list in case of detecting any event that can lead to future financial difficulties to repay their loans; for instance, internal factors such as the economic activity, financial weakness, impacts of macroeconomic conditions, changes in corporate governance and other situations that could affect clients’ business. The amount and allowance of clients included in the described watch list, as of December 31, 2018 and December 2019 is shown below.
December 2019:
| Watch List december 31, 2019 |
| Million COP |
| Risk Level | Amount | % | Allowance |
| Level 1 – Low Risk | 8,781,473 | 1.38% | 120,933 |
| Level 2 – Medium Risk | 3,908,092 | 5.78% | 225,881 |
| Level 3 and 4 –High Risk | 7,506,932 | 51.33% | 3,853,653 |
| Total | 20,196,497 | 20.80% | 4,200,467 |
December 2018:
| Watch List december 31, 2018 |
| Million COP |
| Risk Level | Amount | % | Allowance |
| Level 1 – Low Risk | 9,179,165 | 1.04% | 95,896 |
| Level 2 – Medium Risk | 2,549,977 | 8.96% | 228,461 |
| Level 3 and 4 –High Risk | 5,723,041 | 57.36% | 3,282,938 |
| Total | 17,452,183 | 20.67% | 3,607,295 |
Loans and Financial Leases Collateral
The Bank obtains collateral for loans and leases in order to mitigate credit risk by foreclosing the collateral when the borrower cannot fully repaid the loan or lease. Collateral is considered in the determination of the allowance for loans and advances and lease losses when it complies with the following conditions:
| · | Its fair value was established according to technical and objective criteria. |
| · | The Bank is granted a preference or an improved right to obtain the payment of the obligation, becoming an effective collateral. |
| · | Its performance is reasonably possible. |
| · | It is a payment source that sufficiently attends to the credit as per the requirement of the Bank. |
| · | When the borrower is a government entity, the collateral has a pledge certificate issued by the appropriate authority. |
The Bank has defined the criteria for the collateral enforceability, which are established according to the classification of loan portfolio. In addition, the Bank has set guidelines to value collaterals and the frequency of such valuations, as well as those guidelines related to the legalization, registry and maintenance of the collateral. Likewise, the Bank has defined the criteria for insurability, custody and the necessary procedures for their cancellation.
The update of the fair value of mortgages and vehicles collaterals for the loan portfolio is made between one and three years of agreement with the policy. The methodology used to estimate the fair value of the properties is applied by external and independent entities. Updating the fair value of the vehicles is done through guides and valid values commonly used as reference to set the value of a vehicle. The fair value of real state and vehicles are classified in levels 2 and 3 depending on the observability and significance of the inputs used in the valuation techniques according to the hierarchy established by IFRS 13.
During the reporting period, the Group’s collateral policies have not changed significantly in relation to the way collateral is held and its overall quality.
The following table shows loans and financial leases, classified in commercial, consumer, mortgage, financial leases and small business loans, and disaggregated by type of collateral:
| December 31, 2019 |
| Amount Covered by Collateral |
| In Millions of COP |
| Nature of the Collateral | Commercial | Consumer | Mortgage | Financial
Leasing | Small
Business | Total |
| Real Estate and Residential | 19,830,740 | 1,699,574 | 22,327,716 | 41 | 249,413 | 44,107,484 |
| Goods Given in Real Estate Leasing | - | - | 227 | 13,711,181 | - | 13,711,408 |
| Goods Given in Leasing Other Than Real Estate | - | - | - | 6,155,570 | - | 6,155,570 |
| Stand by Letters of Credit | 756,421 | 151 | - | - | - | 756,572 |
| Security Deposits | 541,530 | 321,814 | - | 7794 | 54,294 | 925,432 |
| Guarantee Fund | 2,838,386 | 155 | - | 107,149 | 339,660 | 3,285,350 |
| Sovereign of the Nation | - | - | - | - | - | - |
| Collection Rights | 4,430,882 | 43,380 | - | - | 990 | 4,475,252 |
| Other Collateral (Pledges) | 3,881,957 | 4,879,795 | 54,848 | 33 | 8,204 | 8,824,837 |
| Without Guarantee (Uncovered Balance) | 60,488,637 | 32,755,801 | 1,600,492 | 4,569,061 | 626,847 | 100,040,838 |
| Total loans and financial leases | 92,768,553 | 39,700,670 | 23,983,283 | 24,550,829 | 1,279,408 | 182,282,743 |
| December 31, 2018 |
| Amount Covered by Collateral |
| In Millions of COP |
| Nature of the Collateral | Commercial | Consumer | Mortgage | Financial
Leasing | Small
Business | Total |
| Real Estate and Residential | 21,209,517 | 1,744,581 | 20,720,459 | 84 | 282,822 | 43,957,463 |
| Goods Given in Real Estate Leasing | - | - | 243 | 12,752,932 | - | 12,753,175 |
| Goods Given in Leasing Other Than Real Estate | - | - | - | 5,900,913 | - | 5,900,913 |
| Stand by Letters of Credit | 667,976 | 229 | - | - | - | 668,205 |
| Security Deposits | 470,400 | 369,689 | - | - | 76,136 | 916,225 |
| Guarantee Fund | 2,595,913 | 138 | - | 118,747 | 288,890 | 3,003,688 |
| Sovereign of the Nation | - | - | - | - | - | - |
| Collection Rights | 3,992,592 | 49,910 | - | - | 1,452 | 4,043,954 |
| Other Collateral (Pledges) | 4,118,947 | 4,713,359 | 48,098 | 20 | 14,158 | 8,894,582 |
| Without Guarantee (Uncovered Balance) | 61,545,303 | 25,115,475 | 2,101,885 | 4,425,508 | 492,740 | 93,680,911 |
| Total loans and financial leases | 94,600,648 | 31,993,381 | 22,870,685 | 23,198,204 | 1,156,198 | 173,819,116 |
The Bank closely monitors collateral held for financial assets that are considered in Stage 3, as it becomes more likely that the Bank will take possession of collateral to mitigate potential credit losses.
Financial assets that are considered Stage 3 and related collateral held in order to mitigate potential losses are shown below:
| December 31, 2019 |
| In Millions of COP |
| Classification | Amount | Allowance | Total | Fair Value of
Collateral |
| Commercial | 747,929 | 235,892 | 512,037 | 1,914,276 |
| Consumer | | | | |
| Mortgage | 161,605 | 18,269 | 143,336 | 203,229 |
| Small Business Loans | | | | |
| Financial Leases | 616,675 | 217,808 | 398,867 | 889,551 |
| Total credit assets | 1,526,209 | 471,969 | 1,054,240 | 3,007,056 |
| December 31, 2018 |
| In Millions of COP |
| Classification | Amount | Allowance | Total | Fair Value of
Collateral |
| Commercial | 775,689 | 239,720 | 535,969 | 2,528,495 |
| Consumer | | | | |
| Mortgage | 139,084 | 21,883 | 117,201 | 173,482 |
| Small Business Loans | | | | |
| Financial Leases | 666,495 | 201,981 | 464,514 | 974,274 |
| Total credit assets | 1,581,268 | 463,584 | 1,117,684 | 3,676,251 |
A portion of the Bank’s financial assets originated by the mortgage and commercial business has sufficiently low ‘loan to value’ (LTV) ratios, which results in no loss allowance being recognized in accordance with The Bank’s expected credit loss model. The carrying amount of such financial assets is COP 285,903 as at 31 December 2019 and COP 281,722 as at 31 December 2018.
Foreclosed assets and other credit mitigants
Assets received in lieu of payment (foreclosed assets) are recognized on the statement of financial position when current possession of the asset takes place.
Foreclosed assets represented by immovable or movable property are received based on a commercial valuation. Foreclosed assets such as equity securities and other financial assets, are received based on market value.
During 2019 and 2018, foreclosed assets received amounted to COP 508,441 and COP 521,718, respectively.
The Bank classifies foreclosed assets after acknowledgment of the exchange operation according to the intention of use, as follows:
| · | Non-current assets held for sale. |
| · | Other marketable assets. |
| · | Other non-marketable assets. |
| · | Financial instruments (investments). |
Collaterals classified as non-current assets held for sale are those expected to be sold in the following 12 months. When there are market restrictions that do not allow their realization in less than 12 months and this period is extended, retroactive depreciation must be charged to results and the asset value will be reduced by the depreciation value.
| c. | Risk Concentration – Loans and Advances |
The analysis of credit risk concentration is done by monitoring the portfolio by groups such as: loan categories, maturity, past due days, economic sector, country and economic group, as shown here:
| · | Loans concentration by category |
The composition of the credit portfolio in commercial, consumer, mortgage, financial leases and small business loans categories are as follows:
| Composition | December 31 2019 | December 31, 2018 |
| In millions of COP |
| Commercial | 92,768,553 | 94,600,648 |
| Corporate | 50,108,427 | 55,562,618 |
| SME | 12,209,759 | 16,524,571 |
| Others | 30,450,367 | 22,513,459 |
| Consumer | 39,700,670 | 31,993,381 |
| Credit card | 8,079,354 | 7,026,689 |
| Vehicle | 3,597,969 | 3,253,060 |
| Payroll loans | 7,896,376 | 7,451,381 |
| Others | 20,126,971 | 14,262,251 |
| Mortgage | 23,983,283 | 22,870,685 |
| VIS3 | 6,211,385 | 5,778,067 |
| Non- VIS | 17,771,898 | 17,092,618 |
| Financial Leases | 24,550,829 | 23,198,204 |
| Small Business Loan | 1,279,408 | 1,156,198 |
| Loans and advances to customers and financial institutions | 182,282,743 | 173,819,116 |
| Allowance for loans and advances and lease losses | (10,929,395) | (10,235,831) |
| Total net loan and financial leases | 171,353,348 | 163,583,285 |
| · | Concentration of loan by maturity |
The following table shows the ranges of maturity for the credit loans and financial leases, according for the remaining term for the completion of the contract of loans and financial leases:
| December 31, 2019 |
| Maturity | Less Than 1 Year | Between 1 and 3 Years | Between 3 and 5 Years | Greater Than 5 Years | Total |
| In millions of COP |
| Commercial | 27,697,217 | 21,352,300 | 17,894,373 | 25,824,663 | 92,768,553 |
| Corporate | 12,377,872 | 9,593,705 | 11,229,624 | 16,907,226 | 50,108,427 |
| SME | 3,700,971 | 4,384,119 | 2,440,766 | 1,683,903 | 12,209,759 |
| Others | 11,618,374 | 7,374,476 | 4,223,983 | 7,233,534 | 30,450,367 |
| Consumer | 897,630 | 5,275,564 | 22,018,610 | 11,508,866 | 39,700,670 |
| Credit card | 160,807 | 334,486 | 7,358,630 | 225,431 | 8,079,354 |
| Vehicle | 66,581 | 573,874 | 1,439,037 | 1,518,477 | 3,597,969 |
| Order of payment | 55,448 | 530,242 | 1,279,371 | 6,031,315 | 7,896,376 |
| Others | 614,794 | 3,836,962 | 11,941,572 | 3,733,643 | 20,126,971 |
| Mortgage | 48,937 | 197,468 | 512,509 | 23,224,369 | 23,983,283 |
| VIS | 9,672 | 55,493 | 134,784 | 6,011,436 | 6,211,385 |
| Non-VIS | 39,265 | 141,975 | 377,725 | 17,212,933 | 17,771,898 |
| Financial Leases | 3,052,472 | 2,993,125 | 4,206,767 | 14,298,465 | 24,550,829 |
| Small business loans | 248,210 | 586,448 | 251,530 | 193,220 | 1,279,408 |
| Total gross loans and financial leases | 31,944,466 | 30,404,905 | 44,883,789 | 75,049,583 | 182,282,743 |
3 VIS: Social Interest Homes, corresponds to mortgage loans granted by the financial institutions of amounts less than 135 minimum wages.
| December 31, 2018 |
| Maturity | Less Than 1 Year | Between 1 and 3
Years | Between 3 and 5
Years | Greater Than 5
Years | Total |
| In millions of COP |
| Commercial | 31,052,548 | 18,846,830 | 16,216,100 | 28,485,170 | 94,600,648 |
| Corporate | 16,569,691 | 8,491,758 | 11,335,723 | 19,165,446 | 55,562,618 |
| SME | 5,253,678 | 5,482,139 | 2,774,471 | 3,014,283 | 16,524,571 |
| Others | 9,229,179 | 4,872,933 | 2,105,906 | 6,305,441 | 22,513,459 |
| Consumer | 749,322 | 4,562,956 | 12,069,707 | 14,611,396 | 31,993,381 |
| Credit card | 100,367 | 244,218 | 1,073,539 | 5,608,565 | 7,026,689 |
| Vehicle | 60,754 | 610,398 | 1,538,979 | 1,042,929 | 3,253,060 |
| Payroll loans | 62,657 | 624,660 | 1,397,974 | 5,366,090 | 7,451,381 |
| Others | 525,544 | 3,083,680 | 8,059,215 | 2,593,812 | 14,262,251 |
| Mortgage | 58,613 | 175,572 | 479,086 | 22,157,414 | 22,870,685 |
| VIS | 11,056 | 51,768 | 117,404 | 5,597,839 | 5,778,067 |
| Non-VIS | 47,557 | 123,804 | 361,682 | 16,559,575 | 17,092,618 |
| Financial Leases | 2,393,428 | 2,560,578 | 4,260,513 | 13,983,685 | 23,198,204 |
| Small business loans | 256,093 | 477,456 | 220,105 | 202,544 | 1,156,198 |
| Total gross loans and financial leases | 34,510,004 | 26,623,392 | 33,245,511 | 79,440,209 | 173,819,116 |
| · | Concentration by past due days |
The following table shows the loans and financial leases according to past due days. Loans or financial leases are considered past due if it is more than one month overdue (i.e. 31 days):
| December 31, 2019 |
| Past-due |
| Period | 0 - 30 Days | 31 - 90 Days | 91 - 120 Days | 121 - 360 Days | More Than
360
Days | Total |
| | In millions of COP |
| Commercial | 89,172,106 | 464,573 | 542,233 | 937,931 | 1,651,710 | 92,768,553 |
| Consumer | 37,661,558 | 873,583 | 282,165 | 742,197 | 141,167 | 39,700,670 |
| Mortgage | 22,205,284 | 647,059 | 136,005 | 333,204 | 661,731 | 23,983,283 |
| Financial Leases | 23,678,408 | 321,232 | 52,548 | 207,619 | 291,022 | 24,550,829 |
| Small Business Loan | 1,122,737 | 50,740 | 14,596 | 56,939 | 34,396 | 1,279,408 |
| Total | 173,840,093 | 2,357,187 | 1,027,547 | 2,277,890 | 2,780,026 | 182,282,743 |
| December 31, 2018 |
| Past-due |
| Period | 0 - 30 Days | 31 - 90 Days | 91 - 120 Days | 121 - 360 Days | More Than
360
Days | Total |
| | In millions of COP |
| Commercial | 90,804,138 | 452,890 | 152,877 | 1,387,364 | 1,803,379 | 94,600,648 |
| Consumer | 30,311,854 | 701,314 | 238,540 | 638,868 | 102,805 | 31,993,381 |
| Mortgage | 21,121,205 | 612,480 | 148,786 | 388,653 | 599,561 | 22,870,685 |
| Financial Leases | 22,433,190 | 209,840 | 54,029 | 245,974 | 255,171 | 23,198,204 |
| Small Business Loan | 1,008,378 | 48,849 | 16,202 | 60,103 | 22,666 | 1,156,198 |
| Total | 165,678,765 | 2,025,373 | 610,434 | 2,720,962 | 2,783,582 | 173,819,116 |
| · | Concentration of loans by economic sector |
The following table contains the detail of the portfolio of loans and financial leases by main economic activity of the borrower:
| December 31, 2019 |
| Economic sector | Loans and advances |
| Local | Foreign | Total |
| In millions of COP |
| Agriculture | 3,931,913 | 1,948,089 | 5,880,002 |
| Petroleum and Mining Products | 923,375 | 148,222 | 1,071,597 |
| Food, Beverages and Tobacco | 6,107,103 | 629,948 | 6,737,051 |
| Chemical Production | 3,383,655 | 62,995 | 3,446,650 |
| Government | 5,626,186 | 1,897 | 5,628,083 |
| Construction | 14,526,616 | 6,221,753 | 20,748,369 |
| Commerce and Tourism | 17,601,979 | 8,873,330 | 26,475,309 |
| Transport and Communications | 7,703,609 | 524,847 | 8,228,456 |
| Public Services | 5,492,806 | 1,326,236 | 6,819,042 |
| Consumer Services | 42,466,786 | 22,647,495 | 65,114,281 |
| Commercial Services | 16,630,762 | 4,120,883 | 20,751,645 |
| Other Industries and Manufactured Products | 6,457,499 | 4,924,759 | 11,382,258 |
| Total | 130,852,289 | 51,430,454 | 182,282,743 |
| December 31, 2018 |
| Economic sector | Loans and advances |
| Local | Foreign | Total |
| In millions of COP |
| Agriculture | 3,804,075 | 2,548,078 | 6,352,153 |
| Petroleum and Mining Products | 1,082,816 | 181,789 | 1,264,605 |
| Food, Beverages and Tobacco | 5,865,111 | 320,596 | 6,185,707 |
| Chemical Production | 3,566,746 | 12,561 | 3,579,307 |
| Government | 4,457,944 | 79,133 | 4,537,077 |
| Construction | 14,508,354 | 5,513,212 | 20,021,566 |
| Commerce and Tourism | 16,928,137 | 7,641,117 | 24,569,254 |
| Transport and Communications | 8,331,727 | 865,257 | 9,196,984 |
| Public Services | 6,007,483 | 966,764 | 6,974,247 |
| Consumer Services | 35,886,645 | 20,813,390 | 56,700,035 |
| Commercial Services | 17,041,170 | 5,540,572 | 22,581,742 |
| Other Industries and Manufactured Products | 5,978,092 | 5,878,347 | 11,856,439 |
| Total | 123,458,300 | 50,360,816 | 173,819,116 |
| · | Credit concentration by country |
The following table shows the concentration of the loans and financial leases by country. Loans are presented based on the country in wich they were originated:
| December 31, 2019 |
| Country | Loans and advances | % Participation | Allowance for loans and advances and lease losses | % Participation |
| Colombia | 127,875,541 | 70.15% | 8,678,279 | 79.40% |
| Panamá | 30,783,359 | 16.89% | 1,084,303 | 9.92% |
| El Salvador | 11,456,280 | 6.28% | 445,609 | 4.08% |
| Puerto Rico | 771,135 | 0.42% | 30,680 | 0.28% |
| Guatemala | 11,385,421 | 6.25% | 689,839 | 6.31% |
| Other Countries | 11,007 | 0.01% | 685 | 0.01% |
| Total | 182,282,743 | 100.00% | 10,929,395 | 100.00% |
| December 31, 2018 |
| Country | Loans and advances | % Participation | Allowance for loans and advances and lease losses | % Participation |
| Colombia | 119,674,770 | 68.85% | 8,402,751 | 82.09% |
| Panama | 32,299,274 | 18.58% | 910,268 | 8.89% |
| El Salvador | 10,590,571 | 6.09% | 465,122 | 4.54% |
| Puerto Rico | 889,528 | 0.51% | 29,041 | 0.29% |
| Guatemala | 10,352,272 | 5.96% | 427,747 | 4.18% |
| Other countries | 12,701 | 0.01% | 902 | 0.01% |
| Total | 173,819,116 | 100.00% | 10,235,831 | 100.00% |
| · | Credit concentration by economic group |
As of December 31, 2019 and 2018, concentration of the 20 largest economic groups amounted to COP 20,272 billion and COP 20,372 billion, respectively. This exposure corresponds to all credit active operations of these groups.
| d. | Credit quality – Loans and Advances |
The following table shows information about credit quality of the borrower:
| December 31 2019 |
| Classification | Stage 1 | Stage 2 | Stage 3 | Total |
| In millions of COP |
| Commercial | 80,068,756 | 4,763,023 | 7,936,774 | 92,768,553 |
| Consumer | 35,957,631 | 1,969,289 | 1,773,750 | 39,700,670 |
| Mortgage | 21,584,674 | 1,340,380 | 1,058,229 | 23,983,283 |
| Small Business Loans | 1,088,656 | 70,219 | 120,533 | 1,279,408 |
| Financial Leases | 21,069,884 | 1,857,427 | 1,623,518 | 24,550,829 |
| Loans and Advances | 159,769,601 | 10,000,338 | 12,512,804 | 182,282,743 |
| December 31 2018 |
| Classification | Stage 1 | Stage 2 | Stage 3 | Total |
| In millions of COP |
| Commercial | 83,632,770 | 3,214,860 | 7,753,018 | 94,600,648 |
| Consumer | 28,666,461 | 1,758,162 | 1,568,758 | 31,993,381 |
| Mortgage | 20,280,416 | 1,513,063 | 1,077,206 | 22,870,685 |
| Small Business Loans | 958,491 | 80,805 | 116,902 | 1,156,198 |
| Financial Leases | 20,355,961 | 1,145,165 | 1,697,078 | 23,198,204 |
| Loans and Advances | 153,894,099 | 7,712,055 | 12,212,962 | 173,819,116 |
In order to determine the expected credit loss, the Bank considers the economic conditions and performance of the borrower’s industry, the analysis of payments behavior, events that could negatively affect the borrower’s ability to pay, among others factors.
The expected credit loss is determined either by a collective or individual evaluation according to the amount and characteristics of the loan. For further details please see Note 2 Significant Accounting Policies, section 7.4.5 Impairment of financial assets at amortized cost or at fair value through other comprehensive income “FVOCI”.
Impairment loan portfolio analyzed by individual evaluation at COP 6.0 billion, which represented 2.8% of the total portfolio of the Bank.
The table below shows Stage 3 loans and advances according to their type of evaluation:
| December 31 2019 |
| Impairment | Individual Evaluation | Collective Evaluation |
| | Carrying Amount | ECL | Carrying Amount | ECL |
| In millions of COP |
| Commercial | 5,163,304 | 2,442,820 | 2,773,470 | 1,961,268 |
| Consumer | - | - | 1,773,750 | 1,579,758 |
| Mortgage | - | - | 1,058,229 | 578,593 |
| Financial Leases | 841,175 | 409,721 | 782,343 | 337,830 |
| Small Business Loan | - | - | 120,533 | 84,445 |
| Total | 6,004,479 | 2,852,541 | 6,508,325 | 4,541,894 |
| December 31 2018 |
| Impairment | Individual Evaluation | Collective Evaluation |
| | Carrying Amount | ECL | Carrying Amount | ECL |
| In millions of COP |
| Commercial | 4,970,415 | 2,583,874 | 2,782,603 | 1,904,866 |
| Consumer | - | - | 1,568,758 | 1,383,265 |
| Mortgage | - | - | 1,077,206 | 586,026 |
| Financial Leases | 795,862 | 339,418 | 901,216 | 367,072 |
| Small Business Loan | - | - | 116,902 | 79,981 |
| Total | 5,766,277 | 2,923,292 | 6,446,685 | 4,321,210 |
Sensitivity analysis
Among the relevant assumptions that affect the allocation of the expected loss (ECL) in the loan portfolio and financial leasing, are the following variables that have the greatest impact on each of the countries:
Bancolombia, Banco Agro Mercantil, Banistmo & Banco Agrícola
| § | GDP growth: due to the impact on the performance of companies and the valuation of guarantees; |
| § | Inflation: Given the significant impact on the purchasing power of economic agents, the investment prospects and externalities caused in the economic environment. |
The changes in the expected loss as of December 31, 2019 are shown below as a result of a possible change of 1% increase or decrease in these variables based on the assumptions used in the calculation of the expected loss for each of them. The scenarios: base, optimistic and pessimistic.
| | | Inflation |
| In Millions of COP |
| | | [+1%] | Without changes | [-1%] |
| GDP Growth | [+1%] | (33,094) | (78,617) | (116,783) |
| Without changes | 45,523 | - | (38,166) |
| [-1%] | 137,869 | 92,346 | 54,180 |
Additionally, the Bank has estimated the impact on the expected loss by applying the optimistic and pessimistic scenarios with a weight of 100% in each one; As a result of the application of this change, there is a decrease in the expected losses of COP 533,689 MM in the case of the optimistic scenario and an increase of COP 549,432 MM in applying the pessimistic scenario. For individual VPN the scenarios applied are the base and alternative respectively.
| e. | Credit Risk Management – Other Financial Instruments: |
Each one of the positions that make up the portfolio complies with the policies and limits that seek to diminish credit risk exposure. Those policies are, among others:
| · | Term Limits: Each borrower is evaluated by the Credit Committee, in which the result of the authorized model for this type of borrower is reviewed (quantitative and qualitative variables), which allows the Credit Committee to establish the maximum term for which the Bank wishes to have exposure. |
| · | Credit Limits: Limits approved under the model and with authorization from the Risk Committee, as well as the exposure, are monitored in line or batch, in such a way that the presentation of excesses is mitigated. |
| · | Counterparty Limits: These limits, derived from the credit limits or from allocation models and are verified by the Front Office prior to the close of operations. |
| · | Master Agreement: These bilateral agreements describe the handling of operations between the counterparties in accordance with good international practices and that limit the legal and financial risk under the occurrence of events of default (failure to pay or delivery). Mitigation mechanisms, procedures to be carried out in the case of this events of default, special conditions by type of operation and that are applied to OTC derivatives, Repos and other securities financing transactions, are all agreed upon. |
| · | Margin Agreements: For OTC derivatives operations and other securities financing transactions, agreements that regulate the administration of guarantees, haircuts, adjustment periods, minimum transfer amounts, etc., and that limit risk for a period of time (one day, one week, etc.), are established for counterparties involved in the operation. |
| · | Counterparty Alerts: There are financial, qualitative and market indicators that allow the Bank to establish damages to the credit quality of an issuer or counterparty. |
| f. | Credit Quality Analysis - Other Financial Instruments: |
In order to evaluate the credit quality of a counterparty or issuer (to determine a risk level or profile), the Bank relies on two rating systems: an external one and an internal one, both of which allow to identify a degree of risk differentiated by segment and country and to apply the policies that have been established for issuers or counterparties with different levels of risk, in order to limit the impact on liquidity and/or the income statement of the Bank.
External credit rating system is divided by the type of rating applied to each instrument or counterparty; in this way the geographic location, the term and the type of instrument allow the assignment of a rating according to the methodology that each examining agency uses.
Internal credit rating system: The “ratings or risk profiles” scale is created with a range of levels that go from low exposure to high exposure(this can be reported in numerical or alphanumerical scales), where the rating model is sustained by the implementation and analysis of qualitative and quantitative variables at sector level, which according to the relative analysis of each variable, determine credit quality; in this way the internal credit rating system aims to establish adequate margin in decision-making regarding the management of financial instruments.
Credit Quality Analysis of the Group
| | Debt instruments | Equity | Derivatives(1) |
| 2019 | 2018 | 2019 | 2018 | 2019 | 2018 |
| Maximum Exposure to Credit Risk |
| Low Risk | 13,738,560 | 12,994,431 | 320,034 | 349,425 | 527,427 | 867,639 |
| Medium Risk | 1,390,984 | 1,639,484 | 8,655 | 1,749 | 2910 | 135 |
| High Risk | 463,305 | 412,834 | 637 | 6496 | 755 | 429 |
| Without Rating | 21,285 | 698,781 | 899,097 | 1,282,279 | 18,744 | 25,798 |
| Total | 15,614,134 | 15,745,530 | 1,228,423 | 1,639,949 | 549,836 | 894,001 |
| (1) | For derivatives transactions counterparty risk is disclosed as long as the valuation is positive. Therefore, the value described here differs from the book value. |
In accordance with the criteria and considerations specified in the internal rating allocation and external credit rating systems methodologies, the following schemes of relation can be established, according to credit quality given to each one of the qualification scales:
Low Risk: All investment grade positions (from AAA to BBB-), as well as those issuers that according to the information available (financial statements, relevant information, external ratings, CDS, among others.) reflect adequate credit quality.
Medium Risk: All speculative grade positions (from BB+ to BB-), as well as those issuers that according to the available information (Financial statements, relevant information, external qualifications, CDS, among others) reflect weaknesses that could affect their financial situation in the medium term.
High Risk: All positions of speculative grade (from B+ to D), as well as those issuers that according to the information available (Financial statements, relevant information, external qualifications, CDS, among others) reflect a high probability of default of financial obligations or that already have failed to fulfill them.
| · | Financial credit quality of other financial instruments that are not in default nor impaired in value |
Debt instruments:100% of the debt instruments are not in default.
Equity:The positions do not represent significant risks.
Derivatives:99.80% of the credit exposure does not present incidences of material default. The remaining percentage corresponds to default events at the end of the period.
| · | Maximum exposure level to the credit risk given for: |
| | Maximum Exposure | Collateral * | Net Exposure |
| | 2019 | 2018 | 2019 | 2018 | 2019 | 2018 |
| Maximum Exposure to Credit Risk |
| Debt instruments | 15,614,134 | 15,745,530 | (974,436) | (2,352,276) | 14,639,698 | 13,393,254 |
| Derivatives ** | 549,836 | 894,001 | (63) | (97) | 549,773 | 893,905 |
| Equity | 1,228,423 | 1,639,949 | - | - | 1,228,423 | 1,639,949 |
| Total | 17,392,393 | 18,279,480 | (974,499) | (2,352,373) | 16,417,894 | 15,927,108 |
See Notes on this table:
| * | Collateral Held (-) and Collateral Pledged (+) |
| ** | Exposure in Derivatives with base in MTM (only positive values), netting by counterparty is applied |
| * | Debt instruments Book value 100% |
| - | Investment funds: Book value 100% |
| · | Analysis of the maturity of other financial instruments past due but not impaired |
| − | Debt instruments: Portfolio does not present past due nor impaired assets. |
| − | Equity: Portfolio does not present impaired assets |
| − | Derivatives: The past due assets are not material. |
| · | The information corresponding to the individual evaluation of impairment at the end of the period for other financial instruments, is detailed as follows: |
Debt instruments
| | Exposure | Impairment | Final Exposure |
| | 2019 | 2018 | 2019 | 2018 | 2019 | 2018 |
| Maximum Exposure to Credit Risk |
| Fair Value | 11,583,672 | 12,251,873 | 2,863 | 3,053 | 11,580,809 | 12,248,820 |
| Amortized Cost | 4,030,462 | 3,493,657 | 11,738 | 11,730 | 4,018,724 | 3,481,928 |
| Total | 15,614,134 | 15,745,530 | 14,601 | 14,783 | 15,599,533 | 15,730,748 |
Equity
| | Exposure | Impairment | Final Exposure |
| | 2019 | 2018 | 2019 | 2018 | 2019 | 2018 |
| Maximum Exposure to Credit Risk |
| Fair Value through profit or loss | 718,269 | 1,101,462 | - | - | 718,269 | 1,101,462 |
| Fair Value through OCI | 510,154 | 538,487 | - | - | 510,154 | 538,487 |
| Total | 1,228,423 | 1,639,949 | - | - | 1,228,423 | 1,639,949 |
Collateral- other financial instruments:
Level of collateral: Respect to the type of asset or operation, a collateral level is determined according to the policies defined for each product and the market where the operation is carried out.
Assets held as collateral in organized markets: The only assets that can be received as collateral are those defined by the central counterparties, the stock market where the operation is negotiated, those assets that are settled separately in different contracts or documents, which can be managed by each organization and must comply with the investment policies defined by the Bank, taking into account the credit limit for each type of asset or operation received or delivered, which collateral received are the best credit quality and liquidity.
Assets received as bilateral collateral between counterparties: The collateral accepted in international OTC derivative operations is agreed on bilaterally in the Credit Support Annex (CSA) 4 and with fulfillment in cash in dollars and managed by ClearStream. This company acts on behalf of Bancolombia for making international margin calls and providing a better management of the collateral.
4A Credit Support Annex (CSA) provides credit protection by setting forth the rules governing the mutual posting of collateral. CSAs are used in documenting collateral arrangements between two parties that trade privately negotiated (over-the-counter) derivative securities. The trade is documented under a standard contract called a master agreement, developed by the International Swaps and Derivatives Association (ISDA).
Collateral adjustments for margin agreements: The adjustments will be determined by the criteria applied by both the external and internal regulations in effect, and at the same time, mitigation standards are maintained so that the operation fulfills the liquidity and solidity criteria for settlement. Among the main characteristics by product or market, we have:
| − | With respect to the derivative operations, these are carried out daily, with threshold levels of zero for the majority of counterparties, which reduces the exposure to a term that does not exceed 10 days, according to Basel. |
| − | For buy-sell backs, repos and other securities financing transactions, daily monitoring is done in order to establish the need to adjust the collateral in such a way that these are applied in as little time as possible, according to the contracts or market conditions. |
| − | For all international counterparties, margin agreements that limit exposure to the maximum and with a daily adjustment period are celebrated. These margin agreements are celebrated under ISDA and GMRA (Global Master Repurchase Agreement) 5 both for OTC derivatives and securities financing transactions. |
| − | For every local counterparty, the local framework agreement is signed (agreement developed by the industry) and the mitigating actions to apply in each operation are agreed upon, whether for margin agreements, re-couponing, early termination, among others. |
| − | For repos, buy-sell backs and other securities financing transactions, these are agreed upon by organized markets that in general implicate complying with haircut or additional collateral rules. |
| − | The central counterparty carries out daily control and monitoring processes in order to comply with the rules imposed by these organizations in such a way that we are always making daily adjustments at the demanded collateral level. |
| · | Level of collateral held: |
| | Collateral* | Main type of collateral |
| | 2019 | 2018 | 2019 | 2018 |
| Maximum Exposure to Credit Risk |
| Debt Securities | (974,436) | (2,352,276) | Government bonds (TES) | Government Bonds (TES) and term deposits |
| Derivatives | (63) | (97) | Cash | Cash |
| Equity | - | - | | |
| Total | (974,499) | (2,352,373) | | |
See Notes on this table:
* Collateral Held (-) and Collateral Pledged (+)
| g. | Credit risk concentration - other financial instruments: |
According to the regulations, the Bank must control on a daily basis the risk of positions of the Bank’s companies with the same issuer or counterparty stands, below the legal limits.
By the same way, the positions of the Bank are verified respect of the authorized risk levels in each country in order to guarantee the alerts and positions limits, that are considered outside of the Bank risk appetite.
5 GMRA: It is a model legal agreement designed for parties transacting repos and is published by the International Capital Market Association (ICMA), which is the body representing the bond and repo markets in Europe.
Risk exposure by economic sector and risk region
| | Debt instruments | Equity | Derivative |
| | 2019 | 2018 | 2019 | 2018 | 2019 | 2018 |
| Maximum Exposure to Credit Risk | | | | | |
| Sector Concentration | | | | | | |
| Corporate | 3,650,072 | 3,179,751 | 1,060,133 | 1,064,268 | 242,827 | 276,721 |
| Financial | 1,119,315 | 805,863 | 145,662 | 543,256 | 262,990 | 520,026 |
| Government | 10,844,747 | 11,757,757 | - | - | - | - |
| Funds e ETF | - | 2159 | 22,628 | 32,425 | 44,019 | 97,254 |
| Total | 15,614,134 | 15,745,530 | 1,228,423 | 1,639,949 | 549,836 | 894,001 |
| Concentration by Region |
| North America | 2,218,829 | 1,569,943 | 4,467 | 1,472 | 77,561 | 279,132 |
| Latam | 12,160,411 | 14,175,587 | 1,181,239 | 1,613,783 | 312,442 | 475,243 |
| Europe | 30,061 | - | - | - | 156,470 | 119,126 |
| Others (Includes Funds and ETF) | 1,204,833 | - | 42,717 | 24,694 | 3,363 | 20,501 |
| Total | 15,614,134 | 15,745,530 | 1,228,423 | 1,639,949 | 549,836 | 894,002 |
Risk exposure by credit rating
| | Other financial instruments |
| | 2019 | 2018 |
| Maximum Exposure to Credit Risk |
| Sovereign Risk | 5,446,411 | 6,879,345 |
| AAA | 4,848,694 | 4,304,104 |
| AA+ | 452,253 | 398,479 |
| AA | 135,231 | 22,615 |
| AA- | 127,153 | 180,757 |
| A+ | 1,019,863 | 23,800 |
| A | 69,811 | 328,597 |
| A- | 209,383 | 163,235 |
| BBB+ | 1,748,221 | 73,101 |
| BBB | 186,469 | 1,133,247 |
| BBB- | 342,531 | 704,216 |
| Other | 1,867,247 | 2,061,128 |
| Not rated | 939,126 | 2,006,858 |
| Total | 17,392,393 | 18,279,480 |
At the end of the year, Bank’s positions are not in excess of the concentration limit, according to the applicable laws.
31.2 Market risk
Market risk refers to the risk of losses in the Bank’s treasury book due to changes in equity prices, interest rates, foreign-exchange rates and other indicators whose values are set in a public market. It also refers to the probability of unexpected changes in net interest income and equity economic value as a result of a change in market interest rates.
Market risk stems from the following activities at the Bank:
6 For derivatives transactions counterparty risk is revealed as long as the valuation is positive. Therefore, the value described here differs from the book value.
| a) | Trading: includes purchase - sale and positioning mainly in fixed income securities, equities, currencies and derivatives, as well as the financial services provided to customers, such as brokerage. Trading instruments are recorded in the treasury book and are managed by the Treasury Division which is also responsible for the aggregated management of exchange rate exposures arising from the banking book and treasury book. |
| b) | Balance sheet management:refers to the assets and liabilities management, due to mismatches in maturities and repricing of them. The Assets Liability Management Division is responsible for the balance sheet management, preserving the stability of the financial margin and the equity economic value, maintaining adequate levels of liquidity and solvency. Non-trading instruments are recorded in the Bank’s banking book (the “Banking Book”), which includes primarily loans, time deposits, checking accounts and savings accounts. |
In the Bank, the market risks are identified, measured, monitored, controlled and reported in order to support the decision-taking process for their mitigation, and to create greater shareholder value added.
The guidelines, policies and methodologies for market risks management are approved by the Board of Directors, thus guaranteeing the congruence and consistency in the risk appetite among subsidiaries. Each country has a local Market and Liquidity Risk Management Office that applies at an individual level the principles of the Bank´s Market Risks Management Strategy. The Board of Directors and senior management have formalized the policies, procedures, strategies and rules of action for market risk administration in its “Market Risk Manual”. This manual defines the roles and responsibilities within each subdivision of the Bank and their interaction to ensure adequate market risk administration.
The Bank´s Market and Liquidity Risks Management Office, responsible for monitoring and permanently controlling compliance with the limits established, is set up with clear independence from the trading and businesses units, ensuring enforcement authority. This independent control function is complemented by regular reviews conducted by the Internal Audit.
The Bank’s Market and Liquidity Risks Management Office is responsible for: (a) identifying, measuring, monitoring, and controlling the market risk inherent in the Bank’s businesses: (b) the Bank’s exposure under stress scenarios and confirming compliance with the Bank’s risk management policies: (c) designing the methodologies for valuation of the market value of certain securities and financial instruments: (d) reporting to senior management and the Board of Directors any violation of the Bank’s risk management policies: (e) reporting to the senior management on a daily basis the levels of market risk associated with the trading instruments recorded in its treasury book, and (f) proposing policies to the Board of Directors and to senior management that ensure the maintenance of predetermined risk levels. The Bank has also implemented an approval process for new products across each of its subdivisions. This process is designed to ensure that each subdivision is prepared to incorporate the new product into its procedures, that every risk is considered before the product is incorporated and that approval is obtained from the Board of Directors before the new product can be sold.
Market risks arising from trading instruments are measured at the Bank using two different Value at Risk (VaR) methodologies: the standard methodology required by the SFC, and the internal methodology of historical simulation. The standard methodology is established by “Chapter XXI of the Basic Accounting Circular”, based on the model recommended by the Amendment to the Capital Accord to Incorporate Market Risks of Basel Committee of 2005. The internal methodology of historical simulation uses a confidence level of 99%, a holding period of 10 days, and a time frame of one year or at least 250 days from the reference date of the VaR calculation is used, obtained from the reference date of calculating the VaR. The standard methodology is used to report the market risk exposure to the Financial Superintendency and is also used to measure the capital requirements for the Bank, therefore the analysis below is based on information obtain from this model.
The Bank’s VaR limits structure for trading activities, is sufficiently granular to conduct an effective control of the various types of market risk factors on which an exposure is held. It ensures that the market risk is not concentrated in certain asset classes and maximizes the portfolio diversification effect. These limits are defined by companies, products or by risk takers. The majority of the limits are based on the maximum VaR values to which a certain portfolio can be exposed, nevertheless, loss triggers, stop loss and sensitivity warning levels are also set, especially in the derivatives portfolios. The limits are approved by the Board of Directors, and set based on factors such as tolerance for losses, capital resources and market´s complexity and volatility. They are monitored daily, and their excesses or violations are reported to the Board of Directors and the Risk Committee.
Additional measurements like stress tests are done, to identify extreme unusual situations that could cause severe losses. Stress simulations include historical events and hypothetical scenarios. Back testing or model validation technics through comparison of predicted and actual loss level are applied on a regular basis to analyse and contrast the accuracy of the VaR calculation methodology in order to confirm its reliability, and make adjustments to the models if necessary.
Within the control and monitoring processes of market risks, reports are elaborated on a daily and monthly basis. They include an analysis of the most relevant risk measures and allow for monitoring the exposure levels to market risks and to the legal and internal limits established for each one of the levels of the Bank. These reports are taken as an input for the decision-taking process in the different Committees and management of the Bank.
Market Risk Management
The following section describes the market risks to which the Bank is exposed and the tools and methodologies used to measure these risks as of December 31, 2019. The Bank faces market risk as a consequence of its lending, trading and investments businesses.
The Bank uses VaR calculation to limit its exposure to the market risk of its Treasury Book. The Board of Directors is responsible for establishing the maximum VaR based on its assessment of the appropriate level of risk for Bancolombia. The Risks Committee is responsible for establishing the maximum VaR by type of investment (e.g., fixed income in public debt) and by type of risk (e.g., currency risk). These limits are supervised on a daily basis by the Market Risk Management Office.
For managing the interest rate risk from banking activities, the Bank analyses the interest rate mismatches between its interest earning assets and its interest bearing liabilities. In addition, the foreign currency exchange rate exposures arising from the banking book are provided to the Treasury Division where these positions are aggregated and managed.
| a. | Measurement of market risk of trading instruments |
The Bank currently measures the treasury book exposure to market risk (including OTC derivatives positions) as well as the currency risk exposure of the banking book, which is provided to the Treasury Division, using a VaR methodology established in accordance with “Chapter XXI of the Basic Accounting Circular”, issued by the SFC.
The VaR methodology established by “Chapter XXI of the Basic Accounting Circular” is based on the model recommended by the Amendment to the Capital Accord to Incorporate Market Risks of Basel Committee of 2005, which focuses on the treasury book and excludes investments classified as amortized cost which are not being given as collateral and any other investment that comprises the banking book, such as non-trading positions. In addition, the methodology aggregates all risks by the use of correlations, through an allocation system based on defined zones and bands, affected by given sensitivity factors.
The total market risk for the Bank is calculated by the arithmetical aggregation of the VaR calculated for each subsidiary. The aggregated VaR is reflected in the Bank’s Capital Adequacy (Solvency) ratio, in accordance with Decree 2555 de 2010.
For purposes of VaR calculations, a risk exposure category is any market variable that is able to influence potential changes in the portfolio value. Taking into account a given risk exposure, the VaR model assesses the maximum loss not exceeded, over a given period of time. The fluctuations in the portfolio’s VaR depend on volatility, modified duration and positions changes relating to the different instruments that are subject to market risk.
The relevant risk exposure categories for which VaR is computed by the Bank according to “Chapter XXI, Appendix 1 of the Basic Accounting Circular” are: (i) interest rate risks relating to local currency, foreign currency and UVR; (ii) currency risk; (iii) stock price risk, (iv) fund risk. and (v) credit default swaps risk.
| · | Interest Rate Risk (Treasury Book) |
The interest rate risk is the probability of decrease in the market value of the position due to fluctuations in market interest rates. The Bank calculates the interest rate risk for positions in local currency, foreign currency and UVR separately; in accordance with Chapter XXI of the Basic Accounting Circular issued by the SFC.
In the first instance, the interest rate risk exposure is determined by the sensitivity calculation for the net position of each instrument. This sensitivity is calculated as the net value market product, its corresponding modified duration and the estimated variation of interest rates. The possible variations in the interest rates are established by the SFC according to the historical behavior of these variables in the markets, and they are a function of the duration and currency, as seen in the following table.
| Zone | Band | Modified Duration | Changes in Interest Rates (bps) |
| Lower Limit | Upper Limit | Legal
Currency | UVR | Foreign Currency |
| Zone 1 | 1 | 0 | 0.08 | 274 | 274 | 100 |
| 2 | 0.08 | 0.25 | 268 | 274 | 100 |
| 3 | 0.25 | 0.5 | 259 | 274 | 100 |
| 4 | 0.5 | 1 | 233 | 274 | 100 |
| Zone 2 | 5 | 1 | 1.9 | 222 | 250 | 90 |
| 6 | 1.9 | 2.8 | 222 | 250 | 80 |
| 7 | 2.8 | 3.6 | 211 | 220 | 75 |
| Zone 3 | 8 | 3.6 | 4.3 | 211 | 220 | 75 |
| 9 | 4.3 | 5.7 | 172 | 200 | 70 |
| 10 | 5.7 | 7.3 | 162 | 170 | 65 |
| 11 | 7.3 | 9.3 | 162 | 170 | 60 |
| 12 | 9.3 | 10.6 | 162 | 170 | 60 |
| 13 | 10.6 | 12 | 162 | 170 | 60 |
| 14 | 12 | 20 | 162 | 170 | 60 |
| 15 | 20 | | 162 | 170 | 60 |
Once the sensitivity factor is calculated for each position, the modified duration is then used to classify each position within its corresponding band. A net sensitivity is then calculated for each band, by determining the difference between the sum of all long-positions and the sum of all short-positions. Then a net position is calculated for each zone (which consists of a series of bands) determined by the SFC. The final step is to make adjustments within each band, across bands and within each zone, which results in a final number that is the interest rate risk VaR by currency. Each adjustment is performed following the guidelines established by the SFC.
The Bank’s exposure to interest risk primarily arises from investments in Colombian government’s treasury bonds (TES).
| · | Currency (Treasury and Banking Book), Equity (Treasury Book) and Fund (Treasury Book) Risk |
The VaR model uses a sensitivity factor to calculate the probability of loss due to fluctuations in the price of stocks, funds and currencies in which the Bank maintains a position. As previously indicated, the methodology used in these financial statements to measure such risk consists of computing VaR, which is derived by multiplying the position by the maximum probable variation in the price of such positions (“∆p”). The (“∆p”) is determined by the SFC, as shown in the following table:
Currency | Sensitivity Factor |
| United States Dollar | 12.49% |
| Euro | 11.00% |
| Other currencies | 13.02% |
| Equity and Fund Risk | 14.70% |
The SFC according to historical market performance establishes the interest rate’s fluctuations and the sensitivity factors for currency, equity and fund risk used in the model.
The total market risk VaR is calculated as the algebraic sum of the interest rate risk, the currency risk, the stock price risk, fund risk and the credit default swaps risk which are calculated as the algebraic sum of the Parent Company and each of its subsidiaries’ exposure to these risks. Currently Bancolombia Group does not present exposure to credit default swaps risk.
The total market risk VaR, had a 17% surge going from COP 1,447,384 in December 31st, 2018 to COP 1,692,516 as of December 31st, 2019, due mainly to increase of 44% in the exposure to interest rate risk as a result of a greater position in fixed income instruments. Also, due to currency risk increases 12% as consequence of greater net position in US. dollars in Bancolombia.
The following table presents the total change on market risk and every risk factor.
| December 2019 |
| In millions of COP |
| Factor | December 31 | Average | Maximum | Minimum |
| Interest Rate | 359,654 | 325,400 | 409,369 | 242,568 |
| Exchange Rate | 1,015,874 | 874,432 | 1,055,546 | 496,565 |
| Share Price | 110,386 | 105,576 | 110,386 | 101,757 |
| Collective Portfolios | 206,602 | 203,676 | 207,503 | 195,944 |
| Total Value at Risk | 1,692,516 | 1,509,084 | 1,711,794 | 1,092,446 |
| December 2018 |
| In millions of COP |
| Factor | December 31 | Average | Maximum | Minimum |
| Interest Rate | 249,070 | 241,602 | 317,524 | 204,478 |
| Exchange Rate | 909,648 | 712,435 | 909,648 | 563,322 |
| Share Price | 91,847 | 103,127 | 112,372 | 91,847 |
| Collective Portfolios | 196,819 | 192,920 | 198,227 | 187,842 |
| Total Value at Risk | 1,447,384 | 1,250,084 | 1,447,384 | 1,108,052 |
| · | Assumptions and Limitations of VaR Models |
Although VaR models represent a recognized tool for risk management, they have inherent limitations, including reliance on historical data that may not be indicative of future market conditions or trading patterns. Accordingly, VaR models should not be viewed as predictive of future results. The Bank may incur losses that could be materially in excess of the amounts indicated by the models on a particular trading day or over a period of time, and there have been instances when results have fallen outside the values generated by the Bank’s VaR models. A VaR model does not calculate the greatest possible loss. The results of these models and analysis thereof are subject to the reasonable judgment of the Bank’s risk management personnel.
b. Non-trading instruments market risk measurement
The banking book’s relevant risk exposure is interest rate risk, which is the probability of unexpected changes in net interest income as a result of a change in market interest rates. Changes in interest rates affect the Bank’s earnings because of timing differences on the repricing of the assets and liabilities. The Bank manages the interest rate risk arising from banking activities in non-trading instruments by analyzing the interest rate mismatches between its interest earning assets and its interest bearing liabilities. The foreign currency exchange rate exposures arising from the banking book are provided to the Treasury Division where these positions are aggregated and managed.
| · | Interest Risk Exposure (Banking Book) |
The Bank has performed a sensitivity analysis of market risk sensitive instruments estimating the impact on the net interest income of each position in the Banking Book, using a repricing model and assuming positive parallel shifts of 50 basis points (bps).
The table 1 provides information about Bancolombia’s interest rate sensitivity for the statement of financial position items comprising the Banking Book.
Table 1. Sensitivity to Interest Rate Risk of the Banking Book
The chart below provides information about Bancolombia’s interest rate risk sensitivity in local currency (COP) at December 31, 2019 and December 31, 2018:
| | December 31, 2019 | December 31, 2018 |
| In millions of COP |
| Assets sensitivity 50 bps | 377,918 | 361,427 |
| Liabilities sensitivity 50 bps | 200,650 | 185,477 |
| Net interest income sensitivity50 bps | 177,269 | 175,950 |
The chart below provides information about Bancolombia’s interest rate risk sensitivity in foreign currency (US dollars) at December 31, 2019 and December 31, 2018:
| | December 31, 2019 | December 31, 2018 |
| In millions of USD |
| Assets sensitivity 50 bps | 35 | 39 |
| Liabilities sensitivity 50 bps | 34 | 36 |
| Net interest income sensitivity50 bps | 1 | 3 |
A positive net sensitivity denotes a higher sensitivity of assets than of liabilities and implies that a rise in interest rates will positively affect the Bank´s net interest income. A negative sensitivity denotes a higher sensitivity of liabilities than of assets and implies that a rise in interest rates will negatively affect the Bank´s net interest income. In the event of a decrease in interest rates, the impacts on net interest income would be opposite to those described above.
Total Exposure:
As of December 31, 2019, the net interest income sensitivity in local currency for the banking book instruments, entered for other than trading purposes with positive parallel shifts of 50 basis points was COP 177,269. The change in the net interest income sensitivity between 2019 and 2018 is due to the increase in the sensitivity of float loans due to the surge in IBR indexed loans.
On the other hand, the net interest income sensitivity in foreign currency, assuming the same parallel shift of 50 basis points, was USD 1 at December 31, 2019, compared with USD 3 at December 31, 2018. The decrease in net interest income sensitivity due to interest rate risk between 2019 and 2018 occurred due to the reduction in the sensitivity of float loans due the decrease in Libor indexed loans.
Assumptions and limitations:
Net interest income sensitivity analysis is based on the repricing model and considers the following key assumptions: (a) does not consider prepayments, new operations, defaults, etc., (b); the fixed rate instruments sensitivity, includes the amounts with maturity lower than one year and assumes these will be disbursed at market interest rates and (c) changes in interest rate occur immediately and parallel in the yield curves from assets and liabilities for different maturities.
| · | Structural equity risk exposure (Banking Book) |
Bancolombia’s investment banking affiliate, in its role of financial corporation, holds, directly and through its affiliated companies, structural equity investments. These positions are maintained mostly in the industrial and financial sectors. The market value of those investments decreased by 76% during the year, from COP163,136 million as of December 31st, 2018 to COP38,428 million as of December 31st, 2019, as a result of the sale of Empresa de Energía del Pacífico S.A (EPSA) shares.
The structural equity positions are exposed to equity price risk. Sensitivity calculations are made for those positions:
Table 2. Share Price Sensitivity
| | December 31, 2019 | December 31, 2018 |
| Fair Value | 38,428 | 163,136 |
| Delta | 14.70% | 14.70% |
| Sensitivity | 5,649 | 23,981 |
A negative impact of 14.70%, applied to the market value, produces a decrease of COP 5,649 on the structural equity investments market value, which would decrease from COP 38,428 to COP 32,799.
31.3 Liquidity risk
Liquidity risk is defined as the inability of a financial firm to meet its debt obligations without incurring unacceptably large losses. Thus, funding liquidity risk is the risk that a firm will not be able to meet its current and future cash flow and collateral needs, both expected and unexpected, without materially affecting its daily operations or overall financial condition. The Bank is sensitive to funding liquidity risk since debt maturity transformation is one of its key business areas.
At the Bank, liquidity prevails over any objective of growth or revenue. Managing liquidity has always been a fundamental pillar of its business strategy, together with capital, in supporting its statement of financial position.
The Bank’s liquidity management model promotes the autonomy of subsidiaries, which must be self-sufficient in their structural funding. Each subsidiary is responsible for meeting the liquidity needs of its current and future activity, within a framework of management coordination at the Bank level. The metrics used to control liquidity risk are developed based on common and homogeneous concepts, but analysis and adaptation are made by each subsidiary.
In line with best governance practices, the Bank has established a clear division of function between executing liquidity management, responsibility of the Asset and Liability Division, and their monitoring and control, responsibility of the Market and Liquidity Risks Management Office.
The different authorities of senior management define the policies and guidelines for managing liquidity risk. These authorities are the Board of Directors, the Risk Committee, and senior management of the Parent Company, which set the risk appetite and define the financial strategy. The ALCO committees (asset and liability committee) define the objective positioning of liquidity and the strategies that ensure the funding needs derived from businesses. The ALM division (Asset and liability management) and the Market and Liquidity Risks Management Office support the mentioned committees, which elaborate analysis and management proposals, and control compliance with the limits established.
Liquidity Risks Management Office is responsible for proposing the minimum amount of the liquidity reserve, the policies of the liquidity portfolio, defining premises and metrics in order to model the behaviour of the cash flows, proposing and monitoring liquidity limits in line with the Bank's risk appetite, simulating stress scenarios, evaluating and reporting the risks inherent to new products and operations; and submitting the reports required by the internal authorities for decision-making, as well as by regulators. All of the above activities are verified and evaluated by the Internal Audit.
The measures to control liquidity risk include maintaining a portfolio of highly liquid assets, and the definition of triggers and liquidity limits, which enable evaluating the level of exposure of each one of the entities in a proactive way.
The methodologies used to control liquidity risk include the liquidity gaps and stress scenarios. The liquidity gaps measure the mismatches of assets, liabilities and off-balance sheet position´s cash flows, separately for local currency and foreign currency. Regulatory metrics are also applied, in which the contractual maturities are used; and internal models in which the cash flows are adjusted by different ratios, to reflect a more accurate behaviour.
Each subsidiary creates their liquidity gap according to the characteristics of their business and they tackle them through the different financing resources they have available. The recurrence of the businesses that are going to be financed, the stability of the financing sources, and the ability of the assets to become liquid are the fundamental factors that are taken into account in the definition of this metric. In practice, and given the different behaviours of a same item in the Bank’s subsidiaries, there are common standards and methodologies to homogenize the construction of liquidity risk profiles for each unit so they can be presented in a comparable way to the Bank's Senior Management.
Periodically, a validation of the policies, limits, processes, methodologies and tools to evaluate liquidity risk exposure is performed, in order to establish its pertinence and functionality, and to carry out the necessary adjustments. The Market and Liquidity Risks Management Office elaborate reports daily, weekly and monthly basis in order to monitor the exposure levels and the limits and triggers set up, and to support the decision-making process.
Each subsidiary has its own liquidity contingency plan, which is tested annually. These contingency plans procure the optimization of different funding sources, including obtaining additional funding from the Parent Company.
Liquidity risk management
The Bank’s Board of Directors sets the strategy for managing liquidity risk and delegates responsibility for oversight of the implementation of this policy to ALCO committee that approves the Bank’s liquidity policies and procedures. The Treasury Division manages the Bank’s liquidity position on a day-to-day basis and reviews daily reports covering the liquidity position. A summary report, including any exceptions and remedial action taken, is submitted regularly to Risk Committee and ALCO committees.
| a. | Liquidity risk exposure: |
In order to estimate liquidity risk, the Bank measure a liquidity coverage ratio to ensure holding liquid assets sufficient to cover potential net cash outflows over 30 day. This indicator allows the Bank to meet liquidity coverage for the next month. The liquidity coverage ratio is presented as follows:
| Liquidity Coverage Ratio | December 31, 2019 | December 31, 2018 |
| Net cash outflows into 30 days* | 11,584,292 | 7,004,662 |
| Liquid Assets | 30,631,688 | 26,506,750 |
| Liquidity coverage ratio | 264.42% | 378.42% |
*Net cash outflows into 30 days: (Interbank borrowings, Financial assets investments, Loans and advances to customers, Derivative financial instruments), minus 30 days contractual maturities of liabilities. Demand deposit Time deposits, Interbank deposits Borrowings from other financial institutions Debt instruments, Derivative financial instruments.
One of the main guidelines of the Bank is to maintain a solid liquidity position, therefore, the ALCO Committee, has established a minimum level of liquid assets, based on the funding needs of each subsidiary, to ensure, as far as possible, that it will always have sufficient liquidity to meet its liabilities when they are due, under both normal and stressed conditions, without incurring unacceptable losses or risking damage to the Bank’s reputation.
The following table shows the liquid assets held by Bank´s:
| Liquid Assets(1) | December 31, 2019 | December 31, 2018 |
| High quality liquid assets* | | |
| Cash | 16,594,906 | 15,370,693 |
| High quality liquid securities | 12,054,474 | 9,268,481 |
| Other Liquid Assets | - | - |
| Other securities** | 1,982,308 | 1,867,576 |
| Total Liquid Assets | 30,631,688 | 26,506,750 |
| (1) | Feature possesses the high liquidity available in all cases, and those liquid assets received by the Central Bank for its operations expansion and monetary contraction. Liquid assets are adjusted by a haircut. The following are considered as liquid assets: cash, repos held for trading and investments held for trading in listed shares in Colombia’s stock exchange, in investment funds units or in other trading debt instruments. |
*High-quality liquid assets: cash and shares that are eligible to be reportable or repo operations, in addition to those liquid assets that the Central Bank receives for its monetary expansion and contraction operations described in paragraph 3.1.1 of the Foreign Regulatory Circular DODM-142 of the Bank of the Republic.
**Other Securities: Securities issued by financial and corporate entities.
| c. | Contractual maturities of financial assets |
The tables below set out the remaining contractual maturities of principal and interest balances of the Group’s financial assets:
Contractual maturities of financial assets December 31, 2019
| Financial Assets | 0 - 1 Year | 1- 3 Years | 3- 5 Years | More than 5 years |
| Cash and balances with central bank | 18,256,065 | - | - | - |
| Interbank borrowings - Repurchase agreements | 5,668,879 | 3,473 | - | - |
| Financial assets investments | 7,596,501 | 5,977,528 | 1,515,494 | 2,511,061 |
| Loans and advances to customers | 68,333,569 | 63,570,825 | 38,880,378 | 61,287,271 |
| Derivative financial instruments | 3,414,986 | 1,439,006 | 602,600 | 1,456,157 |
| Total financial assets | 103,269,999 | 70,990,831 | 40,998,471 | 65,254,489 |
Contractual maturities of financial assets December 31, 2018
| Financial Assets | 0 - 1 Year | 1- 3 Years | 3- 5 Years | More than 5 years |
| Cash and balances with central bank | 15,833,017 | | | |
| Interbank borrowings - Repurchase agreements | 2,965,646 | | | |
| Financial assets investments | 7,512,098 | 4,557,121 | 2,585,777 | 3,608,511 |
| Loans and advances to customers | 61,653,720 | 52,485,542 | 33,393,032 | 59,347,861 |
| Derivative financial instruments | 1,073,804 | 174,475 | 486,746 | 247,268 |
| Total financial assets | 89,038,285 | 57,217,138 | 36,465,555 | 63,203,640 |
| d. | Contractual maturities of financial liabilities |
The tables below set out the remaining contractual maturities of principal and interest balances of the Bank’s financial liabilities:
Contractual maturities of financial liabilities December 31, 2019
| Financial Liabilities | 0 - 1 Year | 1- 3 Years | 3- 5 Years | More than 5 years |
| Demand deposit from customers | 93,570,234 | - | - | - |
| Time deposits from customers | 46,508,889 | 14,550,816 | 4,243,327 | 2,235,994 |
| Interbank deposits-Repurchase agreements | 2,660,153 | 28,720 | - | - |
| Borrowings from other financial institutions | 7,437,449 | 3,332,957 | 1,395,047 | 1,450,059 |
| Debt securities in issue | 3,944,412 | 9,554,767 | 3,740,529 | 6,655,600 |
| Derivative financial instruments | 3,442,440 | 1,832,167 | 657,888 | 891,590 |
| Total financial liabilities | 157,563,577 | 29,299,428 | 10,036,790 | 11,233,243 |
Contractual maturities of financial liabilities December 31, 2018
| Financial Liabilities | 0 - 1 Year | 1- 3 Years | 3- 5 Years | More than 5 years |
| Demand deposit from customers | 85,275,330 | - | - | - |
| Time deposits from customers | 39,104,963 | 14,120,231 | 5,096,152 | 2,037,330 |
| Interbank deposits-Repurchase agreements | 3,132,911 | 531,734 | - | - |
| Borrowings from other financial institutions | 11,149,381 | 2,952,158 | 1,158,784 | 1,844,290 |
| Debt securities in issue | 3,721,909 | 8,078,228 | 7,489,901 | 5,813,722 |
| Derivative financial instruments | 636,410 | 101,836 | 391,930 | 240,727 |
| Total financial liabilities | 143,020,905 | 25,784,187 | 14,136,767 | 9,936,069 |
The expected cash flows for some financial assets and liabilities may vary significantly from their contractual maturity. The main differences are the following:
| · | The demand deposits historically have maintained a tendency to remain stable. |
| · | The mortgages loans, in spite of having contractual maturity between 15 and 30 years, its average life is less than these terms. |
e. Financial guarantees
The tables below set out the remaining contractual maturities of the Group’s financial guarantees
| December 31, 2019 | 0 - 1 Year | 1- 3 Years | 3- 5 Years | More than 5 years |
| In millions of COP |
| Financial guarantees | 3,386,128 | 696,768 | 68,150 | 144,904 |
| December 31, 2018 | 0 - 1 Year | 1- 3 Years | 3- 5 Years | More than 5 years |
| In millions of COP |
| Financial guarantees | 3,370,845 | 1,426,992 | 277,710 | 177,828 |
31.4 Capital management
In order to cover future unexpected losses and be prepared against economic crisis, the Bank is engaged with an active capital management role. To this end, one of the main responsibilities of the Director of Financial Control, is to monitor constantly the capital adequacy allocation and suggest the appropriate measures before crisis take place.
Exercises such as stress testing assessment and Internal Capital Adequacy Assessment Process (ICAAP), are run for internal and external purposes and reported to the Board of Directors and senior levels to ensure all risks are managed according to our risk appetite, policies and regulation.
Simultaneously, senior management is engaged in maintaining a balance between an adequate capital allocation and our shareholders value proposal compliance. In doing so, upcoming investment plans will be funded by capital markets and operational flows without causing negative results among our shareholders´ interests.
In accordance with the Capital Adequacy Requirements, financial institutions in Colombia are required to achieve a minimum solvency ratio (Basic Solvency Risk Index, Tier 1) above 4.5%, and a total solvency risk index (Tier 2) greater than or equal to 9.0%.
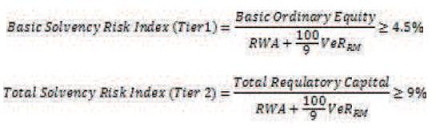
In spite of the above, the management has directed its efforts towards the equity strengthening as shown in table below.
| | As of |
| | December 31, 2019 | December 31 2018 |
| | In millions of COP |
| Regulatory Capital and Capital Adequacy Ratios | | |
| Basic Ordinary Equity | 24,280,973 | 23,965,972 |
| Deductions Basic Ordinary Equity | (4,257,640) | (4,251,247) |
| Total Basic Ordinary Equity | 20,023,333 | 19,714,725 |
| Additional Equity | 6,800,436 | 6,704,144 |
| Total Regulatory Capital | 26,823,769 | 26,418,869 |
| Capital Ratios | | |
| Primary capital to risk-weighted assets (Tier 1) | 9.57% | 10.05% |
| Secondary capital to risk-weighted assets | 3.25% | 3.42% |
| Technical capital to risk-weighted assets (Tier 2) | 12.82% | 13.47% |
NOTE 32. IMPACTS ON APPLICATION OF NEW STANDARDS
| a) | Recently Issued Accounting Pronouncements Applicable in 2019 |
IFRS 16 Leases:
On January 13, 2016, the IASB issued IFRS 16 Leases replacing IAS 17 leases, IFRIC 4 Determination of whether a contract contains a lease, SIC 15 Incentives in lease agreements and SIC 27 Evaluation of the substance of the transaction. This standard establishes the principles of recognition, measurement, presentation and disclosure of leases and requires lessees to account for all their leases under the same balance sheet model similar to the accounting under IAS 17 of the Finance leases. The standard includes two recognition exemptions for lessees: leasing of low-value assets (for example, personal computers) and short-term leases (that is, leases with a term of less than 12 months). At the beginning of the lease, the lessee recognizes a liability for lease payments (liability for lease) and an asset that represent the right to use the underlying asset during the term of the lease (right to use the asset). Lessees must separately recognize the interest expense of the lease liability and the depreciation expense of the right to use.
Lessees must also remeasure the lease liability upon the occurrence of certain events (for example, a change in the term of the lease, a change in future lease payments as a result of a change in the rate or rate used to determine such lease payments). The lessee generally recognizes the amount of the remeasurement of the lease liability as an adjustment in the right of use asset.
The accounting of the lessor under IFRS 16 does not have substantial modifications with respect to the requirements of IAS 17. The lessors continue to classify all their leases using the same classification principles of IAS 17, between financial and operating leases.
For leases previously classified as finance leases the entity recognized the carrying amount of the lease asset and lease liability immediately before transition as the carrying amount of the right of use asset and the lease liability at the date of initial application. The measurement principles of IFRS 16 are only applied after that date.
The Bank chose to use the following practical expedients when adopting IFRS 16 using the modified adoption method for leases previously classified as operating leases using IAS 17:
| a) | Do not carry out an assessment of the impairment of the value of the assets for the right-to-use lease contracts, because prior to the transition to IFRS 16, said contracts were evaluated and none was determined to be onerous; |
| b) | For contracts whose maturity is within 12 months and do not contain a purchase option following the date of initial application, they will be recognized as short-term leases. |
| c) | The initial direct costs of measuring the asset by right to use were excluded on the date of initial application; and |
| d) | Used hindsight to determine the lease term. |
The interest rate implicit in the lease could not be readily determined, that is why The Bank performed an analysis taking in count the currency, lease term, economic environment and class of underlying assets to determinate the weighted average lessee’s incremental borrowing rate. The weighted average lessee’s incremental borrowing effective rate applied to the lease liabilities on January 01, 2019 was 7.19%.
The Bank adopted as of January 01, 2019 the IFRS 16 using the modified retrospective adoption method, where the right-of-use assets are measured as if IFRS 16 had always been applied, using the lessee’s incremental borrowing rate known at the date of transition. Its effects are the following:
The following table sets the lease liability recognized at January 01, 2019:
| | January 01, 2019 |
| Operating lease commitments disclosed as of December 31, 2018(1) | 3,993,490 |
| Lease liability recognized as of January 01, 2019 | 1,848,833 |
| Of which are: | |
| Current lease liabilities | 7,356 |
| Non-current lease liabilities | 1,841,477 |
| (1) | This line does not include short-term leases and low-value leases for value of COP 3,633 and COP 5,040, respectively. |
The recognized right-of-use assets relate to the following types of assets:
| Types of Assets | January 01, 2019 |
| Buildings | 1,487,175 |
| Vehicles | 34,956 |
| Technological equipment | 49,736 |
| Furniture and fixtures | 579 |
| Total right of use assets | 1,572,446 |
The net impact on retained earnings (decrease) as of January 01, 2019 corresponds to COP 184,248. The change in accounting policy affected the following items in the consolidate statement of financial position as of January 01, 2019:
| Concepts | January 01, 2019 |
| Increase in Right of use assets(1) | 1,543,427 |
| Net of Deferred tax | (119,173) |
| Increase in Lease liabilities | 1,848,833 |
| Net of Effect of changes in foreign exchange rate | (9,560) |
| Decrease in Retained earnings | 184,248 |
| (2) | The increase in right of use assets for COP 1,543,427 differs from the COP 1,572,446 presented in the right of use assets at January 01, 2019, in the amount of COP 29,019 due the financial leases recognized by Transportempo S.A.S. under IAS 17 at December 31, 2018. |
IFRS 9, Financial Instruments: The Bank adopted IFRS 9 as issued in July 2014 regarding to hedge accounting from and as of from January 1, 2019. As permitted by the transitional provisions of IFRS 9.7.2, the Bank elected not to restate comparative figures. No adjustments to the carrying amounts of financial assets and liabilities at the date of transition arise.
All hedge relationships designated under IAS 39 as of December 31, 2018, qualified for hedge accounting considering specified qualifying criteria under requirements provided by IFRS 9 on January 1, 2019. In the process of adopting IFRS 9, Banistmo has not identified impacts on the transition from IAS 39 to IFRS 9 on the hedging relationships currently maintained.
NOTE 33. SUBSEQUENT EVENTS
Approval of Consolidated Financial Statements
The consolidated financial statements were approved by the Board of Director on April 21, 2020.
Tender Offer to purchase Bancolombia S.A. senior notes due 2021
On January 8, 2020 the Bank announced that Citigroup Global Markets Inc. commenced an offer to purchase (the “Offer”) for cash any and all of the Issuer’s outstanding 5.950% Senior Notes due 2021 (the “Notes”) upon the terms and subject to the conditions set forth in an Offer to Purchase. The Bank intended to redeem all or a portion of the Notes that remain outstanding following the completion of the Offer.
On January 23, 2020 the Bank priced the public offering of USD 950,000 in aggregate principal amount of its Senior Notes due January 29, 2025 (the “Notes Offering”). The notes have a 5 year maturity and a coupon of 3%, payable semi-annually on January 29 and July 29 of each year, commencing on July 29, 2020. Bancolombia will use the proceeds of the Notes Offering to complete the liability management transaction announced to the market on January 8, 2020 for its 5.950% Senior Notes due 2021 and to redeem all or a portion of those Senior Notes that remain outstanding following completion of that transaction.
The Notes Offering were settled on January 29, 2020.
Acquisition of 40% of the common stock of Grupo Agromercantil Holding
On February 28 2020, Bancolombia S.A announced that it received a notice from BAM Financial Corporation (“BFC”), owner of 40% of the common stock of Grupo Agromercantil Holding (GAH), in which BFC notified its decision to exercise a contractual put option for the sale of the GAH common stock held by BFC to Bancolombia Panama S.A. in accordance with the preexisting agreements between BFC and Bancolombia Panama S.A.
As of the date hereof, Bancolombia Panama S.A. owns 60% of the common stock of GAH. The purchase of 40% of the common stock of GAH from BFC will therefore allow Bancolombia to own 100% of the common stock of GAH. GAH owns the Conglomerado Financiero Agromercantil of Guatemala, which includes among others, Banco Agromercantil of Guatemala (“BAM”).
The aggregate purchase price for the Shares is USD 289,144,606, this amount has been recorded as a financial obligation in Bancolombia’s consolidated financial statements for the fiscal year 2019.
Closing of the transaction will occur after the approval by regulatory authorities which is expected to happen in the third quarter of 2020.
Impacts of COVID-19
Since the beginning of March 2020, the outbreak of COVID-19 has impacted the Bank’s operations, customers, suppliers and employees. This circumstance affects the Bank’s Colombian and Central American operations. It remains unclear at this time how the developments in relation to COVID-19 will evolve through 2020 and the Bank will continue to monitor the situation closely.
As a response to the COVID-19 pandemic, on March 17, 2020 the Colombian government declared the social, economic and ecological emergency. Pursuant to such declaration, the government issued Decree 457 of 2020, which includes a mandatory shelter-in-place order within Colombia, as well as the suspension of international and domestic flights.
Many countries, including those where the Bank operates directly or through its subsidiaries have imposed similar measures, such as mandatory shelter-in-place and the closing of borders or travel prohibitions. These restrictions may adversely affect the jurisdictions where the Bank operates and its ability to conduct businesses as usual in those jurisdictions.
As a response to the effects of COVID-19, in March 2020 Bancolombia started to offer temporary relief measures to assist both personal and small business customers in Colombia during the period of disruption. These measures are supported by the Colombian central bank and Superintendencia Financiera and are being offered throughout the country by the banking sector. Some of the main reliefs are the following:
| - | Deferral of principal and interest payments due on loans that were not impaired as of February 29, 2020 from April 01, 2020 and for up to three months, for mortgage, consumer and small business loans. Also for mortgage loans, clients have the possibility of extending the deferral for an additional three months, by a maximum of six months. The deferral is considered a loan term extension for that period. |
| - | Special interest rates for the acquisition of basic goods such as food and medication through Bancolombia’s credit cards |
If the COVID-19 outbreak continues to cause disruption to economic activity in Colombia and Central America through 2020, there could be potential impairments of long-lived assets, adverse impacts on the Bank’s securities portfolios at fair value and derivatives, as well as impacts on our ability to generate revenues due to lower lending and transaction volumes, and fee revenue, which may impact the Bank’s profitability and capital position.
Changes in economic conditions will be monitored by the Bank as new information becomes available as to reflect in macroeconomic scenarios when assessing impairment of assets.
It is expected that in the first quarter of 2020 there will be higher expected credit losses (ECL) driven by a change in the economic scenarios used to calculate ECL. The COVID-19 outbreak has led to an expected weakening of the GDP forecasts in Colombia and Central America, and the probability of a more adverse economic scenario for the short term is higher than what was expected at 31 December 2019.