Brian Napack, President & CEOJohn Kritzmacher, EVP & CFOBrian Campbell, VP of Investor Relations
SAFE HARBOR STATEMENTThis presentation contains certain forward-looking statements concerning the Company's operations, performance, and financial condition. Reliance should not be placed on forward-looking statements, as actual results may differ materially from those in any forward-looking statements. Any such forward-looking statements are based upon many assumptions and estimates that are inherently subject to uncertainties and contingencies, many of which are beyond the control of the Company and are subject to change based on many important factors. Such factors include, but are not limited to: (i) the level of investment in new technologies and products; (ii) subscriber renewal rates for the Company's journals; (iii) the financial stability and liquidity of journal subscription agents; (iv) the consolidation of book wholesalers and retail accounts; (v) the market position and financial stability of key retailers; (vi) the seasonal nature of the Company's educational business and the impact of the used book market; (vii) worldwide economic and political conditions; (viii) the Company's ability to protect its copyrights and other intellectual property worldwide (ix) the ability of the Company to successfully integrate acquired operations and realize expected opportunities; (x) the Company’s ability to realize operating savings over time and in fiscal year 2022 in connection with our multi-year Business Optimization Program; (xi) the impact of COVID-19 on our operations, performance, and financial condition; and (xii) other factors detailed from time to time in the Company's filings with the Securities and Exchange Commission. The Company undertakes no obligation to update or revise any such forward-looking statements to reflect subsequent events or circumstances. NON-GAAP MEASURESIn this presentation, management provides the following non-GAAP performance measures:Adjusted Earnings Per Share (“Adjusted EPS”);Free Cash Flow less Product Development Spending;Adjusted Contribution to Profit (“Adjusted CTP”) and margin;Adjusted EBITDA and margin;Organic revenue; andResults on a constant currency (“CC”) basis.Management believes non-GAAP financial measures, which exclude the impact of restructuring charges and credits and other items, provide supplementary information to support analyzing operating results and earnings and are commonly used by shareholders to measure our performance. Free Cash Flow less Product Development Spending helps assess our ability over the long term to create value for our shareholders. Results on a constant currency basis removes distortion from the effects of foreign currency movements to provide better comparability of our business trends from period to period applying the same foreign currency exchange rates for the current and equivalent prior period. We have not provided our 2022 outlook for the most directly comparable U.S. GAAP financial measures, as they are not available without unreasonable effort due to the high variability, complexity, and low visibility with respect to certain items, including restructuring charges and credits, gains and losses on foreign currency, and other gains and losses. These items are uncertain, depend on various factors, and could be material to our consolidated results computed in accordance with U.S. GAAP.
Wiley unlocks human potential by powering discovery and learning
Fiscal 2021 Summary 82% FY21 share of revenue from digital & servicesvs. 80% in FY20 Well-established growth strategies in open research and career-connected education are paying offLong term trends in open research, online education, and digital curriculum are being pulled forward, strengthening growth outlookRevenue, profit, and cash flow performance reflected sharp and nimble execution and a highly engaged and inspired workforceAn impact company driving life-changing outcomes in science, education, and career advancement
Open Research Online Education Digital Curriculum Article Output +15%OA Revenue +38%Read-and-publish agreements generating strong momentumHindawi acquisition expands portfolio and drives revenue synergies Online Enrollment +14%New Student Enrollments+20%New university partnerships and programs around the worldStrong pipeline and placements in tech-talent development Digital Content Revenue +22%Digital Courseware Activations+23%Transition to digital courseware returning Ed Publishing to growthShift to virtual corporate training enabling recovery and new opportunity Consistent strategies aligned with accelerating growth trends Fiscal 2021 Metrics
16MWiley Researchers 25KUniversity & Corporate Customers AMSCI ESG Rating 100%Human Rights LGBTQ Score* Growth Strategies Drive Societal ImpactOpen research to increase speed, accessibility, and impact of knowledge ecosystem Career-connected education to close skills gaps and unlock human potential Price-value optimization to expand access and drive equitable education for all Wiley is an Impact Company ESG ProgressSigned UN Global Compact and received positive ESG ratings from third party assessors Achieved full year carbon neutrality and 100% renewable energy certification Signed CEO Action on Diversity & Inclusion; driving industry-wide initiatives on DE&I and sustainability *”Wiley Earns Top Marks in Human Rights Campaign 2021 Corporate Equality Index”
Q4 2021: Focused execution driving strong performance *Revenue +7% at constant currency and excluding acquisitionsAll metrics except for GAAP EPS are at constant currency Revenue+10%*$536M GAAP EPS+$3.56$0.73 Adj. EPS+41%$0.84 Adj. EBITDA+21% $113M Research Publishing & Platforms Revenue (+9%) driven by growth in Open Access, platforms and corporate solutions, and by contributions from acquisitions. Adjusted EBITDA (-6%) due to increased editorial resources to support higher article output, and by higher annual incentive compensation and Hindawi acquisition costsAcademic & Professional Learning Revenue (+12%) driven by digital content and courseware, recovery in corporate training, and timing. Adjusted EBITDA (+57%) driven by revenue growth, business optimization gains, and COVID-related savings, offsetting higher annual incentive compensationEducation ServicesRevenue (+7%) driven by both online degree services and talent development services. Adjusted EBITDA (+32%) driven by revenue growth and business optimization gains, offsetting higher annual incentive compensation
Fiscal 2021: Growth across all key metrics $1,831 $1,942 Revenue +4% GAAP EPS +$3.95 Adjusted EPS +27% $2.40 $356 $419 $2.92 ($1.32) $2.63 $288 $360 $173 $257 Adjusted EBITDA +16% Cash from Ops +25% Free Cash Flow +48%
(millions) Q4 2021 Change Change CC Research Publishing $272 13% 9% Research Platforms $11 6% 6% TOTAL REVENUE $283 13% 9% ADJUSTED EBITDA $92 (6%) ADJ. EBITDA MARGIN 32% FY 2021 Change Change CC $973 7% 5% $43 7% 7% $1,015 7% 5% $357 6% 35% Strong growth in research output (+15%) and usage (+25%)Strategic read-and-publish agreements generating strong momentumHindawi acquisition accelerates market position, drives revenue synergies Momentum continuing for corporate solutions, platforms, and society publishingAdvances in publishing optimization enabling significant volume growth Full YearSummary Research Publishing & Platforms Research revenue at constant currency and excluding acquisitions up 4% and 3% for the quarter and year
Research in Fiscal 2022: Growth accelerating Fiscal Year 2022 Market DynamicsGlobal R&D spending growth acceleratingStrong demand to publish and access researchPeer-reviewed research remains essential and in demandShift to OA creating attractive PxQ environmentCorporate demand for research continuing to increase Organic Revenue Growth At constant currency and excluding impact of acquisitions FY20 FY21 FY22P +2% +3% Mid-single digit growth
(millions) Q4 2021 Change Change CC Education Publishing $99 17% 15% Professional Learning $74 13% 9% TOTAL REVENUE $173 15% 12% ADJUSTED EBITDA $46 57% ADJ. EBITDA MARGIN 27% FY 2021 Change Change CC $364 3% 2% $281 (6%) (8%) $645 (1%) (2%) $164 4% 25% Ed Pub growth from strong digital portfolio (revenue up double-digits) and focus on high-demand disciplinesFaster recovery than expected in corporate training as virtual training takes holdDummies publishing growth driven by demand for timely titlesAccelerated 2H profit from revenue momentum and business optimization gains Academic & Professional Learning Full YearSummary
Fiscal Year 2022 Market DynamicsContinued broad adoption of digital content and courseware in academic and professional environmentsHigher education enrollment expected to improve but COVID-related uncertainty remainsIncreased corporate emphasis on training and e-learningChallenging labor market driving further need for upskilling, reskilling, and certification Organic Revenue Performance At constant currency and excluding impact of acquisitions FY20 FY21 FY22P -9% -3% Low-single digit growth APL in Fiscal 2022: Return to growth
(millions)Adj Q4 2021 Change Change CC Education Services $64 8% 8% Mthree $16 12% 4% TOTAL REVENUE $80 9% 7% ADJUSTED EBITDA $15 32% ADJ. EBITDA MARGIN 19% FY 2021 Change Change CC $228 8% 8% $54 $282 21% 21% $51 +$31 18% Strong year for enrollment (+14%) in our online degree programsEight new university partners signed in the US, Australia, Israel, and LebanonAccelerating momentum for mthree; four new corporate clients signed and strong growth in IT talent placementExceptional profit growth by enhancing the efficiency of the student journey Education Services Education Services revenue at constant currency and excluding acquisitions up 7% for the quarter and year Full YearSummary
Fiscal Year 2022 Market DynamicsUniversity transition to online and hybrid deliveryDemand for graduate and alternative credentials risingStrong focus on affordable pathways to high-demand jobsUrgent need for companies to fill Tech skills gap Organic Revenue Growth At constant currency and excluding impact of acquisitions FY20 FY21 FY22P +11% +7% Low-teens growth Education Services in Fiscal 2022: Growth accelerating
Fiscal 2022 Outlook and Financial Position
FY22 Key Growth and Optimization InitiativesOpen ResearchPublish more to meet global demandDrive Hindawi integration and revenue synergiesScale service offerings for societies and corporationsCareer-Connected EducationExpand online degree programs and drive online enrollment Scale digital courseware Expand mthree corporate pipeline and existing relationships Business OptimizationExpand publishing capacity and drive workflow automationExpand student acquisition capabilitiesBuild DTC capabilities and enhance ecommerce experience Wiley Revenue Growth Trajectory At constant currency and including acquisitions Fiscal 2022: Targeted growth strategies and investments 6-8% est. 4% 3%
Metric Fiscal 2021 Fiscal 2022 Outlook Revenue $1,942 $2,070 to $2,100 Adjusted EBITDA $419 $415 to $435 Adjusted EPS $2.92 $2.80 to $3.05 Free Cash Flow $257 $200 to $220 Fiscal 2022 Outlook Revenue Outlook: revenue to exceed $2B for the first time, with mid-to-high single digit growth anticipated for Research, low-single digit growth for APL, and low-teens growth for Education ServicesEarnings Outlook: profit gains from revenue growth to be tempered by investments to accelerate growth initiatives, as well as higher T&E expenses due to the resumption of in-person business activities. Adjusted EPS growth expected to be moderated by higher depreciation and amortization expense, and a higher effective tax rate Free Cash Flow Outlook: strong cash earnings to be partially offset by higher capex (outlook of $120-$130 million vs. $103 million in Fiscal 2021), non-recurrence of a $21 million tax refund, and higher annual incentive compensation payments related to Fiscal 2021 performance
Balance Sheet, Cash Flow, and Returns to Shareholders Modest Leverage: Net Debt/EBITDA 1.7 TTM inclusive of Hindawi acquisitionFree Cash Flow: $257M (vs. $173M in FY20) due to increased cash earnings, lower capex, and one-time itemsCapex: $103M (vs. $115M in prior year period) focused on development of tech-enabled products and servicesM&A: Acquisition of Hindawi (Open Research) for $298MDividends: Wiley allocated 30% of FCF to dividends in Fiscal 2021; raised dividend for 27th consecutive yearShare Repurchases: Paused through early January 2021; acquired ~310K shares at average cost of $50.93/ share Wiley Capital Allocation
Executive Summary Well-established growth strategies in open research and career-connected education are paying offLong term trends in open research, online education, and digital curriculum are being pulled forward, strengthening growth outlookFiscal 2021 revenue, profit, and cash flow performance reflected sharp and nimble execution and a highly engaged and inspired workforceStrong revenue trajectory to continue in Fiscal 2022, with organic growth expected in all segmentsResearch and Education opportunities are expanding, enabling continued long-term momentum Solid balance sheet and reliable cash flow support robust capital allocation to drive and sustain higher growth and reward long-term shareholders
New IR website at https://investors.wiley.com/Q1 2022 Earnings Call – September 2, 2021Investor Day – October 29, 2021Thank you for joining us. Contact us for follow-up at:brian.campbell@wiley.com | +1(201) 748-6874
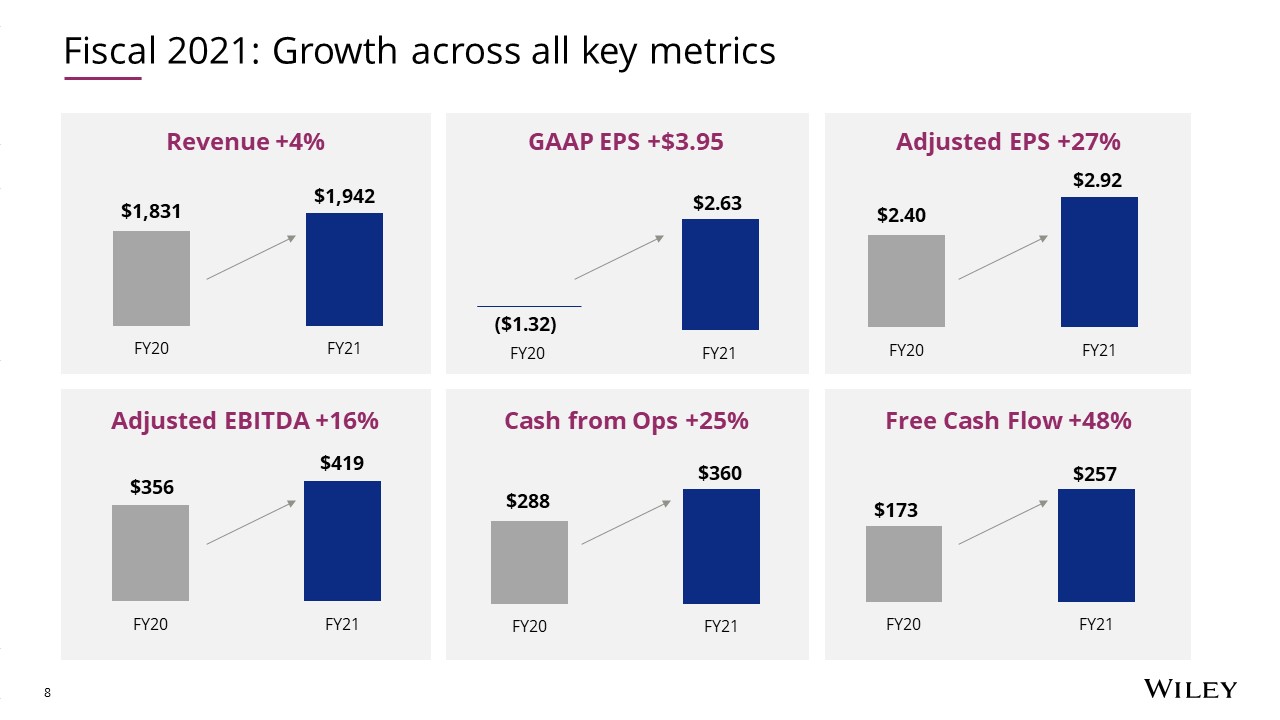
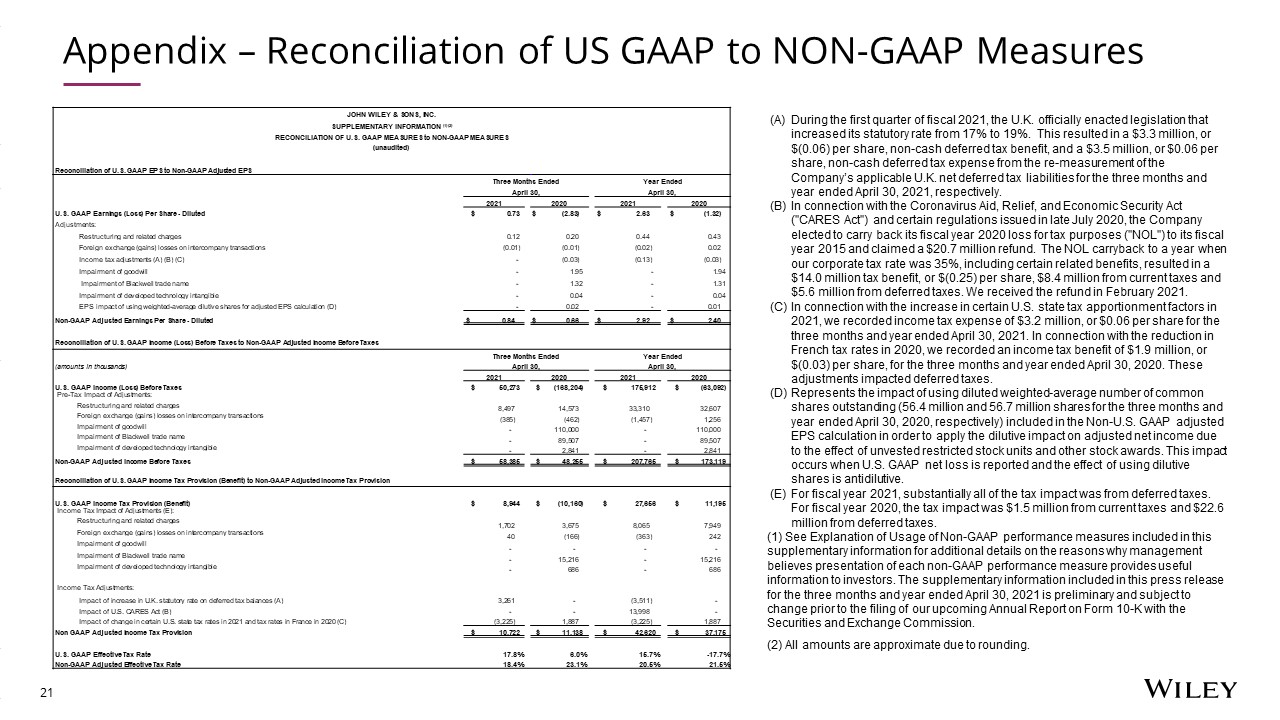
Appendix – Reconciliation of US GAAP to NON-GAAP Measures JOHN WILEY & SONS, INC. SUPPLEMENTARY INFORMATION (1) (2) RECONCILIATION OF U.S. GAAP MEASURES to NON-GAAP MEASURES (unaudited) Reconciliation of U.S. GAAP EPS to Non-GAAP Adjusted EPS Three Months Ended Year Ended April 30, April 30, 2021 2020 2021 2020 U.S. GAAP Earnings (Loss) Per Share - Diluted $ 0.73 $ (2.83) $ 2.63 $ (1.32) Adjustments: Restructuring and related charges 0.12 0.20 0.44 0.43 Foreign exchange (gains) losses on intercompany transactions (0.01) (0.01) (0.02) 0.02 Income tax adjustments (A) (B) (C) - (0.03) (0.13) (0.03) Impairment of goodwill - 1.95 - 1.94 Impairment of Blackwell trade name - 1.32 - 1.31 Impairment of developed technology intangible - 0.04 - 0.04 EPS impact of using weighted-average dilutive shares for adjusted EPS calculation (D) - 0.02 - 0.01 Non-GAAP Adjusted Earnings Per Share - Diluted $ 0.84 $ 0.66 $ 2.92 $ 2.40 Reconciliation of U.S. GAAP Income (Loss) Before Taxes to Non-GAAP Adjusted Income Before Taxes Three Months Ended Year Ended (amounts in thousands) April 30, April 30, 2021 2020 2021 2020 U.S. GAAP Income (Loss) Before Taxes $ 50,273 $ (168,204) $ 175,912 $ (63,092) Pre-Tax Impact of Adjustments: Restructuring and related charges 8,497 14,573 33,310 32,607 Foreign exchange (gains) losses on intercompany transactions (385) (462) (1,457) 1,256 Impairment of goodwill - 110,000 - 110,000 Impairment of Blackwell trade name - 89,507 - 89,507 Impairment of developed technology intangible - 2,841 - 2,841 Non-GAAP Adjusted Income Before Taxes $ 58,385 $ 48,255 $ 207,765 $ 173,119 Reconciliation of U.S. GAAP Income Tax Provision (Benefit) to Non-GAAP Adjusted Income Tax Provision U.S. GAAP Income Tax Provision (Benefit) $ 8,944 $ (10,160) $ 27,656 $ 11,195 Income Tax Impact of Adjustments (E): Restructuring and related charges 1,702 3,675 8,065 7,949 Foreign exchange (gains) losses on intercompany transactions 40 (166) (363) 242 Impairment of goodwill - - - - Impairment of Blackwell trade name - 15,216 - 15,216 Impairment of developed technology intangible - 686 - 686 Income Tax Adjustments: Impact of increase in U.K. statutory rate on deferred tax balances (A) 3,261 - (3,511) - Impact of U.S. CARES Act (B) - - 13,998 - Impact of change in certain U.S. state tax rates in 2021 and tax rates in France in 2020 (C) (3,225) 1,887 (3,225) 1,887 Non GAAP Adjusted Income Tax Provision $ 10,722 $ 11,138 $ 42,620 $ 37,175 U.S. GAAP Effective Tax Rate 17.8% 6.0% 15.7% -17.7% Non-GAAP Adjusted Effective Tax Rate 18.4% 23.1% 20.5% 21.5% (A) During the first quarter of fiscal 2021, the U.K. officially enacted legislation that increased its statutory rate from 17% to 19%. This resulted in a $3.3 million, or $(0.06) per share, non-cash deferred tax benefit, and a $3.5 million, or $0.06 per share, non-cash deferred tax expense from the re-measurement of the Company’s applicable U.K. net deferred tax liabilities for the three months and year ended April 30, 2021, respectively. (B) In connection with the Coronavirus Aid, Relief, and Economic Security Act ("CARES Act") and certain regulations issued in late July 2020, the Company elected to carry back its fiscal year 2020 loss for tax purposes ("NOL") to its fiscal year 2015 and claimed a $20.7 million refund. The NOL carryback to a year when our corporate tax rate was 35%, including certain related benefits, resulted in a $14.0 million tax benefit, or $(0.25) per share, $8.4 million from current taxes and $5.6 million from deferred taxes. We received the refund in February 2021. (C) In connection with the increase in certain U.S. state tax apportionment factors in 2021, we recorded income tax expense of $3.2 million, or $0.06 per share for the three months and year ended April 30, 2021. In connection with the reduction in French tax rates in 2020, we recorded an income tax benefit of $1.9 million, or $(0.03) per share, for the three months and year ended April 30, 2020. These adjustments impacted deferred taxes. (D) Represents the impact of using diluted weighted-average number of common shares outstanding (56.4 million and 56.7 million shares for the three months and year ended April 30, 2020, respectively) included in the Non-U.S. GAAP adjusted EPS calculation in order to apply the dilutive impact on adjusted net income due to the effect of unvested restricted stock units and other stock awards. This impact occurs when U.S. GAAP net loss is reported and the effect of using dilutive shares is antidilutive. (E) For fiscal year 2021, substantially all of the tax impact was from deferred taxes. For fiscal year 2020, the tax impact was $1.5 million from current taxes and $22.6 million from deferred taxes. (1) See Explanation of Usage of Non-GAAP performance measures included in this supplementary information for additional details on the reasons why management believes presentation of each non-GAAP performance measure provides useful information to investors. The supplementary information included in this press release for the three months and year ended April 30, 2021 is preliminary and subject to change prior to the filing of our upcoming Annual Report on Form 10-K with the Securities and Exchange Commission. (2) All amounts are approximate due to rounding.
Appendix – Reconciliation of Net Income to Adjusted EBITDA JOHN WILEY & SONS, INC. SUPPLEMENTARY INFORMATION (1) RECONCILIATION OF GAAP NET INCOME (LOSS) TO NON-GAAP EBITDA AND ADJUSTED EBITDA (unaudited) Three Months Ended Year Ended April 30, April 30, 2021 2020 2020 2021 2020 2020 Net Income (Loss) $ 41,329 $ (158,044) $ (158,044) $ 148,256 $ (74,287) $ (74,287) Interest expense 4,455 5,786 5,786 18,383 24,959 24,959 Provision (Benefit) for income taxes 8,944 (10,160) (10,160) 27,656 11,195 11,195 Depreciation and amortization 52,936 46,589 46,589 200,189 175,127 175,127 Non-GAAP EBITDA 107,664 (115,829) (115,829) 394,484 136,994 136,994 Impairment of goodwill and intangible assets - 202,348 202,348 - 202,348 202,348 Restructuring and related charges 8,497 14,573 14,573 33,310 32,607 32,607 Foreign exchange transaction losses (gains) 1,504 (4,534) (4,534) 7,977 (2,773) (2,773) Other income (4,992) (3,779) (3,779) (16,761) (13,381) (13,381) Non-GAAP Adjusted EBITDA $ 112,673 $ 92,779 $ 92,779 $ 419,010 $ 355,795 $ 355,795 Adjusted EBITDA Margin 21.0% 19.5% 19.5% 21.6% 19.4% 19.4% Notes: (1) See Explanation of Usage of Non-GAAP performance measures included in this supplementary information for additional details on the reasons why management believes presentation of each non-GAAP performance measure provides useful information to investors. The supplementary information included in this press release for the three months and year ended April 30, 2021 is preliminary and subject to change prior to the filing of our upcoming Annual Report on Form 10-K with the Securities and Exchange Commission.