Table of Contents
| o | REGISTRATION STATEMENT PURSUANT TO SECTION 12(b) OR 12(g) OF THE SECURITIES EXCHANGE ACT OF 1934 |
| þ | ANNUAL REPORT PURSUANT TO SECTION 13 OR 15(d) OF THE SECURITIES EXCHANGE ACT OF 1934 |
| o | TRANSITION REPORT PURSUANT TO SECTION 13 OR 15(d) OF THE SECURITIES EXCHANGE ACT OF 1934 |
| o | SHELL COMPANY REPORT PURSUANT TO SECTION 13 OR 15(d) OF THE SECURITIES EXCHANGE ACT OF 1934 |
(Translation of Registrant’s name into English)
(Jurisdiction of Incorporation or Organization)
São Paulo, SP—CEP 05477-000 Brazil
(Address of principal executive offices) (Zip code)
| Title of Each Class | Name of Each Exchange on which Registered | |
| Preferred Shares, Class A, no par value per share, each represented by American Depositary Receipts | New York Stock Exchange |
Yesþ Noo
Yeso Noþ
Yesþ Noo
Yeso Noþ
Table of Contents
| • | Brazilian Law No. 6,404/76, as amended by Brazilian Law No. 9,457/97 and Brazilian Law No. 10,303/01, which we refer to collectively as the Brazilian Corporation Law; | ||
| • | the rules and regulations of the Brazilian Securities Commission (Comissão de Valores Mobiliários); and | ||
| • | the accounting standards issued by the Brazilian Institute of Independent Accountants (Instituto dos Auditores Independentes do Brasil). |
Table of Contents
| • | Prior to January 1, 2006, we recorded expenditures for programmed maintenance shutdowns of our plants as “Deferred charges.” Such expenses occur at scheduled intervals from one to six years and are depreciated to production cost until the beginning of the next maintenance shutdown. Beginning January 1, 2006, in accordance with IBRACON Technical Interpretation 01/2006, we recorded all programmed maintenance shutdown expenses in property, plant and equipment as “Machinery, equipment and facilities.” In addition, the retrospective effects of depreciation with the adoption of this interpretation was recognized as shareholders’ equity. Accordingly, for periods ending after January 1, 2006, we have reclassified the amount of R$400.2 million from deferred charges to property, plant and equipment, and recognized the amount of R$164.9 million in shareholders’ equity. | ||
| • | Prior to January 1, 2006, we recorded quotas subject to mandatory redemption as a separate line item of our balance sheet and not as part of loans and financing. Pursuant to Brazilian Securities Commission (Comissão de Valores Mobiliários, or CVM) Release 01/2006, we now present liabilities related to quotas subject to mandatory redemption as part of loans and financing. Accordingly, short-term loans and financing (including current portion of long-term debt) at December 31, 2005 and 2004 reflect the reclassification of quotas subject to mandatory redemption in the amount of R$225.4 million and R$22.4 million, respectively, and long-term loans and financing at December 31, 2005 and 2004 reflect the reclassification of quotas subject to mandatory redemption in the amount of R$404.1 million and R$201.8 million, respectively. | ||
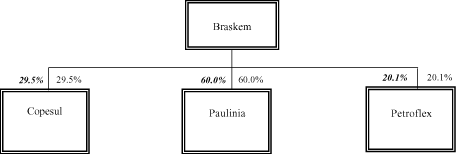
| • | Prior to 2005, our management was considering strategic alternatives with respect to the share capital that we own in Petroflex Indústria e Comércio S.A., or Petroflex, including the possible sale of this share capital. In 2005, our management decided to maintain its investment in Petroflex. At December 31, 2005, we owned 20.1% of the total and voting share capital of Petroflex. As a result, we have proportionally consolidated Petroflex in our consolidated financial statements at and for the year ended December 31, 2005. In previous years, we recorded our investment in Petroflex as an investment in an associated company. In order to provide a better comparison among 2006, 2005 and 2004, we have proportionally consolidated Petroflex in our consolidated financial statements at and for the year ended December 31, 2004. | ||
| • | Beginning on January 1, 2005, pursuant to CVM Instruction 408, we are required to fully consolidate special purpose entities in our consolidated financial statements if specific criteria are met. These special purpose entities include, among others, Chemical Credit Rights Investment Fund (Chemical Fundo de Investimento em Direitos Creditórios) and Chemical Credit Rights Investment Fund II (Chemical II Fundo de Investimento em Direitos Creditórios). In order to provide a better comparison between 2006, 2005 and 2004, we have fully consolidated our special purpose entities in our consolidated financial statements at and for the year ended December 31, 2004. See notes 2 and 4 to our consolidated financial statements. | ||
| • | Prior to 2005, we proportionally consolidated Companhia de Desenvolvimento Rio Verde, or Codeverde, in our consolidated financial statements. At December 31, 2005, we owned 35.5% of the total share capital and voting share capital of Codeverde. In 2005, the CVM granted our request for authorization to record our investment in Codeverde as an investment in an associated company pursuant to Instruction 247. In order to provide a better comparison between 2006, 2005 and 2004, we have recorded our investment in Codeverde as an investment in an associated company in our consolidated financial statements at and for the year ended December 31, 2004. See notes 2 and 4 to our consolidated financial statements. | ||
| • | Prior to December 31, 2004, judicial deposits were recorded as long-term receivables. Pursuant to CVM Deliberation No. 489, we now state contingent liabilities net of the corresponding judicial deposits. In our 2004 consolidated balance sheet, we have reclassified R$170.3 million as long-term taxes and contributions. |
2
Table of Contents
| • | “production capacity” means the annual projected capacity for a particular facility, calculated based upon operations for 24 hours each day of a year and deducting scheduled downtime for regular maintenance; and | ||
| • | “ton” means a metric ton, which is equal to 1,000 kilograms or 2,204.62 pounds. |
3
Table of Contents
4
Table of Contents
| • | general economic, political and business conditions in our company’s markets, both in Brazil and abroad, including demand and prices for petrochemical products; | ||
| • | interest rate, commodity price, inflation and exchange rate volatility; | ||
| • | the cyclical nature of the Brazilian and global petrochemical industries; | ||
| • | our ability to obtain financing on satisfactory terms; | ||
| • | competition; | ||
| • | actions taken by our major shareholders and other shareholders with convertible securities entitling them to acquire significant numbers of our shares; | ||
| • | prices of naphtha and other raw materials; | ||
| • | decisions rendered in pending major tax, labor and other legal proceedings; | ||
| • | final decisions by Brazilian antitrust authorities regarding recent acquisitions by our company; and | ||
| • | other factors identified or discussed under “Item 3. Key Information—Risk Factors.” |
5
Table of Contents
| At and for the Year Ended December 31, | ||||||||||||||||||||||||
| 2006(1) | 2006 | 2005 | 2004 | 2003(2) | 2002(2)(3) | |||||||||||||||||||
| (in millions of | ||||||||||||||||||||||||
| US$, except | ||||||||||||||||||||||||
| financial | ||||||||||||||||||||||||
| ratios) | (in millions ofreais, except financial ratios) | |||||||||||||||||||||||
Statement of Operations Data | ||||||||||||||||||||||||
Brazilian GAAP: | ||||||||||||||||||||||||
| Net sales revenue | US$ | 6,077.0 | R$ | 12,992.7 | R$ | 13,075.1 | R$ | 12,389.5 | R$ | 10,300.2 | R$ | 7,576.6 | ||||||||||||
| Cost of sales and services rendered | (5,047.7 | ) | (10,792.1 | ) | (10,361.7 | ) | (9,223.0 | ) | (8,224.6 | ) | (6,175.5 | ) | ||||||||||||
| Gross profit | 1,029.3 | 2,200.6 | 2,713.4 | 3,166.5 | 2,075.6 | 1,401.1 | ||||||||||||||||||
| Selling, general and administrative expenses | (445.0 | ) | (951.5 | ) | (787.1 | ) | (677.0 | ) | (488.4 | ) | (577.7 | ) | ||||||||||||
| Investment in associated companies, net(4) | (13.5 | ) | (28.8 | ) | (109.8 | ) | (107.6 | ) | (170.5 | ) | (251.7 | ) | ||||||||||||
| Depreciation and amortization | (180.1 | ) | (385.0 | ) | (355.6 | ) | (359.7 | ) | (193.5 | ) | (222.4 | ) | ||||||||||||
| Financial expenses | (513.5 | ) | (1,097.9 | ) | (675.8 | ) | (1,307.2 | ) | (720.8 | ) | (3,481.5 | ) | ||||||||||||
| Financial income | 74.5 | 159.5 | (33.6 | ) | 68.6 | 9.2 | 619.6 | |||||||||||||||||
| Zero-rated IPI credit | — | — | — | — | — | 1,030.1 | ||||||||||||||||||
| Other operating income, net | 87.1 | 186.1 | 22.8 | 43.0 | 55.5 | 102.6 | ||||||||||||||||||
| Operating income (loss) | 38.8 | 83.0 | 774.3 | 826.6 | 567.1 | (1,379.9 | ) | |||||||||||||||||
| Non-operating expenses, net | 3.3 | 7.1 | (25.2 | ) | (29.8 | ) | (4.5 | ) | (98.0 | ) | ||||||||||||||
| Income (loss) before income tax and social contribution (current and deferred) and minority interest | 42.1 | 90.1 | 749.1 | 796.8 | 562.6 | (1,477.9 | ) | |||||||||||||||||
| Income tax and social contribution (current and deferred) | 6.0 | 12.8 | (177.3 | ) | (85.1 | ) | (121.3 | ) | (89.8 | ) | ||||||||||||||
| Income (loss) before minority interest | 48.1 | 102.9 | 571.8 | 711.7 | 441.3 | (1,567.7 | ) | |||||||||||||||||
6
Table of Contents
| At and for the Year Ended December 31, | ||||||||||||||||||||||||
| 2006(1) | 2006 | 2005 | 2004 | 2003(2) | 2002(2)(3) | |||||||||||||||||||
| (in millions of | ||||||||||||||||||||||||
| US$, except | ||||||||||||||||||||||||
| financial | ||||||||||||||||||||||||
| ratios) | (in millions ofreais, except financial ratios) | |||||||||||||||||||||||
| Minority interest | (0.7 | ) | (1.6 | ) | 54.0 | (24.6 | ) | (226.2 | ) | 189.0 | ||||||||||||||
| Net income (loss) | US$ | 47.4 | R$ | 101.3 | R$ | 625.8 | R$ | 687.1 | R$ | 215.1 | R$ | (1,378.7 | ) | |||||||||||
| Number of shares outstanding at year end, excluding treasury shares (in thousands): | ||||||||||||||||||||||||
| Common shares | 123,492 | 120,860 | 120,860 | 102,432 | 98,087 | |||||||||||||||||||
| Class A preferred shares | 231,744 | 240,393 | 240,373 | 170,379 | 168,491 | |||||||||||||||||||
| Class B preferred shares | 803 | 803 | 842 | 916 | 916 | |||||||||||||||||||
| Net income (loss) per share at year end | 0.13 | 0.28 | 1.73 | 1.90 | 0.79 | (5.15 | ) | |||||||||||||||||
| Net income (loss) per ADS at year end | 0.27 | 0.57 | 3.46 | 3.80 | 1.57 | (10.31 | ) | |||||||||||||||||
| Dividends declared per share: | ||||||||||||||||||||||||
| Common shares | — | — | 0.90 | 0.56 | — | — | ||||||||||||||||||
| Class A preferred shares | 0.07 | 0.16 | 0.90 | 0.56 | — | 0.13 | ||||||||||||||||||
| Class B preferred shares | 0.07 | 0.16 | 0.56 | 0.56 | — | 0.13 | ||||||||||||||||||
| Dividends declared per ADS | 0.15 | 0.32 | 1.80 | 1.12 | — | — | ||||||||||||||||||
U.S. GAAP: | ||||||||||||||||||||||||
| Net income (loss) for the year | US$ | 75.6 | R$ | 161.6 | R$ | 741.2 | R$ | 843.1 | R$ | 378.1 | R$ | (1,144.0 | ) | |||||||||||
| Basic earnings (loss) per share (weighted average): | ||||||||||||||||||||||||
| Common shares | 0.06 | 0.13 | 2.05 | 2.63 | 1.41 | (11.93 | ) | |||||||||||||||||
| Class A preferred shares | 0.28 | 0.59 | 2.05 | 2.69 | 1.37 | — | ||||||||||||||||||
| Class B preferred shares | 0.29 | 0.63 | 0.63 | 0.56 | 0.44 | — | ||||||||||||||||||
| Basic earnings (loss) per ADS (weighted average) | 0.55 | 1.18 | 4.10 | 5.38 | 2.74 | — | ||||||||||||||||||
| Diluted earnings (loss) per share (weighted average): | ||||||||||||||||||||||||
| Common shares | 0.06 | 0.13 | 1.95 | 2.40 | 1.41 | (11.93 | ) | |||||||||||||||||
| Class A preferred shares | 0.28 | 0.59 | 1.95 | 2.40 | 1.37 | — | ||||||||||||||||||
| Class B preferred shares | 0.29 | 0.63 | 0.63 | 0.56 | 0.44 | — | ||||||||||||||||||
| Diluted earnings (loss) per ADS (weighted average) | 0.55 | 1.18 | 3.90 | 4.80 | 2.40 | — | ||||||||||||||||||
Balance Sheet Data | ||||||||||||||||||||||||
Brazilian GAAP: | ||||||||||||||||||||||||
| Cash, cash equivalents and other investments | US$ | 917.2 | R$ | 1,961.0 | R$ | 2,281.5 | R$ | 1,815.6 | R$ | 1,221.2 | R$ | 821.0 | ||||||||||||
| Short-term trade accounts receivable | 746.0 | 1,594.9 | 1,493.3 | 1,630.6 | 1,241.0 | 959.0 | ||||||||||||||||||
| Short-term inventories | 826.6 | 1,767.3 | 1,567.4 | 1,562.4 | 1,092.3 | 889.1 | ||||||||||||||||||
| Property, plant and equipment, net (5) | 3,128.5 | 6,688.7 | 6,364.4 | 5,830.4 | 5,090.9 | 5,296.7 | ||||||||||||||||||
| Total assets | 7,626.0 | 16,304.3 | 15,590.8 | 15,050.4 | 14,005.6 | 13,898.2 | ||||||||||||||||||
| Short-term loans and financing (including current portion of long-term debt) (6) | 305.8 | 653.9 | 1,120.4 | 1,808.3 | 2,764.1 | 2,746.1 | ||||||||||||||||||
| Short-term debentures | 541.5 | 1,157.7 | 9.3 | 5.0 | 353.4 | 32.1 | ||||||||||||||||||
| Short-term related party debt | — | — | 3.1 | — | 5.5 | 8.2 | ||||||||||||||||||
| Long-term loans and financing (6) | 1,840.9 | 3,935.8 | 3,261.6 | 3,261.4 | 3,628.0 | 3,891.6 | ||||||||||||||||||
| Long-term debentures | 459.4 | 982.2 | 1,599.3 | 1,167.9 | 1,143.0 | 1,190.2 | ||||||||||||||||||
| Long-term related party debt | 2.2 | 4.8 | 3.0 | 115.8 | 177.6 | 189.3 | ||||||||||||||||||
| Minority interest | 10.2 | 21.8 | 121.2 | 203.1 | 554.4 | 433.1 | ||||||||||||||||||
7
Table of Contents
| At and for the Year Ended December 31, | ||||||||||||||||||||||||
| 2006(1) | 2006 | 2005 | 2004 | 2003(2) | 2002(2)(3) | |||||||||||||||||||
| (in millions of | ||||||||||||||||||||||||
| US$, except | ||||||||||||||||||||||||
| financial | ||||||||||||||||||||||||
| ratios) | (in millions ofreais, except financial ratios) | |||||||||||||||||||||||
| Share capital | 1,640.9 | 3,508.3 | 3,403.0 | 3,403.0 | 1,887.4 | 1,845.4 | ||||||||||||||||||
| Shareholders’ equity | 2,016.8 | 4,311.9 | 4,535.8 | 4,183.7 | 2,112.6 | 1,821.8 | ||||||||||||||||||
U.S. GAAP | ||||||||||||||||||||||||
| Total assets | US$ | 6,964.8 | R$ | 14,890.7 | R$ | 13,634.0 | R$ | 12,671.7 | R$ | 11,058.2 | R$ | 10,531.7 | ||||||||||||
| Shareholders’ equity | 1,387.7 | 2,966.8 | 2,918.4 | 2,439.6 | 7.8 | (415.2 | ) | |||||||||||||||||
Other Financial Information | ||||||||||||||||||||||||
Brazilian GAAP: | ||||||||||||||||||||||||
Cash Flow Data: | ||||||||||||||||||||||||
| Net cash provided by (used in): | ||||||||||||||||||||||||
| Operating activities | US$ | 189.6 | R$ | 405.3 | R$ | 1,719.4 | R$ | 1,916.0 | R$ | 596.9 | R$ | 790.0 | ||||||||||||
| Investing activities | (567.4 | ) | (1,213.1 | ) | (1,048.0 | ) | (1,014.4 | ) | (469.4 | ) | (646.7 | ) | ||||||||||||
| Financing activities | 102.5 | 219.2 | (329.7 | ) | 166.0 | 379.1 | (237.2 | ) | ||||||||||||||||
Other Information: | ||||||||||||||||||||||||
| Capital expenditures: | ||||||||||||||||||||||||
| Property, plant and equipment and intangible assets | US$ | 445.7 | R$ | 953.0 | R$ | 930.2 | R$ | 704.4 | R$ | 223.7 | R$ | 419.9 | ||||||||||||
| Investments in other companies | 104.2 | 222.7 | 34.0 | 23.6 | 71.7 | 13.1 | ||||||||||||||||||
| At and for the Year Ended December 31, | ||||||||||||||||||||
| 2006 | 2005 | 2004 | 2003 | 2002 | ||||||||||||||||
Operating Data(7): | ||||||||||||||||||||
| Ethylene: | ||||||||||||||||||||
| Domestic sales volume (in thousands of tons) | 1,108.5 | 1,169.8 | 1,098.9 | 1,047.3 | 994.8 | |||||||||||||||
| Average domestic price per ton (in R$) | 2,282 | 2,204 | 2,095 | 1,655 | 1,292 | |||||||||||||||
| Propylene: | ||||||||||||||||||||
| Domestic sales volume (in thousands of tons) | 413.0 | 497.5 | 446.8 | 403.4 | 415.2 | |||||||||||||||
| Average domestic price per ton (in R$) | 2,110 | 2,132 | 1,833 | 1,477 | 1,106 | |||||||||||||||
| Polyethylene: | ||||||||||||||||||||
| Domestic sales volume (in thousands of tons) | 672.0 | 502.3 | 498.7 | 446.1 | 491.7 | |||||||||||||||
| Average domestic price per ton (in R$) | 3,276 | 3,072 | 2,987 | 2,567 | 2,007 | |||||||||||||||
| Polypropylene: | ||||||||||||||||||||
| Domestic sales volume (in thousands of tons) | 453.2 | 419.9 | 418.5 | 374.9 | 395.1 | |||||||||||||||
| Average domestic price per ton (in R$) | 3,344 | 3,344 | 3,155 | 2,689 | 1,931 | |||||||||||||||
| Polyvinylchloride: | ||||||||||||||||||||
| Domestic sales volume (in thousands of tons) | 400.4 | 378.9 | 394.4 | 342.4 | 350.1 | |||||||||||||||
| Average domestic price per ton (in R$) | 2,518 | 2,747 | 3,042 | 2,390 | 2,034 | |||||||||||||||
| Number of employees (at period end) | 3,494 | 3,262 | 2,996 | 2,868 | 2,817 | |||||||||||||||
| (1) | Translated for convenience only using the selling rate as reported by the Central Bank at December 31, 2006 forreaisinto U.S. dollars of R$2.138=US$1.00. | |
| (2) | Does not give effect to reclassification of Codeverde. See “Introduction—Financial Statements.” | |
| (3) | Does not give effect to reclassification of Petroflex. See “Introduction—Financial Statements.” | |
| (4) | Investment in associated companies, net comprises equity in the results, amortization of goodwill, net, foreign exchange variation and tax incentives and other. | |
| (5) | Includes all programmed maintenance shutdown expenses as “Machinery, equipment and facilities”. Prior to January 1, 2006, we recorded expenditures for programmed maintenance shutdowns of our plants as “Deferred charges.” Beginning January 1, 2006, in accordance with IBRACON Technical Interpretation 01/2006, we now record all programmed maintenance shutdown expenses in “Property, plant and equipment.” Accordingly, at |
8
Table of Contents
\
| December 31, 2005 and 2004 we have reclassified “Deferred charges” in the amount of R$400.2 million and R$372.8 million, respectively, as “Property, plant and equipment.” | ||
| (6) | Includes quotas (i.e., shares) subject to mandatory redemption. Prior to January 1, 2006, we recorded quotas subject to mandatory redemption as a separate line item of our balance sheet and not as part of loans and financing. Pursuant to CVM Release 01/2006, we now present liabilities related to quotas subject to mandatory redemption as part of loans and financing. Accordingly, short-term loans and financing (including current portion of long-term debt) at December 31, 2005 and 2004 reflect the reclassification of quotas subject to mandatory redemption in the amount of R$225.4 million and R$22.4 million, respectively, and long-term loans and financing at December 31, 2005 and 2004 reflect the reclassification of quotas subject to mandatory redemption in the amount of R$404.1 million and R$201.8 million, respectively. | |
| (7) | Including intra-company sales within Braskem. Intra-company sales of ethylene totaled approximately 882,500 tons in 2006, 588,700 tons in 2005 and 537,100 tons in 2004. Intracompany sales of propylene totaled approximately 86,500 tons in 2006, 89,300 tons in 2005 and 31,300 tons in 2004. |
| • | the commercial rate exchange market; and | ||
| • | the floating rate exchange market. |
9
Table of Contents
| Reaisper U.S. Dollar | ||||||||||||||||
| Year | High | Low | Average | Period End | ||||||||||||
| 2002 | R$3.995 | R$2.271 | R$2.998 | R$3.533 | ||||||||||||
| 2003 | 3.662 | 2.822 | 3.071 | 2.889 | ||||||||||||
| 2004 | 3.205 | 2.654 | 2.909 | 2.654 | ||||||||||||
| 2005 | 2.762 | 2.163 | 2.413 | 2.341 | ||||||||||||
| 2006 | 2.371 | 2.059 | 2.176 | 2.138 | ||||||||||||
| Reaisper U.S. Dollar | ||||||||
| Month | High | Low | ||||||
| December 2006 | R$2.169 | R$2.138 | ||||||
| January 2007 | 2.156 | 2.125 | ||||||
| February 2007 | 2.118 | 2.077 | ||||||
| March 2007 | 2.139 | 2.050 | ||||||
| April 2007 | 2.048 | 2.023 | ||||||
| May 2007 | 2.031 | 1.929 | ||||||
| • | fluctuations in exchange rates; | ||
| • | exchange control policies; | ||
| • | interest rates; | ||
| • | inflation; | ||
| • | tax policies; | ||
| • | expansion or contraction of the Brazilian economy, as measured by rates of growth in gross domestic product, or GDP; | ||
| • | liquidity of domestic capital and lending markets; and |
10
Table of Contents
| • | other political, diplomatic, social and economic developments in or affecting Brazil. |
11
Table of Contents
12
Table of Contents
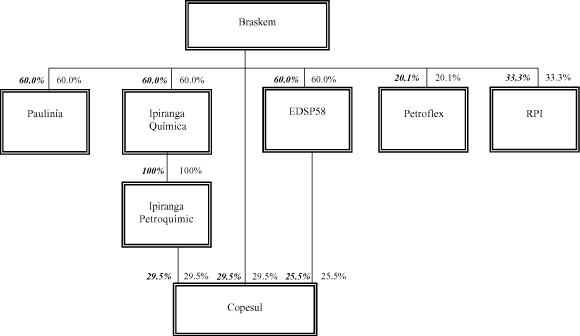
| • | (1) we will own shares of Ipiranga Química S.A. representing 60% of its total share capital and voting share capital, and (2) assuming that all of the holders of the shares of Ipiranga Petroquímica accept the Ipiranga tender offer described below, Ipiranga Química will own all of the total share capital and voting share capital of Ipiranga Petroquímica; and | ||
| • | (1) we will continue to own shares of Copesul representing 29.5% of the total and voting share capital of Copesul, (2) Ipiranga Petroquímica will continue to own shares of Copesul representing 29.5% of the total and voting share capital of Copesul, and (3) assuming that all of the holders of the shares of Copesul accept the Copesul tender offer, we will own 60% of the share capital of EDSP58 which will own shares of Copesul representing 25.5% of the total and voting share capital of Copesul; | ||
| • | we will own shares of Refinaria de Petróleo Ipiranga S.A., or RPI, representing 33.3% of total share capital and voting share capital of RPI. |
| • | Although we have experience integrating the operations of acquired companies into our operations, we lack experience integrating operations as substantial as the combined operations of Copesul, Ipiranga Química and Ipiranga Petroquímica. The Ipiranga Transaction is significantly larger than any other acquisition we have completed and integrating these operations into ours may require significant management time and resources and may divert management’s attention from our day-to-day business. | ||
| • | Our acquisition of Ipiranga Química and Ipiranga Petroquímica was made on the basis of publicly available information about these companies and our acquisition of additional interests in Copesul was made on the basis of publicly available information about Copesul and information otherwise available to us as a significant shareholder of Copesul. Since our acquisition of Copesul, Ipiranga Química and Ipiranga Petroquímica on April 18, 2007, we have conducted only limited due diligence of non-public information about these companies, given the short period of time between this acquisition and the preparation of this annual report. | ||
| • | We may incur unexpected liabilities or contingencies related to environmental regulation, labor, taxes or other matters as a result of our acquisition of Ipiranga Química and Ipiranga Petroquímica, and rights of acceleration or termination under agreements to which Ipiranga Química and Ipiranga Petroquímica are bound and that may be triggered as a result of our acquisition of Ipiranga Química and Ipiranga |
13
Table of Contents
| Petroquímica that could result in unanticipated expenses or adversely affect the results of operations and financial condition of Ipiranga Química or Ipiranga Petroquímica and, consequently, our company. | |||
| • | We may have difficulty retaining and integrating key employees of Copesul, Ipiranga Química and Ipiranga Petroquímica. The operations of Copesul, Ipiranga Química or Ipiranga Petroquímica could be adversely affected if we cannot retain their key employees to assist in the integration of these companies into our company and in their ongoing operations. | ||
| • | We may encounter difficulties or delays in implementing common information systems, operating procedures, sales and credit policies and financial controls. |
| • | A substantial portion of our cash flow from operations must be dedicated to the payment of principal and interest on our indebtedness, reducing the funds available to us for other purposes. | ||
| • | Our higher levels of indebtedness may impair our ability to adjust to changing market conditions or withstand competitive pressures. |
14
Table of Contents
| • | The operations of Copesul and Ipiranga Petroquímica are conducted in Brazil and Copesul and Ipiranga Petroquímica are exposed to traditional risks associated with operations in Brazil, such as fluctuations in interest rates, inflation and exchange rates, and changes in tax laws. See “—Risks Relating to Brazil.” | ||
| • | Similarly to our company, Copesul and Ipiranga Petroquímica face risks relating to the cyclicality of the petrochemical markets, fluctuations in commodity prices, competition from Brazilian and international producers of polyethylene and polypropylene, the application of Brazilian federal, state and local environmental laws and regulations, and hazards associated with the manufacture of petrochemicals and the storage and transportation of feedstocks and petrochemical products. See “—Risks Relating to Our Company and the Petrochemical Industry.” | ||
| • | Copesul purchases approximately two-fifths of its supply of naphtha from Petrobras. Similarly to our Basic Petrochemicals Unit, Copesul’s production volume and net sales revenue would likely decrease and our overall financial performance would likely be negatively affected in the event of (1) significant damage to Petrobras’ refineries or logistics facilities, or (2) the termination by Petrobras of its supply contract with Copesul. See “—Risks Relating to Our Company and the Petrochemical Industry—We depend on Petrobras to supply us with the substantial portion of our naphtha requirements.” | ||
| • | Copesul is the only supplier of ethylene and propylene to Ipiranga Petroquímica, which exposes Ipiranga Petroquímica to the same risks as our Polyolefins Unit as described under “—Risks Relating to Our Company and the Petrochemical Industry—Our Polyolefins and Vinyls Units depend on our Basic Petrochemicals Unit and Copesul to supply them with their ethylene and propylene requirements.” |
15
Table of Contents
| • | downturns in general business and economic activity may cause demand for our products to decline; | ||
| • | when demand falls, we may face competitive pressures to lower our prices; and | ||
| • | if we decide to expand our plants or construct new plants, we may do so based on an estimate of future demand that never materializes or materializes at levels lower than we predicted. |
16
Table of Contents
| • | significant damage to Petrobras’ refineries or to the port facilities through which Petrobras imports naphtha, or to any of the pipelines connecting our plants to Petrobras’ facilities, whether as a consequence of an accident, natural disaster, fire or otherwise; or | ||
| • | any termination by Petrobras of the naphtha supply contract with our company, which provides that Petrobras may terminate the contract for a number of reasons, including as a result of a national emergency affecting the supply of petroleum derivatives in Brazil. |
| • | significant damage to our Basic Petrochemicals Unit’s or to Copesul’s facilities through which ethylene or propylene is produced, or to the pipeline or other facilities that connect these units to our Basic Petrochemicals Unit or Copesul, whether as a consequence of an accident, natural disaster, fire or otherwise; or |
17
Table of Contents
| • | any significant reduction in the supply of naphtha to our Basic Petrochemicals Unit or to Copesul, as naphtha is the principal raw material used in the production of ethylene and propylene. |
| • | failure of acquired businesses to achieve expected results; | ||
| • | possible inability to retain or hire key personnel of acquired businesses; | ||
| • | possible inability to achieve expected synergies and/or economies of scale; | ||
| • | unanticipated liabilities; and |
18
Table of Contents
| • | antitrust considerations. |
| • | Social Contribution on Net Income.We have challenged the constitutionality of the Brazilian federal Social Contribution on Net Income (Contribuição Social Sobre o Lucro Líquido). A Brazilian Federal Supreme Court (Supremo Tribunal Federal) decision in our favor was overruled in a subsequent rescission action filed by the Brazilian tax authorities, and our appeal of that suit is pending. We believe that it is reasonably possible that we will lose our appeal. If we lose our appeal, we believe that we would be required to pay |
19
Table of Contents
| Social Contribution on Net Income only from the date that a final decision is published. However, as Brazilian law allows rescission actions to relate back to, and to take effect from, the date of the initial decision, we believe that it is reasonably possible that we will be required to pay this tax from the date of the original decision, in which case our total estimated exposure at December 31, 2006, including interest, would be R$743.0 million. This amount does not include approximately R$199.5 million in penalties at December 31, 2006 that we believe we would not be required to pay because we relied upon a judicial decision in not paying the Social Contribution on Net Income. We believe that there is a possibility that we will be required to pay related interest and a remote possibility that we will be required to pay fines as a result of this tax litigation. We have not established a provision for these lawsuits. | |||
| • | Cost of Living Adjustments on Workers’ Wages.The unions that represent employers and workers at the facilities located in the petrochemical complex located in Camaçari in the State of Bahia, which we refer to as the Northeastern Complex, are involved in a lawsuit over the indices we and other companies have used for cost of living adjustments on workers’ wages since early 1990. For a description of the legal bases of this suit, see “Item 8. Financial Information—Legal Proceedings—Labor Proceedings.” The Brazilian Federal Supreme Court has held in favor of the employers’ union, but has accepted a divergence appeal requesting the resolution of conflict between the decisions given by the Brazilian Federal Supreme Court under this proceeding and prior decisions given by another panel of the Brazilian Federal Supreme Court. Accordingly, the decision of the Brazilian Federal Supreme Court in our favor is not yet final and does not address damages. We believe it is reasonably possible that the employers’ union will lose the divergence appeal, which could adversely affect us. While we believe that it is possible, although unlikely, that an adverse judgment against the employers’ union could impact wages that we paid from April 1990 to the present, we believe that any judgment would most likely impact wages that we paid from April 1990 to September 1990 (the effective date of the next collective bargaining agreement). As we believe that it is not probable that the employers’ union will lose this suit, we have not recorded a provision in respect of this suit. If the employers’ union loses this suit and we are required to pay damages from April 1990 to September 1990, we estimate that we could be subject to liability of up to R$35.0 million, although additional claims would have to be brought by the workers’ union or individual employees to quantify the amount of damages that we would be required to pay. |
20
Table of Contents
21
Table of Contents
22
Table of Contents
23
Table of Contents
24
Table of Contents
| • | 81.3% of the total share capital of OPP Química S.A., or OPP Química, including 100% of its voting share capital. OPP Química, in turn, owned 41.6% of the total share capital of Trikem S.A., or Trikem, representing 64.4% of its voting share capital; | ||
| • | 29.5% of the total share capital and voting share capital of Copesul; and | ||
| • | 92.3% of the total share capital of Nitrocarbono S.A., or Nitrocarbono, representing 95.5% of its voting share capital. |
25
Table of Contents
26
Table of Contents
27
Table of Contents
| • | Ultrapar is obligated to acquire, as a commission agent acting on behalf of Braskem and Petrobras, 100% of the share capital of Ipiranga Química. Ipiranga Química currently owns 86.9% of the voting share capital and 92.4% of the total share capital of Ipiranga Petroquímica, which in turn owns 29.5% of the share capital of Copesul. Under the Investment Agreement, Ultrapar is obligated to transfer 60% of the share capital of Ipiranga Química to our company and 40% of the share capital of Ipiranga Química to Petrobras. | ||
| • | We are obligated under applicable law to conduct a public tender offer jointly with Petrobras for the 13.1% of the share capital of Ipiranga Petroquímica not currently owned by Ipiranga Química. | ||
| • | Under the Investment Agreement, Ultrapar is obligated to transfer 33.3% of the share capital of RPI to our company and 33.3% of the share capital of RPI to Petrobras. We will jointly and equally control RPI with Petrobras and Ultrapar. |
| • | 7.7% of the total capital of DPPI, including 15.3% of its voting share capital; | ||
| • | 11.4% of the total share capital of CBPI, including 24.8% of its voting share capital; and | ||
| • | 58.5% of the total share capital and voting share capital of Ipiranga Química. |
| • | 29.9% of the total share capital of RPI, including 61.6% of its voting share capital; | ||
| • | 32.1% of the total capital of DPPI, including 69.2% of its voting share capital; and | ||
| • | 1.5% of the total share capital of CBPI, including 3.6% of its voting share capital. |
28
Table of Contents
| • | Ultrapar will make a mandatory tender offer for the remaining outstanding voting shares of RPI, DPPI and CBPI, as required under Brazilian law, which we refer to as the Ultrapar tender offer. If all holders of these shares accept the Ultrapar tender offer, the purchase price for these shares will be R$771.8 million. We expect that this transaction will be consummated on or prior to July 31, 2007. | ||
| • | our company has filed a request with the CVM to make the Ipiranga tender offer for the outstanding voting shares of Ipiranga Petroquímica not owned by Ipiranga Química, as required under Brazilian law. If all holders of these shares accept the Ipiranga tender offer, the purchase price for these shares will be R$117.9 million. We expect that the Ipiranga tender offer will be consummated on or prior to July 31, 2007. |
29
Table of Contents
| • | (1) we will continue to own shares of Copesul representing 29.5% of the total and voting share capital of Copesul, (2) Ipiranga Petroquímica will continue to own shares of Copesul representing 29.5% of the total and voting share capital of Copesul, and (3) we will own 60% of the share capital of EDSP58 which, assuming that all of the holders of the shares of Copesul accept the Copesul tender offer, will own shares of Copesul representing 25.5% of the total and voting share capital of Copesul; | ||
| • | (1) we will own shares of Ipiranga Química representing 60% of its total share capital and voting share capital, and (2) assuming that all of the holders of the shares of Ipiranga Petroquímica accept the Ipiranga tender offer, Ipiranga Química will own all of the total share capital and voting share capital of Ipiranga Petroquímica; and | ||
| • | we will own shares of RPI representing 33.3% of total share capital and voting share capital of RPI. |
30
Table of Contents
| • | Increase the size of our business allowing us to achieve greater economies of scale and operational flexibility. Through the growth in the size and geographic scope of our business, we believe that we will obtain economies of scale, including reduced costs related to maintenance services, energy, raw materials and supplies and logistics. In addition, because we will have greater production capacity for a variety of resins, we will be able to utilize specific plants for longer production runs of specific resins, thus lowering our transition costs. | ||
| • | Increase our market share in a polyethylene and polypropylene. Through the expansion of our client base, we believe that we will have greater opportunities to develop innovative products and product applications and provide value-added services to these clients based on our leadership in Brazil in thermoplastic technology. | ||
| • | Increase our competitiveness through further integration of the thermoplastic production chain. Through our operation of Copesul, our principal supplier in the Southern Complex, and our operation of additional polyethylene and polypropylene plants in the Southern Complex, we anticipate that we will be able to improve the quality of our products, achieve operational and financial synergies and facilitate new investments in the productive assets of this complex. |
31
Table of Contents
| • | olefins, primarily ethylene, propylene and butadiene; and |
32
Table of Contents
| • | aromatics, such as benzene, toluene and xylenes. |
| • | polyethylene, polystyrene and PVC (each produced from ethylene); | ||
| • | polypropylene and acrylonitrile (each produced from propylene); | ||
| • | caprolactam (produced from benzene); and | ||
| • | polybutadiene (produced from butadiene). |
| • | plastics (produced from polyethylene, polypropylene and PVC); | ||
| • | acrylic fibers (produced from acrylonitrile); | ||
| • | nylon (produced from caprolactam); | ||
| • | elastomers (produced from butadiene); and | ||
| • | disposable containers (produced from polystyrene and polypropylene). |
| • | the Northeastern Complex located in Camaçari in the State of Bahia, where we operate the cracker; | ||
| • | the petrochemical complex located in Triunfo in the State of Rio Grande do Sul, which we refer to as the Southern Complex, where our subsidiary Copesul operates the cracker; |
33
Table of Contents
| • | the São Paulo Complex located in Capuava in the State of São Paulo, or the São Paulo Complex, where Petroquímica União operates the cracker; and | ||
| • | the Rio de Janeiro Complex located in Duque de Caxias in the State of Rio de Janeiro, or the Rio de Janeiro Complex, where Rio Polímeros operates the cracker. |
34
Table of Contents
| Before Privatization | At December 31, 2006 | |||||||||||||||||||||||||
| Private | Private | |||||||||||||||||||||||||
| Date of | Sector | Other | Sector | Other | ||||||||||||||||||||||
| Privatization | Petroquisa | Groups | Investors(1) | Petroquisa | Groups | Investors(1) | ||||||||||||||||||||
| Copesul | May 15, 1992 | 67.2 | % | 2.1 | % | 30.7 | % | 15.6 | % | 58.9 | % | 25.4 | % | |||||||||||||
| Petroquímica União | January 24, 1994 | 67.8 | 31.9 | 0.3 | 17.4 | 60.8 | 21.8 | |||||||||||||||||||
| Braskem | August 15, 1995 | 48.2 | 50.4 | 1.4 | 9.8 | 81.1 | 9.1 | |||||||||||||||||||
| Rio Polímeros | — | — | — | — | 16.7 | 66.6 | 16.7 | |||||||||||||||||||
| (1) | Pension funds, banks and individual investors. |
35
Table of Contents
| 2006 | 2005 | 2004 | 2003 | 2002(1) | 2001(2) | 2000 | 1999 | 1998 | 1997(3) | |||||||||||||||||||||||||||||||
| (%) | ||||||||||||||||||||||||||||||||||||||||
First generation petrochemicals: | ||||||||||||||||||||||||||||||||||||||||
| Ethylene | 2.0 | 2.0 | 2.0 | 3.5 | 3.5 | 4.5 | 5.0 | 5.0 | 5.0 | 5.0 | ||||||||||||||||||||||||||||||
| Propylene | 2.0 | 2.0 | 2.0 | 3.5 | 3.5 | 4.5 | 5.0 | 5.0 | 5.0 | 5.0 | ||||||||||||||||||||||||||||||
| Caustic soda | 8.0 | 8.0 | 8.0 | 9.5 | 9.5 | 10.5 | 11.0 | 11.0 | 11.0 | 11.0 | ||||||||||||||||||||||||||||||
Second generation petrochemicals: | ||||||||||||||||||||||||||||||||||||||||
| Polyethylene | 14.0 | 14.0 | 14.0 | 15.5 | 15.5 | 16.5 | 17.0 | 17.0 | 17.0 | 17.0 | ||||||||||||||||||||||||||||||
| Polypropylene | 14.0 | 14.0 | 14.0 | 15.5 | 15.5 | 16.5 | 17.0 | 17.0 | 17.0 | 17.0 | ||||||||||||||||||||||||||||||
| PVC (4) | 14.0 | 14.0 | 14.0 | 15.5 | 15.5 | 16.5 | 17.0 | 17.0 | 17.0 | 17.0 | ||||||||||||||||||||||||||||||
| Caprolactam | 12.0 | 12.0 | 12.0 | 13.5 | 13.5 | 14.5 | 15.0 | 15.0 | 15.0 | 15.0 | ||||||||||||||||||||||||||||||
| (1) | In 2002, the official tariff was 1.5% less than the rate shown. An additional surcharge of 1.5% assessed on imported products is included in the rate shown. | |
| (2) | In 2001, the official tariff was 2.5% less than the rate shown. An additional surcharge of 2.5% assessed on imported products is included in the rate shown. | |
| (3) | An additional tariff of 3% was assessed commencing on November 13, 1997, which is included in the rate shown. | |
| (4) | Imports of suspension PVC from the U.S. and Mexico have been subject to tariffs of 16% and 18%, respectively, since 1992 as a result of the imposition of anti-dumping duties by the Brazilian Foreign Trade Chamber (CAMEX—Câmara de Comércio Exterior) of the Ministry of Development, Industry and Trade. These duties will expire on December 14, 2010, unless extended. |
36
Table of Contents
| Total | Estimated | |||||||||||||||||||||||
| Total | Production of | Total Brazilian | ||||||||||||||||||||||
| Brazilian | Our Total | Other Brazilian | Total | Total | Domestic | |||||||||||||||||||
| Production | Production | Companies | Imports | Exports | Consumption | |||||||||||||||||||
| (thousands of tons) | ||||||||||||||||||||||||
| Olefins(1) | ||||||||||||||||||||||||
| 2006(2) | 5,297.7 | 1,783.4 | 3,514.2 | 3.2 | 171.3 | 5,129.5 | ||||||||||||||||||
| 2005 | 4,775.2 | 1,889.9 | 2,885.2 | 18.5 | 120.0 | 4,672.7 | ||||||||||||||||||
| 2004 | 4,779.0 | 1,809.6 | 2,969.4 | 19.9 | 121.5 | 4,677.3 | ||||||||||||||||||
| Aromatics(3) | ||||||||||||||||||||||||
| 2006(2) | 1,531.1 | 720.2 | 810.9 | 90.7 | 410.4 | 1,211.4 | ||||||||||||||||||
| 2005 | 1,518.0 | 733.7 | 784.3 | 47.6 | 453.8 | 1,111.8 | ||||||||||||||||||
| 2004 | 1,562.4 | 714.8 | 847.6 | 100.4 | 317.8 | 1,345.0 | ||||||||||||||||||
| Polyolefins(4) | ||||||||||||||||||||||||
| 2006(2) | 3,569.7 | 1,629.6 | 1,940.1 | 401.5 | 1,021.8 | 2,949.4 | ||||||||||||||||||
| 2005 | 3,148.3 | 1,289.2 | 1,859.1 | 379.9 | 782.8 | 2,745.4 | ||||||||||||||||||
| 2004 | 3,042.6 | 1,175.1 | 1,867.5 | 354.4 | 651.4 | 2,745.7 | ||||||||||||||||||
| PVC | ||||||||||||||||||||||||
| 2006(2) | 676.3 | 447.4 | 228.9 | 126.6 | 50.9 | 752.0 | ||||||||||||||||||
| 2005 | 640.3 | 449.3 | 191.0 | 119.5 | 65.6 | 694.2 | ||||||||||||||||||
| 2004 | 629.7 | 420.7 | 209.1 | 94.5 | 44.1 | 680.1 | ||||||||||||||||||
| PET (5) | ||||||||||||||||||||||||
| 2006(2) | 307.4 | 65.1 | 242.3 | 172.5 | 30.6 | 449.2 | ||||||||||||||||||
| 2005 | 352.6 | 69.7 | 282.9 | 178.4 | 32.6 | 498.3 | ||||||||||||||||||
| 2004 | 357.6 | 72.6 | 285.0 | 137.1 | 62.0 | 432.7 | ||||||||||||||||||
| Caprolactam | ||||||||||||||||||||||||
| 2006(2) | 44.9 | 44.9 | — | 6.7 | 17.8 | 33.8 | ||||||||||||||||||
| 2005 | 49.7 | 49.7 | — | 4.1 | 16.2 | 37.5 | ||||||||||||||||||
| 2004 | 50.5 | 50.5 | — | 6.4 | 7.6 | 49.3 | ||||||||||||||||||
| (1) | Includes ethylene, propylene and butadiene. | |
| (2) | Preliminary data. | |
| (3) | Includes benzene, toluene and xylenes. | |
| (4) | Includes polyethylene, high density polyethylene, low density polyethylene, linear low density polyethylene, ethyl vinyl acetate copolymer and polypropylene. | |
| (5) | On May 16, 2007, we temporarily closed our PET plant. |
37
Table of Contents
| • | Basic Petrochemicals, which accounted for R$6,883.6 million, or 50.3%, of the net sales revenue of all segments, including net sales to our other business units, and had an operating margin of 7.8% in 2006; | ||
| • | Polyolefins, which accounted for R$4,775.8 million, or 34.9%, of the net sales revenue of all segments and had an operating margin of 9.6% in 2006; | ||
| • | Vinyls, which accounted for R$1,541.7 million, or 11.3%, of the net sales revenue of all segments and had an operating margin of 13.5% in 2006; and | ||
| • | Business Development, which accounted for R$483.1 million, or 3.5%, of the net sales revenue of all segments and had a negative operating margin of 18.0% in 2006. |
| • | Focus on Customer Relationships:We seek to establish close, long-term relationships with our customers. We serve as partners with our customers in developing new products and applications and, consequently, |
38
Table of Contents
| business opportunities for them. We recognize the cyclical nature of the markets for our petrochemical products and believe that, by focusing on relationships with our customers, we can foster customer loyalty even during periods of lower demand. Our growth strategy is centered on increasing customers’ consumption of our products, and enabling them to substitute non-plastic materials with thermoplastics. |
| • | optimize customers’ processing of our products; | ||
| • | identify new products and applications to meet our clients’ needs; and | ||
| • | increase customers’ productivity. |
| • | Pursuit of Selected Business Opportunities:We are pursuing new business opportunities by, for example: |
| • | manufacturing new products such as: UTEC™, our ultra high molecular weight polyethylene, or UHMWP, product that is used in technical applications; Braskem Flexus®, a high-performance polyethylene product used for specialized packaging; and Braskem Symbios®, a high-performance flexible packaging sealant. We are the world’s second largest producer of UHMWP, which we sell mainly in the United States; | ||
| • | manufacturing linear low density polyethylene, or LLDPE, and low density polyethylene, or LDPE, using a specialized production process that permits us to produce thermoplastics with distinctive characteristics for the flexible packaging industry, including greater resistance to impact and punctures, improved polish and greater transparency; | ||
| • | replacing traditional materials such as glass, wood, steel and paper, with our thermoplastics products; and | ||
| • | developing manufacturing process to produce “green” polymers made out of renewable raw materials. |
| • | Expansion of Our Production Capacity:We plan to expand the production capacity of our business units during the next several years based on anticipated growth in demand for our products. We plan to expand our production capacity in the short-term principally through efficiency enhancements at our plants and by modernizing our production technology, although from time to time we may consider acquisitions of second generation producers that currently compete with us or produce products that are complementary to ours, such as our acquisition of Ipiranga Química, or enter into joint ventures with others to build new petrochemical plants. | ||
| We have entered into a joint venture with Petroquisa for the construction of a polypropylene plant in Paulínia, in the State of São Paulo, with an initial annual production capacity of 350,000 tons. In addition, we have entered into Project Development Agreements with Petroquímica de Venezuela, S.A., or Pequiven, the petrochemical company of the Bolivarian Republic of Venezuela, with respect to (1) the development, construction and operation of the Jose Olefins Project, a petrochemical complex that will be located in the Jose Petrochemical Complex in the State of Anzoategui, Venezuela and will include an ethylene cracker that will use ethane extracted from natural gas as its raw material, with an annual production capacity of 1.3 million tons, polyethylene production facilities with a combined annual production capacity of 1.1 million tons, and integrated plants to produce other second-generation petrochemicals, and (2) the construction and operation of a polypropylene plant in the Jose Petrochemical Complex, with an annual production capacity of approximately 450,000 tons. We believe that additional capacity developed by our company, together with joint venture partners, will enable us to maintain and expand our leadership position in Latin America and support our expansion into strategic export markets. | |||
| • | Continued Reductions in Operating Costs and increases in Operating Efficiencies:As a result of the integration of our facilities and large production scale, we believe that we are a low-cost producer of |
39
Table of Contents
| second generation petrochemicals. We have completed a program—the Braskem+ Program—to increase operating efficiencies and to reduce operating costs. We also continue to realize synergies from our integration process. | |||
| Our cost reduction program is linked to initiatives to purchase feedstocks at competitive prices. We began to import lower-cost naphtha in 2002, and during 2006, we imported approximately 25.1% of our feedstock requirements, primarily from North Africa. | |||
| • | Commitment to Our Employees and Communities:We are focused on our human resources, which are vital to our competitiveness and growth. We continue to train our employees to develop skills necessary to operate an internationally competitive, vertically integrated petrochemical company. We have adopted a policy that makes all of our directors, officers, and employees responsible for worker safety and for preserving the environment. We are also committed to sustainable development and to improving the quality of life in the communities in which our facilities are located. |
| • | olefins, such as ethylene, polymer and chemical grade propylene, butadiene, isoprene and butene-1; | ||
| • | aromatics, such as benzene, toluene, para-xylene and ortho-xylene; | ||
| • | fuels, such as automotive gasoline and liquefied petroleum gas, or LPG; and |
40
Table of Contents
| • | methyl tertiary butyl ether, or MTBE, solvent C9 and pyrolysis C9. |
41
Table of Contents
| Our Basic | Intermediate Products Derived from | |||
| Petrochemical Products | Our Basic Petrochemical Products | Common End Uses | ||
Olefins | ||||
| Ethylene | LDPE /LLDPE (1) | Garbage bags, packaging film, toys, housewares, electrical insulation, paper coatings | ||
| High density polyethylene (1) | Blow-molded plastic bottles (such as milk bottles) | |||
| UHMWP (1) | Technical parts, industrial applications, medical applications, parts for automotive industry products | |||
| Ethyl vinyl acetate copolymer (1) | Shoe soles, hot melt, plastic film for special applications | |||
| Ethylene oxide, used to produce ethylene glycol | Polyester fibers and PET resin | |||
| Ethylene dichloride, used to produce PVC (2) | Pipes, home siding, upholstery, floor coverings | |||
| Propylene (polymer and chemical grade) | Ethylbenzene, used to produce styrene monomer and then polystyrene Polypropylene (1) | Disposable cups and containers, high-impact plastics Carpet-backing, luggage, bottles, diapers, raffia bags | ||
| Acrylonitrile | Clothing, plastics | |||
| Propylene oxide | Polyurethane foams for furniture and insulation, cleaning compounds and coatings | |||
| Butadiene | Synthetic rubber, elastomers, resins | Tires, shoes, hoses, surgical gloves | ||
| Butene–1 | LLDPE (1) | Garbage bags, packaging film, toys, housewares, electrical insulation, paper coatings | ||
Aromatics | ||||
| Benzene | Ethylbenzene (used to make styrene monomer/polystyrene) | Disposable cups, containers, high-impact plastics | ||
| Cumene | Epoxies | |||
| Cyclohexane and cyclohexanone (3) | Nylon | |||
| Linear alkyle benzene | Detergents | |||
| Caprolactam (3) | Nylon | |||
| Ammonium sulfate (3) | Fertilizers | |||
| Isoprene | Styrene-isoprene-styrene (SIS) | Adhesive | ||
| Toluene | Toluenediisocianate | Urethane foams | ||
| Solvents | ||||
| Para-xylene | Purified terephthalic acid and DMT (4) | Polyester film and fibers, PET resin (4) | ||
| Ortho-xylene | Phthalic anhydride and plasticizers | Flexible products from PVC | ||
Others | ||||
| MTBE | — | Octane booster for gasoline | ||
| Solvent C9 | — | Solvents and thinners | ||
| Pyrolysis C9 | — | Octane booster for gasoline | ||
Fuels | ||||
| Automotive Gasoline | — | Fuel for internal combustion engines | ||
| LPG | — | Cooking gas |
| (1) | Produced by our Polyolefins Unit. | |
| (2) | Produced by our Vinyls Unit. | |
| (3) | Produced by our Business Development Unit. | |
| (4) | Formerly produced by our Business Development Unit. On May 16, 2007, we permanently closed our DMT plant and temporarily closed our PET plant. |
42
Table of Contents
| Years Ended December 31, | ||||||||||||||||||||||||||||||||||||
| 2006 | 2005 | 2004 | ||||||||||||||||||||||||||||||||||
| Quantities | Quantities | Quantities | ||||||||||||||||||||||||||||||||||
| Sold (1) | Net Sales Revenue | Sold (1) | Net Sales Revenue | Sold (1) | Net Sales Revenue | |||||||||||||||||||||||||||||||
| (thousands | (millions of | (thousands | (millions of | (thousands | (millions of | |||||||||||||||||||||||||||||||
| of tons) | reais) | (%) | of tons) | reais) | (%) | of tons) | reais) | (%) | ||||||||||||||||||||||||||||
| Domestic net sales: | ||||||||||||||||||||||||||||||||||||
| Ethylene | 1,108.5 | R$ | 2,530.6 | 42.2 | % | 1,169.8 | R$ | 2,578.2 | 40.8 | % | 1,098.9 | R$ | 2,302.2 | 40.1 | % | |||||||||||||||||||||
| Propylene | 413.0 | 871.6 | 14.5 | 497.5 | 1,060.9 | 16.8 | 446.8 | 819.1 | 14.3 | |||||||||||||||||||||||||||
| Para-xylene | 82.8 | 201.7 | 3.4 | 171.0 | 385.0 | 6.1 | 148.7 | 319.6 | 5.6 | |||||||||||||||||||||||||||
| Benzene | 203.0 | 398.0 | 6.6 | 199.9 | 439.8 | 7.0 | 216.7 | 522.6 | 9.1 | |||||||||||||||||||||||||||
| Butadiene | 140.9 | 341.9 | 5.7 | 150.2 | 331.3 | 5.2 | 160.0 | 296.0 | 5.2 | |||||||||||||||||||||||||||
| Mixed xylenes | 34.1 | 78.0 | 1.3 | 35.4 | 61.7 | 1.0 | 74.5 | 126.4 | 2.2 | |||||||||||||||||||||||||||
| Ortho-xylene | 61.7 | 136.0 | 2.3 | 41.3 | 87.0 | 1.4 | 52.7 | 109.9 | 1.9 | |||||||||||||||||||||||||||
| Toluene | 34.8 | 62.5 | 1.0 | 29.5 | 48.0 | 0.7 | 33.2 | 57.4 | 1.0 | |||||||||||||||||||||||||||
| Others | 178.6 | 379.9 | 6.3 | 203.8 | 380.1 | 6.0 | 255.3 | 405.0 | 7.1 | |||||||||||||||||||||||||||
| Total domestic net sales of basic petrochemicals | 2,257.4 | 5,000.1 | 83.4 | 2,498.4 | 5,372.0 | 85.0 | 2,486.8 | 4,958.2 | 86.4 | |||||||||||||||||||||||||||
| Total export net sales of basic petrochemicals | 544.4 | 953.4 | 16.6 | 535.0 | 950.0 | 15.0 | 436.6 | 778.9 | 13.6 | |||||||||||||||||||||||||||
| Total net sales of basic petrochemicals | 2,801.8 | 5,953.4 | 100 | % | 3,033.4 | 6,322.0 | 100 | % | 2,923.4 | 5,737.1 | 100 | % | ||||||||||||||||||||||||
| Automotive gasoline and utilities (2) | 930.2 | 904.7 | 742.9 | |||||||||||||||||||||||||||||||||
| Total Basic Petrochemicals Unit net sales revenue (3) | R$ | 6,883.6 | R$ | 7,226.7 | R$ | 6,480.0 | ||||||||||||||||||||||||||||||
| % of the total net sales revenue of all segments | 50.3 | % | 53.5 | % | 52.1 | % | ||||||||||||||||||||||||||||||
| (1) | Includes the following intra-company sales: | |
| • approximately 800,600 tons of ethylene in 2006, 588,700 tons in 2005 and 537,100 tons in 2004; | ||
| • approximately 86,500 tons of propylene in 2006, 89,300 tons in 2005 and 31,300 tons in 2004; | ||
| • approximately 42,300 tons of para-xylene in 2006, 45,600 tons in 2005 and 48,200 tons in 2004; and | ||
| • approximately 53,400 tons of benzene in 2006, 60,800 tons in 2005 and 62,300 tons in 2004. | ||
| (2) | Utilities include electric power, steam, treated water and compressed air. | |
| (3) | Includes basic petrochemicals, fuels and utilities. |
43
Table of Contents
| Annual | Production | |||||||||||||||||
| Production | Year Ended December 31, | |||||||||||||||||
| Name | Primary Products | Capacity | 2006 | 2005 | 2004 | |||||||||||||
| (in tons, except | ||||||||||||||||||
| automotive | ||||||||||||||||||
| gasoline) | (in tons, except automotive gasoline) | |||||||||||||||||
| Olefins units 1 and 2 | Ethylene | 1,280,000 | 1,103,969 | 1,165,319 | 1,105,610 | |||||||||||||
| Propylene | 550,000 | 520,413 | 562,048 | 542,359 | ||||||||||||||
| Plants of aromatics units 1 and 2: | ||||||||||||||||||
| Butadiene plants 1 and 2 | Butadiene | 175,000 | 154,227 | 162,586 | 161,616 | |||||||||||||
| MTBE plants 1 and 2 | MTBE | 140,000 | 118,691 | 129,345 | 130,079 | |||||||||||||
| Butene-1 plant | Butene-1 | 35,000 | 24,701 | 25,515 | 29,093 | |||||||||||||
| Isoprene plant | Isoprene | 26,800 | 12,500 | 16,140 | 16,396 | |||||||||||||
| Dicyclopentadiene | 24,000 | 16,517 | 25,245 | 21,306 | ||||||||||||||
| Sulfolane plants 1, 2 and 3 | Coperaf – 1 (1) | 120,000 | 86,773 | 86,066 | 112,249 | |||||||||||||
| BTX fractionation plants 1 and 2 | Benzene | 427,000 | 400,793 | 428,796 | 393,737 | |||||||||||||
| Toluene (2) | 42,000 | 44,778 | 38,505 | 58,502 | ||||||||||||||
| C8+ fractionation plant | Mixed xylenes (2) | 40,000 | 55,853 | 50,487 | 87,208 | |||||||||||||
| Ortho-xylene | 62,000 | 76,450 | 57,441 | 53,966 | ||||||||||||||
| Solvent C9 (1) | 30,000 | 23,426 | 20,011 | 20,405 | ||||||||||||||
| Parex plant | Para-xylene | 203,000 | 128,672 | 158,461 | 124,455 | |||||||||||||
| Blending plant | Automotive gasoline (3) | 600,000 | 374,504 | 457,334 | 394,591 | |||||||||||||
| LPG | 25,000 | 15,476 | 15,822 | 18,767 | ||||||||||||||
| (1) | Solvents. | |
| (2) | Actual production may exceed production capacity of certain plants when excess capacity of other plants in the Aromatics units is utilized. | |
| (3) | Automotive gasoline in cubic meters per year. |
44
Table of Contents
| Amsterdam-Rotterdam-Antwerp | ||||||||||||||||
| Market Price of Naphtha | ||||||||||||||||
| 2007 | 2006 | 2005 | 2004 | |||||||||||||
| (in U.S. dollars per ton) | ||||||||||||||||
| Average(1) | US$ | 597.21 | US$ | 564.74 | US$ | 476.04 | US$ | 377.40 | ||||||||
| Month ended: | ||||||||||||||||
| January | 509.23 | 561.81 | 394.86 | 329.74 | ||||||||||||
| February | 550.85 | 529.67 | 416.23 | 309.52 | ||||||||||||
| March | 603.95 | 528.65 | 477.43 | 327.26 | ||||||||||||
| April | 655.37 | 588.84 | 471.62 | 333.31 | ||||||||||||
| May | 686.61 | (2) | 601.91 | 421.26 | 373.71 | |||||||||||
| June | 613.14 | 439.32 | 350.16 | |||||||||||||
| July | 644.24 | 468.43 | 373.95 | |||||||||||||
| August | 620.04 | 528.00 | 420.40 | |||||||||||||
| September | 524.71 | 572.77 | 421.39 | |||||||||||||
| October | 509.91 | 545.43 | 469.14 | |||||||||||||
| November | 514.96 | 478.82 | 433.16 | |||||||||||||
| December | 545.11 | 498.35 | 387.05 | |||||||||||||
| (1) | The information in the “Average” row represents (i) during 2006, 2005 and 2004, the mean average of average monthly naphtha prices during the year, and (ii) during 2007, the mean average of average monthly naphtha prices from January through April. | |
| (2) | Through May 24, 2007. |
| • | 36 kilometers from the Madre de Deus Port Terminal (located in the City of Madre de Deus in the State of Bahia), a port terminal owned and operated by Petrobras; | ||
| • | 27 kilometers from Refinaria Landulfo Alves (located in the State of Bahia), one of the largest refineries in Brazil, which is owned and operated by Petrobras; and | ||
| • | 22 kilometers from the port terminal of Aratú (located in the State of Bahia). |
45
Table of Contents
| • | from Petrobras: approximately 3,123,000 tons of naphtha in 2006, representing 74.9% of our naphtha requirements; approximately 3,084,000 tons of naphtha in 2005, representing 69.2% of our naphtha requirements; and approximately 2,734,000 tons of naphtha in 2004, representing 62.3% of our naphtha requirements; and | ||
| • | from suppliers located primarily in North Africa: approximately 1,045,000 tons of naphtha in 2006, representing 25.1% of our naphtha requirements; approximately 1,372,500 tons of naphtha in 2005, representing 30.8% of our naphtha requirements; and approximately 1,654,000 tons of naphtha in 2004, representing 37.7% of our naphtha requirements. |
| • | Petrobras has agreed to sell and deliver naphtha and gas oil to our basic petrochemicals plants in the Northeastern Complex exclusively for our use as a raw material; | ||
| • | we provide Petrobras with a firm commitment order for naphtha and fuel oil each month, together with an estimate of the volume of naphtha and fuel oil that we will purchase over the following six months; | ||
| • | if we request to purchase volumes of naphtha and gas oil that exceed the minimum volumes we establish, Petrobras must use its best efforts to attempt to meet our higher demand; | ||
| • | if we fail to purchase the minimum volumes that we establish for a given year, we are required to pay damages to Petrobras, and if Petrobras fails to deliver the minimum volumes, Petrobras is required to pay damages to us; | ||
| • | Petrobras may suspend deliveries, in whole or in part, or may terminate this contract without penalties if required by the National Petroleum Agency as a result of a national contingency plan that adversely affects the supply of petroleum derivatives in Brazil; and | ||
| • | Petrobras may rescind the contract, without prior notice, if: (1) we violate any provision of the contract; (2) we declare bankruptcy, or we are declared bankrupt or are liquidated; (3) we transfer all or part of our |
46
Table of Contents
| rights and obligations under the contract to a third party without Petrobras’ consent; or (4) we are involved in a reorganization or merger. |
| • | SONATRACH has agreed to sell and deliver naphtha to us exclusively for our use as a raw material; and | ||
| • | we agreed to purchase, and SONATRACH agreed to sell, a minimum annual volume of naphtha up to a maximum annual volume. |
| • | ABB Lummus Global technology; technology developed jointly by CENPES (Petrobras) Research Center and TECHNIP; and technology developed by Linde AG, each of which we use in our olefins plants; and | ||
| • | technology developed by Nippon Zeon, a Japanese petrochemical company, which we use in our butadiene plants. |
47
Table of Contents
| • | Petroflex technology, which we use in our MTBE plants; | ||
| • | technology developed by Japan Synthetic Rubber Company, which we use in our isoprene plant; | ||
| • | technology developed by Universal Oil Products, or UOP, which we use in our sulfolane plants, our parex plant and our BTX fractionation plants; and | ||
| • | technology licensed from Mobil, which we use in the conversion of toluene to benzene and xylenes. |
48
Table of Contents
| Year Ended December 31, | ||||||||||||
| 2006 | 2005 | 2004 | ||||||||||
Export sales (in millions ofreais) | 995.0 | 950.0 | 778.9 | |||||||||
| As % of total net sales revenue of Basic Petrochemicals Unit | 14.5 | 15.0 | 13.6 | |||||||||
| Export volumes (thousands of tons) | 575.1 | 535.2 | 436.6 | |||||||||
| As % of total sales volume of Basic Petrochemicals Unit (excluding automotive gasoline) | 20.3 | 17.6 | 14.9 | |||||||||
| • | benzene, toluene, para-xylene, dicyclopentadiene and automotive gasoline with reference to market prices prevailing in the U.S. Gulf market; and | ||
| • | propylene, MTBE, ortho-xylene, butene-l and isoprene with reference to market prices prevailing in the European market. |
49
Table of Contents
| • | polyethylene, including LDPE, LLDPE, high density polyethylene, or HDPE, UHMWP and ethyl vinyl acetate copolymer, or EVA; and | ||
| • | polypropylene. |
| • | plastic films for food and industrial packaging; | ||
| • | bottles, shopping bags and other consumer goods containers; | ||
| • | automotive parts; and | ||
| • | household appliances. |
| • | greater consumption of plastic-based consumer products, as Brazil’s consumption of plastic based products on a per-capita basis is low when compared to the United States and many European countries; and | ||
| • | the trend towards substitution of plastics for more traditional packaging materials, such as glass and paper. |
| Year Ended December 31, | ||||||||||||||||||||||||||||||||||||
| 2006 | 2005 | 2004 | ||||||||||||||||||||||||||||||||||
| Quantities | Quantities | Quantities | ||||||||||||||||||||||||||||||||||
| sold | Net Sales Revenue | sold | Net Sales Revenue | sold | Net Sales Revenue | |||||||||||||||||||||||||||||||
| (thousands | (millions of | (thousands | (millions of | (thousands | (millions of | |||||||||||||||||||||||||||||||
| of tons) | reais) | (%) | of tons) | reais) | (%) | of tons) | reais) | (%) | ||||||||||||||||||||||||||||
| Domestic net sales: | ||||||||||||||||||||||||||||||||||||
| Polypropylene | 453.2 | R$ | 1,515.5 | 31.7 | % | 419.9 | R$ | 1,404.2 | 35.8 | % | 418.5 | R$ | 1,320.3 | 37.8 | % | |||||||||||||||||||||
| LDPE | 196.9 | 635.8 | 13.3 | 143.1 | 443.7 | 11.3 | 134.7 | 404.2 | 11.6 | |||||||||||||||||||||||||||
| LLDPE | 211.0 | 703.2 | 14.7 | 156.2 | 476.4 | 12.2 | 148.6 | 444.4 | 12.7 | |||||||||||||||||||||||||||
| HDPE | 186.6 | 603.2 | 12.6 | 201.9 | 618.1 | 15.8 | 214.1 | 635.5 | 18.2 | |||||||||||||||||||||||||||
| UHMWP | 1.2 | 6.4 | 0.1 | 1.0 | 5.1 | 0.1 | 1.4 | 5.7 | 0.3 | |||||||||||||||||||||||||||
50
Table of Contents
| Year Ended December 31, | ||||||||||||||||||||||||||||||||||||
| 2006 | 2005 | 2004 | ||||||||||||||||||||||||||||||||||
| Quantities | Quantities | Quantities | ||||||||||||||||||||||||||||||||||
| sold | Net Sales Revenue | sold | Net Sales Revenue | sold | Net Sales Revenue | |||||||||||||||||||||||||||||||
| (thousands | (millions of | (thousands | (millions of | (thousands | (millions of | |||||||||||||||||||||||||||||||
| of tons) | reais) | (%) | of tons) | reais) | (%) | of tons) | reais) | (%) | ||||||||||||||||||||||||||||
| EVA | 9.1 | 34.2 | 0.7 | — | — | — | — | — | — | |||||||||||||||||||||||||||
| Other | — | 4.8 | 0.1 | — | — | — | — | — | — | |||||||||||||||||||||||||||
| Total domestic net sales | 1,057.9 | 3,503.0 | 73.3 | 922.1 | 2,947.5 | 75.2 | 917.3 | 2,810.1 | 80.6 | |||||||||||||||||||||||||||
| Total export net sales | 467.2 | 1,272.8 | 26.7 | 363.6 | 971.5 | 24.8 | 248.3 | 679.3 | 19.4 | |||||||||||||||||||||||||||
| Total polyolefins net sales | 1,525.1 | R$ | 4,775.8 | 100 | % | 1,285.7 | R$ | 3,919.0 | 100 | % | 1,165.6 | R$ | 3,489.4 | 100 | % | |||||||||||||||||||||
| % of the total net sales revenue of all segments | 34.9 | % | 29.0 | % | 28.0 | % | ||||||||||||||||||||||||||||||
51
Table of Contents
| Annual | Production | ||||||||||||||||||
| Production | Year Ended December 31, | ||||||||||||||||||
| Location (Complex) | Primary Products | Capacity | 2006 | 2005 | 2004 | ||||||||||||||
| (in tons) | (in tons) | ||||||||||||||||||
| Triunfo (Southern) | LDPE | 215,000 | 209,209 | 207,174 | 209,140 | ||||||||||||||
| Polypropylene (1) | 100,000 | — | — | — | |||||||||||||||
| Polypropylene (2) | 560,000 | 542,781 | 528,980 | 463,077 | |||||||||||||||
| HDPE/LLDPE (3) | 300,000 | 268,762 | 237,262 | 235,028 | |||||||||||||||
| Camaçari (Northeastern) | HDPE/LLDPE (3) | 230,000 | 216,822 | 211,625 | 175,436 | ||||||||||||||
| HDPE/LLDPE (3)(4) | 210,000 | 133,088 | — | — | |||||||||||||||
| LDPE (4) | 150,000 | 102,684 | — | — | |||||||||||||||
| HDPE/UHMWP(3) | 160,000 | 103,034 | 124,382 | 128,312 | |||||||||||||||
| (1) | This plant is currently inactive. | |
| (2) | Reflects the combined production capacity and annual production of two polypropylene plants located in the Southern Complex. | |
| (3) | Plant with swing line capable of producing two types of resins. Capacity varies depending on actual production. | |
| (4) | Reflects the production of Politeno since April 6, 2006, the date of the Politeno acquisition. |
52
Table of Contents
| • | Refap has agreed to sell and deliver propylene to us exclusively for our use as a raw material; and | ||
| • | we agreed to purchase, and Refap agreed to sell, at prices determined by reference to U.S. Gulf Coast prices for propylene. |
| Year Ended December 31, | ||||||||||||
| 2006 | 2005 | 2004 | ||||||||||
| (R$ per ton) | ||||||||||||
| Ethylene supplied by our Basic Petrochemicals Unit | R$ | 2,323 | R$ | 2,206 | R$ | 2,350 | ||||||
| Ethylene supplied by Copesul | 2,677 | 2,527 | 2,313 | |||||||||
| Propylene supplied by Copesul | 2,570 | 2,405 | 2,017 | |||||||||
53
Table of Contents
| • | We entered into an agreement with Sumitomo in 1974 to use a high pressure autoclave process to produce LDPE and ethyl vinyl acetate copolymer at a plant in the Northeastern Complex. We have fully paid all royalties due under the terms of this license agreement. | ||
| • | We obtained technology from Mitsubishi in 1978, under a licensing agreement we continue to use in our HDPE slurry plant in the Northeastern Complex. Although this technology is our oldest, we have regularly upgraded and improved it, and we use this technology to produce UHMWP in this plant. We have fully paid all royalties due under the terms of our license agreement with Mitsubishi and are no longer subject to the confidentiality provisions of this agreement. | ||
| • | We entered into an agreement with Du Pont Canada, now Nova Chemicals, in 1987 to use Sclairtech technology to produce LLDPE and HDPE at a plant in the Northeastern Complex. We have fully paid all royalties due under the terms of this license agreement. | ||
| • | We entered into an agreement with a predecessor of Univation Technologies in 1988 (effective in 1992) to use Unipol® technology to produce polyethylene. We made a lump sum payment at the time of execution of this license agreement, in lieu of additional royalty payments. We use the Unipol® technology to produce low density polyethylene and high density polyethylene in the Northeastern Complex. | ||
| • | We entered into agreements with Basell Technology Company B.V., the largest polypropylene manufacturer in the world and a leader in polypropylene technology, in 1987 (effective in 1991) to use Spheripol® technology for the construction and operation of our first polypropylene plant in the Southern Complex. Under these agreements, we may use this technology for our current and future plants. We built a second plant based on this technology, which commenced operations in 1997. We have fully paid all royalties due under the terms of these license agreements. |
54
Table of Contents
| • | We entered into agreements with Basell Polyolefine GmbH in 1995 (effective in 1999) to use Spherilene® technology. We pay royalties on a quarterly basis under these license agreements based on the amounts of polyethylene that we produce using this technology at our swing HDPE/ LLDPE plant located at the Southern Complex. | ||
| • | We entered into an agreement with Univation Technologies in 2003 to use metallocene process and product technology and related catalysts. We pay quarterly royalties based on amounts of LLDPE and very low density polyethylene that we produce using metallocene technology at our Unipol® polyethylene plant located at the Northeastern Complex. | ||
| • | We entered into an agreement with Basell Polyolefine Italia S.p.A. in 2004 to use an updated Spheripol® technology for the construction and operation of the Paulínia polypropylene plant. Under this agreement, we may use this technology for our existing and future plants. |
| • | develop new products and applications in response to our customers’ requirements; | ||
| • | upgrade or improve the properties and processability of our products; | ||
| • | identify new product market opportunities; | ||
| • | implement improvements in our production processes and reduce our operating costs; and | ||
| • | expand and optimize the capacity and the flexibility of production at our plants. |
55
Table of Contents
56
Table of Contents
| Year Ended December 31, | ||||||||||||
| 2006 | 2005 | 2004 | ||||||||||
Net export sales revenue (in millions ofreais) | 1,272.8 | 971.5 | 678.6 | |||||||||
| As % of total net sales revenue of Polyolefins Unit | 26.7 | 24.8 | 19.4 | |||||||||
| Export volumes (thousands of tons) | 467.2 | 363.6 | 248.5 | |||||||||
| As % of total production of Polyolefins Unit | 30.6 | 28.3 | 21.3 | |||||||||
| • | Rio Polímeros, with a maximum annual production capacity of 540,000 tons of LLDPE and HDPE; and |
57
Table of Contents
| • | Solvay, with an annual capacity of 150,000 tons of HDPE. |
58
Table of Contents
| Years Ended December 31, | ||||||||||||||||||||||||||||||||||||
| 2006 | 2005 | 2004 | ||||||||||||||||||||||||||||||||||
| Quantities | Quantities | Net Sales | Quantities | |||||||||||||||||||||||||||||||||
| Sold | Net Sales Revenue | Sold | Revenue | Sold | Net Sales Revenue | |||||||||||||||||||||||||||||||
| (thousands | (millions | (thousands | (millions | (thousands | (millions | |||||||||||||||||||||||||||||||
| of tons) | ofreais) | (%) | of tons) | ofreais) | (%) | of tons) | ofreais) | (%) | ||||||||||||||||||||||||||||
| Domestic sales: | ||||||||||||||||||||||||||||||||||||
| PVC suspension | 380.6 | R$ | 926.9 | 60.1 | % | 360.4 | R$ | 959.9 | 53.5 | % | 372.4 | R$ | 1,116.8 | 60.1 | % | |||||||||||||||||||||
| PVC emulsion | 19.7 | 81.1 | 5.3 | 18.5 | 81.0 | 4.5 | 22.0 | 82.8 | 4.4 | |||||||||||||||||||||||||||
| Caustic soda | 423.9 | 357.8 | 23.2 | 455.6 | 449.4 | 25.1 | 444.0 | 342.1 | 18.4 | |||||||||||||||||||||||||||
| Other (1) | 121.0 | 55.8 | 3.6 | 125.3 | 82.9 | 4.6 | 134.0 | 60.9 | 3.3 | |||||||||||||||||||||||||||
| Total domestic sales | 945.2 | 1,421.5 | 92.2 | 959.8 | 1,573.2 | 87.7 | 972.4 | 1,602.6 | 86.2 | |||||||||||||||||||||||||||
| Total exports | 142.7 | 120.2 | 7.8 | 194.3 | 220.9 | 12.3 | 191.0 | 256.2 | 13.8 | |||||||||||||||||||||||||||
| Total vinyl net sales | 1,087.9 | 1,541.7 | 100 | % | 1,154.1 | R$ | 1,794.1 | 100 | % | 1,163.3 | R$ | 1,858.8 | 100 | % | ||||||||||||||||||||||
| % of the total net sales revenue of all segments | 11.3 | % | 13.3 | % | 14.9 | % | ||||||||||||||||||||||||||||||
| (1) | Includes chlorine, hydrogen, caustic soda flake and sodium hypochlorite. |
59
Table of Contents
| Annual | Production | |||||||||||||||||
| Primary | Production | Year Ended December 31, | ||||||||||||||||
| Location (Complex) | Products | Capacity | 2006 | 2005 | 2004 | |||||||||||||
| (in tons) | (in tons) | |||||||||||||||||
| Camaçari (Northeastern) | PVC | 250,000 | 193,089 | 225,563 | 206,978 | |||||||||||||
| Camaçari (Northeastern) | Caustic Soda | 79,000 | 73,316 | 76,219 | 76,517 | |||||||||||||
| Chlorine | 64,000 | 59,820 | 66,587 | 66,644 | ||||||||||||||
| Maceió (Alagoas) | Caustic Soda | 460,000 | 395,572 | 419,673 | 416,100 | |||||||||||||
| Chlorine | 400,000 | 370,588 | 387,510 | 381,464 | ||||||||||||||
| EDC | 520,000 | 477,472 | 499,256 | 495,827 | ||||||||||||||
| Marechal Deodoro (Alagoas) | PVC | 240,000 | 229,079 | 198,125 | 189,810 | |||||||||||||
| Vila Prudente (São Paulo) | PVC | 26,000 | 21,888 | 23,689 | 24,830 | |||||||||||||
60
Table of Contents
61
Table of Contents
| Year Ended December 31, | ||||||||||||
| 2006 | 2005 | 2004 | ||||||||||
Net export sales revenue (in millions ofreais) | 120.2 | 220.9 | 256.2 | |||||||||
| As % of total net sales revenue of Vinyls Unit | 7.8 | 12.3 | 13.8 | |||||||||
| Export volumes (thousands of tons) | 142.7 | 194.3 | 191.0 | |||||||||
| As % of total production of Vinyls Unit | 13.1 | 16.8 | 16.4 | |||||||||
62
Table of Contents
| • | transportation costs; | ||
| • | tariffs, duties and other trade barriers; | ||
| • | a pricing premium reflecting the tighter demand/supply relationship in Brazil; and | ||
| • | our reliability of supply, coupled with the technical support that we provide. |
63
Table of Contents
| Year Ended December 31, | ||||||||||||||||||||||||||||||||||||
| 2006 | 2005 | 2004 | ||||||||||||||||||||||||||||||||||
| Quantities | Quantities | Quantities | ||||||||||||||||||||||||||||||||||
| sold | Net Sales Revenue | sold | Net Sales Revenue | Sold | Net Sales Revenue | |||||||||||||||||||||||||||||||
| (thousands | (millions | (thousands | (millions of | (thousands | (millions of | |||||||||||||||||||||||||||||||
| of tons) | ofreais) | (%) | of tons) | reais) | (%) | of tons) | reais) | (%) | ||||||||||||||||||||||||||||
| Domestic Sales: | ||||||||||||||||||||||||||||||||||||
| PET (1) | 50.6 | R$ | 152.7 | 31.6 | % | 56.6 | R$ | 200.7 | 35.3 | % | 66.2 | R$ | 238.5 | 38.4 | % | |||||||||||||||||||||
| Caprolactam | 25.7 | 127.5 | 26.4 | 33.0 | 197.2 | 34.7 | 42.9 | 229.9 | 37.0 | |||||||||||||||||||||||||||
| Ammonium sulfate | 77.8 | 25.5 | 5.3 | 94.2 | 33.5 | 5.9 | 92.4 | 41.4 | 6.7 | |||||||||||||||||||||||||||
| Others | 19.5 | 56.5 | 11.7 | 16.7 | 49.7 | 8.7 | 15.6 | 54.2 | 8.7 | |||||||||||||||||||||||||||
| Total domestic sales | 173.6 | 362.2 | 75.0 | 200.5 | 481.2 | 84.6 | 217.1 | 564.1 | 90.8 | |||||||||||||||||||||||||||
| Total exports | 34.3 | 120.9 | 25.0 | 19.1 | 87.8 | 15.4 | 14.3 | 56.8 | 9.2 | |||||||||||||||||||||||||||
| Total net sales | 207.9 | 483.1 | 100 | % | 219.6 | R$ | 569.0 | 100 | % | 231.4 | R$ | 620.8 | 100 | % | ||||||||||||||||||||||
| % of total net sales revenue of all segments | 3.5 | % | 4.2 | % | 5.0 | % | ||||||||||||||||||||||||||||||
| (1) | On May 16, 2007, we temporarily closed our PET plant. |
64
Table of Contents
| Annual | Production | |||||||||||||||||
| Production | Year Ended December 31, | |||||||||||||||||
| Location (Complex) | Primary Products | Capacity | 2006 | 2005 | 2004 | |||||||||||||
| (in tons) | (in tons) | |||||||||||||||||
| Camaçari (Northeastern) | PET (1) | 78,000 | 57,155 | 66,233 | 72,194 | |||||||||||||
| DMT (2) | 80,000 | 76,070 | 70,954 | 76,985 | ||||||||||||||
| Camaçari (Northeastern) | Caprolactam | 62,000 | 41,615 | 49,981 | 50,483 | |||||||||||||
| Cyclohexane | 72,000 | 57,764 | 65,057 | 66,292 | ||||||||||||||
| Cyclohexanone | 55,000 | 40,964 | 46,590 | 48,282 | ||||||||||||||
| Ammonium sulfate | 114,000 | 78,296 | 94,855 | 92,617 | ||||||||||||||
| (1) | On May 16, 2007, we temporarily closed our PET plant. | |
| (2) | On May 16, 2007, we permanently closed our DMT plant. |
65
Table of Contents
66
Table of Contents
| • | we will continue to own shares of Copesul representing 29.5% of the total and voting share capital of Copesul; | ||
| • | Ipiranga Petroquímica will continue to own shares of Copesul representing 29.5% of the total and voting share capital of Copesul; and | ||
| • | we will own 60% of the share capital of EDSP58 which, assuming that all of the holders of the shares of Copesul accept the Copesul tender offer, will own shares of Copesul representing 25.5% of the total and voting share capital of Copesul. |
| • | olefins, such as ethylene, polymer grade propylene, butadiene and butene-1; | ||
| • | aromatics, such as benzene, toluene, and mixed xylene; | ||
| • | fuels, such as automotive gasoline and LPG; and | ||
| • | MTBE, solvent C9 and pyrolysis C9. |
67
Table of Contents
| • | 30 km from Refinaria Alberto Pasqualini (located in Canoas, Rio Grande do Sul), a refinery that is owned and operated by Petrobras; and | ||
| • | 150 km from the Almirante Soares Dutra Terminal (located in Osório, Rio Grande do Sul), a port terminal owned and operated by Petrobras Transporte S.A. – Transpetro, or Transpetro, a subsidiary of Petrobras. |
| • | Petrobras has agreed to sell and deliver naphtha and petroleum condensate to Copesul’s basic petrochemicals plants in the Southern Complex exclusively for Copesul’s use as a raw material; | ||
| • | Copesul provides Petrobras with a firm commitment order for naphtha each month, together with an estimate of the volume of naphtha that Copesul will purchase over the following six months; | ||
| • | if Copesul requests to purchase volumes of naphtha that exceed the minimum volumes it establishes, Petrobras must use its best efforts to attempt to meet Copesul’s higher demand; | ||
| • | if Copesul fails to purchase the minimum volumes that it establishes for a given year, Copesul is required to pay damages to Petrobras, and if Petrobras fails to deliver the minimum volumes, Petrobras is required to pay damages to Copesul; |
68
Table of Contents
| • | Petrobras may suspend deliveries, in whole or in part, or may terminate this contract without penalties if required by the National Petroleum Agency as a result of a national contingency plan that adversely affects the supply of petroleum derivatives in Brazil; and | ||
| • | Petrobras may rescind the contract, without prior notice, if: (1) Copesul violates any provision of the contract; (2) Copesul declares bankruptcy, or is declared bankrupt or is liquidated; (3) Copesul transfers all or part of its rights and obligations under the contract to a third party without Petrobras’ consent; or (4) Copesul is involved in a reorganization or merger. |
| • | SONATRACH has agreed to sell and deliver petroleum condensate to Copesul exclusively for Copesul’s use as a raw material; | ||
| • | Copesul provides SONATRACH with a firm commitment order for petroleum each month at a market price that is agreed to each month; and | ||
| • | Copesul agreed to purchase, and SONATRACH agreed to sell, approximately 1,000,000 tons of petroleum condensate annually. |
| • | Ryttsa has agreed to sell and deliver naphtha to Copesul exclusively for Copesul’s use as a raw material; and | ||
| • | Copesul agreed to purchase, and Ryttsa agreed to sell, an annual minimum of 630,000 tons of naphtha and an annual maximum of 870,000 tons. |
| • | technology licensed from TECHNIP/Kinetics Technology International BV, which Copesul uses in one of its olefins plants; | ||
| • | technology licensed from Shaw Stone & Webster, Inc., which Copesul uses in one of its olefins plants; | ||
| • | technology licensed from Axens, a subsidiary of Institut Francais du Petrole, which Copesul uses in the production of pyrolysis gasoline; | ||
| • | technology licensed from Nippon Zeon, which Copesul uses in its butadiene plant; | ||
| • | technology licensed from UOP LLC, which Copesul uses in its BTX fractionation plant; | ||
| • | technology licensed from Krupp/UHDE GmbH, which Copesul uses in its benzene extraction plant; |
69
Table of Contents
| • | technology licensed from Shaw Stone & Webster, Inc., which Copesul uses in its butene-1 plant; and | ||
| • | technology licensed for Petroflex, which Copesul uses in its MTBE plant. |
| • | the conversion of its MTBE plant to the production of ethyl tertiary butyl ether, which is scheduled to be completed in the fourth quarter of 2007; | ||
| • | upgrades to its furnaces and logistics systems; | ||
| • | projects to expand the products and services that it offers; | ||
| • | competitiveness programs; and | ||
| • | safety, health and environmental programs. |
70
Table of Contents
71
Table of Contents
72
Table of Contents
73
Table of Contents
74
Table of Contents
75
Table of Contents
| • | so long as we own at least 60% of Paulínia’s total share capital, we have the right to nominate a majority (three members) of Paulínia’s board of directors (and their respective alternates) and two of its three executive officers; | ||
| • | so long as Petroquisa owns at least 40% of Paulínia’s total share capital, Petroquisa has the right to nominate two members of Paulínia’s board of directors (and their respective alternates) and one of its three executive officers; | ||
| • | if the interest in the total share capital of Paulínia of our company or Petroquisa falls below 40% (but exceeds 20%), we or Petroquisa will have the right to elect one member of Paulínia’s board of directors; and | ||
| • | if the interest in the total share capital of Paulínia of our company or Petroquisa falls below 10% (if we and Petroquisa are Paulínia’s only shareholders at the time, or below 20% if Paulínia has additional shareholders at the time), we or Petroquisa will no longer have the right to elect members of Paulínia’s board of directors. |
76
Table of Contents
| • | an efficiency enhancement project at one of our polypropylene plants in the Southern Complex that increased our annual polypropylene production capacity by 100,000 tons. This project was undertaken in 2003 and 2004 at a total cost of R$21.0 million; | ||
| • | an automation project in our PVC plants in Alagoas and the Northeastern Complex that is expected to increase the reliability of the operation of and modernize these plants, improve the operational performance of these plants, and increase the safety of our production processes at these plants. We invested R$37.4 million in this project in 2003, 2004, 2005 and 2006. This project was completed at our Alagoas PVC plant in 2004 and at our PVC plant in the Northeastern Complex in the second half of 2006; | ||
| • | the first stage of our modernization and improvement project at our Aromatics 1 and 2 units in the Northeastern Complex that increased our annual para-xylene production capacity by 50,000 tons. This project was undertaken in 2004 at a total cost of R$25.1 million; | ||
| • | an efficiency enhancement at our Alagoas PVC plant that increased its annual production capacity by 50,000 tons. This project was undertaken in 2004 and 2005 at a total cost of R$111.8 million; | ||
| • | an efficiency enhancement project at one of our polyethylene plants in the Northeastern Complex that increased its annual production capacity by 30,000 tons. This project was undertaken in 2004 and 2005 at a total cost of R$9.2 million; | ||
| • | an efficiency enhancement project at our other polyethylene plant in the Northeastern Complex that we believe will increase its annual production capacity by 30,000 tons. We invested R$3.1 million in this project in 2004 and 2005 and completed this project in the third quarter of 2006 at a total cost of approximately R$9.9 million; and | ||
| • | an efficiency enhancement project at our Aromatics 2 unit in the Northeastern Complex that increased our annual isoprene production capacity by 8,800 to 26,800 tons. We completed this project in 2006 at a total cost of R$81.9 million. |
77
Table of Contents
78
Table of Contents
| • | Ultrapar is obligated to acquire, as a commission agent acting on behalf of Braskem and Petrobras, 100% of the share capital of Ipiranga Química. Ipiranga Química currently owns 86.9% of the voting share capital and 92.4% of the total share capital of Ipiranga Petroquímica, which in turn owns 29.5% of the share capital of Copesul. Under the Investment Agreement, Ultrapar is obligated to transfer 60% of the share capital of Ipiranga Química to our company and 40% of the share capital of Ipiranga Química to Petrobras. | ||
| • | We are obligated under applicable law to conduct a public tender offer jointly with Petrobras for the 13.1% of the share capital of Ipiranga Petroquímica not currently owned by Ipiranga Química. | ||
| • | Under the Investment Agreement, Ultrapar is obligated to transfer 33.3% of the share capital of RPI to our company and 33.3% of the share capital of RPI to Petrobras. We will jointly and equally control RPI with Petrobras and Ultrapar. |
| • | this joint venture would be implemented through a new company which the parties will jointly control; | ||
| • | Pequiven would be responsible for obtaining a supply of propylene, the primary feed stock of this plant, for the new company; | ||
| • | a significant portion of the cost of the project will be borrowed by the joint venture company under project finance arrangements, collateralized exclusively by the assets of this project, with multilateral credit agencies, export credit agencies, development banks and private banks; and | ||
| • | the contributions of the parties to the new company may consist of cash, equity in other companies in the petrochemical sector and/or key technology and know-how. |
79
Table of Contents
| • | this joint venture would be implemented through a new company which the parties will jointly control; and | ||
| • | a significant portion of the cost of the project will be borrowed by the joint venture company under project finance arrangements, collateralized exclusively by the assets of this project, with multilateral credit agencies, export credit agencies, development banks and private banks. |
80
Table of Contents
81
Table of Contents
82
Table of Contents
| • | no significant environmental accidents in 2006; and | ||
| • | no fines were levied on any of our plants by state environmental authorities during 2006. |
83
Table of Contents
| • | expanding our relationship with the communities in which we operate; | ||
| • | continually improving the health, safety and environmental aspects of our processes, products and services by promoting innovation and complying with evolving health, safety and environmental standards; | ||
| • | implementing preventive measures to promote (1) the health and quality of life of people in the communities in which we operate, and (2) the safety of our workers, third parties and others involved or affected by our processes; and | ||
| • | the efficient use of natural resources. |
| Year Ended December 31, | ||||||||||||||||
| 2006 | 2005 | 2004 | 2005 (1) | |||||||||||||
| Brazilian Chemical | ||||||||||||||||
| Braskem | Industry Average | |||||||||||||||
Safety Indicator | ||||||||||||||||
| Index of Accident Frequency (accidents/200,000 man-hours) | 0.3 | 0.2 | 0.4 | 2.4 | ||||||||||||
| Index of Severity (lost and deducted days/200,000 man-hours) | 3 | 4 | 11 | 30 | ||||||||||||
| (1) | Brazilian petrochemical industry average of the members of Brazilian Association of Chemical Industry and Derivative Products for 2005, as reported by the Brazilian Association of Chemical Industry and Derivative Products. |
| • | a 38% increase in our rate of personal accidents of all types, compared to 2005; | ||
| • | eight of our 14 units had no accidents causing injuries requiring a worker to be absent from work during 2006; and |
84
Table of Contents
| • | our total cost resulting from accidents was approximately 4% higher than in 2005. |
| Type of Product or Service | Location of Facilities | Size of Plant | ||||
| (in hectares (1)) | ||||||
| Basic petrochemicals | Camaçari | 65.5 | ||||
| Waste disposal | Marechal Deodoro | 34.3 | ||||
| Polyethylene | Camaçari | 24.5 | ||||
| Caustic soda/EDC/chlorine | Maceió | 15.0 | ||||
| PVC/caustic soda/chlorine | Camaçari | 12.6 | ||||
| Polyethylene | Triunfo | 12.4 | ||||
| Polypropylene | Triunfo | 11.4 | ||||
| Caprolactam | Camaçari | 8.1 | ||||
| PVC | Marechal Deodoro | 7.0 | ||||
| PET (2) | Camaçari | 6.2 | ||||
| PVC | Vila Prudente/Capuava | 3.2 | ||||
| (1) | One hectare equals 10,000 square meters. | |
| (2) | On May 16, 2007 we temporarily closed our PET plant. |
85
Table of Contents
| • | the Administrative Council for Economic Defense(Conselho Administrativo de Defesa Econômica), or CADE, an independent agency consisting of a president and six members; | ||
| • | the Economic Law Office of the Ministry of Justice(Secretaria de Direito Econômico), or SDE; and | ||
| • | the Economic Monitoring Office of the Ministry of Finance(Secretaria de Acompanhamento Econômico), or SEAE. |
86
Table of Contents
| • | a brief overview of our company and the principal factors that influence our results of operations, financial condition and liquidity; | ||
| • | a review of our financial presentation and accounting policies, including our critical accounting policies; |
87
Table of Contents
| • | a discussion of the principal factors that influence our results of operations; | ||
| • | a discussion of our results of operations for the years ended December 31, 2006, 2005 and 2004; | ||
| • | a discussion of developments since the end of 2006 that may materially affect our results of operations, financial condition and liquidity; | ||
| • | a discussion of our liquidity and capital resources, including our working capital at December 31, 2006, our cash flows for the years ended December 31, 2006, 2005 and 2004, and our material short-term and long-term indebtedness at December 31, 2006; | ||
| • | a discussion of our off-balance sheet arrangements; | ||
| • | a discussion of our capital expenditures and our contractual commitments; and | ||
| • | a qualitative and quantitative discussion of market risks that we face. |
| • | the growth rate of Brazilian GDP, which affects the demand for our products and, consequently, our domestic sales volume; | ||
| • | the international market price of naphtha, our principal raw material, which significantly affects the cost of producing our products; | ||
| • | the expansion of global production capacity for the products that we sell and the growth rate of the global economy; | ||
| • | the exchange rate of the Brazilianrealagainst the U.S. dollar; | ||
| • | the level of our outstanding indebtedness and the interest rates we pay on this indebtedness, which affects our net financial expenses; | ||
| • | the results of operations of those companies in which we have or had minority equity interests, such as Copesul, Politeno and Petroflex, a portion of which are consolidated into our results of operations as required by Brazilian GAAP; | ||
| • | the tax policies adopted by, and resulting tax obligations to, the Brazilian government and the governments of the Brazilian states in which we operate; and |
88
Table of Contents
| • | our implementation of our corporate competitiveness programs, Braskem+ and Formula Braskem, which we anticipate will result in meaningful operational improvements and the realization of annual recurring cost reductions over the next few years. |
| • | our ability to generate cash flows from our operations; | ||
| • | prevailing Brazilian and international interest rates and movements in exchange rates, which affect our debt service requirements; | ||
| • | our ability to continue to be able to borrow funds from Brazilian and international financial institutions and to sell our debt securities in the Brazilian and international securities markets, which is influenced by a number of factors discussed below; and | ||
| • | our capital expenditure requirements, which consist primarily of maintenance of our operating facilities, expansion of our production capacity and research and development activities. |
| • | Basic petrochemicals—This segment includes our production and sale of basic petrochemicals and our supply of utilities to second generation producers, including some producers owned or controlled by our company; | ||
| • | Polyolefins—This segment includes our production and sale of polyethylene and polypropylene; | ||
| • | Vinyls—This segment includes our production and sale of PVC, caustic soda and chlorine; and | ||
| • | Business development—This segment includes our production and sale of other second generation petrochemical products, such as PET and caprolactam. |
89
Table of Contents
| • | Provision for doubtful accounts. We record a provision for doubtful accounts in an amount considered sufficient to cover estimated losses on the realization of the receivables, taking into account the Company’s loss experience. For a better calculation of the doubtful accounts, the Company analyzes, on a monthly basis, the amounts and characteristics of trade accounts receivable. | ||
| • | Impairment and depreciation and amortization of permanent assets. We perform annual cash flow studies to determine if the accounting value of our assets, primarily our property, plant and equipment, goodwill and other intangible assets, is compatible with the profitability resulting from the respective business units. If the expected cash flows are lower than the accounting value, we record a provision for impairment of the asset’s value. In order to estimate future cash flows, we must make various assumptions about matters that are highly uncertain, including future production and sales, product prices (which we estimate based on current and historical prices, price trends and related factors), future taxes payable and operating costs. We regularly recognize expenses related to the depreciation of our property, plant and equipment and to the amortization of our deferred charges, goodwill and other intangible assets. The rates of depreciation or amortization are based on our or on third-party estimates of the useful lives of the fixed assets or otherwise over the periods during which these assets can be expected to provide benefits to us. | ||
| • | Valuation of investments other than temporary impairment on investment. We record long-term investments at cost or under the equity accounting method, depending on our participation in voting capital and the degree of influence that we exercise over the operations of the companies involved. We evaluate the fair value of investments for impairment whenever the performance of the underlying entity indicates that impairment may exist. In such cases, the fair value of the investments is estimated principally based on discounted estimated cash flows using assumptions. Arriving at assumptions and estimates concerning these cash flows is a complex and often subjective process involving estimation of future revenues, costs and taxes. | ||
| • | Valuation of derivative instruments. We use swaps, non-deliverable forwards, non-deliverable options and other derivative instruments to manage risks from changes in foreign exchange and interest rates. We record these instruments at their estimated fair market value based on market quotations for similar instruments, and based on standard mark-to-market practices, which take into account reliable market curves for interest rates, foreign exchange rates and volatility. | ||
| • | Pension plans. For defined benefit plans that we sponsor, we calculate our funding obligations based on calculations performed by independent actuaries using assumptions that we provide about interest rates, investment returns, levels of inflation, mortality rates and future employment levels. These assumptions directly impact our liability for accrued pension costs and the amounts we record as pension costs. In June |
90
Table of Contents
| 2005, we announced that we intend to withdraw as a sponsor of our defined benefit plans. Unrecognized actuarial gains and losses are amortized either over the estimated future service period of employees or over the estimated period of the plan final settlement, whichever is less. |
| • | Deferred taxes. We recognize deferred tax assets and liabilities based on the differences between the financial statement carrying amounts and the tax basis of assets and liabilities using prevailing tax rates. We regularly review any deferred tax assets for recoverability and reduce their carrying value, as required, based on our historical taxable income, projected future taxable income and the expected timing of any reversals of existing temporary differences. If one of our subsidiaries operates at a loss or is unable to generate sufficient future taxable income, or if there is a material change in the actual effective tax rates or the time period within which the underlying temporary differences become taxable or deductible, we evaluate the need to reduce partially or completely the carrying value of our deferred tax assets. | ||
| • | Contingencies. We are currently involved in numerous judicial and administrative proceedings, as described under “Item 8. Financial Information—Legal Proceedings” and in notes 9, 16, 17 and 21 to our consolidated financial statements. We record accrued liabilities for contingencies that we deem probable of creating an adverse effect on the result of operations or financial condition. We believe that these contingencies are properly recognized in our financial statements. We are also involved in judicial and administrative proceedings that are aimed at obtaining or defending our legal rights with respect to taxes that we believe to be unconstitutional or otherwise not required to be paid by our company. We believe that these proceedings will ultimately result in tax credits or benefits, which we do not recognize in our financial statements until the contingency has been resolved. When, based on favorable but appealable court decisions, we use tax credits or benefits in dispute to offset current tax obligations, we establish a provision equal to the amount used and maintain the provision until a final decision on those credits or benefits. Our provisions include interest on the tax obligations we have offset with disputed credits or benefits at the interest rate defined in the relevant tax law. |
91
Table of Contents
92
Table of Contents
| • | cyclical trends in general business and economic activity produce swings in demand for petrochemicals; |
93
Table of Contents
| • | during periods of reduced demand, the high fixed cost structure of the capital intensive petrochemicals industry generally leads producers to compete aggressively on price in order to maximize capacity utilization; | ||
| • | significant capacity additions, whether through plant expansion or construction, can take two to three years to implement and are therefore necessarily based upon estimates of future demand; and | ||
| • | as competition in petrochemical products is generally focused on price, being a low-cost producer is critical to improved profitability. This favors producers with larger plants that maximize economies of scale, but construction of plants with high capacity may result in significant increases in capacity that can outstrip demand growth. |
| • | in 2006, (1) Copesul expanded its annual ethylene production capacity by 65,000 tons and its annual propylene production capacity by 49,000 tons in January; (2) Ipiranga Petroquímica expanded its annual polypropylene production capacity by 30,000 tons in January; (3) Suzano expanded its polypropylene annual production capacity by 60,000 tons in July; and (4) we increased our annual HDPE production capacity by 30,000 tons in September and our annual isoprene production capacity by 8,800 tons in November; | ||
| • | in 2005, (1) Solvay expanded its annual PVC production capacity by 30,000 tons in December; and (2) we increased our annual polyethylene production capacity by 30,000 tons in October and our annual PVC production capacity by 50,000 tons in December; and | ||
| • | in 2004, (1) Polibrasil Resinas S.A.’s polypropylene facility in Mauá, São Paulo, which commenced operations in 2003, reached its full annual capacity of 300,000 tons; and (2) we increased our annual para-xylene production capacity by 50,000 tons in May and our annual polypropylene production capacity by 100,000 tons in December. |
94
Table of Contents
| Year Ended December 31, | ||||||||||||
| 2006 | 2005 | 2004 | ||||||||||
| Ethylene | 87 | % | 91 | % | 87 | % | ||||||
| Polyethylene | 89 | (1) | 94 | (2) | 91 | |||||||
| Polypropylene | 97 | 94 | 96 | (3) | ||||||||
| PVC | 86 | 95 | (4) | 90 | ||||||||
| (1) | Without giving effect to a 30,000 ton increase of our annual production capacity in September 2006. | |
| (2) | Without giving effect to a 30,000 ton increase of our annual production capacity in November 2005. | |
| (3) | Without giving effect to a 100,000 ton increase of our annual production capacity in July 2004. | |
| (4) | Without giving effect to a 50,000 ton increase of our annual production capacity in December 2005. |
| • | high costs of transporting products to and within Brazil; | ||
| • | warehousing, and other logistics costs; and | ||
| • | tariffs and duties. |
95
Table of Contents
| • | a substantial portion of our net sales revenue is linked to U.S. dollars; | ||
| • | our costs for some of our raw materials, principally naphtha and certain catalysts required in our production processes, are incurred in U.S. dollars or are U.S. dollar-linked; | ||
| • | we have operating expenses, and make other expenditures, that are denominated in or linked to U.S. dollars; and | ||
| • | we have significant amounts of U.S. dollar-denominated liabilities that require us to make principal and interest payments in U.S. dollars. |
| • | the interest costs on our U.S. dollar-denominated indebtedness increase inreais, which negatively affects our results of operations inreais; | ||
| • | the amount of our U.S. dollar-denominated indebtedness increases inreais, and our total liabilities and debt service obligations inreaisincrease; and | ||
| • | our financial expenses tend to increase as a result of foreign exchange losses that we must record. |
| • | the interest costs on our U.S. dollar-denominated indebtedness decrease inreais, which positively affects our results of operations inreais; |
96
Table of Contents
| • | the amount of our U.S. dollar-denominated indebtedness decreases inreais, and our total liabilities and debt service obligations inreaisdecrease; and | ||
| • | our financial expenses tend to decrease as a result of foreign exchange gains that we must record. |
97
Table of Contents
98
Table of Contents
| • | PVC manufactured at our plant in the Northeastern Complex until December 31, 2013; | ||
| • | polyethylene manufactured at our polyethylene plants in the Northeastern Complex and basic petrochemical products manufactured in the Northeastern Complex, until December 31, 2011; and | ||
| • | caustic soda, chlorine and EDC produced at our plants in the Northeastern Complex and Alagoas, and caprolactam manufactured in the Northeastern Complex until December 31, 2012. |
99
Table of Contents
100
Table of Contents
| • | Ultrapar is obligated to acquire, as a commission agent acting on behalf of Braskem and Petrobras, 100% of the share capital of Ipiranga Química. Ipiranga Química currently owns 86.9% of the voting share capital and 92.4% of the total share capital of Ipiranga Petroquímica, which in turn owns 29.5% of the share capital of Copesul. Under the Investment Agreement, Ultrapar is obligated to transfer 60% of the share capital of Ipiranga Química to our company and 40% of the share capital of Ipiranga Química to Petrobras. | ||
| • | We are obligated under applicable law to conduct a public tender offer jointly with Petrobras for the 13.1% of the share capital of Ipiranga Petroquímica not currently owned by Ipiranga Química. | ||
| • | Under the Investment Agreement, Ultrapar is obligated to transfer 33.3% of the share capital of RPI to our company and 33.3% of the share capital of RPI to Petrobras. We will jointly and equally control RPI with Petrobras and Ultrapar. |
101
Table of Contents
| • | investments in certain jointly controlled companies which are required to be proportionally consolidated under Brazilian GAAP are not considered as part of any segment for segment reporting purposes; and | ||
| • | operating income for segment reporting purposes does not consider the results of investments in associated companies and financial income and expenses, whereas such results and income and expenses are classified as operating items for statutory reporting purposes. |
102
Table of Contents
| Year Ended December 31, 2006 | ||||||||||||||||||||||||||||||||||||
| Basic | Business | Total | Total prior | |||||||||||||||||||||||||||||||||
| Petrochemicals | Polyolefins | Vinyls | Development | segments | Eliminations | to CVM 247 | CVM 247 | Consolidated | ||||||||||||||||||||||||||||
| (in millions ofreais) | ||||||||||||||||||||||||||||||||||||
| Net sales revenue | R$ | 6,883.6 | R$ | 4,775.8 | R$ | 1,541.7 | R$ | 483.1 | R$ | 13,684.2 | R$ | (1,965.2 | ) | R$ | 11,719.0 | R$ | 1,273.7 | R$ | 12,992.7 | |||||||||||||||||
| Cost of sales and services rendered | (5,994.8 | ) | (3,985.4 | ) | (1,245.3 | ) | (545.7 | ) | (11,771.2 | ) | 1,889.6 | (9,881.6 | ) | (910.5 | ) | (10,792.1 | ) | |||||||||||||||||||
| Gross profit (loss) | 888.8 | 790.4 | 296.4 | (62.6 | ) | 1,913.0 | (75.6 | ) | 1,837.4 | 363.2 | 2,200.6 | |||||||||||||||||||||||||
| Operating expenses: | �� | |||||||||||||||||||||||||||||||||||
| Selling, general and administrative | (339.0 | ) | (344.5 | ) | (123.0 | ) | (26.0 | ) | (832.5 | ) | (41.9 | ) | (874.4 | ) | (77.1 | ) | (951.5 | ) | ||||||||||||||||||
| Depreciation and amortization | (0.4 | ) | (10.4 | ) | (0.4 | ) | (0.1 | ) | (11.3 | ) | (368.3 | ) | (379.6 | ) | (5.4 | ) | (385.0 | ) | ||||||||||||||||||
| Other, net | (10.4 | ) | 22.5 | 35.1 | 1.9 | 49.1 | 107.8 | 156.9 | 29.2 | 186.1 | ||||||||||||||||||||||||||
| Operating income (loss) | R$ | 539.0 | R$ | 458.0 | R$ | 208.1 | R$ | (86.8 | ) | R$ | 1,118.3 | R$ | (378.0 | ) | R$ | 740.3 | R$ | 309.9 | R$ | 1,050.2 | ||||||||||||||||
| Year Ended December 31, 2005 | ||||||||||||||||||||||||||||||||||||
| Basic | Business | Total | Total prior | |||||||||||||||||||||||||||||||||
| Petrochemicals | Polyolefins | Vinyls | Development | segments | Eliminations | to CVM 247 | CVM 247 | Consolidated | ||||||||||||||||||||||||||||
| (in millions ofreais) | ||||||||||||||||||||||||||||||||||||
| Net sales revenue | R$ | 7,226.7 | R$ | 3,919.0 | R$ | 1,794.1 | R$ | 569.0 | R$ | 13,508.8 | R$ | (1,894.2 | ) | R$ | 11,614.6 | R$ | 1,460.5 | R$ | 13,075.1 | |||||||||||||||||
| Cost of sales and services rendered | (6,138.5 | ) | (3,182.8 | ) | (1,271.9 | ) | (552.9 | ) | (11,146.1 | ) | 1,827.6 | (9,318.5 | ) | (1,043.2 | ) | (10,361.7 | ) | |||||||||||||||||||
| Gross profit | 1,088.2 | 736.2 | 522.2 | 16.1 | 2,362.7 | (66.6 | ) | 2,296.1 | 417.3 | 2,713.4 | ||||||||||||||||||||||||||
| Operating expenses: | ||||||||||||||||||||||||||||||||||||
| Selling, general and administrative | (250.3 | ) | (229.0 | ) | (89.2 | ) | (18.2 | ) | (586.7 | ) | (89.7 | ) | (676.4 | ) | (110.7 | ) | (787.1 | ) | ||||||||||||||||||
| Depreciation and amortization | 0.0 | (6.9 | ) | (0.8 | ) | (0.3 | ) | (8.0 | ) | (342.2 | ) | (350.2 | ) | (5.4 | ) | (355.6 | ) | |||||||||||||||||||
| Other, net | 57.1 | 53.0 | 6.6 | 9.2 | 125.9 | (56.1 | ) | 69.8 | (47.0 | ) | 22.8 | |||||||||||||||||||||||||
| Operating income | R$ | 895.0 | R$ | 553.3 | R$ | 438.8 | R$ | 6.8 | R$ | 1,893.9 | R$ | (554.6 | ) | R$ | 1,339.3 | R$ | 254.2 | R$ | 1,593.5 | |||||||||||||||||
| Year Ended December 31, 2004 | ||||||||||||||||||||||||||||||||||||
| Basic | Business | Total | Total prior | |||||||||||||||||||||||||||||||||
| Petrochemicals | Polyolefins | Vinyls | Development | segments | Eliminations | to CVM 247 | CVM 247 | Consolidated | ||||||||||||||||||||||||||||
| (in millions ofreais) | ||||||||||||||||||||||||||||||||||||
| Net sales revenue | R$ | 6,480.0 | R$ | 3,489.4 | R$ | 1,858.8 | R$ | 620.8 | R$ | 12,449.0 | R$ | (1,404.8 | ) | R$ | 11,044.2 | R$ | 1,345.3 | R$ | 12,389.5 | |||||||||||||||||
| Cost of sales and services rendered | (5,330.1 | ) | (2,523.0 | ) | (1,157.1 | ) | (564.9 | ) | (9,575.1 | ) | 1,269.4 | (8,305.7 | ) | (917.3 | ) | (9,223.0 | ) | |||||||||||||||||||
| Gross profit | 1,149.9 | 966.4 | 701.7 | 55.9 | 2,873.9 | (135.4 | ) | 2,738.5 | 428.0 | 3,166.5 | ||||||||||||||||||||||||||
| Operating expenses: | ||||||||||||||||||||||||||||||||||||
| Selling, general and administrative | (213.8 | ) | (199.1 | ) | (80.1 | ) | (24.9 | ) | (517.9 | ) | (62.8 | ) | (580.7 | ) | (96.3 | ) | (677.0 | ) | ||||||||||||||||||
| Depreciation and amortization | (2.6 | ) | (5.9 | ) | (0.6 | ) | (0.7 | ) | (9.8 | ) | (344.0 | ) | (353.8 | ) | (5.9 | ) | (359.7 | ) | ||||||||||||||||||
| Other, net | 22.2 | 6.3 | 14.9 | 2.6 | 46.0 | (10.8 | ) | 35.2 | 7.8 | 43.0 | ||||||||||||||||||||||||||
| Operating income | R$ | 955.7 | R$ | 767.7 | R$ | 635.9 | R$ | 32.9 | R$ | 2,392.2 | R$ | (553.0 | ) | R$ | 1,839.2 | R$ | 333.6 | R$ | 2,172.8 | |||||||||||||||||
103
Table of Contents
| Year Ended December 31, | ||||||||
| 2006 | 2005 | |||||||
| (In millions ofreais) | ||||||||
| Net sales revenue | R$ | 12,992.7 | R$ | 13,075.1 | ||||
| Cost of sales and services rendered | (10,792.1 | ) | (10,361.7 | ) | ||||
| Gross profit | 2,200.6 | 2,713.4 | ||||||
| Selling, general and administrative expenses | (951.5 | ) | (787.1 | ) | ||||
| Investment in associated companies, net(1) | (28.8 | ) | (109.8 | ) | ||||
| Depreciation and amortization | (385.0 | ) | (355.6 | ) | ||||
| Financial expenses, net | (938.4 | ) | (709.4 | ) | ||||
| Other operating income, net | 186.1 | 22.8 | ||||||
| Operating income | 83.0 | 774.3 | ||||||
| Non-operating expenses, net | 7.1 | (25.2 | ) | |||||
| Income before income tax and social contribution and minority interest | 90.1 | 749.1 | ||||||
| Income tax and social contribution | 12.8 | (177.3 | ) | |||||
| Income before minority interest | 102.9 | 571.8 | ||||||
| Minority interest | (1.6 | ) | 54.0 | |||||
| Net income | R$ | 101.3 | R$ | 625.8 | ||||
| (1) | Investment in associated companies, net comprises the following line items in our consolidated statement of operations: equity in the results, amortization of goodwill (negative goodwill), net, foreign exchange variation and tax incentives and other. |
104
Table of Contents
| • | financial income of R$333.4 million related to the exchange rate effect on our U.S. dollar-denominated and U.S. dollar-indexed liabilities; and | ||
| • | financial expense of R$204.2 million related to the exchange rate effect on our U.S. dollar-denominated assets. |
| • | financial income of R$556.9 million related to the exchange rate effect on our U.S. dollar-denominated and U.S. dollar-indexed liabilities; and |
105
Table of Contents
| • | financial expense of R$288.8 million related to the exchange rate effect on our U.S. dollar-denominated assets. |
106
Table of Contents
| Year Ended December 31, | ||||||||
| 2006 | 2005 | |||||||
| (in millions ofreais,except | ||||||||
| percentages) | ||||||||
Basic Petrochemicals | ||||||||
| Net sales revenue | R$ | 6,883.6 | R$ | 7,226.7 | ||||
| Cost of sales and services rendered | (5,994.8 | ) | (6,138.5 | ) | ||||
| Gross profit | 888.8 | 1,088.2 | ||||||
| Operating income (1) | 539.0 | 895.0 | ||||||
| Gross margin (%) | 12.9 | % | 15.1 | % | ||||
| Operating margin (%) | 7.8 | % | 12.4 | % | ||||
Polyolefins | ||||||||
| Net sales revenue | R$ | 4,775.8 | R$ | 3,919.0 | ||||
| Cost of sales | (3,985.4 | ) | (3,182.8 | ) | ||||
| Gross profit | 790.4 | 736.2 | ||||||
| Operating income (1) | 458.0 | 553.3 | ||||||
| Gross margin (%) | 16.6 | % | 18.8 | % | ||||
| Operating margin (%) | 9.6 | % | 14.1 | % | ||||
Vinyls | ||||||||
| Net sales revenue | R$ | 1,541.7 | R$ | 1,794.1 | ||||
| Cost of sales | (1,245.3 | ) | (1,271.9 | ) | ||||
| Gross profit | 296.4 | 522.2 | ||||||
| Operating income (1) | 208.1 | 438.8 | ||||||
| Gross margin (%) | 19.2 | % | 29.1 | % | ||||
| Operating margin (%) | 13.5 | % | 24.5 | % | ||||
Business Development | ||||||||
| Net sales revenue | R$ | 483.1 | R$ | 569.0 | ||||
| Cost of sales | (545.7 | ) | (552.9 | ) | ||||
| Gross profit (loss) | (62.6 | ) | 16.1 | |||||
| Operating income (loss)(1) | (86.8 | ) | 6.8 | |||||
| Gross margin (%) | (13.0 | )% | 2.8 | % | ||||
| Operating margin (%) | (18.0 | )% | 1.2 | % | ||||
| (1) | Operating income does not include financial income, financial expense and investment in associated companies. |
| • | a R$572.0 million, or 45.0%, decline in net sales revenue generated by domestic sales of ethylene to third parties; | ||
| • | a R$126.6 million, or 12.5%, decline in net sales revenue generated by sales of propylene to third parties; | ||
| • | a R$100.4 million, or 35.5%, decline in net sales revenue generated by sales of para-xylene to third parties; |
107
Table of Contents
| • | a R$86.3 million, or 11.3%, decline in net sales revenue generated by sales of benzene to third parties. |
108
Table of Contents
| • | a 34.6% increase in net sales revenue generated by sales of polyethylene, led by (1) a 50.1% increase in net sales revenue generated by sales of LLDPE, (2) a 41.2% increase in net sales revenue generated by sales of LDPE, and (3) to a lesser extent, net sales revenue of R$61.6 million generated by sales of EVA, which we have sold since the Politeno acquisition on April 6, 2006; and | ||
| • | a 4.2% increase in net sales revenue generated by sales of polypropylene, principally as a result of the higher volume sold and higher prices compared to 2005. |
109
Table of Contents
110
Table of Contents
| Year Ended December 31, | ||||||||
| 2005 | 2004 | |||||||
| (In millions ofreais) | ||||||||
| Net sales revenue | R$ | 13,075.1 | R$ | 12,389.5 | ||||
| Cost of sales and services rendered | (10,361.7 | ) | (9,223.0 | ) | ||||
| Gross profit | 2,713.4 | 3,166.5 | ||||||
| Selling, general and administrative expenses | (787.1 | ) | (677.0 | ) | ||||
| Investment in associated companies, net(1) | (109.8 | ) | (107.6 | ) | ||||
| Depreciation and amortization | (355.6 | ) | (359.7 | ) | ||||
| Financial expenses, net | (709.4 | ) | (1,238.6 | ) | ||||
| Other operating income, net | 22.8 | 43.0 | ||||||
| Operating income | 774.3 | 826.6 | ||||||
| Non-operating expenses, net | (25.2 | ) | (29.8 | ) | ||||
| Income before income tax and social contribution and minority interest | 749.1 | 796.8 | ||||||
| Income tax and social contribution | (177.3 | ) | (85.1 | ) | ||||
| Income before minority interest | 571.8 | 711.7 | ||||||
| Minority interest | 54.0 | (24.6 | ) | |||||
| Net income | R$ | 625.8 | R$ | 687.1 | ||||
| (1) | Investment in associated companies, net comprises the following line items in our consolidated statement of operations: equity in the results, amortization of goodwill (negative goodwill), net, foreign exchange variation and tax incentives and other. |
111
Table of Contents
| • | financial income of R$556.9 million related to the exchange rate effect on our U.S. dollar-denominated and U.S. dollar-indexed liabilities; and |
112
Table of Contents
| • | financial expense of R$288.8 million related to the exchange rate effect on our U.S. dollar-denominated assets. |
| • | financial income of R$425.4 million related to the exchange rate effect on our U.S. dollar-denominated and U.S. dollar-indexed liabilities; and | ||
| • | financial expense of R$335.3 million related to the exchange rate effect on our U.S. dollar-denominated assets. |
113
Table of Contents
| Year Ended December 31, | ||||||||
| 2005 | 2004 | |||||||
| (in millions ofreais,except | ||||||||
| percentages) | ||||||||
Basic Petrochemicals | ||||||||
| Net sales revenue | R$ | 7,226.7 | R$ | 6,480.0 | ||||
| Cost of sales and services rendered | (6,138.5 | ) | (5,330.1 | ) | ||||
| Gross profit | 1,088.2 | 1,149.9 | ||||||
| Operating income (1) | 895.0 | 955.7 | ||||||
| Gross margin (%) | 15.1 | % | 17.7 | % | ||||
| Operating margin (%) | 12.4 | % | 14.7 | % | ||||
Polyolefins | ||||||||
| Net sales revenue | R$ | 3,919.0 | R$ | 3,489.4 | ||||
| Cost of sales | (3,182.8 | ) | (2,523.0 | ) | ||||
| Gross profit | 736.2 | 966.4 | ||||||
| Operating income (1) | 553.3 | 767.7 | ||||||
| Gross margin (%) | 18.8 | % | 27.7 | % | ||||
| Operating margin (%) | 14.1 | % | 22.0 | % | ||||
Vinyls | ||||||||
| Net sales revenue | R$ | 1,794.1 | R$ | 1,858.8 | ||||
| Cost of sales | (1,271.9 | ) | (1,157.1 | ) | ||||
| Gross profit | 522.2 | 701.7 | ||||||
| Operating income (1) | 438.8 | 635.9 | ||||||
| Gross margin (%) | 29.1 | % | 37.8 | % | ||||
| Operating margin (%) | 24.5 | % | 34.2 | % | ||||
Business Development | ||||||||
| Net sales revenue | R$ | 569.0 | R$ | 620.8 | ||||
| Cost of sales | (552.9 | ) | (564.9 | ) | ||||
| Gross profit | 16.1 | 55.9 | ||||||
| Operating income (1) | 6.8 | 32.9 | ||||||
| Gross margin (%) | 2.8 | % | 9.0 | % | ||||
| Operating margin (%) | 1.2 | % | 5.3 | % | ||||
| (1) | Operating income does not include financial income, financial expense and investment in associated companies. |
| • | a R$269.2 million, or 16.5%, increase in net sales revenue generated by sales to our other business units (which net sales revenue is eliminated in preparation of our consolidated financial statements); |
114
Table of Contents
| • | a R$128.4 million, or 17.4%, increase in domestic net sales revenue generated by sales of propylene to third parties; | ||
| • | a R$115.0 million, or 9.9%, increase in domestic net sales revenue generated by sales of ethylene to third parties; and | ||
| • | a R$91.0 million, or 28.3%, increase in net sales revenue generated by sales of automotive gasoline to third parties. |
115
Table of Contents
| • | a 15.1% increase in net sales revenue generated by sales of polypropylene, principally as a result of the increase in our annual polypropylene capacity from approximately 463,100 tons in 2004 to approximately 529,000 tons in 2005; and | ||
| • | a 10.5% increase in net sales revenue generated by sales of polyethylene, led by a 59.4% increase in net sales revenue generated by export sales of LLDPE. |
116
Table of Contents
117
Table of Contents
| • | working capital requirements; | ||
| • | the servicing of our indebtedness; | ||
| • | capital expenditures related to investments in operations, maintenance and expansion of plant facilities; | ||
| • | funds required for acquisitions of equity interests in other petrochemical producers; and | ||
| • | dividends on our shares, including in the form of interest attributable to shareholders’ equity. |
| • | cash flows from operating activities; | ||
| • | short-term and long-term borrowings; and | ||
| • | sales of debt securities in domestic and international capital markets. |
118
Table of Contents
| • | a commitment from an domestic financial institution to lend us an aggregate principal amount of up to R$113.0 million for use in connection with our capital expenditure program; and | ||
| • | a commitment from BNDES to lend us an aggregate principal amount of R$68.3 million for use in connection with our capital expenditure program in addition to the remaining amounts to be disbursed under two credit facilities described under “—Liquidity and Capital Resources— Indebtedness and Financing Strategy—Long-Term Indebtedness.” |
| • | our net income of R$101.3 million; and | ||
| • | longer payment terms for imported raw materials under our raw material financing arrangements, resulting in a R$415.0 million increase in our liabilities to suppliers. |
| • | our net income of R$625.8 million; and | ||
| • | longer payment terms for imported raw materials under our raw material financing arrangements, resulting in a R$485.1 million increase in our liabilities to suppliers. |
| • | our net income of R$687.1 million; | ||
| • | the R$1,152.1 million increase in our liabilities to suppliers, principally resulting from longer payment terms for imported raw materials; and |
119
Table of Contents
| • | the R$289.4 million decrease in taxes recoverable as a result of our use of tax credits to offset R$174.3 million of federal taxes due in 2004. |
| • | a R$451.7 million increase in our trade accounts receivable resulting from higher prices for certain of our principal products due to the realignment of our prices with international market prices during 2004; | ||
| • | a R$389.6 million increase in inventories primarily as a result of (1) increased production of certain products at the end of 2004 to maintain capacity utilization rates in order to sustain better operational performance, and (2) increased prices for, and higher volumes of, certain of our principal raw materials; and | ||
| • | a R$212.3 million decrease in advances from customers primarily as a result of faster delivery of products to our customers. |
120
Table of Contents
| • | to repay R$3,613.8 million of our short-term debt, principally debt denominated in foreign currencies, including US$772.0 million under advances on export contracts (Adiantamentos sobre Contratos de Exportação), US$114.1 million under our export prepayment agreements, US$19.5 million under our raw materials financing arrangements, and US$178.4 million under our working capital facilities; | ||
| • | to repurchase R$150.0 million aggregate principal amount of our 12th Issue of debentures; and | ||
| • | to repurchase US$184.6 million aggregate principal amount of our 12.50% Senior Notes due 2008. |
| • | issuances of our 9.75% Perpetual Bonds in an aggregate principal amount of US$150.0 million, our 9.375% Senior Notes due 2015 in an aggregate principal amount of US$150.0 million, our 13th issue of debentures in an aggregate principal amount of R$300.0 million, and quotas (shares) by Chemical Credit Rights Investment Fund II in the aggregate amount of R$400.0 million; and | ||
| • | loans of US$111.7 million under two syndicated credit agreements and US$45.0 million under a pre-export finance facility. |
| • | R$2,338.8 million of our short-term debt, principally debt denominated in foreign currencies, including US$247.3 million under advances on export contracts (Adiantamentos sobre Contratos de Exportação), US$213.8 million under our export prepayment agreements, US$146.7 million under our raw materials financing arrangements, and US$65.0 million of 9.25% notes due 2005 issued under our medium-term note program; and | ||
| • | R$617.2 million of our long-term debt, including US$150 million of our 9.375% Senior Notes due 2015 and US$100 million of our 10.625% Notes due 2007. |
| • | issuances in an aggregate amount of US$250.0 million under our medium-term note program, R$1,200.0 million under our 11th issue of debentures, and R$300.0 million under our 12th issue of debentures; and | ||
| • | loans of US$200.0 million under a syndicated secured export prepayment facility and US$50.0 million under an export prepayment facility. |
| • | R$4,595.7 million of our short-term debt, including (1) the short-term portion of our 11th issue of debentures, (2) our 11.0% notes due 2004 at maturity and the first tranche of an export prepayment credit facility, and (3) the second tranche of an export prepayment credit facility; and |
121
Table of Contents
| • | R$991.6 million of our long-term debt, including the prepayment of the long-term portion of our 11th issue of debentures. |
122
Table of Contents
| Outstanding Principal | ||||||
| Amount at | ||||||
| Instrument | December 31, 2006 | Final Maturity | Principal Covenants | |||
| Debentures: | ||||||
14th Issue of Debentures | R$500.0 million | September 2011 | Financial ratios | |||
13th Issue of Debentures | R$300.0 million | June 2010 | Financial ratios | |||
12th Issue of Debentures | R$150.0 million | June 2009 | Financial ratios, limitations on liens, dividends, asset sales and investments | |||
| Subordinated Convertible Debentures | R$933.1 million | July 2007 | Limitation on liens, indebtedness and investments | |||
| Medium-Term Notes: | ||||||
| 12.50% Notes due 2008 | US$90.4 million | November 2008 | Limitations on liens, dividends, indebtedness, related party transactions, investments, and mergers | |||
| 11.75% Notes due 2014 | US$250.0 million | January 2014 | Limitations on liens, dividends, indebtedness, related party transactions, asset sales, and mergers |
123
Table of Contents
| Outstanding Principal | ||||||
| Amount at | ||||||
| Instrument | December 31, 2006 | Final Maturity | Principal Covenants | |||
| Other Fixed-Rate Notes: | ||||||
| 9.0% Notes due 2007 | US$150.0 million | June 2007 | Limitations on liens | |||
| 9.375% Notes due 2015 | US$250.0 million | June 2015 | Limitations on liens, related party transactions and mergers | |||
| 9.75% Perpetual Bonds | US$150.0 million | — | Limitations on liens, related party transactions and mergers | |||
| 9.00% Perpetual Bonds | US$200.0 million | — | Limitations on liens, related party transactions and mergers | |||
| 8.00% Notes due 2017 | US$275.0 million | January 2017 | Limitations on liens, related party transactions and mergers | |||
| Bank Credit Facilities: | ||||||
| Bank Loan (construction financing) | US$3.8 million | December 2007 | Limitations on liens and mergers | |||
| Secured Credit Agreement (construction financing) | R$122.1 million | June 2016 | Limitation on liens and asset sales | |||
| Syndicated Credit Agreement | US$44.2 million | March 2012 | Financial ratios, limitations on liens, related party transactions, mergers and asset sales | |||
| Syndicated Credit Agreement | US$55.7 million | June 2012 | Financial ratios, limitations on liens, related party transactions, mergers and asset sales | |||
| Export Finance Facilities: | ||||||
| Syndicated Secured Export Prepayment Facility | US$125.0 million | June 2009 | Financial ratios, limitations on liens, dividends, investments, indebtedness, asset sales, related party transactions and mergers | |||
| Pre-Export Finance Facility | US$20.5 million | January 2008 | ||||
| Credit Export Note Facility | US$78.0 million | May 2018 | Financial ratios | |||
| Quotas subject to mandatory redemption: | ||||||
| Chemical Credit Rights Investment Fund II | R$400.0 million | December 2008 |
| • | net debt to EBITDA less than or equal to 3.75 to 1.0 at the end of and for each fiscal quarter until maturity; and | ||
| • | EBITDA to net financial expenses greater than or equal to 1.5 to 1.0 at the end of and for each fiscal quarter until maturity. |
124
Table of Contents
| • | net debt to EBITDA of 2.6 to 1.0; and | ||
| • | EBITDA to net financial expenses of 12.4 to 1.0. |
| • | incur additional indebtedness; | ||
| • | incur liens; | ||
| • | issue guarantees; | ||
| • | issue or sell share capital of subsidiaries; | ||
| • | pay dividends or make certain other restricted payments; | ||
| • | consummate certain asset sales; | ||
| • | enter into certain transactions with affiliates; or | ||
| • | merge or consolidate with any other person or sell or otherwise dispose of all or substantially all of our assets. |
125
Table of Contents
126
Table of Contents
127
Table of Contents
128
Table of Contents
129
Table of Contents
130
Table of Contents
| Payments Due by Period | ||||||||||||||||||||
| Less than One | One to | Three to Five | More than | |||||||||||||||||
| Year | Three Years | Years | Five Years | Total | ||||||||||||||||
| (In millions ofreais) | ||||||||||||||||||||
| Loans and financings | R$ | 653.9 | (1) | R$ | 1,137.1 | R$ | 321.1 | R$ | 2,477.6 | R$ | 4,589.7 | |||||||||
| Debentures | 1,157.7 | (1) | 150.0 | 832.2 | — | 2,139.9 | ||||||||||||||
| Interest on loans, financings and debentures (2) | 767.1 | 1,117.9 | 881.9 | 1,446.1 | 4,213.0 | |||||||||||||||
| Purchase obligations (3) | 6,580.2 | 8,785.1 | 994.0 | 1,135.9 | 17,495.2 | |||||||||||||||
| Pension plan contributions (4) | — | 58.6 | — | — | 58.6 | |||||||||||||||
| Other long-term liabilities | — | 104.8 | — | — | 104.8 | |||||||||||||||
| Total contractual obligations | 9,158.9 | 11,353.5 | 3,029.2 | 5,059.6 | 28,601.2 | |||||||||||||||
| Exclusion of proportional consolidation: | ||||||||||||||||||||
| Loans, financings and debentures | 247.0 | (1) | 67.1 | 93.0 | 27.6 | 434.7 | ||||||||||||||
| Interest on loans, financings and debentures(2) | 28.9 | 14.2 | 9.3 | 2.8 | 55.2 | |||||||||||||||
| Other long-term liabilities | — | 6.9 | — | — | 6.9 | |||||||||||||||
| Total contractual obligations, excluding the effects of proportional consolidation | R$ | 8,883.0 | R$ | 11,265.3 | R$ | 2,926.9 | R$ | 5,029.2 | R$ | 28,104.4 | ||||||||||
| (1) | Includes interest accrued at December 31, 2006. | |
| (2) | Consists of estimated future payments of interest on our loans, financings and debentures, calculated based on interest rates and foreign exchange rates applicable at December 31, 2006 and assuming (i) that all amortization payments and payments at maturity on our loans, financings and debentures will be made on their scheduled payment dates, and (ii) that our perpetual bonds are redeemed on the first permitted redemption date. | |
| (3) | Consists of purchase commitments for raw material and electric power pursuant to binding obligations which include all significant terms, including fixed or minimum quantities to be purchased; fixed, minimum or variable price provisions; and the approximate timing of the transaction. Based upon the applicable purchase prices at December 31, 2006. | |
| (4) | Consists of a final disbursement by our company to two defined benefit pension plans in an amount that we estimate will be assessed by theSecretaria da Previdencia Complementar (Secretariat for Complementary Pensions) based on projections which we have obtained from independent actuaries. In June 2005, we announced that we intend to withdraw as a sponsor of these two defined benefit pension plans. |
131
Table of Contents
| • | supplementary inflation restatement of permanent assets and shareholders’ equity in 1996 and 1997; | ||
| • | capitalized interest; | ||
| • | deferred charges and other intangible assets; | ||
| • | impairment; | ||
| • | business combinations and goodwill; | ||
| • | transactions giving rise to distributions to shareholders; | ||
| • | guarantees; | ||
| • | pension plan; | ||
| • | earnings per share; | ||
| • | comprehensive income; | ||
| • | deferred taxes; | ||
| • | tax incentives; | ||
| • | dividends; | ||
| • | proportional consolidation of jointly controlled entities; | ||
| • | classification of statement of operations and balance sheet items; | ||
| • | segment reporting; and | ||
| • | derivatives. |
132
Table of Contents
| Name | Member Since | Position Held | Age | |||
| Pedro Augusto Ribeiro Novis | Aug. 15, 2001 | President of the Board | 59 | |||
| Ruy Lemos Sampaio | July 20, 2006 | Alternate | 56 | |||
| Alvaro Fernandes da Cunha Filho | Nov. 6, 1997 | Vice President of the Board | 58 | |||
| Marcos Luiz Abreu de Lima | March 31, 2005 | Alternate | 63 | |||
| José de Freitas Mascarenhas | Aug. 15, 2001 | Board Member | 65 | |||
| Guilherme Simões de Abreu | March 4, 2002 | Alternate | 55 | |||
| Luiz Fernando Cirne Lima | Aug. 15, 2001 | Board Member | 74 | |||
| Hilberto Mascarenhas Alves da Silva Filho | April 29, 2003 | Alternate | 51 | |||
| Newton Sergio de Souza | Aug. 15, 2001 | Board Member | 53 | |||
| Cláudio Melo Filho | October 3, 2005 | Alternate | 39 | |||
| Alvaro Pereira Novis | Aug 15, 2001 | Board Member | 63 | |||
| Marcos Wilson Spyer Rezende | Sept. 29, 2002 | Alternate | 59 | |||
| Francisco Teixeira de Sá | May 24, 2001 | Board Member | 58 | |||
| Lúcio José Santos Júnior | Aug. 15, 2001 | Alternate | 41 | |||
| José Lima de Andrade Neto | July 20, 2006 | Board Member | 53 |
133
Table of Contents
| Name | Member Since | Position Held | Age | |||
| Edmundo José Correia Aires | April 29, 2003 | Alternate | 48 | |||
| Patrick Horbach Fairon | November 30, 2004 | Board Member | 51 | |||
| Rogério Gonçalves Mattos | Sept. 29, 2002 | Alternate | 51 | |||
| Antonio Britto Filho | July 20, 2006 | Board Member | 55 | |||
| Rubio Fernal Ferreira e Sousa | April 7, 2006 | Alternate | 55 | |||
| Masatoshi Furuhashi (1) | April 7, 2006 | Board Member | 57 | |||
| Yukihiro Funamoto | April 7, 2006 | Alternate | 34 |
| (1) | Mr. Furuhashi resigned as a director of our company on May 14, 2007. Mr. Funamoto, his alternate, will serve in his place until Mr. Furuhashi’s successor is duly elected. |
134
Table of Contents
135
Table of Contents
136
Table of Contents
| Year of | ||||||||||
| Name | Appointment | Position Held | Age | |||||||
| José Carlos Grubisich Filho | 2002 | Chief Executive Officer | 50 | |||||||
| Carlos José Fadigas de Souza Filho | 2007 | Vice President Executive Officer, Chief Financial Officer and Director of Investor Relations | 36 | |||||||
| Bernardo Afonso de Almeida Gradin | 2002 | Vice President Executive Officer | 42 | |||||||
| Luiz de Mendonça | 2002 | Vice President Executive Officer | 43 | |||||||
| Mauricio Roberto de Carvalho Ferro | 2002 | Vice President Executive Officer and General Counsel | 41 | |||||||
| Roberto Prisco Paraíso Ramos | 2002 | Vice President Executive Officer | 60 | |||||||
| Luis Fernando Sartini Felli | 2006 | Vice President Executive Officer | 41 | |||||||
137
Table of Contents
138
Table of Contents
| First Year | ||||
| of | ||||
| Name | Appointment | |||
| Ismael Campos de Abreu | 2003 | |||
| Jayme Gomes da Fonseca Junior (alternate) | 2007 | |||
| Manoel Mota Fonseca | 2002 | |||
| Maria Cláudia Freitas Sampaio (alternate) | 2002 | |||
| Walter Murilo Melo de Andrade | 2002 | |||
| Sérgio Garrido de Barros (alternate) | 2007 | |||
| Janildo Dantas de Souza | 2006 | |||
| José Easton Matos Neto (alternate) | 2006 | |||
| Marcos Antonio Silva Menezes | 2005 | |||
| Sergio José de Barros (alternate) | 2005 | |||
139
Table of Contents
140
Table of Contents
| • | board of directors: an aggregate limit of R$1.7 million; | ||
| • | board of executive officers: an aggregate limit of R$18.9 million; and | ||
| • | each regular member of our fiscal council: the greater of (1) 10% of the average monthly compensation of the members of our board of executive officers, plus travel and lodging expenses (the statutory minimum set forth in the Brazilian Corporation Law and in our by-laws) and (2) R$5,502 per month. |
141
Table of Contents
| • | the maximum number of investment units to be issued in that year; | ||
| • | the business partners that will be offered investment units in that year; | ||
| • | the purchase price of the investment units to be paid by the participating business partners; | ||
| • | the projected allocation of the investment units among the business partners; and | ||
| • | as an incentive to purchase investment units, the number of additional investment units that each business partner will receive in connection with the purchase of an investment unit. |
142
Table of Contents
| At December 31, | ||||||||||||
| Main Category of Activity | 2006(1) | 2005(2) | 2004(3) | |||||||||
| Coordinators and operators | 1,653 | 1,589 | 1,563 | |||||||||
| Engineers and other professionals | 768 | 695 | 521 | |||||||||
| Administrative and support | 281 | 254 | 272 | |||||||||
| Technicians | 289 | 283 | 226 | |||||||||
| Maintenance | 284 | 243 | 224 | |||||||||
| Managers and directors | 219 | 198 | 190 | |||||||||
| Total | 3,494 | 3,262 | 2,996 | |||||||||
| (1) | At December 31, 2006, 2,171 employees worked in the State of Bahia, 423 employees worked in the State of Alagoas, 430 employees worked in the State of Rio Grande do Sul, 455 employees worked in the State of São Paulo and 15 employees worked in other states in Brazil. | |
| (2) | At December 31, 2005, 1,982 employees worked in the State of Bahia, 427 employees worked in the State of Alagoas, 415 employees worked in the State of Rio Grande do Sul, 413 employees worked in the State of São Paulo and 25 employees worked in other states in Brazil. | |
| (3) | At December 31, 2004, 1,818 employees worked in the State of Bahia, 397 employees worked in the State of Alagoas, 400 employees worked in the State of Rio Grande do Sul, 356 employees worked in the State of São Paulo and 25 employees worked in other states in Brazil. |
143
Table of Contents
144
Table of Contents
| Class A Preferred | Class B Preferred | |||||||||||||||||||||||||||||||
| Common Shares | Shares | Shares(1) | Total | |||||||||||||||||||||||||||||
| Number of | Number of | Number of | Number of | |||||||||||||||||||||||||||||
| Shares | % | shares | % | Shares | % | shares | % | |||||||||||||||||||||||||
| ODBPAR Investments(2) | 93,439,802 | 75.4 | 48,993,481 | 19.8 | — | — | 142,433,283 | 38.3 | ||||||||||||||||||||||||
| Petroquisa | 12,110,937 | 9.8 | 18,522,258 | 7.5 | — | — | 30,633,195 | 8.2 | ||||||||||||||||||||||||
| BNDESPAR | — | — | 13,649,731 | 5.5 | — | — | 13,649,731 | 3.7 | ||||||||||||||||||||||||
| Alliance Capital Management L.P. (3) | — | — | 12,191,991 | 5.0 | — | — | 12,191,991 | 3.3 | ||||||||||||||||||||||||
| Marcos Juliano Lucas Carvalho | 80 | * | 395,792 | * | 260,368 | 32.4 | 656,240 | * | ||||||||||||||||||||||||
| Liane Maria Wolf | — | — | 15,900 | * | 54,400 | 6.8 | 70,300 | * | ||||||||||||||||||||||||
| Beatriz Wolf Wander | — | — | — | — | 54,400 | 6.8 | 54,400 | * | ||||||||||||||||||||||||
| Vera Maria Wolf | — | — | — | — | 27,000 | 3.4 | 27,000 | * | ||||||||||||||||||||||||
| All directors, fiscal council members, their alternates and executive officers as a group (39 persons) | 7 | * | 80,261 | * | — | — | 80,268 | * | ||||||||||||||||||||||||
| * | less than 1% |
145
Table of Contents
| (1) | Our Class B preferred shares may be converted at any time at the request of the holder into class A preferred shares at the ratio of two class B shares per class A share. |
| (2) | Represents direct ownership of 63,220,272 common shares owned by ODBPAR Investments (a wholly-owned subsidiary of Odebrecht), 29,639,199 common shares owned by Norquisa (a wholly-owned subsidiary of ODBPAR Investments), 580,331 common shares owned by our subsidiary Braskem Participações S.A., 46,518,070 class A preferred shares owned by ODBPAR Investments, 2,185,246 class A preferred shares owned by Norquisa and 290,165 class A preferred shares owned by Braskem Participações S.A. Under CVM regulations, Braskem Participações S.A. is not permitted to vote at out shareholders meetings, and the common shares and class A preferred shares owned by Braskem Participações S.A. are treated as treasury shares in our financial statements. ODBPAR Investments disclaims ownership of our shares owned by Braskem Participações S.A. other than with respect to its proportionate interest in these shares. ODBPAR Investments also owns convertible debentures issued originally by OPP Produtos. These debentures may be converted into our shares at any time, at the discretion of ODBPAR Investments. If such right had been exercised at May 31, 2007, 27,477,636 new common shares and 54,955,272 new class A preferred shares of our company would have been issued. These shares have not been included in the above table. |
| (3) | Based on filing of Alliance Capital Management L.P. with the São Paulo Stock Exchange on February 4, 2005 pursuant to CVM Instruction 358. |
| • | Norquisa owned 9.1% of our total share capital, including 25.4% of our voting share capital; | ||
| • | the Odebrecht Group owned 64.1% of Norquisa’s total share capital, including 62.5% of its voting share capital; | ||
| • | the Odebrecht Group, including Norquisa, owned 40.6% of our total share capital, including 73.6% of our voting share capital; and | ||
| • | Petroquisa owned 8.5% of our total share capital, including 10.0% of our voting share capital. |
146
Table of Contents
| • | the ODBPAR Investments owned, directly and indirectly, 38.3% of our total share capital, including 75.4% of our voting share capital; and | ||
| • | Petroquisa owned 8.2% of our total share capital, including 9.8% of our voting share capital. |
| • | any modification of the rights conferred on our shares by our by-laws if that modification would adversely affect the value of our shares; | ||
| • | any change, increase or reduction of the scope of our corporate purpose, except as necessary for us to operate as an integrated petrochemical company; | ||
| • | any increase in the number of members of our board of directors; | ||
| • | any decrease in the number of members of our board of directors to be nominated by Petroquisa; | ||
| • | any capital increase by us paid in by tendering goods or rights, unless those goods or rights relate to our corporate purpose and a valuation of those goods or rights is performed by a first tier investment bank or independent auditing firm; |
147
Table of Contents
| • | any merger or spin-off of our company into another company or of another company into our company that could result in the unjustified dilution of the percentage ownership of Petroquisa except that the integration of the second generation petrochemical producers controlled by the Odebrecht Group is expressly permitted; and | ||
| • | our dissolution or liquidation. |
| • | acquisitions, sales or granting of liens against our fixed assets with values in excess of 30.0% of our net worth, if such acquisition, sale or grant of a lien is not related to, or is outside the scope of, our corporate purpose; | ||
| • | transactions involving affiliates of the parties to the Petroquisa memorandum of understanding, other than transactions involving the integration of the second generation petrochemical producers controlled by the Odebrecht Group or the Mariani Group; | ||
| • | investments in other companies, unless they are in the same business as our company; and | ||
| • | any resolution that would cause us to fail to meet any of the following financial ratios, with any projections to determine compliance with this provision to be performed by an internationally recognized entity: |
| o | projected net debt to EBITDA; | ||
| o | EBITDA to interest expense; and | ||
| o | EBITDA to debt service (excluding trade finance). |
148
Table of Contents
| • | our board of executive officers will be composed of competent professionals; | ||
| • | our dividend policy will have as its objective the distribution of at least 50.0% of net income available during the relevant period, provided that all necessary reserves for the efficient operation and development of our business are established and maintained; | ||
| • | we will adopt a commercial policy that assures the regular and continuous supply of raw materials and utilities on a competitive basis and consistent with the domestic and international markets. |
149
Table of Contents
150
Table of Contents
151
Table of Contents
152
Table of Contents
153
Table of Contents
154
Table of Contents
155
Table of Contents
156
Table of Contents
157
Table of Contents
158
Table of Contents
| Nominal Brazilian Currency per | US$ equivalent per | |||||||||||||||||||||||||||
| Class A | Class B | Class A | Class B | |||||||||||||||||||||||||
| Common | Preferred | Preferred | Common | Preferred | Preferred | |||||||||||||||||||||||
| Year | Payment Date | shares | Shares | Shares | shares | Shares | Shares | |||||||||||||||||||||
| 2001 | February 20, 2001 | R$0.21 | R$0.21 | R$— | US$ | 0.11 | US$ | 0.11 | US$— | |||||||||||||||||||
| May 20, 2001 | 0.14 | 0.14 | 0.14 | 0.06 | 0.06 | 0.06 | ||||||||||||||||||||||
| August 20, 2001 | 0.14 | 0.14 | 0.14 | 0.06 | 0.06 | 0.06 | ||||||||||||||||||||||
| November 20, 2001 | 0.14 | 0.14 | 0.14 | 0.06 | 0.06 | 0.06 | ||||||||||||||||||||||
| 2002 | February 25, 2002 | — | 0.08 | 0.08 | — | 0.04 | 0.04 | |||||||||||||||||||||
| May 20, 2002 | — | 0.13 | 0.13 | — | 0.05 | 0.05 | ||||||||||||||||||||||
| 2005 | April 12, 2005(1) | 0.56 | 0.56 | 0.56 | 0.22 | 0.22 | 0.22 | |||||||||||||||||||||
| 2006 | April 18, 2006(2) | 0.90 | 0.90 | 0.56 | 0.42 | 0.42 | 0.26 | |||||||||||||||||||||
| 2007 | April 9, 2007(3) | — | 0.16 | 0.16 | — | 0.07 | 0.07 | |||||||||||||||||||||
| (1) | Represents interest attributable to shareholders’ equity of R$0.28 (US$0.11) per common share, R$0.56 (US$0.22) per class A preferred share and R$0.56 (US$0.22) per class B preferred share, plus dividends of R$0.28 (US$0.11) per common share. | |
| (2) | Represents interest attributable to shareholders’ equity of R$0.75 (US$0.35) per common share, R$0.75 (US$0.35) per class A preferred share and R$0.56 (US$0.26) per class B preferred share, plus dividends of R$0.15 (US$0.07) per common share and R$0.15 (US$0.07) per class A preferred share. | |
| (3) | Represents dividends of R$0.16 (US$0.07) per class A preferred share and R$0.16 (US$0.07) per class B preferred share. |
| • | a contingency reserve for an anticipated loss that is deemed probable in future years. Any amount so allocated in a previous year must be reversed in the fiscal year in which the loss had been anticipated if the loss does not occur as projected or charged off in the event that the anticipated loss occurs; |
159
Table of Contents
| • | a reserve for investment projects, in an amount based on a capital expenditure budget approved by our shareholders; | ||
| • | an unrealized income reserve described under “—Mandatory Distributions” below; and | ||
| • | a tax incentive investment reserve, included in our capital reserve accounts, in the amount of the reduction in our income tax obligations due to government tax incentive programs. See note 19(a) to our audited consolidated and combined financial statements. |
160
Table of Contents
161
Table of Contents
| • | 50% of our net income (after the deduction of the provision for social contribution tax and before the deduction of the provision for corporate income tax) before taking into account any such distribution for the period for which the payment is made; and | ||
| • | 50% of the sum of our retained earnings and profit reserves. |
162
Table of Contents
| São Paulo Stock Exchange | New York Stock Exchange | |||||||||||||||
| Reaisper | ||||||||||||||||
| Class A Preferred Share | U.S. dollars per ADS | |||||||||||||||
| High | Low | High | Low | |||||||||||||
| 2002 | R$6.84 | R$2.24 | US$ | 6.38 | US$ | 1.29 | ||||||||||
| 2003 | 15.63 | 1.85 | 11.70 | 1.10 | ||||||||||||
| 2004 | 31.68 | 9.36 | 25.48 | 6.18 | ||||||||||||
| 2005 | 31.84 | 16.16 | 25.82 | 14.57 | ||||||||||||
| 2006 | 18.95 | 9.97 | 18.24 | 9.15 | ||||||||||||
| São Paulo Stock Exchange | New York Stock Exchange | |||||||||||||||
| Reaisper | ||||||||||||||||
| Class A Preferred Share | U.S. dollars per ADS | |||||||||||||||
| High | Low | High | Low | |||||||||||||
2005 | ||||||||||||||||
| First Quarter | R$31.84 | R$25.04 | US$ | 25.82 | US$ | 19.42 | ||||||||||
| Second Quarter | 26.49 | 18.02 | 20.87 | 15.78 | ||||||||||||
| Third Quarter | 24.45 | 16.16 | 22.45 | 14.57 | ||||||||||||
| Fourth Quarter | 21.93 | 17.00 | 21.00 | 15.79 | ||||||||||||
2006 | ||||||||||||||||
| First Quarter | 18.95 | 15.84 | 18.24 | 14.37 | ||||||||||||
| Second Quarter | 15.74 | 12.26 | 15.05 | 10.93 | ||||||||||||
| Third Quarter | 14.94 | 9.97 | 13.63 | 9.15 | ||||||||||||
| Fourth Quarter | 16.69 | 13.95 | 15.42 | 12.86 | ||||||||||||
2007 | ||||||||||||||||
Most Recent Six Months | ||||||||||||||||
| November 2006 | 16.69 | 15.50 | 15.42 | 14.18 | ||||||||||||
| December 2006 | 15.60 | 14.53 | 14.71 | 13.44 | ||||||||||||
| January 2007 | 16.25 | 14.24 | 15.32 | 13.19 | ||||||||||||
| February 2007 | 16.01 | 13.70 | 15.39 | 12.86 | ||||||||||||
| March 2007 | 16.22 | 12.88 | 15.86 | 12.18 | ||||||||||||
| April 2007 | 17.35 | 15.06 | 16.78 | 14.69 | ||||||||||||
| May 2007 (1) | 17.85 | 15.70 | 18.20 | 15.97 | ||||||||||||
| (1) | Through May 24, 2007. |
163
Table of Contents
| • | our class A preferred shares on the São Paulo Stock Exchange was R$15.70 per share; | ||
| • | our class A preferred shares on the LATIBEX was€6.00 per share; and | ||
| • | the ADSs on The New York Stock Exchange was US$15.97 per ADS. |
| Average Daily Trading Volume | ||||||||
| São Paulo Stock Exchange | New York Stock Exchange | |||||||
| Class A Preferred Shares | ADSs | |||||||
2005 | ||||||||
| First Quarter | 983,247 | 224,456 | ||||||
| Second Quarter | 1,023,416 | 207,602 | ||||||
| Third Quarter | 1,353,811 | 255,289 | ||||||
| Fourth Quarter | 1,277,477 | 222,679 | ||||||
2006 | ||||||||
| First Quarter | 1,521,282 | 302,466 | ||||||
| Second Quarter | 1,682,577 | 231,495 | ||||||
| Third Quarter | 1,712,119 | 191,306 | ||||||
| Fourth Quarter | 1,513,327 | 151,090 | ||||||
2007 | ||||||||
| First Quarter | 1,739,292 | 228,726 | ||||||
164
Table of Contents
| • | Corporate Governance Level 1; | ||
| • | Corporate Governance Level 2; and | ||
| • | The New Market (Novo Mercado) of the São Paulo Stock Exchange. |
| • | ensure that shares representing 25% of our total share capital are available for trading; |
165
Table of Contents
| • | adopt offering procedures that favor widespread ownership of shares whenever making a public offering; | ||
| • | comply with minimum quarterly disclosure standards; | ||
| • | follow stricter disclosure policies with respect to transactions involving our securities made by our controlling shareholder and our directors and executive officers; | ||
| • | disclose any existing shareholders agreements and stock option plans; and | ||
| • | make a schedule of corporate events available to our shareholders. |
| • | have a board of directors consisting of at least five members; at least 20% of whom will be independent, as defined in the Level 2 regulations; | ||
| • | confer upon preferred shares the right to vote on at least the following issues: (1) transformation, merger, consolidation or spin-off of the company; (2) approval of transactions between the company and its controlling shareholder and/or related parties, whenever such matter is subject to authorization at a general meeting of shareholders pursuant to law or under the company’s by-laws; (3) appraisal of assets contributed to pay the company’s capital increases; (4) selection of a specialized company in charge of determining the company’s economic value for delisting purposes; and (5) amendment to or revocation of any provisions contained in the company’s by-laws, whenever such acts alter or modify any requirements set forth in the São Paulo Stock Exchange regulations; | ||
| • | offer tag-along rights to minority shareholders (meaning that upon the acquisition of a controlling interest, the purchaser must also agree to purchase the shares of the company’s minority shareholders in an amount equivalent to 100% of the price paid for each share in the controlling stake, in the case of holders of common shares, and at least 80% of the price paid for each share in the controlling stake, in the case of holders of preferred shares); | ||
| • | conduct a tender offer at fair market value in the event of a delisting of shares or termination of Level 2 registration; | ||
| • | present an annual balance sheet prepared in accordance with, or reconciled to, U.S. GAAP or international financial reporting standards; | ||
| • | establish a two-year term for all members of the board of directors; and | ||
| • | resolve corporate conflicts with or among the company’s shareholders through arbitration. |
166
Table of Contents
| • | the manufacture, trading, import and export of chemical and petrochemical products; | ||
| • | the production of utilities for use by component companies of the Northeastern Complex, including the supply of steam, water, compressed air, industrial gases, electric power, as well as the provision of various services to these companies; | ||
| • | the holdings of equity stakes (quotas or shares) in other companies; and | ||
| • | the manufacture, distribution, sale, import and export of gasoline, diesel oil, LPG and other oil derivatives. |
167
Table of Contents
168
Table of Contents
| • | approve or reject the financial statements approved by our board of directors and board of executive officers, including any recommendation by our board of directors for the allocation of net profits and distribution of dividends; | ||
| • | elect members of our board of directors (upon expiration of their two-year term) and members of our fiscal council, subject to the right of minority shareholders to elect members of our board of directors and our fiscal council; and | ||
| • | approve any monetary adjustment to our share capital. |
| • | amend our by-laws; | ||
| • | approve any capital increase in excess of the amount of our authorized capital; | ||
| • | approve any capital reduction; | ||
| • | accept or reject the valuation of assets contributed by any of our shareholders in exchange for the issuance of our share capital; | ||
| • | suspend the rights of any of our shareholders in default of their obligations established by law or by our by-laws; | ||
| • | authorize the issuance of convertible debentures; | ||
| • | approve any reorganization of our legal form or any merger, consolidation or spin-off involving us; | ||
| • | authorize our dissolution and liquidation, the election and dismissal of liquidators appointed in connection with any dissolution or liquidation of our company, and the examination of the liquidators’ accounts; | ||
| • | participate in a centralized group of companies (as defined under the Brazilian Corporation Law); | ||
| • | approve the aggregate compensation payable to our directors and executive officers; and | ||
| • | authorize management to declare us insolvent or bankrupt and to request aconcordata(a procedure involving our protection from our creditors similar in many respects to a reorganization under the U.S. Bankruptcy Code). |
169
Table of Contents
| • | by any of our shareholders if, under certain circumstances set forth in the Brazilian Corporation Law, our directors do not convene a shareholders’ meeting within 60 days; | ||
| • | by shareholders holding at least 5.0% of our total share capital if, after a period of eight days, our directors fail to call a shareholders’ meeting that has been requested by such shareholders; | ||
| • | by shareholders holding at least 5.0% of either our total voting share capital or our total non-voting share capital, if after a period of eight days, our directors fail to call a shareholders’ meeting for the purpose of appointing a fiscal council that has been requested by such shareholders; and | ||
| • | by the fiscal council, if the board of directors does not convene an annual shareholders’ meeting within 30 days or at any other time to consider any urgent and serious matters. |
170
Table of Contents
| • | creating preferred shares or disproportionately increasing an existing class of our preferred shares relative to the other classes of our preferred shares, other than to the extent permitted by our by-laws; | ||
| • | changing a priority, preference, right, privilege or condition of redemption or amortization of any class of our preferred shares or creating a new class of preferred shares that has a priority, preference, right, condition or redemption or amortization superior to an existing class of our preferred shares; | ||
| • | reducing the mandatory distribution of dividends; | ||
| • | changing our corporate purpose; | ||
| • | merging our company with another company, or consolidating our company, subject to the conditions set forth in the Brazilian Corporation Law; | ||
| • | transferring all of our shares to another company, known as an “incorporação de ações” under the Brazilian Corporation Law; | ||
| • | participating in a centralized group of companies as defined under the Brazilian Corporation Law and subject to the conditions set forth in the Brazilian Corporation Law; | ||
| • | dissolving or liquidating our company or canceling any ongoing liquidation of our company; | ||
| • | creating any participation certificates entitling the holders thereof to participate in the profits of our company; and | ||
| • | spinning-off of all or any part of our company. |
| • | the right to participate in the distribution of our profits; | ||
| • | the right to participate in any remaining residual assets in the event of our liquidation; | ||
| • | the right to supervise the management of our corporate business as specified in the Brazilian Corporation Law; | ||
| • | the right to preemptive rights in the event of an issuance of our shares, debentures convertible into our shares or subscription bonuses, other than with respect to a public offering of our securities; and |
171
Table of Contents
| • | the right to withdraw from our company under the circumstances specified in the Brazilian Corporation Law. |
| • | preferred shares representing at least 10% of our total share capital; or | ||
| • | common shares representing at least 15% of our voting capital, |
172
Table of Contents
| • | the number of shares to be converted; | ||
| • | the ratio of any such conversion; and | ||
| • | the term during which any conversion must be performed. |
173
Table of Contents
| • | a court ruling or act, such as a judicial seizure or execution; or | ||
| • | a final decision by regulatory authorities, including CADE, that obliges our controlling shareholders to divest all or part of their shares in our company. |
| • | to create a new class of our preferred shares with greater privileges than the existing classes of our preferred shares; |
174
Table of Contents
| • | to increase an existing class of our preferred shares relative to the other classes of our preferred shares (unless such actions are provided for or authorized by our by-laws); or | ||
| • | to modify a preference, privilege or condition of redemption or amortization conferred on one or more classes of our preferred shares. |
| • | to merge with another company or to consolidate with another company in a transaction in which our company is not the surviving entity; | ||
| • | to transfer all of our shares to another company or to acquire all of the shares of another company (“incorporação de ações”); | ||
| • | to participate in a centralized group of companies as defined under the Brazilian Corporation Law; | ||
| • | to reduce the mandatory distribution of dividends; | ||
| • | to change our corporate purposes; or | ||
| • | to spin-off a portion of our company. |
175
Table of Contents
| • | appoint at least one representative in Brazil that will be responsible for complying with registration and reporting requirements and reporting procedures with the Central Bank and the Brazilian Securities Commission. If the representative is an individual or a non-financial company, the investor must also appoint an institution duly authorized by the Central Bank that will be jointly and severally liable for the representative’s obligations; | ||
| • | complete the appropriate foreign investor registration form; | ||
| • | register as a foreign investor with the Brazilian Securities Commission; |
176
Table of Contents
| • | register the foreign investment with the Central Bank; | ||
| • | appoint a tax representative in Brazil; and | ||
| • | obtain a taxpayer identification number from the Brazilian federal tax authorities. |
| • | register as a foreign direct investor with the Central Bank; | ||
| • | obtain a taxpayer identification number from the Brazilian tax authorities; | ||
| • | appoint a tax representative in Brazil; and | ||
| • | appoint a representative in Brazil for service of process in respect of suits based on the Brazilian Corporation Law. |
177
Table of Contents
178
Table of Contents
179
Table of Contents
180
Table of Contents
181
Table of Contents
182
Table of Contents
183
Table of Contents
184
Table of Contents
185
Table of Contents
186
Table of Contents
| • | 60% of our total U.S. dollar-denominated indebtedness that is related to exports, or trade finance, excluding advances on currency contracts with a remaining maturity of up to six months and advances on export contracts; and | ||
| • | 75% of our total in U.S. dollar-denominated indebtedness unrelated to exports, or non-trade finance. |
| • | the short-term domestic CDI rate declined from 18.00% per annum at December 31, 2005 to 13.25% per annum at December 31, 2006; |
187
Table of Contents
| • | the TJLP declined from 9.75% per annum at December 31, 2005 to 6.85% per annum at December 31, 2006; and | ||
| • | the IGP-M was 3.84% in 2006 compared to 1.20% in 2005. |
| Payment Schedule – Breakdown by Type of Interest Rate | ||||||||||||||||||||||||||||||||
| At December 31, 2006 | ||||||||||||||||||||||||||||||||
| Expected Maturity Date | ||||||||||||||||||||||||||||||||
| Fair | ||||||||||||||||||||||||||||||||
| 2007 | 2008 | 2009 | 2010 | 2011 | Thereafter | Total | Value (1) | |||||||||||||||||||||||||
| (in millions ofreais) | ||||||||||||||||||||||||||||||||
| LIABILITIES: | ||||||||||||||||||||||||||||||||
| Loans and financings (excluding debentures): | ||||||||||||||||||||||||||||||||
| Fixed rate, denominated in U.S. dollars | 106.0 | 202.9 | 9.6 | 9.6 | 2.0 | 2,358.2 | 2,688.3 | 6,721.5 | ||||||||||||||||||||||||
| Average interest rate | 9.8 | % | 9.8 | % | 9.6 | % | 9.6 | % | 9.6 | % | 9.3 | % | 9.4 | % | ||||||||||||||||||
| Variable rate, denominated in U.S. dollars | 170.0 | 119.7 | 53.4 | 1.0 | 2.0 | 1.0 | 347.1 | 950.4 | ||||||||||||||||||||||||
| Average interest rate (over LIBOR) | 1.7 | % | 1.4 | % | 1.6 | % | 1.6 | % | 1.6 | % | 1.6 | % | 1.6 | % | ||||||||||||||||||
| Fixed rate, denominated in Japanese yen | 0.9 | 0.4 | — | — | — | — | 1.3 | 2.8 | ||||||||||||||||||||||||
| Average interest rate | 6.7 | % | 6.7 | % | 6.7 | % | ||||||||||||||||||||||||||
Fixed rate, denominated inreais | 3.1 | 7.6 | 15.3 | 15.3 | 15.3 | 68.7 | 125.3 | 123.1 | ||||||||||||||||||||||||
| Average interest rate | 11.9 | % | 11.9 | % | 11.9 | % | 11.9 | % | 11.9 | % | 11.9 | % | 11.9 | % | ||||||||||||||||||
Variable rate, denominated inreais(excluding debentures) | 49.9 | 66.8 | 82.3 | 82.3 | 54.5 | 6.0 | 341.8 | 324.3 | ||||||||||||||||||||||||
| Average interest rate (over TJLP) | 3.4 | % | 3.5 | % | 3.4 | % | 3.3 | % | 2.9 | % | 1.3 | % | 3.4 | % | ||||||||||||||||||
Variable rate, denominated inreais(excluding debentures) | 77.3 | 461.1 | 50.9 | 42.4 | 35.9 | 16.1 | 683.7 | 687.4 | ||||||||||||||||||||||||
| Average interest rate (% of CDI) | 103.2 | % | 103.5 | % | 102.9 | % | 102.9 | % | 102.9 | % | 102.9 | % | 103.3 | % | ||||||||||||||||||
| Loans and financings (excluding debentures) before proportional consolidation | 407.2 | 858.5 | 211.5 | 150.6 | 109.7 | 2,450.0 | 4,187.5 | 8,809.5 | ||||||||||||||||||||||||
| Loans and financings, of proportionally consolidated companies | 246.7 | 18.3 | 48.8 | 42.7 | 18.1 | 27.6 | 402.2 | 402.2 | ||||||||||||||||||||||||
| Total loans and financings (excluding debentures) | 653.9 | 876.8 | 260.3 | 193.3 | 127.8 | 2,477.6 | 4,589.7 | 9,211.7 | ||||||||||||||||||||||||
| Debentures: | ||||||||||||||||||||||||||||||||
Variable rate, denominated inreais | 26.6 | — | 150.0 | 300.0 | 500.0 | — | 976.6 | 969.4 | ||||||||||||||||||||||||
| Average interest rate (% of CDI) | 106.0 | % | 106.0 | % | 105.0 | % | 103.6 | % | 103.5 | % | 104.9 | % | ||||||||||||||||||||
Variable rate, denominated inreais | 1,130.8 | — | — | — | — | — | 1,130.8 | 1,113.3 | ||||||||||||||||||||||||
| Average interest rate (over TJLP) | 5.00 | % | 5.00 | % | ||||||||||||||||||||||||||||
| Debentures before proportional consolidation | 1,157.4 | — | 150.0 | 300.0 | 500.0 | — | 2,107.4 | 2,082.7 | ||||||||||||||||||||||||
| Debentures of proportionally consolidated companies | 0.3 | — | — | 32.2 | — | — | 32.5 | 32.5 | ||||||||||||||||||||||||
| Total debentures | 1,157.7 | — | 150.0 | 332.2 | 500.0 | — | 2,139.9 | 2,115.2 | ||||||||||||||||||||||||
| ASSETS: | ||||||||||||||||||||||||||||||||
| Cash and cash equivalents and other instruments: | ||||||||||||||||||||||||||||||||
| Variable rate, denominated in U.S. dollars | 1,054.9 | — | — | — | — | — | 1,054.9 | 1,054.9 | ||||||||||||||||||||||||
Variable rate, denominated inreais | 724.8 | — | — | — | — | — | 724.8 | 724.8 | ||||||||||||||||||||||||
188
Table of Contents
| Payment Schedule – Breakdown by Type of Interest Rate | ||||||||||||||||||||||||||||||||
| At December 31, 2006 | ||||||||||||||||||||||||||||||||
| Expected Maturity Date | ||||||||||||||||||||||||||||||||
| Fair | ||||||||||||||||||||||||||||||||
| 2007 | 2008 | 2009 | 2010 | 2011 | Thereafter | Total | Value (1) | |||||||||||||||||||||||||
| (in millions ofreais) | ||||||||||||||||||||||||||||||||
| Cash and cash equivalents and other investments, before proportional consolidation | 1,779.7 | — | — | — | — | — | 1,779.7 | 1,779.7 | ||||||||||||||||||||||||
| Cash and cash equivalents and other investments of proportionally consolidated companies | 181.3 | — | — | — | — | — | 181.3 | 181.3 | ||||||||||||||||||||||||
| Total cash and cash equivalents and other investments | 1,961.0 | — | — | — | — | — | 1,961.0 | 1,961.0 | ||||||||||||||||||||||||
| (1) | Represents the net present value of the future cash flows from the obligations converted intoreaisat fair market value at December 31, 2006. |
| Payment Schedule – Breakdown by Currency | ||||||||||||||||||||||||||||||||
| As of December 31, 2006 | ||||||||||||||||||||||||||||||||
| Expected Maturity Date | ||||||||||||||||||||||||||||||||
| Fair | ||||||||||||||||||||||||||||||||
| 2007 | 2008 | 2009 | 2010 | 2011 | Thereafter | Total | Value (1) | |||||||||||||||||||||||||
| (in millions ofreais) | ||||||||||||||||||||||||||||||||
| LIABILITIES: | ||||||||||||||||||||||||||||||||
| Loans and financings: | ||||||||||||||||||||||||||||||||
| Loans and financings (excluding debentures): | ||||||||||||||||||||||||||||||||
| Denominated in U.S. dollars | 276.0 | 322.6 | 63.0 | 10.6 | 4.0 | 2,359.2 | 3,035.4 | 7,671.9 | ||||||||||||||||||||||||
| Denominated in Japanese Yen | 0.9 | 0.4 | — | — | — | — | 1.3 | 2.8 | ||||||||||||||||||||||||
Denominated inreais | 130.3 | 535.5 | 148.5 | 140.0 | 105.7 | 90.8 | 1,150.8 | 1,134.8 | ||||||||||||||||||||||||
| Loans and financings (excluding debentures) before proportional consolidation | 407.2 | 858.5 | 211.5 | 150.6 | 109.7 | 2,450.0 | 4,187.5 | 8,809.5 | ||||||||||||||||||||||||
| Loans and financings, of proportionally consolidated companies | 246.7 | 18.3 | 48.8 | 42.7 | 18.1 | 27.6 | 402.2 | 402.2 | ||||||||||||||||||||||||
| Total loans and financings (excluding debentures) | 653.9 | 876.8 | 260.3 | 193.3 | 127.8 | 2,477.6 | 4,589.7 | 9,211.7 | ||||||||||||||||||||||||
| Debentures: | ||||||||||||||||||||||||||||||||
Denominated inreais | 1,157.7 | — | 150.0 | 332.2 | 500.0 | — | 2,139.9 | 2,115.2 | ||||||||||||||||||||||||
| Total debentures, including current portion | 1,157.7 | — | 150.0 | 332.2 | 500.0 | — | 2,139.9 | 2,115.2 | ||||||||||||||||||||||||
| ASSETS: | ||||||||||||||||||||||||||||||||
| Cash and cash equivalents and other investments: | ||||||||||||||||||||||||||||||||
| Denominated in U.S. dollars | 1,054.9 | — | — | — | — | — | 1,054.9 | 1,054.9 | ||||||||||||||||||||||||
Denominated inreais | 724.8 | — | — | — | — | — | 724.8 | 724.8 | ||||||||||||||||||||||||
| Cash and cash equivalents and other investments, before proportional consolidation | 1,779.7 | — | — | — | — | — | 1,779.7 | 1,779.7 | ||||||||||||||||||||||||
| Cash and cash equivalents and other investments of proportionally consolidated companies | 181.3 | — | — | — | — | — | 181.3 | 181.3 | ||||||||||||||||||||||||
| Total cash and cash equivalents and other investments | 1,961.0 | — | — | — | — | — | 1,961.0 | 1,961.0 | ||||||||||||||||||||||||
189
Table of Contents
| (1) | Represents the net present value of the future cash flows from the obligations converted intoreaisat fair market value at December 31, 2006. |
190
Table of Contents
191
Table of Contents
| Year ended December 31, | ||||||||
| 2006 | 2005 | |||||||
| (in millions ofreais) | ||||||||
| Audit fees(1) | R$ | 15.0 | R$ | 9.7 | ||||
| Audit-related fees(2) | 1.3 | 1.9 | ||||||
| Tax fees(3) | 0.7 | 0.6 | ||||||
| Total fees | R$ | 17.0 | R$ | 12.2 | ||||
| (1) | Audit fees consist of the aggregate fees billed by PricewaterhouseCoopers Auditores Independentes in connection with the audit of our annual financial statements, interim audits, interim reviews of our quarterly financial information, issuance of comfort letters, procedures as related to audit of income tax provisions and related reserves in connection with the audit and review of financial statements and review of documents filed with the Brazilian Securities Commission and the Commission. | |
| (2) | Audit-related fees consist of the aggregate fees billed by PricewaterhouseCoopers Auditores Independentes for internal control reviews. | |
| (3) | Tax fees consist of the aggregate fees billed by PricewaterhouseCoopers Auditores Independentes for tax compliance reviews. |
| • | we are a foreign private issuer that has a fiscal council, which is a board of auditors (or similar body) established and selected pursuant to and as expressly permitted under Brazilian law; | ||
| • | Brazilian law requires our fiscal council to be separate from our board of directors; | ||
| • | members of our fiscal council are not elected by our management, and none of our executive officers is a member of our fiscal council; | ||
| • | Brazilian law provides standards for the independence of our fiscal council from our management; | ||
| • | our fiscal council, in accordance with its charter, makes recommendations to our board of directors regarding the appointment, retention and oversight of the work of any registered public accounting firm |
192
Table of Contents
| engaged (including, the intermediation of disagreements between our management and our independent auditors regarding financial reporting) for the purpose of preparing or issuing an audit report or performing other audit, review or attest services for our company, as Brazilian law requires that our board of directors appoint, retain and oversee the work of our independent public accountants; |
| • | our fiscal council (1) has implemented procedures for receiving, retaining and addressing complaints regarding accounting, internal control and auditing matters, including the submission of confidential, anonymous complaints from employees regarding questionable accounting or auditing, and (2) has authority to engage independent counsel and other advisors as it determines necessary to carry out its duties; and | ||
| • | our company compensates our independent auditors and any outside advisors hired by our fiscal council and provides funding for ordinary administrative expenses incurred by the fiscal council in the course of its duties. |
| Total Number of | Maximum Number | |||||||||||||||
| Share Purchased | of Shares that may | |||||||||||||||
| Total Number | Average | as Part of Publicly | yet be Purchased | |||||||||||||
| of Shares | Price Paid | Announced Plans | Under the Plans or | |||||||||||||
| Period | Purchased (1) | Per Share | or Programs | Programs (2) | ||||||||||||
| January 1 through January 31, 2006 | — | R$ | — | — | — | |||||||||||
| February 1 through February 28, 2006 | — | — | — | — | ||||||||||||
| March 1 through March 31, 2006 | — | — | — | — | ||||||||||||
| April 1 through April 30, 2006 | — | — | — | — | ||||||||||||
| May 1 through May 31, 2006 | 2,868,500 | 15.56 | 2,868,500 | 12,428,128 | ||||||||||||
| June 1 through June 30, 2006 | 1,135,100 | 13.32 | 4,003,600 | 11,293,028 | ||||||||||||
| July 1 through July 31, 2006 (3) | 1,288,920 | 12.15 | 4,528,200 | 10,768,428 | ||||||||||||
| August 1 through August 31, 2006 | 1,768,900 | 12.69 | 6,297,100 | 8,999,528 | ||||||||||||
| September 1 through September 30, 2006 | 3,633,900 | 13.78 | 9,931,000 | 5,365,628 | ||||||||||||
| October 1 through October 31, 2006 | 3,200,054 | 14.80 | 13,131,054 | — | ||||||||||||
| November 1 through November 30, 2006 | — | — | — | — | ||||||||||||
| December 1 through December 31, 2006 | — | — | — | — | ||||||||||||
| Total | 13,895,374 | 14.05 | 13,131,054 | |||||||||||||
| (1) | All shares purchased were class A preferred shares. | |
| (2) | On May 3, 2006, we announced that our board of directors had authorized a share repurchase program under which we were authorized to repurchase up to 13,896,133 class A preferred shares and up to 1,400,495 common shares at market prices over the São Paulo Stock Exchange at any time and from time to time prior to October 31, 2006. Shares that were repurchased are being held in treasury and may be resold or cancelled. | |
| (3) | Includes (1) 524,600 class A preferred shares purchased under our share repurchase program at an average price per share of R$10.38, and (2) 764,320 class A preferred shares acquired from dissenting shareholders at an average price per share of R$13.36 in connection with our merger with Polialden on May 31, 2006. |
193
Table of Contents
| Management’s Report on Internal Controls Over Financial Reporting | F-1 | |||
| Report of Independent Registered Public Accounting Firm | F-3 | |||
| Consolidated Balance Sheets as of December 31, 2006 and 2005 | F-6 | |||
| Consolidated Statements of Operations for the years ended December 31, 2006, 2005 and 2004 | F-8 | |||
| Statements of Changes in Shareholders’ Equity for the years ended December 31, 2006, 2005 and 2004 | F-9 | |||
| Consolidated Statement of Changes in Financial Position for the years ended December 31, 2006, 2005 and 2004 | F-10 | |||
| Consolidated Statements of Cash Flows for the years ended December 31, 2006, 2005 and 2004 | F-12 | |||
| Notes to the Consolidated Financial Statements | F-14 |
| Report of Independent Registered Public Accounting Firm | F-118 | |||
| Consolidated Balance Sheet at December 31, 2006 and 2005 | F-120 | |||
| Consolidated Statement of Income for the years ended December 31, 2006, 2005 and 2004 | F-121 | |||
| Statement of Changes in Shareholders’ Equity for the years ended December 31, 2006, 2005 and 2004 | F-122 | |||
| Consolidated Statement of Changes in Financial Position for the years ended December 31, 2006, 2005 and 2004 | F-124 | |||
| Consolidated Statements of Cash Flow for the years ended December 31, 2006, 2005 and 2004 | F-126 | |||
| Notes to the Consolidated Financial Statements | F-128 |
| 1.01 | By-laws, as amended through April 2, 2007 (English translation). | |
| 2.01 | Amended and Restated Deposit Agreement, dated as of September 17, 2003, among Braskem S.A., The Bank of New York and all holders and beneficial owners of ADSs evidenced by ADRs issued thereunder (incorporated by reference to Exhibit 4.01 to Form F-1 of Braskem S.A. filed on April 6, 2004). | |
| 2.02 | Form of Certificate representing American Depositary Shares (incorporated by reference to Exhibit 4.02 to Form F-1 of Braskem S.A. filed on April 6, 2004). | |
| 2.03 | The total amount of long-term debt securities of our company and its subsidiaries under any one instrument does not exceed 10% of the total assets of our company and its subsidiaries on a consolidated basis. We agree to furnish copies of any or all such instruments to the Commission upon request. 3.01 Memorandum of Understanding Regarding Shareholders Agreement, dated as of July 3, 2001, among Odebrecht Química S.A., Petroquímica da Bahia S.A. and Petrobras Química S.A. (English translation) (incorporated by reference to Exhibit 3.03 to Form 20-F of Braskem S.A. filed on June 30, 2003). |
194
Table of Contents
| 3.01 | Memorandum of Understanding Regarding Shareholders Agreement, dated as of July 3, 2001, among Odebrecht Química S.A., Petroquímica da Bahia S.A. and Petrobras Química S.A. (English translation) (incorporated by reference to Exhibit 3.03 to Form 20-F of Braskem S.A. filed on June 30, 2003). | |
| 3.02 | First Amendment to Memorandum of Understanding Regarding Shareholders Agreement, dated July 26, 2002, among Odebrecht S.A and Petrobras Química S.A., acknowledged by Petroquímica da Bahia S.A., Nordeste Química S.A. and the Registrant. (English translation) (incorporated by reference to Exhibit 3.04 to Form 20-F of Braskem S.A. filed on June 30, 2003). | |
| 3.03 | Second Amendment to Memorandum of Understanding Regarding Shareholders Agreement, dated April 29, 2005, among Odebrecht S.A and Petrobras Química S.A., acknowledged by Nordeste Química S.A. and the Registrant. (English translation) (incorporated by reference to Form 6-K of Braskem S.A. filed on May 9, 2005) | |
| 3.04 | Memorandum of Understanding Regarding Shareholders Agreement, dated July 20, 2001, among Odebrecht Química S.A., Petroquímica da Bahia S.A., PETROS—Fundação Petrobras de Seguridade Social and PREVI—Caixa de Previdéncia dos Funcionários do Banco do Brasil (English translation) (incorporated by reference to Exhibit 3.05 to Form 20-F of Braskem S.A. filed on June 30, 2003). | |
| 4.01 | Share Purchase Agreement, dated as of April 6, 2006, between Braskem S.A., SPQ Investimentos e Participações Ltda., Sumitomo Chemical Company, Limited, and Itochu Corporation (incorporated by reference to Exhibit 4.01 to Form 20-F of Braskem S.A. filed on June 23, 2006). | |
| 4.02 | Protocol and Justification of the Merger of Polialden Petroquímica S.A. into Braskem S.A., dated May 5, 2006 (English translation)(incorporated by reference to Exhibit 4.02 to Form 20-F of Braskem S.A. filed on June 23, 2006). | |
| 4.03 | Protocol and Justification of the Merger of Politeno Indústria e Comércio S.A. into Braskem S.A., dated March 12 2007 (English translation)(incorporated by reference to Form 6-K of Braskem S.A. filed on March 19, 2007). | |
| 4.04 | Share Purchase Agreement Between the Ipiranga Group Key Shareholders and Ultrapar dated March 18, 2007 (English summary) | |
| 4.05 | Investment Agreement by and between Ultrapar Participações S.A., Braskem S.A. and Petróleo Brasileiro S.A. — Petrobras dated March 18, 2007 (English summary) | |
| 4.06 | Amendment dated April 18, 2007 to the Investment Agreement by and between Ultrapar Participações S.A. and Braskem S.A. and Petróleo Brasileiro S.A. — Petrobras dated March 18, 2007 (English summary) | |
| 4.07 | Private Instrument of Chattel Mortgage in Guarantee between Ultrapar, Braskem and Petrobras dated April 18, 2007 (English summary) | |
| 4.08 | Shareholders Agreement, dated as of April 18, 2007, among Ultrapar Participações S.A., Petróleo Brasileiro S.A. – Petrobrás, Braskem S.A., Refinaria de Petróleo Ipiranga S.A., Distribuidora de Produtos de Petróleo Ipiranga S.A., Companhia Brasileira de Petróleo Ipiranga, Ipiranga Química S.A. and Ipiranga Petroquímica S.A. (English translation) | |
| 4.09 | Memorandum of Understanding, dated March 18, 2007, among Petróleo Brasileiro S.A. – Petrobrás, Braskem S.A. and, as intervening party, Petrobrás Química S.A. (English translation) | |
| 4.10 | Agreement for Maintenance of Reversibility of Operations, dated April 25, 2007, between Conselho Administrativo de Defesa Econômica – CADE and Braskem S.A. (English translation) | |
| 4.11 | Naphtha and Gas Oil Purchase and Sale Contract, dated as of June 22, 1978, between Petróleo Brasileiro S.A. and the Registrant (English translation) (incorporated by reference to Exhibit 10.06 to Form F-1 of Braskem S.A. filed on April 6, 2004). | |
| 4.12 | First Amendment to Naphtha and Gas Oil Purchase and Sale Contract, dated as of February 8, 1993, between |
195
Table of Contents
| Petróleo Brasileiro S.A. and the Registrant (English translation) (incorporated by reference to Exhibit 10.07 to Form F-1 of Braskem S.A. filed on April 6, 2004). |
| 4.13 | Second Amendment to Naphtha and Gas Oil Purchase and Sale Contract, dated as of February 24, 2003, between Petróleo Brasileiro S.A. and the Registrant. (English translation) (incorporated by reference to Exhibit 10.08 to Form 20-F of Braskem S.A. filed on June 30, 2003). | |
| 4.14 | Braskem S.A. Long-Term Incentive Plan (English translation)(incorporated by reference to Exhibit 4.23 to Form 20-F of Braskem S.A. filed on June 23, 2006). | |
| 4.15 | Amendment and Restatement of Section 7 of Braskem’s Long-Term Incentive Plan, adopted at Extraordinary Shareholder’s Meeting on April 7, 2006 (English translation)(incorporated by reference to Exhibit 4.24 to Form 20-F of Braskem S.A. filed on June 23, 2006). | |
| 8.01 | List of subsidiaries (incorporated by reference to note 4 to our audited consolidated financial statements included elsewhere in this annual report). | |
| 12.01 | Certification of Principal Executive Officer dated June 29, 2005 pursuant to Exchange Act Rules 13a-15(e) and 15d-15(e) | |
| 12.02 | Certification of Principal Financial Officer dated June 29, 2005 pursuant to Rules 13a-15(e) and 15d-15(e) | |
| 13.01 | Certifications of Principal Executive Officer and Principal Financial Officer dated June 29, 2005 pursuant to 18 U.S.C. Section 1350, as adopted pursuant to Section 906 of the Sarbanes-Oxley Act of 2002 |
196
Table of Contents
| BRASKEM S.A. | ||||||
| By: | /s/ José Carlos Grubisich Filho | |||||
| Name: | José Carlos Grubisich Filho | |||||
| Title: | Chief Executive Officer | |||||
| Date: | May 31, 2007 | |||||
197
| F-1 | ||||
| F-3 | ||||
| F-6 | ||||
| F-8 | ||||
| F-9 | ||||
| F-10 | ||||
| F-12 | ||||
| F-14 |
| F-118 | ||||
| F-120 | ||||
| F-121 | ||||
| F-122 | ||||
| F-124 | ||||
| F-126 | ||||
| F-128 |
Table of Contents
F-1
Table of Contents
| /s/ José Carlos Grubisich Filho | ||||
| By: | José Carlos Grubisich Filho | |||
| Chief Executive Officer | ||||
| /s/ Carlos José Fadigas de Souza Filho | ||||
| Carlos José Fadigas de Souza Filho | ||||
| Chief Financial Officer | ||||
F-2
Table of Contents
Braskem S.A.
F-3
Table of Contents
F-4
Table of Contents
Auditores Independentes
May 31, 2007
F-5
Table of Contents
In millions of reais
| (Reclassified) | ||||||||
| 2006 | 2005 | |||||||
Assets | ||||||||
Current assets | ||||||||
| Cash and cash equivalents (Note 4) | 1,547.1 | 2,135.7 | ||||||
| Other investments (Note 5) | 413.9 | 145.8 | ||||||
| Trade accounts receivable (Note 6) | 1,594.9 | 1,493.3 | ||||||
| Inventories (Note 7) | 1,767.3 | 1,567.4 | ||||||
| Taxes recoverable (Note 9) | 408.1 | 324.9 | ||||||
| Deferred income tax and social contribution (Note 17) | 20.6 | 22.0 | ||||||
| Advances to suppliers | 64.7 | 40.0 | ||||||
| Prepaid expenses | 84.6 | 48.8 | ||||||
| Other receivable | 49.8 | 59.6 | ||||||
| 5,951.0 | 5,837.5 | |||||||
Non-current | ||||||||
| Long-term assets | ||||||||
| Other investments (Note 5) | 1.6 | 0.3 | ||||||
| Trade accounts receivable (Note 6) | 52.5 | 49.7 | ||||||
| Inventories (Note 7) | 22.9 | 75.8 | ||||||
| Taxes recoverable (Note 9) | 953.1 | 559.4 | ||||||
| Deferred income tax and social contribution (Note 17) | 377.0 | 273.0 | ||||||
| Judicial deposits and compulsory loan (Note 10) | 90.5 | 36.5 | ||||||
| Related parties (Note 8) | 40.7 | 40.6 | ||||||
| Other assets | 58.8 | 27.3 | ||||||
| 1,597.1 | 1,062.6 | |||||||
| Permanent assets | ||||||||
| Investments (Note 11) | ||||||||
| Joint-controlled companies | 6.5 | 6.2 | ||||||
| Associated companies | 26.2 | 25.8 | ||||||
| Other investments | 14.1 | 34.2 | ||||||
| Property, plant and equipment (Note 12) | 6,688.7 | 6,364.4 | ||||||
| Intangible assets (Note 12) | 129.5 | 28.4 | ||||||
| Deferred charges, including goodwill (Note 13) | 1,891.2 | 2,231.7 | ||||||
| 8,756.2 | 8,690.7 | |||||||
Total assets | 16,304.3 | 15,590.8 | ||||||
F-6
Table of Contents
Consolidated Balance Sheets at December 31 | ||
In millions of reais | (continued) |
| (Reclassified) | ||||||||
| 2006 | 2005 | |||||||
Liabilities and shareholders’ equity | ||||||||
Current liabilities | ||||||||
| Suppliers | 3,022.1 | 2,580.2 | ||||||
| Loans and financing (Note 14) | 653.9 | 1,120.4 | ||||||
| Debentures (Note 15) | 1,157.7 | 9.3 | ||||||
| Salaries and payroll charges | 148.9 | 136.0 | ||||||
| Taxes, charges and contributions | 122.8 | 192.2 | ||||||
| Income tax and social contribution | 14.4 | 19.0 | ||||||
| Interest on own capital and dividends payable (Note 20 (f)) | 41.4 | 299.2 | ||||||
| Advances from customers | 26.7 | 42.0 | ||||||
| Related parties (Note 8) | 3.1 | |||||||
| Insurance premiums payable | 50.0 | 3.2 | ||||||
| Other liabilities (Note 1(b)) | 269.0 | 39.6 | ||||||
| 5,506.9 | 4,444.2 | |||||||
Non-Current liabilities | ||||||||
| Long-term liabilities | ||||||||
| Suppliers | 21.4 | 29.7 | ||||||
| Loans and financing (Note 14) | 3,935.8 | 3,261.6 | ||||||
| Debentures (Note 15) | 982.2 | 1,599.3 | ||||||
| Taxes and contributions (Note 16) | 1,322.0 | 1,324.4 | ||||||
| Related parties (Note 8) | 4.8 | 3.0 | ||||||
| Long-term incentives (Note 19) | 2.3 | |||||||
| Deferred income tax and social contribution (Note 17) | 17.3 | 10.4 | ||||||
| Private pension plans (Note 28) | 64.2 | 65.1 | ||||||
| Other liabilities | 83.3 | 108.2 | ||||||
| 6,433.3 | 6,401.7 | |||||||
Deferred income | ||||||||
| Negative goodwill on investments in subsidiary companies | 30.4 | 87.9 | ||||||
Minority interests | 21.8 | 121.2 | ||||||
Shareholders’ equity(Note 20) | ||||||||
| Capital | 3,508.3 | 3,403.0 | ||||||
| Capital reserves | 408.7 | 396.8 | ||||||
| Treasury shares | (255.6 | ) | (15.0 | ) | ||||
| Revenue reserves | 748.8 | 849.3 | ||||||
| Retained earnings (accumulated deficit) | (98.3 | ) | (98.3 | ) | ||||
| 4,311.9 | 4,535.8 | |||||||
Total liabilities and shareholders’ equity | 16,304.3 | 15,590.8 | ||||||
F-7
Table of Contents
Years Ended December 31
In millions of reais, except amounts per shares
| 2006 | 2005 | 2004 | ||||||||||
Gross sales | ||||||||||||
| Domestic market | 13,028.4 | 14,099.1 | 13,579.4 | |||||||||
| Foreign market | 3,516.9 | 2,944.3 | 2,620.8 | |||||||||
| Taxes, freights and returns on sales | (3,552.6 | ) | (3,968.3 | ) | (3,810.7 | ) | ||||||
Net sales revenues | 12,992.7 | 13,075.1 | 12,389.5 | |||||||||
| Cost of sales and services rendered | (10,792.1 | ) | (10,361.7 | ) | (9,223.0 | ) | ||||||
Gross profit | 2,200.6 | 2,713.4 | 3,166.5 | |||||||||
Operating expenses (income) | ||||||||||||
| Selling | 399.0 | 261.9 | 291.0 | |||||||||
| General and administrative | 552.5 | 525.2 | 386.0 | |||||||||
| Depreciation and amortization | 385.0 | 355.6 | 359.7 | |||||||||
| Other operating income, net (Note 24) | (186.1 | ) | (22.8 | ) | (43.0 | ) | ||||||
| 1,150.4 | 1,119.9 | 993.7 | ||||||||||
Operating income before equity accounting and financial income | 1,050.2 | 1,593.5 | 2,172.8 | |||||||||
Equity accounting | ||||||||||||
| Equity in the results of investees | 0.8 | 1.3 | 0.7 | |||||||||
| Amortization of goodwill (negative goodwill), net | (57.8 | ) | (152.5 | ) | (152.7 | ) | ||||||
| Foreign exchange variation | (1.4 | ) | 3.6 | (9.6 | ) | |||||||
| Tax incentives | 20.5 | 39.2 | 44.9 | |||||||||
| Other | 9.1 | (1.4 | ) | 9.1 | ||||||||
| (28.8 | ) | (109.8 | ) | (107.6 | ) | |||||||
Financial income (expenses) (Note 23) | ||||||||||||
| Financial expenses | (1,097.9 | ) | (675.8 | ) | (1,307.2 | ) | ||||||
| Financial income | 159.5 | (33.6 | ) | 68.6 | ||||||||
| (938.4 | ) | (709.4 | ) | (1,238.6 | ) | |||||||
Operating income | 83.0 | 774.3 | 826.6 | |||||||||
| Non-operating income (expenses), net (Note 25) | 7.1 | (25.2 | ) | (29.8 | ) | |||||||
Income before income tax and social contribution | 90.1 | 749.1 | 796.8 | |||||||||
| Income tax and social contribution | ||||||||||||
| Current | (88.1 | ) | (147.7 | ) | (226.5 | ) | ||||||
| Deferred | 100.9 | (29.6 | ) | 141.4 | ||||||||
Income before minority interests | 102.9 | 571.8 | 711.7 | |||||||||
| Minority interests | (1.6 | ) | 54.0 | (24.6 | ) | |||||||
Net income for the year | 101.3 | 625.8 | 687.1 | |||||||||
| Shares outstanding at the end of the year (thousands) | 356,039 | 362,056 | 362,056 | |||||||||
Net income per share at year end — R$ | 0.2845 | 1.7285 | 1.8978 | |||||||||
F-8
Table of Contents
In millions of reais
| Capital reserves | Revenue reserves | |||||||||||||||||||||||||||||||
| Retained earnings | ||||||||||||||||||||||||||||||||
| Tax | Legal | Retained | Treasury | (accumulated | ||||||||||||||||||||||||||||
| Capital | incentives | Other | reserve | earnings | shares | deficit) | Total | |||||||||||||||||||||||||
At December 31, 2003 | 1,887.4 | 743.7 | 0.6 | (23.2 | ) | (495.9 | ) | 2,112.6 | ||||||||||||||||||||||||
| Capital increase | 1,515.6 | 1,515.6 | ||||||||||||||||||||||||||||||
| Exchange of shares | 8.2 | 8.2 | ||||||||||||||||||||||||||||||
| Absorption of accumulated losses | (463.2 | ) | 463.2 | |||||||||||||||||||||||||||||
| Tax incentives | 63.7 | 63.7 | ||||||||||||||||||||||||||||||
| Prescribed dividends | 0.7 | 0.7 | ||||||||||||||||||||||||||||||
| Interest on own capital | (170.0 | ) | (170.0 | ) | ||||||||||||||||||||||||||||
| Net income for the year | 687.1 | 687.1 | ||||||||||||||||||||||||||||||
| Appropriations: | ||||||||||||||||||||||||||||||||
| Legal reserve | 34.6 | (34.6 | ) | |||||||||||||||||||||||||||||
| Proposed dividends | (34.2 | ) | (34.2 | ) | ||||||||||||||||||||||||||||
| Retained earnings | 454.7 | (454.7 | ) | |||||||||||||||||||||||||||||
December 31, 2004 | 3,403.0 | 344.2 | 0.6 | 34.6 | 454.7 | (15.0 | ) | (38.4 | ) | 4,183.7 | ||||||||||||||||||||||
| Tax incentives | 52.0 | 52.0 | ||||||||||||||||||||||||||||||
| Interest on own capital (Note 20 (f)) | (270.0 | ) | (270.0 | ) | ||||||||||||||||||||||||||||
| Net income for the year | 625.8 | 625.8 | ||||||||||||||||||||||||||||||
| Appropriations: | ||||||||||||||||||||||||||||||||
| Legal reserve | 34.3 | (34.3 | ) | |||||||||||||||||||||||||||||
| Proposed dividends (Note 20 (e)) | (55.7 | ) | (55.7 | ) | ||||||||||||||||||||||||||||
| Retained earnings | 325.7 | (325.7 | ) | |||||||||||||||||||||||||||||
December 31, 2005 | 3,403.0 | 396.2 | 0.6 | 68.9 | 780.4 | (15.0 | ) | (98.3 | ) | 4,535.8 | ||||||||||||||||||||||
| Capital increase (Note 1 (b) and 20 (a)) | 105.3 | 105.3 | ||||||||||||||||||||||||||||||
| Tax incentives | 11.9 | 11.9 | ||||||||||||||||||||||||||||||
| Repurchase of shares (Note 20 (c)) | (240.6 | ) | (240.6 | ) | ||||||||||||||||||||||||||||
| Effect of change in accounting practice (Note 12) | (164.9 | ) | (164.9 | ) | ||||||||||||||||||||||||||||
| Transfer from reserve for absorption of prior year adjustments (Note 20(d)) | (164.9 | ) | 164.9 | |||||||||||||||||||||||||||||
| Net income for the year | 101.3 | 101.3 | ||||||||||||||||||||||||||||||
| Appropriations: | ||||||||||||||||||||||||||||||||
| Legal reserve | 3.9 | (3.9 | ) | |||||||||||||||||||||||||||||
| Proposed dividends (Note 20 (e)) | (36.9 | ) | (36.9 | ) | ||||||||||||||||||||||||||||
| Retained earnings | 60.5 | (60.5 | ) | |||||||||||||||||||||||||||||
December 31, 2006 | 3,508.3 | 408.1 | 0.6 | 72.8 | 676.0 | (255.6 | ) | (98.3 | ) | 4,311.9 | ||||||||||||||||||||||
F-9
Table of Contents
Years Ended December 31
In millions of reais
| 2006 | 2005 | 2004 | ||||||||||
Financial resources were provided by: | ||||||||||||
| Operations | ||||||||||||
| Net income for the year | 101.3 | 625.8 | 687.1 | |||||||||
| Expenses (income) not affecting working capital: | ||||||||||||
| Depreciation, amortization and depletion | 962.4 | 841.5 | 798.1 | |||||||||
| Equity accounting | ||||||||||||
| Equity in the results of investees | (0.8 | ) | (1.3 | ) | (0.7 | ) | ||||||
| Amortization of goodwill (negative goodwill), net | 57.8 | 152.5 | 152.7 | |||||||||
| Foreign exchange variation | 1.4 | (3.6 | ) | 9.6 | ||||||||
| Tax incentives | (20.5 | ) | (39.2 | ) | (44.9 | ) | ||||||
| Adjustment to investments realization value | (11.4 | ) | 2.2 | (16.0 | ) | |||||||
| Impairment and disposal of long-lived assets | 4.4 | 5.1 | 23.7 | |||||||||
| Long-term interest and monetary and exchange variations, net | 90.4 | (54.4 | ) | (94.9 | ) | |||||||
| Deferred tax expense (benefit) | (100.9 | ) | 29.6 | (141.4 | ) | |||||||
| Minority interest | 1.6 | (54.0 | ) | 24.6 | ||||||||
| Assignment of rights to use | (19.7 | ) | (3.6 | ) | (20.7 | ) | ||||||
| Tax recovery | (94.5 | ) | ||||||||||
| Other | (16.1 | ) | (26.2 | ) | 67.2 | |||||||
| Total resulting from operations | 955.4 | 1,474.4 | 1,444.4 | |||||||||
| Shareholders | ||||||||||||
| Capital increase | 110.9 | 2.5 | 1,211.0 | |||||||||
| Advance for future capital increase | 0.2 | 0.2 | ||||||||||
| Exchange of treasury stock | 8.2 | |||||||||||
| 110.9 | 2.7 | 1,219.4 | ||||||||||
| Third parties | ||||||||||||
| Transfer from long-term receivables to current assets | 168.3 | 66.4 | 516.7 | |||||||||
| Decrease in long-term assets | 28.4 | 123.3 | 61.1 | |||||||||
| Increase in long-term liabilities | 2,290.1 | 2,036.1 | 3,187.3 | |||||||||
| Dividends receivable | 2.0 | 2.0 | ||||||||||
| Tax incentives | 32.4 | 91.4 | 112.5 | |||||||||
| Net working capital of merged companies | 84.1 | |||||||||||
| Other | 5.9 | 0.6 | ||||||||||
| 2,605.3 | 2,325.1 | 3,878.2 | ||||||||||
Total funds provided | 3,671.6 | 3,802.2 | 6,542.0 | |||||||||
F-10
Table of Contents
Consolidated Statements of Changes in Financial Position | ||
Years Ended December 31 | ||
In millions of reais | (Continued) |
| 2006 | 2005 | 2004 | ||||||||||
Financial resources were used for: | ||||||||||||
| Dividends proposed and interest on own capital | 66.2 | 331.3 | 209.8 | |||||||||
| Transfer from long-term liabilities to current liabilities | 24.8 | 316.2 | 48.4 | |||||||||
| Transfer from long-term financing to current liabilities | 1,767.8 | 504.2 | 2,172.3 | |||||||||
| Settlement of long-term financing | 634.0 | 617.2 | 1,017.3 | |||||||||
| Decrease of current liabilities, net | 4.3 | 117.8 | 55.5 | |||||||||
| Redemption of shares / debentures | 192.7 | 9.1 | ||||||||||
| Decrease in long-term liabilities | 148.7 | 3.1 | 126.1 | |||||||||
| Increase in long-term receivables | 202.4 | 507.7 | 123.7 | |||||||||
| Permanent assets | ||||||||||||
| Investments | 483.0 | 22.5 | 23.6 | |||||||||
| Property, plant, equipment and intangible assets | 1,056.6 | 965.3 | 442.3 | |||||||||
| Deferred charges | 40.3 | 87.6 | 549.4 | |||||||||
Total funds used | 4,620.8 | 3,482.0 | 4,768.4 | |||||||||
Increase (decrease) in working capital | (949.2 | ) | 320.2 | 1,773.6 | ||||||||
Changes in working capital | ||||||||||||
Current assets | ||||||||||||
| At the end of the year | 5,951.0 | 5,837.5 | 5,668.3 | |||||||||
| At the beginning of the year | 5,837.5 | 5,668.3 | 4,167.4 | |||||||||
| 113.5 | 169.2 | 1,500.9 | ||||||||||
Current liabilities | ||||||||||||
| At the end of the year | 5,506.9 | 4,444.2 | 4,595.2 | |||||||||
| At the beginning of the year | 4,444.2 | 4,595.2 | 4,867.9 | |||||||||
| 1,062.7 | (151.0 | ) | (272.7 | ) | ||||||||
Increase (decrease) in working capital | (949.2 | ) | 320.2 | 1,773.6 | ||||||||
F-11
Table of Contents
Years Ended December 31
In millions ofreais
| 2006 | 2005 | 2004 | ||||||||||
| Net income for the year | 101.3 | 625.8 | 687.1 | |||||||||
| Adjustment to reconcile net income to cash provided: | ||||||||||||
| Depreciation, amortization and depletion | 962.4 | 841.5 | 798.1 | |||||||||
| Amortization of goodwill (negative goodwill), net | 57.8 | 152.5 | 152.7 | |||||||||
| Equity in earnings of associated companies | (0.8 | ) | (1.3 | ) | (0.7 | ) | ||||||
| Tax incentives | (20.5 | ) | (39.2 | ) | (44.9 | ) | ||||||
| Foreign Exchange variation on investments | 1.4 | (3.6 | ) | 9.6 | ||||||||
| Adjustment to realization value of investments | (11.4 | ) | 2.2 | (16.0 | ) | |||||||
| Loss on permanent assets disposed of | 1.4 | 2.2 | 23.7 | |||||||||
| Interest and monetary and exchange variations, net | (1.3 | ) | (133.1 | ) | (336.2 | ) | ||||||
| Minority interest | 1.6 | (54.0 | ) | 24.6 | ||||||||
| Tax recovery | (94.5 | ) | ||||||||||
| Deferred tax expense (benefit) | (100.9 | ) | 29.6 | (141.4 | ) | |||||||
| Other | 5.3 | (30.9 | ) | 26.0 | ||||||||
| Decrease (increase) in assets: | ||||||||||||
| Effect of merger on cash of subsidiaries (i) | 8.8 | |||||||||||
| Other investments | (347.1 | ) | (82.1 | ) | 47.8 | |||||||
| Trade accounts receivable | 53.9 | 161.7 | (451.7 | ) | ||||||||
| Fair market value of derivative financial instruments | (4.1 | ) | ||||||||||
| Inventories | (148.2 | ) | (51.5 | ) | (389.6 | ) | ||||||
| Taxes recoverable | (462.5 | ) | (130.3 | ) | 289.4 | |||||||
| Prepaid expenses | (56.7 | ) | 16.0 | 29.6 | ||||||||
| Other receivables | (34.6 | ) | (30.1 | ) | 28.1 | |||||||
| Increase (decrease) in liabilities: | ||||||||||||
| Suppliers | 415.0 | 485.1 | 1,152.1 | |||||||||
| Taxes and contributions payable | (66.5 | ) | (79.3 | ) | 174.3 | |||||||
| Tax incentives | 32.4 | 91.2 | 112.5 | |||||||||
| Advances from customers | (24.4 | ) | (0.6 | ) | (212.3 | ) | ||||||
| Other liabilities | 133.4 | (52.4 | ) | (42.7 | ) | |||||||
Net cash provided by operating activities | 405.3 | 1,719.4 | 1,916.0 | |||||||||
| Proceeds from sale of permanent assets | 0.9 | 1.8 | ||||||||||
| Additions to investments | (222.7 | ) | (34.0 | ) | (23.6 | ) | ||||||
| Additions to property, plant, equipment and intangible assets | (953.0 | ) | (930.2 | ) | (704.4 | ) | ||||||
| Additions to deferred charges | (40.3 | ) | (87.6 | ) | (287.2 | ) | ||||||
| Dividends received | 2.0 | 2.0 | 0.8 | |||||||||
Net cash used in investing activities | (1,213.1 | ) | (1,048.0 | ) | (1,014.4 | ) | ||||||
F-12
Table of Contents
Consolidated Statements of Cash Flows | ||
Years Ended December 31 | ||
In millions ofreais | (Continued) |
| 2006 | 2005 | 2004 | ||||||||||
| Short-term debt | ||||||||||||
| Issuances | 2,793.5 | 948.3 | 2,059.9 | |||||||||
| Repayment | (3,613.8 | ) | (2,338.8 | ) | (4,595.7 | ) | ||||||
| Long-term debt | ||||||||||||
| Issuances | 2,235.8 | 1,624.7 | 2,454.2 | |||||||||
| Repayment | (659.1 | ) | (617.2 | ) | (991.6 | ) | ||||||
| Quotas (shares) subject to mandatory redemption | 400.0 | 88.3 | ||||||||||
| Related parties | ||||||||||||
| Issuances | 0.2 | 0.2 | 39.9 | |||||||||
| Repayment | (4.1 | ) | (124.7 | ) | (109.2 | ) | ||||||
| Dividends paid to shareholders and minorities | (343.4 | ) | (208.7 | ) | (4.9 | ) | ||||||
| Share issue | 5.4 | 2.5 | 1,211.0 | |||||||||
| Treasury share re-issuances (purchases) | (192.7 | ) | 8.2 | |||||||||
| Other | (2.6 | ) | (16.0 | ) | 5.9 | |||||||
Net cash provided by (used in) financing activities | 219.2 | (329.7 | ) | 166.0 | ||||||||
| Increase (decrease) in cash and cash equivalents | (588.6 | ) | 341.7 | 1,067.6 | ||||||||
| Represented by | ||||||||||||
| Cash and cash equivalents, beginning of year | 2,135.7 | 1,794.0 | 726.4 | |||||||||
| Cash and cash equivalents, end of year | 1,547.1 | 2,135.7 | 1,794.0 | |||||||||
| Increase (decrease) in cash and cash equivalents | (588.6 | ) | 341.7 | 1,067.6 | ||||||||
Supplemental information | ||||||||||||
Cash paid during the year for: | ||||||||||||
| Interest | 537.0 | 508.0 | 1,029.4 | |||||||||
| Income taxes | 1.6 | 16.8 | 13.9 | |||||||||
| (i) | Issue of Company shares and use of treasury shares to acquire minority interests in its subsidiaries (Note 1 (b)) affecting minority interests and share capital; |
F-13
Table of Contents
at December 31, 2006, 2005 and 2004
All amounts in millions ofreais,unless otherwise indicated
| 1 | Operations | |
| (a) | Braskem S.A. (“Braskem”) and its subsidiaries, including its jointly-controlled companies (together, “we”, “us”, “our” or “the Company”), is the largest integrated petrochemical cracker and thermoplastics producer in Brazil, and produces a diversified portfolio of petrochemical products. Braskem’s principal corporate objective is manufacturing, selling, importing and exporting chemical and petrochemical products and fuels, as well as producing and supplying utilities to companies in the Camaçari Petrochemical Complex in Bahia, Brazil and rendering of services to those companies. | |
| The Company’s operations are structured in four business units: Basic Petrochemicals, Polyolefins, Vynils and Business Development. | ||
| (b) | Formation of Braskem | |
| Since its inception on August 16, 2002, the Company has undergone a major corporate restructuring process, disclosed to the market through material event notices. The major developments during 2004, 2005 and 2006 can be summarized as follows: |
F-14
Table of Contents
at December 31, 2006, 2005 and 2004
All amounts in millions ofreais,unless otherwise indicated
R$ 13.4. In this transaction, the Company recorded goodwill of R$ 0.4, fully amortized since it is grounded in other economic reasons
F-15
Table of Contents
at December 31, 2006, 2005 and 2004
All amounts in millions ofreais,unless otherwise indicated
F-16
Table of Contents
at December 31, 2006, 2005 and 2004
All amounts in millions ofreais,unless otherwise indicated
F-17
Table of Contents
at December 31, 2006, 2005 and 2004
All amounts in millions ofreais,unless otherwise indicated
| Braskem | Polialden | |||||||
| Current number of shares issued and outstanding | 362,523,521 | 645,253,380 | ||||||
| Market value of shareholders’ equity (in R$) | 8,202,482,686.96 | 459,721,902.03 | ||||||
| Value per share based on the market value of shareholders’ equity (in R$) | 22.626 | 0.713 | ||||||
| Exchange ratio – Shareholders’ equity at market values | 31.49 | 1.00 | ||||||
| Book value of shareholders’ equity (in R$) | 4,650,559,014.63 | 289,940,899.44 | ||||||
| Value per share based on the book value (in R$) | 12.828 | 0.449 | ||||||
| Ratio of exchange of Polialden preferred stock with Braskem class “A” preferred stock under the merger | 33.62 | 1.00 | ||||||
F-18
Table of Contents
at December 31, 2006, 2005 and 2004
All amounts in millions ofreais,unless otherwise indicated
Following the acquisition, the Extraordinary General meeting held on July 20, 2006 approved the partial spin-off of Cinal and the related legal merger of Cinal’s industrial assets into the Company. This transaction did not generated any impact in the consolidated financial statements of the Company, because it was under common control.
| (c) | Administrative Council for Economic Defense — CADE | |
| On September 14, 2005, CADE approved, by unanimous vote and with no restrictions, the transactions resulting in the formation of the Company in 2002, which had given rise to a notice of potential economic concentration. | ||
| On July 19, 2006, CADE approved, by unanimous vote, the acquisition of Politeno by the Company (Note 1(b)). CADE members took this decision based on their understanding that the Brazilian petrochemical industry is part of an international market and therefore the transaction do not threaten competition in Brazil. | ||
| (d) | Reverse share split and split of American Depositary Shares (“ADS”) | |
| In order to increase the trading liquidity of the Company’s shares, the shareholders at an Extraordinary General Meeting held on March 31, 2005, approved the reverse split of all classes of Braskem’s shares, on the basis of one share for each 250 existing shares. As a result, a change in the ratio of the American Depositary Shares representing Braskem’s Class A preferred shares (“ADSs”) was also made on the basis of two ADSs for each existing ADS. |
F-19
Table of Contents
at December 31, 2006, 2005 and 2004
All amounts in millions ofreais,unless otherwise indicated
| Without giving effect | As presented after | |||||||
| to the reverse share | giving effect to the | |||||||
| split (per thousand | reverse share split | |||||||
| shares) | (per share) | |||||||
| Year ended December 31, 2006 | 0.2845 | |||||||
| Year ended December 31, 2005 | 6.9138 | 1.7285 | ||||||
| Year ended December 31, 2004 | 7.5907 | 1.8977 | ||||||
| (e) | Corporate governance | |
| Braskem agreed to comply with Level 1 of the Corporate Governance Standards of the Bovespa, which mainly commits the Company to (i) improve information provided to the market; and (ii) to increase the percentage of capital available for trading in the market, which Braskem satisfied through the Global Offering in 2004, reaching approximately 47% of free float. The Company intends to reach Level 2 of Corporate Governance Standards of the Bovespa in due time. |
F-20
Table of Contents
at December 31, 2006, 2005 and 2004
All amounts in millions ofreais,unless otherwise indicated
| 2 | Presentation of the financial statements | |
| The financial statements have been prepared in accordance with the accounting practices adopted in Brazil (“Brazilian GAAP”), which are based on: |
| • | Brazilian Law N° 6404/76, as amended by Brazilian Law N° 9457/97 and Brazilian Law N° 10303/01; | ||
| • | the rules and regulations of the Brazilian Securities Commission (the “CVM”); and | ||
| • | the accounting standards issued by the Brazilian Institute of Independent Accountants (Instituto dos Auditores Independentes do Brasil – or “IBRACON”). |
| The consolidated financial statements prepared by the Company for statutory purposes, which include the stand-alone financial statements of Braskem S.A. (holding company), were filed with the CVM on February 8, 2007. The financial statements presented herein do not include the holding company’s stand-alone financial statements and are not intended to be used for statutory purposes. | ||
| The following reclassifications and procedures were made in 2005, for a better presentation and comparison among 2006 and 2005 in the financial statements: |
| • | In accordance with IBRACON Technical Interpretation 01/2006, beginning January 1, 2006 the amount of R$ 400.2 related to programmed maintenance shutdown was reclassified from deferred charges to property, plant and equipment; and | ||
| • | Pursuant to CVM Release 01/2006, the Company now presents liabilities related to quotas subject to mandatory redemption under loans and financing. Accordingly, the comparative 2005 balance sheet herein reflects the reclassification of R$ 629.5, for both short and long term liabilities. |
F-21
Table of Contents
at December 31, 2006, 2005 and 2004
All amounts in millions ofreais,unless otherwise indicated
| Published | Reclassified | |||||||||||
| 2005 | Reclassification | 2005 | ||||||||||
Assets | ||||||||||||
Current assets | ||||||||||||
| Deferred income tax and social contribution | 2.4 | 19.6 | 22.0 | |||||||||
Long-term assets | ||||||||||||
| Deferred income tax and social contribution | 292.6 | (19.6 | ) | 273.0 | ||||||||
Permanent assets | ||||||||||||
| Property, plant and equipment | 5,964.2 | 400.2 | 6,364.4 | |||||||||
| Intangible assets | 28.4 | 28.4 | ||||||||||
| Deferred charges | 2,660.3 | (428.6 | ) | 2,231.7 | ||||||||
Current liabilities | ||||||||||||
| Loans and financing – short-term | 895.0 | 225.4 | 1,120.4 | |||||||||
| Quotas subject to mandatory redemption – short-term | 225.4 | (225.4 | ) | |||||||||
Long-term liabilities | ||||||||||||
| Loans and financing – long-term | 2,857.5 | 404.1 | 3,261.6 | |||||||||
| Quotas subject to mandatory redemption – long-term | 404.1 | (404.1 | ) | |||||||||
| The financial statements for the year ended December 31, 2006 consider the full consolidation of Politeno as from April 1, 2006. The condensed balance sheets and statements of operations of Politeno are presented in Note 3 (g). | ||
| 3 | Significant accounting practices | |
| These financial statements were approved by the Board of Directors of the Company on May 29, 2007. | ||
| (a) | Use of estimates | |
| In the preparation of the financial statements, it is necessary to use estimates to record certain assets, liabilities and transactions. The Company’s financial statements include, therefore, various estimates regarding derivatives and the selection of the useful lives of property, plant and equipment, deferred charges amortization periods, as well as provisions for contingencies, income tax and other similar amounts. | ||
| (b) | Revenue recognition and other income statement items | |
| Revenue is recognized for products sales when risk and title are transferred to the Company’s customers. |
F-22
Table of Contents
at December 31, 2006, 2005 and 2004
All amounts in millions ofreais,unless otherwise indicated
| Title generally passes when the product is delivered to our customers or their freight carriers. Freight expenses are reported within net sales and amounted R$ 366.9, R$ 340.2 and R$ 285.4, in 2006, 2005 and 2004, respectively. | ||
| The provisions for income tax and value-added tax on sales and services (Imposto sobre Circulação de Mercadorias e Serviços, or “ICMS”) are recorded gross of the tax incentive portions, with the amounts related to tax exemption and reduction recorded within capital reserves. | ||
| Monetary and exchange variations of foreign currency assets and liabilities are classified as financial income and financial expenses, respectively. | ||
| The Company has recognized in the results of each year the change in market value for derivative instruments related to liabilities indexed to foreign currency or international interest rates. See Notes 22 and 23. | ||
| Advertising expenses are recorded when incurred and were not significant for the years presented herein. | ||
| Earnings per share are calculated based on the number of outstanding shares on the balance sheet date. | ||
| (c) | Current and non-current assets | |
| Cash and cash equivalents consist principally of cash deposits and marketable securities or investments maturing within 90 days or less (Note (4)). | ||
| Other investments refers basically to marketable securities that are recorded at the lower of cost and market value, including accrued income earned to the balance sheet date which is not significantly different from market value. | ||
| Derivative instruments are recorded at their estimated fair value, based on market quotations for similar instruments as to foreign exchange and interest rates. |
F-23
Table of Contents
at December 31, 2006, 2005 and 2004
All amounts in millions ofreais,unless otherwise indicated
| The allowance for doubtful accounts is set up at an amount considered sufficient to cover probable losses on the realization of the receivables, taking into account the Company’s loss experience. In order to determine the overall adequacy of the allowance for doubtful accounts, we evaluate the amount and characteristics of our accounts receivable on a monthly basis. | ||
| Inventories are stated at average purchase or production cost, which is lower than replacement cost or realization value. Imports in transit are stated at the accumulated cost of each import. Inventories of consumable materials (“Warehouse”) are classified in current assets or long-term assets, considering their history of consumption. | ||
| Deferred tax assets are recognized in accordance with CVM Deliberation N° 273 and CVM Instruction N° 371, when recoverability is more likely than not. Valuation allowances are recorded for the amounts that will be recovered after ten years. Tax deductible goodwill generates an income tax benefit to the extent that it has been amortized. | ||
| Judicial deposits are stated net of the related contingent liabilities, pursuant to CVM Deliberation 489/05. | ||
| Other assets are shown at realizable values, including, where applicable, accrued income and monetary variations, or at cost in the case of prepaid expenses. | ||
| (d) | Permanent assets | |
| Permanent assets are stated at cost indexed for inflation through December 31, 1995, and take into consideration the following: |
| • | Investments in associated companies are accounted for using the equity method, plus unamortized goodwill/negative goodwill. Goodwill is calculated as the difference between the amount paid and the book value of net assets acquired. Total goodwill is divided between the fair values of assets and expected future profitability of the investees, and is amortized over the useful life of the related assets or up to ten years in the case of future profitability. Goodwill in legally merged companies is transferred to property, plant and equipment and deferred charges, when based on asset appreciation and future profitability of the investees, respectively. Other investments are carried at the cost of acquisition adjusted for any permanent loss, if applicable; |
F-24
Table of Contents
at December 31, 2006, 2005 and 2004
All amounts in millions ofreais,unless otherwise indicated
| • | Property, plant and equipment are shown at acquisition or construction cost and, as from 1997, includes capitalized interest incurred during the construction period. Capitalized interest is added to assets and depreciated as from the date they become operational; | ||
| • | Depreciation of property, plant and equipment is recorded on the straight-line basis at the rates mentioned in Note 12; | ||
| • | Amortization of deferred charges is recorded over a period of up to ten years, as from the time benefits begin to accrue; | ||
| • | As from January 2006, in accordance with IBRACON Technical Interpretation 01/2006, the Company records all programmed maintenance shutdown expenses in property, plant and equipment, as “Machinery, equipment and facilities”. Such stoppages occur at scheduled periods at intervals from two to six years and the related expenses are depreciated until the beginning of the next maintenance shutdown (Note 12); and | ||
| • | Impairment provisions are recorded when the projected operating income is not sufficient to absorb the depreciation or amortization of permanent assets. During 2004, the Company recorded an impairment provision of R$12.7, related to the fair market values of some machinery and equipment. No impairment provision was recorded in either 2006 and 2005. |
| (e) | Current and non-current liabilities | |
| These liabilities are stated at known or estimated amounts, including accrued charges and monetary and exchange adjustments, as applicable. | ||
| Defined benefit pension plans are accounted for based on the calculations made by independent actuaries, based on assumptions provided by the Company. | ||
| Provisions are recorded based on (i) current legislation (even when management believes that this legislation may be considered unconstitutional); (ii) the need to eliminate contingent gains upon credit offsetting as a result of judicial claims; and (iii) estimated payments of indemnities considered probable. | ||
| (f) | Deferred income | |
| Deferred income includes negative goodwill of merged companies, supported by the expected future profitability of those companies. |
F-25
Table of Contents
at December 31, 2006, 2005 and 2004
All amounts in millions ofreais,unless otherwise indicated
| (g) | Consolidated financial statements | |
| The consolidated financial statements were prepared in accordance with the consolidation principles set forth in the Brazilian corporate law and supplementary standards of CVM and include the financial statements of Braskem, its subsidiaries, jointly-controlled companies, and Special Purpose Entities (“SPE’s”) in which the Company has direct or indirect share control, as shown below: |
| Interest in total | ||||||||||||||||
| capital - % | ||||||||||||||||
| Head | ||||||||||||||||
| office | ||||||||||||||||
| (country) | 2006 | 2005 | 2004 | |||||||||||||
Subsidiaries | ||||||||||||||||
| Braskem Argentina | (i) | Argentina | 100.00 | 100.00 | ||||||||||||
| Braskem America Inc. (“Braskem America”) | (ii) | USA | 100.00 | 63.68 | 63.68 | |||||||||||
| Braskem Distribuidora de Combustíveis Ltda. | (xiv) | Brazil | 100.00 | 100.00 | 100.00 | |||||||||||
| Braskem Europa | (iii) | Holland | 100.00 | |||||||||||||
| Braskem Incorporated Ltd. | Cayman | 100.00 | 100.00 | 100.00 | ||||||||||||
| Islands | ||||||||||||||||
| Braskem Participações S.A. | Brazil | 100.00 | 100.00 | 100.00 | ||||||||||||
| Braskem International Ltd. (“Braskem International”) | (iv) | Bahamas | 100.00 | 100.00 | ||||||||||||
| CINAL | (v) | Brazil | 100.00 | 86.82 | 63.03 | |||||||||||
| CPP — Companhia Petroquímica Paulista (“CPP”) | Brazil | 79.70 | 79.70 | 90.71 | ||||||||||||
| Polialden | (vi) | Brazil | 63.68 | 63.68 | ||||||||||||
| Politeno | (vii) | Brazil | 96.16 | |||||||||||||
| Tegal Terminal de Gases Ltda. (“Tegal”) | (viii) | Brazil | 95.83 | 90.79 | 90.79 | |||||||||||
| Investimentos Petroquímicos Ltda. (“IPL”) | (xv) | Brazil | 100.00 | 100.00 | ||||||||||||
| Braskem Importação e Exportação Ltda. | Brazil | 100.00 | 100.00 | 100.00 | ||||||||||||
| Overseas | (xvi) | Cayman | 100.00 | 100.00 | 100.00 | |||||||||||
| Islands | ||||||||||||||||
| Lantana | Bahamas | 100.00 | 100.00 | 100.00 | ||||||||||||
Jointly-controlled companies | (ix) | |||||||||||||||
| CETREL S.A. — Empresa de Proteção Ambiental (“CETREL”) | (x) | Brazil | 49.03 | 48.02 | 40.56 | |||||||||||
| Companhia Petroquímica do Sul (“COPESUL”) | Brazil | 29.46 | 29.46 | 29.46 | ||||||||||||
| Petroflex Indústria e Comércio S.A. | Brazil | 20.12 | 20.12 | 20.12 | ||||||||||||
| Petroquímica Paulínia | (xi) | Brazil | 60.00 | 60.00 | ||||||||||||
| Politeno | (vii) | Brazil | 33.96 | 33.96 | ||||||||||||
Special-purpose entities (“SPE’s”) | (xii) | |||||||||||||||
| Chemical Fundo de Investimento em Direitos Creditórios (“Fundo Chemical”) | (xiii) | Brazil | 100.00 | 11.58 | 10.65 | |||||||||||
| Chemical Fundo de Investimento em Direitos Creditórios (“Fundo Chemical II”) | (xiii) | Brazil | 9.19 | 9.09 | ||||||||||||
| Fundo Parin | Guernsey | 100.00 | 100.00 | |||||||||||||
| Guardian-Protected Cell Company (“Guardian”) | (xvii) | Guernsey | 100.00 | 100.00 | ||||||||||||
| Sol-Fundo de Aplicação em Cotas de Fundos de Investimento (“FIQ Sol”) | Brazil | 100.00 | 100.00 | 100.00 | ||||||||||||
F-26
Table of Contents
at December 31, 2006, 2005 and 2004
All amounts in millions ofreais,unless otherwise indicated
| (i) | Including the interest of subsidiary Braskem Distribuidora, Braskem interest amounts to 100%. | |
| (ii) | Became a direct subsidiary of Braskem after Polialden’s merger into the Company on May 31, 2006 (Note 1(c)). | |
| (iii) | Start-up in September 2006 (Note 1(c)). | |
| (iv) | Wound up in March 2006. | |
| (v) | In June 2006, the Company acquired the remaining shares from minority stockholders (Note 1(c)). | |
| (vi) | Merged into the Company on May 31, 2006 (Note 1(c)). | |
| (vii) | Jointly-controlled entity until March 31, 2006. In the second quarter of 2006, the Company acquired the remaining share control of Politeno (Note 1(c)). | |
| (viii) | Interest acquired from subsidiary. | |
| (ix) | Investments proportionally consolidated, pursuant to CVM Instruction 247/96. | |
| (x) | Including the interest of subsidiary CINAL, Braskem interest amounts to 53.61%. Jointly-controlled entity pursuant to the provisions of the stockholders’ agreement. | |
| (xi) | Jointly-controlled entity as a result of shareholders’ agreement provisions. | |
| (xii) | Investments consolidated in accordance with CVM Instruction 408/04. | |
| (xiii) | Interest corresponding to subordinated quotas held by Braskem. | |
| (xiv) | Upon the merger of IPL, the investment in Braskem Importação e Exportação is held by Braskem Distribuidora. | |
| (xv) | Merged into Braskem Distribuidora in September 2006. | |
| (xvi) | Company in process of winding up. | |
| (xvii) | Fund wound up in October 2006. |
F-27
Table of Contents
at December 31, 2006, 2005 and 2004
All amounts in millions ofreais,unless otherwise indicated
| Unaudited | ||||||||
| 2006 | 2005 | |||||||
| Assets | ||||||||
| Current assets | 0.3 | 0.4 | ||||||
| Non-current assets | 0.1 | |||||||
| Permanent assets | 45.0 | 43.6 | ||||||
| Total assets | 45.4 | 44.0 | ||||||
| Liabilities and stockholders’ equity | ||||||||
| Current liabilities | 0.1 | 0.1 | ||||||
| Non-current liabilities | 1.4 | 1.1 | ||||||
| Shareholders’ equity | 43.9 | 42.8 | ||||||
| Total liabilities and stockholders’ equity | 45.4 | 44.0 | ||||||
F-28
Table of Contents
at December 31, 2006, 2005 and 2004
All amounts in millions ofreais,unless otherwise indicated
| Copesul | Cetrel (i) | Petroflex(i) | ||||||||||||||||||||||||||||||||||
| 2006 | 2005 | 2004 | 2006 | 2005 | 2004 | 2006 | 2005 | 2004 | ||||||||||||||||||||||||||||
| Assets | ||||||||||||||||||||||||||||||||||||
| Current assets | 1,261.8 | 907.9 | 754.0 | 25.5 | 24.3 | 27.8 | 605.0 | 499.5 | 591.2 | |||||||||||||||||||||||||||
| Long-term receivables | 154.6 | 154.9 | 294.8 | 12.3 | 15.0 | 12.9 | 31.3 | 29.1 | 35.8 | |||||||||||||||||||||||||||
| Permanent assets | 1,050.2 | 1,125.8 | 1,158.8 | 131.2 | 111.5 | 108.3 | 437.0 | 384.3 | 330.4 | |||||||||||||||||||||||||||
| Total assets | 2,466.6 | 2,188.6 | 2,207.6 | 169.0 | 150.8 | 149.0 | 1,073.3 | 912.9 | 957.4 | |||||||||||||||||||||||||||
| Liabilities and shareholders’ equity | ||||||||||||||||||||||||||||||||||||
| Current liabilities | 840.7 | 701.6 | 745.7 | 20.3 | 20.9 | 26.4 | 390.7 | 474.9 | 363.7 | |||||||||||||||||||||||||||
| Long-term liabilities | 325.7 | 246.5 | 307.1 | 39.2 | 31.9 | 66.0 | 375.8 | 159.1 | 338.0 | |||||||||||||||||||||||||||
| Shareholders’ equity | 1,300.2 | 1,240.5 | 1,154.8 | 109.5 | 98.0 | 56.6 | 306.8 | 278.9 | 255.7 | |||||||||||||||||||||||||||
| Total liabilities and shareholders’ equity | 2,466.6 | 2,188.6 | 2,207.6 | 169.0 | 150.8 | 149.0 | 1,073.3 | 912.9 | 957.4 | |||||||||||||||||||||||||||
| Statement of income | ||||||||||||||||||||||||||||||||||||
| Net sales | 6,299.2 | 5,552.6 | 5,374.1 | 106.2 | 98.2 | 81.8 | 1,361.5 | 1,373.2 | 1,306.0 | |||||||||||||||||||||||||||
| Cost of goods sold and services rendered | (5,292.3 | ) | (4,610.4 | ) | (4,417.6 | ) | (74.0 | ) | (79.6 | ) | (64.1 | ) | (1,197.0 | ) | (1,088.9 | ) | (1,043.4 | ) | ||||||||||||||||||
| Gross profit | 1,006.9 | 942.2 | 956.5 | 32.2 | 18.6 | 17.7 | 164.5 | 284.3 | 262.6 | |||||||||||||||||||||||||||
| Operating expenses, net | (117.5 | ) | (151.1 | ) | (155.3 | ) | (19.7 | ) | (11.1 | ) | (25.3 | ) | (131.3 | ) | (160.8 | ) | (134.0 | ) | ||||||||||||||||||
| Non operating income (expenses), net | (4.3 | ) | 5.4 | (0.8 | ) | 0.2 | 0.3 | (1.1 | ) | 0.9 | (1.5 | ) | 0.5 | |||||||||||||||||||||||
| Income before income tax and social contribution | 885.1 | 796.5 | 800.4 | 12.7 | 7.8 | (8.7 | ) | 34.1 | 122.0 | 129.1 | ||||||||||||||||||||||||||
| Income tax and social contribution | (269.9 | ) | (230.5 | ) | (242.0 | ) | (2.5 | ) | (0.7 | ) | (8.1 | ) | (33.7 | ) | (30.5 | ) | ||||||||||||||||||||
| Net income for the year | 615.2 | 566.0 | 558.4 | 10.2 | 7.1 | (8.7 | ) | 26.0 | 88.3 | 98.6 | ||||||||||||||||||||||||||
| (i) | Financial statements excluding non-mandatory asset revaluation effects, to conform to the Company accounting policies. |
F-29
Table of Contents
at December 31, 2006, 2005 and 2004
All amounts in millions ofreais,unless otherwise indicated
| Politeno (i) | Petroquímica Paulínia(ii) | |||||||||||
| 2005 | 2006 | 2005 | ||||||||||
| Assets | ||||||||||||
| Current assets | 294.2 | 102.5 | 7.5 | |||||||||
| Long-term receivables | 164.0 | |||||||||||
| Permanent assets | 191.3 | 115.5 | 58.2 | |||||||||
| Total assets | 649.5 | 218.0 | 65.7 | |||||||||
| Liabilities and shareholders’ equity | ||||||||||||
| Current liabilities | 148.9 | 3.8 | ||||||||||
| Long-term liabilities | 11.0 | 84.0 | 17.7 | |||||||||
| Shareholders’ equity | 489.6 | 130.2 | 48.0 | |||||||||
| Total liabilities and shareholders’ equity | 649.5 | 218.0 | 65.7 | |||||||||
| Statement of income | �� | |||||||||||
| Net sales | 1,169.9 | |||||||||||
| Cost of goods sold and services rendered | (950.2 | ) | ||||||||||
| Gross profit | 219.7 | |||||||||||
| Operating expenses, net | (116.9 | ) | ||||||||||
| Non operating income (expenses), net | (5.6 | ) | ||||||||||
| Income before income tax and social contribution | 97.2 | |||||||||||
| Income tax and social contribution | (33.8 | ) | ||||||||||
| Net income for the year | 63.4 | |||||||||||
| (i) | Financial statements excluding non-mandatory asset revaluation effects, to conform to the Company accounting policies. | |
| (ii) | A development stage Company. |
F-30
Table of Contents
at December 31, 2006, 2005 and 2004
All amounts in millions ofreais,unless otherwise indicated
| Fundo Parin | Guardian | FIQ Sol | Fundo Chemical (i) | Fundo Chemical II (i) | Orion | |||||||||||||||||||||||||||||||||||||||||||||||
| 2006 | 2005 | 2005 | 2004 | 2006 | 2005 | 2004 | 2006 | 2005 | 2004 | 2006 | 2005 | 2004 | ||||||||||||||||||||||||||||||||||||||||
| Assets | 538.0 | 560.6 | 1,002.8 | 994.3 | 395.2 | 545.6 | 402.1 | 6.1 | 228.3 | 226.2 | 442.6 | 444.6 | 553.7 | |||||||||||||||||||||||||||||||||||||||
| Liabilities | 0.2 | 0.5 | 0.1 | 0.2 | 0.3 | |||||||||||||||||||||||||||||||||||||||||||||||
| Shareholders’ equity | 538.0 | 560.4 | 1,002.3 | 994.2 | 395.2 | 545.6 | 402.1 | 5.9 | 228.0 | 226.2 | 442.6 | 444.6 | 553.7 | |||||||||||||||||||||||||||||||||||||||
| Total liabilities and shareholders’ equity | 538.0 | 560.6 | 1,002.8 | 994.3 | 395.2 | 545.6 | 402.1 | 6.1 | 228.3 | 226.2 | 442.6 | 444.6 | 553.7 | |||||||||||||||||||||||||||||||||||||||
| Net income (loss) for the year | (14.8 | ) | 9.3 | 48.5 | 19.3 | 37.0 | 70.6 | 92.4 | (19.0 | ) | 39.0 | 3.8 | 68.6 | 4.5 | 31.4 | |||||||||||||||||||||||||||||||||||||
| (i) | Fundo Chemical and Fundo Chemical II are receivables securitization funds. Such funds are considered SPEs and therefore consolidated for purposes of these financial statements. The senior quots of these funds with third-parties are recorded as liabilities in the consolidated financial statements (Note 2). |
F-31
Table of Contents
at December 31, 2006, 2005 and 2004
All amounts in millions ofreais,unless otherwise indicated
| 4 | Cash and cash equivalents |
| 2006 | 2005 | |||||||
| Cash and banks | 140.2 | 142.0 | ||||||
| Financial investments | ||||||||
| Domestic | 751.6 | 740.6 | ||||||
| Foreign | 655.3 | 1,253.1 | ||||||
| 1,547.1 | 2,135.7 | |||||||
F-32
Table of Contents
at December 31, 2006, 2005 and 2004
All amounts in millions ofreais,unless otherwise indicated
| 5 | Other investments |
| 2006 | 2005 | |||||||
Current assets | ||||||||
| Fair market value of derivative instruments | 27.6 | 19.8 | ||||||
| Government securities issued abroad | 311.1 | |||||||
| Investment fund — time deposits | 63.9 | 122.1 | ||||||
| Subordinated quotas of investment fund — credit rights and other | 11.3 | 3.9 | ||||||
| 413.9 | 145.8 | |||||||
Long-term receivables | ||||||||
| Other | 1.6 | 0.3 | ||||||
| 1.6 | 0.3 | |||||||
Total | 415.5 | 146.1 | ||||||
| 6 | Trade accounts receivable |
| 2006 | 2005 | |||||||
Customers | ||||||||
| Domestic market | 1,514.3 | 1,300.9 | ||||||
| Foreign market | 421.9 | 360.6 | ||||||
| Discounted trade receivables | (119.7 | ) | ||||||
| Advances on bills of exchange delivered | (15.8 | ) | (31.2 | ) | ||||
| Allowance for doubtful accounts | (153.3 | ) | (87.3 | ) | ||||
| 1,647.4 | 1,543.0 | |||||||
Non-current asset | (52.5 | ) | (49.7 | ) | ||||
| Current assets | 1,594.9 | 1,493.3 | ||||||
F-33
Table of Contents
at December 31, 2006, 2005 and 2004
All amounts in millions ofreais,unless otherwise indicated
| 2006 | 2005 | 2004 | ||||||||||
| At the beginning of the year | 87.3 | 55.0 | 105.7 | |||||||||
| Addition for the full consolidation of Politeno | 15.5 | |||||||||||
| Additions classified as selling expenses | 99.3 | 38.9 | 52.8 | |||||||||
| Recovery of credits provided | (48.6 | ) | (6.7 | ) | (0.4 | ) | ||||||
| Write-off of bad debts | (0.2 | ) | (102.4 | ) | ||||||||
| Exchange variation | 0.1 | (0.7 | ) | |||||||||
| At the end of the year | 153.3 | 87.3 | 55.0 | |||||||||
| 7 | Inventories |
| 2006 | 2005 | |||||||
| Finished products and work-in-process | 986.9 | 848.5 | ||||||
| Raw materials, production inputs and packaging | 393.4 | 407.9 | ||||||
| Maintenance material (*) | 344.6 | 347.2 | ||||||
| Advances to suppliers | 64.0 | 47.3 | ||||||
| Imports in transit and others | 17.6 | 10.2 | ||||||
| Provision for adjustment to realization value | (16.3 | ) | (17.9 | ) | ||||
| Total | 1,790.2 | 1,643.2 | ||||||
| Long-term maintenance material(*) | (22.9 | ) | (75.8 | ) | ||||
| Current assets | 1,767.3 | 1,567.4 | ||||||
| (*) | Based on management’s expectation of utilization, part of the maintenance materials inventory was reclassified to long-term maintenance materials. |
| 2006 | 2005 | 2004 | ||||||||||
| At beginning of the year | 17.9 | 12.8 | ||||||||||
| Additions and (reduction)charge to statement of operations | (1.6 | ) | 5.1 | 12.8 | ||||||||
| At the end of the year | 16.3 | 17.9 | 12.8 | |||||||||
F-34
Table of Contents
at December 31, 2006, 2005 and 2004
All amounts in millions ofreais,unless otherwise indicated
| 8 | Related parties |
| Balances at December 31, 2006 | ||||||||||||||||||||||||||||||||
| Long-term | ||||||||||||||||||||||||||||||||
| Current asset | receivables | Current liabilities | Long-term liabilities | |||||||||||||||||||||||||||||
| Trade | ||||||||||||||||||||||||||||||||
| accounts | Related | Related | Related | |||||||||||||||||||||||||||||
| receivable | parties | Suppliers | Debentures | parties | Suppliers | Debentures | Parties | |||||||||||||||||||||||||
Jointly-controlled companies | ||||||||||||||||||||||||||||||||
| CETREL | 0.6 | 2.0 | ||||||||||||||||||||||||||||||
| Copesul | 1.7 | 358.5 | ||||||||||||||||||||||||||||||
| Petroflex | 17.1 | |||||||||||||||||||||||||||||||
Associated company | ||||||||||||||||||||||||||||||||
| Borealis | 2.8 | |||||||||||||||||||||||||||||||
Related parties | ||||||||||||||||||||||||||||||||
| Refinaria Alberto Pasqualini — REFAP S.A. (related party to Copesul) | 1.2 | 5.8 | ||||||||||||||||||||||||||||||
| Ipiranga Petroquímica S.A. (related party to Copesul) | 4.6 | 1.0 | ||||||||||||||||||||||||||||||
| CNO | 7.7 | 6.7 | ||||||||||||||||||||||||||||||
| Monsanto Nordeste S.A. (related party to CETREL) | 0.2 | 2.8 | ||||||||||||||||||||||||||||||
| ODBPAR | 1,130.8 | |||||||||||||||||||||||||||||||
| Petrobras | 49.7 | 38.8 | 615.8 | 17.6 | ||||||||||||||||||||||||||||
| Petrobras Distribuidora S.A. | 0.1 | 6.5 | ||||||||||||||||||||||||||||||
| Petroquímica União S.A. (related party to Petroflex) | 3.0 | |||||||||||||||||||||||||||||||
| Unipar Comércio e Distribuidora S.A. ( related party to Petroflex) | ||||||||||||||||||||||||||||||||
| Other | 1.9 | |||||||||||||||||||||||||||||||
At December 31, 2006 | 85.1 | 40.7 | 997.9 | 1,130.8 | 17.6 | 4.8 | ||||||||||||||||||||||||||
F-35
Table of Contents
at December 31, 2006, 2005 and 2004
All amounts in millions ofreais,unless otherwise indicated
| Balances at December 31, 2005 | ||||||||||||||||||||||||||||||||
| Long-term | ||||||||||||||||||||||||||||||||
| Current assets | receivables | Current liabilities | Long -term liabilities | |||||||||||||||||||||||||||||
| Trade | ||||||||||||||||||||||||||||||||
| accounts | Related | Related | Related | Related | ||||||||||||||||||||||||||||
| receivable | parties | parties | Suppliers | Debentures | parties | Suppliers | Parties | |||||||||||||||||||||||||
Jointly-controlled companies | ||||||||||||||||||||||||||||||||
| CETREL | 0.9 | 3.1 | ||||||||||||||||||||||||||||||
| Copesul | 0.4 | 353.2 | ||||||||||||||||||||||||||||||
| Petroflex | 41.4 | |||||||||||||||||||||||||||||||
| Politeno | 18.5 | |||||||||||||||||||||||||||||||
Associated company | ||||||||||||||||||||||||||||||||
| Borealis | 8.7 | |||||||||||||||||||||||||||||||
Related parties | ||||||||||||||||||||||||||||||||
| Refinaria Alberto Pasqualini — REFAP S.A. (related party to Copesul) | 7.9 | 0.3 | ||||||||||||||||||||||||||||||
| Ipiranga Petroquímica S.A. (related party to Copesul) | 12.5 | 0.5 | ||||||||||||||||||||||||||||||
| CNO | 0.6 | 12.3 | ||||||||||||||||||||||||||||||
| Monsanto Nordeste S.A. (related party to CETREL) | 3.0 | |||||||||||||||||||||||||||||||
| ODBPAR | 999.3 | |||||||||||||||||||||||||||||||
| Petrobras | 0.1 | 35.3 | 59.1 | 21.5 | ||||||||||||||||||||||||||||
| Petrobras Distribuidora S.A. | 0.1 | 20.9 | 1.6 | |||||||||||||||||||||||||||||
| Other | 5.3 | |||||||||||||||||||||||||||||||
At December 31, 2005 | 89.6 | 0.6 | 40.6 | 447.2 | 999.3 | 3.1 | 23.1 | 3.0 | ||||||||||||||||||||||||
F-36
Table of Contents
at December 31, 2006, 2005 and 2004
All amounts in millions ofreais,unless otherwise indicated
| Transactions | ||||||||||||||||||||||||||||||||||||
| 2006 | 2005 | 2004 | ||||||||||||||||||||||||||||||||||
| Utilities, | Utilities, | Utilities, | ||||||||||||||||||||||||||||||||||
| Products | services and | Interest | Products | services and | Interest | Products | services and | Interest | ||||||||||||||||||||||||||||
| sales/ | raw material | income and | sales/ | raw material | income and | sales/ | raw material | income and | ||||||||||||||||||||||||||||
| revenues | purchases | (expenses) | revenues | purchases | (expenses) | revenues | purchases | (expenses) | ||||||||||||||||||||||||||||
Subsidiary | ||||||||||||||||||||||||||||||||||||
| Politeno | ||||||||||||||||||||||||||||||||||||
Jointly — controlled companies | ||||||||||||||||||||||||||||||||||||
| Copesul | 12.2 | 1,941.9 | 4.5 | 1,814.3 | (1.7 | ) | 1.6 | 1,659.7 | (42.5 | ) | ||||||||||||||||||||||||||
| Cetrel | 0.6 | 11.2 | 0.7 | 13.6 | 0.7 | 12.5 | ||||||||||||||||||||||||||||||
| Petroflex | 365.5 | 1.7 | 353.2 | 312.2 | ||||||||||||||||||||||||||||||||
| Politeno | 166.7 | 696.0 | 623.1 | |||||||||||||||||||||||||||||||||
Associated companies | ||||||||||||||||||||||||||||||||||||
| Borealis | 122.1 | 128.5 | 141.3 | |||||||||||||||||||||||||||||||||
Related parties | ||||||||||||||||||||||||||||||||||||
| Refinaria Alberto Pasqualini — REFAP S.A. (related party of Copesul) | 22.8 | 264.9 | 35.8 | 636.5 | 114.3 | |||||||||||||||||||||||||||||||
| Ipiranga Petroquímica S.A. (related party of Copesul) | 555.5 | 5.7 | 1,207.2 | 25.6 | 1.2 | 504.8 | 28.2 | 2.0 | ||||||||||||||||||||||||||||
| Construtora Norberto Odebrecht S.A. | 136.2 | 109.5 | 32.5 | |||||||||||||||||||||||||||||||||
| Nitroclor Produtos Químicos (related party of Cetrel) | 0.8 | |||||||||||||||||||||||||||||||||||
| Monsanto Nordeste S.A. (related party of Cetrel) | 3.7 | 2.5 | ||||||||||||||||||||||||||||||||||
| ODBPAR | (131.5 | ) | ||||||||||||||||||||||||||||||||||
| Petrobras (*) | 78.8 | 5,390.5 | 3.4 | 5,116.0 | 3.8 | 4,190.2 | ||||||||||||||||||||||||||||||
| Petrobras Distribuidora S.A. | 298.1 | 195.4 | 4.0 | 164.5 | ||||||||||||||||||||||||||||||||
| Petroquímica União (related party of Petroflex) | 22.9 | |||||||||||||||||||||||||||||||||||
| Pronor (related party of Cetrel) | 1.6 | |||||||||||||||||||||||||||||||||||
| Other | 2.5 | 1.9 | ||||||||||||||||||||||||||||||||||
| 1,330.4 | 8,071.4 | 5.1 | 2,425.9 | 7,910.9 | (128.2 | ) | 1,592.6 | 6,201.9 | (38.6 | ) | ||||||||||||||||||||||||||
| (*) | The Company is dependent on Petrobras for supply of raw materials. |
F-37
Table of Contents
at December 31, 2006, 2005 and 2004
All amounts in millions ofreais,unless otherwise indicated
| Company | Products/inputs | |
| Borealis / Cayman / Lantana / Braskem America | Thermoplastic resins | |
| Braskem Inc. | Basic petrochemicals | |
| Polialden / Politeno | Ethylene and utilities | |
| Petroflex | Butadiene | |
| Petrobras | Gasoline |
| Company | Products/inputs/services | |
| CINAL / Cetrel | Utilities, treatment and incineration of waste | |
| Copesul | Ethylene, propane and utilities | |
| Petrobras | Naphtha | |
| Petrobras Distribuidora | Fuel | |
| Polialden | Thermoplastic resins | |
| CNO | Construction and maintenance services | |
| Tegal | Gas storage services |
F-38
Table of Contents
at December 31, 2006, 2005 and 2004
All amounts in millions ofreais,unless otherwise indicated
| 9 | Taxes recoverable |
| 2006 | 2005 | |||||||
| Excise tax (IPI) (standard operations) | 63.0 | 69.2 | ||||||
| Value-added Tax on Sales and Services (ICMS) (i) | 936.3 | 556.9 | ||||||
| Social Integration Program (PIS) and Social Contribution on Revenues (Cofins) | 118.5 | 40.8 | ||||||
| Import duty | 22.4 | 18.2 | ||||||
| Social Investment Fund (Finsocial) | 12.1 | 14.5 | ||||||
| PIS — Decrees-Law 2445 and 2449/88 | 62.0 | 60.2 | ||||||
| Income tax and social contribution | 56.9 | 62.3 | ||||||
| Tax on Net Income — ILL | 17.4 | 27.8 | ||||||
| Other | 72.6 | 34.4 | ||||||
| Total | 1,361.2 | 884.3 | ||||||
| Current assets | (408.1 | ) | (324.9 | ) | ||||
| Non-current assets | 953.1 | 559.4 | ||||||
F-39
Table of Contents
at December 31, 2006, 2005 and 2004
All amounts in millions ofreais,unless otherwise indicated
| (i) | ICMS |
| . | Obtaining from the Rio Grande do Sul state authorities an authorization for transfer of these credits to third parties, as prescrided by the Agreement TSC 036 of 2006 (published in the Official Gazette on October 19, 2006). | |
| . | Authorization from the State of Bahia Government to expand the percentage of reduction in the calculation basis of ICMS levied on imported petrochemical naphtha from 40% to 60%, pursuant to paragraphs 9 and 10, article 347 of the State of Bahia ICMS Regulation (Decree 9681/2005). | |
| . | Increasing the ICMS tax base in connection with the sale of funds to refiner (from 40% to 100%), as per article 347 of the Bahia State ICMS Regulations. |
F-40
Table of Contents
at December 31, 2006, 2005 and 2004
All amounts in millions ofreais,unless otherwise indicated
| . | Replacing the exports of co-products by domestic market transactions with identified clients. | |
| . | Starting feedstock imports under specific customs prerogatives, thus ensuring a lower generation of ICMS credits. |
F-41
Table of Contents
at December 31, 2006, 2005 and 2004
All amounts in millions ofreais,unless otherwise indicated
| 10 | Judicial deposits and compulsory loan — Long-term assets |
| 2006 | 2005 | |||||||
Judicial deposits | ||||||||
| Tax contingencies | 29.7 | 12.7 | ||||||
| Labor and other claims | 41.3 | 11.6 | ||||||
Compulsory loan | ||||||||
| Eletrobrás | 19.5 | 12.2 | ||||||
| 90.5 | 36.5 | |||||||
F-42
Table of Contents
at December 31, 2006, 2005 and 2004
All amounts in millions ofreais,unless otherwise indicated
| 11 | Investments | |
| (a) | Information on investments |
| Number of shares of quotas held (thousands) | ||||||||||||||||||||||||||||||||||||
| Interest in | Interest in | |||||||||||||||||||||||||||||||||||
| 2006 | 2005 | total capital (%) | voting capital (%) | |||||||||||||||||||||||||||||||||
| Common | Pref. | |||||||||||||||||||||||||||||||||||
| shares | shares | Quotas | Total | Total | 2006 | 2005 | 2006 | 2005 | ||||||||||||||||||||||||||||
Jointly-controlled companies | ||||||||||||||||||||||||||||||||||||
| Cetrel | 730 | 730 | 715 | 49.03 | 48.02 | 49.03 | 48.02 | |||||||||||||||||||||||||||||
| CODEVERDE | 9,755 | 9,755 | 9,639 | 35.55 | 35.52 | 35.55 | 35.52 | |||||||||||||||||||||||||||||
| Copesul | 44,255 | 44,255 | 44,255 | 29.46 | 29.46 | 29.46 | 29.46 | |||||||||||||||||||||||||||||
| Petroflex | 4,759 | 2,321 | 7,080 | 7,080 | 20.12 | 20.12 | 20.14 | 20.14 | ||||||||||||||||||||||||||||
| Petroquímica Paulínia | 67,582 | 67,582 | 45,000 | 60.00 | 93.75 | 60.00 | 93.75 | |||||||||||||||||||||||||||||
| Politeno | 22,466,167 | 33.96 | 33.96 | |||||||||||||||||||||||||||||||||
Associated companies | ||||||||||||||||||||||||||||||||||||
| Borealis | 18,949 | 18,949 | 18,949 | 20.00 | 20.00 | 20.00 | 20.00 | |||||||||||||||||||||||||||||
| Rionil | 3,061 | 3,061 | 3,061 | 33.33 | 33.33 | 33.33 | 33.33 | |||||||||||||||||||||||||||||
| Sansuy | 271 | 271 | 271 | 20.00 | 20.00 | 20.00 | 20.00 | |||||||||||||||||||||||||||||
| Adjusted shareholders’ | ||||||||||||||||
| Adjusted net income (loss) | equity (unsecured | |||||||||||||||
| for the year | liabilities) | |||||||||||||||
| 2006 | 2005 | 2006 | 2005 | |||||||||||||
Associated companies | ||||||||||||||||
| Borealis | 13.7 | 13.4 | 117.9 | 114.15 | ||||||||||||
| Rionil | 0.2 | 6.1 | 5.8 | |||||||||||||
| Sansuy | (10.2 | ) | (12.7 | ) | (25.4 | ) | 5.0 | |||||||||
F-43
Table of Contents
at December 31, 2006, 2005 and 2004
All amounts in millions ofreais, unless otherwise indicated
| Associated companies | ||||||||||||||||||||||||
| 2006 | 2005 | |||||||||||||||||||||||
| Borealis | Rionil | Sansuy | Other | Total | Total | |||||||||||||||||||
At January 1 | 22.8 | 2.0 | 1.0 | 25.8 | 4.9 | |||||||||||||||||||
| Transfer of investment | 22.1 | |||||||||||||||||||||||
| Equity in the results | 2.8 | (1.0 | ) | 1.8 | 0.8 | |||||||||||||||||||
| Dividends | (2.0 | ) | (2.0 | ) | (2.0 | ) | ||||||||||||||||||
| Other | 0.6 | 0.6 | ||||||||||||||||||||||
At December 31 | 23.6 | 2.0 | 0.6 | 26.2 | 25.8 | |||||||||||||||||||
| Quotation (R$) | Trading | |||||||||||||
| Type | Code | Dec/2006 | Dec/2005 | unit | ||||||||||
| Copesul | ON | CPSL3 | 38.10 | 27.9 | 1 share | |||||||||
| Petroflex | ON | PEFX3 | 14.40 | 16.61 | 1 share | |||||||||
| PNA | PEFX5 | 14.85 | 16.26 | 1 share | ||||||||||
| (b) | Information on investments in the main jointly-controlled companies, included in proportionally consolidated under CVM Instruction 247 | |
| Copesul | ||
| Copesul is engaged in the manufacture, sale, import and export of chemical, petrochemical and fuel products and the production and supply of utilities, such as steam, water, compressed air and electric energy to the companies in the Triunfo Petrochemical Complex in the State of Rio Grande do Sul. Copesul also provides other services to these companies, including management of logistic services related to its waterway and terrestrial terminals. Goodwill on this investment is based on future profitability and will be amortized up to August 2011. | ||
| Politeno | ||
| As stated in Note 1(b)(viii), on April 4, 2006, the Company acquired the control of Politeno. As result, for dates and periods after April 4, 2006, the Company fully consolidates Politeno. Politeno is engaged in the manufacture, processing, direct or indirect sale, consignment, export, import and transportation of polyethylene and by-products, as well as the participation in other companies. |
F-44
Table of Contents
at December 31, 2006, 2005 and 2004
All amounts in millions ofreais, unless otherwise indicated
| The main raw material for all of its products is ethylene, which is supplied by Braskem. Politeno operates an industrial plant in Camaçari — Bahia. Goodwill on this investment is based on future profitability and will be amortized up to August 2011. | ||
| Cetrel | ||
| The principal activities of Cetrel are to provide services related to environmental protection and controls to petrochemical companies. Goodwill on this investment is based on the fair value of assets and will be amortized up to July 2015. | ||
| Petroquímica Paulínia | ||
| On September 16, 2005, Braskem and Petroquisa formed Petroquímica Paulínia, which will be responsible for the implementation and operation of a new polypropylene plant to be built at Paulínia – São Paulo. This plant will use polymer-grade propylene supplied by Petrobrás as its main raw material. Operations are scheduled to start by the beginning of 2008, using advanced Braskem technology. The assignment of the right to use this technology gave rise to a gain of R$ 23.3 for the Company. | ||
| Petroflex | ||
| Petroflex is a leading producer of synthetic rubber in Latin America and produces styrene-butadiene, polybutadiene, liquid hidroxylated polybutadiene and other elastomers. The main raw material for all of its products is butadiene, which is supplied by Braskem. Petroflex operates three plants in Brazil located in Rio de Janeiro, Pernambuco and Rio Grande do Sul. |
F-45
Table of Contents
at December 31, 2006, 2005 and 2004
All amounts in millions ofreais, unless otherwise indicated
| 12 | Property, plant and equipment, and Intangible assets |
| Average | ||||||||||||||||||||
| 2006 | 2005 | annual | ||||||||||||||||||
| Accumulated | depreciation | |||||||||||||||||||
| Cost | depreciation | Net | Net | rates (%) | ||||||||||||||||
| Property, plant and equipment | ||||||||||||||||||||
| Land | 61.3 | 61.3 | 43.4 | |||||||||||||||||
| Buildings and improvements | 1,067.1 | (475.0 | ) | 592.1 | 554.6 | 2.4 | ||||||||||||||
| Machinery, equipment and facilities | 9,086.3 | (4,789.4 | ) | 4,296.9 | 4,609.7 | 7.6 | ||||||||||||||
| Mines and wells | 28.5 | (23.7 | ) | 4.8 | 3.9 | 10.9 | ||||||||||||||
| Furniture and fixtures | 60.0 | (43.5 | ) | 16.5 | 6.9 | 10.0 | ||||||||||||||
| Information technology equipment | 85.7 | (63.8 | ) | 21.9 | 12.8 | 20.0 | ||||||||||||||
| Maintenance stoppages in progress | 77.8 | 77.8 | 103.1 | |||||||||||||||||
| Constructions in progress | 1,523.8 | 1,523.8 | 960.1 | |||||||||||||||||
| Other | 173.8 | (80.2 | ) | 93.6 | 69.9 | 11.2 | ||||||||||||||
| 12,164.3 | (5,475.6 | ) | 6,688.7 | 6,364.4 | ||||||||||||||||
| Intangible assets | ||||||||||||||||||||
| Brands and patents | 0.7 | (0.6 | ) | 0.1 | 10.0 | |||||||||||||||
| Technology | 45.8 | (32.0 | ) | 13.8 | 18.1 | 10.0 | ||||||||||||||
| Licensing rights for internal use of operating systems | 131.7 | (16.1 | ) | 115.6 | 10.3 | 10.0 | ||||||||||||||
| 178.2 | (48.7 | ) | 129.5 | 28.4 | ||||||||||||||||
| 12,342.5 | (5,524.3 | ) | 6,818.1 | 6,392.8 | ||||||||||||||||
F-46
Table of Contents
at December 31, 2006, 2005 and 2004
All amounts in millions ofreais, unless otherwise indicated
| 13 | Deferred Charges |
| Average | ||||||||||||||||||||
| 2006 | 2005 | annual | ||||||||||||||||||
| Accumulated | amortization | |||||||||||||||||||
| Cost | amortization | Net | Net | rates (%) | ||||||||||||||||
| Organization and system implementation expenses | 381.9 | (247.9 | ) | 134.0 | 163.4 | 20.0 | ||||||||||||||
| Expenditures for structured transactions | 382.5 | (223.8 | ) | 158.7 | 223.8 | 20.0 | ||||||||||||||
| Goodwill on acquisition of investments | 2,379.5 | (848.5 | ) | 1,531.0 | 1,768.9 | 14.2 | ||||||||||||||
| Research and development | 102.7 | (54.8 | ) | 47.9 | 56.6 | 11.8 | ||||||||||||||
| Pre-operating expenses and other items | 25.9 | (6.3 | ) | 19.6 | 19.0 | 13.5 | ||||||||||||||
| 3,272.5 | (1,381.3 | ) | 1,891.2 | 2,231.7 | ||||||||||||||||
F-47
Table of Contents
at December 31, 2006, 2005 and 2004
All amounts in millions ofreais, unless otherwise indicated
| 14 | Loans and financing |
| Annual financial charges | 2006 | 2005 | ||||||||||||
Foreign currency | ||||||||||||||
| U.S. dollar – denominated notes and bonds | Note 14(a) | 1,715.8 | 743.2 | |||||||||||
| Advances on foreign exchange contracts | 2006 | USD exchange variation + interest of 5.60% or fixed interest of 7.11% | 63.0 | |||||||||||
| 2005 | USD exchange variation + interest of 5.00% or fixed interest of 11.75% | 36.3 | ||||||||||||
| Export prepayments | Note 14(b) | 324.9 | 595.9 | |||||||||||
| Medium — Term Notes | Note 14(c) | 763.5 | 1,277.4 | |||||||||||
| Raw material financing | 2006 | YEN exchange variation + fixed interest of 6.70% | 1.3 | |||||||||||
| 2005 | YEN exchange variation + fixed interest of 6.90% | 2.4 | ||||||||||||
| 2006 | USD exchange variation + average interest of 5.73% | 20.9 | ||||||||||||
| 2005 | USD exchange variation + average interest of 6.68% | 45.3 | ||||||||||||
| 2006 | EUR exchange variation + average interest of 2.00% above LIBOR | 1.8 | ||||||||||||
| Permanent asset financing | 2006 | USD exchange variation + interest of 9.73% | 8.8 | |||||||||||
| 2005 | USD exchange variation + interest of 8.81% | 20.2 | ||||||||||||
| 2006/2005 | USD exchange variation + fixed interest of 7.14% | 0.6 | 13.1 | |||||||||||
| BNDES | 2006 | Average fixed interest of 10.00% + post-fixed restatement (UMBNDES) | 40.9 | |||||||||||
| 2005 | Fixed interest of 10.43%+ post-fixed restatement (UMBNDES) | 43.9 | ||||||||||||
| 2006/2005 | USD exchange variation + average interest of 8.70% | 3.1 | 2.5 | |||||||||||
| Working capital | 2006 | USD exchange variation + interest of 8.10% | 168.7 | |||||||||||
| 2006 | USD exchange variation + interest of 6.91% | 4.0 | ||||||||||||
| 2005 | USD exchange variation + average interest of 6.49% | 10.4 | ||||||||||||
F-48
Table of Contents
at December 31, 2006, 2005 and 2004
All amounts in millions ofreais, unless otherwise indicated
| Annual financial charges | 2006 | 2005 | ||||||||||||
Local currency | ||||||||||||||
| Working capital | 2006/2005 | Fixed interest of 13.42% + post-fixed restatement (CDI) | 6.7 | 73.8 | ||||||||||
| Investment fund in credit rights | 2006/2005 | Note 14(g) | 422.3 | 646.3 | ||||||||||
| Government Agency for Machinery and Equipment Financing (“FINAME”) | 2006/2005 | Fixed interest of 7.50% + TJLP | 12.9 | 30.2 | ||||||||||
| National Bank for Economic and Social Development (“BNDES”) | 2006 | Fixed interest of 4.00% +TJLP | 346.0 | |||||||||||
| 2005 | Fixed interest of 3.94% +TJLP | 145.1 | ||||||||||||
| Bank of the Northeast of Brazil (“BNB”) | 2006 | Fixed interest of 11.81%. | 135.0 | |||||||||||
| 2005 | Fixed interest of 11.90%. | 62.9 | ||||||||||||
| Government Agency for Studies and Projects (“FINEP”) | 2006/2005 | USD exchange variation + post-fixed restatement (TJLP) | 83.6 | 31.5 | ||||||||||
| Loan for acquisition of shares | 2005 | Fixed interest of 4.00% + post-fixed restatement (TJLP) | 176.3 | |||||||||||
| Project financing (NEXI) | 2006/2005 | YEN exchange variation + interest of 0.95% above TIBOR | 281.9 | 283.6 | ||||||||||
| Vendor | 184.0 | 141.7 | ||||||||||||
| 4,589.7 | 4,382.0 | |||||||||||||
| Less: Current liabilities | (653.9 | ) | (1,120.4 | ) | ||||||||||
| Non-current liabilities | 3,935.8 | 3,261.6 | ||||||||||||
| CDI | = Interbank Certificate of Deposit Rate. | |
| UMBNDES | = BNDES Monetary Unit. | |
| LIBOR | = London Interbank Offered Rate. | |
| TJLP | = Long-term Interest Rate, published by the Brazilian Central Bank. | |
| TIBOR | = Tokyo Interbank Rate. |
F-49
Table of Contents
at December 31, 2006, 2005 and 2004
All amounts in millions ofreais, unless otherwise indicated
| (a) | U.S. dollar denominated notes and bonds | |
| In April 2006, the Company issued perpetual bonds in an aggregate principal amount of US$ 200.0 million. These bonds bear annual interest of 9.00%, payable on a quarterly in arrears on January 28, April 28, July 28 and October 28 of each year, commencing on July 28, 2006. Funds raised were used for working capital purposes and acquisition of Politeno shares. | ||
| In September 2006, the Company issued bonds in an aggregate principal amount of US$ 275.0 million, with a 8% coupon and maturity in ten years. Funds raised were used mainly to repurchase 3rd tranche of the Medium-Term Notes (“MTN”) (Note 14 (c)). | ||
| The Company’s U.S. dollar denominated notes and bonds positions are summarized as follow: |
| Amounts in | Interest | |||||||||||||||||||
| Date | US$ million | Maturity | % p.a. | 2006 | 2005 | |||||||||||||||
| Jun/1997 | 150.0 | Jun/2007 | 9.00 | 321.1 | 351.6 | |||||||||||||||
| Jul/1997 | 250.0 | Jun/2015 | 9.38 | 35.5 | 39.0 | |||||||||||||||
| Jun/2005 | 150.0 | None | 9.75 | 322.0 | 352.6 | |||||||||||||||
| Apr/2006 | 200.0 | None | 9.00 | 435.2 | ||||||||||||||||
| Sep/2006 | 275.0 | Jan/2017 | 8.00 | 602.0 | ||||||||||||||||
| 1,715.8 | 743.2 | |||||||||||||||||||
| (b) | Export prepayments | |
| The Company’s export prepayments positions are summarized as follow: |
| Amount in | ||||||||||||||||||||
| Date | US$ million | Maturity | Interest % p.a. | 2006 | 2005 | |||||||||||||||
| Dec/2002 | 97.2 | Jun/2006 | 1.25 + 6-month LIBOR | 37.3 | ||||||||||||||||
| Mar/2003 | 15.0 | Mar/2006 | 2.10 + 6-month LIBOR | 9.4 | ||||||||||||||||
| Jun/2004 | 200.0 | Jun/2009 | 1.45 + 6-month LIBOR | 268.2 | 410.7 | |||||||||||||||
| Aug/2004 | 50.0 | Oct/2006 | 3.00 + 3-month LIBOR | 47.5 | ||||||||||||||||
| Jan/2005 | 45.0 | Jan/2008 | 1.55 + 3-month LIBOR | 44.3 | 87.1 | |||||||||||||||
| Jan/2005 | 28.0 | Jan/2008 | 1.66 + 6-month LIBOR | 12.4 | 3.9 | |||||||||||||||
| 324.9 | 595.9 | |||||||||||||||||||
F-50
Table of Contents
at December 31, 2006, 2005 and 2004
All amounts in millions ofreais, unless otherwise indicated
| (c) | Medium-Term Notes (“MTN”) program | |
| The outstanding principal amounts of notes under the MTN program at December 31, 2006 and 2005 are as follows: |
| Amount in | ||||||||||||||||||||||||
| Issue | US$ million | Date | Maturity | Interest p.a. | 2006 | 2005 | ||||||||||||||||||
3rd tranche | 275.0 | Nov/2003 | Nov/2008 | 12.50 | % | 197.5 | 657.7 | |||||||||||||||||
4th tranche | 250.0 | Jan/2004 | Jan/2014 | 11.75 | % | 566.0 | 619.7 | |||||||||||||||||
| 763.5 | 1,277.4 | |||||||||||||||||||||||
| (d) | FINAME, BNDES and BNB | |
| These loans relate to various transactions for the increase in production capacity, as well as environmental programs, operating control centers, laboratory and waste treatment stations. Principal interest and other financial charges are payable monthly up to June 2016. | ||
| In June 2005, a further BNDES credit line was approved, in the amount of R$ 384.6, of which at December 31, 2006 an amount of R$ 295.3 was used by the Company. | ||
| (e) | Loan for acquisition of shares | |
| The Company borrowed funds to finance the acquisition of shares related to the acquisition from BNDESPAR of one billion shares of Braskem Participações S.A. in September 2001 by Nova Camaçari Participações S.A. This loan was fully paid in August 2006. | ||
| (f) | Project financing (NEXI) | |
| In March and September 2005, the Company obtained Japanese yen–denominated loans from Nippon Export and Investment Insurance, in the amount of ¥ 5,256.5 million (R$ 136.5) and ¥ 6,628.2 million (R$ 141.5), respectively, to finance several investment projects, including the “Braskem +” program. These loans bear annual interest of 0.95% above the Tokyo Interbank Rate (TIBOR) plus exchange variation, payable semiannually. | ||
| Principal is payable in 11 installments, commencing in March 2007, with a final maturity date in March 2012. The financing contracts include insurance that guarantees 95% of commercial risks and 97.5% of political risks. |
F-51
Table of Contents
at December 31, 2006, 2005 and 2004
All amounts in millions ofreais, unless otherwise indicated
| As part of its risk management policy (Note 22), the Company entered into a swap contract in the total amount of these loans, which, in effect, change the annual interest rate and exchange variation to 101.59% of CDI for the tranche drawn down in March 2005, and 103.98% of CDI and 104.29% of CDI for two tranches drawn down in September 2005. The swap contract was signed with a leading foreign bank and its maturity, currencies, rates and amounts are perfectly matched to the financing contracts. The effect of this swap contract is recorded in financial results, under monetary variation of financing (Note 22). | ||
| (g) | Investment fund in credit rights | |
| This financing arises from the consolidation of investment funds in credit rights (“FIDC”), named Chemical and Chemical II. FIDC raise funds by selling senior quotas with remuneration linked to the variation of CDI. FIDC’s charter also provide for the issuer subordinated quotas in order to maintain the respective asset balance. These quotas are remunerated in accordance with the funds profitability. At December 31, 2006, the subordinated quotas in these Fund were owned by the Company. With the resources available, the funds purchase trade bills issued by Braskem, taking into account the selection criteria prescribed by the FIDC manager (Note (6)). | ||
| In December 2006, the Chemical Fund redeemed its senior quotas (December 31, 2005 — R$ 201.6) and their remuneration was 113.5% of CDI. | ||
| The Chemical II fund issued the first tranche of senior quotas in December 2005, remunerated at 103.75% of CDI and redemption anticipated for December 2008. At December 31, 2006, the balance of these quotas amounted to R$ 401.4 (2005 – R$ 404.1). | ||
| (h) | Repayment schedule and guarantees | |
| Long-term loans mature as follows: |
| 2006 | 2005 | |||||||
| 2007 | 348.5 | |||||||
| 2008 | 876.8 | 1,284.1 | ||||||
| 2009 | 260.3 | 157.3 | ||||||
| 2010 | 193.3 | 86.3 | ||||||
| 2011 | 127.8 | 49.4 | ||||||
| 2012 and thereafter | 2,477.6 | 1,336.0 | ||||||
| 3,935.8 | 3,261.6 | |||||||
F-52
Table of Contents
at December 31, 2006, 2005 and 2004
All amounts in millions ofreais, unless otherwise indicated
| Total | Loan | |||||||||||
| Maturity | guaranteed | Amount | Guarantees | |||||||||
| BNB | Jan/2016 | 125.3 | 127.3 | Machinery and equipment | ||||||||
| BNDES | Jan/2012 | 302.8 | 302.8 | Machinery and equipment | ||||||||
| 1st and 12nd series debentures | Jun/2009 | 1,282.5 | 2,107.4 | Shares and credit rights | ||||||||
| NEXI | Mar/2012 | 213.9 | 281.9 | Insurance premium | ||||||||
| FINEP | Mar/2012 | 76.6 | 76.6 | Surety bond | ||||||||
| Other institutions | Mar/2007 to Dec/2008 | 57.6 | 186.0 | Surety/ endorsement and promissory notes | ||||||||
| Total | 2,058.7 | 3,082.0 | ||||||||||
| 15 | Debentures | |
| The debentures activities can be summarized as follows: |
| 2006 | 2005 | |||||||
| At January 1 | 1,608.6 | 1,172.8 | ||||||
| Accrued interest and financial charges | 248.6 | 229.4 | ||||||
| Issuance | 532.5 | 300.0 | ||||||
| Repayments | (249.8 | ) | (93.6 | ) | ||||
| Balance at the end of the year | 2,139.9 | 1,608.6 | ||||||
| Less: Current liabilities | (1,157.7 | ) | (9.3 | ) | ||||
| Non-current liabilities | 982.2 | 1,599.3 | ||||||
F-53
Table of Contents
at December 31, 2006, 2005 and 2004
All amounts in millions ofreais, unless otherwise indicated
| (a) | 12th public issue | |
| On September 29, 2004, the Company issued and sold the 12th series of its debentures in the aggregate principal amount of R$ 300.0. These debentures are not convertible into shares and have a final maturity date of June 1, 2009. At November 2006, the Company redeemed in advance 1,500 of the 12th series of debentures. Upon redemption, all of these debentures were cancelled. | ||
| (b) | 13th and 14th public issues | |
| On June 30, 2005, the Company issued and sold the 13th series of its non-convertible debentures, in an aggregate principal amount of R$ 300.0. | ||
| On September 1, 2006, the Company issued and sold the 14th series of its non-convertible debentures, in an aggregate principal amount of R$ 500.0. | ||
| (c) | Jointly-controlled company Petroflex issuance | |
| In January 2006, the jointly-controlled company Petroflex issued and sold the 4th series of its public and non-convertible debentures, in an aggregate principal amount of R$ 160.0, comprising 16,000 debentures with unit value of R$ 10.0, maturity in December 2010 and remuneration of 104.5% of CDI. | ||
| The Company’s debentures positions are summarized as follows: |
| Payment of annual | ||||||||||||||||||||
| Issue | Unit value | Maturity | Annual financial charges | financial charges | 2006 | 2005 | ||||||||||||||
| 1st (i) | R$10 | Jul/2007 | TJLP variation + interest of 5% p.a. | Upon maturity | 1,130.8 | 999.3 | ||||||||||||||
| 4th (ii) | R$10 | Dec/2010 | 104.00% of CDI | Triennial as from Jan/2009 | 32.5 | |||||||||||||||
| 12th | R$100 | Jun/2009 | 117.00% of CDI | Biannually as from Dec/2004 | 151.7 | 304.9 | ||||||||||||||
| 13th | R$10 | Jun/2009 | 104.10% of CDI | Biannually as from Dec/2005 | 303.1 | 304.4 | ||||||||||||||
| 14th | R$10 | Sep/2011 | 103.50% of CDI | Biannually as from Mar/2007 | 521.8 | |||||||||||||||
| 2,139.9 | 1,608.6 | |||||||||||||||||||
| (i) | Private issue of debentures convertible into class A preferred shares and held by ODBPARINV (Note 8). | |
| (ii) | Private issue of debentures not convertible into shares emitted by the jointly-controlled Petroflex. |
F-54
Table of Contents
at December 31, 2006, 2005 and 2004
All amounts in millions ofreais, unless otherwise indicated
| 16 | Taxes and contributions payable – Long-term liabilities |
| 2006 | 2005 | |||||||
IPI credits offset | ||||||||
| IPI – export credit | (i) | 647.8 | 550.3 | |||||
| IPI – zero rate | (ii) | 505.9 | 466.3 | |||||
| IPI – consumption materials and property, plant and equipment | 54.7 | 37.7 | ||||||
Other taxes and contributions payable | ||||||||
| PIS /COFINS — Law 9718/98 | (iii) | 146.8 | 316.1 | |||||
| Education contribution, SAT and INSS | 37.1 | 40.8 | ||||||
| PAES-Law 10684 | (iv) | 36.6 | 43.2 | |||||
| Other | 21.5 | 9.8 | ||||||
(-) Judicial deposits | (128.4 | ) | (139.8 | ) | ||||
| 1,322.0 | 1,324.4 | |||||||
| The Company has brought legal actions challenging certain changes in tax laws and defending, among other things, the right to IPI credits on the purchase of raw materials and the export of products. With regard to the contingent IPI credits, which had been offset against several federal taxes payable, the Company recorded liabilities to eliminate the contingent gain and accrued interest on these liabilities based on the SELIC rate. The Company has not recorded tax assets for uncompensated credits that have not been used to offset other tax obligations as they are considered contingent assets pending realization. | ||
| (i) | IPI — export credit | |
| The Company and its merged companies OPP Química, Trikem and Nitrocarbono challenges the term of effectiveness of the IPI tax credit (crédito-prêmio) introduced by Decree-law 491 of 1969 as an incentive to manufactured product exports. Most lower court decisions have been favorable, but such favorable decisions may still be appealed. | ||
| According to its external legal advisors, of the Company believes that the probability of losses are possible. The Superior Court of Justice (STJ) is currently entertaining an identical lawsuit lodged by another taxpayer (judgment is currently on hold). Most of the STJ justices who have cast their votes to date recognized that such tax benefit continued after 1983. | ||
| The liability was recorded to eliminate the contingent gain for the credits offset. | ||
| (ii) | IPI — Purchase of zero-rated materials | |
| Merged companies OPP Química, Trikem and Polialden have filed lawsuits in the state of São Paulo, Bahia and Alagoas claiming IPI tax credits from acquisition of raw materials and inputs that are exempt, non-taxed or taxed at a zero rate. Most lower court decisions have been favorable, but such favorable decisions may still be appealed. The Company’s external legal advisors are of opinion that it is possible that we will lose these cases; the STF itself is |
F-55
Table of Contents
at December 31, 2006, 2005 and 2004
All amounts in millions ofreais, unless otherwise indicated
| revisiting this matter as well. A liability has been recorded to eliminate the contingent gain recognized for the amounts offset with other federal taxes. | ||
| In entertaining another case over this same issue last February 2007, the STF found against the right to offset IPI tax credits at a zero rate, with a tight majority (6 to 5). This judgment is stayed, as the STF Justices will still deliberate on the effects of such decision. Given this shift in their once-established view, the STF should now define whether such new court determination will have retrospective or only prospective effects. | ||
| (iii) | PIS/COFINS — Law 9718 of 1998 | |
| The Company and its merged companies OPP Química, Trikem and Polialden have brought a number of lawsuits to challenge the constitutionality of the expansion in the calculation basis for the period from February 1999 to November 2002 for PIS and for the period from February 1999 to January 2004 for COFINS, and also the increase in the taxe rate from 2% to 3% for COFINS, increased through Law 9718 of 1998. | ||
| In February 2006, the company received a final and conclusive favorable decision to one of these actions initiated in March 1999. Accordingly, the Company reversed the provision totaling R$ 89.6 (Note 24). | ||
| As the STF Full Bench had ruled, in November 2005, that the increase in PIS and COFINS tax basis under law 9718/98 was unconstitutional, the Company based on the opinion of its legal advisors believes that it will probably prevail in these cases. The Company has recorded a provision of R$106.9 at December 31, 2006, for these cases, which fired court decisions. | ||
| Some of these lawsuits also challenged the increase of COFINS tax rates from 2% to 3%. Based on the opinion of its legal advisors, the Company stands probable chances of loss in this specific regard. This fact, and the recent unfavorable determination from the STF, led the Company to file for voluntary dismissal of this claim in most suits and settle the debt in cash. This procedure generated a positive result of R$ 13.8 based on reduction of fines and interests that had been recorded (Note 24). | ||
| (iv) | Special Installment Program — PAES — Law 10684/03 | |
| On May 30, 2003, Law N° 10684 was published, introducing the PAES program, which offers taxpayers with liabilities to the Federal Revenue Office or the National Treasury (that have been confessed or are being challenged in the courts) the option of paying their overdue tax obligations at February 28, 2003, in up to 180 consecutive monthly installments. | ||
| The legislation provides, among other benefits, for a 50% reduction in the fines on arreas as well as the utilization of the TJLP to update the installments due (replacing the usual SELIC rate wich is more onerous). | ||
| In August 2003, merged company Trikem opted to file a voluntary dismissal of the its lawsuit against the COFINS rate increase from 2% to 3% under Law 9718 of 1998, thus qualifying for the more favorable payment conditions under the PAES program instituted by Federal Law |
F-56
Table of Contents
at December 31, 2006, 2005 and 2004
All amounts in millions ofreais, unless otherwise indicated
F-57
Table of Contents
at December 31, 2006, 2005 and 2004
All amounts in millions ofreais, unless otherwise indicated
| 17 | Income tax and social contribution on net income | |
| (a) | Income tax reconciliation |
| 2006 | 2005 | 2004 | ||||||||||
| Income before income tax and minority interest | 90.1 | 749.1 | 796.8 | |||||||||
| Income tax and social contribution benefit (expense) at statutory rate 34% | (30.6 | ) | (254.7 | ) | (270.9 | ) | ||||||
| Income tax on equity in earnings of associates | 6.1 | 3.0 | (15.4 | ) | ||||||||
| Non-deductible amortization of goodwill | (30.3 | ) | (38.2 | ) | (26.4 | ) | ||||||
| Exempt exchange losses on foreign currency | (1.9 | ) | (4.5 | ) | (2.5 | ) | ||||||
| Income tax incentives (Note 18(a)) | 5.6 | 15.5 | 17.0 | |||||||||
| Other permanent differences | (22.7 | ) | 25.9 | (7.7 | ) | |||||||
| Tax effect of Social Contribution tax exemption (c) below | 5.7 | 70.6 | 65.1 | |||||||||
| Net change in valuation allowance | 6.2 | 6.3 | 166.9 | |||||||||
| Tax on goodwill of merged subsidiary Polialden (Note 1(b)) | 75.9 | |||||||||||
| Other | (1.2 | ) | (1.2 | ) | (11.2 | ) | ||||||
Income tax expense, per consolidated statement of operations | 12.8 | (177.3 | ) | (85.1 | ) | |||||||
F-58
Table of Contents
at December 31, 2006, 2005 and 2004
All amounts in millions ofreais, unless otherwise indicated
| (b) | Deferred income tax | |
| In accordance with a pronouncement issued by IBRACON on the accounting for income tax and social contribution, supplemented by CVM Instruction Nº 371, the Company has recognized deferred tax assets as follows: |
| 2006 | 2005 | |||||||
Deferred tax assets | ||||||||
| Net operating loss carryfowards | 162.2 | 110.3 | ||||||
| Goodwill and deferred charges | 100.4 | 37.8 | ||||||
| Non-deductible accrued expenses and other temporary differences | 146.9 | 165.0 | ||||||
| Gross deferred tax assets | 409.5 | 313.1 | ||||||
| Valuation allowance | (11.9 | ) | (18.1 | ) | ||||
| Total income tax | 397.6 | 295.0 | ||||||
| Less: current deferred tax assets | (20.6 | ) | (22.0 | ) | ||||
| Long-term deferred tax assets | 377.0 | 273.0 | ||||||
Deferred tax liabilities | ||||||||
| Accelerated depreciation and other | (17.3 | ) | (10.4 | ) | ||||
| Long-term deferred tax liabilities | (17.3 | ) | (10.4 | ) | ||||
F-59
Table of Contents
at December 31, 2006, 2005 and 2004
All amounts in millions ofreais, unless otherwise indicated
| (c) | Social contribution on net income (“CSLL”) | |
| In view of the discussions over the constitutionality of Law 7689 of 1988, the Company and its merged companies OPP Química, Trikem and Polialden filed civil lawsuits against payment of social contribution. | ||
| The TRF of the 1st Region had expressly recognized the unconstitutionality of this tax, and the courts issued final and unappealable decisions favorable to the Company, the merged companies and Polialden. However, the Federal Government filed a rescission action to revoke the decisions in favor of the Company, Trikem and Polialden, arguing that after the final decision favorable to those companies the Plenary Session of the STF had declared the constitutionality of this tax, for all years in question except in 1988. As the Federal Government did not file a rescission action in the case of OPP Química, the first final and conclusive decision remained in force for OPP Química. | ||
| The decisions of lower and first appeal courts were favorable to the Federal Government; however, tax payments are still suspended. Currently, the mentioned action is awaiting final judgment of the appeals lodged to the STF and STJ. | ||
| Based on the referred STF decision, the SRF has issued tax assessment notices against the Company and its merged companies, against which administrative defense arguments have been filed. | ||
| The Company believes that it is reasonably possible that it will lose the appeals to maintain the Company’s exemption. If the appeals are not successful, the Company believes that the loss of the exemption would be effective only as from the date of a final unfavorable decision and may not be applied retroactively. For this reason, no liability has been recorded. However, we believe that it is reasonably possible that we will be required to pay these taxes retroactively. If a retroactive claim were made by the government, the exposure to the Company would be, at December 31, 2006, approximately R$ 743.0 (2005 – R$ 651.7), including interest but excluding fines. | ||
| 18 | Tax Incentives | |
| (a) | Corporate income tax | |
| Until calendar year 2011, the Company has the right to reduce by 75% the income tax on the profit arising from the sale of basic petrochemical products and utilities. The two Camaçari polyethylene plants have the same rights until calendar years 2011 and 2012. The polyvinylchloride (“PVC”) plant at Camaçari has the same right until 2013. The PVC plants in Alagoas and the polyethylene teraphthalate (“PET”) plant at Camaçari are exempt from corporate income tax calculated on the results of their industrial operations until 2008. |
F-60
Table of Contents
at December 31, 2006, 2005 and 2004
All amounts in millions ofreais, unless otherwise indicated
| Productions of caustic soda, chloride, ethylene dichloride and caprolactama enjoy the benefit of the 75% decrease in the income tax rate up to 2012. | ||
| At the end of each fiscal year, in the case of taxable profit resulting from the benefited operations, income tax calculated without giving effect to these exemptions and reduced rates is recorded as expense for the year and the income tax benefit of these exemptions and reduced rates is deducted from income tax payable and credited to a capital reserve account, which may only be used to increase capital or absorb losses. | ||
| (b) | Value-added tax — ICMS | |
| The Company has ICMS tax incentives granted by the States of Rio Grande do Sul and Alagoas, through the Company Operation Fund — FUNDOPEM and State of Alagoas Integrated Development Program - - PRODESIN, respectively. These incentives are designed to foster the installation and expansion of industrial facilities in those States. The incentive determined for the year ended December 31, 2006 amounted to R$ 12.9 (2005 – R$ 7.8). The accounting treatment of such incentives is the same as that applied to the income tax incentive. | ||
| 19 | Long-term incentives | |
| Braskem has developed a Long-Term Incentive Plan under which officers and employees involved in strategic programs are entitled to acquire certificates of investment. | ||
| The unit value of each certificate of investment was calculated based on the average closing price of Braskem class A preferred shares at BOVESPA from October 2005 to March 2006, and was equal to R$ 18.14. | ||
| As an incentive to purchase the certificate of investment, the participants receive a bonus of 1 certificate of investment for each certificate of investment purchased. This incentive is redeemable as from the fifth year at the ratio of 20% in the first year and 10% in subsequent years. The value of these units was determined based on the projected value of the Company class A preferred share. | ||
| The participants will be entitled to receive another certificate of investment with a return equivalent to the amount of dividends and/or interest on own capital attributed to the holders of each Braskem class A preferred share. |
F-61
Table of Contents
at December 31, 2006, 2005 and 2004
All amounts in millions ofreais, unless otherwise indicated
| Number | Value | |||||||
| Investment Units | ||||||||
| Issued (Alfa Units) | 95,710 | 1.7 | ||||||
| Granted as incentive (Beta Units) | 95,710 | 0.6 | ||||||
| Total | 191,420 | 2.3 | ||||||
| 20 | Shareholders’ Equity | |
| (a) | Capital | |
| At December 31, 2006, Braskem’s subscribed and paid-up capital was R$ 3,508.3, consisting of 123,492,142 common, 246,107,138 class A preferred and 803,066 class B preferred shares, all of them with no par value. At the same date, the Company’s authorized capital comprises 488,000,000 shares, of which 175,680,000 are common, 307,440,000 are class A preferred and 4,880,000 are class B preferred shares. | ||
| The Extraordinary General Meeting held on May 31, 2006 approved the Company’s capital increase by R$ 105.3 as a result of the merger of subsidiary Polialden (Note 1 (b)), through the issuance of 7,878,725 class A preferred shares. On that same date, the conversion of 2,632,043 class A preferred shares into common shares, at the ratio of 1:1 was also approved. | ||
| (b) | Share rights | |
| Preferred shares do not carry voting rights, but they have a priority right to a minimum non-cumulative annual dividend of 6% per annum of their nominal value, depending on the availability of net income for distribution. Only Class A preferred shareholders share equally with the common shares in the remaining net income, and common shares are entitled to dividends only after priority dividends have been paid to the holders of preferred shares. The Class A preferred shareholders also share equally with common shares in the distribution of shares resulting from the incorporation of other reserves. Class B preferred shares are not convertible into common shares. However, at the end of the non-transfer period provided under applicable law, Class B preferred shares can be converted into Class A preferred shares at any time, at the ratio of two Class B preferred shares for each Class A preferred share. | ||
| Class A and Class B preferred shares have priority to the return of capital in the event of liquidation of Braskem. |
F-62
Table of Contents
at December 31, 2006, 2005 and 2004
All amounts in millions ofreais, unless otherwise indicated
| All shareholders are entitled to an annual mandatory dividend of 25% of adjusted net income for the year, in accordance with the Brazilian Corporation Law. | ||
| As set forth in a shareholders’ agreement and memorandum of understanding, the Company has a target to distribute dividends corresponding to not less than 50% of the net income for the year, as long as the required reserve amounts are sufficient to allow for the efficient operation and development of the Company’s businesses. However the legal obligation of the Company remains to the mandatory dividend of 25%. | ||
| Under the terms of certain U.S. dollar-denominated debt (Notes 14(a) and 14(c)), the payment of dividends, interest on capital or any other profit sharing is limited to 50% of net income for the year, or 6% of the nominal value of the Class A and B preferred shares, whichever is higher. | ||
| (c) | Treasury shares | |
| Braskem’s Board of Directors, at a meeting held on May 3, 2006 approved a Share Buyback Program, under which common and class A preferred shares in the Company were be acquired to be kept in treasury and subsequently sold and/or cancelled, with no reduction in capital. | ||
| Under the program, the Company acquired 13,131,054 class A preferred shares at the average cost of R$ 13.88. The low and high quotations during this period were R$ 9.97 and R$ 15.89 per share, respectively. | ||
| In July 2006, the Company also acquired 765,079 class A preferred shares from Polialden dissenting shareholders, which did not accept the exchange of shares made by the Company Note 1(b)(ix). | ||
| At December 31, 2006, the Company held in treasury 14,363,480 class A preferred shares (2005 – 467,347 shares) for a total value of R$ 255.6 (2005 – R$ 15.0). | ||
| (d) | Retention of revenue reserves | |
| Braskem’s Shareholders, at a meeting held on March 28, 2006 approved the transfer of R$ 164.9 from revenue reserves to Retained Earnings (accumulated deficit) for absorption of prior year adjustments related to IBRACON Technical Interpretation 01/2006 (Note 12). | ||
| (e) | Appropriation of net income | |
| In accordance with the Company’s by-laws, net income for each year, adjusted as provided by Law Nº 6404/76, will be appropriated as follows: (i) 5% for constitution of the legal reserve, not |
F-63
Table of Contents
at December 31, 2006, 2005 and 2004
All amounts in millions ofreais, unless otherwise indicated
F-64
Table of Contents
at December 31, 2006, 2005 and 2004
All amounts in millions ofreais, unless otherwise indicated
| 2006 | 2005 | |||||||
| Net income for the year | 101.3 | 625.8 | ||||||
| Excludes effect of consolidation adjustments (*) | (23.5 | ) | 60.0 | |||||
| Portion appropriated to legal reserve | (3.9 | ) | (34.3 | ) | ||||
| Adjusted net income for the calculation of dividends | 73.9 | 651.5 | ||||||
Distribution of profits: | ||||||||
| Interest on own capital (Note 20(f)) | ||||||||
| Common shares — R$0.746 | 90.2 | |||||||
| Class A preferred shares – R$0.746 | 179.4 | |||||||
| Class B preferred shares – R$0.563 | 0.4 | |||||||
| 270.0 | ||||||||
| Dividends proposed | ||||||||
| Common shares — (2005 - R$0.154) | 18.6 | |||||||
| Class A preferred shares – R$0.159 (2005 – R$0.154) | 36.8 | 37.1 | ||||||
| Class B preferred shares – R$0.159 | 0.1 | |||||||
| Total dividends proposed | 36.9 | 55.7 | ||||||
| Total interest on own capital and dividends | 36.9 | 325.7 | ||||||
| Amount allocated to revenue reserve | 36.9 | 325.7 | ||||||
| Minimum mandatory dividends - 25% | 18.5 | 162.9 | ||||||
| (*) | Recognizes income on intercompany’s transactions. |
F-65
Table of Contents
at December 31, 2006, 2005 and 2004
All amounts in millions ofreais, unless otherwise indicated
| (f) | Interest on own capital | |
| On December 29, 2005, pursuant to authorization from Braskem’s board of directors, Braskem’s executive officers approved the payment of interest on own capital in the amount of R$ 270.0, consisting of: (i) R$ 179.4 to holders of Class A preferred shares and holders of ADSs, corresponding to the gross amount of R$ 0.746145 per share and R$ 1.492290 per ADS; (ii) R$ 0.4 to the holders of Class B preferred shares, corresponding to the gross amount of R$ 0.563940 per share, equal to 6% of the share unit value, as provided in Article 9 of Braskem’s by-laws; and (iii) R$ 90.2 to the holders of common shares, corresponding to the gross amount of R$ 0.746145 per share. Payment started in april 18, 2006. | ||
| Interest on own capital was determined based on share ownership positions at December 31, 2005, applying such amount to priority and mandatory dividends for 2005, as prescribed by Law 9249/95 and paragraph 6, Article 44 of Braskem’s by-laws. Withholding income tax on interest credited was R$ 35.5 and the benefit for the Company regarding income tax was R$ 67.5. | ||
| For disclosure purposes, the expense for interest on own capital was reversed in the statement of operations and the reversal was recorded in operating expenses (income), and also reflected in the statement of changes in shareholders’ equity, pursuant to CVM Deliberation Nº 207. | ||
| 21 | Contingencies | |
| (a) | Collective labor agreement | |
| The chemical workers union in the Camaçari region (“SINDIQUÍMICA”) and the syndicate of chemical manufacturers in the same region (“SINPEQ”) are disputing in the courts whether the wage and salary indexation clause in their collective labor agreement was overruled by a 1990 economic policy law which restricted wage and salary increases. Braskem and Politeno and merged companies Trikem, Polialden and Nitrocarbono operated plants in the region in 1990 and are members of SINPEQ. The workers’ union is requesting that salaries and wages be adjusted retroactively and cumulatively since 1990. The most recent ruling by the STF, in December 2002, was favorable to SINPEQ and established that the economic policy law overruled the collective labor agreement. SINDIQUIMICA appealed this decision. In May 2005, the appeal was rejected by unanimous opinion. This decision is pending publication. Nevertheless, the decision is subject to reconsideration by the STF. On October 24, 2005, SINDIQUÍMICA filed a motion to review, which is pending judgment. |
F-66
Table of Contents
at December 31, 2006, 2005 and 2004
All amounts in millions ofreais, unless otherwise indicated
| Management believes that it is reasonably possible that the employers’ union will lose this suit. If the employers’ union loses this suit and assuming that (a) the Company is required to pay damages from April 1990 to September 1990 (the date of the next collective bargaining agreement) and (b) the employees’ union or individual employees file additional claims necessary to quantify the amount of damages, the Company estimates that it could be subject to liability of up to R$ 35.0. | ||
| (b) | Holders of preferred shares | |
| Some holders of Class “B” preferred shares issued by the Company under a tax incentive program are claiming that they are entitled to participate on equal conditions in the remaining profits with the holders of common and Class “A” preferred shares. | ||
| Polialden faced an identical issue with CVM; on August 10, 2000, the CVM Board sided with the Poliladen’s stance that “the dividends payable to preferred shares should range from 6% to 8% of the par value of such shares, or the equivalent to 25% of net profits at yearned, whichever is higher, as the company has done over the last 10 years. Such shares are not entitled to remaining profits, as the bylaws have clearly set the maximum dividens attaching to suche shares.” | ||
| Most court decisions already rendered in this regard have been favorable to the Company. Most of judicial deposits made by the Company have already been reversed to the Company and at December 31, 2006 there is only one judicial deposit at the historical value of R$ 0.8, which is related to the 2004 dividends. | ||
| The Company’s external legal advisors believe that the chances of loss in these cases are remote, based on opinions of its legal consuel, recent court decision in similar cases and CVM rulings on this specific issue. The Company continues to pay dividends accordiling the limiting payments at 6% of their par value or 25% of minimum mandatory dividends set forth in the Company’s bylaws. | ||
| (c) | Offsetting of tax credits | |
| From May through October 2000, merged companies OPP Química and Trikem offset their own federal tax debts with IPI tax credits assigned by an export trading company (“Assignor”). These offsetting procedures were recognized by the São Paulo tax officials (DERAT/SP) through offset supporting certificates (“DCCs”) issued in response to an injunctive relief entered in a motion for writ of mandamus (“MS SP”). Assignor also filed a motion for writ of mandamus against the Rio de Janeiro tax officials (DERAT/RJ) (“MS RJ”) for recovery of IPI tax credits and their use for offsetting with third-party tax debts, among others. The MS SP was dismissed without prejudice, confirming the Rio de Janeiro administrative and jurisdictional authority to rule on Assignor’s tax credits. |
F-67
Table of Contents
at December 31, 2006, 2005 and 2004
All amounts in millions ofreais, unless otherwise indicated
F-68
Table of Contents
at December 31, 2006, 2005 and 2004
All amounts in millions ofreais, unless otherwise indicated
| Both, Assignor and the Company commenced a number of judicial and administrative proceedings to defend the lawfulness and validity of those offsetting procedures, and the legal advisors to both companies believe the chances of success in those cases are probable, mostly in light of the indisputable validity and liquidity of those credits as confirmed in a specific audit conducted by DERAT/RJ. | ||
| On October 3, 2005, the Federal Supreme Court held the MS RJ favorably to Assignor in a final and conclusive manner, confirming Assignor’s definite right to use the IPI tax credits from all its exports and their availability for offsetting with third-party debts. As a result, the legal advisors to assignor and to the Company believe that the offsetting procedures carried out by the merged companies and duly recognized by DERAT/SP have been confirmed, and for this reason they also hold that the tax liabilities being imputed to the Company are not due. Irrespective of the final and conclusive decision in MS RJ, the legal advisors to Assignor and to the Company, in addition to a jurist when inquired of his opinion on this specific issue, believe that the tax liabilities purportedly related to offsetting procedures carried out by the merged companies have become time-barred and, as such, can no longer be claimed by the tax authorities. | ||
| In January 2006, the Company was ordered to post bond in aid of execution of the tax claim referred to above. This bond was tendered in the form of an insurance policy currently under negotiation between the Company, Assignor and insurance companies. | ||
| The Company believes, based on the advice of its external legal advisors that the chances of success in all claims listed above are probable. Nevertheless, if the Company is eventually defeated in all those cases, it will be entitled to full recourse against Assignor concerning all amounts paid to the National Treasury, as per the assignment agreement executed in 2000. | ||
| (d) | National Social Security Institute — INSS | |
| The Company is a party to several social security claims totaling R$ 164.8 as of December 31, 2006 (2005 — R$ 169.9). Out of these sums, the Company has made judicial deposits of R$ 15.1, and R$ 18.2 are secured by a portion of the Company’s inventory. Based on the opinion of its outside legal counsel, the Company believes that the chances of loss for the remaining amounts are remote and therefore, no provision has been recorded. | ||
| (e) | Other court disputes involving the Company and its controlled companies | |
| The Company is party to a civil lawsuit filed by a former caustic soda customer, claiming amounts, at December 31, 2006, of R$ 25.8 (2005 – R$131.0). Braskem’s management, supported by the opinion of its external legal advisors, believe that chance of losses are remote and, for this reason, no provisions have been recorded. |
F-69
Table of Contents
at December 31, 2006, 2005 and 2004
All amounts in millions ofreais, unless otherwise indicated
| In the second quarter of 2005, the Petrochemical and Chemicals Companies Employees Union of Triunfo (RS) and Camaçari (BA) brought labor actions claiming payments in respect of overtime. On those lawsuits it has been filed the proper defense and the Company does not expect any losses in these action. | ||
| The Company is defendant in an arbitration in the City of Rio de Janeiro commenced by a freightage company. Recently, the arbitrators asked for a technical expert opinion on the subject matter and extent of the dispute, which was estimated at R$ 29.0. However, in reliance on the opinion of legal advisors sponsoring the Company interests in this arbitration. The Comapny believes that the Company is likely to prevail, and for this reason no amounts were provisioned for this regard. | ||
| As of December 31, 2006, the Company is defendant in approximately 1,200 labor claims, including those mentioned in the paragraph above, totaling approximately R$ 260.2 (2005 – R$ 223.4). Based on the opinion of its external legal advisors, the Company has provided a provision of R$ 21.9 at December 31,2006 (2005 – R$ 12.3) for the probable losses in these claims. | ||
| For the civil and labor cases entailing a probable defeat, the Company has provisioned for R$ 21.9 (2005 – R$12.0) | ||
| 22 | Financial Instruments | |
| (a) | Risk management | |
| Because the Company operates in the international markets, obtaining funds for its operations and investments, it is exposed to market risks mainly arising from changes in the foreign exchange and interest rates. The bank accounts, financial investments and other accounts receivable are subject to credit risk. The Company has developed policies and procedures for risk evaluation, report preparation and mathematical models for the monitoring of these risks and possible use of derivatives to decrease these risks. | ||
| To cover its exposure to market risks, the Company utilizes various types of currency hedges, some involving the use of cash and others not. The most common cash–based currency hedges used by the Company are financial instruments denominated in foreign currencies (certificates of deposit, U.S. dollar-denominated securities, foreign mutual funds, time deposits and overnight deposits) and put and call options. The non-cash types of currency hedges used by the Company are swaps of foreign currency and forwards. | ||
| To hedge its exposure to exchange and interest risks arising from loan and financing agreements, the Company adopted, at December 31, 2001, the following methodology: hedging of the principal and interest (on a consolidated basis), falling due in the next 12 months of, at least, (i) 60% of the debt linked to exports (trade finance), except for advances |
F-70
Table of Contents
at December 31, 2006, 2005 and 2004
All amounts in millions ofreais, unless otherwise indicated
F-71
Table of Contents
at December 31, 2006, 2005 and 2004
All amounts in millions ofreais, unless otherwise indicated
| (b) | Exposure to foreign exchange risks | |
| The Company has long-term loans and financing to finance its operations, including cash flows and project financing. A substantial part of the long-term loans and financing is denominated in U.S. dollars (Note 14). | ||
| (c) | Exposure to interest rate risks | |
| The Company is exposed to interest rate risks on its short-term and long-term debt. The debt in foreign currency, bearing floating interest rates, is mainly subject to LIBOR variation, while the domestic debt, bearing floating interest rates, is mainly subject to fluctuations in the TJLP and the CDI rate and the IGP-M inflation index. | ||
| (d) | Exposure to commodities risks | |
| The Company is exposed to fluctuations in the price of several petrochemical commodities, especially its main raw material, naphtha. Because the Company seeks to transfer to its own selling prices the effect of price changes in its raw material, arising from changes in international quotations for naphtha, part of its sales may be carried out under fixed-price contracts or contracts stating maximum and/or minimum fluctuation ranges. Such contracts are commercial agreements or derivative contracts relating to future sales. | ||
| (e) | Exposure to credit risk | |
| The Company is subject to concentration of credit risk in connection with bank accounts, financial investments and other accounts receivable, which expose the Company to risks relating to financial institutions involved. In order to manage the credit risk, the Company keeps its bank accounts and financial investments with large financial institutions. | ||
| In relation to customer credit risk, the Company protects itself by performing detailed analyses before granting credit and by obtaining security and guarantees, when necessary. |
F-72
Table of Contents
at December 31, 2006, 2005 and 2004
All amounts in millions ofreais, unless otherwise indicated
| (f) | Derivative instrument transactions | |
| As of December 31, 2006, the Company had the following derivative contracts: |
| Market value (i) | ||||||||||||
| Description | Maturity | Notional amount | Dec/06 | |||||||||
| Real / US$- Option (Put US$) | Feb/2007 | US$ | 306.0 | (11.6 | ) | |||||||
| Real + CDI / Yen + Tibor (swap) | Mar/2012 | R$ | 136.0 | (45.2 | ) | |||||||
| Real + CDI / Yen + Tibor (swap) | Jun/2012 | R$ | 143.0 | (22.8 | ) | |||||||
| Real + CDI / US$(swap) | May/2007 | US$ | 100.0 | (24.3 | ) | |||||||
| Real + CDI / US$(swap) | Feb/2007 | US$ | 200.0 | (19.1 | ) | |||||||
| Tax Sparing I | Jun/2007 | US$ | 134.0 | |||||||||
| Tax Sparing II | Jun/2015 | US$ | 100.0 | 0.1 | ||||||||
| Return Swap | Dec/2007 | US$ | 410.0 | 10.2 | ||||||||
| Benzene | Jan/2007 | 146.7 th.tons | (6.9 | ) | ||||||||
| (i) | The market value represents the amount receivable (payable) if transactions have been settled at December 31, 2006. |
F-73
Table of Contents
at December 31, 2006, 2005 and 2004
All amounts in millions ofreais, unless otherwise indicated
| 23 | Financial income (expenses) |
| 2006 | 2005 | 2004 | ||||||||||
Financial income: | ||||||||||||
| Interest income | 140.0 | 140.1 | 160.8 | |||||||||
| Monetary variation of financial investments, related parties and accounts receivable | 48.1 | 17.7 | 12.8 | |||||||||
| Monetary variation of taxes recoverable | 48.6 | 7.6 | 31.8 | |||||||||
| Gains on derivative transactions | 114.1 | 45.7 | 125.8 | |||||||||
| Exchange variation on foreign currency assets | (204.2 | ) | (288.8 | ) | (335.3 | ) | ||||||
| Other | 12.9 | 44.1 | 72.7 | |||||||||
| 159.5 | (33.6 | ) | 68.6 | |||||||||
Financial expenses: | ||||||||||||
| Interest on financing and related parties | (287.8 | ) | (347.0 | ) | (595.3 | ) | ||||||
| Monetary variation on financing and related parties | (255.5 | ) | (203.1 | ) | (380.9 | ) | ||||||
| Monetary variation and interest on taxes and suppliers | (178.5 | ) | (169.7 | ) | (137.1 | ) | ||||||
| Losses on derivative transactions | (161.9 | ) | (61.5 | ) | (131.4 | ) | ||||||
| Expenses with discounting transactions | (119.7 | ) | (108.2 | ) | (73.6 | ) | ||||||
| Discounts granted | (138.0 | ) | (88.4 | ) | (80.7 | ) | ||||||
| Exchange variation on foreign currency liabilities | 333.4 | 556.9 | 425.4 | |||||||||
| Taxes and charges on financial transactions | (228.4 | ) | (110.6 | ) | (148.4 | ) | ||||||
| Interest on capital | (270.0 | ) | (170.0 | ) | ||||||||
| Reversal of interest on capital | 270.0 | 170.0 | ||||||||||
| Other | (61.5 | ) | (144.2 | ) | (185.2 | ) | ||||||
| (1,097.9 | ) | (675.8 | ) | (1,307.2 | ) | |||||||
| Financial results, net | (938.4 | ) | (709.4 | ) | (1,238.6 | ) | ||||||
| 24 | Other operating income (expenses) |
| 2006 | 2005 | 2004 | ||||||||||
Income (expenses) | ||||||||||||
| Rental of facilities and assignment of right of use | 45.4 | 3.9 | 20.7 | |||||||||
| Recovery of taxes (Note 16 (iii)) | 125.9 | 3.4 | 16.4 | |||||||||
| Recovery of costs and expenses/Inventory adjustments | (9.3 | ) | 10.5 | 1.6 | ||||||||
| Other operating income/(expenses), net | 24.1 | 5.0 | 4.3 | |||||||||
| 186.1 | 22.8 | 43.0 | ||||||||||
F-74
Table of Contents
at December 31, 2006, 2005 and 2004
All amounts in millions ofreais, unless otherwise indicated
| 2006 | 2005 | 2004 | ||||||||||
Income (expenses) | ||||||||||||
| Increase in interest in investments | 2.4 | 5.4 | 3.5 | |||||||||
| Sale of permanent assets | (0.5 | ) | 0.8 | 0.5 | ||||||||
| Reversal of (provision for) loss on investments | (4.3 | ) | (5.5 | ) | ||||||||
| Provision for loss/retirement of assets | (22.4 | ) | (18.2 | ) | ||||||||
| Other non-operating income (expenses), net | 5.2 | (4.7 | ) | (10.1 | ) | |||||||
| 7.1 | (25.2 | ) | (29.8 | ) | ||||||||
| 26 | Insurance Coverage | |
| The Company has a broadly-based risk management program designed to provide cover and protection for all assets, as well as possible losses caused by production stoppages, through an “all risks” insurance policy. This policy establishes the amount for maximum probable damage, considers sufficient to cover possible losses, taking into account the nature of the Company’s activities and the advice of insurance consultants. At December 31, 2006, insurance coverage for inventories, property, plant and equipment, and loss of profits of the Company is R$12,109.6 per claim, while the total of all insured assets is R$ 17,250.3. | ||
| 27 | Shares Traded Abroad — NYSE and LATIBEX | |
| (a) | American Depositary Receipts (“ADRs”) program | |
| The Company’s ADS’s are traded on NYSE with the following characteristics: |
| (b) | LATIBEX | |
| The Company’s Class A preferred shares are traded on LATIBEX, the Madrid Stock Exchange’s market for Latin American companies quoted in euros. The shares are traded under the symbol “XBRK” and the Brazilian custodian bank is Banco Itaú S.A. LATIBEX has adjusted and altered the process for quotation and trading to comply with the new Corporate Governance Standards adopted by Bovespa. Accordingly, as from May 16, 2005, the shares have been traded in unit’s shares. |
F-75
Table of Contents
at December 31, 2006, 2005 and 2004
All amounts in millions ofreais, unless otherwise indicated
| 28 | Private Pension Plans | |
| The actuarial obligations relating to the pension and retirement plans are accrued in conformity with the procedures established by CVM Deliberation 371/2000. | ||
| The formation of Braskem (Note 1 (c)) involved the integration of six sponsoring companies and three different pension plans managed by Fundação PETROBRAS de Seguridade Social — PETROS (“PETROS”), PREVINOR — Associação de Previdência Privada (“PREVINOR”) and ODEPREV — Odebrecht Previdência (“ODEPREV”). In addition to sponsoring different private pension plans, the Company had approximately 800 employees who did not participate in company-sponsored pension plans, as no new benefits were granted to employees since the inception of the Company. | ||
| Management ceased to provide benefits to new employees in order to devise a single, legitimate solution for all participants, with a view to protecting the plan participants’ financial assets. | ||
| Experts engaged by the Company recommended that ODEPREV be the only supplementary pension plan entity sponsored by the Company. Furthermore, employees who did not participate in the PETROS and PREVINOR plans were offered the opportunity to join the ODEPREV plan, retroactively to August 16, 2002. | ||
| In June 2005, the Company communicated to PETROS and PREVINOR its intended withdrawal as a sponsor effective June 30, 2005. With regard to PETROS, the calculation of mathematical reserves of participants was completed in November 2006 and submitted in that month to the Supplementary Pension Plan Secretary, a Social Security Ministry department in charge of regulating and inspecting private pension plans. The Company recorded a provision of R$ 58.6, which is considered sufficient to face the required disbursements by the sponsor. During 2005, the Company’s and employees’ contributions to PETROS totaled R$ 2.8 and R$ 1.8, respectively. | ||
| Benefits to retired employees and pensioners will continue to be paid on a regular basis up to completion of the process. | ||
| As to PREVINOR, the calculation of mathematical reserves of participants have been completed and the entity has a surplus, so that no contributions by the Company are required. The sponsorship withdrawal was approved by the Supplementary Pension Plan Secretary and the commitments to the plan participants will be settled in the first half of 2007. During 2005, the Company’s and employees’ contributions added up to R$ 0.6 and R$ 0.4, respectively. |
F-76
Table of Contents
at December 31, 2006, 2005 and 2004
All amounts in millions ofreais, unless otherwise indicated
| The subsidiary Politeno was the sponsor of a defined contribution plan managed by PREVINOR. In December 2006, Politeno advised PREVINOR of its intention to withdraw from the plan effective the end of that month. The calculation of mathematical reserves of participants to be refunded to plan are being prepared by independent experts for subsequent analysis and approval by the Supplementary Pension Plan Secretary. Benefits to retired employees and pensioners will continue to be paid on a regular basis up to completion of the process. | ||
| In 2006, Politeno’s and its employees’ contributions totaled R$ 1.5 (2005 — R$ 1.6) and R$ 0.9 (2005 – R$ 1.0), respectively. | ||
| (a) | ODEPREV | |
| The Company has a defined-contribution plan for its employees. The plan is managed by ODEPREV - Odebrecht Previdência which is sponsored by Odebrecht as a closed private pension entity. ODEPREV offers participating employees of the sponsoring companies the Optional Plan, a defined-contribution plan, under which monthly and periodic participant contributions and annual and monthly sponsor contributions are accumulated and managed in individual retirement savings accounts. | ||
| The Board of Trustees of ODEPREV defines each year, in advance, the parameters for contributions to be made by the participants and the sponsoring companies. With regard to the payment of benefits under the Optional Plan, the obligation of ODEPREV is limited to the total value of the quotas held by its participants and, to comply with the regulations for a defined-contribution plan, it will not be able to require any obligation or responsibility on the part of the sponsoring company to assure minimum levels of benefits to the participants who retire. | ||
| At December 31, 2006, the active participants in ODEPREV totaled 2,354 (2005 – 2,131), and the Company’s and employees’ contributions amounted to R$ 7.9 (2005 – R$ 4.6) and R$ 13.2 (2005 – R$ 9.3), respectively. | ||
| (b) | PETROS | |
| At December 31, 2006, the jointly-controlled companies Copesul and Petroflex take part in the defined benefit plan managed by PETROS. As required in PETROS regulation and relevant law, in the event of a significant gap in technical reserves, both, the sponsors and participants, must make an additional financial contribution, otherwise the plan benefits will be adjusted to the available resources. Up to December 31, 2006, no supplementation was required. | ||
| In accordance with CVM Deliberation 371/2000, which approved NPC 26 of IBRACON — “Accounting for Employee Benefits”, the subsidiaries carried out the actuarial valuation of the plans and, accordingly, recorded actuarial liabilities in long-term liabilities. |
F-77
Table of Contents
at December 31, 2006, 2005 and 2004
All amounts in millions ofreais, unless otherwise indicated
| The amounts of the jointly-controlled plans are as follows: |
| Copesul | Petroflex | |||||||||||||||
| 2006 | 2005 | 2006 | 2005 | |||||||||||||
| Fair value of asset plans | 388.0 | 337.7 | 579.6 | 489.7 | ||||||||||||
| Present value of actuarial liabilities | 405.8 | 357.3 | 512.5 | 458.0 | ||||||||||||
| Funded status (unfunded status) | (17.8 | ) | (19.6 | ) | 67.1 | 31.7 | ||||||||||
| Net actuarial liabilities | 9.0 | 12.5 | 15.1 | 22.2 | ||||||||||||
| Unrecognized actuarial gains (actuarial liabilities provided for) | (8.8 | ) | (7.1 | ) | 82.2 | 53.9 | ||||||||||
| Copesul | Petroflex | |||||||
| Actual discount rate | 11% per annum | 11% per annum | ||||||
| Expected return rate on plan assets | 11% per annum | 11% per annum | ||||||
| Actual salary raises | 2% per annum up to 47 years and | 1% for 2006 | ||||||
| 0% per annum after 48 years of age | 2% for 2005 | |||||||
| Inflation | 5% per annum | 5% per annum | ||||||
| Contributions to PETROS by Copesul and Petroflex at December 31, 2006, amounted to R$ 5.6 and R$ 2.1, respectively. (2005 – R$ 5.9 and R$ 2.2). | ||
| Copesul also sponsors a defined benefit plan, Plano Copesul de Previdência Complementar – COPESULPREV, for employees who do not participate in PETROS. Copesul’s contributions at December 31, 2006, amounted to R$ 1.1 (2005 — R$ 1.1 ) | ||
| 29 | Raw Material Purchase Commitments | |
| The Company has contracts for consumption of electric energy by its industrial plants located in the States of Alagoas, Bahia and Rio Grande do Sul. The minimum annual commitment under these contracts amounts to R$ 102.3. | ||
| The Company acquires from Copesul ethylene and propylene for its units at the Southern Petrochemical Complex, under a contract that expires in 2014. The minimum annual purchase commitment corresponds to 268,200 metric tons of ethylene and 262,200 metric tons of propylene. Based upon the market prices at December 31, 2006, this commitment was R$ 1,262.4 (unaudited). If the Company does not acquire the minimum volume, it must pay 40% of the current price of the amount not purchased. | ||
| Braskem purchases naphtha under contracts establishing a minimum annual purchase volume equal to R$ 5,752.6 (unaudited), based on market prices as of December 31, 2006. |
F-78
Table of Contents
at December 31, 2006, 2005 and 2004
All amounts in millions ofreais, unless otherwise indicated
| 30 | Subsequent events | |
| (a) | Merger of Politeno | |
| The Extraordinary Shareholders’ Meeting held on April 2, 2007 approved the merger of Politeno, through an exchange ratio of shares and based on the book value of Politeno’s shareholders’ equity as of December 31, 2006, in the amount of R$ 499.0. The exchange ratio of Politeno shares for Braskem shares was determined based on the book value of shareholders’ equity as of December 31, 2006, according to appraisal reports issued by independent experts. To maintain the current capital structure of Braskem, the Shareholders’ Meeting also approved the conversion of 486,530 class A preferred shares into common shares, as well as the issuance of 1,533,670 class A preferred shares. Upon the merger of Politeno, the Company’s share capital was increased by R$ 19.2 to R$ 3,527.4, while the free float remained at approximately 53%. | ||
| (b) | Acquisition of Ipiranga Group | |
| On April 17, 2007, Ultrapar Participações S.A. (”Ultrapar”), with Braskem and Petrobras as intervening parties (under commission), acquired for R$ 2.1 billions, equal to 61.6% of the issued common share and 13.8% of the issued preferred shares of Refinaria de Petróleo Ipiranga S.A. (“RPI”), 65.5% of the issued common shares and 12.6% of the issued preferred shares of Distribuidora de Produtos de Petróleo Ipiranga S.A. (“DPPI”), and 3.6% of the issued common shares and 0.4% of the issued preferred shares of Companhia Brasileiro de Petróleo Ipiranga (“CBPI”) which belong to the shareholders of Ipiranga Group. | ||
| Under the agreement among Ultrapar, Braskem and Petrobras, Ultrapar will have control over the fuel and lubricant distribution business located in the South and Southeast regions (“South Distribution Assets”), Petrobras will have control over the fuel and lubricant distribution businesses located in the North, Northeast and Center-West regions (“North Distribution Assets”), and Braskem will have control over the petrochemical assets, comprising Ipiranga Química S.A., Ipiranga Petroquímica S.A. (“IPQ”), and IPQ’s interest in Copesul. Oil refining operation assets held by RPI will be shared on equal terms by Ultrapar, Petrobras, and Braskem which will account for their interest therein under the proportional consolidation method. | ||
| As agreed upon with Braskem and Petrobras, Ultrapar is responsible for carrying out a corporate reorganization of the acquired companies, in order to segregate the acquired assets ascribed to each individual companies, including the following phases: | ||
| i) Tag-along public tender offer for the acquisition of issued common shares of RPI, DPPI, CBPI and IPQ; | ||
| ii) Transfer of RPI, DPPI and DBPI shares to Ultrapar; and |
F-79
Table of Contents
at December 31, 2006, 2005 and 2004
All amounts in millions ofreais, unless otherwise indicated
| iii) Segregation of assets as follows: (a) decrease in the capital of RPI and CBPI, in order to transfer Petrochemical Assets directly to Ultrapar, to be subsequently delivered to Braskem and Petrobras, pursuant to the contract, and (b) spin-off of CBPI to transfer North Distribution Assets to a company controlled by Petrobras. | ||
| The main effects of this acquisition were as follows: |
| At March 31, 2007 | ||||
| (Unaudited) | ||||
| Consolidated | ||||
| Current assets | R$765.2 | |||
| Long-term assets | 269.8 | |||
| Property, plant and equipment | 562.9 | |||
| Intangible assets and other investments | 594.8 | |||
| Current liabilities | 826.1 | |||
| Long-term liabilities | 657.6 | |||
| Minority interests | 40.6 | |||
| Book value of net assets (100%) | 668.4 | |||
| Interest acquired (13.8%) | 92.4 | |||
| Purchase price for 13.8% | 652.2 | |||
| The interest acquired of 13.8% represents the total capital acquired for Ipiranga Química (the holding company of the other companies acquired). | ||
| (c) | Funding | |
| In April 2007, Braskem completed negotiations to obtain up to US$ 1.2 billion under a bridge loan to finance the acquisition of the petrochemical assets of the Ipiranga Group and future delisting of Copesul. In that month, Braskem withdrew the Company withdrawn US$ 309.0 million, used for the payment of shares acquired on April 18, 2007. | ||
| The new two-year term credit line bears annual interest of 0.35% above LIBOR in the first year and 0.55% in the second year. | ||
| Braskem expects to refinance the bridge loan in due time, always with a view to reducing its capital cost and maintaining the debt profile adjusted to its cash flow. | ||
| (d) | Propylene supply contract | |
| In April 2006, Braskem entered into a purchase agreement with Refinaria Alberto Pasqualini (“Refap”), located at Canoas, state of Rio Grande do Sul, for the initial purchase of 70 thousand tons of propylene per year. The annual volume to be supplied may exceed 100 thousand annually tons due to planned increases in the refinery production. |
F-80
Table of Contents
at December 31, 2006, 2005 and 2004
All amounts in millions ofreais, unless otherwise indicated
| Under the contract, 5.8 thousand tons of propylene will be purchased per month. This volume will supply the existing Company’s units at the Southern Petrochemical Complex and ensure the supply of raw material for future expansions. |
F-81
Table of Contents
at December 31, 2006, 2005 and 2004
All amounts in millions ofreais, unless otherwise indicated
| (e) | Agreement for the formation of joint ventures | |
| On April 16, 2007, Braskem and Pequiven, the leading petrochemical company in Venezuela, entered into an agreement to form two joint ventures in order to develop and implement in that country the most modern and competitive integrated petrochemical project in the Americas, at the Jose Complex. Under the project, an ethane cracker from natural gas will be build, with a capacity of 1.3 million ton/year of ethylene, integrated with the production of 1.1 million ton/year of polyethylene and other petrochemicals. | ||
| The investments to implement the ethylene unit and the polyethylene unit are estimated at approximately US$ 2.5 billion (unaudited). Braskem and Pequiven are also considering investments in PVC and soda units. | ||
| These projects require approximately 30% of the total investment to be funded equally by Braskem and Pequiven. The remaining 70% will be provided by multilateral agencies for export credit, development banks and private banks, under project financing arrangements. | ||
| (f) | Writ of injunction issued by CADE | |
| On April 25, 2007, Braskem and CADE executed the Agreement for the Preservation of the Transaction Reversibility (APRO). The agreement specifically does not impact Braskem’s control over Copesul but does impact its investment in IPQ, Ipiranga Química S.A. Under the agreement, whereby Braskem undertakes to maintain in the polyethylene and polypropylene markets the competitive status prevailing prior to April 18, and to refrain from doing the following with respect to the operations acquired from the Ipiranga group: |
| • | Any changes in the corporate structure which would imply in a changes the controlling shareholder; | ||
| • | Substantive changes in its physical facilities and assignment or waiver of its rights and duties in connection with its assets, including brands, patents, customer base and raw material supplier base; | ||
| • | Discontinuing the use of brands and products, subject to the provisions of the Investment Agreement, maintaining the offer of the Ipiranga product line; | ||
| • | Substantive changes in the structure, logistics, and distribution and marketing practices; | ||
| • | Substantive changes in the companies, which would imply the lay-off of employees, or reassignment of personnel among the production, distribution, marketing and research areas, for the purpose of integrating the companies; and | ||
| • | Interruption without cause (in CADE’s judgment) of investment projects pre-approved by the Board of Directors, in all businesses of the acquired company, and of the implementation of its sales plans and targets. |
F-82
Table of Contents
at December 31, 2006, 2005 and 2004
All amounts in millions ofreais, unless otherwise indicated
| CADE expressed no restraints with respect to the transaction involving Copesul, considering that the Braskem and Petrobras will maintain their respective positions of controlling and minority stockholders, as before April 18. | ||
| The agreement is subject to review at any time by CADE or at the request of the applicants provided that these companies, at the discretion of CADE’s full bench, prove that the requirements that gave rise to the above mentioned agreement no longer exist. | ||
| 31 | Summary of Principal Differences Between Brazilian GAAP and U.S.GAAP | |
| (a) | Presentation of financial information | |
| As described in Note 2, the Company has elected to use the consolidated financial statements prepared in accordance with Brazilian GAAP and expressed in reais as its primary financial statements, for the purposes of filling under the U.S. Securities Act of 1934. | ||
| A summary of the Company’s principal accounting policies that differ significantly from U.S. GAAP is set forth below. | ||
| (b) | Supplementary inflation restatement in 1996 and 1997 for U.S. GAAP | |
| Under Brazilian GAAP, inflation accounting was discontinued effective January 1, 1996. Prior to that date, Brazilian GAAP statements included indexation adjustments which partially accounted for the effect of inflation on property, plant and equipment, investments, deferred charges (together denominated “permanent assets”) and shareholders’ equity, and reported the net charge or credit in the statement of operations. However, under U.S. GAAP, Brazil ceased to be treated as a highly inflationary economy only as from January 1, 1998. Accordingly, the financial information for purposes of U.S. GAAP should include additional inflation restatement adjustments for 1996 and 1997 made by applying the General Price Index increased by 9.3% in 1996 and 7.5% in 1997. | ||
| For purposes of the U.S. GAAP reconciliation, shareholders’ equity under U.S. GAAP was increased by R$ 693.2 and R$ 721.8, at December 31,2006 and 2005, respectively, due to the additional inflation restatement adjustments, net of depreciation. These amounts generated increases in depreciation charges of R$ (28.6), R$ (39.9) and R$ (37.3) in 2006, 2005 and 2004 respectively. | ||
| (c) | Property, plant and equipment | |
| (i) Capitalized interest | ||
| Since January 2006, under Brazilian GAAP, the Company adopted the same methodology to capitalize interest as U.S. GAAP. Therefore, as from January 2006, there are no more differences between Brazilian GAAP and U.S. GAAP in the reconciliation going forward. The |
F-83
Table of Contents
at December 31, 2006, 2005 and 2004
All amounts in millions ofreais, unless otherwise indicated
| depreciation of interest capitalized under U.S. GAAP before 2006 continues to be depreciated based on the useful life of the underlying asset. |
F-84
Table of Contents
at December 31, 2006, 2005 and 2004
All amounts in millions ofreais, unless otherwise indicated
| (ii) Impairment | ||
| Under Brazilian GAAP, companies are required to determine if operating income discounted cash flow is sufficient to absorb the depreciation or amortization of long-lived assets in order to assess potential asset impairment. In the event of such operating income discounted cash flow is insufficient to recover the depreciation, the assets, or groups of assets, are written down to recoverable values. In the event of a planned substitution of assets prior to the end of the original estimated useful life of the asset, depreciation of such asset is accelerated to ensure that the asset is depreciated according to the estimated net realizable values at the estimated date of substitution. | ||
| Under U.S. GAAP, Statement of Financial Accounting Standard (“SFAS”) Nº 144, “Accounting for the Impairment of Disposal of Long-Lived Assets”, requires companies to evaluate the carrying value of long-lived assets to be held and used, and for long-lived assets to be disposed off, when events and circumstances require such a review. The carrying value of long-lived assets is considered impaired when the anticipated undiscounted cash flow from identified asset groups, representing the lowest level for which identifiable cash flow are largely independent of the cash flows of other groups of assets, is less than their carrying value. In that event, a loss is recognized based on the amount by which the carrying value exceeds the fair value of the assets or discounted cash flows generated by the assets. There is no impairment recorded for U.S. GAAP purposes at December 31, 2006. | ||
| (d) | Deferred charges and other intangible assets | |
| Brazilian GAAP permits deferral of expenses, pre-operating expenses incurred in the construction or expansion of a facility before the facility begins operations, research and development expenditure and other items listed in Note 13. | ||
| For purposes of the U.S. GAAP reconciliation, all Brazilian GAAP deferred costs, other than those reclassified to property, plant and equipment, and goodwill generated on common control transactions, which is eliminated, have been charged to income. | ||
| For purposes of the U.S. GAAP reconciliation, deferred charges adjustments, net under U.S. GAAP amounted to R$ 34.5, R$ 82.1 and R$ (142.9) in 2006, 2005 and 2004, respectively. | ||
| Under U.S. GAAP all research and development costs are expensed as incurred and recorded in the statement of operations within general and administrative expense whereas certain of such costs are capitalized deferred charges under Brazilian GAAP. Expenditure on research and development totaled R$ 44.3, R$ 47.2 and R$ 59.2, for the years ended December 31, 2006, 2005 and 2004, respectively. |
F-85
Table of Contents
at December 31, 2006, 2005 and 2004
All amounts in millions ofreais, unless otherwise indicated
| A reconciliation of the net adjustments to net income for all three years presented is set forth in the following table: |
| 2006 | 2005 | 2004 | ||||||||||
| Expense of deferred charges under U.S. GAAP | ||||||||||||
| Pre-operating expenses | — | (1.0 | ) | (13.6 | ) | |||||||
| Organization and implementation expenses | (35.2 | ) | (33.7 | ) | (116.3 | ) | ||||||
| Expenditures for structured operations | (6.7 | ) | (4.3 | ) | (86.8 | ) | ||||||
| Research and development | — | (0.7 | ) | (13.1 | ) | |||||||
| Other | (25.5 | ) | (6.6 | ) | ||||||||
| (67.4 | ) | (39.7 | ) | (236.4 | ) | |||||||
| Reversal of amortization of deferred charges under Brazilian GAAP | ||||||||||||
| Pre-operating expenses | 4.2 | 6.4 | 44.7 | |||||||||
| Organization and implementation expenses | 54.1 | 67.1 | 11.4 | |||||||||
| Expenditures for structures operations | 35.7 | 43.4 | 33.8 | |||||||||
| Research and development | 6.3 | 4.2 | 6.0 | |||||||||
| Other | 1.6 | 0.7 | (2.4 | ) | ||||||||
| 101.9 | 121.8 | 93.5 | ||||||||||
| 34.5 | 82.1 | (142.9 | ) | |||||||||
| (e) | Business combinations and goodwill | |
| As mentioned in Note 1(viii), the Company acquired 100% of the common and preferred shares of Politeno owned by Suzano Petroquímica, Sumitomo Chemical and Itochu Corporation, which comprised 62.2% of the total share capital of Politeno. The purchase price paid without any contingent consideration under Brazilian GAAP and U.S. GAAP was R$ 237.5. | ||
| Under Brazilian GAAP, goodwill arises from the difference between the amount paid and the Brazilian GAAP book value (normally also the tax basis) of the net assets acquired. Goodwill is generally justified on the difference between the book value and the market value of assets acquired and/or based on expectation of future profitability and is amortized over the remaining useful lives of the assets or up to ten years, respectively. Negative goodwill arises under Brazilian GAAP when the book value of assets acquired exceeds the purchase consideration. Negative goodwill is amortized in up to over ten years after the related investment other than nontemporary has been legally merged. | ||
| Under U.S. GAAP, fair values are assigned to acquired assets and liabilities in business combinations, including intangible assets. The positive difference of consideration paid over the fair value of assets and liabilities is recorded as goodwill. In accordance with SFAS No. 142, “Goodwill and Other Intangible Assets”, goodwill is no longer amortized but is instead assigned to an entity’s reporting units and tested for impairment at least annually. |
F-86
Table of Contents
at December 31, 2006, 2005 and 2004
All amounts in millions ofreais, unless otherwise indicated
| As the fair value originally assigned to the Politeno net assets was higher than the purchase price under U.S. GAAP negative goodwill amounting to R$ 329.1, was initially calculated. However, under U.S. GAAP, when a business combination involves a contingent consideration agreement that, when resolved, might result in the recognition of an additional element of cost with respect to the acquired entity (i.e., a contingency based on earnings), a deferred credit should be recognized for the lesser of (1) the maximum amount of contingent consideration or (2) the initial amount of negative goodwill. As there is no maximum amount contingent consideration estabelished in the contract the amount of negative goodwill has been recorded as contingent consideration. | ||
| On this bases, the fair value allocation of this acquisition was as follows: |
| Current assets | R$311.9 | |||
| Long-term assets | 174.0 | |||
| Property, plant and equipment | 651.0 | |||
| Intangible assets and other investments | 109.1 | |||
| Current liabilities | 184.5 | |||
| Long-term liabilities | 201.3 | |||
| Fair value of net assets | 860.2 | |||
| Participation acquired (62.2%) | 535.0 | |||
| Purchase price (including contingent consideration of R$329.1) | 535.0 |
| We began to fully consolidate Politeno as from April 1, 2006, at which time related minority interests was R$ 21.8. | ||
| This additional U.S. GAAP difference generated increases in property, plant, equipment and intangible assets and deferred tax liability at December 31, 2006 of R$ 202.2, R$ 37.4 and R$ 81.4, respectively. These adjustments resulted in an increase in the depreciation and amortization expenses for the year then ended of R$ 8.7 and R$ 26.9, respectively, and a deferred tax credit to income of R$ 12.2. | ||
| In addition, the Company acquired the minority interests of Polialden (Note 1(b)(ix)) with book value of R$136.2 were acquired for R$111.3 generating negative goodwill of R$24.9 which was allocated to non-current assets, principally property, plant and equipment. | ||
| (i) Goodwill | ||
| The differences in relation to Brazilian GAAP arise principally from (i) non-recognition of goodwill arising from transactions between parties under common control under U.S. GAAP (Note 31(g)); (ii) valuation of assets and liabilities acquired at their fair value at the date of acquisition; and (iii) difference between goodwill calculated under U.S. GAAP and under Brazilian GAAP. |
F-87
Table of Contents
at December 31, 2006, 2005 and 2004
All amounts in millions ofreais, unless otherwise indicated
| These balances can be summarized as follows: |
| 2006 | 2005 | |||||||
| US GAAP Goodwill balance (*) | 450.5 | 450.5 | ||||||
| US GAAP Fair Market Value adjustment (**) | 262.9 | 299.5 | ||||||
| Reversal of Brazilian GAAP business combinations effect (***) | (421.8 | ) | (805.2 | ) | ||||
| 291.6 | (55.2 | ) | ||||||
| (*) | In 2005, the US GAAP Goodwill balance was reduced due the impairment charge of R$ 373.8 related to Politeno. | |
| (**) | These include the continuos effects of distributions included in Note 31 (g). | |
| (***) | Includes Brazilian GAAP goodwill, net of negative goodwill among other items. |
| For Brazilian GAAP purposes, the balance of goodwill at December 31, 2006 was R$ 820.2 (2005 – R$ 873.6), which is being amortized to income over a period of up to 10 years for items reclassified to deferred charges, or the remaining useful lives of the underlying assets, for the items reclassified to property, plant and equipment. Negative goodwill at December 31, 2006 was R$ 30.4 (2005 – R$ 87.9). | ||
| Under U.S. GAAP, the net balance of goodwill can be demonstrated as follows: |
| Goodwill attributable to | Business | |||||||||||||||||||
| each reportable segment | Polyolefins | Vinyls | Development | Other | Total | |||||||||||||||
| At December 31, 2005 | 416.9 | 3.0 | 17.4 | 13.2 | 450.5 | |||||||||||||||
| At December 31, 2006 | 416.9 | 3.0 | 17.4 | 13.2 | 450.5 | |||||||||||||||
| For purposes of U.S. GAAP reconciliation, goodwill and negative goodwill amortization under Brazilian GAAP have been reversed and amounted to R$ 57.8 in 2006, R$ 152.5 in 2005 and R$ 152.7 in 2004. |
F-88
Table of Contents
at December 31, 2006, 2005 and 2004
All amounts in millions ofreais, unless otherwise indicated
| (ii) Impairment | ||
| For purposes of U.S. GAAP, goodwill impairment is determined using a two-step process. The first step of the goodwill impairment test is to identify a potential impairment by comparing the fair value of a reporting unit with its carrying amount, including goodwill. The estimates of fair value of a reporting unit, are determined using a discounted cash flow analysis. A discounted cash flow analysis requires one to make various judgmental assumptions including assumptions about future cash flows, growth rates and discount rates. The assumptions about future cash flows and growth rates are based on the Company’s budget and business plans. Discount rate assumptions are based on an assessment of the risk inherent in the respective reporting units. If the carrying amount of a reporting unit exceeds its fair value, the second step of the goodwill impairment test is performed to measure the amount of impairment loss, if any. | ||
| The second step of the goodwill impairment test compares the implied fair value of the reporting unit’s goodwill with the carrying amount of that goodwill. If the carrying amount of the reporting unit’s goodwill exceeds the implied fair value of that goodwill, an impairment loss is recognized in an amount equal to that excess. The implied fair value of goodwill is determined in the same manner as the amount of goodwill recognized in a business combination. | ||
| Under Brazilian GAAP, goodwill is analyzed in relation to its future recovery based on total estimated future profitability and discounted cash flows. No impairment has been recorded for Brazilian GAAP purposes. | ||
| The Company performed its annual impairment review for goodwill and recorded a charge for purposes of reconciliation of R$ 373.8 at December 31, 2005 as Operating Income in the condensed consolidated statement of operations. This impairment charge reflects the impact of the decrease in market conditions of its investment in Politeno, included in the column “U.S. GAAP“ in the segment footnote (Note 31(w)). | ||
| (f) | Effects of U.S. GAAP adjustments on equity investees | |
| Under BR GAAP the equity investees, Cetrel, Copesul and Petroflex are proportionally consolidated according to CVM 247/96. Under U.S. GAAP such equity investees are accounted under the equity method. | ||
| For purposes of the U.S. GAAP reconciliation, the effects in the statement of operations of U.S. GAAP adjustments on equity investees amounted to R$ (56.8), R$ (46.5) and R$ (92.2) in 2006, 2005 and 2004, respectively. | ||
| In addition, due to the adoption of SFAS no. 158 “Employers’ Accounting for Defined Benefit Pension and Other Postretirement Plans — an Amendment of FASB Statements No. 87, 88, 106, and 132(R)” (Note 31 (i)), the Company recognized the effects from its investees Petroflex and Copesul through comprehensive income, in the amount of R$ 10.9 and R$ 2.1, respectively. |
F-89
Table of Contents
at December 31, 2006, 2005 and 2004
All amounts in millions ofreais, unless otherwise indicated
| (g) | Transactions giving rise to distributions to and contribution from shareholders under U.S. GAAP | |
| Transactions between parties under common control gave raise to goodwill under Brazilian GAAP which is treated as capital distributions and contributions under U.S. GAAP: |
| 2006 | 2005 | |||||||
| Acquisition of ESAE and related transactions (i) | (363.2 | ) | (363.2 | ) | ||||
| OPP PP transactions (ii) | (1,814.6 | ) | (1,814.6 | ) | ||||
| Contributions from shareholders (iii) | 406.5 | 400.6 | ||||||
| Total | (1,771.3 | ) | (1,777.2 | ) | ||||
| (i) Acquisition of ESAE and Related Transactions | ||
| Under Brazilian GAAP, the acquisition of ESAE was accounted for at book value. Under U.S. GAAP, the acquisition would be accounted for using the purchase method with the assets acquired and the liabilities assumed from third parties recorded at fair value. The portions of net assets that were already held by the Odebrecht Group would be maintained at their existing book values, and the excess of the proportional amount of the purchase price over these book values would be considered a distribution to the Odebrecht Group in the amount of R$ 363.2. |
| Purchase | Value of | Capital | ||||||||||||||
| Investment Acquired | Price | Investments | Goodwill | Distribution | ||||||||||||
| 30.99% of Politeno | 739.4 | 141.9 | 373.8 | 223.7 | ||||||||||||
| 42.64% of Polialden | 658.4 | 157.3 | 387.8 | 113.3 | ||||||||||||
| Subtotal (100% of Braskem Participações) | 1,397.8 | 299.2 | 761.6 | 337.0 | ||||||||||||
| 100% of Proppet | 51.1 | 10.6 | 14.3 | 26.2 | ||||||||||||
| 1,448.9 | 309.8 | 775.9 | 363.2 | |||||||||||||
| Under U.S. GAAP, the total payment of R$ 1,448.9 made in the acquisition of ESAE and related transactions is divided into payments made to third parties and payments made to companies under common control as follows: |
| Common control transactions | Third party transactions | |||||||||||||||||||||||
| Fair value | ||||||||||||||||||||||||
| Payment | Book | Capital | Purchase | of net | ||||||||||||||||||||
| made | value | distribution | price | assets | Goodwill | |||||||||||||||||||
| 100% of Braskem Participações | 381.1 | 44.1 | 337.0 | 1,016.7 | 255.1 | 761.6 | ||||||||||||||||||
| 100% of Proppet | 39.1 | 12.8 | 26.2 | 12.0 | (2.3 | ) | 14.3 | |||||||||||||||||
| 420.2 | 56.9 | 363.2 | 1,028.7 | 252.8 | 775.9 | |||||||||||||||||||
F-90
Table of Contents
at December 31, 2006, 2005 and 2004
All amounts in millions ofreais, unless otherwise indicated
| Nova Camaçari acquired Braskem Participações through the acquisition of the entire share capital of ESAE and Intercapital and the acquisition of an 11.76% direct interest in Conepar. Nova Camaçari acquired Intercapital for total consideration of R$ 445.0, of which R$ 381.0 was paid to members of the Odebrecht Group and the remaining R$ 64.0 was paid to members of the Mariani Group (Pronor Petroquímica S.A. and Companhia Brasileira de Poliolefinas). The net assets acquired from the Odebrecht Group were valued at a carryover basis of R$ 12.8, while the net assets acquired from the Mariani Group were valued at fair value of R$ 16.1. | ||
| (ii) OPP PP Transaction | ||
| Under Brazilian GAAP, since the terms of the exchange of Braskem and OPP PP shares were based on the appraised economic value of each company, the transaction was accounted for on that basis. | ||
| Under U.S. GAAP, the common control transaction would be recorded at the book value of OPP PP’s consolidated net assets as of July 25, 2001. On that date the difference between consideration paid and the net liabilities of OPP PP under U.S. GAAP was R$ 1,814.6 and the issuance of Braskem shares to the Odebrecht Group would, therefore, be considered a distribution in that amount. | ||
| The fair value of the stock issued by the Company for the acquisition of OPP PP was R$ 1,268.4 on August 16, 2002. At that time OPP PP had a negative carryover book basis of R$ 546.2 under U.S. GAAP, resulting in a capital distribution of R$ 1,814.6 under U.S. GAAP. The Company adjusted the Brazilian GAAP shareholders’ equity to reflect the U.S. GAAP capital distribution of R$ 1,814.6 and made corresponding adjustments to deferred charges, property, plant and equipment and goodwill recorded in investments. At December 31, 2006, the residual balances within deferred charges of R$ 395.1 was represented by cost R$ 994.3 and accumulated amortization of R$ 599.2. | ||
| (iii) Contributions from shareholders | ||
| Under Brazilian GAAP, the acquisition of 46.4% of minority interests of Trikem, was undertaken through exchange of shares, and accounted for on that basis. Under U.S. GAAP, the difference between the book and the fair value of the shares issued was recorded as additional paid in capital. Accordingly, during 2004, this transaction generated a contribution from shareholders amounting to R$ 339.4. | ||
| Also, during 2004, the Company acquired minority interests of Polialden utilizing shares held in treasury. Under U.S. GAAP, the difference between the book value and the market value of the shares amounting to R$ 46.5 was recorded as additional paid in capital. |
F-91
Table of Contents
at December 31, 2006, 2005 and 2004
All amounts in millions ofreais, unless otherwise indicated
| As mentioned in Note 1 (ix), the Company acquired minority interests representing 32.6% of the total share capital of Polialden, by the issuance of 7,878,725 class A preferred shares. Under Brazilian GAAP, the Class A preferred shares were issued based upon the book value. Under U.S. GAAP, the difference raised between the book and the fair-value of these shares issued was recorded as an additional paid in capital. This transaction generated a contribution to shareholders amounting to R$ 5.9. | ||
| (h) | Guarantees | |
| The fair value of guarantees is initially determined by consideration of data in observable markets, comparable transactions and the utilization of probability-weighted discounted net cash flow models. | ||
| The Company has directly guaranteed debt obligations under agreements with third parties related to an equity affiliate. At December 31, 2006, the Company had directly guaranteed under financing of the controlled entities, Petroflex and Petroquímica Paulínia for R$ 6.4 (2005 – R$ 16.7) and R$ 339.7 (2005 – no guarantees granted), respectively. This represents the maximum potential amount of future (undiscounted) payments that the Company could be required to make under the guarantees. In addition the Company has some commitments regarding purchase agreements as stated in the Note 29. | ||
| The fair value of the guarantees that have been issued or modified since the Company’s adoption of FASB Interpretation Nº 45 on January 1, 2003, is not material. As of December 31, 2006, the liabilities recorded for these obligations were not material. | ||
| (i) | Pension plan | |
| In determining the pension and other post-retirement benefit obligations for Brazilian GAAP purposes, Brazilian Accounting Standard NPC 26 is effective for financial statements beginning with the year ended December 31, 2001. As permitted by NPC 26, the transitional obligation, which is the difference between a plan’s net assets and the projected benefit obligation at that date, was fully recognized as a direct charge to retained earnings. After January, 2002 under U.S. GAAP, SFAS Nº 87, “Employer’s Accounting for Pensions”, is effective for fiscal years beginning after 1988. As from such date, when an initial transition obligation determined based on an actuarial valuation is recognized, actuarial gains and losses, as well as unexpected variations in plan assets and the projected benefit obligation and the effects of amendments, settlements and other events, would be recorded in accordance with these standards and therefore result in deferral differences. Through 1997, these amounts were treated as non-monetary and were indexed for inflation. U.S. GAAP also requires recognition of an additional minimum liability. Unrecognized actuarial gains and losses are amortized either over the estimated future service period of employees or over the estimated remaining period until the plan final settlement, whichever the less. | ||
| Although the calculation of the sufficiency funded status has been the same since December 31, 2001, differences arise on (i) actuarial gains and losses as there is initially no actuarial gain or loss at December 31, 2001, (ii) recognition of the initial transition obligation and (iii) the minimum liability under U.S. GAAP. |
F-92
Table of Contents
at December 31, 2006, 2005 and 2004
All amounts in millions ofreais, unless otherwise indicated
| SFAS no. 158 “Employers’ Accounting for Defined Benefit Pension and Other Postretirement Plans — an Amendment of FASB Statements No. 87, 88, 106, and 132(R)”requires an employer to recognize the overfunded or underfunded status of a defined benefit pension and post-retirement plan (other than a multiemployer plan) as an asset or liability in its statement of financial position and to recognize changes in that funded status in the year in which the changes occur through comprehensive income of a business entity or changes in unrestricted net assets of a not-for-profit organization. SFAS 158 also requires an employer to measure the funded status of a plan as of the date of its year-end statement of financial position, with limited exceptions. We are required to initially recognize the funded status of our defined benefit pension and post-retirement plans and to provide the required disclosures as of December 31, 2006. The requirement to measure plan assets and benefit obligations as of the date of the employer’s fiscal year end statement of financial position is effective for us for our fiscal year ending December 31, 2008. | ||
| Based on the report of the Company’s independent actuary, the summary of the sufficiency of funds and amounts recorded in the U.S. GAAP condensed balance sheet as at December 31, 2006 and 2005 and the condensed statement of operations for 2006, 2005 and 2004 for our pension liabilities to retired beneficiaries in accordance with SFAS Nº 132, “Employer’s Disclosures About Pensions and Other Post-Retirement Benefits — revised”, is as follows: |
F-93
Table of Contents
at December 31, 2006, 2005 and 2004
All amounts in millions ofreais, unless otherwise indicated
| 2006 | 2005 | |||||||
Change in benefit obligation | ||||||||
| Net projected benefit obligation at beginning of year | (415.5 | ) | (336.2 | ) | ||||
| Service cost | — | (3.7 | ) | |||||
| Interest cost | (46.9 | ) | (19.0 | ) | ||||
| Curtailment | — | 11.5 | ||||||
| Actuarial loss | 3.0 | (79.3 | ) | |||||
| Gross benefits paid | — | 11.2 | ||||||
| Net projected benefit at end of year | (459.4 | ) | (415.5 | ) | ||||
| Accumulated benefit obligation at end of year | 459.4 | 415.5 | ||||||
Change in plan assets | ||||||||
| Fair value of plan assets at beginning of year | 360.1 | 289.5 | ||||||
| Actual return on plan assets | 46.4 | 76.8 | ||||||
| Employer contributions | — | 3.0 | ||||||
| Employee contributions | — | 2.0 | ||||||
| Gross benefits paid | — | (11.2 | ) | |||||
| Fair value of plan assets at end of year | 406.5 | 360.1 | ||||||
Prepaid pension cost | ||||||||
| Unfunded status at end of year | (52.8 | ) | (55.3 | ) | ||||
| Unrecognized net actuarial loss | 4.3 | 65.2 | ||||||
| Prepaid (accrued) pension cost | (48.5 | ) | 9.9 | |||||
Additional minimum pension liability | ||||||||
| Prepaid pension cost | (48.5 | ) | 9.9 | |||||
| Additional amount recognized in shareholders equity | (4.3 | ) | (65.2 | ) | ||||
| Minimum pension liability | (52.8 | ) | (55.3 | ) | ||||
| 2006 | 2005 | |||||||
Weighted-average assumptions as of December 31 (%) | ||||||||
| Discount rate | 11.0 | 11.0 | ||||||
| Expected return on plan assets | 11.0 | 11.0 | ||||||
| Rate of compensation increase | 0 | 0 | ||||||
| Projected annual inflation rate (added to the above percentages) | 5.0 | 5.0 | ||||||
F-94
Table of Contents
at December 31, 2006, 2005 and 2004
All amounts in millions ofreais, unless otherwise indicated
| As Braskem had already recognized the unfunded status of the pension plan in as a liability and the unrecognized loss as a debit to a separate account in shareholders’ equity the initial application of FAS 158 had no impact on assets, liabilities nor net shareholders’ equity. |
| The charge in the statement of operations is comprised as follows: |
| 2006 | 2005 | 2004 | ||||||||||
Components of net periodic benefit cost (credit) | ||||||||||||
| Service cost | — | 3.7 | 7.5 | |||||||||
| Interest cost | 46.9 | 36.9 | 33.3 | |||||||||
| Expected return on assets | (40.7 | ) | (29.9 | ) | (25.9 | ) | ||||||
| Amortization of unrecognized actuarial losses | 52.2 | 22.4 | 5.1 | |||||||||
| Employee contributions | — | (2.0 | ) | (3.6 | ) | |||||||
| Total net periodic benefit cost (credit) | 58.4 | 31.1 | 16.4 | |||||||||
| % | ||||||||
| Range of | Range of | |||||||
| Allocation for | Allocation for | |||||||
| 2006 | 2005 | |||||||
| Investments targets and composition of plan assets | ||||||||
| Equity securities | 20.0 to 30.0 | 23.1 | ||||||
| Real estate | 2.5 to 4.5 | 4.2 | ||||||
| Fixed income | 55.0 to 74.0 | 68.9 | ||||||
| Loans | 3.0 to 6.0 | 3.8 | ||||||
| In June 2005, the Company communicated to its employees the permanent suspension of the defined benefit plan effective on June 30, 2005. As a result, the Company recorded a curtailment gain of R$ 11.5 million which was recorded as a reduction of the unrecognized actuarial losses. Settlement requires approval of the Secretariat for Complementary Pension and unrecognized actuarial losses are being amortized since July 2005, over the expected period to final approval which is shorter than the remaining service life of the active employees. | ||
| (j) | Earnings per share | |
| Under Brazilian GAAP, net income or loss per share is calculated based on the number of shares outstanding at the balance sheet date retroactively restated for the 250 for one share reverse split in March 2005 (Note 1 (d)) for all periods. Information is disclosed per share. | ||
| Under U.S. GAAP, because the preferred and common shares have different voting and liquidation rights, basic and diluted earnings per share have been calculated using the “two-class” method, pursuant to SFAS Nº 128, “Earnings per Share”, which provides computation, presentation and disclosure requirements for earnings per share. The two-class method is an earnings allocation formula that determines earnings per share for preferred and common shares according to the dividends to be paid as required by the Company’s by-laws and participation rights in undistributed earnings. Basic earnings per common share are computed by dividing net income by the weighted-average number of common and preferred shares outstanding during the year. |
F-95
Table of Contents
at December 31, 2006, 2005 and 2004
All amounts in millions ofreais, unless otherwise indicated
| The table below presents the determination of U.S. GAAP net income available to common and preferred shareholders and weighted average common and preferred shares outstanding used to calculate basic and diluted earnings per share for each of the years presented under U.S. GAAP. All references to the number of preferred and common shares and per share amounts have been restated to give retroactive effect to the May 2005 (Note 1 (d)) share reverse split for all periods presented. |
| December 31, 2006 | ||||||||||||||||
| Class A | Class B | |||||||||||||||
| Common | Preferred | Preferred | ||||||||||||||
| Share | Shares | Shares | Total | |||||||||||||
| Basic numerator — undiluted | ||||||||||||||||
| Minimum 6% dividend | 15.5 | 137.0 | 0.5 | 153.0 | ||||||||||||
| Induced conversion of Class A preferred shares into Common shares (Note 20 (a)) | — | 8.6 | — | 8.6 | ||||||||||||
| Total undistributed earnings | 15.5 | 145.6 | 0.5 | 161.6 | ||||||||||||
| Weighted average numbers of shares | ||||||||||||||||
| Basic and diluted | 122.4 | 248.3 | 0.8 | 371.5 | ||||||||||||
| Basic and diluted earnings per thousand outstanding shares – (whole reais) — R$ | 0.13 | 0.59 | 0.63 | |||||||||||||
| On May 31, 2006 the shareholders of the Company approved the conversion of 2,632,043 class A preferred shares into common shares (Note 20(a)). In accordance with EITF Topic No. D-42“The Effect on the Calculation of Earnings per Share for the Redemption or Induced Conversion of Preferred Stock”the amount of R$ 8.6 was subtracted from net earnings available to common shareholders in the calculation of earnings per share for the year ended December 31, 2006. |
| December 31, 2005 | ||||||||||||||||
| Class A | Class B | |||||||||||||||
| Common | Preferred | Preferred | ||||||||||||||
| Share | Shares | Shares | Total | |||||||||||||
| Basic numerator — undiluted | ||||||||||||||||
| Minimum 6% dividend | 68.2 | 135.6 | 0.5 | 204.3 | ||||||||||||
| Undistributed earnings allocation | 179.6 | 357.3 | — | 536.9 | ||||||||||||
| Total undistributed earnings | 247.8 | 492.9 | 0.5 | 741.2 | ||||||||||||
| Weighted average numbers of shares | ||||||||||||||||
| Basic | 120.9 | 240.4 | 0.8 | 362.1 | ||||||||||||
| Diluted | 142.1 | 290.0 | — | 432.1 | ||||||||||||
| Basic earnings per thousand outstanding shares – (whole reais) - R$ | 2.05 | 2.05 | 0.63 | |||||||||||||
| Effects of conversion | (0.10 | ) | (0.10 | ) | ||||||||||||
| Diluted earnings per thousand shares – (whole reais) — R$ | 1.95 | 1.95 | ||||||||||||||
F-96
Table of Contents
at December 31, 2006, 2005 and 2004
All amounts in millions ofreais, unless otherwise indicated
| December 31, 2004 | ||||||||||||||||
| Class A | Class B | |||||||||||||||
| Common | Preferred | Preferred | ||||||||||||||
| Share | Shares | Shares | Total | |||||||||||||
| Basic numerator — undiluted | ||||||||||||||||
| Minimum 6% dividend | 68.2 | 135.5 | 0.5 | 204.2 | ||||||||||||
| Undistributed earnings allocation | 213.8 | 425.1 | — | 638.9 | ||||||||||||
| Total undistributed earnings | 282.0 | 560.6 | 0.5 | 843.1 | ||||||||||||
| Weighted average numbers of shares | ||||||||||||||||
| Basic | 107.4 | 208.7 | 0.9 | 317.0 | ||||||||||||
| Diluted | 126.5 | 263.4 | 389.9 | |||||||||||||
| Basic earnings per thousand outstanding shares – (whole reais) - R$ | 2.63 | 2.69 | 0.56 | |||||||||||||
| Effects of conversion | (0.23 | ) | (0.29 | ) | ||||||||||||
| Diluted earnings per thousand shares – (whole reais) — R$ | 2.40 | 2.40 | ||||||||||||||
| (k) | Comprehensive income | |
| Under Brazilian GAAP, the concept of comprehensive income is not recognized. | ||
| Under U.S. GAAP, SFAS Nº 130, “Reporting Comprehensive Income”, requires the disclosure of comprehensive income. Comprehensive income is comprised of net income and other comprehensive income that include charges or credits directly to equity which are not the result of transactions with owners. For Braskem and its jointly controlled companies Copesul and Petroflex, the components of comprehensive income are its net income or loss and the changes in minimum pension liability (Note 31(z)(iii)). | ||
| (l) | Capital issuance costs | |
| Under BR GAAP, costs of issuance of equity securities issued through December 31, 2005, were accounted as deferred charges in the balance sheet. As required by CVM Release 01/2006, the costs of issuance of equity securities issued as from 2006, will be accounted as non recurrent expenses in the operational results. No capital issuance costs were incurred in 2005 and 2006. | ||
| Under U.S. GAAP, specific incremental costs directly attributable to a share offering may be netted against the gross capital issued. For the year ended December 31, 2004, the Company |
F-97
Table of Contents
at December 31, 2006, 2005 and 2004
All amounts in millions ofreais, unless otherwise indicated
| had incurred in R$ 58.1 million of capital issuance costs, charged against the gross proceeds of the offering. | ||
| (m) | Income taxes | |
| Under Brazilian GAAP, according to CVM Deliberation 273/98 and CVM Instruction Nº 371/02, the deferred income tax asset represents the estimated amount to be recovered. | ||
| Under U.S. GAAP, deferred taxes are accrued on all temporary tax differences. Deferred tax assets and liabilities are classified as current or long-term based on the classification of the asset or liability underlying the temporary difference. Deferred income tax assets and liabilities in the same tax jurisdiction are netted rather than presented gross. | ||
| In addition, under Brazilian GAAP no deferred tax asset is recognized relating to temporary timing differences or income tax losses which are expected to be realized after a period of ten years from the balance sheet date. Under U.S. GAAP there is no limit to the period in which deferred tax assets may be realized and the valuation allowance recognition for Brazilian GAAP purposes at December 31, 2006 in the amount of R$ 11.9 (2005 – R$ 18.1) was reversed for U.S. GAAP purposes. | ||
| For purposes of the U.S. GAAP reconciliation, the adjustment for deferred taxes relates to the U.S. GAAP adjustments. Additional income tax (charges) in the reconciliation benefits relating to other U.S. GAAP adjustments were recognized in the statement of operations under U.S. GAAP of R$ (123.2), R$ 39.9 and R$ 48.8 in 2006, 2005 and 2004, respectively. | ||
| (n) | Tax incentives | |
| Under Brazilian GAAP, the various tax incentives of the Company (in the form of tax reduction or exemption for defined periods) are accounted for directly in a capital reserve account in shareholders’ equity. | ||
| For U.S. GAAP reconciliation purposes, the amount of those incentives has been credited to the statement of operations instead of to a capital reserve. | ||
| (o) | Revenue recognition | |
| Under Brazilian GAAP, it is acceptable to record sales revenues either at the date of shipment on signing a sales contract or at the date that the product is delivered to and accepted by the customer, although the prevalent practice is to record sales at the date of shipment. | ||
| Under U.S. GAAP, and in accordance with SEC Staff Accounting Bulletin Nº 101 and 104, sales are normally recorded when legal title passes to the buyer. In addition, multiple element service contracts are recognized only when certain conditions are met. Accordingly, for U.S. GAAP reconciliation purposes, the Company deferred the gain on multiple element contract with its jointly controlled company Petroquímica Paulínia, amounting to R$ (18.1) at December 31, 2006 (2005 – R$ 3.6). |
F-98
Table of Contents
at December 31, 2006, 2005 and 2004
All amounts in millions ofreais, unless otherwise indicated
| (p) | Consolidation of securitization funds | |
| Under Brazilian GAAP, until the year ended 2003, in respect of the accounting treatment for the Braskem’s trade receivable securitization program, the transfer of receivables to the fund was treated as a sale of receivables and the discount on the sale was immediately recorded in the statement of operations. In August 2004, CVM issued CVM Instruction 408 providing for the inclusion of Special Purpose Entities in the consolidated financial statement of publicly – held companies and therefore those entities have been consolidated in 2004 and 2005. | ||
| Under U.S. GAAP, in accordance with FASB Interpretation Nº 46 “Consolidation of Variable Interest Entities (revised December 2003)”, trade receivable securitization funds are variable interest entities and have been consolidated in all periods presented. | ||
| (q) | Accounting for maintenance costs | |
| Under Brazilian GAAP, as from January 1st, 2006 the built-in overhaul method, consistent with the application of component approach was applied for maintenance costs as required by IBRACON Technical Interpretation 01/2006. The components of plant requiring maintenance had previously been treated as an integral part of principal plant and subjected to the same depreciation rate. With the treatment of all maintenance costs as separate components of property, plant and equipment instead of deferring maintenance costs as incurred, the change in accounting practice resulted in a reclassification from deferred assets to property, plant and equipment of R$ 400.2 at January 1, 2006 and debt to retained earnings in the amount of R$ 164.9. | ||
| Considering that both the deferral and the built-in overhaul method are acceptable methods under U.S. GAAP, the Company believes that the built-in overhaul method is considered the preferential accounting method for maintenance costs. | ||
| Due to that change, under U.S. GAAP the new accounting policy has been retrospectively applied to all prior periods presented in accordance with the provisions of paragraph 7 of SFAS 154 “Accounting Changes and Error Corrections.” This will represent a difference at the U.S. GAAP net income and shareholders equity reported for prior periods (Note 31(z)(iii)). |
F-99
Table of Contents
at December 31, 2006, 2005 and 2004
All amounts in millions ofreais, unless otherwise indicated
| The effects of the retrospective application of the accounting principle can be summarized as follows: |
| Shareholder’s equity | Statement of income | |||||||||||||||
| As of | As of | As of | As of | |||||||||||||
| December | December | December | December | |||||||||||||
| 31, 2005 | 31, 2004 | 31, 2005 | 31, 2004 | |||||||||||||
| As previously reported | 3,063.6 | 2,588.9 | 737.1 | 887.8 | ||||||||||||
| Effect of change in accounting principle (*) | (164.9 | ) | (171.1 | ) | 6.2 | (51.2 | ) | |||||||||
| Equity in investees | 19.7 | 21.8 | (2.1 | ) | 6.5 | |||||||||||
| As adjusted due to retrospective application of accounting principle | 2,918.4 | 2,439.6 | 741.2 | 843.1 | ||||||||||||
| (*) | Theses adjustments affected the condensed balance sheet under U.S. GAAP as Property, plant and equipment account balances by these respectively amounts. |
| (r) | Long-term share incentive plan | |
| SFAS Statement 123 (R) “Share Based Payment”, requires the measuring and recording of the cost of employee services in exchange for awards of equity instruments based on the grant-date fair value of those awards (with limited exceptions). Awards granted with other than market condition shall be classified as liability awards. That cost will be recognized over the period during which the employee is required to provide the service in exchange for the award. No compensation cost is recognized for equity instruments for which employees do not render the requisite service. SFAS 123 (R) requires entities to initially measure the cost of employee services received in exchange for an award of liability instruments based on its current fair value. Changes in fair value during the requisite service period will be recognized as compensation cost over that period. The grant date fair value and the fair value of each reporting period of employee share options are estimated using the Black-Scholes option-pricing model. SFAS 123 (R) is effective as of the beginning of the first interim or annual reporting period that begins after June 15, 2005. As described in further details below, the Company has granted a long-term share incentive plan (the “Plan”) to certain employees to purchase investment certificates at prices below market. The market value of the options granted will be recognized for U.S. GAAP purposes as expense over the period in which the services are rendered. The fair value of the options classified as liability award will be reassessed each reporting date. |
F-100
Table of Contents
at December 31, 2006, 2005 and 2004
All amounts in millions ofreais, unless otherwise indicated
| Braskem’s Plan, entitles officers and employees involved in strategic plans of the Company to buy investment certificates, up to pre-defined maximum quantities. The investment certificates bought by the participants are named alpha, beta and gama certificates. The costs to employees of the certificates are equivalent to the average value of one Class A Preferred Share negotiated at Bovespa from the months of October through March. Alpha and beta certificates represent the right to receive the fair value of a Class A Preferred at vesting. Gama certificates represent the dividends and interest on own capital paid to the Company’s shareholders during the period through vesting. | ||
| The shareholders approved the maximum amount of 204,845 alpha, beta and gama certificates to be offered to participants. The certificates are generally offered to the participants in April of each year. Following the offer, the participants generally have 30 days to acquire via payment the certificates. Only certificates bought by the participants are considered granted, since the certificates offered and not paid do not generate any benefit to the participant. The amount deposited by the employees was initially recognized as a liability for both Brazilian and U.S. GAAP and totaled R$ 1.7 million. The liability is updated based on the greater of the amount which employees may withdraw and the variation in the share price (each alpha and gama acquired generate a cashflow equal to a preferred share), which generated no variation throughat December 31, 2006. | ||
| Under the Plan, 20% of the balance of alpha and beta investment certificates vests after 5 years of continuous service and the remaining balance vests at the rate of 10% per year after the 6th year. After the 10th year, beta certificates not redeemed are transformed to alpha certificates and the employee has no further incentive for that grant. Gama certificates vests and are paid to the employees when dividends and interest on own capital is paid to the Company’s shareholders. One alpha and one gama certificate provide the employee with a cash flow similar to one preferred share and are valued as such for the purposes of the amounts initially deposited. The beta certificate is considered to generate an incentive similar to a share option scheme, employees may be awarded shares if they remain employees for a number of years. | ||
| Under U.S. GAAP, the Company accounts for beta certificates in accordance with FASB 123 (R) since 2006. The beta certificate is a considered a liability award, compensation cost has been recognized as the fair value of beta certificate at each reporting date. The fair value for these options was estimated at the date of grant using a Black-Scholes option pricing model with the following weighted-average assumptions: |
| At December 31, 2006 | 1st grant | |||
| Risk-free interest rates | 8.42 | % | ||
| Exercise price | 18.14 | |||
| Dividend yield | 6.00 | % | ||
| Volatility factors of the market | 54.1 | % | ||
| Stock market price | R$14.85 | |||
| Expected life of the option | 9.3 years | |||
F-101
Table of Contents
at December 31, 2006, 2005 and 2004
All amounts in millions ofreais, unless otherwise indicated
| A summary of investment certificate activity under the Plan as of December 31, 2006, and changes during the year then ended is presented below: |
| Weighted-average | ||||||||||||
| Investment | Weighted- | remaining contractual | ||||||||||
| certificates | average | (compensation) term | ||||||||||
| (In units) | purchase price | (years) | ||||||||||
| Outstanding at January 1, 2006 | ||||||||||||
| Granted | 97,372 | 18.14 | ||||||||||
| Exercised | — | |||||||||||
| Forfeited | (1,653 | ) | ||||||||||
| Outstanding at December 31, 2006 | 95,719 | 18.14 | 9.3 | |||||||||
| Redeemable at December 31, 2006 | — | |||||||||||
| Under Brazilian GAAP, as of December 31, 2006, the difference between the total value determined for the investment certificates and the deposit liability was recorded in the statement of operations and amounted to R$ 0.6. Under U.S. GAAP, the expense in relation to the beta certificates will be recorded based on the term that the participant employees are expected to provide service to the Company, limited to the contractual life of the Plan. For the year ended December 31, 2006, the Company recorded an expense of R$ 0.1 under U.S. GAAP. | ||
| (s) | Proportional consolidation of jointly-controlled entities | |
| Under Brazilian GAAP, jointly-controlled entities must be consolidated using the proportional consolidation method. Proportional consolidation requires that the share of the assets, liabilities, income and expenses be combined on a line-by-line basis with similar items in the Company’s financial statements. Under U.S. GAAP, jointly-controlled entities are recorded under the equity method, except that joint ventures for which the principal financial and operational decisions are jointly controlled by all of the entities equity holders are permitted to be proportionally consolidated for U.S. GAAP reconciliation purposes. The pro-rated accounts of our jointly-controlled investees have not been proportionally consolidated in the condensed U.S. GAAP balance sheet and statements of operations, except for Politeno in 2005 which became a subsidiary in April, 2006 (Note 1(viii)) and Petroquímica Paulinia, an development stage company which was organized on September, 2005 (Note 1(vi). Both companies meet the U.S. GAAP joint venture requirements. |
F-102
Table of Contents
at December 31, 2006, 2005 and 2004
All amounts in millions ofreais, unless otherwise indicated
| The following table presents summarized assets and liabilities of Politeno and Petroquímica Paulínia that are proportionally consolidated in the balance sheet in accordance with U.S. GAAP: |
| Politeno | Petroquímica Paulínia | |||||||||||
| 2005 | 2006 | 2005 | ||||||||||
| Total current assets | 110.3 | 61.5 | 4.5 | |||||||||
| Property, plant and equipment | 103.7 | 67.3 | 34.9 | |||||||||
| Total assets | 272.5 | 128.8 | 39.4 | |||||||||
| Total current liabilities | 55.3 | 2.3 | ||||||||||
| Total long-term liabilities | 22.9 | 50.4 | 34.9 | |||||||||
| The following table shows summarized income and expenses and cash flow of Politeno and Petroquímica Paulinia that are proportionally consolidated in the statement of operations in accordance with U.S. GAAP: |
| For the year Ended December 31, | ||||||||||||||||
| Petroquímica | ||||||||||||||||
| Politeno | Paulínia | |||||||||||||||
| 2005 | 2004 | 2006 | 2005 | |||||||||||||
Statement of operations | ||||||||||||||||
| Net sales | 397.3 | 379.2 | ||||||||||||||
| Operating income (loss) | 29.1 | 43.3 | (2.0 | ) | ||||||||||||
| Net income | 11.9 | 33.0 | (2.0 | ) | ||||||||||||
Cash flows | ||||||||||||||||
| Net cash provided by operating activities | 31.3 | 18.0 | 1.8 | |||||||||||||
| Net cash used in investing activities | (7.3 | ) | (7.7 | ) | (34.3 | ) | ||||||||||
| Net cash used by financing activities | (23.8 | ) | (13.6 | ) | 86.6 | 4.5 | ||||||||||
| (t) | Classification of statement of operations line items | |
| Under Brazilian GAAP, in addition to the issues noted above, the classification of certain income and expense items are presented differently from U.S. GAAP. We have restated our statement of operations under Brazilian GAAP to present a condensed statement of operations in accordance with U.S. GAAP (Note 31(z)(ii)). The reclassifications are summarized as follows: |
F-103
Table of Contents
at December 31, 2006, 2005 and 2004
All amounts in millions ofreais, unless otherwise indicated
| (u) | Classification of balance sheet line items | |
| Under Brazilian GAAP, the classification of certain balance sheet items is presented differently from U.S. GAAP. We have restated our consolidated balance sheet under Brazilian GAAP to present a condensed consolidated balance sheet in accordance with U.S. GAAP (Note 31(z)(i)). The reclassifications are summarized as follows: |
F-104
Table of Contents
at December 31, 2006, 2005 and 2004
All amounts in millions ofreais, unless otherwise indicated
| (v) | Dividends | |
| Under Brazilian GAAP, the Company’s executive officers proposed a dividend distribution from earnings, which has been recorded. Under U.S. GAAP, the amount of dividends exceeding the minimum mandatory dividend is not deemed declared before the distribution is approved by the shareholders. For purposes of reconciliation, the Company has excluded the amount which exceeded the minimum mandatory dividend amounting to R$ 18.5 at December 31, 2006 (2005 – R$ 55.7). | ||
| Under Braskem’s by laws, interest on own capital may be declared and paid upon authorization of the Board of Directors. | ||
| (w) | Segment reporting | |
| Under Brazilian GAAP, there is no obligation to present disaggregated information with respect to the business segments of an enterprise. | ||
| Under U.S. GAAP, SFAS 131, “Disclosures About Segments of an Enterprise and Related Information”, requires that public enterprises disclose certain information about segments on the basis that top management uses to allocate resources among segments and evaluate their performance. |
F-105
Table of Contents
at December 31, 2006, 2005 and 2004
All amounts in millions ofreais, unless otherwise indicated
| • | Basic Petrochemicals—comprising basic petrochemical production activities and supply of electricity, steam and compressed air to second generation producers. This segment is dependent on Petrobras for supply of raw material. | ||
| • | Polyolefins—comprising activities related to the production of polyethylene and polypropylene. | ||
| • | Vinyls—comprising activities related to the production of PVC, caustic soda and chlorine. One client represents 11.1%, 10.2% and 14.1% of Vinyl revenues for the years ended December 31, 2006, 2005 and 2004, respectively. | ||
| • | Business Development—comprising activities related to the production of other second generation petrochemical products. One client represents 23.3%, 22.6% and 27.6% of Business Development revenues for the years ended December 31, 2006, 2005 and 2004, respectively. |
| December 31 | ||||||||
| 2006 | 2005 | |||||||
| Basic Petrochemicals | 5,426.6 | 5,458.9 | ||||||
| Polyolefins | 4,200.6 | 2,867.9 | ||||||
| Vinyls | 2,294.9 | 2,116.8 | ||||||
| Business Development | 573.3 | 547.8 | ||||||
| Other | 3,808.9 | 4,599.4 | ||||||
| Total assets | 16,304.3 | 15,590.8 | ||||||
F-106
Table of Contents
at December 31, 2006, 2005 and 2004
All amounts in millions ofreais, unless otherwise indicated
| 2006 | ||||||||||||||||||||||||||||||||||||||||||||
| Business Segments | ||||||||||||||||||||||||||||||||||||||||||||
| Braskem | ||||||||||||||||||||||||||||||||||||||||||||
| Eliminations | consolidated | |||||||||||||||||||||||||||||||||||||||||||
| Basic | Business | Total | and | before | Braskem | U.S. GAAP | ||||||||||||||||||||||||||||||||||||||
| Vinyls | Polyolefins | Petrochemicals | Development | Segments | Adjustments | CVM 247(*) | CVM 247 | consolidated | Differences | U.S. GAAP | ||||||||||||||||||||||||||||||||||
Net sales revenue | 1,541.7 | 4,775.8 | 6,883.6 | 483.1 | 13,684.2 | (1,965.2 | ) | 11,719.0 | 1,273.7 | 12,992.7 | (1,029.3 | ) | 11,963.4 | |||||||||||||||||||||||||||||||
| Cost of sales | (1,245.3 | ) | (3,985.4 | ) | (5,994.8 | ) | (545.7 | ) | (11,771.2 | ) | 1,889.6 | (9,881.6 | ) | (910.5 | ) | (10,792.1 | ) | 468.3 | (10,323.8 | ) | ||||||||||||||||||||||||
Gross profit | 296.4 | 790.4 | 888.8 | (62.6 | ) | 1,913.0 | (75.6 | ) | 1,837.4 | 363.2 | 2,200.6 | (561.0 | ) | 1,639.6 | ||||||||||||||||||||||||||||||
Operating expenses (income) | ||||||||||||||||||||||||||||||||||||||||||||
| Selling and general administrative | 123.0 | 344.5 | 339.0 | 26.0 | 832.5 | 41.9 | 874.4 | 77.1 | 951.5 | 10.7 | 962.2 | |||||||||||||||||||||||||||||||||
| Depreciation and amortization | 0.4 | 10.4 | 0.4 | 0.1 | 11.3 | 368.3 | 379.6 | 5.4 | 385.0 | (366.7 | ) | 18.3 | ||||||||||||||||||||||||||||||||
| Other, net | (35.1 | ) | (22.5 | ) | 10.4 | (1.9 | ) | (49.1 | ) | (107.8 | ) | (156.9 | ) | (29.2 | ) | (186.1 | ) | 139.0 | (47.1 | ) | ||||||||||||||||||||||||
| 88.3 | 332.4 | 349.8 | 24.2 | 794.7 | 302.4 | 1,097.1 | 53.3 | 1,150.4 | (217.0 | ) | 933.4 | |||||||||||||||||||||||||||||||||
Operating income | 208.1 | 458.0 | 539.0 | (86.8 | ) | 1,118.3 | (378.0 | ) | 740.3 | 309.9 | 1,050.2 | (344.0 | ) | 706.2 | ||||||||||||||||||||||||||||||
| (*) | “CVM 247” refers to proportional consolidation under Brazilian GAAP (Note 3 (g)) and “Braskem consolidated before CVM 247” includes depreciation at R$ 576.4 within this cost of sales. |
F-107
Table of Contents
at December 31, 2006, 2005 and 2004
All amounts in millions ofreais, unless otherwise indicated
| 2005 | ||||||||||||||||||||||||||||||||||||||||||||
| Business Segments | ||||||||||||||||||||||||||||||||||||||||||||
| Braskem | ||||||||||||||||||||||||||||||||||||||||||||
| Eliminations | consolidated | |||||||||||||||||||||||||||||||||||||||||||
| Basic | Business | Total | and | before | Braskem | U.S. GAAP | ||||||||||||||||||||||||||||||||||||||
| Vinyls | Polyolefins | Petrochemicals | Development | Segments | Adjustments | CVM 247(*) | CVM 247 | consolidated | Differences | U.S. GAAP | ||||||||||||||||||||||||||||||||||
Net sales revenue | 1,794.1 | 3,919.0 | 7,226.7 | 569.0 | 13,508.8 | (1,894.2 | ) | 11,614.6 | 1,460.5 | 13,075.1 | (1,067.3 | ) | 12,007.8 | |||||||||||||||||||||||||||||||
| Cost of sales | (1,271.9 | ) | (3,182.8 | ) | (6,138.5 | ) | (552.9 | ) | (11,146.1 | ) | 1,827.6 | (9,318.5 | ) | (1,043.2 | ) | (10,361.7 | ) | 709.1 | (9,652.6 | ) | ||||||||||||||||||||||||
Gross profit | 522.2 | 736.2 | 1,088.2 | 16.1 | 2,362.7 | (66.6 | ) | 2,296.1 | 417.3 | 2,713.4 | (358.2 | ) | 2,355.2 | |||||||||||||||||||||||||||||||
Operating expenses (income) | ||||||||||||||||||||||||||||||||||||||||||||
| Selling and general administrative | 89.2 | 229.0 | 250.3 | 18.2 | 586.7 | 89.7 | 676.4 | 110.7 | 787.1 | (5.5 | ) | 781.6 | ||||||||||||||||||||||||||||||||
| Depreciation and amortization | 0.8 | 6.9 | — | 0.3 | 8.0 | 342.2 | 350.2 | 5.4 | 355.6 | (283.7 | ) | 71.9 | ||||||||||||||||||||||||||||||||
| Impairment | — | — | — | — | — | — | — | — | — | 373.8 | 373.8 | |||||||||||||||||||||||||||||||||
| Other, net | (6.6 | ) | (53.0 | ) | (57.1 | ) | (9.2 | ) | (125.9 | ) | 56.1 | (69.8 | ) | 47.0 | (22.8 | ) | 13.3 | (9.5 | ) | |||||||||||||||||||||||||
| 83.4 | 182.9 | 193.2 | 9.3 | 468.8 | 488.0 | 956.8 | 163.1 | 1,119.9 | 97.9 | 1,217.8 | ||||||||||||||||||||||||||||||||||
Operating income | 438.8 | 553.3 | 895.0 | 6.8 | 1,893.9 | (554.6 | ) | 1,339.3 | 254.2 | 1,593.5 | (456.1 | ) | 1,137.4 | |||||||||||||||||||||||||||||||
| (*) | “CVM 247” refers to proportional consolidation under Brazilian GAAP (Note 3 (g)) and “Braskem consolidated before CVM 247” includes depreciation at R$ 409.9 within this cost of sales. |
F-108
Table of Contents
at December 31, 2006, 2005 and 2004
All amounts in millions ofreais, unless otherwise indicated
| 2004 | ||||||||||||||||||||||||||||||||||||||||||||
| Business Segments | ||||||||||||||||||||||||||||||||||||||||||||
| Braskem | ||||||||||||||||||||||||||||||||||||||||||||
| Eliminations | consolidated | |||||||||||||||||||||||||||||||||||||||||||
| Basic | Business | Total | and | before | Braskem | U.S. GAAP | ||||||||||||||||||||||||||||||||||||||
| Vinyls | Polyolefins | Petrochemicals | Development | Segments | Adjustments | CVM 247(*) | CVM 247 | consolidated | Differences | U.S. GAAP | ||||||||||||||||||||||||||||||||||
Net sales revenue | 1,858.8 | 3,489.4 | 6,480.0 | 620.8 | 12,449.0 | (1,404.8 | ) | 11,044.2 | 1,345.3 | 12,389.5 | (745.4 | ) | 11,644.1 | |||||||||||||||||||||||||||||||
| Cost of sales | (1,157.1 | ) | (2,523.0 | ) | (5,330.1 | ) | (564.9 | ) | (9,575.1 | ) | 1,269.4 | (8,305.7 | ) | (917,3 | ) | (9,223.0 | ) | 231.8 | (8,991.2 | ) | ||||||||||||||||||||||||
Gross profit | 701.7 | 966.4 | 1,149.9 | 55.9 | 2,873.9 | (135.4 | ) | 2,738.5 | 428.0 | 3,166.5 | (513.6 | ) | 2,652.9 | |||||||||||||||||||||||||||||||
Operating expenses (income) | ||||||||||||||||||||||||||||||||||||||||||||
| Selling and general administrative | 80.1 | 199.1 | 213.8 | 24.9 | 517.9 | 62.8 | 580.7 | 96.3 | 677.0 | 173.7 | 850.7 | |||||||||||||||||||||||||||||||||
| Depreciation and amortization | 0.6 | 5.9 | 2.6 | 0.7 | 9.8 | 344.0 | 353.8 | 5.9 | 359.7 | (296.0 | ) | 63.7 | ||||||||||||||||||||||||||||||||
| Other, net | (14.9 | ) | (6.3 | ) | (22.2 | ) | (2.6 | ) | (46.0 | ) | 10.8 | (35.2 | ) | (7.8 | ) | (43.0 | ) | 15.8 | (27.2 | ) | ||||||||||||||||||||||||
| 65.8 | 198.7 | 194.2 | 23.0 | 481.7 | 417.6 | 899.3 | 94.4 | 993.7 | (106.5 | ) | 887.2 | |||||||||||||||||||||||||||||||||
Operating income | 635.9 | 767.7 | 955.7 | 32.9 | 2,392.2 | (553.0 | ) | 1,839.2 | 333.6 | 2,172.8 | (407.1 | ) | 1,765.7 | |||||||||||||||||||||||||||||||
| (*) | “CVM 247” refers to proportional consolidation under Brazilian GAAP (Note 3 (g)) and “Braskem consolidated before CVM 247” includes depreciation at R$ 366.7 within this cost of sales. |
F-109
Table of Contents
at December 31, 2006, 2005 and 2004
All amounts in millions ofreais, unless otherwise indicated
| Years Ended December 31 | ||||||||||||
| 2006 | 2005 | 2004 | ||||||||||
| Domestic sales | 9,671.7 | 10,348.0 | 9,949.3 | |||||||||
| Exports from Brazil | 3,321.0 | 2,727.1 | 2,440.2 | |||||||||
| Total net sales | 12,992.7 | 13,075.1 | 12,389.5 | |||||||||
| Information on the geographical composition of the Company’s sales is as follows: |
| Years Ended December 31 | ||||||||||||
| 2006 | 2005 | 2004 | ||||||||||
| Destination of exports from Brazil | ||||||||||||
| Americas | 2,059.0 | 1,827.2 | 1,586.1 | |||||||||
| Far East | 431.7 | 327.3 | 292.8 | |||||||||
| Europe | 830.3 | 572.6 | 536.8 | |||||||||
| Other | — | — | 24.5 | |||||||||
| Total exports | 3,321.0 | 2,727.1 | 2,440.2 | |||||||||
| Domestic sales | 9,671.7 | 10,348.0 | 9,949.3 | |||||||||
| Total net sales | 12,992.7 | 13,075.1 | 12,389.5 | |||||||||
| (x) | Recently issued accounting standards | |
| In February 2006, the FASB issued FAS 155, “Accounting for certain hybrid financial instruments”, which amends FASB Statements Nº 133, Accounting for Derivative Instruments and Hedging Activities, and FAS 140 “Accounting for Transfers and Servicing of Financial Assets and Extinguishments of Liabilities”. This Statement or solves issues addressed in Statement 133 Implementation Issue Nº D1, “Application of Statement 133 to Beneficial Interests in Securitized Financial Assets”. The Company does not expect FASB 155 to have a significant impact on its financial position, results of operations or cash flows. | ||
| In March 2006, the FASB issued FAS 156, “Accounting for Servicing Financial Assets”, which amends FASB Statements Nº 140 “Accounting for Transfers and Servicing of Financial Assets and Extinguishments of Liabilities”. This Statement or solves issues addressed in Statement 140 regarding recognition for all servicing financial asset or liability and its measurement methods. The Company does not expect FASB 156 to have a significant impact on its financial position, results of operations or cash flows. |
F-110
Table of Contents
at December 31, 2006, 2005 and 2004
All amounts in millions ofreais, unless otherwise indicated
| In June 2006, the Financial Accounting Standards Board (“FASB”) issued Emerging Issues Task Force (“EITF”) 06-03, “How Taxes Collected from Customers and Remitted to Governmental Authorities Should Be Presented in the Income Statement (That Is, Gross Versus Net Presentation).” EITF 06-03 requires that any tax assessed by a governmental authority that is imposed concurrent with or subsequent to a revenue-producing transaction between a seller and a customer should be presented on a gross (included in revenues and costs) or a net (excluded from revenues) basis. In addition, for any such taxes that are reported on a gross basis, a company should disclose the amounts of those taxes in interim and annual financial statements for each period for which an income statement is presented if those amounts are significant. EITF 06-03 will be effective for interim and annual reporting periods beginning after December 15, 2006. The Company is currently evaluating the impact that the application of this new standard will have on its consolidated financial statements. | ||
| In July 2006, the FASB issued FIN 48, “Accounting for uncertainty in income taxes”, which prescribes a comprehensive model for how a Company should recognize, measure, present, and disclose in its financial statements uncertain tax positions that the Company has taken or expects to take on a tax return. Currently, the Company has no uncertain tax positions that will affect its tax return and therefore, the Company has concluded that the adoption of this standard will have no significant impact on its financial statements. | ||
| In September 2006, the FASB issued SFAS No. 157, “Fair Value Measurements,” which formally defines fair value, creates a standardized framework for measuring fair value in generally accepted accounting principles (“GAAP”), and expands fair value measurement disclosures. SFAS 157 will be effective for fiscal years beginning after November 15, 2007. The Company is currently evaluating the impact that the application of this new standard will have on its financial statements, as of January 1, 2008. | ||
| In September 2006, the SEC issued Staff Accounting Bulletin No. 108, “Considering the Effects of Prior Year Misstatements when Quantifying Misstatements in Current Year Financial Statements” (“SAB 108”). SAB 108 provides interpretive guidance on how the effects of the carryover or reversal of prior year misstatements should be considered in quantifying a current year misstatement. The SEC staff believes that registrants should quantify errors using both a balance sheet and income statement approach and evaluate whether either approach results in quantifying a misstatement that, when all relevant quantitative and qualitative factors considered, is material. SAB 108 is effective for fiscal years ending on or after November 15, 2006. The Company’s adoption of SAB 108 did not have an impact on its financial position or results of operations. | ||
| In February, 2007, the FASB issued FAS 159 “The fair value option for financial assets and financial liabilities” including an amendment of FASB Statement 115 “Accounting for certain investments in debt and equity securities”, permits the company to choose to measure many financial instruments and certain other items at fair value. The Company is currently evaluation the impact that the application of this new standard will have on its financial statements, as of 2007. |
F-111
Table of Contents
at December 31, 2006, 2005 and 2004
All amounts in millions ofreais, unless otherwise indicated
| (y) | Reconciliation of principal differences between Brazilian GAAP and U.S. GAAP | |
| Net income |
| Years Ended December 31 | ||||||||||||||
| Reference | 2006 | 2005 | 2004 | |||||||||||
Net income under Brazilian GAAP | 101.3 | 625.8 | 687.1 | |||||||||||
| Depreciation of additional indexation of permanent assets for 1996 and 1997 | 31(b) | (28.6 | ) | (39.9 | ) | (37.3 | ) | |||||||
| Capitalized interest | 31(c) | — | 50.3 | 34.1 | ||||||||||
| Amortization of capitalized interest | 31(c) | (38.7 | ) | (38.3 | ) | (38.1 | ) | |||||||
| Deferred charges, net | 31(d) | 34.5 | 82.1 | (142.9 | ) | |||||||||
| Business combination and goodwill adjustments | 31(e) | 330.6 | 35.5 | 382.5 | ||||||||||
| Pension plan | 31(i) | (58.4 | ) | (27.7 | ) | (20.2 | ) | |||||||
| Tax incentives | 31(n) | 11.9 | 52.0 | 63.7 | ||||||||||
| Revenue recognition | 31(o) | (18.1 | ) | (3.6 | ) | — | ||||||||
| Amortization capital issuance cost | 31 (l) | 5.8 | 5.8 | |||||||||||
| Effects of U.S. GAAP adjustments on equity Investees | 31(f) | (56.8 | ) | (46.5 | ) | (92.2 | ) | |||||||
| Deferred income tax on adjustments above | 31(m) | (123.2 | ) | 39.9 | 48.8 | |||||||||
| Long-term incentive plan | 31 (r) | 0.5 | — | — | ||||||||||
| Minority interest on adjustments above | 0.8 | 1.7 | 2.3 | |||||||||||
Net income under U.S. GAAP – as previously reported | 161.6 | 737.1 | 887.8 | |||||||||||
| Change in accounting principle — maintenance cost | 31 (q) | — | 4.1 | (44.7 | ) | |||||||||
Net income under U.S. GAAP – as adjusted | 161.6 | 741.2 | 843.1 | |||||||||||
F-112
Table of Contents
at December 31, 2006, 2005 and 2004
All amounts in millions ofreais, unless otherwise indicated
| Shareholders’ Equity |
| December 31 | ||||||||||||||
| Reference | 2006 | 2005 | ||||||||||||
Shareholders’ equity under Brazilian GAAP | 4,311.9 | 4,535.8 | ||||||||||||
| Additional indexation of permanent assets for 1996 and 1997 | 31(b) | 1,135.8 | 1,135.8 | |||||||||||
| Depreciation of additional indexation of permanent assets for 1996 and 1997 | 31(b) | (442.6 | ) | (414.0 | ) | |||||||||
| Capitalized interest, net | 31(c) | 536.3 | 536.3 | |||||||||||
| Amortization of capitalized interest | 31(c) | (369.6 | ) | (330.9 | ) | |||||||||
| Deferred charges, net | 31(d) | (408.3 | ) | (442.8 | ) | |||||||||
| Business combination adjustments | 31(e) | 291.6 | (55.2 | ) | ||||||||||
| Distributions to shareholders | 31(g) | (1,771.3 | ) | (1,777.2 | ) | |||||||||
| Capital issuance costs | 31(l) | (46.5 | ) | (52.3 | ) | |||||||||
| Pension plan | 31(i) | (12.1 | ) | (14.6 | ) | |||||||||
| Consolidation of variable interest entities | 31(p) | 0.7 | 0.7 | |||||||||||
| Equity investees | 31(f) | (226.2 | ) | (182.8 | ) | |||||||||
| Treasury shares | 10.4 | 10.4 | ||||||||||||
| Revenue recognition | 31(o) | (2.2 | ) | (3.6 | ) | |||||||||
| Reversal of proposed dividends | 31(v) | 18.5 | 55.7 | |||||||||||
| Deferred income tax adjustments | 31(m) | (185.7 | ) | (62.5 | ) | |||||||||
| Long-term incentive plan | 31 (r) | 0.5 | — | |||||||||||
| Minority interest on adjustments above | 125.6 | 124.8 | ||||||||||||
Shareholders’ equity under U.S. GAAP – as previously reported | 2,966.8 | 3,063.6 | ||||||||||||
| Change in accounting principle — maintenance cost | 31 (q) | — | (145.2 | ) | ||||||||||
Shareholders’ equity under U.S. GAAP – as adjusted | 2,966.8 | 2,918.4 | ||||||||||||
| (z) | U.S. GAAP condensed financial information | |
| Based on the reconciling items and discussion above, Braskem’s consolidated balance sheet, statement of operations and statement of changes in shareholders’ equity under U.S. GAAP have been recast in condensed format as follows: |
F-113
Table of Contents
at December 31, 2006, 2005 and 2004
All amounts in millions ofreais, unless otherwise indicated
| (i) | Condensed balance sheet under U.S. GAAP |
| 2006 | 2005 | |||||||
Assets | ||||||||
| Current assets | ||||||||
| Cash and cash equivalents | 667.2 | 531.8 | ||||||
| Short-term investments | 1,174.0 | 1,682.5 | ||||||
| Trade accounts receivable, net | 1,598.6 | 1,425.3 | ||||||
| Taxes recoverable | 383.0 | 303.8 | ||||||
| Inventories | 1,504.3 | 1,336.2 | ||||||
| Dividends receivable | 4.9 | 6.2 | ||||||
| Prepaid expenses | 79.5 | 44.3 | ||||||
| Advances to suppliers | 125.0 | 87.1 | ||||||
| Other receivables | 46.4 | 56.4 | ||||||
| 5,582.9 | 5,473.6 | |||||||
| Investments | 554.1 | 508.9 | ||||||
| Goodwill, net | 450.5 | 450.5 | ||||||
| Property, plant and equipment | 6,636.8 | 5,862.4 | ||||||
| Other noncurrent assets | ||||||||
| Receivables from related parties | 40.9 | 61.0 | ||||||
| Prepaid expenses | 99.0 | 112.5 | ||||||
| Inventories, net | 22.9 | 75.8 | ||||||
| Intangible assets | 175.1 | 40.7 | ||||||
| Other taxes recoverable | 912.3 | 527.3 | ||||||
| Deferred income tax | 143.4 | 306.1 | ||||||
| Restricted deposits for legal proceedings | 206.5 | 161.9 | ||||||
| Other receivables | 66.3 | 53.3 | ||||||
| 1,666.4 | 1,338.6 | |||||||
| Total assets | 14,890.7 | 13,634.0 | ||||||
F-114
Table of Contents
at December 31, 2006, 2005 and 2004
All amounts in millions ofreais, unless otherwise indicated
| 2006 | 2005 | |||||||
Liabilities and shareholders’ equity | ||||||||
| Current liabilities | ||||||||
| Suppliers | 3,080.4 | 2,659.3 | ||||||
| Payroll and related charges | 128.6 | 108.0 | ||||||
| Taxes on income payable | 0.7 | 55.2 | ||||||
| Other taxes payable | 101.2 | 140.0 | ||||||
| Fair market value of derivative financial instruments | 98.2 | 39.4 | ||||||
| Short-term debt, including current portion of long-term debit | 418.1 | 699.0 | ||||||
| Interest payable on short-term debt and debentures | 271.3 | 117.1 | ||||||
| Debentures | 958.6 | — | ||||||
| Related parties | — | 6.5 | ||||||
| Advances from customers | 12.1 | 35.5 | ||||||
| Dividend payable | 22.0 | 237.7 | ||||||
| Other | 425.3 | 35.4 | ||||||
| 5,516.5 | 4,133.1 | |||||||
| Long-term liabilities | ||||||||
| Long-term debt | 3,799.0 | 3,182.1 | ||||||
| Debentures | 950.0 | 1,599.3 | ||||||
| Fair market value of derivative financial instruments | 31.7 | 8.1 | ||||||
| Related parties | 4.4 | — | ||||||
| Minimum pension liability | 52.8 | 55.3 | ||||||
| Taxes and contributions payable | 1,418.0 | 1,451.2 | ||||||
| Other | 122.0 | 135.3 | ||||||
| 6,377.9 | 6,431.3 | |||||||
| Minority interest | 29.5 | 151.2 | ||||||
| Shareholders’ equity | 2,966.8 | 2,918.4 | ||||||
| Total liabilities and shareholder’s equity | 14,890.7 | 13,634.0 | ||||||
F-115
Table of Contents
at December 31, 2006, 2005 and 2004
All amounts in millions ofreais, unless otherwise indicated
| (ii) | Condensed statement of operations under U.S. GAAP |
| 2006 | 2005 | 2004 | ||||||||||
Gross sales | 15,045.5 | 15,341.0 | 14,780.0 | |||||||||
| Value -added and other taxes, discounts and returns | (3,082.1 | ) | (3,333.2 | ) | (3,135.9 | ) | ||||||
Net sales revenue | 11,963.4 | 12,007.8 | 11,644.1 | |||||||||
| Cost of sales | (10,323.8 | ) | (9,652.6 | ) | (8,991.2 | ) | ||||||
Gross profit | 1,639.6 | 2,355.2 | 2,652.9 | |||||||||
Operating income (expenses) | ||||||||||||
| Selling, general and administrative | (962.2 | ) | (781.6 | ) | (850.7 | ) | ||||||
| Depreciation and amortization | (18.3 | ) | (71.9 | ) | (63.7 | ) | ||||||
| Impairment of goodwill | (373.8 | ) | ||||||||||
| Other, net | 47.1 | 9.5 | 27.2 | |||||||||
Operating income | 706.2 | 1,137.4 | 1,765.7 | |||||||||
Non-operating income (expenses) | ||||||||||||
| Financial income | 232.6 | (46.5 | ) | (62.3 | ) | |||||||
| Financial expenses | (916.0 | ) | (565.8 | ) | (1,110.2 | ) | ||||||
| Other | 17.3 | (24.4 | ) | (24.3 | ) | |||||||
Income before income tax, equity in results of associated companies and minority interest | 40.1 | 500.7 | 568.9 | |||||||||
Income tax benefit (expense) | ||||||||||||
| Current | (3.9 | ) | (24.0 | ) | (66.2 | ) | ||||||
| Deferred | (21.9 | ) | 17.3 | 185.1 | ||||||||
Income before equity in results of associated companies and minority interest | 14.3 | 494.0 | 687.8 | |||||||||
| Equity in earnings of associated companies | 147.3 | 179.5 | 177.6 | |||||||||
| Minority interest | — | 67.7 | (22.3 | ) | ||||||||
Net income for the year | 161.6 | 741.2 | 843.1 | |||||||||
F-116
Table of Contents
at December 31, 2006, 2005 and 2004
All amounts in millions ofreais, unless otherwise indicated
| (iii) | Condensed changes in shareholders’ equity under U.S. GAAP |
| 2006 | 2005 | |||||||||||||||||||||||
| Accumulated other | Other | Accumulated other | Other | |||||||||||||||||||||
| comprehensive | equity | Total | comprehensive | equity | Total | |||||||||||||||||||
| income | accounts | equity | income | accounts | equity | |||||||||||||||||||
At beginning of the year – as previously reported | 1,512.6 | 1,405.8 | 2,918.4 | 763.8 | 1,825.1 | 2,588.9 | ||||||||||||||||||
| Change in accounting principle — maintenance cost | — | — | — | — | (149.3 | ) | (149.3 | ) | ||||||||||||||||
| Adoption of SFAS 158 | 73.9 | — | 73.9 | |||||||||||||||||||||
At beginning of the year – as adjusted | 1,586.5 | 1,405.8 | 2,992.3 | 763.8 | 1,675.8 | 2,439.6 | ||||||||||||||||||
| Net income | 161.6 | — | 161.6 | 741.2 | — | 741.2 | ||||||||||||||||||
| Changes in minimum pension liability | — | — | — | 7.6 | — | 7.6 | ||||||||||||||||||
| Total comprehensive income | 1,748.1 | 1,405.8 | 3,153.9 | 1,512.6 | 1,675.8 | 3,188.4 | ||||||||||||||||||
| Capital increase | — | 105.3 | 105.3 | — | — | — | ||||||||||||||||||
| Distribution shareholders | — | 5.9 | 5.9 | — | — | — | ||||||||||||||||||
| Repurchase of treasury shares | — | (224.3 | ) | (224.3 | ) | — | — | — | ||||||||||||||||
| Dividends and interest in own capital | — | (74.0 | ) | (74.0 | ) | — | (270.0 | ) | (270.0 | ) | ||||||||||||||
At end of the year | 1,748.1 | 1,218.7 | 2,966.8 | 1,512.6 | 1,405.8 | 2,918.4 | ||||||||||||||||||
F-117
Table of Contents
| Report of Independent Registered Public Accounting Firm | ||
| To the Board of Directors and Shareholders Copesul — Companhia Petroquímica do Sul and Subsidiaries | ||
| 1 | We have audited the accompanying consolidated balance sheets of Copesul — Companhia Petroquímica do Sul and subsidiaries (“the Company”) as of December 31, 2006 and 2005 and the related consolidated statements of income, of changes in shareholders’ equity, of changes in financial position and of cash flows for each of the three years in the period ended December 31, 2006. These financial statements are the responsibility of the Company’s management. Our responsibility is to express an opinion on these financial statements based on our audits. | |
| 2 | We conducted our audits in accordance with the standards of the Public Company Accounting Oversight Board (United States). Those standards require that we plan and perform the audit to obtain reasonable assurance about whether the financial statements are free of material misstatement. An audit includes examining, on a test basis, evidence supporting the amounts and disclosures in the financial statements. An audit also includes assessing the accounting principles used and significant estimates made by management, as well as evaluating the overall financial statement presentation. We believe that our audits provide a reasonable basis for our opinion. |
F-118
Table of Contents
| Copesul — Companhia Petroquímica do Sul and Subsidiaries | ||
| 3 | In our opinion, the consolidated financial statements referred to above present fairly, in all material respects, the consolidated financial position of Copesul — Companhia Petroquímica do Sul and subsidiaries at December 31, 2006 and 2005 and the consolidated results of their operations, the changes in their financial position and their cash flows for each of the three years in the period ended December 31, 2006, in conformity with accounting practices adopted in Brazil. | |
| 4 | Accounting practices adopted in Brazil vary in certain significant respects from accounting principles generally accepted in the United States of America. Information relating to the nature and effect of such differences is presented in Note 28 to the consolidated financial statements. |
| PricewaterhouseCoopers | Porto Alegre, Brazil | |
| Auditores Independentes | April 30, 2007 |
F-119
Table of Contents
All amounts in millions of reais
| 2006 | 2005 | 2006 | 2005 | |||||||||||||||
Assets | Liabilities and shareholders' equity | |||||||||||||||||
Current assets | Current liabilities | |||||||||||||||||
| Cash and banks (Note 4) | 201 | 113 | Suppliers | |||||||||||||||
| Trade accounts receivable | Third parties (Note 14) | 290 | 154 | |||||||||||||||
| Third parties (Note 5) | 195 | 149 | Related parties (Note 27) | 63 | 2 | |||||||||||||
| Related parties (Note 27) | 59 | 49 | Loans and financing (Note 15) | 50 | 288 | |||||||||||||
| Export drafts — billed (Note 16) | (1 | ) | (18 | ) | Export drafts - to be invoiced (Note 16) | 39 | 1 | |||||||||||
| Credits ceded to receivables securitization fund (FIDC) (Note 7) | (13 | ) | Taxes and charges payable (Note 17) | 45 | 42 | |||||||||||||
| Swap receivables (Note 6) | 64 | 53 | Social and labor contributions and charges | 45 | 49 | |||||||||||||
| Marketable securities (Note 7) | 38 | 13 | Proposed dividends (Note 19 (d) (iii)) | 185 | 68 | |||||||||||||
| Inventories (Note 8) | 571 | 495 | Interest on own capital (Note 19 (d) (iii)) | 17 | 21 | |||||||||||||
| Taxes and charges recoverable (Note 9) | 115 | 43 | Income tax and social contribution (Note 18) | 44 | 9 | |||||||||||||
| Prepaid expenses (Note 10) | 14 | 14 | Provision for programmed manintenance (Note 19 (e) (i)) | 16 | ||||||||||||||
| Other accounts receivable | 5 | 9 | Swap and options payable (Note 6) | 23 | 5 | |||||||||||||
| Advances from customers | 5 | 13 | ||||||||||||||||
| 1,261 | 907 | Profit sharing and other | 35 | 27 | ||||||||||||||
Non-current assets | 841 | 695 | ||||||||||||||||
Long-term assets | Non-current liabilities | |||||||||||||||||
| Marketable securities (Note 7) | 1 | 1 | Long-term liabilities | |||||||||||||||
| Taxes and charges recoverable (Note 9) | 137 | 133 | Loans and financing (Note 15) | 107 | 84 | |||||||||||||
| Judicial deposits (Note 11) | 9 | 8 | Export drafts - to be invoiced (Note 16) | 139 | 91 | |||||||||||||
| Prepaid expenses (Note 10) | 4 | 6 | Provision for programmed maintenance (Note 19 (e) (i)) | 52 | ||||||||||||||
| Loans to third parties | 3 | 6 | Deferred contributions and taxes (Note 18) | 37 | 1 | |||||||||||||
| Claims receivable and other | 2 | 1 | Provision for contingencies (Note 24) | 34 | 11 | |||||||||||||
| Actuarial liability - PETROS (Note 25) | 9 | 7 | ||||||||||||||||
| 156 | 155 | 326 | 246 | |||||||||||||||
Permanent assets | Shareholders’ equity (Note 19) | |||||||||||||||||
| Investments | 10 | 9 | Capital | 850 | 750 | |||||||||||||
| Property, plant and equipment (Note 12) | 1,030 | 1,106 | Capital reserve | 296 | 341 | |||||||||||||
| Deferred charges (Note 13) | 10 | 11 | Revaluation reserve | 75 | 109 | |||||||||||||
| Revenue reserve | 79 | 47 | ||||||||||||||||
| 1,050 | 1,126 | 1,300 | 1,247 | |||||||||||||||
Total assets | 2,467 | 2,188 | Total liabilities and shareholders’ equity | 2,467 | 2,188 | |||||||||||||
F-120
Table of Contents
Years Ended December 31
In millions of reais, unless otherwise indicated
| 2006 | 2005 | 2004 | ||||||||||
Gross sales | ||||||||||||
| Sale of petrochemical products and utilities | ||||||||||||
| Local market | 7,186 | 6,527 | 6,267 | |||||||||
| Foreign market | 761 | 765 | 774 | |||||||||
| Sale of services and resale of goods | 201 | 56 | 112 | |||||||||
| 8,148 | 7,348 | 7,153 | ||||||||||
Taxes and contributions on sales | ||||||||||||
| ICMS | (982 | ) | (1,041 | ) | (1,051 | ) | ||||||
| PIS, COFINS, CIDE and other | (790 | ) | (691 | ) | (661 | ) | ||||||
| (1,772 | ) | (1,732 | ) | (1,712 | ) | |||||||
Net sales and services | 6,376 | 5,616 | 5,441 | |||||||||
| Cost of products, utilities and services | (5,292 | ) | (4,610 | ) | (4,418 | ) | ||||||
Gross profit | 1,084 | 1,006 | 1,023 | |||||||||
Operating (expenses) income | ||||||||||||
| Selling | (133 | ) | (125 | ) | (136 | ) | ||||||
| General and administrative | (51 | ) | (43 | ) | (41 | ) | ||||||
| Management fees | (3 | ) | (2 | ) | (2 | ) | ||||||
| Other operating income (expenses), net (Note 21) | 20 | 22 | 42 | |||||||||
| (167 | ) | (148 | ) | (137 | ) | |||||||
Operating profit before financial result | 917 | 858 | 886 | |||||||||
Financial result (Note 20) | ||||||||||||
| Financial expenses | (463 | ) | (279 | ) | (670 | ) | ||||||
| Financial income | 372 | 137 | 507 | |||||||||
| (91 | ) | (142 | ) | (163 | ) | |||||||
Operating profit | 826 | 716 | 723 | |||||||||
Non-operating result, net | ||||||||||||
| Non-operating income | (6 | ) | (4 | ) | 1 | |||||||
| Non-operating expenses | 2 | 10 | (2 | ) | ||||||||
| (4 | ) | 6 | (1 | ) | ||||||||
Income before income tax and social contribution | 822 | 722 | 722 | |||||||||
| Income tax and social contribution (Note 18) | (270 | ) | (231 | ) | (242 | ) | ||||||
Income before profit sharing | 552 | 491 | 480 | |||||||||
| Employees profit sharing | (24 | ) | (22 | ) | (20 | ) | ||||||
| Management profit sharing | (3 | ) | (1 | ) | (1 | ) | ||||||
Income before reversal of interest on own capital | 525 | 468 | 459 | |||||||||
| Reversal of interest on own capital (Note 19) | 90 | 99 | 88 | |||||||||
Net income for the year | 615 | 567 | 547 | |||||||||
Earnings per share (in Brazilian Reais) (Note 19) | 4.10 | 3.77 | 3.64 | |||||||||
F-121
Table of Contents
In millions of reais
| Capital reserve | Revenue reserve | |||||||||||||||||||||||
| Retained earnings | ||||||||||||||||||||||||
| Revaluation | (Acummulated | |||||||||||||||||||||||
| Capital | Fiscal incentives | reserve | Legal | losses) | Total | |||||||||||||||||||
| At December 31, 2003 | 610 | 247 | 179 | 42 | 1,078 | |||||||||||||||||||
| Capitalization of capital reserve — fiscal incentives | ||||||||||||||||||||||||
| FUNDOPEM | 90 | (90 | ) | |||||||||||||||||||||
| Fiscal incentives | ||||||||||||||||||||||||
| FUNDOPEM | 89 | 89 | ||||||||||||||||||||||
| Program for Technological and Industrial Development (PDTI) | 2 | 2 | ||||||||||||||||||||||
| Realization of revaluation reserve | ||||||||||||||||||||||||
| Revaluation - 1983 | (3 | ) | 3 | |||||||||||||||||||||
| Revaluation - 1989 | (32 | ) | 32 | |||||||||||||||||||||
| Income tax and social contribution on realized revaluation reserve | (10 | ) | (10 | ) | ||||||||||||||||||||
| Net income for the year | 547 | 547 | ||||||||||||||||||||||
| Appropriation of net income | ||||||||||||||||||||||||
| Legal reserve | 27 | (27 | ) | |||||||||||||||||||||
| Proposed dividends — R$0.785 per share | (118 | ) | (118 | ) | ||||||||||||||||||||
| Interim dividends — R$2.252 per share | (339 | ) | (339 | ) | ||||||||||||||||||||
| Interest on own capital — R$0.587 per share | (88 | ) | (88 | ) | ||||||||||||||||||||
| At December 31, 2004 | 700 | 248 | 144 | 69 | 1,161 | |||||||||||||||||||
| Capitalization of revenue reserve | ||||||||||||||||||||||||
| Legal Reserve | 50 | (50 | ) | |||||||||||||||||||||
| Fiscal incentives | ||||||||||||||||||||||||
| FUNDOPEM | 89 | 89 | ||||||||||||||||||||||
| Program for Technological and Industrial Development (PDTI) | 4 | 4 | ||||||||||||||||||||||
| Realization of revaluation reserve | ||||||||||||||||||||||||
| Revaluation - 1983 | (3 | ) | 3 | |||||||||||||||||||||
| Revaluation - 1989 | (32 | ) | 32 | |||||||||||||||||||||
| Income tax and social contribution on realized revaluation reserve | �� | (11 | ) | (11 | ) | |||||||||||||||||||
| Net income for the year | 567 | 567 | ||||||||||||||||||||||
| Appropriation of net income | ||||||||||||||||||||||||
| Legal reserve | 28 | (28 | ) | |||||||||||||||||||||
| Proposed dividends — R$0.454 per share | (68 | ) | (68 | ) | ||||||||||||||||||||
| Interim dividends — R$2.635 per share | (396 | ) | (396 | ) | ||||||||||||||||||||
| Interest on own capital — R$0.660 per share | (99 | ) | (99 | ) | ||||||||||||||||||||
| At December 31, 2005 | 750 | 341 | 109 | 47 | 1,247 | |||||||||||||||||||
F-122
Table of Contents
In millions of reais
| Capital reserve | Revenue reserve | |||||||||||||||||||||||
| Revaluation | ||||||||||||||||||||||||
| Capital | Fiscal incentives | reserve | Legal | Retained earnings | Total | |||||||||||||||||||
| At December 31, 2005 | 750 | 341 | 109 | 47 | 1,247 | |||||||||||||||||||
| Adjustment from previous years (Note 19 (e)) | 38 | 38 | ||||||||||||||||||||||
| Capitalization of capital reserve — FUNDOPEM | 100 | (100 | ) | |||||||||||||||||||||
| Fiscal incentives | ||||||||||||||||||||||||
| FUNDOPEM | 50 | 50 | ||||||||||||||||||||||
| Program for Technological and Industrial Development (PDTI) | 5 | 5 | ||||||||||||||||||||||
| Realization of revaluation reserve | ||||||||||||||||||||||||
| Revaluation - 1983 | (4 | ) | 4 | |||||||||||||||||||||
| Revaluation - 1989 | (30 | ) | 30 | |||||||||||||||||||||
| Income tax and social contribution on realized revaluation reserve | (8 | ) | (8 | ) | ||||||||||||||||||||
| Net income for the year | 615 | 615 | ||||||||||||||||||||||
| Appropriation of net income | ||||||||||||||||||||||||
| Legal reserve | 32 | (32 | ) | |||||||||||||||||||||
| Proposed dividends — R$1,229 per share | (185 | ) | (185 | ) | ||||||||||||||||||||
| Interim dividends — R$2.475 per share | (372 | ) | (372 | ) | ||||||||||||||||||||
| Interest on own capital — R$0.597 per share | (90 | ) | (90 | ) | ||||||||||||||||||||
| At December 31, 2006 | 850 | 296 | 75 | 79 | 1,300 | |||||||||||||||||||
F-123
Table of Contents
In millions of reais
| 2006 | 2005 | 2004 | ||||||||||
Financial resources were provided by: | ||||||||||||
Operations | ||||||||||||
| Net income for the year | 615 | 567 | 547 | |||||||||
| Expenses (income) not affecting working capital | ||||||||||||
| Depreciation and amortization | 234 | 202 | 206 | |||||||||
| Provision for realization of investments at market value | (1 | ) | ||||||||||
| Long-term taxes recoverable | (5 | ) | ||||||||||
| Write off of non current assets prepaid expenses | 1 | |||||||||||
| Provision for long-term programmed maintenance | 19 | 34 | ||||||||||
| Provision for administrative, civil and labor contingencies | 24 | 4 | 3 | |||||||||
| Provision for actuarial liability — PETROS | 2 | 2 | 2 | |||||||||
| Interest on long-term amounts receivable | (1 | ) | (10 | ) | (47 | ) | ||||||
| Interest on long-term financing | 6 | 3 | ||||||||||
| Interest on income tax and social contribution on long-term liabilities | 2 | |||||||||||
| Monetary and exchange variations on long-term items | ||||||||||||
| Long-term liabilities | (5 | ) | (11 | ) | (2 | ) | ||||||
| Long-term receivables | (5 | ) | (3 | ) | (23 | ) | ||||||
| Disposals of property, plant and equipment and investments | 2 | 5 | ||||||||||
| Income tax and social contribution | ||||||||||||
| Long-term receivavles | (25 | ) | ||||||||||
| Long-term liabilities | 10 | (2 | ) | (1 | ) | |||||||
| Retained earnings revaluation reserve | (10 | ) | (11 | ) | (10 | ) | ||||||
| 837 | 769 | 712 | ||||||||||
Third parties | ||||||||||||
| Decrease in long-term assets | ||||||||||||
| Marketable securities | 1 | 11 | 12 | |||||||||
| Related parties | 154 | 572 | ||||||||||
| Taxes and charges recoverable | 50 | 6 | 3 | |||||||||
| Prepaid expenses | 3 | 3 | 6 | |||||||||
| Loans to third parties and other | 5 | 5 | 4 | |||||||||
| Increase in long-term liabilities | ||||||||||||
| Financial institutions | 47 | 77 | 121 | |||||||||
| Export drafts to be invoiced | 138 | 114 | ||||||||||
| Fiscal incentives of FUNDOPEM and Program for Technological and Industrial Development | 55 | 93 | 91 | |||||||||
| 299 | 349 | 923 | ||||||||||
Other | ||||||||||||
| Effect on net working capital from the change in the accounting procedure and prior year adjustments | 1 | |||||||||||
Total funds provided | 1,137 | 1,118 | 1,635 | |||||||||
F-124
Table of Contents
| COPESUL — Companhia Petroquímica do Sul | ||
| Consolidated Statements of Changes in Financial Position In millions of reais | (continued) |
| 2006 | 2005 | 2004 | ||||||||||
Financial resources were used for: | ||||||||||||
| Long-term assets | ||||||||||||
| Marketable securities | 23 | |||||||||||
| Related parties | 325 | |||||||||||
| Taxes and charges recoverable | 42 | 21 | 19 | |||||||||
| Prepaid expenses | 1 | 5 | 4 | |||||||||
| Loans to third parties and other | 2 | 1 | 6 | |||||||||
| Permanent assets | ||||||||||||
| Investments | 2 | |||||||||||
| Property, plant and equipment | 126 | 171 | 131 | |||||||||
| Deferred charges | 2 | 3 | 2 | |||||||||
| Transfer from long-term to current liabilities | ||||||||||||
| Financial institutions | 24 | 64 | 195 | |||||||||
| Export drafts to be invoiced | 35 | 371 | ||||||||||
| Provision for programmed maintenance | 11 | 43 | ||||||||||
| Amortization of long-term liabilities | ||||||||||||
| Financial institutions | 79 | 174 | ||||||||||
| Export drafts to be invoiced | 49 | 133 | ||||||||||
| Administrative, civil and labor contingencies | 1 | 2 | 1 | |||||||||
| Distribution of net income | ||||||||||||
| Proposed dividends | 185 | 68 | 118 | |||||||||
| Prepaid dividends | 372 | 396 | 339 | |||||||||
| Interest on own capital | 90 | 99 | 88 | |||||||||
Total funds used | 929 | 920 | 1,974 | |||||||||
Increase (decrease) in working capital | 208 | 198 | (339 | ) | ||||||||
Current assets | ||||||||||||
| At the end of the year | 1,261 | 907 | 754 | |||||||||
| At the beginning of the year | 907 | 754 | 1,387 | |||||||||
| 354 | 153 | (633 | ) | |||||||||
Current liabilities | ||||||||||||
| At the end of the year | 841 | 695 | 740 | |||||||||
| At the beginning of the year | 695 | 740 | 1,034 | |||||||||
| 146 | (45 | ) | (294 | ) | ||||||||
Increase (decrease) in working capital | 208 | 198 | (339 | ) | ||||||||
F-125
Table of Contents
In millions of reais
| 2006 | 2005 | 2004 | ||||||||||
| Cash provided by operating activities | ||||||||||||
| Net income for the year | 615 | 567 | 547 | |||||||||
| Expenses (income) not affecting cash | ||||||||||||
| Depreciation and amortization | 234 | 202 | 206 | |||||||||
| Provision for programmed maintenance | (31 | ) | 36 | |||||||||
| Provision for administrative, civil and labor contingencies | 23 | 4 | 3 | |||||||||
| Provision for actuarial liabilities — PETROS | 2 | 2 | 2 | |||||||||
| Provision for realization of investments at market value | (1 | ) | ||||||||||
| Interest and monetary and exchange variations on assets | ||||||||||||
| Interest | 5 | 15 | 5 | |||||||||
| Monetary and exchange variations | (4 | ) | 6 | (18 | ) | |||||||
| Disposals of property, plant and equipment and other investments | 2 | 5 | ||||||||||
| Net changes in swap receivable | (11 | ) | (52 | ) | 9 | |||||||
| Net changes in swap and options payable | 18 | (3 | ) | (32 | ) | |||||||
| Loans, financing and export drafts | ||||||||||||
| Interest | (11 | ) | (1 | ) | (3 | ) | ||||||
| Monetary and exchange variations | (7 | ) | (36 | ) | (21 | ) | ||||||
| Deferred income tax and social contribution | 4 | 10 | (30 | ) | ||||||||
| Interest on provision for income tax and social contribution | 2 | |||||||||||
| Decrease (increase) in assets | ||||||||||||
| Trade accounts receivable | (57 | ) | 21 | 277 | ||||||||
| Trade notes linked to the FIDC | (13 | ) | (10 | ) | 23 | |||||||
| Inventories | (76 | ) | (68 | ) | (144 | ) | ||||||
| Other accounts receivable | (92 | ) | (36 | ) | 102 | |||||||
| Related parties | 61 | (25 | ) | |||||||||
| Increase (decrease) in liabilities | ||||||||||||
| Suppliers — third parties | 137 | 8 | 59 | |||||||||
| Other accounts payable | 13 | (28 | ) | 21 | ||||||||
| Fiscal incentives of FUNDOPEM, income tax and Program for Technological and Industrial Development | 55 | 93 | 91 | |||||||||
| Net cash provided by operating activities | 899 | 668 | 1,108 | |||||||||
F-126
Table of Contents
| COPESUL — Companhia Petroquímica do Sul | ||
| Consolidated Statements of Cash Flows In millions of reais | (continued) |
| 2006 | 2005 | 2004 | ||||||||||
| Marketable securities | ||||||||||||
| Purchases | (210 | ) | (145 | ) | (997 | ) | ||||||
| Redemptions | 181 | 201 | 910 | |||||||||
| Loans to related parties | ||||||||||||
| Issuances | 5 | (325 | ) | |||||||||
| Repayments | 130 | 522 | ||||||||||
| Additions to investments | (2 | ) | ||||||||||
| Additions to property, plant and equipment | (126 | ) | (171 | ) | (131 | ) | ||||||
| Additions to deferred charges | (2 | ) | (3 | ) | (2 | ) | ||||||
| Net cash provided by (used in) investing activities | (152 | ) | 12 | (25 | ) | |||||||
| Loans, financing and export drafts | ||||||||||||
| Issuances | 1,320 | 1,279 | 772 | |||||||||
| Repayments | (1,447 | ) | (1,411 | ) | (1,707 | ) | ||||||
| Interest on own capital payable paid | (94 | ) | (97 | ) | (83 | ) | ||||||
| Dividends paid | (438 | ) | (513 | ) | (346 | ) | ||||||
| Net cash used in financing activities | (659 | ) | (742 | ) | (1,364 | ) | ||||||
| Net change in cash | 88 | (62 | ) | (281 | ) | |||||||
| Initial cash balance | 113 | 175 | 456 | |||||||||
| Final cash balance | 201 | 113 | 175 | |||||||||
| Net change in cash | 88 | (62 | ) | (281 | ) | |||||||
F-127
Table of Contents
at December 31, 2006 and 2005
All amounts in millions of reais, unless otherwise indicated
| 1 | Operations | |
| The Company, headquartered in Triunfo, Rio Grande do Sul, is a publicly held corporation and main objectives are: a) manufacture, sale, import and export of chemical and petrochemical products and fuel; b) production and distribution of goods, as well as rendering services to companies of the Southern Petrochemical Complex and management of the logistic services pertinent to its waterway and terrestrial terminals; c) participation in other companies as quotaholder or shareholder. Its main shareholders are Braskem S.A., Ipiranga Petroquímica S.A. and Petrobras Química S.A. - PETROQUISA. | ||
| The main suppliers of raw materials in the local market are PETROBRAS — Petróleo Brasileiro S.A. and Refinaria Alberto Pasqualini — REFAP S.A. and overseas, the companies Sonatrach SPA and Repsol YPF S.A. | ||
| The Company’s main customers are located in the Petrochemical Complex in Triunfo, Rio Grande do Sul. Additionally, the Company’s sales of hydrocarbon solvents and fuels are made to both national and international market, and the latter being mainly to Mercosur (Southern Common Market) and the United States. | ||
| 2 | Presentation of financial statements | |
| The financial statements for statutory and regulatory purposes were approved by the Company’s Board of Directors on January 30, 2007. | ||
| The consolidated financial statements have been prepared and are being presented in accordance with accounting practices adopted in Brazil, which are based on Brazilian corporate legislation and standards and procedures of the Brazilian Securities Commission (CVM). The financial statements presented herein do not include the holding company’s stand-alone financial statements, are not intended for statutory purposes, and have been adjusted with respect to the financial statements for statutory purposes to include in Note 28 a reconciliation of net equity and net income between the amounts under accounting practices adopted in Brazil and generally accepted accounting principles in the United States of America as well as certain additional disclosure to facilitate its understanding by readers not familiar with accounting practices adopted in Brazil as described below. | ||
| Due to the change of accounting practice, the provision for programmed maintenance, beginning on January 1, 2006, was totally reversed against retained earnings as required by Deliberation of the Brazilian Securities and Exchange Commission — CVM no. 489 of October 3, 2005 and Technical Interpretation — IT IBRACON no. 01/2006 and its effects are |
F-128
Table of Contents
at December 31, 2006 and 2005
All amounts in millions of reais, unless otherwise indicated
| shown in Note 19 (e) (i). | ||
| The preparation of financial statements in conformity with generally accepted accounting practices requires the use of estimates to account for certain assets and liabilities and other transactions. Therefore, the Company’s financial statements include estimates referring to the selection of useful lives of fixed assets, provisions for contingent liabilities and determination of income tax liabilities. Actual results may differ from such estimates. | ||
| 3 | Significant accounting practices | |
| (a) | Consolidated financial statements | |
| These consolidated statements include the wholly-owned subsidiaries Copesul International Trading, Inc., CCI — Comercial Importadora S.A. and the Fundo de Investimento Financeiro Multimercado Copesul, a mutual fund whose quotas are wholly-owned by the Company. In the consolidation process, intercompany balances, income, expenses and unrealized profits arising from intercompany transactions are eliminated, as well as the investment in the subsidiaries. | ||
| (b) | Marketable securities and swap receivables and payables | |
| Marketable securities are recorded at cost plus accrued income up to the balance sheet date (accrual basis), adjusted to market value, when lower. Investment in quotas of mutual funds are valued at its market value at period-end with gain and losses regognized in the statement of income. As required by accounting standards specifically applicable to mutual funds, investments held by mutual funds, such as the “Fundo de Investimento Financeiro Multimercado Copesul” are valued at its market value at period-end with gain and losses recognized in the statement of income. Derivatives financial instruments, which include swaps and options (Note 6) are recorded at fair value with realized and unrealized gains and losses recognized in income. | ||
| (c) | Allowance for doubtful accounts | |
| The Company has no allowance for doubtful accounts, since losses are not consider to be probable to occur in relation to accounts receivable. |
F-129
Table of Contents
at December 31, 2006 and 2005
All amounts in millions of reais, unless otherwise indicated
| (d) | Inventories | |
| Inventories are stated at average cost of acquisition or production, adjusted to market value, when lower. | ||
| (e) | Investments | |
| Investments are recorded at acquisition cost and adjusted to market value, when applicable. | ||
| (f) | Property, plant and equipment | |
| Property, plant and equipment are stated at cost, plus revaluation, less accumulated depreciation. Depreciation is calculated on the straight-line method in accordance with the estimated useful lives of assets, supported by an independent appraisal report, as shown in Note 12. | ||
| (g) | Deferred charges | |
| Deferred charges include pre-operating expenses related to expansion, projects for new products and systems and organizational restructuring expenditures, amortized at the rate of 20% per year (p.a.), as shown in Note 13. | ||
| (h) | Rights and obligations | |
| Rights are stated at cost or realization value, including, when applicable, interest and monetary restatements and exchange rate variations. Liabilities are recognized at their known or calculable values, including corresponding charges, monetary restatements and exchange rate variations when applicable. | ||
| (i) | Provision for programmed maintenance | |
| Up to December 31, 2005, the Provision for Programmed maintenance was set up accruing in advance the estimated costs of scheduled maintenance stoppage, especially the general stoppage that occurs every six years. The most recent stoppage of Plant 1 occurred in the first half of 2001 and the next one should be in 2008. The most recent stoppage of Plant 2 took place in November 2005 and the next one is planned for November 2011. Due to the change of accounting practice, the provision for programmed maintenance, beginning on January 1, 2006, was totally reversed against retained earnings as established by Deliberation of the Brazilian Securities and Exchange Commission — CVM no. 489 of October 3, 2005 and Technical Interpretation — IT IBRACON no. 01/2006 and its effects are shown in Note 19 (e) (i). |
F-130
Table of Contents
at December 31, 2006 and 2005
All amounts in millions of reais, unless otherwise indicated
| As from January 1, 2006 and in accordance with IT IBRACON 01/2006 no provision is recognized for programmed maintenance. IT IBRACON 01/2006 establishes that “no provision is recognized for costs that need to be incurred to operate in the future. The only liabilities recognized in the balance sheet of an entity are those that exist at the balance sheet date.” As from January 1, 2006 amounts incurred in programmed maintenance are capitalized and amortized over the estimated period to the next programmed maintenance. | ||
| (j) | Income tax and social contribution | |
| Deferred income tax and social contribution on temporary differences were fully recognized at current rates, considering that its realization is probable. | ||
| Income tax and social contribution are provided based on taxable income determined in accordance with current tax legislation. | ||
| (k) | Determination of results of operations | |
| Income and expenses are determined on the accrual basis. | ||
| (l) | Statement of cash flows | |
| In accordance with IBRACON (“Instituto dos Auditores Independentes do Brasil”) Accounting Standards and Procedures (NPC) 20, the Company is presenting the consolidated statements of cash flows for the years ended December 31, 2006, 2005 and 2004. For purposes of the statements of cash flows, cash and banks comprises all cash in hand, amounts deposited in banks and securities, quotas in mutual funds and amounts invested in other debt securities which might be sold by the Company at any moment in exchange for cash. |
F-131
Table of Contents
at December 31, 2006 and 2005
All amounts in millions of reais, unless otherwise indicated
| 4 | Cash and banks |
| 2006 | 2005 | |||||||
| Cash and banks — checking account | 7 | 6 | ||||||
| Marketable securities | ||||||||
| Investments of Fundo de Investimento Financeiro Multimercado Copesul | ||||||||
| Bank Deposit Certificates | 88 | 43 | ||||||
| Financial Brazilian Government Treasury Bills | 13 | 12 | ||||||
| National Treasury Bills | 1 | 1 | ||||||
| Mutual Fund quotas | 12 | 13 | ||||||
| Receivables investment Fund — FIDC | 9 | |||||||
| Debentures and other debt securities | 43 | 15 | ||||||
| Bank Deposit Certificates | 13 | |||||||
| Government securities | ||||||||
| Overnight and term deposits | 37 | 1 | ||||||
| 201 | 113 | |||||||
| 5 | Trade accounts receivable — Third parties |
| 2006 | 2005 | |||||||
| Local customers | 121 | 103 | ||||||
| Foreign customers | 74 | 46 | ||||||
| 195 | 149 | |||||||
F-132
Table of Contents
at December 31, 2006 and 2005
All amounts in millions of reais, unless otherwise indicated
| 6 | Swap and options receivables and payables | |
| The Company entered into operations involving options with respect to US dollars called ‘Box Options’ as commented below. Its purpose has been to invest cash resources at rates higher than other available investment options. The Company also entered into swap operations which were entered into by Fundo de Investimento Financeiro Multimercado Copesul, whose custodian and manager is Banco Santander Brasil S.A. |
| Amounts receivable | ||||||||
| 2006 | 2005 | |||||||
| Swap receivables | 27 | 2 | ||||||
| Swap with anticipatory breach clause | 1 | |||||||
| Options — Box operations | 37 | 50 | ||||||
| Total — current assets | 64 | 53 | ||||||
| Amounts payable | ||||||||
| 2006 | 2005 | |||||||
| Options payable | 1 | |||||||
| Options — Box operations | 2 | |||||||
| Swap payable | 23 | 2 | ||||||
| Total — current liabilities | 23 | 5 | ||||||
| Box options are combined operations that involve both the purchase and the sale of options in US dollars for the same maturity at a certain price, so that, regardless of the future US dollar rate, the Company knows in advance the net result of such operations providing what the Company views as a fixed return over its investment. The value paid for the options, called premium, correspond to the amount invested by the Company and the sum redeemed will be the premium plus a pre-fixed rate of return. | ||
| Swaps correspond to cross-currency interest rate swaps by which the Company pays a fixed interest rate and receives a variable rate based on the Interbank Deposit Certificates — CDI rate. |
F-133
Table of Contents
at December 31, 2006 and 2005
All amounts in millions of reais, unless otherwise indicated
| 7 | Marketable securities |
| 2006 | 2005 | |||||||
| Receivables Securitization Fund (FIDC) (*) | 13 | |||||||
| Term deposits | 39 | 1 | ||||||
| Total | 39 | 14 | ||||||
| Current | (38 | ) | (13 | ) | ||||
| Long-term | 1 | 1 | ||||||
| (*) | The ‘Fundo Copesul de Investimentos em Direitos Creditórios’ — FIDC (Copesul Receivables Securitization Fund) was closed with amortization of the last installment on August 21, 2006. |
| 8 | Inventories | |
| Inventories are comprised as follows: |
| 2006 | 2005 | |||||||
| Raw materials | 234 | 267 | ||||||
| Raw materials in transit | 145 | 90 | ||||||
| Finished products | 99 | 46 | ||||||
| Spare parts and other materials | 73 | 75 | ||||||
| Chemical products | 7 | 8 | ||||||
| Intermediary products | 13 | 9 | ||||||
| 571 | 495 | |||||||
F-134
Table of Contents
at December 31, 2006 and 2005
All amounts in millions of reais, unless otherwise indicated
| 9 | Taxes and charges recoverable |
| Current | Long-term | |||||||||||||||
| 2006 | 2005 | 2006 | 2005 | |||||||||||||
Deferred taxes | ||||||||||||||||
| Deferred income tax and social contribution on tax loss — CITI (c) | 1 | |||||||||||||||
| Deferred income tax on temporary additions (c) | 1 | 4 | 11 | 21 | ||||||||||||
| Deferred social contribution on temporary additions (c) | 1 | 2 | 4 | 8 | ||||||||||||
| 2 | 6 | 15 | 30 | |||||||||||||
Other taxes and charges recoverable | ||||||||||||||||
| Withholding income tax on financial investments | 4 | |||||||||||||||
| IRPJ and CSLL recoverable | 12 | 4 | ||||||||||||||
| Tax on Net Income (ILL) (a) | 54 | 51 | ||||||||||||||
| Additional State Income Tax (ADIR) (b) | 28 | 32 | ||||||||||||||
| ICMS on acquisition of property, plant and equipment (d) | 8 | 7 | 9 | 15 | ||||||||||||
| PIS recoverable | 1 | |||||||||||||||
| PASEP recoverable (h) | 15 | 23 | ||||||||||||||
| PIS on acquisition of property, plant and equipment (e) | 1 | |||||||||||||||
| COFINS recoverable | 3 | |||||||||||||||
| COFINS on acquisition of property, plant and equipment (e) | 2 | 1 | 2 | 1 | ||||||||||||
| Prepaid ICMS (f) | 72 | 20 | ||||||||||||||
| CSLL withheld — Law 10833 | 1 | |||||||||||||||
| IPI recoverable (g) | 5 | 4 | ||||||||||||||
| Other taxes and charges recoverable | 113 | 37 | 122 | 103 | ||||||||||||
| 115 | 43 | 137 | 133 | |||||||||||||
| (a) | This refers to the tax credit of Tax on Net Income — ILL paid from 1989 to 1991 and recognized in December 2002 as this tax was considered unconstitutional according to Resolution of the Federal Senate no. 82 of November 18, 1996 and republished on November 22, 1996. The Company is seeking administratively the right of compensation of this credit with other taxes. Additionally, in the first quarter of 2006 as shown in Note 19 (e) (ii), the Company recorded a liability of R$ 28, recorded against retained earnings, substantially referring to IRPJ and to CSLL levied on the monetary variations of this credit. | |
| (b) | As of December 31, 2006, the Company recorded a receivable of R$ 28 (R$ 32 in 2005) relating to Additional State Income Tax (ADIR), for which the Company was awarded a final favorable judgment, and a security to cover court-ordered debts was issued. This security should be received at its original amount, in cash, plus legal interest, in successive and equal annual installments over a maximum ten-year period, from 2001. Up to December 31, 2006, no installment had been settled up within their time of maturity, but they may be offset in future years against State taxes, as determined by Article 2 of Constitutional Amendment 30 of September 13, 2000. As a means of precaution, the Company filed an appeal in order to avoid the first installment become past due and to use it to offset this credit with ICMS payable generated in its operations. |
F-135
Table of Contents
at December 31, 2006 and 2005
All amounts in millions of reais, unless otherwise indicated
| (c) | The Company recorded deferred assets on the loss of its subsidiary Copesul International Trading, Inc. — CITI in view of the loss assessed in December 2005. Those losses were offset with profits during 2006. The Company also recorded deferred tax assets on temporary differences in the amount of R$ 17 in current assets and non-current assets in accordance with the expectation of realization of these credits. Deferred taxes are expected to be realized as follows: |
| 2006 | 2005 | |||||||
| % | % | |||||||
| 2006 | 17 | |||||||
| 2007 | 13 | 80 | ||||||
| 2008 | 3 | |||||||
| 2009 and after | 87 | |||||||
| 100.00 | 100.00 | |||||||
| (d) | As from August 2000, the Company started recording the ICMS credits paid on acquisitions of property, plant and equipment, as determined by Complementary Law 102 dated July 11, 2000. The credits to be offset are as follows: |
| 2006 | 2005 | |||||||
| 2006 | 8 | |||||||
| 2007 | 8 | 7 | ||||||
| 2008 | 6 | 6 | ||||||
| 2009 | 2 | 2 | ||||||
| 2010 | 1 | |||||||
| 17 | 23 | |||||||
| Current | (8 | ) | (8 | ) | ||||
| Long-term | 9 | 15 | ||||||
| (e) | The Company recognizes PIS and COFINS recoverable credits on the acquisitions of property, plant and equipment, which will be realized in 24 and 48 months depending on the asset acquired as permitted by Law 10865/04 and Decree 5222/04. |
F-136
Table of Contents
at December 31, 2006 and 2005
All amounts in millions of reais, unless otherwise indicated
| (f) | During 2006, the Company made an advance payment of amounts related to ICMS on future sales in the amount of 72 (2005 — R$ 20). The offset of the prepaid ICMS will be done in 6 equal payments, monthly and consecutives, adjusted by the ‘Unidade Padrão Fiscal do RS’ — UPF (Standard Fiscal Unit of RS) of 2007, beginning in January 2007. |
| (g) | The Company recognizes an IPI credit in the acquisitions of raw materials used in the production process. In order to use these credits, every quarter they are offset with federal taxes in accordance with Decree 4544/2002 and paragraph 4, article 16 of the Regulatory Instruction no 460/2004 of the Brazilian Revenue and Customs Secretariat. The long-term balance refers to the IPI Credit Bonus that was judicially gained and will be realized by the end of 2008. |
| (h) | During 2006 the Company recognized a PASEP judicial tax credit in the amount of R$ 45, seeking the right to carry out the payments in accordance with Complementary Law 8/70, using as a calculation basis the revenue of the sixth month previous to the occurrence of the taxable event, in light of Resolution no. 49/95 of the Federal Senate in a final decision. This credit was recognized in the income statement for the year in “Other net operating income” in the amount of R$ 14 and financial income of R$ 30. | |
| The Company expects to settle the remaining balance at December 31, 2006 as follows: |
| PASEP credit with final favorable judgment and recognized in 2006 | 45 | |||
| Credit amount to be offset in 2006 with PIS | (8 | ) | ||
| PASEP balance at December 31, 2006 | 37 | |||
| 2007 | 15 | |||
| 2008 | 14 | |||
| 2009 | 8 | |||
| 37 | ||||
F-137
Table of Contents
at December 31, 2006 and 2005
All amounts in millions of reais, unless otherwise indicated
| 10 | Prepaid expenses | |
| Prepaid expenses comprise: |
| Realization period | 2006 | 2005 | ||||||||
| Insurance | Up to Nov/2007 (2005 - up to Nov/2006) | 10 | 10 | |||||||
| Chemical products (catalysts) | Up to Nov/2018 (2005 - up to Nov/2011) | 8 | 10 | |||||||
| Total, net | 18 | 20 | ||||||||
| Current | (14 | ) | (14 | ) | ||||||
| Long-term | 4 | 6 | ||||||||
| The long-term portion refers to chemical products (catalysts) which are used as agents that promote a chemical reaction in the production of basic petrochemicals. Their average useful life and amortization period is 6 years. | ||
| 11 | Judicial deposits |
| 2006 | 2005 | |||||||
| Tax matters: | ||||||||
| Income tax | 2 | 2 | ||||||
| CIDE on technical assistance service | 4 | 3 | ||||||
| Income tax on technical assistance service | 1 | 1 | ||||||
| 7 | 6 | |||||||
| Labor, Civil and Administrative matters | 2 | 2 | ||||||
| 9 | 8 | |||||||
| The Company has judicial deposits and has recorded a provision for contingencies relating to income tax, in connection with lawsuits. |
F-138
Table of Contents
at December 31, 2006 and 2005
All amounts in millions of reais, unless otherwise indicated
| 12 | Property, plant and equipment |
| 2006 | 2005 | |||||||||||||||||
| Annual | ||||||||||||||||||
| depreciation | Revalued | |||||||||||||||||
| rates - | and restated | Accumulated | ||||||||||||||||
| % (*) | cost (*) | depreciation | Net | Net | ||||||||||||||
| Equipment and installations | ||||||||||||||||||
| Operations | 10 | 2,001 | (1,466 | ) | 535 | 624 | ||||||||||||
| Utilities | 10 | 910 | (831 | ) | 79 | 116 | ||||||||||||
| Storage and transfers | 10 | 434 | (335 | ) | 99 | 119 | ||||||||||||
| Maintenance — CVM Del. No. 489/05 (**) | 21 | 92 | (35 | ) | 57 | |||||||||||||
| Other (***) | 10 to 20 | 89 | (69 | ) | 20 | 23 | ||||||||||||
| Buildings and construction | 4 | 56 | (23 | ) | 33 | 33 | ||||||||||||
| Improvements | 4 | 22 | (11 | ) | 11 | 11 | ||||||||||||
| Land | 37 | 37 | 37 | |||||||||||||||
| Construction in progress | 141 | 141 | 143 | |||||||||||||||
| Other | 18 | 18 | ||||||||||||||||
| 3,800 | (2,770 | ) | 1,030 | 1,106 | ||||||||||||||
| (*) | weighted average rate that reflects the depreciation expense (Note 2 (f)). | |
| (**) | supported by appraisal reports issued by specialized companies. | |
| (***) | information technology equipment, furniture and fixtures, among others are included in this account. |
| Certain items of fixed assets were given as guarantee for financing operations (Note 15 (d)). | ||
| (a) | Revaluations | |
| Revaluations of property, plant and equipment made in 1983 and 1989, based on appraisal reports issued by specialized companies, produced the following effects on the balance sheet: |
| 2006 | 2005 | |||||||||||||||
| Accumulated | ||||||||||||||||
| Revaluation | realization | Net | Net | |||||||||||||
| Equipment and installations | 1,338 | (1,310 | ) | 28 | 62 | |||||||||||
| Buildings and construction | 17 | (6 | ) | 11 | 11 | |||||||||||
| Improvements | 7 | (2 | ) | 5 | 5 | |||||||||||
| Land | 32 | (1 | ) | 31 | 31 | |||||||||||
| Total | 1,394 | (1,319 | ) | 75 | 109 | |||||||||||
| Revaluation reserve | 75 | 109 | ||||||||||||||
F-139
Table of Contents
at December 31, 2006 and 2005
All amounts in millions of reais, unless otherwise indicated
| Realizations of the revaluation reserve occur through depreciation and disposals of the revalued assets each year. The amounts realized are transferred directly from revaluation reserve to retained earnings, considering the related effects of income tax and social contribution at the current rates. | ||
| The Company did not set up a provision for deferred income tax and deferred social Contribution on the balance of the revaluation reserve, since CVM Deliberation 183/95 determines that such provision is only required on revaluations made as from July 1, 1995. The revaluation reserve is taxable when realized through depreciation and disposals of items. Considering current tax legislation, the revaluation reserve is subject to future taxation estimated as follows: |
| 2006 | 2005 | |||||||
Income tax | ||||||||
| Balance of revaluation reserve | 75 | 108 | ||||||
| Revaluation reserve on land | (31 | ) | (31 | ) | ||||
| Income tax calculation basis | 44 | 77 | ||||||
| Income tax (rate - 25%) | (11 | ) | (19 | ) | ||||
Social contribution | ||||||||
| Income tax calculation basis | 44 | 77 | ||||||
| Difference regarding IPC/BTNF on revaluation reserve balance | (22 | ) | (40 | ) | ||||
| Social contribution calculation basis | 22 | 37 | ||||||
| Social contribution (rate - 9%) | (2 | ) | (3 | ) | ||||
| Income tax and social contribution | (13 | ) | (22 | ) | ||||
| During this year, the portion of R$ 33 (2005 — R$ 35) was transferred to retained earnings as a result of realization of the revaluation reserve, as shown in the changes in stockholders’ equity. The tax effect on the realization was R$ 10 (2005 — R$ 10). | ||
| (b) | Acquisitions of property, plant and equipment | |
| COPESUL invested in 2006 the amount of R$ 126 (R$ 171 in 2005). The main investments are R$ 38 — replacement equipment to be used during scheduled programmed maintenance ; R$ 19 - operational reliability, technological updating, and profitability increase projects to be |
F-140
Table of Contents
at December 31, 2006 and 2005
All amounts in millions of reais, unless otherwise indicated
| implemented during the PGM that is forecasted to take place in 2008; R$ 18 — industrial automation programs; R$ 10 — replacement of coils and revamping (technological updating) the furnaces; R$ 5 — building of Butadiene Unit, and R$ 7 — conversion of the MTBE unit to ETBE. The remaining balance of R$ 29 refers to various investment projects. | ||
| 13 | Deferred charges | |
| Deferred charges comprises: |
| 2006 | 2005 | |||||||||||||||||||
| Annual | ||||||||||||||||||||
| amortization | Restated | Accumulated | ||||||||||||||||||
| rates - % | cost | amortization | Net | Net | ||||||||||||||||
| Development programs and other | 20 | 18 | (8 | ) | 10 | 11 | ||||||||||||||
| 18 | (8 | ) | 10 | 11 | ||||||||||||||||
| 14 | Suppliers — Third parties |
| 2006 | 2005 | |||||||
| Local | 30 | 27 | ||||||
| Foreign | 260 | 127 | ||||||
| 290 | 154 | |||||||
F-141
Table of Contents
at December 31, 2006 and 2005
All amounts in millions of reais, unless otherwise indicated
| 15 | Loans and financing | |
| (a) | Liabilities for loans and financing are as follows: |
| Annual | ||||||||||||||||
| Index | charges (%)* | 2006 | 2005 | |||||||||||||
Foreign currency | ||||||||||||||||
| Financing (investments) (US$2 million) | Currency basket and US$ | 8.70 | 5 | |||||||||||||
| Financing and loans (US$3 million; 2004- US$18 million) | Currency Basket | 9.76 | 6 | 44 | ||||||||||||
| 11 | 44 | |||||||||||||||
Local currency | ||||||||||||||||
| Loans and financing | TJLP | 11.67 | 40 | 49 | ||||||||||||
| Hot money, “Compror”, NCE, and BACEN Resolution no. 2770 | CDI | 13.42 | 23 | 172 | ||||||||||||
| Financing (investments) | TJLP | 10.00 | 83 | 50 | ||||||||||||
| Copesul Receivables Securitization Fund | CDI | 57 | ||||||||||||||
| 146 | 328 | |||||||||||||||
| 157 | 372 | |||||||||||||||
| Current liabilities | (50 | ) | (288 | ) | ||||||||||||
| Long-term liabilities | 107 | 84 | ||||||||||||||
| * | weighted average rate that reflects charges on loans. |
| NCE — Export Credit Note CDI — Interbank Deposit Certificate TJLP — Long-Term Interest Rate | ||
| In April 2004, Copesul International Trading, Inc. (CITI) established the “Euro Medium-term Note Program” guaranteed by COPESUL — Companhia Petroquímica do Sul for the issuance of US$ 125 million Notes (“Series I Notes”) in the foreign market (United States of America and Canada). In the last quarter of 2004, the CITI issued 100 million Notes, corresponding to US$ 100,000 thousand, which are held in treasury, without cost to the Company. In December 2006, all the contractual commitments were closed. |
F-142
Table of Contents
at December 31, 2006 and 2005
All amounts in millions of reais, unless otherwise indicated
| (b) | The changes in loans and financing were as follows: |
| Current | Long-term | Total | ||||||||||
| At December 31, 2004 | 213 | 143 | 356 | |||||||||
| Additions | 1,012 | 77 | 1,089 | |||||||||
| Interest | 39 | 6 | 45 | |||||||||
| Transfer to short-term | 64 | (64 | ) | |||||||||
| Amortization | (1,037 | ) | (79 | ) | (1,116 | ) | ||||||
| Monetary and exchange variation | (3 | ) | 1 | (2 | ) | |||||||
| At December 31, 2005 | 288 | 84 | 372 | |||||||||
| Additions | 604 | 47 | 651 | |||||||||
| Interest | 28 | 28 | ||||||||||
| Transfer to short-term | 25 | (25 | ) | |||||||||
| Amortization | (893 | ) | (893 | ) | ||||||||
| Monetary and exchange variation | (2 | ) | 1 | (1 | ) | |||||||
| At December 31, 2006 | 50 | 107 | 157 | |||||||||
| During 2006, the subsidiary CITI settled some loans for working capital and the additions and amortizations the Company made refer mostly to Export Credit Note operations. | ||
| During the third quarter of 2006, the Company entered into a credit line agreement with BNDES - Banco Nacional de Desenvolvimento Social in the amount of R$ 338 for future investment in order to improve its manufacturing facilities. As of December 31, 2006 the Company had used R$ 43 of this credit line. | ||
| (c) | Long-term financing falls due as follows: |
| Year | 2006 | 2005 | ||||||
| 2007 | 22 | |||||||
| 2008 | 33 | 23 | ||||||
| 2009 | 30 | 20 | ||||||
| 2010 | 22 | 13 | ||||||
| 2011 | 14 | 6 | ||||||
| 2012 | 8 | |||||||
| 107 | 84 | |||||||
| (d) | Guarantees | |
| The foreign currency financing are guaranteed in part by the mortgage of plant 2 and by letter of guarantee. | ||
| Local currency financing via FINEM and FINAME programs is guaranteed by Plant 2 and by the financed machinery and equipment, respectively. |
F-143
Table of Contents
at December 31, 2006 and 2005
All amounts in millions of reais, unless otherwise indicated
| The financing contracted with the Banco Nacional de Desenvolvimento Econômico e Social — BNDES, on September 9, 2005, amounting to R$ 50 million, for the installation of a pyrolysis furnace, has as a guarantee a guarantee letter issued by the Banco Regional de Desenvolvimento do Extremo Sul — BRDE. For the rest of the investment financing, the Company placed plant 2 as guarantee. | ||
| The NCE operations in the amount of R$ 23 (2005 — R$ 123) are guaranteed by COPESUL itself in the same NCE contracted document. | ||
| 16 | Export drafts | |
| The changes in advances contracted with financial institutions relating to exports to be invoiced are as follows: |
| Asset | Liability | |||||||||||||||
| Exports already | ||||||||||||||||
| invoiced and | ||||||||||||||||
| provided as | ||||||||||||||||
| source of | ||||||||||||||||
| repayment of | ||||||||||||||||
| export drafts | Short-term | Long-term | Total | |||||||||||||
| At December 31, 2004 | 170 | 21 | 103 | 294 | ||||||||||||
| Additions | 190 | 190 | ||||||||||||||
| Interest | 17 | 17 | ||||||||||||||
| New export receivables | 209 | (209 | ) | |||||||||||||
| Amortization | (339 | ) | (19 | ) | (358 | ) | ||||||||||
| Monetary and exchange variation | (22 | ) | 1 | (12 | ) | (33 | ) | |||||||||
| At December 31, 2005 | 18 | 1 | 91 | 110 | ||||||||||||
| Additions | 531 | 138 | 669 | |||||||||||||
| Interest | 13 | 13 | ||||||||||||||
| Transfer to short-term | 35 | (35 | ) | |||||||||||||
| New export receivables | 526 | (526 | ) | |||||||||||||
| Amortization | (545 | ) | (12 | ) | (49 | ) | (606 | ) | ||||||||
| Monetary and exchange variation | 2 | (3 | ) | (6 | ) | (7 | ) | |||||||||
| At December 31, 2006 | 1 | 39 | 139 | 179 | ||||||||||||
| The amortization recorded in long-term liabilities in 2006 refers to the anticipated settlement of a prepayment to Santander Bank in the amount of US$ 22 million. |
F-144
Table of Contents
at December 31, 2006 and 2005
All amounts in millions of reais, unless otherwise indicated
| Export drafts to be invoiced bear exchange variation plus average interest of 7.11% p.a. (11.75% in 2005), which are recorded in the statement of income as financial expenses. | ||
| Long-term export drafts will fall due as shown below. |
| 2006 | 2005 | |||||||
| 2007 | 91 | |||||||
| 2009 | 75 | |||||||
| 2010 | 64 | |||||||
| 139 | 91 | |||||||
| 17 | Taxes and charges payable |
| 2006 | 2005 | |||||||
| ICMS payable | 22 | 26 | ||||||
| ICMS — tax replacement | 3 | 5 | ||||||
| CIDE on fuels payable | 16 | 6 | ||||||
| IRRF on interest on capital payable | 3 | 3 | ||||||
| Other retentions payable | 1 | 2 | ||||||
| 45 | 42 | |||||||
F-145
Table of Contents
at December 31, 2006 and 2005
All amounts in millions of reais, unless otherwise indicated
| 18 | Income tax and social contribution | |
| Income tax and social contribution are calculated based on official rates. Their composition as of December 31, 2006 and 2005 is as follows: | ||
| (a) | Composition of deferred income tax and social contribution |
| 2006 | 2005 | |||||||||||||||
| Income | Social | Income | Social | |||||||||||||
| Calculation basis for deferred income tax and social contribution | Tax | Contribution | Tax | Contribution | ||||||||||||
| Provision for administrative, civil and labor contingencies | 29 | 29 | 7 | 8 | ||||||||||||
| Provision for fiscal contingencies — IR and CIDE on services abroad | 5 | 5 | 4 | 4 | ||||||||||||
| Provision for contingencies — pension plan | 9 | 9 | 4 | 4 | ||||||||||||
| Exchange variation — deferred | (26 | ) | (26 | ) | ||||||||||||
| Provision for programmed maintenance | 68 | 68 | ||||||||||||||
| Other provisions | 8 | 8 | 19 | 19 | ||||||||||||
| Copesul International Trading tax loss | 2 | 2 | ||||||||||||||
| Accelerated depreciation Law 11051/05 | (15 | ) | ||||||||||||||
| Accelerated depreciation incentive | (4 | ) | (7 | ) | ||||||||||||
| Deferred taxes calculation basis | 21 | 10 | 97 | 105 | ||||||||||||
| Deferred income tax (25%) | 5 | 24 | ||||||||||||||
| Deferred social contribution (9%) | 1 | 9 | ||||||||||||||
| Deferred total taxes | 5 | 1 | 24 | 9 | ||||||||||||
Assets | ||||||||||||||||
| Short-term | 2 | 1 | 4 | 1 | ||||||||||||
| Long-term | 11 | 4 | 22 | 8 | ||||||||||||
| 13 | 5 | 26 | 9 | |||||||||||||
Liabilities | ||||||||||||||||
| Short-term | (1 | ) | ||||||||||||||
| Long-term | (8 | ) | (4 | ) | (1 | ) | ||||||||||
| (8 | ) | (4 | ) | (2 | ) | |||||||||||
| 5 | 1 | 24 | 9 | |||||||||||||
| Changes in deferred taxes | ||||||||||||||||
| Recognized in income | (2 | ) | (2 | ) | (7 | ) | (3 | ) | ||||||||
| Recognized in stockholders’ equity | (17 | ) | (6 | ) | ||||||||||||
| (19 | ) | (8 | ) | (7 | ) | (3 | ) | |||||||||
| Deferred income tax and social contribution assets and liabilities arose from temporary differences and are recognized in accounting terms taking into consideration the probable realization of these taxes based on forecasts of future results prepared with basis on internal assumptions and on future economic scenarios that can, however, may change. |
F-146
Table of Contents
at December 31, 2006 and 2005
All amounts in millions of reais, unless otherwise indicated
| (b) | Estimated realization period | |
| The values of the assets, net of the deferred tax liabilities, have the following expectations of realization: |
| Net credits | ||||||||
| 2006 | 2005 | |||||||
| 2006 | 6 | |||||||
| 2007 | 1 | 23 | ||||||
| 2010 | (1 | ) | (1 | ) | ||||
| 2011 | (4 | ) | ||||||
| 2015 and 2016 | 10 | 5 | ||||||
| 6 | 33 | |||||||
| Since the taxable basis of the income tax and social contribution on the net income arise from not only the profit that can be generated, but also the existence of non-taxable income, non-deductible expenses, fiscal incentives, and other variables, there is not an immediate correlation between the Company’s net income and the result of income tax and social contribution. Therefore, the expectation of using the tax credits should not be taken as a single indicator of the Company’s future results. | ||
| (c) | Reconciliation of income tax and social contribution |
| 2006 | 2005 | 2004 | ||||||||||
| Income before income tax and social contribution | 822 | 722 | 722 | |||||||||
Social contribution on net income (CSLL) | ||||||||||||
| Social contribution (9%) | (74 | ) | (65 | ) | (65 | ) | ||||||
| Permanent additions | ||||||||||||
| Realization of revaluation reserve — difference in IPC/BTNF | (1 | ) | (2 | ) | (2 | ) | ||||||
| Foreign profits | (2 | ) | (7 | ) | ||||||||
| Amortization and depreciation — Law 8200/91 | (1 | ) | (1 | ) | (1 | ) | ||||||
| Other | (1 | ) | 1 | |||||||||
| Permanent exclusions | ||||||||||||
| Positive equity in results | 2 | 7 | ||||||||||
| PDI fiscal incentive | 1 | |||||||||||
| Other | 2 | 5 | ||||||||||
| Social contribution expense (carryforward) | (74 | ) | (63 | ) | (67 | ) | ||||||
F-147
Table of Contents
at December 31, 2006 and 2005
All amounts in millions of reais, unless otherwise indicated
| 2006 | 2005 | 2004 | ||||||||||
| Social contribution expense (brought forward) | (74 | ) | (63 | ) | (67 | ) | ||||||
Income tax (IR) | ||||||||||||
| Income tax (25%) | (205 | ) | (181 | ) | (181 | ) | ||||||
| Permanent additions | ||||||||||||
| Negative result of equity method | (1 | ) | ||||||||||
| Foreign profits | (4 | ) | (20 | ) | ||||||||
| Other | (4 | ) | (3 | ) | ||||||||
| Permanent exclusions | ||||||||||||
| Equity in results | 4 | 20 | ||||||||||
| Fiscal Incentives | 7 | |||||||||||
| Other | 6 | 17 | 6 | |||||||||
| Income tax expense | (196 | ) | (168 | ) | (175 | ) | ||||||
| Total income tax and social contribution in the income statement | (270 | ) | (231 | ) | (242 | ) | ||||||
| The Company elected to pay income tax and social contribution based on annual taxable income, with advance payments made based on quarterly interim trial balances. | ||
| (d) | Fiscal incentives | |
| The Company exercised its rights to fiscal incentives of PDTI — Program for Technological and Industrial Development based on Law No. 9532/97 of Decree No. 949/93 and on Ordinance No. 130/02 of the Ministry of Science and Technology (MCT) up to the year 2005. Beginning in 2006, the Company migrated to the incentives of Law 11196/05 of Decree No. 5798/06 and of MCT Ordinance No. 782/06 with incentive of R$ 3 in the present year. Fiscal incentives in audiovisual, child and adolescent fund, and operations of a cultural and artistic nature were also used during 2006 as well as the PAT — Program for the Worker’s Nutrition, reaching a total of R$ 7. These incentives were recorded directly as reductions of the IRPJ and CSLL accounts in the statement of income. |
F-148
Table of Contents
at December 31, 2006 and 2005
All amounts in millions of reais, unless otherwise indicated
| 19 | Stockholders’ equity | |
| (a) | Capital | |
| The proposal of the Board of Directors for the 1-to-100 reverse split of the Company’s shares was approved at the Extraordinary General Meeting of stockholders No. 107 held on January 20, 2005. This decreased the number of shares of the Company’s capital from 15,021,716,784 to 150,217,167 common shares, with no par value. The Company’s stockholder composition at December 31, 2006 and 2005 is shown below. |
| Stockholders | Number of shares | (%) | ||||||
| Ipiranga Group | 44,255,077 | 29.46 | ||||||
| Braskem Group / Odebrecht | 44,255,077 | 29.46 | ||||||
| Petrobras Química S.A. — PETROQUISA | 23,482,008 | 15.63 | ||||||
| Other | 38,225,005 | 25.45 | ||||||
| Total | 150,217,167 | 100.00 | ||||||
| On March 6, 2006, as approved at the Ordinary/Extraordinary General Meeting, the Company carried out a capital increase in the amount of R$ 100 by the capitalization of fiscal incentive reserves of FUNDOPEM (2005 — R$ 50 from capitalization of legal reserve), without changing the number of original shares. | ||
| The Company is authorized to increase capital up to the limit of R$ 1,100, without changing the by-laws, assuring preference to existing stockholders on subscription. | ||
| (b) | Capital reserves |
| 2006 | 2005 | |||||||
| FUNDOPEM | 284 | 334 | ||||||
| Fiscal incentives — Program of Technological and Industrial Development — PDTI | 12 | 7 | ||||||
| 296 | 341 | |||||||
F-149
Table of Contents
at December 31, 2006 and 2005
All amounts in millions of reais, unless otherwise indicated
| In September 1998, the Company started to set up a capital reserve based on the financial incentive of the Company Operation Fund (FUNDOPEM) — RS, according to Law No. 6427 of October 18, 1972 and amendments. The incentive was granted to the Company through Decree No. 38502, of May 11, 1998, and the benefit obtained is 50% of ICMS due for a maximum period of 8 years, as from September 1998 to August 2006. The amount accumulated since the beginning of the benefit, recorded as a capital reserve in stockholders’ equity, is R$ 610 (2005 — R$ 561), of which R$ 326 was used to increase capital, as approved at the General Meetings in 2006, 2004, 2003, 2001, and 2000. | ||
| Beginning in 2003, the Company obtained the benefit of fiscal incentives of PDTI — Program for Technological and Industrial Development based on Law No. 9532/97 of Decree No. 949/93 and on Ordinance No. 130/02 of the Ministry of Science and Technology. There is a 60-month period in which these benefits must be used, beginning from March 2002 and therefore terminating in February 2007. During 2006, the Company recorded the benefit of this fiscal incentive in the amount of R$ 6 (2005 - - R$ 4) directly on the stockholders’ equity, as mentioned in Note 18 (d). | ||
| (c) | Revaluation reserve | |
| The realization of the revaluation reserve, based on depreciation, write-offs or disposals of the corresponding revalued assets, is transferred to retained earnings, also considering the tax effects of the provisions constituted. | ||
| The tax charges levied on the revaluation reserve are recognized as this reserve is realized since they are previous to the publication of the CVM Deliberation No. 183/95. The tax charges levied on these reserves total R$ 13 (2005 — R$ 22), as shown in Note 12. | ||
| (d) | Distribution of net income | |
| According to the by-laws, net income for the year, adjusted under the terms of Law 6404/76, is to be appropriated as follows: (i) 5% to the legal reserve, not to exceed 20% of capital, and (ii) mandatory non-cumulative dividends, equivalent to 6% of capital, up to the limit of 25% of adjusted net income. Dividends will only be distributed when there is available income. The appropriation of the remaining net income will be determined by the General Meeting. |
F-150
Table of Contents
at December 31, 2006 and 2005
All amounts in millions of reais, unless otherwise indicated
| (i) | The mandatory dividend, calculated according to corporate legislation and the by-laws, is as follows: |
| 2006 | 2005 | |||||||
| Capital at the end of the year | 850 | 750 | ||||||
| Dividend based on 6% of capital | 51 | 45 | ||||||
| Net income for the year | 615 | 566 | ||||||
| Transfer to legal reserve (5% of net income) | (31 | ) | (28 | ) | ||||
| Net income basis for calculation of dividend | 584 | 538 | ||||||
| Mandatory dividends (25% of adjusted net income) | 146 | 135 | ||||||
| (ii) | Dividends proposed by management, subject to approval by the General Meeting, are as follows: |
| 2006 | 2005 | |||||||
| Retained earnings | ||||||||
| Prior year adjustment | 38 | |||||||
| Realization of revaluation reserve | 34 | 35 | ||||||
| Income tax and social contribution on realized revaluation reserve | (8 | ) | (11 | ) | ||||
| Net income for the year | 615 | 567 | ||||||
| Profit retained | ||||||||
| Legal reserve | (32 | ) | (28 | ) | ||||
| Profit distribution | ||||||||
| Interest on capital paid and credited | (90 | ) | (99 | ) | ||||
| Prepaid dividends | (372 | ) | (396 | ) | ||||
| Proposed dividends | 185 | 68 | ||||||
| (iii) | For the year ended December 31, 2006, the Company paid the amount of R$ 90 (2005 — R$ 99) as interest on capital calculated based on the variation of the Long-Term Interest Rate - TJLP and recorded according to Law No. 9249/95, including the amount of the mandatory minimum dividend, of which R$ 70 (2005 — R$ 78) had been paid by the closing of the year. |
F-151
Table of Contents
at December 31, 2006 and 2005
All amounts in millions of reais, unless otherwise indicated
| The Extraordinary General Meeting No. 115 held on December 1, 2006 approved the complementary crediti of interest on capital for those stockholders of record on December 21, 2006 in the amount of R$ 19 at the ratio of R$ 0.129826274 per share, with retention of 15% withholding income tax of R$ 3. In 2005 these amounts were R$ 25 at the ratio of R$ 0.165087656 approved at the Extraordinary General Meeting No. 111 on November 28, 2005 and R$ 3 of withholding income tax. | ||
| The income tax and social contribution benefit arising from the deductibility of this interest, recorded in the results for the year ended December 31, 2006, is R$ 30 (2005 — R$ 34). In compliance with tax legislation, the amount of interest on capital was recorded as financial expense. However, for the purposes of these financial statements, the interest on capital is presented as a distribution of net income in the year as provided for in CVM Deliberation No. 207/96. | ||
| (iv) | In addition, during the year ended December 31, 2006, the Company prepaid dividends in the amount of R$ 372 (2005 — R$ 396), approved by the Extraordinary General Meetings held on May 22, 2006, August 23, 2006, and December 1, 2006. Payments were made on June 9, September 15, and December 15, 2006, respectively. | |
| (e) | Prior year adjustments | |
| The adjustment can be summarized as shown below. |
| 2006 | ||||
| Provision for programmed maintenance (i) | 66 | |||
| Taxes (ii) | (28 | ) | ||
| Prior year adjustment — Total | 38 | |||
F-152
Table of Contents
at December 31, 2006 and 2005
All amounts in millions of reais, unless otherwise indicated
| (i) | Up to December 31, 2005, the Provision for Programmed maintenance was set up considering the estimated costs of programmed maintenance, especially the general stoppage that occurs every six years. The stoppage of Plant 1 occurred in the first half of 2001 and the next one should be in 2008. The stoppage of Plant 2 took place in November 2005 and the next one is planned for November 2011. In accordance with the provisions contained in CVM Deliberation no. 489, dated October 3, 2005, that approved and made mandatory for listed companies the Accounting Pronouncement and Standard — NPC No. 22 (“Provisions, Liabilities and Contingent Assets and Liabilities”), issued by the Brazilian Institute of Independent Auditors — IBRACON which establishes that “...no provision is recognized for costs that need to be incurred to operate in the future. The only liabilities recognized in the balance sheet of an entity are those that exist at the balance sheet date.” Thus, the effects of the adoption of the procedures described above were recognized as a prior year adjustment due to a change in accounting practice, on January 1, 2006, charged directly to retained earnings. The effects of adopting this new accounting practice, net of the tax effects, are as follows: |
| 2006 | ||||
| Reversal of the provision set up on December 31, 2005, net of the tax effects | 45 | |||
| Capitalization of the expenses incurred with previous stoppages in property, plant and equipment, net of the tax effects | 41 | |||
| Depreciation accumulated up to December 31, 2005 on the expenses incurred with previous stoppages in property, plant and equipment that were capitalized | (20 | ) | ||
| 66 | ||||
| (ii) | On November 2001, COPESUL filed a Restitution Request of the Tax on Net Income — ILL with the Brazilian Revenue and Customs Secretariat seeking a compensation for the ILL paid from 1990 to 1992 as this tax has been considered unconstitutional according to the Federal Senate Resolution No. 82 of November 22, 1996. See Note 9.(a). | |
| In December 2002, the Company recognized this credit because the legal advisors considered this a legal right. When originally recorded the credit the Company has not recognized the corresponding IRPJ and CSLL payable on the monetary correction of the credit. During 2006 the Company recognized the amount of R$ 28 as a tax payable. The monetary variations recorded in 2002 represents taxable income and during 2006 the Company recorded the corresponding tax payable against retained earnings as a correction of an error.. |
F-153
Table of Contents
at December 31, 2006 and 2005
All amounts in millions of reais, unless otherwise indicated
| 20 | Financial result | |
| The net financial result is as follows: |
| Consolidated | ||||||||
| 2006 | 2005 | |||||||
| Financial income | ||||||||
| Earnings on financial investments | 23 | 16 | ||||||
| Revenue with derivatives of Fundo de Investimento Financeiro Multimercado Copesul | 315 | 113 | ||||||
| Monetary variations on assets | 4 | 4 | ||||||
| Exchange variations on assets | (11 | ) | (22 | ) | ||||
| Interest on loans granted and other assets | 10 | 25 | ||||||
| PASEP adjustment | 30 | |||||||
| Other financial income | 1 | 1 | ||||||
| 372 | 137 | |||||||
| Financial expenses | ||||||||
| Interest and charges on loans and financing | (40 | ) | (62 | ) | ||||
| Expense with derivatives of Fundo de Investimento Financeiro Multimercado Copesul | (284 | ) | (85 | ) | ||||
| Monetary variations on liabilities | (1 | ) | (2 | ) | ||||
| Exchange variations on liabilities | 9 | 33 | ||||||
| Interest on capital | (90 | ) | (99 | ) | ||||
| Other financial expenses | (57 | ) | (64 | ) | ||||
| (463 | ) | (279 | ) | |||||
| Net financial result | (91 | ) | (142 | ) | ||||
| 21 | Other operating income (expenses), net |
| 2006 | 2005 | |||||||
| Operating income | ||||||||
| Recovery of PIS, COFINS and ICMS | 8 | 11 | ||||||
| Recovery of PASEP (Note 8 (h)) | 14 | |||||||
| Recovery of IPI (a) | 16 | |||||||
| Adjustment to the accrual for sale contract | 16 | |||||||
| Other | 8 | 3 | ||||||
| 46 | 30 | |||||||
| Operating expenses | ||||||||
| Taxes, charges and contributions | (2 | ) | (1 | ) | ||||
| Provisions for administrative, civil and labor contingencies | (22 | ) | (3 | ) | ||||
| Actuarial liability — PETROS | (2 | ) | (2 | ) | ||||
| (26 | ) | (6 | ) | |||||
| Other operating income, net | 20 | 24 | ||||||
F-154
Table of Contents
at December 31, 2006 and 2005
All amounts in millions of reais, unless otherwise indicated
| (a) | During 2005 the Company recognized as operating income a credit in the amount of R$ 16. The credit derives from the recalculation of presumed IPI credit on petrochemical naphtha acquisitions made from April 2002 to January 2004 according to provisions in Law No. 9.363/96. Such credit was used to offset federal taxes (IRPJ and CSLL) in that year. The corresponding taxes on the recognized credit were paid in order to avoid future challenges by the tax authorities. | |
| 22 | Financial instruments | |
| The Company evaluated its assets and liabilities in relation to market and/or realizable values through available information and valuation methodologies established by management. However, both the interpretation of market data and the selection of valuation methods require considerable judgment and reasonable estimates to produce the appropriate realizable value. Consequently, the estimates presented do not necessarily indicate the amounts that can be realized in the current market. The use of different market assumptions and/or methodologies for estimates can have a significant effect on estimated realizable values. | ||
| Valuation of the financial instruments | ||
| The Company’s main asset and liability financial instruments at December 31, 2006, as well as the criteria for their valuation are described below. | ||
| (a) | Cash and banks, financial investments, accounts receivable, other current assets and accounts payable | |
| The amounts recorded are similar to their realizable values. | ||
| (b) | Investments | |
| The investments are mainly in a privately held subsidiary, recorded on the equity method of accounting, in which the Company has a strategic interest. Considerations of the market value of shares held are not applicable. | ||
| (c) | Financing | |
| These are subject to interest at normal market rates, as mentioned in Note 15 (a). The estimated market value was calculated based on the present value of the future disbursement of cash, using interest rates that are available to the Company for the issuance of debts with similar maturities and terms. |
F-155
Table of Contents
at December 31, 2006 and 2005
All amounts in millions of reais, unless otherwise indicated
| (d) | Interest rate risk | |
| This risk derives from the possibility of the Company incurring losses due to fluctuations in the interest rates that would increase the financial expenses related to loans and financings from the market. The Company made contracts of derivatives to hedge against the risk in some operations and it is also continually monitoring the market interest rate with the objective of evaluating the need of contracting new operations in order to protect itself from the risk of the volatility of these rates. | ||
| (e) | Exchange rate risk | |
| This risk derives from the possibility of the Company incurring losses due to fluctuations in the exchange rates that would reduce the nominal values billed or increase the amounts owed to the market. | ||
| Since part of the Company’s revenues (around 10% — unaudited) is in US dollars, the main strategy is that this serves as a natural hedge for its liability operations recorded in foreign currency. | ||
| At December 31, 2006, the Company had assets and liabilities denominated in US dollars in the amount of US$ 16 thousand and US$ 88 thousand, respectively, and it had no instrument to protect this exposure on that date. | ||
| (f) | Derivatives | |
| The net foreign exchange exposure is as follows: |
| 2006 | 2005 | |||||||
| Financing and export drafts contracted originally in US$ | (189 | ) | (136 | ) | ||||
| Assets contracted originally in US$ | 34 | 2 | ||||||
| Derivative instruments contracted originally in US$ | 11 | |||||||
| Net exposure | (144 | ) | (134 | ) | ||||
F-156
Table of Contents
at December 31, 2006 and 2005
All amounts in millions of reais, unless otherwise indicated
| 2006 | 2005 | |||||||||||||||
| Book value | Market value | Book value | Market value | |||||||||||||
| Cash and banks | 200 | 200 | 113 | 113 | ||||||||||||
| Swap receivables | 64 | 64 | 53 | 53 | ||||||||||||
| Marketable securities | 39 | 39 | 14 | 14 | ||||||||||||
| Locked exchange contract advance receivable | 2 | 2 | ||||||||||||||
| Loans to third parties | 2 | 2 | 6 | 6 | ||||||||||||
| Financial institutions | (156 | ) | (156 | ) | (372 | ) | (366 | ) | ||||||||
| Export drafts billed and to be invoiced | (180 | ) | (178 | ) | (92 | ) | (92 | ) | ||||||||
| Swaps and options payable | (23 | ) | (23 | ) | (5 | ) | (5 | ) | ||||||||
| (52 | ) | (50 | ) | (283 | ) | (277 | ) | |||||||||
| Cross-currency swap operations receiving US dollars and paying a fixed rate in reais were entered into in order to minimize the effect of the variations of the exchange rates on liabilities. The Company also opted to use time deposits indexed to the US dollar. | ||
| At December 31, 2006, the Company had forward purchase of foreign exchange, not yet settled, related to operations for purchasing raw material in the amount of US$ 109 thousand (2005 — US$ 41 thousand) equivalent to R$ 232 thousand (2005 — R$ 95 thousand). | ||
| As shown above, the book values of the financial instruments are recorded at values that approximate its estimated market value. | ||
| 23 | Insurance | |
| The Company’s policy is to contract insurance at levels adequate for the risks involved with its operations. Considering the characteristics of its risks, management contracts insurance under the concept of maximum possible loss in a single event, and maintains coverage for operational risks, civil responsibilities and loss of profits. Also, the Company contracts transportation, group life, sundry risks and vehicle insurance. |
F-157
Table of Contents
at December 31, 2006 and 2005
All amounts in millions of reais, unless otherwise indicated
| 24 | Provision for contingencies | |
| On the dates of the financial statements, the Company presented the following liabilities and the corresponding judicial deposits related to the contingencies: |
| Provisions for | ||||||||||||||||
| Judicial deposits | contingencies | |||||||||||||||
| 2006 | 2005 | 2006 | 2005 | |||||||||||||
| Tax contingencies (a) | 7 | 6 | 5 | 4 | ||||||||||||
| Labor and social security contingencies (b) | 1 | 1 | 27 | 4 | ||||||||||||
| Civil complaints (c) | 2 | 3 | ||||||||||||||
| 8 | 7 | 34 | 11 | |||||||||||||
| The Company is a party to labor, civil, and tax claims as well as others in progress and is discussing these issues from both an administrative and judicial point of view and these are backed by judicial deposits when applicable. The provisions for the possible losses from these processes are estimated and updated by the administration based on the opinion of its legal external consultants. | ||
| (a) | Tax contingencies | |
| With respect to the Income Tax and Economic Domain Intervention Contribution (CIDE) on payment of technical assistance services, the Company has been judicially questioning the legality of charging these taxes since August 2002 and has made judicial deposits. The purpose of the process is to avoid double taxation with respect to the countries with which Brazil has tax treaties and provisions have been made in the same amounts as judicial deposits as shown in Note 10. | ||
| (b) | Labor and social security contingencies | |
| The Company has ongoing labor claims, mainly related to salary equivalence claims and overtime. A provision for these contingencies was recorded considering the estimates of the legal advisors for probable loss. Judicial deposits were made when required. The Company is a party to in labor, civil, and tax claims as well as others in progress and is discussing these issues from both an administrative and judicial point of view and these are backed by judicial deposits when applicable. |
F-158
Table of Contents
at December 31, 2006 and 2005
All amounts in millions of reais, unless otherwise indicated
| Furthermore, the Company has made provision for labor losses related to suits filed by the Petrochemical Industry Labor Union of Triunfo concerning the rights claimed by the Company’s shift workers to receive overtime, claiming delays during transfer and change of shifts. A partial grant was given in trial court in deference to the workers claims to overtime. However in appellate court on December 11, 2006 an ordinary appeal was filed by the Company and the expectation is the total or at least partial reversal of the unfavorable decision in the 4th Regional Labor Court of Appeals. | ||
| (c) | Civil contingencies | |
| The main lawsuits are related to complaints made by contracted workers related to losses that supposedly occurred as a result of various economic plans. | ||
| Possible losses | ||
| The Company has suits of both a tax and civil nature involving risks of loss classified by the management as possible based on the evaluation of its legal advisors and for which no provisions have been set up. They are listed below. | ||
| (a) | Tax losses | |
| The Brazilian Revenue and Customs Secretariat (SRF) penalized the Company in 1999, establishing a tax assessment referring to IRPJ and CSLL for 1994, related to the monetary restatement of the balance sheet and equity method adjustment, arising from accounting recognition of dividends distributed by its subsidiary overseas. The adjusted amount is R$ 21. In 2002, the Company filed an Appeal with the Taxpayer Board, which was judged in 2005, with a result totally favorable to the Company. The court decision of the Taxpayers Council was published in the 4th quarter of 2006 and an appeal was made by the Attorney of the Internal Revenue Service to the High Court of Appeals for Fiscal Matters, to which the Company has already offered a brief of respondent. This lawsuit now awaits the decision of this Court. | ||
| (b) | Civil losses | |
| A civil lawsuit is still outstanding against the Company brought by the minority stockholder Petroquímica Triunfo S.A., questioning aspects involved in the privatization process related to the conversion of preferred shares into common shares before the privatization auction and the preference for subscription of Company shares in relation to the bidders in the auction. Management and the legal advisors do not expect losses to arise from this lawsuit. |
F-159
Table of Contents
at December 31, 2006 and 2005
All amounts in millions of reais, unless otherwise indicated
| Remote losses | ||
| (a) | Tax losses | |
| (i) | Federal tax lawsuits related to the effects of Law No. 8200/91 on the social contribution on net income and on corporate income tax, for which provisions were not recorded, considering the opinion of management and the legal advisors that there are good chances of a favorable outcome. | |
| (ii) | In September 2003, the Company was assessed by the Federal Tax Auditors for alleged failure to pay PIS and COFINS on certain transactions. The Company appealed the tax assessment because it understood that it arose from an incorrect interpretation of the applicable legal rules by the tax authorities. Based on the opinion of its legal advisors and external tax consultants, the Company decided not to record a provision for this tax assessment, considering the possibility of a favorable outcome to the appeal. In view of the contents of an infraction notice, in a recent decision the Brazilian Federal Supreme Court — STF denied the expansion of the calculation basis of PIS and COFINS, established by Law 9718/98, prevailing the revenue concept provided in Complementary Law No. 70/91. This fact is in agreement with the opinion of the Company and its legal counselors of not establishing an accrual. Considering the judgment of STF, the Company considers as remote the chances of an unfavorable result. | |
| 25 | Actuarial liability — PETROS | |
| (a) | The Company and its employees contribute to PETROS — Fundação PETROBRAS de Seguridade Social, in connection with retirement and defined benefit pension plans. In 2006, the rate of salary contribution was 12.93% on the total of income of employees linked to the plan. Company contributions during 2006 totaled R$ 6 (2005 — R$ 6). | |
| According to the PETROS by-laws and pertinent legislation, in case of a significant shortfall of technical reserves, the sponsors and participants will contribute additional financial resources, or there should be an adjustment of the benefits of the plan to the available funds. Up to the end of the year, no such contribution was needed. |
F-160
Table of Contents
at December 31, 2006 and 2005
All amounts in millions of reais, unless otherwise indicated
| (b) | In compliance with CVM Deliberation 371/2000, the Company calculated the actuarial liability at December 31 for post-employment benefits granted to employees, using the projected unit credit method based on the information as of November 30, presenting the following result: |
| 2006 | 2005 | |||||||
| Fair value of plan assets | 388 | 337 | ||||||
| Present value of actuarial obligations | 406 | 357 | ||||||
| Actuarial liability | (18 | ) | (20 | ) | ||||
| Total net actuarial liability to be provided | (18 | ) | (20 | ) | ||||
| Actuarial liability already provided | 9 | 7 | ||||||
| Net actuarial liability — unprovided | (9 | ) | (13 | ) | ||||
| According to CVM Deliberation 371 of December 13, 2000, item 84, in the year 2002 the Company began to recogne monthly 1/60 of its actuarial liability, amounting to R$ 9, based on the actuarial study prepared by an independent actuary at December 31, 2001. Accordingly, the amount of R$ 2 was recorded in other operating expenses in 2006 (2005 — R$ 2). | ||
| The actuarial valuation at November 30, 2006 concluded that the Company needs to increase the future contributions in order to complement the benefits, but since it is within the limits defined by CVM Deliberation 371 and in accordance with accounting practices adopted in Brazil, the Company opted not to adjust the supplementary actuarial liability. | ||
| (c) | The gains (losses) identified previously are related to the profitability of the plan assets — differences between the actuarial assumptions and what actually happened, thus being considered actuarial gains (losses). The Company adopted the policy of recognizing these gains (losses) as revenue (expenses) only when their accumulated amounts were larger than the following limits in each year: (i) 10% of the present value of the total actuarial obligations of the benefit defined and (ii) 10% of the fair value of the plan assets. The portion to be recognized is amortized annually, dividing this amount by the average remaining time of estimated work for the employees participating in the plan. |
F-161
Table of Contents
at December 31, 2006 and 2005
All amounts in millions of reais, unless otherwise indicated
| 2006 | 2005 | |||||||
| Real discount rate | 6 | % | 6 | % | ||||
| Expected return on the assets of the plan | 6 | % | 6 | % | ||||
| Real salary growth | 2% up to 47 years of age and none after 48 years old | 2% up to 47 years of age and none after 48 years old | ||||||
Biometrics bases | ||||||||
| Mortality for pension and charges (not disabled) | AT-2000 | AT-2000 | ||||||
| Mortality for pension and charges (disabled) | Experience of C.A.P. (*) | Experience of C.A.P. (*) | ||||||
| Disability | Álvaro Vindas (**) | Álvaro Vindas (**) | ||||||
| Other charges | Experience of STEA (***) | Experience of STEA (***) | ||||||
| (*) | C.A.P. — Retiree and Pensioner Fund used as the basis to develop the mortality table in the actuarial calculations. | |
| (**) | Álvaro Vindas — Disability Table used in the actuarial calculations | |
| (***) | STEA — Serviços Técnicos de Estatística e Atuária Ltda. |
| (d) | In May 2003, the Administrative Council approved the Complementary Pension Plan called COPESULPREV, a closed defined contribution plan. This plan aims to provide benefits to employees not included in the old PETROS plan, which is now closed to new members. Plan management will be carried out through Fundação PETROBRAS de Seguridade Social — PETROS, in an independent manner, not linked to any other pension plan managed by that entity, in compliance with Complementary Law 109/2001. The contributions the Company made during 2006 amounted to R$ 1 (2005 — R$ 1). | |
| 26 | Related parties | |
| According to CVM Deliberation 26/86, related parties are defined as those entities, whether individuals or companies, with which the Company has the possibility of contracting, in the broad sense of this word, in conditions which might not be following terms of interchangeability and independence which are found in transactions with third parties not related to the Company, not subject to its managerial control or not subject to any other influence. |
F-162
Table of Contents
at December 31, 2006 and 2005
All amounts in millions of reais, unless otherwise indicated
| Assets | Liabilities | Financial expenses | Financial income | Sales | Purchases | |||||||||||||||||||||||||||||||||||||||||||||||||||||||||||
| 2006 | 2005 | 2006 | 2005 | 2006 | 2005 | 2004 | 2006 | 2005 | 2004 | 2006 | 2005 | 2004 | 2006 | 2005 | 2004 | |||||||||||||||||||||||||||||||||||||||||||||||||
| Braskem S.A. | 39 | 20 | 2 | 1 | 1 | 2 | 8 | 2,753 | 2,573 | 2,349 | 17 | 66 | 100 | |||||||||||||||||||||||||||||||||||||||||||||||||||
| Ipiranga Petroquímica S.A. | 15 | 18 | 3 | 1 | 2 | 7 | 1,886 | 1,711 | 1,713 | 19 | 36 | 96 | ||||||||||||||||||||||||||||||||||||||||||||||||||||
| Refinaria Alberto Pasqualini — REFAP S.A. | 4 | 11 | 20 | 77 | 51 | 900 | 902 | 388 | ||||||||||||||||||||||||||||||||||||||||||||||||||||||||
| Petróleo Brasileiro S.A. — PETROBRAS | 37 | 1,655 | 1,104 | 1,781 | ||||||||||||||||||||||||||||||||||||||||||||||||||||||||||||
| Petrobras Distribuidora S.A. | 1 | 2 | 4 | 14 | 10 | 8 | 19 | |||||||||||||||||||||||||||||||||||||||||||||||||||||||||
| CPN — Incorporated Limited. | 33 | 36 | 42 | |||||||||||||||||||||||||||||||||||||||||||||||||||||||||||||
| Natal Trading Ltd. | 6 | |||||||||||||||||||||||||||||||||||||||||||||||||||||||||||||||
| Lantana Trading Co. Ltd. | 8 | 52 | ||||||||||||||||||||||||||||||||||||||||||||||||||||||||||||||
| 58 | 49 | 63 | 2 | 1 | 12 | 73 | 4,718 | 4,372 | 4,112 | 2,643 | 2,116 | 2,384 | ||||||||||||||||||||||||||||||||||||||||||||||||||||
F-163
Table of Contents
at December 31, 2006 and 2005
All amounts in millions of reais, unless otherwise indicated
| 27 | Commitments | |
| Purchase commitments | ||
| The Company purchases naphtha from Petrobras and Repsol-YPF as well as condensate (a raw material) from Sonatrach, based under contracts with a total minimum annual purchase volume of metric tons equivalent to R$ 4,062 (2005 — R$ 3,941) valued at the prices for purchase of such products ruling at the respective year end. | ||
| Copesul purchases coal for its utility unit based under a contract that expires in 2008. The minimum annual purchase commitment is 120,000 metric tons, which amounts to R$ 12 (2005 — R$ 13) valued at the prices for purchase of such products ruling at the respective year end. | ||
| The Company purchases natural gas under two long-term contracts that expire in 2023. One contract is for consumption of natural gas by its cogeneration turbine. The minimum annual purchase commitment is 65,664 metric tons, which amounts to R$ 25 (2005 — R$ 25) valued at the prices for purchase of such products ruling at the respective year end. The other contract is for consumption in its utility unit. The minimum annual purchase commitment is 5,472 metric tons (2005 — 7,600 metric tons), which amounts to R$ 5 (2005 — R$ 6) valued at the prices for purchase of such products ruling at the respective year end. | ||
| All these contracts described above have take-or-pay clauses for its quantities. | ||
| 28 | Summary of principal differences between accounting practices adopted in Brazil (“Brazilian GAAP”) and US GAAP | |
| 28.1 | Narrative description of differences between Brazilian GAAP and US GAAP | |
| A summary of the Company’s principal accounting policies that affect the determination of net income and shareholder’s equity in Brazilian GAAP as compared to US GAAP is set forth in this section. Section 29.2 includes a quantitative reconciliation of net income and shareholders’ equity between Brazilian GAAP and US GAAP. |
F-164
Table of Contents
at December 31, 2006 and 2005
All amounts in millions of reais, unless otherwise indicated
| (a) | Remeasurement of financial statements for the effects of inflation | |
| Under Brazilian GAAP until 1995, the CVM required publicly traded companies subject to its reporting requirements to prepare and publish: (a) statutory financial information prepared according to the accounting principles prescribed by Brazilian Corporate Law and (b) as supplemental information, financial statements expressed in currency of constant purchasing power (the “constant currency method”). The requirement to present financial statements following the constant currency method was eliminated when indexation of financial statements for Brazilian statutory and tax purposes was discontinued on January 1, 1996. As such, these financials statements prepared following Brazilian GAAP have been remeasured to reflect the effect of inflation through December 31, 1995. The index selected for this remeasurement was the Fiscal Reference Unit (UFIR), the index established by the tax authorities for preparation of financial statements under Corporate Law as well as the index selected by the CVM. | ||
| Under US GAAP, Brazil was considered to be a hyperinflationary economy until June 30, 1997, and, accordingly, all balances and transactions prior to that date should be remeasured at June 30, 1997 price-levels. As from January 1, 1996, with the elimination of the requirement to present constant currency financial statements, no index has been established for this purpose under Brazilian GAAP. The index the Company selected for remeasurement as from January 1, 1996 to June 30, 1997, for purposes of the reconciliation to US GAAP, is the General Market Price Index — Internal Availability (IGP — DI). | ||
| This difference affects the carrying amount of property, plant and equipment and related depreciation as well as of inventories, exclusively due to the effect of depreciation of property, plant and equipment on the cost of inventories. | ||
| (b) | Revaluation of property, plant and equipment | |
| Under Brazilian GAAP, as explained in Note 12, the Company has recorded in prior years a revaluation of certain of its fixed assets. | ||
| Under US GAAP, property, plant and equipment is recorded at its historical cost and revaluations are not allowed. | ||
| As a result, the reconciliations presented in Note 29.2 include a reversal of such revaluation and related depreciation recognized under Brazilian GAAP. |
F-165
Table of Contents
at December 31, 2006 and 2005
All amounts in millions of reais, unless otherwise indicated
| (c) | Capitalization of interest on property, plant and equipment | |
| Under Brazilian GAAP, only interest on loans and financing which have been obtained for the specific purpose of financing property, plant and equipment is capitalized. | ||
| For US GAAP purposes, interest is capitalized during the construction period of qualifying assets in accordance with Statement of Financial Accounting Standards (“SFAS”) No. 34, “Capitalization of interest cost”, which requires capitalization of interest expense no only of loans and financing for the specific purpose of financing property, plant and equipment. Interest is capitalized based on the average borrowing rate of the company applied to qualifying assets under constructions. | ||
| (d) | Pension benefits | |
| Pension benefit obligations for Brazilian GAAP purposes should be accounted for following CVM Instruction 371/2000, which requires the mandatory application of Brazilian Accounting Standard IBRACON NPC 26. Under CVM Instruction 371/2000, disclosure of pension and other post-retirement obligations is required as from December 31, 2001 while recognition of the related obligations is required as from years ended December 31 2002. As permitted by NPC 26 the initial transitional obligation, which is the difference between plan assets and plan projected benefit obligation at the date of initial recognition, may be recognized by the Company over a 60 month period as from the year ended December 31, 2002. After initial application of the standard, actuarial gains and losses are deferred and recognized in income over the estimated remaining service period of the employees to the extent that those actuarial gains and losses exceed 10% of the higher of the plan assets and the projected benefit obligation. |
F-166
Table of Contents
at December 31, 2006 and 2005
All amounts in millions of reais, unless otherwise indicated
F-167
Table of Contents
at December 31, 2006 and 2005
All amounts in millions of reais, unless otherwise indicated
| Years ended December 31 | ||||||||||||
| 2006 | 2005 | 2004 | ||||||||||
| Benefit obligation at beginning of year | 359 | 305 | 256 | |||||||||
| Service cost | 8 | 7 | 6 | |||||||||
| Interest cost | 37 | 33 | 28 | |||||||||
| Benefit payments | (31 | ) | (19 | ) | (14 | ) | ||||||
| Actuarial losses | 36 | 33 | 29 | |||||||||
| Benefit obligation at end of year | 409 | 359 | 305 | |||||||||
| Years ended December 31 | ||||||||||||
| 2006 | 2005 | 2004 | ||||||||||
| Plan assets at fair value at beginning of year | 347 | 282 | 230 | |||||||||
| Actual return on plan assets | 86 | 74 | 57 | |||||||||
| Employer contributions (net of administrative fee) | 5 | 6 | 5 | |||||||||
| Employee contributions (net of administrative fee) | 4 | 4 | 4 | |||||||||
| Benefit payments | (31 | ) | (19 | ) | (14 | ) | ||||||
| Plan assets at fair value at end of year | 411 | 347 | 282 | |||||||||
| At December 31 | ||||||||
| 2006 | 2005 | |||||||
| Funded status at end of year | 2 | (12 | ) | |||||
| Unrecognized prior service cost | 20 | |||||||
| Unrecognized net actuarial gain | (15 | ) | ||||||
| Accrued benefit cost (pre-paid plan) | 2 | (7 | ) | |||||
| Additional minimum liability | (1 | ) | ||||||
| Total asset (liability) recorded in the balance sheet | 2 | (8 | ) | |||||
F-168
Table of Contents
at December 31, 2006 and 2005
All amounts in millions of reais, unless otherwise indicated
| 2006 | ||||
| Unrecognized prior service cost | (17 | ) | ||
| Unrecognized net actuarial gain | 28 | |||
| 11 | ||||
| Years ended December 31 | ||||||||||||
| 2006 | 2005 | 2004 | ||||||||||
| Service cost | 8 | 7 | 6 | |||||||||
| Interest cost | 37 | 33 | 28 | |||||||||
| Expected return on plan assets | (36 | ) | (31 | ) | (26 | ) | ||||||
| Amortization of unrecognized prior service cost | 3 | 3 | 4 | |||||||||
| Employee contributions (net of administrative fee) | (4 | ) | (4 | ) | (4 | ) | ||||||
| Net periodic benefit cost | 8 | 8 | 8 | |||||||||
F-169
Table of Contents
at December 31, 2006 and 2005
All amounts in millions of reais, unless otherwise indicated
| 2006 | 2005 | 2004 | ||||
| Assumed discount rate | Inflation + 6.0% p.a. | Inflation + 6.0% p.a. | Inflation + 6.0% p.a. | |||
| Expected rate of future salary increases | Inflation + 1.7% p.a. up to 47 years old and none after 48 years old | Inflation + 2% p.a. up to 47 years old and none after 48 years old | Inflation + 2% p.a. up to 47 years old and none after 48 years old | |||
| Expected rate of future pension increases | Inflation + 0.0% p.a. | Inflation + 0.0% p.a. | Inflation + 0.0% p.a. | |||
| Expected rate of return on plan assets | Inflation + 6.0% p.a. | Inflation + 6.0% p.a. | Inflation + 6.0% p.a. | |||
| Inflation | 4.5% p.a. | 5% p.a. | 5% p.a. |
| 2006 | 2005 | |||||||
| Equity securities | 39.23 | % | 33.42 | % | ||||
| Debt securities | 45.88 | % | 50.51 | % | ||||
| Real estate | 6.38 | % | 6.96 | % | ||||
| Other (loans and financing) | 8.51 | % | 9.11 | % | ||||
| 100.00 | % | 100.00 | % | |||||
F-170
Table of Contents
at December 31, 2006 and 2005
All amounts in millions of reais, unless otherwise indicated
| Year | ||||
| 2007 | 38 | |||
| 2008 | 38 | |||
| 2009 | 37 | |||
| 2010 | 37 | |||
| 2011 | 37 | |||
| 2012 to 2016 | 174 | |||
| 361 | ||||
| (e) | Deferred charges | |
| Under Brazilian GAAP, pre-operating expenses incurred in the construction or expansion of a new facility may be deferred until the facility begins commercial operations. Additionally, all costs related to the organization and start-up of a new business may be capitalized to the extent that they are considered recoverable. Deferred charges are amortized over a period of five to ten years. As described in Note 13 the company deferred pre-operating expenses related to expansion, projects for new products, and to organizational restructurings, which are being amortized at the rate of 20% p.a. | ||
| Under US GAAP, the rules are restrictive as to the costs that can be capitalized and the amounts recorded as deferred charges under Brazilian GAAP do not meet the criteria for capitalization and should be expensed as incurred. | ||
| As a result, the reconciliations presented in Note 28.2 include a reversal of those charges which were deferred under Brazilian GAAP. | ||
| (f) | Tax incentives | |
| Under Brazilian GAAP, the various tax incentives of the Company (in the form of tax reduction or exemption for defined periods) are accounted for directly as an increase in a capital reserve account in shareholders’ equity. The Company records the taxes as expense in the consolidated statement of income for the amounts that would be due absent the benefit, and recognizes a reduction in the tax payable against the capital reserve. | ||
| For US GAAP reconciliation purposes the amount of those incentives is recognized directly in the statement of income. |
F-171
Table of Contents
at December 31, 2006 and 2005
All amounts in millions of reais, unless otherwise indicated
| (g) | Income tax and social contribution on the revaluation of property, plant and equipment | |
| Under Brazilian GAAP, and as explained in Note 12, no deferred tax liability was recognized for the difference between the tax value and the book value of property, plant and equipment that resulted from the revaluation of property, plant and equipment. Depreciation in the financial statements is recorded based on the revaluated amount. For income tax purposes, depreciation is deductible based on only the historical restated cost of property, plant and equipment acquired and the amortization of the revaluation is not deductible. The revaluation, when originally recorded, was recognized as an increase in property, plant and equipment against a capital reserve. The reserve is reduced against retained earnings as the revaluation is recognized as expense through depreciation or through the sale of the revalued assets. The increase in income tax payable resulting from the non-deductibility of the revaluation is recognized as a reduction in equity against retained earnings. | ||
| Under US GAAP, no deferred tax is required to be recorded on the revaluation because the revaluation is reverted. The increase in income tax payable resulting from non-deductibility of the revaluation is considered an expense for purposes of the reconciliation presented in Note 29.2. | ||
| (h) | Derivative financial instruments | |
| Under Brazilian GAAP, foreign currency derivatives are recorded by comparing contractual exchange rates to exchange rates ruling at month end. Under the swap agreements, the Company pays or receives at maturity the amounts of the difference between the variation corresponding to an interest rate based on the CDI rate and an amount based on the US Dollar exchange rate plus a fixed rate. Gains and losses on swap agreements are recorded based on the contractual rates and year-end exchange rates. Gains on options and forward contracts are recorded when the contracts expire, while losses are recorded based on the position of each invididual instrument at year-end. | ||
| Under US GAAP, all derivatives are required to be recorded at fair value on the balance sheet and all variations in fair value are required to be recorded in the statement of income, unless they qualify as a hedge. None of the derivatives entered into by the Company qualified for hedge accounting during the periods presented. |
F-172
Table of Contents
at December 31, 2006 and 2005
All amounts in millions of reais, unless otherwise indicated
| (i) | Provision for dividends and interest on own capital | |
| Under Brazilian GAAP, at each balance sheet date the directors are required to propose a dividend distribution from earnings and accrue for this in the financial statements. Under Brazilian GAAP, companies are permitted to distribute or capitalize an amount of interest on own capital, subject to certain limitations and calculated based on a government interest rate multiplied by shareholders’ equity. Such interest is deductible for tax purposes and is recorded as a dividend. Although not affecting net income, except for the tax benefit, the Company includes this nominal charge in financial expenses and reverses out the same amount before net income. | ||
| Under US GAAP, since proposed dividends in excess of the mandatory minimum dividend required to be paid by its by-laws may be ratified or modified at the annual Shareholders’ Meeting, such proposed dividends in excess of the mandatory minimum dividends are not considered declared at the balance sheet date and therefore are not accrued. However, interim dividends paid or interest on own capital already credited to the shareholders as capital remuneration under Brazilian legislation is considered declared for US GAAP purposes. Under US GAAP, interest on own capital are accounted for as tax-deductible dividends. Dividends paid during the years ended December 31, 2006 and 2005 as interim dividends exceeded mandatory minimum dividends and for that reason the porivin for dividends and interest on own capital recorded under Brazilian GAAP is being reverted in the reconciliation to US GAAP. | ||
| (j) | Provision for programmed maintenance | |
| As indicated in Note 19 up to December 31, 2005 the Company recorded a provision accruing in advance for programmed maintenance on its financial statements in Brazilian GAAP. Effective January 1, 2006 the Company adopted the provisions of NPC No. 22 and modified its accounting policy to no longer provide in advance expected amounts to be incurred in the future during scheduled stoppages but rather to capitalize as part of property, plant and equipment the amounts incurred during each stoppage and amortize those amounts over the expected period until the next stoppage, a method know as “built-in overhaul method”. The effect of changing the accounting policy has been recorded as an adjustment to retained earnings as of January 1, 2006. | ||
| Under US GAAP, FASB Staff Position AUG AIR-1 “Accounting for Planned Major Maintenance Activities” was issued on September 2006. AUG AIR-1 prohibits the use of the accrue-in-advance method and allows to use either the built-in overhaul method, the direct expensing method or the deferral method. AUG AIR-1 is mandatory to the first fiscal year beginning after December 15, 2006. Earlier adoption is permitted. The guidance in AUG AIR-1 shall be applied retrospectively for all financial statements presented. |
F-173
Table of Contents
at December 31, 2006 and 2005
All amounts in millions of reais, unless otherwise indicated
| For US GAAP purposes, the Company has early applied AUG AIR-1 and has also adopted the “built-in overhaul method” for US GAAP, and has restated the reconciliation for years ended December 31, 2005 and 2004 to adjust for the application of the new accounting policy. Upon application of AUG AIR-1 the Company presents: | ||
| (i) | in the reconciliation of shareholders equity the reversal of the “accrue-in-advance” provision for programmed maintenance which is recorded in Brazilian GAAP and to capitalize the costs incurred in prior stoppages net of the related depreciation; and | |
| (ii) | in the reconciliation of net income the reversal of the amount charged to expense in Brazilian GAAP to create the provision for programmed maintenance and is recognizing depreciation for the year of the capitalized costs under the new policy. |
| Years ended December 31, | ||||||||
| 2005 | 2004 | |||||||
| Net income under US GAAP, as originally reported | 623 | 611 | ||||||
| Effect of change in accounting policy for programmed maintenance | (7 | ) | 21 | |||||
| Net income under US GAAP, retrospectively adjusted | 616 | 632 | ||||||
| Earnings per share (basic and diluted), as originally reported | 4.15 | 4.06 | ||||||
| Effect of change in accounting policy for programmed maintenance | (0.05 | ) | 0.15 | |||||
| Earnings per share (basic and diluted), retrospectively adjusted | 4.10 | 4.21 | ||||||
| (k) | Income tax payable on monetary correction | |
| As described in Note 19.(ii) the Company recorded as prior year adjustment in retained earnings the recognition of a tax payable amounting to R$ 28 corresponding to income tax and social contribution on the monetary correction of certain tax credits that should have been recognized in prior years. | ||
| For US GAAP the Company has concluded that the effect of this prior year adjustment is not material to net income for the year ended December 31, 2006 and has therefore recorded the tax payable against the 2006 net income. |
F-174
Table of Contents
at December 31, 2006 and 2005
All amounts in millions of reais, unless otherwise indicated
| (l) | Earnings per share | |
| Under Brazilian GAAP, disclosure of earnings per share is normally computed based on the number of shares outstanding at the end of the year, although a weighted-average basis is acceptable. | ||
| Under US GAAP, in accordance with SFAS 128, “Earnings per Share”, the presentation of earnings per share is required for public companies. A dual presentation is required: basic and diluted. Computations of basic and diluted earnings per share data should be based on the weighted average number of common shares outstanding during the period and all dilutive potential commom shares outstanding during each period presented, respectively. If a share dividend, share split or reverse share split is approved earnings per share should be retroactively restated as if such change had been in effect as of the beginning of the earliest period presented. | ||
| No financial instruments have been issued by the Company which have a dilutive effect, and therefore basic and diluted earnings per share are the same. | ||
| (m) | Consolidation of receivables securitization fund (“FIDC”) | |
| On March 1, 2004 the Company obtained financing through the FIDC, a special purpose entity. The FIDC is managed by Votorantim Assets Management DTVM Ltda., an independent asset manager. The FIDC has two classes of quotas: senior quotas and subordinated quotas. The FIDC issued senior quotas in exchange of R$ 125 contributed by third-parties and subordinated quotas in exchange of R$ 25. All the subordinated quotas were issued to and are held by the Company. The senior quotas have the right to a fixed return of 106.5% of CDI. Subordinated quotas have right to any excess of net income of the fund over the return attributed to senior quotas. Senior quotas are mandatorily redeemable by the fund under an amortization schedule that begin on November 2004 and ended on August 2006 when the FIDC was liquidated. The subordinated quotas should represent at least 15% of total equity of the Fund. The FIDC is required to invest in receivables originated by the Company. As of December 31, 2005 and 2004 the Company received R$ 125 from the FIDC as payment for the purchase of receivables, R$ 25 of receivables were transferred to the FIDC in exchange for the subornidated quotas and R$ 2 of receivables were transferred to the FIDC as repayment of the proceeds received (2005 — R$ 13). |
F-175
Table of Contents
at December 31, 2006 and 2005
All amounts in millions of reais, unless otherwise indicated
| Under Brazilian GAAP, the Company accounts for the subordinated quotas received as marketable securities at the net asset value determined by the administrator of the FIDC and recognizes a debt under loan and financig for the proceeds received, carrying interest at 112% of CDI. When receivables are transferred to the FIDC, they are transferred at a discount to their face amount; at the transfer of the receivables they are derecognized for their carrying amount, a loss is recognized for the discount and the debt with the FIDC is reduced by the discounted amount. | ||
| Under US GAAP, in accordance with FASB Interpretation No. 46 “Consolidation of Variable Interest Entities (revised December 2003)”, the FIDC is considered a variable interest entity and is being consolidated by the Company since its inception. | ||
| (n) | Classification of statement of income line items | |
| Under Brazilian GAAP, in addition to the differences described in the items above, the classification of certain income and expense items is presented differently from US GAAP. We have recast our statement of income under Brazilian GAAP to present a condensed statement of income in accordance with US GAAP (Note 28.3). The reclassifications are summarized as follows: | ||
| (i) | Interest income and interest expense, together with other financial charges, are displayed within operating income in the statement of income presented in accordance with Brazilian GAAP. These amounts have been reclassified to non-operating income and expenses in the condensed statement of income in accordance with US GAAP; | |
| (ii) | Under Brazilian GAAP, foreign exchange gains and losses are displayed as financial income or expenses. Under US GAAP foreign exchange gains and losses are recorded in a specific line as non-operating income (expenses); | |
| (iii) | Under Brazilian GAAP, losses incurred in 2004 on the early payment of debt are recorded as financial expense. Under US GAAP such cost is recorded in a specific line as non-operating expense; | |
| (iv) | Under Brazilian GAAP, management fees are recorded in a specific line as operating expenses. For US GAAP purposes such costs are included as operating expenses in selling, general and administrative expenses; | |
| (v) | Under Brazilian GAAP, employees and management profit sharing are recorded after income tax and social contribution. Under US GAAP, these items are included as operating expenses. |
F-176
Table of Contents
at December 31, 2006 and 2005
All amounts in millions of reais, unless otherwise indicated
| (o) | Classification of balance sheet line items | |
| Under Brazilian GAAP, the classification of certain balance sheet items is presented differently from US GAAP. We have recast our consolidated balance sheet under Brazilian GAAP to present a condensed consolidated balance sheet in accordance with US GAAP Note 28.3. The reclassifications are summarized as follows: | ||
| (i) | Cash equivalents is not specifically defined under Brazilian GAAP. Cash and banks under Brazilian GAAP comprises cash in hand, placed in banks, investments in mutual funds and amounts invested in other debt securities which might be sold by the Company at any moment in exchange for cash. For US GAAP, SFAS 95, “Statements of cash flows”, defines cash equivalents as short-term , highly liquid investments (i) readily convertible to known amounts of cash and (ii) so near their maturity that they present insignificant risk of changes due to changes in interest rates. The Company has considered Cash and cash equivalents for US GAAP to include cash in hand, deposits and debt securities with original maturities of three months or less. Other financial instruments not meeting the definition of Cash and cah equivalents and recorded in Cash and banks under Brazilian GAAP are recorded as certificates of deposit or trading investments, as appropriate; | |
| (ii) | Under Brazilian GAAP, in accordance with Law 6.404/76, loans receivable from related parties, resulting from non-operating transactions are classified as Long Term assets, regardless of their contractual maturity. Under US GAAP they are classified as current or non-current assets based on their contractual maturity; | |
| (iii) | Under Brazilian GAAP, invoices for export sales for which the Company authorized a bank to use, upon their collection, the proceeds to repay export draft debt are recognized as a reduction of current assets, and debt is also reduced for the same amount. For US GAAP purposes, the invoices are presented as receivables and the debt is not reduced until collection of the proceeds and settlement of the debt have actually took place; | |
| (iv) | Under Brazilian GAAP, deferred income taxes are not netted and assets are shown separately from liabilities. For US GAAP purposes, deferred tax assets and liabilities are netted within the same taxpayer and same tax jurisdiction and are classified as current or non-current based on the classification of the underlying temporary difference. |
F-177
Table of Contents
at December 31, 2006 and 2005
All amounts in millions of reais, unless otherwise indicated
| (p) | Additional disclosures required by US GAAP | |
| (i) | Advertising costs | |
| Advertising costs are expensed as incurred and are included in selling, general and administrative expense. Advertising costs amounted to R$ 21, R$ 14 and R$ 9 for the years ended December 31, 2006, 2005 and 2004, respectively. | ||
| (ii) | Freight expenses | |
| Freight expenses are recorded in a specific line as selling expenses in the following amounts: R$ 83, R$ 70 and R$ 69 at December 31, 2006, 2005 and 2004, respectively. | ||
| (q) | Recently issued accounting standards | |
| In July 2006, the FASB released FASB Interpretation No. 48, “Accounting for Uncertainty in Income Taxes, an interpretation of FASB Statement No. 109” (FIN 48). FIN 48 prescribes a comprehensive model for the financial statement recognition, measurement, presentation and disclosure of income tax uncertainties with respect to positions taken or expected to be taken in income tax returns. Management is currently evaluating the effect of FIN 48 on the Company’s financial condition and results of operations. | ||
| In September 2006, the FASB issued SFAS No. 157, “Fair Value Measurements”. SFAS 157 defines fair value, establishes a framework for measuring fair value under generally accepted accounting principles and enhances disclosures about fair value measurements. SFAS 157 retains the exchange price notion and clarifies that the exchange price is the price that would be received for an asset or paid to transfer a liability (an exit price) in an orderly transaction between market participants on the measurement date. SFAS 157 is effective for the Company’s financial statements for the year beginning on January 1, 2008, with earlier adoption permitted. Management is currently evaluating the effect of SFAS 157 on the Company’s financial condition and results of operations. |
F-178
Table of Contents
at December 31, 2006 and 2005
All amounts in millions of reais, unless otherwise indicated
| 28.2 | Reconciliation of differences between Brazilian GAAP and US GAAP | |
| 28.2.1 | Differences in net income |
| Years ended December 31 | ||||||||||||||
| Reference | ||||||||||||||
| in 29.1 | 2006 | 2005 | 2004 | |||||||||||
Net income under Brazilian GAAP | 615 | 567 | 547 | |||||||||||
| 1. Remeasurement of financial statements for the effect of inflation — Depreciation on fixed assets for the year | (a) | (69 | ) | (77 | ) | (76 | ) | |||||||
| 2. Reversal of depreciation for the year on revaluation of property, plant and equipment | (b) | 34 | 35 | 35 | ||||||||||
| 3. Depreciation of capitalized interest on construction of property, plant and equipment | (c) | (8 | ) | (9 | ) | (8 | ) | |||||||
| 4. Effect in net income of pension benefits | (d) | (1 | ) | |||||||||||
| 5. Reversal of amortization related to deferred charges | (e) | 1 | 2 | 5 | ||||||||||
| 6. Recognition as expense of amounts recorded as deferred charges during the year | (e) | (1 | ) | (3 | ) | (1 | ) | |||||||
| 7. Tax incentives | (f) | |||||||||||||
| (i) Company Operation Fund — FUNDOPEM | 50 | 89 | 89 | |||||||||||
| (ii) Program for Technological and Industrial Development — PDTI | 5 | 4 | 3 | |||||||||||
| 8. Income tax and social contribution on the revaluation of property, plant and equipment | (g) | (8 | ) | (11 | ) | (10 | ) | |||||||
| 9. Effects from change in accounting policy for programmed maintenance | (j) | (11 | ) | 32 | ||||||||||
| 10. Income tax payable on monetary correction | (k) | (28 | ) | |||||||||||
| 11. Derivative financial instruments | (h) | (1 | ) | |||||||||||
| 12. Deferred income tax on all adjustments except for 2, 7, 8 and 10 | 28 | 36 | 16 | |||||||||||
| 13. Other adjustments | (4 | ) | (6 | ) | 2 | |||||||||
Net income under US GAAP | 615 | 616 | 632 | |||||||||||
F-179
Table of Contents
at December 31, 2006 and 2005
All amounts in millions of reais, unless otherwise indicated
| Years ended December 31 | ||||||||||||||||
| Reference | ||||||||||||||||
| in 28.1 | 2006 | 2005 | 2004 | |||||||||||||
Weighted average number of shares issued and outstanding after giving retroactive effect at December 31, 2004 to the reverse share split approved on January 20, 2005 - Basic and diluted | 150,217,167 | 150,217,167 | 150,217,167 | |||||||||||||
Earnings per share (in Brazilian Reais) | 4.09 | 4.10 | 4.21 | |||||||||||||
| December 31 | ||||||||||
| Reference | 2006 | 2005 | ||||||||
Shareholders’ equity under Brazilian GAAP | 1,300 | 1,247 | ||||||||
| 1. Remeasurement of financial statements for the effect of inflation: | ||||||||||
| (i) Fixed assets net of accumulated depreciation | (a) | 16 | 85 | |||||||
| (ii) Inventories | (a) | 1 | 1 | |||||||
| 2. Reversal of revaluation of property, plant and equipment | (b) | (75 | ) | (109 | ) | |||||
| 3. Capitalization of interest on construction of property, plant and equipment | (c) | 186 | 186 | |||||||
| 4. Depreciation of capitalized interest on construction of property, plant and equipment | (c) | (148 | ) | (140 | ) | |||||
| 5. Reversal of amortization related to deferred charges | (e) | 63 | 62 | |||||||
| 6. Recognition as expense of amounts recorded as deferred charged during the year | (e) | (73 | ) | (73 | ) | |||||
| 9. Effects from change in accounting policy for programmed maintenance: | (j) | |||||||||
| Reversal of provision recorded under Brazilian GAAP | 68 | |||||||||
| Capitalization of cost in prior stoppage, net of depreciation | 33 | |||||||||
| 10. Difference between amount recognized of pension plan asset (liability) | (d) | 11 | (1 | ) | ||||||
| 8. Deferred income tax on all adjustments except for 2 | (17 | ) | (76 | ) | ||||||
| 9. Proposed dividends in excess of mandatory minimum dividend | (i) | 185 | 68 | |||||||
| 10. Other adjustments | (3 | ) | 2 | |||||||
F-180
Table of Contents
at December 31, 2006 and 2005
All amounts in millions of reais, unless otherwise indicated
| December 31 | ||||||||||
| Reference | 2006 | 2005 | ||||||||
Shareholders’ equity under US GAAP | 1,446 | 1,353 | ||||||||
F-181
Table of Contents
at December 31, 2006 and 2005
All amounts in millions of reais, unless otherwise indicated
| 28.3 | US GAAP condensed financial information | |
| Based on the reconciling items and discussion above, Copesul’s condensed consolidated balance sheet, statement of income condensed consolidated and statement of changes in shareholders’ equity under US GAAP are as follows: | ||
| (a) | Condensed balance sheet under US GAAP |
| Assets | 2006 | 2005 | ||||||
| Current assets | ||||||||
| Cash and cash equivalents | 169 | 64 | ||||||
| Trading investments | 70 | 41 | ||||||
| Certificates of deposit | 3 | |||||||
| Loans to related parties | ||||||||
| Trade accounts receivable | 254 | 198 | ||||||
| Inventories,net | 572 | 495 | ||||||
| Taxes and charges recoverable | 101 | 29 | ||||||
| Deferred income taxes | 2 | |||||||
| Swaps receivable | 64 | 53 | ||||||
| Prepaid expenses | 13 | 14 | ||||||
| Prepaid income taxes | 227 | 230 | ||||||
| Other accounts receivable | 6 | 9 | ||||||
| 1,478 | 1,136 | |||||||
| Property, plant and equipment, net | 1,010 | 1,162 | ||||||
| Other noncurrent assets | ||||||||
| Held-to-maturity investments | 1 | 1 | ||||||
| Investments at cost,net | 10 | 9 | ||||||
| Judicial deposits | 9 | 8 | ||||||
| Taxes and charges recoverable | 121 | 103 | ||||||
| Prepaid expenses | 4 | 6 | ||||||
| Loans to third parties | 2 | 6 | ||||||
| Intangible asset — recognition of minimum pension obligation | 1 | |||||||
| Prepaid pension cost | 2 | |||||||
| Other accounts receivable | 1 | 1 | ||||||
| 150 | 135 | |||||||
| Total assets | 2,638 | 2,433 | ||||||
F-182
Table of Contents
at December 31, 2006 and 2005
All amounts in millions of reais, unless otherwise indicated
| Liabilities and shareholders’ equity | 2006 | 2005 | ||||||
| Current liabilities | ||||||||
| Suppliers | 354 | 156 | ||||||
| Social and labor contributions and charges | 45 | 49 | ||||||
| Provision for income taxes | 259 | 242 | ||||||
| Taxes and charges payable | 45 | 42 | ||||||
| Short-term debt, including current portion of long-term debt | 50 | 231 | ||||||
| Short-term export drafts, including current portion of long-term export drafts | 40 | 19 | ||||||
| Quotas subject to mandatory redemption | 51 | |||||||
| Interest on own capital | 17 | 21 | ||||||
| Payables related to swaps, forwards and options | 23 | 5 | ||||||
| Advances from customers | 4 | 13 | ||||||
| Retirement benefit obligation | 6 | |||||||
| Profit sharing and other | 35 | 27 | ||||||
| 872 | 862 | |||||||
| Long-term liabilities | ||||||||
| Long-term debt, net of current portion | 107 | 84 | ||||||
| Long-term export draft, net of current portion | 139 | 91 | ||||||
| Quotas subject to mandatory redemption | ||||||||
| Taxes and charges payable | 26 | |||||||
| Deferred income taxes | 14 | 30 | ||||||
| Provision for tax, civil and labor proceedings | 34 | 11 | ||||||
| Retirement benefit obligation | 2 | |||||||
| 320 | 218 | |||||||
Commitments and contingencies | ||||||||
| Shareholders’ equity | 1,446 | 1,353 | ||||||
| Total liabilities and shareholders’ equity | 2,638 | 2,433 | ||||||
F-183
Table of Contents
at December 31, 2006 and 2005
All amounts in millions of reais, unless otherwise indicated
| 2006 | 2005 | 2004 | ||||||||||
Gross sales | 8,148 | 7,348 | 7,153 | |||||||||
| Taxes and contributions on sales | (1,722 | ) | (1,642 | ) | (1,623 | ) | ||||||
Net sales and services | 6,426 | 5,706 | 5,530 | |||||||||
| Cost of products, utilities and services | (5,326 | ) | (4,661 | ) | (4,423 | ) | ||||||
Gross profit | 1,100 | 1,045 | 1,107 | |||||||||
Operating (expenses) income | ||||||||||||
| Selling, general and administrative | (190 | ) | (184 | ) | (189 | ) | ||||||
| Employees profit sharing | (24 | ) | (22 | ) | (20 | ) | ||||||
| Other operating income (expenses), net | 18 | 28 | 44 | |||||||||
Operating profit | 904 | 867 | 942 | |||||||||
Non-operating income (expenses) | ||||||||||||
| Financial income (expenses), net | 1 | (62 | ) | (81 | ) | |||||||
| Loss on anticipated payment of debt paid in advance settlement | (16 | ) | ||||||||||
| Foreign exchange gains, net | (2 | ) | 12 | 22 | ||||||||
| Other | (12 | ) | 5 | |||||||||
Income before income taxes and social contribution | 891 | 822 | 867 | |||||||||
Income tax benefit (expense) | ||||||||||||
| Current | (297 | ) | (238 | ) | (271 | ) | ||||||
| Deferred | 21 | 32 | 35 | |||||||||
Net income for the year | 615 | 616 | 632 | |||||||||
| (c) | Condensed statement of changes in shareholders’ equity under US GAAP |
| Years Ended December 31 | ||||||||||||
| 2006 | 2005 | 2004 | ||||||||||
At beginning of the year | 1,353 | 1,350 | 1,154 | |||||||||
| Net income | 615 | 616 | 632 | |||||||||
| Transition effect of application of SFAS 158, net of taxes | 8 | |||||||||||
| Dividends | (440 | ) | (514 | ) | (348 | ) | ||||||
| Interest on own capital | (90 | ) | (99 | ) | (88 | ) | ||||||
At end of the year | 1,446 | 1,353 | 1,350 | |||||||||
F-184
Table of Contents
at December 31, 2006 and 2005
All amounts in millions of reais, unless otherwise indicated
| 2006 | 2005 | 2004 | ||||||||||
| Cash provided by operating activities | ||||||||||||
| Net income for the year | 615 | 616 | 632 | |||||||||
| Adjustments to reconcile net income to net cash provided by operating activities | ||||||||||||
| Depreciation and amortization | 288 | 250 | 248 | |||||||||
| Provision for administrative, civil and labor contingencies | 24 | 4 | 3 | |||||||||
| Net effects on working capital related to Programmed maintenance | (1 | ) | (21 | ) | 6 | |||||||
| Provision for actuarial liabilities — PETROS | 2 | 2 | 2 | |||||||||
| Loss on disposals of assets | 29 | 5 | ||||||||||
| Interest, foreign exchange and monetary variation on long-term | ||||||||||||
| Liabilities | (4 | ) | (16 | ) | (11 | ) | ||||||
| Other assets | (6 | ) | 5 | (7 | ) | |||||||
| Loss (gain) on trading investments | 10 | 14 | ||||||||||
| Interest on investment in certificates of deposit | (1 | ) | (1 | ) | (2 | ) | ||||||
| Interest on quotas subject to mandatory redemption | (44 | ) | (10 | ) | 16 | |||||||
| Unrealized gain related to forwards, swaps and options, net | 17 | (3 | ) | (30 | ) | |||||||
| Interest, foreign exchange and monetary variation on loans to related parties and other current liabilities | 15 | (12 | ) | |||||||||
| Interest and monetary variation on short-term debts | 5 | (22 | ) | (33 | ) | |||||||
| Deferred income tax | (21 | ) | (32 | ) | (35 | ) | ||||||
| Decrease/increase in assets and liabilities | ||||||||||||
| Trade accounts receivable | (56 | ) | 21 | 277 | ||||||||
| Inventories | (76 | ) | (68 | ) | (144 | ) | ||||||
| Purchases of trading investments | (195 | ) | (186 | ) | (928 | ) | ||||||
| Sales and redemptions of trading investments | 165 | 267 | 1,077 | |||||||||
| Other assets | (24 | ) | 155 | (94 | ) | |||||||
| Suppliers | 198 | 8 | 34 | |||||||||
| Other liabilities | 26 | (203 | ) | 214 | ||||||||
Net cash provided by operating activities | 941 | 796 | 1,227 | |||||||||
F-185
Table of Contents
| 2006 | 2005 | 2004 | ||||||||||
Cash flows from investing activities | ||||||||||||
| Held-to-maturity investments, net | (1 | ) | ||||||||||
| Redemptions in certificates of deposit | 24 | |||||||||||
| Investment in certificates of deposit | 4 | (1 | ) | |||||||||
| Receivables related to forwards, swaps and options, net | (11 | ) | (52 | ) | 9 | |||||||
| Loans to related parties | ||||||||||||
| Issuances | (325 | ) | ||||||||||
| Repayments | 130 | 522 | ||||||||||
| Acquisitions of property, plant and equipment | (198 | ) | (171 | ) | (131 | ) | ||||||
| Acquisitions of investments | (2 | ) | ||||||||||
Net cash provided by (used in) investing activities | (205 | ) | (94 | ) | 96 | |||||||
Cash flows from financing activities | ||||||||||||
| Short-term debt | ||||||||||||
| Proceeds | 1,660 | 1,198 | 514 | |||||||||
| Payments | (1,864 | ) | (1,183 | ) | (706 | ) | ||||||
| Long-term debt | ||||||||||||
| Proceeds | 185 | 81 | 133 | |||||||||
| Payments | (71 | ) | (153 | ) | (989 | ) | ||||||
| Quotas subject to mandatory redemption | ||||||||||||
| Proceeds | 125 | |||||||||||
| Payments | (8 | ) | (68 | ) | (12 | ) | ||||||
| Dividends paid | (439 | ) | (513 | ) | (346 | ) | ||||||
| Interest on own capital paid | (94 | ) | (97 | ) | (83 | ) | ||||||
Net cash used in financing activities | (631 | ) | (735 | ) | (1,364 | ) | ||||||
Net decrease in cash and cash equivalents | 105 | (33 | ) | (41 | ) | |||||||
Cash and cash equivalents at beginning of year | 64 | 97 | 138 | |||||||||
Cash and cash equivalents at end of the year | 169 | 64 | 97 | |||||||||
Cash paid during the period for | ||||||||||||
Interest | 33 | 63 | 106 | |||||||||
Income taxes | 240 | 238 | 244 | |||||||||
F-186