                                  UNITED STATES
                       SECURITIES AND EXCHANGE COMMISSION
                             WASHINGTON, D. C. 20549

                                   FORM N-CSR

Investment Company Act file number 811-09057

                             SCUDDER INVESTORS TRUST
                        --------------------------------
               (Exact Name of Registrant as Specified in Charter)

               222 South Riverside Plaza, Chicago, Illinois 60606
                  --------------------------------------------
               (Address of Principal Executive Offices) (Zip Code)

        Registrant's Telephone Number, including Area Code: (617) 295-2663
                                                            --------------

                               Salvatore Schiavone
                             Two International Place
                           Boston, Massachusetts 02110
                     ---------------------------------------
                     (Name and Address of Agent for Service)

Date of fiscal year end:        8/31

Date of reporting period:       8/31/03


ITEM 1.  REPORT TO STOCKHOLDERS
[Scudder Investments logo]
| ||
Annual Report to Shareholders | ||
August 31, 2003 | ||
Contents |
<Click Here> Performance Summary <Click Here> Portfolio Management Review <Click Here> Portfolio Summary <Click Here> Investment Portfolio <Click Here> Financial Statements <Click Here> Financial Highlights <Click Here> Notes to Financial Statements <Click Here> Report of Independent Auditors <Click Here> Tax Information <Click Here> Trustees and Officers <Click Here> Investment Products <Click Here> Account Management Resources |
Scudder Investments is part of Deutsche Asset Management, which is the marketing name in the US for the asset management activities of Deutsche Bank AG, Deutsche Investment Management Americas Inc., Deutsche Asset Management Inc., Deutsche Asset Management Investment Services Ltd., Deutsche Bank Trust Company Americas and Scudder Trust Company.
This report must be preceded or accompanied by a prospectus. To obtain a prospectus for any of our funds, refer to the Account Management Resources information provided in the back of this booklet. The prospectus contains more complete information, including a description of the risks of investing in the fund, management fees and expenses. Please read it carefully before you invest or send money.
Fund shares are not FDIC-insured and are not deposits or other obligations of, or guaranteed by, any bank. Fund shares involve investment risk, including possible loss of principal.
Average Annual Total Returns* (Unadjusted for Sales Charge) | |||
Scudder S&P 500 Stock Fund | 1-Year | 3-Year | Life of Fund** |
| Class A | 10.93% | -12.46% | -10.82% |
| Class B | 10.04% | -13.17% | -11.51% |
| Class C | 10.21% | -13.12% | -11.47% |
| S&P 500 Index+ | 12.07% | -11.43% | -9.64% |
Sources: Lipper, Inc. and Deutsche Investment Management Americas Inc.
Net Asset Value and Distribution Information | |||
Class A | Class B | Class C | |
| Net Asset Value: 8/31/03 | $ 6.34 | $ 6.25 | $ 6.26 |
| 8/31/02 | $ 5.75 | $ 5.68 | $ 5.68 |
| Distribution Information: Twelve Months: Income Dividends | $ .03 | $ - | $ - |
Class A Lipper Rankings - S&P 500 Index Objective Funds Category | ||||
Period | Rank | Number of Funds Tracked | Percentile Ranking | |
| 1-Year | 132 | of | 173 | 76 |
| 3-Year | 122 | of | 149 | 82 |
Rankings are historical and do not guarantee future results. Rankings are based on total return unadjusted for sales charges with distributions reinvested. If sales charges had been included, rankings might have been less favorable.
S&P 500 is a trademark of the McGraw-Hill Companies, Inc. and has been licensed for use by Scudder Investments, Inc. The product is not sponsored, endorsed, sold, or promoted by Standard & Poor's and Standard & Poor's makes no representation regarding the advisability of investing in the product.
Growth of an Assumed $10,000 Investment*(a) (Adjusted for Sales Charge) |
[] Scudder S&P 500 Stock Fund - Class A [] S&P 500 Index+ |
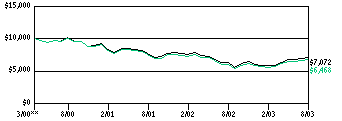 |
Comparative Results* (Adjusted for Sales Charge) | ||||
Scudder S&P 500 Stock Fund | 1-Year | 3-Year | Life of Fund** | |
Class A(b) | Growth of $10,000 | $10,594 | $6,407 | $6,468 |
| Average annual total return | 5.94% | -13.79% | -12.02% | |
Class B(b) | Growth of $10,000 | $10,704 | $6,416 | $6,464 |
| Average annual total return | 7.04% | -13.75% | -12.03% | |
Class C(b) | Growth of $10,000 | $10,911 | $6,492 | $6,540 |
| Average annual total return | 9.11% | -13.41% | -11.73% | |
| S&P 500 Index+ | Growth of $10,000 | $11,207 | $6,949 | $7,072 |
| Average annual total return | 12.07% | -11.43% | -9.64% | |
The growth of $10,000 is cumulative.
Notes to Performance Summary |
* Returns during the 3-year and life of fund period shown reflect a fee waiver and/or expense reimbursement. Without this waiver/reimbursement returns would have been lower.
** The Fund commenced operations on April 3, 2000. Index returns begin March 31, 2000.
a The Fund's growth of an assumed $10,000 investment is adjusted for the maximum sales charge of 4.50%. This results in a net initial investment of $9,550.
b Returns shown for Class A, B and C shares have been adjusted to reflect the current applicable sales charge of each specific class. Returns for Class A reflect the current maximum initial sales charges of 4.50%. Class B share performance is adjusted for the applicable contingent deferred sales charge ("CDSC"), which is 4% within the first year after purchase, declining to 0% after six years. Returns for Class C reflect an initial sales charge of 1%. Redemptions on Class C shares within one year of purchase may be subject to a CDSC of 1%. Any difference in expenses will affect performance.
+ The Standard & Poor's (S&P) 500 Index is a capitalization-weighted index of 500 stocks. The index is designed to measure performance of the broad domestic economy through changes in the aggregate market value of 500 stocks representing all major industries. "Standard & Poor's", "S&P 500", "Standard & Poor's 500" and "500" are trademarks of the McGraw-Hill Companies Inc., and have been licensed for use by the Fund's investment advisor. Index returns assume reinvestment of dividends and, unlike Fund returns, do not reflect any fees or expenses. It is not possible to invest directly into an index.
All performance is historical, assumes reinvestment of all dividends and capital gains, and is not indicative of future results. Investment return and principal value will fluctuate, so an investor's shares, when redeemed, may be worth more or less than when purchased. Performance figures do not reflect the deduction of taxes that a shareholder would pay on fund distributions or the redemption of fund shares. Returns may differ by share class.
Investments in funds involve risk. Some funds have more risk than others. These include funds that allow exposure to or otherwise concentrate investments in certain sectors, geographic regions, security types, market capitalization or foreign securities (e.g., political or economic instability, which can be accentuated in emerging market countries). Please read this fund's prospectus for specific details regarding its investments and risk profile.
Please call (800) 621-1048 for the Fund's most up-to-date performance. On the Web, go to scudder.com.
Scudder S&P 500 Stock Fund: A Team Approach to Investing
Deutsche Investment Management Americas Inc. ("DeIM" or the "Advisor"), which is part of Deutsche Asset Management, is the investment advisor for Scudder S&P 500 Stock Fund. DeIM and its predecessors have more than 80 years of experience managing mutual funds and DeIM provides a full range of investment advisory services to institutional and retail clients. DeIM is also responsible for selecting brokers and dealers and for negotiating brokerage commissions and dealer charges.
Deutsche Asset Management is a global asset management organization that offers a wide range of investing expertise and resources. This well-resourced global investment platform brings together a wide variety of experience and investment insight across industries, regions, asset classes and investing styles.
DeIM is an indirect, wholly owned subsidiary of Deutsche Bank AG. Deutsche Bank AG is a major global banking institution that is engaged in a wide range of financial services, including investment management, mutual funds, retail, private and commercial banking, investment banking and insurance.
Northern Trust Investments, N.A. ("NTI"), an indirect subsidiary of Northern Trust Corporation, is the subadvisor for the fund. As of June 30, 2003, NTI had approximately $220 billion of assets under management.
Portfolio Management Team
The fund is managed by a team of portfolio managers that specializes in domestic large-cap index investing.
In the following interview the portfolio managers of Northern Trust Investments, Inc., the fund's subadvisor, discuss Scudder S&P 500 Stock Fund's strategy and the market environment during the12-month period ended August 31, 2003.
Q: How did the stock market perform during the reporting period?
A: Stocks in the United States performed well over the past year, providing a measure of relief to those who remained invested during the three-year bear market. The Standard & Poor's 500 composite stock index delivered a double-digit return for the period, with all of the gain occurring during the spring and summer. Prior to the war in Iraq, investors were paralyzed by uncertainty: The economy remained weak, corporate earnings were under pressure, oil prices had risen to more than $30 a barrel and the hazy threat of a war of unknown duration hung over the market. At its intra-day low on March 12, 2003, the S&P 500 fell to 788, more than 10% beneath its level at the beginning of the reporting period.
Once the war got under way, and it appeared that the United States would win the main campaign, investors began to move money back into the market. News from the economic and earnings fronts also provided a boost to stock prices as the summer progressed. Although the employment picture remained weak, a variety of indicators began to signal that the economy was emerging from its torpor. At the same time, corporate earnings results showed a substantial rise from their year-ago levels. Market participants were further encouraged by the stimulus provided by the Federal Reserve (in the form of continued low interest rates) and by the government's fiscal policy (in the form of lower taxes and increased spending). The improved backdrop gave investors the green light to put money back into stocks. From March 1 through the close of the period on August 31 (the second half of the annual period), the S&P 500 rose an amazing 20.88%. The rally was led by the higher-risk areas of the market, including growth stocks, small companies and stocks of companies with poor business fundamentals. This was a significant departure from the market environment of the previous three years. The speed at which this shift took place illustrates the potential value of an index fund, which invests across all areas of the market.
Despite its remarkable recovery, the S&P 500 is still well off its all-time high. In closing the period at 1,008, the index remained more than 500 points beneath its high-water mark set in March of 2000.
Q: How did the fund perform in relation to its benchmark and its peer group?
A: The total return of Scudder S&P 500 Stock Fund (Class A shares unadjusted for sales charge) for the 12 months ended August 31, 2003, was 10.93%, not far behind the 12.07% return of the benchmark index. (Please see pages 3 through 5 for performance of other share classes.)
Q: What industries and individual stocks were key drivers of the index's performance?
A: The S&P 500 was led by the sectors that are viewed as best able to benefit during an economic recovery. Technology stocks topped the performance charts, returning 33.39% as a group. The sector had been hurt by reduced spending on technology equipment by corporations - which were tightening their belts to cope with the slow economy - but investors have since become more optimistic that stronger growth will lead to a revival in spending. Telecommunications services, basic materials (for example, chemicals, mining and paper) and consumer discretionary1 stocks - the types of companies that could benefit from the stronger spending accompanying a recovery - were among the market's top performers, as well. The weakest performance was delivered by sectors that are viewed as being more "defensive," in other words, those areas that investors tend to favor when the economy is expected to be weak. These include consumer staples2, utilities and health care stocks.
1 Consumer discretionary products are those, such as home electronics, that are nonnecessities and therefore more sensitive to economic conditions.2 Consumer staples companies are those that make products consumers need to buy regardless of economic conditions, such as food and beverages.
The winners and losers for the annual period ended August 31, 2003, are displayed in the accompanying charts.
S&P 500 Sector Performance | ||
Economic Sector | Average Weight | Total Return |
| Consumer staples | 9.23 | -1.93 |
| Utilities | 2.79 | 2.32 |
| Health care | 14.87 | 3.98 |
| Energy | 5.91 | 9.01 |
| Industrials | 11.52 | 9.21 |
| Financials | 20.54 | 10.44 |
| Consumer discretionary | 13.71 | 15.40 |
| Materials | 2.73 | 15.60 |
| Telecommunication services | 3.89 | 16.89 |
| Information technology | 14.83 | 33.39 |
| Total | 100.003 | 12.07 |
3 Average weight percentages might not equal 100% due to rounding.
Top Three Performers Within the S&P 500 | |
Company | Percentage |
| Avaya, Inc. | +397% |
| Corning, Inc. | +312% |
| Citrix Systems, Inc. | +229% |
Bottom Three Performers Within the S&P 500 | |
Company | Percentage |
| Mirant Corp.* | -81% |
| Cresset Precious Metals, Inc.* | -80% |
| Tenet Healthcare Corp. | -66% |
* The security was not held at 8/31/03.
Q: Will you discuss the nature of the changes made to the index during the period?
A: During the year, Standard & Poor's made 11 additions to and 11 deletions from the index. Consistent with our strategy of building the portfolio so that it tracks the index, we matched these changes in the fund's portfolio. Among the names added to the index during the period were Autonation and RJ Reynolds Tobacco. Some of the stocks removed from the index were AMR Corp. (parent of American Airlines), Household International (which was taken over by HSBC) and Healthsouth.
Q: Will you review your investment process?
A: We seek to provide investment results that, before expenses, correspond to the total return of the S&P 500 index. The fund offers investors a convenient means of participating in the stock market - as measured by the S&P 500 - while relieving them of the time and paperwork it would require to own all of these investments directly. We use a "passive," or "indexing," approach, attempting to duplicate the overall performance of the S&P 500. In doing so, we attempt to allocate the fund's portfolio in approximately the same weighting as the index, beginning with the heaviest-weighted stocks that make up a larger portion of the index's value. Because the portfolio turnover rate of index funds is typically lower than that of actively managed funds, index funds tend to generate fewer taxable gains.
Q: Any final thoughts for investors?
A: Yes. The stock market always presents us with ups and downs, and we are fortunate that the past five months finished squarely in the "up" column. As a result, investors who became frightened and exited the market late in 2002 or early in 2003 - locking in their losses in the process - have been unable to participate in the subsequent rebound. We urge investors to keep this in mind during the inevitable periods when the stock market does not perform as well as it did this past spring and summer. No matter what the market environment, we believe the best approach is to maintain a diversified portfolio and to remain focused on your long-term objectives rather than short-term market fluctuations.
The views expressed in this report reflect those of the portfolio management team only through the end of the report period as stated on the cover. The team's views are subject to change at any time based on market and other conditions and should not be construed as a recommendation.
Asset Allocation | 8/31/03 | 8/31/02 |
| Common Stocks | 99% | 98% |
| Cash Equivalents | 1% | 2% |
| 100% | 100% | |
Sector Diversification (Excludes Cash Equivalents) | 8/31/03 | 8/31/02 |
| Financials | 20% | 21% |
| Information Technology | 16% | 14% |
| Health Care | 13% | 14% |
| Industrials | 12% | 12% |
| Consumer Staples | 12% | 10% |
| Consumer Discretionary | 11% | 13% |
| Energy | 6% | 6% |
| Telecommunication Services | 4% | 4% |
| Materials | 3% | 3% |
| Other | 3% | 3% |
| 100% | 100% | |
Asset allocation and sector diversification are subject to change.
Ten Largest Equity Holdings at August 31, 2003 (23.1% of Portfolio) | |
| 1. General Electric Co. Industrial conglomerate | 3.1% |
| 2. Microsoft Corp. Developer of computer software | 3.0% |
| 3. Wal-Mart Stores, Inc. Operator of discount stores | 2.7% |
| 4. ExxonMobil Corp. Explorer and producer of oil and gas | 2.7% |
| 5. Pfizer, Inc. Manufacturer of prescription pharmaceuticals and non-prescription self-medications | 2.5% |
| 6. Citigroup, Inc. Provider of diversified financial services | 2.4% |
| 7. Intel Corp. Designer, manufacturer and seller of computer components and related products | 2.0% |
| 8. American International Group, Inc. Provider of insurance services | 1.6% |
| 9. Johnson & Johnson Provider of health care products | 1.6% |
| 10. International Business Machines Corp. Manufacturer of computers and provider of information processing services | 1.5% |
Portfolio holdings are subject to change.
For more complete details about the fund's investment portfolio, see page 14. A quarterly Fact Sheet and Portfolio Holdings are available upon request.
Shares | Value ($) | |
Common Stocks 98.5% | ||
| Consumer Discretionary 11.1% | ||
| Auto Components 0.2% | ||
| Cooper Tire & Rubber Co. | 800 | 14,400 |
| Dana Corp. | 1,402 | 21,619 |
| Delphi Corp. | 5,581 | 50,564 |
| Goodyear Tire & Rubber Co. | 1,680 | 11,962 |
| Johnson Controls, Inc. | 887 | 87,813 |
| Visteon Corp. | 1,081 | 7,297 |
193,655 | ||
| Automobiles 0.7% | ||
| AutoNation, Inc.* | 2,800 | 52,612 |
| Ford Motor Co. | 18,602 | 215,039 |
| General Motors Corp. | 5,637 | 231,681 |
| Harley-Davidson, Inc. | 3,033 | 151,104 |
650,436 | ||
| Hotel Restaurants & Leisure 0.9% | ||
| Carnival Corp. "A" | 6,432 | 222,483 |
| Darden Restaurants, Inc. | 1,719 | 37,474 |
| Harrah's Entertainment, Inc. | 1,073 | 44,444 |
| Hilton Hotels Corp. | 3,831 | 58,538 |
| International Game Technology | 3,492 | 90,233 |
| Marriott International, Inc. "A" | 2,334 | 95,297 |
| Starbucks Corp.* | 3,940 | 112,054 |
| Starwood Hotels & Resorts Worldwide, Inc. | 1,961 | 66,341 |
| Wendy's International, Inc. | 1,157 | 36,503 |
| YUM! Brands, Inc.* | 2,946 | 87,349 |
850,716 | ||
| Household Durables 0.5% | ||
| American Greeting Corp. "A" | 715 | 13,228 |
| Black & Decker Corp. | 799 | 34,181 |
| Centex Corp. | 653 | 49,249 |
| Fortune Brands, Inc. | 1,510 | 85,164 |
| KB Home | 515 | 29,468 |
| Leggett & Platt, Inc. | 1,958 | 45,347 |
| Maytag Corp. | 811 | 21,978 |
| Newell Rubbermaid, Inc. | 2,791 | 66,286 |
| Pulte Homes, Inc. | 615 | 40,934 |
| Snap-On, Inc. | 615 | 18,143 |
| The Stanley Works | 839 | 25,397 |
| Tupperware Corp. | 515 | 8,410 |
| Whirlpool Corp. | 692 | 48,149 |
485,934 | ||
| Internet & Catalog Retailing 0.4% | ||
| eBay, Inc.* | 6,400 | 355,392 |
| Leisure Equipment & Products 0.3% | ||
| Brunswick Corp. | 910 | 24,552 |
| Eastman Kodak Co. | 2,871 | 80,072 |
| Hasbro, Inc. | 1,761 | 32,579 |
| Mattel, Inc. | 4,503 | 86,998 |
224,201 | ||
| Media 4.1% | ||
| AOL Time Warner, Inc.* | 45,558 | 745,329 |
| Clear Channel Communications, Inc.* | 6,162 | 278,029 |
| Comcast Corp. "A"* | 22,851 | 679,825 |
| Dow Jones & Co., Inc. | 860 | 36,524 |
| Gannett Co., Inc. | 2,693 | 211,185 |
| Interpublic Group of Companies, Inc. | 3,995 | 60,524 |
| Knight-Ridder, Inc. | 812 | 55,102 |
| McGraw-Hill, Inc. | 1,963 | 119,743 |
| Meredith Corp. | 515 | 24,421 |
| Monster Worldwide, Inc.* | 1,133 | 30,954 |
| New York Times Co. "A" | 1,562 | 69,337 |
| Omnicom Group, Inc. | 1,947 | 152,061 |
| Tribune Co. | 3,166 | 146,428 |
| Univision Communications, Inc. "A"* | 2,293 | 85,965 |
| Viacom, Inc. "B" | 17,902 | 805,590 |
| Walt Disney Co. | 20,752 | 425,416 |
3,926,433 | ||
| Multiline Retail 1.3% | ||
| Big Lots, Inc.* | 1,130 | 20,679 |
| Costco Wholesale Corp.* | 4,641 | 148,930 |
| Dillard's, Inc. "A" | 815 | 12,331 |
| Dollar General Corp. | 3,339 | 76,563 |
| Family Dollar Stores, Inc. | 1,724 | 69,167 |
| Federated Department Stores, Inc.* | 1,848 | 80,758 |
| J.C. Penny Co., Inc. | 2,681 | 56,891 |
| Kohl's Corp.* | 3,436 | 217,327 |
| Sears, Roebuck & Co. | 2,873 | 126,469 |
| Target Corp. | 9,230 | 374,738 |
| The May Department Stores Co. | 2,964 | 81,747 |
1,265,600 | ||
| Specialty Retail 2.3% | ||
| AutoZone, Inc.* | 943 | 86,567 |
| Bed Bath & Beyond, Inc.* | 2,955 | 127,154 |
| Best Buy Co., Inc.* | 3,246 | 168,798 |
| Circuit City Stores - Circuit City Group | 2,098 | 21,882 |
| Home Depot, Inc. | 23,311 | 749,682 |
| Lowe's Companies, Inc. | 7,870 | 431,748 |
| Office Depot, Inc.* | 3,115 | 56,818 |
| RadioShack Corp. | 1,742 | 52,957 |
| Sherwin-Williams Co. | 1,533 | 46,113 |
| Staples, Inc.* | 4,961 | 122,189 |
| The Gap, Inc. | 9,012 | 188,261 |
| Tiffany & Co. | 1,504 | 58,536 |
| TJX Companies, Inc. | 5,154 | 111,636 |
| Toys ''R'' Us, Inc.* | 2,115 | 28,806 |
2,251,147 | ||
| Textiles, Apparel & Luxury Goods 0.4% | ||
| Jones Apparel Group, Inc. | 1,313 | 40,559 |
| Liz Claiborne, Inc. | 1,098 | 37,848 |
| NIKE, Inc. "B" | 2,682 | 152,820 |
| Nordstrom, Inc. | 1,370 | 35,716 |
| Reebok International Ltd. | 680 | 22,746 |
| The Limited, Inc. | 5,278 | 89,515 |
| VF Corp. | 1,167 | 46,797 |
426,001 | ||
| Consumer Staples 11.4% | ||
| Beverages 2.6% | ||
| Adolph Coors Co. "B" | 408 | 22,501 |
| Anheuser-Busch Companies, Inc. | 8,422 | 434,070 |
| Brown-Forman Corp. "B" | 572 | 45,211 |
| Coca-Cola Enterprises, Inc. | 4,620 | 85,424 |
| Pepsi Bottling Group, Inc. | 2,820 | 68,018 |
| PepsiCo, Inc. | 17,475 | 778,337 |
| The Coca-Cola Co. | 25,032 | 1,089,393 |
2,522,954 | ||
| Food & Drug Retailing 3.8% | ||
| CVS Corp. | 4,024 | 131,182 |
| Kroger Co.* | 7,744 | 148,762 |
| Safeway, Inc.* | 4,559 | 111,285 |
| Supervalu, Inc. | 1,376 | 33,162 |
| Sysco Corp. | 6,570 | 206,692 |
| Walgreen Co. | 10,416 | 339,249 |
| Wal-Mart Stores, Inc. | 44,461 | 2,630,757 |
| Winn-Dixie Stores, Inc. | 1,546 | 15,537 |
3,616,626 | ||
| Food Products 1.5% | ||
| Albertson's, Inc. | 3,770 | 79,245 |
| Archer-Daniels-Midland Co. | 6,541 | 90,724 |
| Campbell Soup Co. | 4,147 | 100,357 |
| ConAgra Foods, Inc. | 5,433 | 119,526 |
| General Mills, Inc. | 3,752 | 173,943 |
| H.J. Heinz Co. | 3,554 | 115,007 |
| Hershey Foods Corp. | 1,371 | 95,833 |
| Kellogg Co. | 4,079 | 136,769 |
| McCormick & Co., Inc. | 1,400 | 37,380 |
| McDonald's Corp. | 12,920 | 289,666 |
| Sara Lee Corp. | 7,905 | 150,037 |
| William Wrigley Jr. Co. | 2,236 | 118,620 |
1,507,107 | ||
| Household Products 1.9% | ||
| Clorox Co. | 2,211 | 94,741 |
| Colgate-Palmolive Co. | 5,490 | 303,487 |
| Kimberly-Clark Corp. | 5,134 | 262,399 |
| Procter & Gamble Co. | 13,176 | 1,150,133 |
1,810,760 | ||
| Personal Products 0.6% | ||
| Alberto-Culver Co. "B" | 615 | 35,104 |
| Avon Products, Inc. | 2,403 | 154,032 |
| Gillette Co. | 10,312 | 334,728 |
523,864 | ||
| Tobacco 1.0% | ||
| Altria Group, Inc. | 20,475 | 843,980 |
| R.J. Reynolds Tobacco Holdings, Inc. | 967 | 33,023 |
| UST, Inc. | 1,678 | 56,045 |
933,048 | ||
| Energy 5.7% | ||
| Energy Equipment & Services 0.8% | ||
| Baker Hughes, Inc. | 3,360 | 112,426 |
| BJ Services Co.* | 1,600 | 59,792 |
| Halliburton Co. | 4,410 | 106,634 |
| Nabors Industries Ltd.* | 1,503 | 60,345 |
| Noble Corp.* | 1,390 | 50,290 |
| Rowan Companies, Inc. | 886 | 22,185 |
| Schlumberger Ltd. | 5,859 | 290,079 |
| Transocean Sedco Forex, Inc. | 3,409 | 71,998 |
773,749 | ||
| Oil & Gas 4.9% | ||
| Amerada Hess Corp. | 921 | 43,425 |
| Anadarko Petroleum Corp. | 2,552 | 111,012 |
| Apache Corp. | 1,608 | 110,887 |
| Ashland, Inc. | 615 | 20,332 |
| Burlington Resources, Inc. | 2,001 | 96,888 |
| ChevronTexaco Corp. | 10,862 | 791,480 |
| ConocoPhillips | 6,920 | 386,424 |
| Devon Energy Corp. | 2,450 | 126,788 |
| EOG Resources, Inc. | 1,141 | 48,378 |
| ExxonMobil Corp. | 67,771 | 2,554,967 |
| Kerr-McGee Corp. | 1,048 | 46,060 |
| Marathon Oil Corp. | 3,106 | 86,626 |
| Occidental Petroleum Corp. | 3,826 | 131,347 |
| Sunoco, Inc. | 830 | 33,723 |
| Unocal Corp. | 2,589 | 79,275 |
4,667,612 | ||
| Financials 20.1% | ||
| Banks 7.9% | ||
| AmSouth Bancorp. | 3,484 | 75,045 |
| Bank of America Corp. | 15,242 | 1,207,929 |
| Bank of New York Co., Inc. | 7,862 | 231,300 |
| Bank One Corp. | 11,602 | 457,931 |
| BB&T Corp. | 5,774 | 210,866 |
| Charter One Financial, Inc. | 2,201 | 68,231 |
| Comerica, Inc. | 1,834 | 90,490 |
| Fifth Third Bancorp. | 5,895 | 345,447 |
| First Tennessee National Corp. | 1,200 | 49,620 |
| FleetBoston Financial Corp. | 10,665 | 315,577 |
| Golden West Financial Corp. | 1,597 | 137,773 |
| Huntington Bancshares, Inc. | 2,382 | 47,640 |
| J.P. Morgan Chase & Co. | 20,548 | 703,153 |
| KeyCorp. | 4,256 | 115,891 |
| Marshall & Ilsley Corp. | 2,268 | 70,308 |
| Mellon Financial Corp. | 4,347 | 136,278 |
| National City Corp. | 6,212 | 196,796 |
| North Fork Bancorp., Inc. | 1,500 | 50,655 |
| Northern Trust Corp. | 1,956 | 82,621 |
| PNC Financial Services Group | 2,861 | 136,184 |
| Regions Financial Corp. | 2,174 | 76,655 |
| SouthTrust Corp. | 3,538 | 102,567 |
| SunTrust Banks, Inc. | 2,801 | 171,225 |
| Synovus Financial Corp. | 3,273 | 80,025 |
| Union Planters Corp. | 1,930 | 61,567 |
| US Bancorp. | 19,435 | 464,497 |
| Wachovia Corp. | 13,652 | 575,432 |
| Washington Mutual, Inc. | 9,378 | 365,554 |
| Wells Fargo & Co. | 16,958 | 850,274 |
| Zions Bancorp. | 929 | 51,745 |
7,529,276 | ||
| Diversified Financials 7.2% | ||
| American Express Co. | 13,114 | 590,786 |
| Bear Stearns Companies, Inc. | 1,015 | 71,030 |
| Capital One Finance Corp. | 2,260 | 120,684 |
| Charles Schwab Corp. | 13,841 | 150,313 |
| Citigroup, Inc. | 52,216 | 2,263,564 |
| Countrywide Financial Corp. | 1,286 | 87,255 |
| Fannie Mae | 9,977 | 646,410 |
| Federated Investors, Inc. | 1,100 | 32,296 |
| Franklin Resources, Inc. | 2,636 | 113,849 |
| Freddie Mac | 6,946 | 369,180 |
| Goldman Sachs Group, Inc. | 4,800 | 424,752 |
| Janus Capital Group, Inc. | 2,467 | 42,605 |
| Lehman Brothers Holdings, Inc. | 2,532 | 166,428 |
| MBNA Corp. | 12,972 | 302,766 |
| Merrill Lynch & Co., Inc. | 9,459 | 508,705 |
| Moody's Corp. | 1,544 | 80,072 |
| Morgan Stanley | 11,032 | 538,251 |
| Providian Financial Corp.* | 2,885 | 29,571 |
| SLM Corp. | 4,561 | 183,261 |
| State Street Corp. | 3,426 | 150,573 |
| T. Rowe Price Group, Inc. | 1,221 | 51,893 |
6,924,244 | ||
| Insurance 4.6% | ||
| ACE Ltd. | 2,700 | 86,940 |
| AFLAC, Inc. | 5,178 | 165,748 |
| Allstate Corp. | 7,155 | 255,791 |
| AMBAC Financial Group, Inc. | 1,011 | 65,634 |
| American International Group, Inc. | 26,416 | 1,573,601 |
| Aon Corp. | 3,142 | 69,752 |
| Chubb Corp. | 1,888 | 128,271 |
| Cincinnati Financial Corp. | 1,662 | 67,062 |
| Hartford Financial Services Group, Inc. | 2,881 | 153,327 |
| Jefferson-Pilot Corp. | 1,399 | 61,934 |
| John Hancock Financial Services, Inc. | 2,927 | 89,361 |
| Lincoln National Corp. | 1,785 | 63,225 |
| Loews Corp. | 1,800 | 74,088 |
| Marsh & McLennan Companies, Inc. | 5,450 | 272,500 |
| MBIA, Inc. | 1,491 | 84,182 |
| MetLife, Inc. | 7,686 | 218,436 |
| MGIC Investment Corp. | 972 | 54,792 |
| Principal Financial Group, Inc. | 3,300 | 103,818 |
| Progressive Corp. | 2,174 | 153,789 |
| Prudential Financial, Inc. | 5,600 | 203,896 |
| Safeco Corp. | 1,429 | 51,530 |
| St. Paul Companies, Inc. | 2,280 | 79,253 |
| Torchmark Corp. | 1,139 | 45,970 |
| Travelers Property Casualty Corp. "B" | 10,024 | 155,272 |
| UnumProvident Corp. | 2,927 | 41,271 |
| XL Capital Ltd. "A" | 1,375 | 104,156 |
4,423,599 | ||
| Real Estate 0.4% | ||
| Apartment Investment & Management Co. (REIT) | 1,021 | 39,360 |
| Equity Office Properties Trust (REIT) | 4,200 | 116,844 |
| Equity Residential (REIT) | 2,700 | 78,516 |
| Plum Creek Timber Co., Inc. (REIT) | 1,900 | 49,685 |
| ProLogis (REIT) | 1,800 | 50,742 |
| Simon Property Group, Inc. (REIT) | 1,900 | 81,149 |
416,296 | ||
| Health Care 13.4% | ||
| Biotechnology 1.3% | ||
| Amgen, Inc.* | 12,781 | 842,268 |
| Biogen, Inc.* | 1,544 | 60,926 |
| Chiron Corp.* | 1,916 | 97,371 |
| Genzyme Corp. (General Division)* | 2,200 | 103,730 |
| MedImmune, Inc.* | 2,564 | 89,407 |
1,193,702 | ||
| Health Care Equipment & Supplies 1.9% | ||
| Applera Corp. - Applied Biosystems Group | 2,119 | 46,109 |
| Bausch & Lomb, Inc. | 582 | 24,537 |
| Baxter International, Inc. | 6,104 | 171,522 |
| Becton, Dickinson & Co. | 2,633 | 96,210 |
| Biomet, Inc. | 2,702 | 80,330 |
| Boston Scientific Corp.* | 4,167 | 250,437 |
| C.R. Bard, Inc. | 564 | 37,788 |
| Guidant Corp. | 3,155 | 158,381 |
| Medtronic, Inc. | 12,444 | 616,974 |
| St. Jude Medical, Inc.* | 1,796 | 93,518 |
| Stryker Corp. | 2,080 | 157,664 |
| Zimmer Holdings, Inc.* | 2,074 | 107,309 |
1,840,779 | ||
| Health Care Providers & Services 1.7% | ||
| Aetna, Inc. | 1,588 | 90,516 |
| AmerisourceBergen Corp. | 1,085 | 63,158 |
| Anthem, Inc.* | 1,447 | 105,920 |
| Cardinal Health, Inc. | 4,513 | 256,925 |
| CIGNA Corp. | 1,416 | 67,515 |
| HCA, Inc. | 5,269 | 200,169 |
| Health Management Associates, Inc. | 2,400 | 53,472 |
| Humana, Inc.* | 1,609 | 28,302 |
| IMS Health, Inc. | 2,534 | 49,337 |
| Manor Care, Inc. | 930 | 25,668 |
| McKesson Corp. | 2,926 | 95,797 |
| Quest Diagnostics, Inc.* | 1,059 | 63,540 |
| Quintiles Transnational Corp.* | 1,269 | 18,071 |
| Tenet Healthcare Corp.* | 4,656 | 74,721 |
| UnitedHealth Group, Inc. | 6,022 | 297,667 |
| Wellpoint Health Networks, Inc.* | 1,434 | 111,852 |
1,602,630 | ||
| Pharmaceuticals 8.5% | ||
| Abbott Laboratories | 15,850 | 638,755 |
| Allergan, Inc. | 1,298 | 103,139 |
| Bristol-Myers Squibb Co. | 19,647 | 498,444 |
| Eli Lilly & Co. | 11,402 | 758,575 |
| Forest Laboratories, Inc.* | 3,608 | 169,576 |
| Johnson & Johnson | 30,095 | 1,492,110 |
| King Pharmaceuticals, Inc.* | 2,356 | 33,102 |
| Medco Health Solutions, Inc.* | 2,719 | 72,605 |
| Merck & Co., Inc. | 22,748 | 1,144,679 |
| Pfizer, Inc. | 80,164 | 2,398,507 |
| Schering-Plough Corp. | 14,931 | 226,802 |
| Watson Pharmaceuticals, Inc.* | 1,117 | 45,909 |
| Wyeth | 13,489 | 578,004 |
8,160,207 | ||
| Industrials 11.7% | ||
| Aerospace & Defense 1.8% | ||
| Boeing Co. | 8,463 | 316,432 |
| General Dynamics Corp. | 1,997 | 171,962 |
| Goodrich Corp. | 1,167 | 30,377 |
| Honeywell International, Inc. | 8,694 | 252,039 |
| Lockheed Martin Corp. | 4,525 | 231,816 |
| Northrop Grumman Corp. | 1,859 | 177,497 |
| Raytheon Co. | 4,128 | 132,344 |
| Rockwell Collins, Inc. | 1,746 | 47,229 |
| United Technologies Corp. | 4,731 | 379,663 |
1,739,359 | ||
| Air Freight & Logistics 1.0% | ||
| FedEx Corp. | 3,076 | 206,400 |
| Ryder System, Inc. | 686 | 20,601 |
| United Parcel Service, Inc. "B" | 11,375 | 713,895 |
940,896 | ||
| Airlines 0.2% | ||
| Delta Air Lines, Inc. | 1,303 | 16,770 |
| Southwest Airlines Co. | 7,994 | 136,617 |
153,387 | ||
| Building Products 0.2% | ||
| American Standard Companies, Inc.* | 680 | 54,529 |
| Crane Co. | 615 | 15,738 |
| Masco Corp. | 4,813 | 119,314 |
189,581 | ||
| Commercial Services & Supplies 1.9% | ||
| Allied Waste Industries, Inc.* | 2,176 | 24,067 |
| Apollo Group, Inc. "A"* | 1,800 | 115,326 |
| Automatic Data Processing, Inc. | 6,136 | 244,888 |
| Avery Dennison Corp. | 1,076 | 58,911 |
| Cendant Corp.* | 10,322 | 185,590 |
| Cintas Corp. | 1,813 | 72,393 |
| Concord EFS, Inc.* | 4,950 | 68,558 |
| Convergys Corp.* | 1,713 | 30,834 |
| Deluxe Corp. | 515 | 21,991 |
| Equifax, Inc. | 1,458 | 33,447 |
| First Data Corp. | 7,610 | 292,224 |
| Fiserv, Inc.* | 1,958 | 76,068 |
| H&R Block, Inc. | 1,826 | 80,527 |
| Paychex, Inc. | 3,853 | 138,708 |
| Pitney Bowes, Inc. | 2,380 | 92,820 |
| R.R. Donnelley & Sons Co. | 1,176 | 29,565 |
| Robert Half International, Inc.* | 1,825 | 40,588 |
| Sabre Holdings Corp. | 1,413 | 31,962 |
| Waste Management, Inc. | 5,969 | 158,835 |
1,797,302 | ||
| Construction & Engineering 0.1% | ||
| Fluor Corp. | 853 | 31,425 |
| Electrical Equipment 0.5% | ||
| American Power Conversion Corp. | 2,092 | 37,489 |
| Cooper Industries, Inc. "A" | 1,004 | 51,094 |
| Emerson Electric Co. | 4,304 | 239,991 |
| Molex, Inc. | 2,060 | 60,605 |
| Power-One, Inc.* | 810 | 9,566 |
| Rockwell Automation, Inc. | 1,946 | 52,970 |
| Thomas & Betts Corp.* | 761 | 12,998 |
464,713 | ||
| Industrial Conglomerates 4.2% | ||
| 3M Co. | 4,011 | 571,447 |
| General Electric Co. | 101,487 | 3,000,971 |
| Textron, Inc. | 1,367 | 61,515 |
| Tyco International Ltd. | 20,242 | 416,580 |
4,050,513 | ||
| Machinery 1.3% | ||
| Caterpillar, Inc. | 3,436 | 246,808 |
| Cummins, Inc. | 464 | 23,126 |
| Danaher Corp. | 1,541 | 119,042 |
| Deere & Co. | 2,438 | 137,771 |
| Dover Corp. | 2,018 | 76,724 |
| Eaton Corp. | 766 | 71,728 |
| Illinois Tool Works, Inc. | 3,169 | 229,087 |
| Ingersoll-Rand Co. "A" | 1,682 | 100,113 |
| ITT Industries, Inc. | 942 | 61,305 |
| Navistar International Corp.* | 715 | 31,982 |
| PACCAR, Inc. | 1,189 | 101,260 |
| Pall Corp. | 1,207 | 30,175 |
| Parker-Hannifin Corp. | 1,235 | 61,157 |
1,290,278 | ||
| Road & Rail 0.4% | ||
| Burlington Northern Santa Fe Corp. | 3,777 | 107,078 |
| CSX Corp. | 2,232 | 72,049 |
| Norfolk Southern Corp. | 3,849 | 73,285 |
| Union Pacific Corp. | 2,595 | 158,139 |
410,551 | ||
| Trading Companies & Distributors 0.1% | ||
| Genuine Parts Co. | 1,773 | 56,771 |
| W.W. Grainger, Inc. | 926 | 46,143 |
102,914 | ||
| Information Technology 16.2% | ||
| Communications Equipment 2.5% | ||
| ADC Telecommunications, Inc.* | 8,063 | 20,480 |
| Andrew Corp.* | 1,500 | 18,570 |
| Avaya, Inc.* | 3,934 | 41,110 |
| CIENA Corp.* | 4,800 | 31,200 |
| Cisco Systems, Inc.* | 71,374 | 1,366,812 |
| Comverse Technologies, Inc.* | 1,923 | 31,710 |
| Corning, Inc.* | 12,853 | 106,037 |
| JDS Uniphase Corp.* | 14,189 | 48,810 |
| Lucent Technologies, Inc.* | 40,848 | 78,020 |
| Motorola, Inc. | 23,514 | 252,305 |
| QUALCOMM, Inc. | 8,020 | 331,066 |
| Scientific-Atlanta, Inc. | 1,574 | 53,516 |
| Tellabs, Inc.* | 4,143 | 27,054 |
2,406,690 | ||
| Computers & Peripherals 3.8% | ||
| Apple Computer, Inc.* | 3,807 | 86,152 |
| Dell, Inc.* | 26,147 | 853,177 |
| EMC Corp.* | 22,277 | 284,032 |
| Gateway, Inc.* | 2,696 | 15,556 |
| Hewlett-Packard Co. | 31,076 | 619,035 |
| International Business Machines Corp. | 17,571 | 1,440,998 |
| Lexmark International, Inc.* | 1,329 | 89,096 |
| NCR Corp.* | 1,003 | 29,097 |
| Network Appliance, Inc.* | 3,508 | 78,614 |
| Sun Microsystems, Inc.* | 32,021 | 123,601 |
3,619,358 | ||
| Electronic Equipment & Instruments 0.5% | ||
| Agilent Technologies, Inc.* | 4,750 | 115,520 |
| Jabil Circuit, Inc.* | 1,976 | 55,624 |
| Millipore Corp.* | 442 | 20,067 |
| PerkinElmer, Inc. | 1,290 | 21,337 |
| Sanmina Corp.* | 5,150 | 46,247 |
| Solectron Corp.* | 8,468 | 50,215 |
| Symbol Technologies, Inc. | 2,401 | 32,510 |
| Tektronix, Inc.* | 870 | 20,567 |
| Thermo Electron Corp.* | 1,724 | 39,290 |
| Waters Corp.* | 1,347 | 41,084 |
442,461 | ||
| Internet Software & Services 0.2% | ||
| Yahoo!, Inc.* | 6,126 | 204,604 |
| IT Consulting & Services 0.3% | ||
| Computer Sciences Corp.* | 1,892 | 80,542 |
| Electronic Data Systems Corp. | 4,941 | 107,862 |
| SunGard Data Systems, Inc.* | 2,900 | 81,780 |
| Unisys Corp.* | 3,123 | 40,537 |
310,721 | ||
| Office Electronics 0.1% | ||
| Xerox Corp.* | 8,006 | 86,305 |
| Semiconductor Equipment & Products 4.1% | ||
| Advanced Micro Devices, Inc.* | 3,491 | 39,413 |
| Altera Corp.* | 3,887 | 87,224 |
| Analog Devices, Inc.* | 3,686 | 151,126 |
| Applied Materials, Inc.* | 16,820 | 363,312 |
| Applied Micro Circuits Corp.* | 3,118 | 18,116 |
| Broadcom Corp. "A"* | 2,878 | 79,087 |
| Intel Corp. | 66,396 | 1,900,254 |
| KLA-Tencor Corp.* | 1,892 | 112,309 |
| Linear Technology Corp. | 3,188 | 131,409 |
| LSI Logic Corp.* | 3,811 | 43,979 |
| Maxim Integrated Products, Inc. | 3,288 | 147,664 |
| Micron Technology, Inc.* | 6,134 | 88,084 |
| National Semiconductor Corp.* | 1,837 | 53,530 |
| Novellus Systems, Inc.* | 1,495 | 59,740 |
| NVIDIA Corp.* | 1,595 | 28,965 |
| PMC-Sierra, Inc.* | 1,719 | 24,513 |
| QLogic Corp.* | 966 | 47,353 |
| Teradyne, Inc.* | 1,886 | 33,627 |
| Texas Instruments, Inc. | 17,555 | 418,687 |
| Xilinx, Inc.* | 3,431 | 105,812 |
3,934,204 | ||
| Software 4.7% | ||
| Adobe Systems, Inc. | 2,298 | 89,231 |
| Autodesk, Inc. | 1,096 | 19,618 |
| BMC Software, Inc.* | 2,264 | 33,236 |
| Citrix Systems, Inc.* | 1,569 | 32,306 |
| Computer Associates International, Inc. | 5,938 | 152,191 |
| Compuware Corp.* | 3,468 | 20,635 |
| Electronic Arts, Inc.* | 1,500 | 134,625 |
| Intuit, Inc.* | 2,105 | 95,399 |
| Mercury Interactive Corp.* | 889 | 39,018 |
| Microsoft Corp. | 108,948 | 2,889,301 |
| Novell, Inc.* | 3,845 | 19,340 |
| Oracle Corp.* | 53,069 | 678,222 |
| Parametric Technology Corp.* | 2,078 | 6,920 |
| PeopleSoft, Inc.* | 3,797 | 68,726 |
| Siebel Systems, Inc.* | 4,975 | 50,148 |
| Symantec Corp.* | 1,500 | 86,145 |
| VERITAS Software Corp.* | 4,145 | 142,920 |
4,557,981 | ||
| Materials 2.8% | ||
| Chemicals 1.5% | ||
| Air Products & Chemicals, Inc. | 2,300 | 108,836 |
| Dow Chemical Co. | 9,234 | 318,850 |
| E.I. du Pont de Nemours & Co. | 10,058 | 449,995 |
| Eastman Chemical Co. | 909 | 32,551 |
| Ecolab, Inc. | 2,658 | 68,550 |
| Engelhard Corp. | 1,246 | 34,975 |
| Great Lakes Chemicals Corp. | 615 | 13,032 |
| Hercules, Inc.* | 1,000 | 11,200 |
| International Flavors & Fragrances, Inc. | 930 | 29,295 |
| Monsanto Co. | 2,623 | 67,437 |
| PPG Industries, Inc. | 1,728 | 94,884 |
| Praxair, Inc. | 1,606 | 102,495 |
| Rohm & Haas Co. | 2,286 | 83,050 |
| Sigma-Aldrich Corp. | 692 | 37,887 |
1,453,037 | ||
| Construction Materials 0.0% | ||
| Vulcan Materials Co. | 1,021 | 42,280 |
| Containers & Packaging 0.2% | ||
| Ball Corp. | 600 | 31,680 |
| Bemis Co., Inc. | 515 | 23,314 |
| Pactiv Corp.* | 1,746 | 35,060 |
| Sealed Air Corp.* | 810 | 39,415 |
| Temple-Inland, Inc. | 567 | 28,225 |
157,694 | ||
| Metals & Mining 0.6% | ||
| Alcoa, Inc. | 8,539 | 243,874 |
| Allegheny Technologies, Inc. | 715 | 5,327 |
| Freeport-McMoRan Copper & Gold, Inc. "B" | 1,696 | 50,880 |
| Newmont Mining Corp. | 4,092 | 160,652 |
| Nucor Corp. | 833 | 42,825 |
| Phelps Dodge Corp.* | 880 | 42,231 |
| United States Steel Corp. | 1,014 | 18,668 |
| Worthington Industries, Inc. | 800 | 12,080 |
576,537 | ||
| Paper & Forest Products 0.5% | ||
| Boise Cascade Corp. | 702 | 19,130 |
| Georgia-Pacific Corp. | 2,578 | 59,732 |
| International Paper Co. | 4,920 | 199,506 |
| Louisiana-Pacific Corp.* | 1,015 | 13,347 |
| MeadWestvaco Corp. | 2,030 | 51,453 |
| Weyerhaeuser Co. | 2,206 | 131,257 |
474,425 | ||
| Telecommunication Services 3.4% | ||
| Diversified Telecommunication Services 2.9% | ||
| ALLTEL Corp. | 3,217 | 147,339 |
| AT&T Corp. | 7,842 | 174,872 |
| BellSouth Corp. | 18,610 | 468,972 |
| CenturyTel, Inc. | 1,553 | 53,982 |
| Citizens Communications Co.* | 2,700 | 30,780 |
| Qwest Communications International, Inc.* | 16,381 | 72,895 |
| SBC Communications, Inc. | 33,616 | 756,024 |
| Sprint Corp. | 9,225 | 136,253 |
| Verizon Communications, Inc. | 27,902 | 985,499 |
2,826,616 | ||
| Wireless Telecommunication Services 0.5% | ||
| AT&T Wireless Services, Inc.* | 27,899 | 240,489 |
| Nextel Communications, Inc. "A"* | 10,641 | 205,158 |
| Sprint Corp. (PCS Group)* | 10,935 | 56,753 |
502,400 | ||
| Utilities 2.7% | ||
| Electric Utilities 2.1% | ||
| Allegheny Energy, Inc. | 1,127 | 10,447 |
| Ameren Corp. | 1,564 | 66,470 |
| American Electric Power Co. | 4,164 | 117,883 |
| CenterPoint Energy, Inc. | 3,207 | 27,227 |
| CINergy Corp. | 1,688 | 57,763 |
| CMS Energy Corp. | 1,462 | 9,752 |
| Consolidated Edison, Inc. | 2,360 | 93,291 |
| Constellation Energy Group, Inc. | 1,635 | 59,498 |
| Dominion Resources, Inc. | 3,154 | 191,069 |
| DTE Energy Co. | 1,606 | 56,065 |
| Edison International* | 3,449 | 65,048 |
| Entergy Corp. | 2,358 | 123,677 |
| Exelon Corp. | 3,268 | 192,485 |
| FirstEnergy Corp. | 2,951 | 86,341 |
| FPL Group, Inc. | 1,905 | 117,843 |
| PG&E Corp.* | 4,236 | 93,912 |
| Pinnacle West Capital Corp. | 1,000 | 34,300 |
| PPL Corp. | 1,691 | 67,082 |
| Progress Energy, Inc. | 2,395 | 96,974 |
| Public Service Enterprise Group, Inc. | 2,204 | 93,317 |
| Southern Co. | 7,242 | 205,528 |
| TECO Energy, Inc. | 1,579 | 18,680 |
| TXU Corp. | 3,186 | 70,092 |
| Xcel Energy, Inc. | 3,886 | 56,930 |
2,011,674 | ||
| Gas Utilities 0.3% | ||
| El Paso Corp. | 5,873 | 43,108 |
| KeySpan Corp. | 1,607 | 54,236 |
| Kinder Morgan, Inc. | 1,247 | 66,403 |
| NICOR, Inc. | 415 | 14,106 |
| NiSource, Inc. | 2,839 | 54,906 |
| Peoples Energy Corp. | 400 | 16,060 |
| Sempra Energy | 2,066 | 61,464 |
310,283 | ||
| Multi-Utilities & Unregulated Power 0.3% | ||
| AES Corp.* | 6,251 | 40,506 |
| Calpine Corp.* | 3,980 | 22,447 |
| Duke Energy Corp. | 9,069 | 154,899 |
| Dynegy, Inc. "A" | 3,727 | 11,516 |
| Williams Companies, Inc. | 5,149 | 47,010 |
276,378 | ||
| Total Common Stocks (Cost $101,251,235) | 94,440,535 | |
Principal Amount ($) | Value ($) | |
Treasury Obligations 0.2% | ||
| US Treasury Bill, 0.88%**, 10/16/2003 (c) (Cost $149,835) | 150,000 | 149,828 |
Shares | Value ($) | |
Cash Equivalents 1.3% | ||
| Scudder Cash Management QP Trust, 1.09% (b) (Cost $1,222,065) | 1,222,065 | 1,222,065 |
| Total Investment Portfolio - 100.0% (Cost $102,623,135) (a) | 95,812,428 | |
* Non-income producing security.
** Annualized yield at time of purchase; not a coupon rate.
(a) The cost for federal income tax purposes was $109,096,360. At August 31, 2003, net unrealized depreciation for all securities based on tax cost was $13,283,932. This consisted of aggregate gross unrealized appreciation for all securities in which there was an excess of value over tax cost of $6,039,490 and aggregate gross unrealized depreciation for all securities in which there was an excess of tax cost over value of $19,323,422.
(b) Scudder Cash Management QP Trust is also managed by Deutsche Investment Management Americas Inc. The rate shown is the annualized seven-day yield at period end.
(c) At August 31, 2003, this security has been pledged, in whole or in part, to cover initial margin requirements for open futures contracts.
At August 31, 2003, open futures contracts purchased were as follows:
Futures | Expiration | Contracts | Aggregate Face Value ($) | Value ($) |
| S&P 500 Index | 9/19/2003 | 5 | 1,228,043 | 1,259,626 |
| Total unrealized appreciation on open futures contracts | 31,583 | |||
The accompanying notes are an integral part of the financial statements.
Statement of Assets and Liabilities as of August 31, 2003 | |
| Assets | |
| Investments: Investments in securities, at value (cost $101,401,070) | $ 94,590,363 |
| Investment in Scudder Cash Management QP Trust (cost $1,222,065) | 1,222,065 |
| Total investments in securities, at value (cost $102,623,135) | 95,812,428 |
| Cash | 10,000 |
| Receivable for daily variation margin on open future contracts | 8,125 |
| Receivable for investments sold | 9,869 |
| Dividends receivable | 148,686 |
| Receivable for Fund shares sold | 165,553 |
| Total assets | $ 96,154,661 |
| Liabilities | |
| Payable for investments purchased | 4,445 |
| Payable for Fund shares redeemed | 691,849 |
| Accrued management fee | 28,137 |
| Other accrued expenses and payables | 65,740 |
| Total liabilities | 790,171 |
| Net assets, at value | $ 95,364,490 |
| Net Assets | |
| Net assets consist of: Undistributed net investment income | 338,815 |
| Net unrealized appreciation (depreciation) on: Investments | (6,810,707) |
| Futures | 31,583 |
| Accumulated net realized gain (loss) | (13,946,494) |
| Paid-in capital | 115,751,293 |
| Net assets, at value | $ 95,364,490 |
The accompanying notes are an integral part of the financial statements.
Statement of Assets and Liabilities as of August 31, 2003 (continued) | |
| Net Asset Value | |
| Class A Net Asset Value and redemption price per share ($69,446,763 / 10,952,643 outstanding shares of beneficial interest, $.01 par value, unlimited number of shares authorized) | $ 6.34 |
| Maximum offering price per share (100 / 95.50 of $6.34) | $ 6.64 |
| Class B Net Asset Value, offering and redemption price (subject to contingent deferred sales charge) per share ($13,870,638 / 2,218,081 outstanding shares of beneficial interest, $.01 par value, unlimited number of shares authorized) | $ 6.25 |
| Class C Net Asset Value and redemption price (subject to contingent deferred sales charge) per share ($12,047,089 / 1,923,973 outstanding shares of beneficial interest, $.01 par value, unlimited number of shares authorized) | $ 6.26 |
| Maximum offering price per share (100 / 99.00 of $6.26) | $ 6.32 |
The accompanying notes are an integral part of the financial statements.
Statement of Operations for the year ended ended August 31, 2003 | |
| Investment Income | |
| Income: Dividends (net of foreign taxes withheld of $135) | $ 1,398,962 |
| Interest - Scudder Cash Management QP Trust | 18,672 |
| Interest | 1,761 |
| Total Income | 1,419,395 |
| Expenses: Management fee | 258,562 |
| Administrative fee | 282,746 |
| Distribution service fees | 328,508 |
| Trustees' fees and expenses | 18,517 |
| Other | 3,782 |
| Total expenses before expense reductions | 892,115 |
| Expense reductions | (262) |
| Total expenses, after expense reductions | 891,853 |
| Net investment income (loss) | 527,542 |
| Realized and Unrealized Gain (Loss) on Investment Transactions | |
| Net realized gain (loss) from: Investments | (6,237,194) |
| Futures | 70,251 |
| (6,166,943) | |
| Net unrealized appreciation (depreciation) during the period on: Investments | 14,648,700 |
| Futures | (44,906) |
| 14,603,794 | |
| Net gain (loss) on investment transactions | 8,436,851 |
| Net increase (decrease) in net assets resulting from operations | $ 8,964,393 |
The accompanying notes are an integral part of the financial statements.
Statement of Changes in Net Assets | ||
Years Ended August 31, | ||
| Increase (Decrease) in Net Assets | 2003 | 2002 |
| Operations: Net investment income | $ 527,542 | $ 193,478 |
| Net realized gain (loss) on investment transactions | (6,166,943) | (5,910,854) |
| Net unrealized appreciation (depreciation) on investment transactions during the period | 14,603,794 | (10,501,058) |
| Net increase (decrease) in net assets resulting from operations | 8,964,393 | (16,218,434) |
| Distributions to shareholders from: Net investment income: Class A | (331,565) | (99,581) |
| Fund share transactions: Proceeds from shares sold | 56,890,636 | 58,885,353 |
| Reinvestment of distributions | 330,928 | 99,581 |
| Cost of shares redeemed | (42,182,800) | (35,771,093) |
| Net increase (decrease) in net assets from Fund share transactions | 15,038,764 | 23,213,841 |
| Increase (decrease) in net assets | 23,671,592 | 6,895,826 |
| Net assets at beginning of period | 71,692,898 | 64,797,072 |
| Net assets at end of period (including undistributed net investment income of $338,815 and $147,629, respectively) | $ 95,364,490 | $ 71,692,898 |
The accompanying notes are an integral part of the financial statements.
Class A | ||||
Years Ended August 31, | 2003 | 2002 | 2001 | 2000a |
| Selected Per Share Data | ||||
| Net asset value, beginning of period | $ 5.75 | $ 7.10 | $ 9.59 | $ 9.50 |
| Income from investment operations: Net investment incomeb | .05 | .03 | .03 | .03 |
| Net realized and unrealized gain (loss) | .57 | (1.37) | (2.46) | .06 |
Total from investment operations | .62 | (1.34) | (2.43) | .09 |
| Less distribution from: Net investment income | (.03) | (.01) | (.04) | - |
| Net realized gains on investment transactions | - | - | (.02) | - |
Total distributions | (.03) | (.01) | (.06) | - |
| Net asset value, end of period | $ 6.34 | $ 5.75 | $ 7.10 | $ 9.59 |
| Total Return (%)c | 10.93 | (18.87) | (25.46)d | .95d** |
| Ratios to Average Net Assets and Supplemental Data | ||||
| Net assets, end of period ($ in millions) | 69 | 51 | 45 | 22 |
| Ratio of expenses before expense reductions (%) | .92 | 1.00 | 1.62e | 3.19* |
| Ratio of expenses after expense reductions (%) | .92 | 1.00 | 1.03e | 1.00* |
| Ratio of net investment income (loss) (%) | .89 | .48 | .41 | .90* |
| Portfolio turnover rate (%) | 11 | 12 | 8 | 43* |
| a For the period from April 3, 2000 (commencement of operations) to August 31, 2000. b Based on average shares outstanding during the period. c Total return does not reflect the effect of any sales charges. d Total return would have been lower had certain expenses not been reduced. e The ratios of operating expenses excluding costs incurred in connection with a fund complex reorganization before and after expense reductions were 1.61% and 1.02%, respectively. * Annualized ** Not annualized | ||||
Class B | ||||
Years Ended August 31, | 2003 | 2002 | 2001 | 2000a |
| Selected Per Share Data | ||||
| Net asset value, beginning of period | $ 5.68 | $ 7.06 | $ 9.57 | $ 9.50 |
| Income from investment operations: Net investment income (loss)b | .01 | (.02) | (.03) | .00 |
| Net realized and unrealized gain (loss) | .56 | (1.36) | (2.46) | .07 |
Total from investment operations | .57 | (1.38) | (2.49) | .07 |
| Less distribution from: Net realized gains on investment transactions | - | - | (.02) | - |
| Net asset value, end of period | $ 6.25 | $ 5.68 | $ 7.06 | $ 9.57 |
| Total Return (%)c | 10.04 | (19.55) | (26.04)d | .74d** |
| Ratios to Average Net Assets and Supplemental Data | ||||
| Net assets, end of period ($ in millions) | 14 | 13 | 14 | 3 |
| Ratio of expenses before expense reductions (%) | 1.72 | 1.80 | 2.64e | 4.18* |
| Ratio of expenses after expense reductions (%) | 1.72 | 1.80 | 1.81e | 1.75* |
| Ratio of net investment income (loss) (%) | .09 | (.32) | (.38) | .09* |
| Portfolio turnover rate (%) | 11 | 12 | 8 | 43* |
| a For the period from April 3, 2000 (commencement of operations) to August 31, 2000. b Based on average shares outstanding during the period. c Total return does not reflect the effect of any sales charges. d Total return would have been lower had certain expenses not been reduced. e The ratios of operating expenses excluding costs incurred in connection with a fund complex reorganization before and after expense reductions were 2.64% and 1.80%, respectively. * Annualized ** Not annualized | ||||
Class C | ||||
Years Ended August 31, | 2003 | 2002 | 2001 | 2000a |
| Selected Per Share Data | ||||
| Net asset value, beginning of period | $ 5.68 | $ 7.06 | $ 9.57 | $ 9.50 |
| Income from investment operations: Net investment income (loss)b | .01 | (.02) | (.03) | .00 |
| Net realized and unrealized gain (loss) | .57 | (1.36) | (2.46) | .07 |
Total from investment operations | .58 | (1.38) | (2.49) | .07 |
| Less distribution from: Net realized gains on investment transactions | - | - | (.02) | - |
| Net asset value, end of period | $ 6.26 | $ 5.68 | $ 7.06 | $ 9.57 |
| Total Return (%)c | 10.21 | (19.55) | (26.04)d | .74d** |
| Ratios to Average Net Assets and Supplemental Data | ||||
| Net assets, end of period ($ in millions) | 12 | 8 | 5 | 2 |
| Ratio of expenses before expense reductions (%) | 1.69 | 1.77 | 2.67e | 4.13* |
| Ratio of expenses after expense reductions (%) | 1.69 | 1.77 | 1.80e | 1.75* |
| Ratio of net investment income (loss) (%) | .12 | (.29) | (.36) | .09* |
| Portfolio turnover rate (%) | 11 | 12 | 8 | 43* |
| a For the period from April 3, 2000 (commencement of operations) to August 31, 2000. b Based on average shares outstanding during the period. c Total return does not reflect the effect of any sales charges. d Total return would have been lower had certain expenses not been reduced. e The ratios of operating expenses excluding costs incurred in connection with a fund complex reorganization before and after expense reductions were 2.66% and 1.79%, respectively. * Annualized ** Not annualized | ||||
A. Significant Accounting Policies
Scudder S&P 500 Stock Fund (the "Fund") is a diversified series of Scudder Investors Trust (the "Trust") which is registered under the Investment Company Act of 1940, as amended (the "1940 Act"), as an open-end management investment company organized as a Massachusetts business trust.
The Fund offers multiple classes of shares which provide investors with different purchase options. Class A shares are offered to investors subject to an initial sales charge. Class B shares are offered without an initial sales charge but are subject to higher ongoing expenses than Class A shares and a contingent deferred sales charge payable upon certain redemptions. Class B shares automatically convert to Class A shares six years after issuance. Class C shares are offered to investors subject to a 1% initial sales charge and are subject to higher ongoing expenses than Class A shares and a contingent deferred sales charge payable upon certain redemptions within one year of purchase. Prior to February 3, 2003, Class C shares were offered without an initial sales charge. Class C shares do not convert into another class.
Investment income, realized and unrealized gains and losses, and certain fund-level expenses and expense reductions, if any, are borne pro rata on the basis of relative net assets by the holders of all classes of shares, except that each class bears certain expenses unique to that class such as distribution service fees, administrative fees and certain other class-specific expenses. Differences in class-level expenses may result in payment of different per share dividends by class. All shares of the Fund have equal rights with respect to voting subject to class-specific arrangements.
The Fund's financial statements are prepared in accordance with accounting principles generally accepted in the United States of America which require the use of management estimates. Actual results could differ from those estimates. The policies described below are followed consistently by the Fund in the preparation of its financial statements.
Security Valuation. Investments are stated at value determined as of the close of regular trading on the New York Stock Exchange on each day the exchange is open for trading. Equity securities are valued at the most recent sale price reported on the exchange (US or foreign) or over-the-counter market on which the security is traded most extensively. Securities for which no sales are reported are valued at the calculated mean between the most recent bid and asked quotations on the relevant market or, if a mean cannot be determined, at the most recent bid quotation.
Money market instruments purchased with an original or remaining maturity of sixty days or less, maturing at par, are valued at amortized cost. Investments in open-end investment companies and Scudder Cash Management QP Trust are valued at their net asset value each business day.
Securities and other assets for which market quotations are not readily available or for which the above valuation procedures are deemed not to reflect fair value are valued in a manner that is intended to reflect their fair value as determined in accordance with procedures approved by the Trustees.
Futures Contracts. A futures contract is an agreement between a buyer or seller and an established futures exchange or its clearinghouse in which the buyer or seller agrees to take or make a delivery of a specific amount of a financial instrument at a specified price on a specific date (settlement date). The Fund may enter into futures contracts as a hedge against anticipated interest rate, currency or equity market changes, and for duration management, risk management and return enhancement purposes.
Upon entering into a futures contract, the Fund is required to deposit with a financial intermediary an amount ("initial margin") equal to a certain percentage of the face value indicated in the futures contract. Subsequent payments ("variation margin") are made or received by the Fund dependent upon the daily fluctuations in the value of the underlying security and are recorded for financial reporting purposes as unrealized gains or losses by the Fund. When entering into a closing transaction, the Fund will realize a gain or loss equal to the difference between the value of the futures contract to sell and the futures contract to buy. Futures contracts are valued at the most recent settlement price.
Certain risks may arise upon entering into futures contracts, including the risk that an illiquid secondary market will limit the Fund's ability to close out a futures contract prior to the settlement date and that a change in the value of a futures contract may not correlate exactly with the changes in the value of the securities or currencies hedged. When utilizing futures contracts to hedge, the Fund gives up the opportunity to profit from favorable price movements in the hedged positions during the term of the contract.
Federal Income Taxes. The Fund's policy is to comply with the requirements of the Internal Revenue Code, as amended, which are applicable to regulated investment companies, and to distribute all of its taxable income to its shareholders. Accordingly, the Fund paid no federal income taxes and no federal income tax provision was required.
At August 31, 2003, the Fund had a net tax basis capital loss carryforward of approximately $4,116,000 which may be applied against any realized net taxable capital gains of each succeeding year until fully utilized or until August 31, 2009 ($228,000), August 31, 2010 ($638,000), and August 31, 2011 ($3,250,000) the expiration dates, whichever occurs first. In addition, from November 1, 2002 through August 31, 2003, the Fund incurred approximately $3,326,000 of net realized capital losses. As permitted by tax regulations, the Fund intends to elect to defer these losses and treat them as arising in the fiscal year ended August 31, 2004.
Distribution of Income and Gains. Distributions of net investment income, if any, are made annually. Net realized gains from investment transactions, in excess of available capital loss carryforwards, would be taxable to the Fund if not distributed, and, therefore, will be distributed to shareholders at least annually.
The timing and characterization of certain income and capital gains distributions are determined annually in accordance with federal tax regulations which may differ from accounting principles generally accepted in the United States of America. These differences primarily relate to securities sold at a loss and investments in futures contracts. As a result, net investment income (loss) and net realized gain (loss) on investment transactions for a reporting period may differ significantly from distributions during such period. Accordingly, the Fund may periodically make reclassifications among certain of its capital accounts without impacting the net asset value of the Fund.
At August 31, 2003, the Fund's components of distributable earnings (accumulated losses) on a tax-basis were as follows:
| Undistributed ordinary income* | $ 343,853 |
| Undistributed net long-term capital gains | $ - |
| Capital loss carryforwards | $ (4,116,000) |
| Unrealized appreciation (depreciation) on investments | $ (13,283,932) |
In addition, during the years ended August 31, 2003 and August 31, 2002 the tax character of distributions paid to shareholders by the Fund are summarized as follows:
2003 | 2002 | |
| Distributions from ordinary income* | $ 331,565 | $ 99,581 |
* For tax purposes short-term capital gains distributions are considered ordinary income distributions.
Other. Investment transactions are accounted for on the trade date. Interest income is recorded on the accrual basis. Dividend income is recorded on the ex-dividend date. Realized gains and losses from investment transactions are recorded on an identified cost basis.
B. Purchases and Sales of Securities
During the year ended August 31, 2003, purchases and sales of investment securities (excluding short-term instruments) aggregated $24,125,876 and $8,481,573, respectively.
C. Related Parties
Management Agreement. Under the Management Agreement with Deutsche Investment Management Americas Inc. ("DeIM" or the "Advisor"), the Advisor directs the investments of the Fund in accordance with its investment objectives, policies and restrictions. The Advisor determines the securities, instruments and other contracts relating to investments to be purchased, sold or entered into by the Fund. In addition to portfolio management services, the Advisor provides certain administrative services in accordance with the Management Agreement. The management fee payable under the Agreement was equal to an annual rate of 0.33% of the first $100,000,000 of the Fund's average daily net assets, 0.29% of the next $100,000,000 of such net assets and 0.27% of such net assets in excess of $200,000,000, computed and accrued daily and payable monthly. Accordingly, for the year ended August 31, 2003, the fee pursuant to the Management Agreement was equivalent to an annualized effective rate of 0.33% of the Fund's average daily net assets.
On January 31, 2003, Deutsche Bank AG completed the sale of its global passive equity, enhanced equity and passive fixed income businesses to Northern Trust Investments, N.A. ("NTI"), an indirect subsidiary of Northern Trust Corporation. Under this agreement, Deutsche Investment Management Americas Inc. ("DeIM") remained as investment advisor to the Fund until Board and shareholder approval of NTI as sub-advisor to the Fund. Effective April 25, 2003, NTI serves as sub-advisor to the Fund and is paid by the Advisor for its services.
Administrative Fee. Under the Administrative Agreement (the "Administrative Agreement"), the Advisor provides or pays others to provide substantially all of the administrative services required by the Fund (other than those provided by the Advisor under its Agreement and Management Agreement with the Fund, as described above) in exchange for the payment by each class of the Fund of an administrative services fee (the "Administrative Fee") of 0.35%, 0.40% and 0.375% of the average daily net assets for Class A, B and C shares, respectively, computed and accrued daily and payable monthly.
Various third-party service providers, some of which are affiliated with the Advisor, provide certain services to the Fund under the Administrative Agreement. Scudder Fund Accounting Corporation, a subsidiary of the Advisor, computes the net asset value for the Fund and maintains the accounting records of the Fund. Scudder Investments Service Company, an affiliate of the Advisor, is the transfer, shareholder service and dividend-paying agent for Class A, B and C shares of the Fund. These affiliated entities have in return entered in various agreements with third-party service providers to provide these services. In addition, other service providers not affiliated with the Advisor provide certain services (i.e., custody, legal and audit) to the Fund under the Administrative Agreement. The Advisor pays the service providers for the provision of their services to the Fund and pays other Fund expenses, including insurance, registration, printing, postage and other costs. Certain expenses of the Fund are not borne by the Advisor under the Administrative Agreement, such as taxes, brokerage, interest and extraordinary expenses, and the fees and expenses of the Independent Trustees (including the fees and expenses of their independent counsel). For the year ended August 31, 2003, the Administrative Fee was as follows:
Administrative Fee | Total Aggregated | Unpaid at August 31, 2003 |
| Class A | $ 198,465 | $ 21,576 |
| Class B | 49,635 | 5,054 |
| Class C | 34,646 | 3,902 |
$ 282,746 | $ 30,532 |
The Administrative Agreement between the Advisor and the Fund will terminate effective September 30, 2003 and the Fund will directly bear the cost of those expenses formerly covered under the Administrative Agreement.
Effective October 1, 2003 through September 30, 2005, the Advisor has agreed to contractually waive all or a portion of its management fee and reimburse or pay certain operating expenses of the Fund to the extent necessary to maintain the operating expenses of each class at 0.75%, 0.80% and 0.80% of average daily net assets for Class A, B and C shares, respectively (excluding certain expenses such as Rule 12b-1 and/or service fees, trustee and trustee counsel fees, extraordinary expenses, taxes, brokerage and interest).
Distribution Service Agreement. Under the Distribution Service Agreement, in accordance with Rule 12b-1 under the 1940 Act, Scudder Distributors, Inc., ("SDI"), a subsidiary of the Advisor, receives a fee ("Distribution Fee") of 0.75% of average daily net assets of Class B and C shares. Pursuant to the agreement, SDI enters into related selling group agreements with various firms at various rates for sales of Class B and C shares. For the year ended August 31, 2003, the Distribution Fee was as follows:
Distribution Fee | Total Aggregated | Unpaid at August 31, 2003 |
| Class B | $ 93,066 | $ 8,613 |
| Class C | 69,292 | 7,482 |
$ 162,358 | $ 16,095 |
In addition, SDI provides information and administrative services ("Service Fee") to Class A, B and C shareholders at an annual rate of up to 0.25% of average daily net assets for each such class. SDI in turn has various agreements with financial services firms that provide these services and pays these fees based upon the assets of shareholder accounts the firms service. For the year ended August 31, 2003, the Service Fee was as follows:
Service Fee | Total Aggregated | Unpaid at August 31, 2003 | Effective Rate |
| Class A | $ 120,160 | $ 11,763 | .21% |
| Class B | 26,538 | 2,301 | .21% |
| Class C | 19,452 | 1,713 | .21% |
$ 166,150 | $ 15,777 |
Underwriting Agreement and Contingent Deferred Sales Charge. SDI is the principal underwriter for Class A, B and C shares. Underwriting commissions paid in connection with the distribution of Class A and C shares for the year ended August 31, 2003 aggregated $5,316 and $69, respectively.
In addition, SDI receives any contingent deferred sales charge ("CDSC") from Class B share redemptions occurring within six years of purchase and Class C share redemptions occurring within one year of purchase. There is no such charge upon redemption of any share appreciation or reinvested dividends. The CDSC is based on declining rates ranging from 4% to 1% for Class B and 1% for Class C, of the value of the shares redeemed. For the year ended August 31, 2003 the CDSC for Class B and C shares aggregated $50,081 and $144, respectively. A deferred sales charge of up to 1% is assessed on certain redemptions of Class A shares. For the year ended August 31, 2003, SDI received $510.
Trustees' Fees and Expenses. The Trust pays each Trustee not affiliated with the Advisor retainer fees plus specified amounts for attended board and committee meetings.
Scudder Cash Management QP Trust. Pursuant to an Exemptive Order issued by the SEC, the Fund may invest in the Scudder Cash Management QP Trust (the "QP Trust") and other affiliated funds managed by Scudder Investments, Inc. The QP Trust seeks to provide as high a level of current income as is consistent with the preservation of capital and the maintenance of liquidity. The QP Trust does not pay the Advisor a management fee for the affiliated funds' investments in the QP Trust.
D. Expense Off-Set Arrangement
The Fund has entered into an arrangement with its custodian whereby credits realized as a result of uninvested cash balances are used to reduce a portion of the Fund's custodian expenses. During the year ended August 31, 2003, the Administrative Fee was reduced by $262 for custodian credits earned.
E. Line of Credit
The Fund and several other affiliated funds (the "Participants") share in a $1.25 billion revolving credit facility administered by J.P. Morgan Chase Bank for temporary or emergency purposes, including the meeting of redemption requests that otherwise might require the untimely disposition of securities. The Participants are charged an annual commitment fee which is allocated, pro rata based upon net assets, among each of the Participants. Interest is calculated at the Federal Funds rate plus 0.5 percent. The Fund may borrow up to a maximum of 33 percent of its net assets under the agreement.
F. Share Transactions
The following table summarizes share and dollar activity in the Fund:
Year Ended | Year Ended | |||
Shares | Dollars | Shares | Dollars | |
| Shares sold | ||||
| Class A | 7,037,294 | $ 40,177,197 | 6,698,957 | $ 45,271,215 |
| Class B | 1,863,607 | 10,593,527 | 1,141,086 | 7,539,065 |
| Class C | 1,081,710 | 6,119,912 | 905,554 | 6,075,073 |
$ 56,890,636 | $ 58,885,353 | |||
| Shares issued in reinvestment of dividends | ||||
| Class A | 59,095 | $ 330,928 | 13,987 | $ 99,581 |
$ 330,928 | $ 99,581 | |||
| Shares redeemed | ||||
| Class A | (5,011,984) | $ (28,491,274) | (4,218,486) | $ (28,148,267) |
| Class B | (1,973,680) | (11,006,249) | (828,642) | (5,480,313) |
| Class C | (479,136) | (2,685,277) | (332,788) | (2,142,513) |
$ (42,182,800) | $ (35,771,093) | |||
| Net increase (decrease) | ||||
| Class A | 2,084,405 | $ 12,016,851 | 2,494,458 | $ 17,222,529 |
| Class B | (110,073) | (412,722) | 312,444 | 2,058,752 |
| Class C | 602,574 | 3,434,635 | 572,766 | 3,932,560 |
$ 15,038,764 | $ 23,213,841 | |||
To the Trustees of Scudder Investors Trust and Shareholders of Scudder S&P 500 Stock Fund:
We have audited the accompanying statement of assets and liabilities, including the investment portfolio, of the Scudder S&P 500 Stock Fund (the "Fund"), a series of the Scudder Investors Trust (the "Trust"), as of August 31, 2003, and the related statement of operations for the year then ended, the statement of changes in net assets for each of the two years in the period then ended, and the financial highlights for each of the periods indicated therein. These financial statements and financial highlights are the responsibility of the Trust's management. Our responsibility is to express an opinion on these financial statements and financial highlights based on our audits.
We conducted our audits in accordance with auditing standards generally accepted in the United States of America. Those standards require that we plan and perform the audit to obtain reasonable assurance about whether the financial statements and financial highlights are free of material misstatement. An audit includes examining, on a test basis, evidence supporting the amounts and disclosures in the financial statements and financial highlights. Our procedures included confirmation of securities owned as of August 31, 2003, by correspondence with the custodian and brokers or by other appropriate auditing procedures were replies from brokers were not received. An audit also includes assessing the accounting principles used and significant estimates made by management, as well as evaluating the overall financial statement presentation. We believe that our audits provide a reasonable basis for our opinion.
In our opinion, the financial statements and financial highlights referred to above present fairly, in all material respects, the financial position of the Scudder S&P 500 Stock Fund at August 31, 2003, the results of its operations for the year then ended, the changes in its net assets for each of the two years in the period then ended, and the financial highlights for each of the periods indicated therein, in conformity with accounting principles generally accepted in the United States.
Boston, Massachusetts | /s/ Ernst & Young LLP |
For corporate shareholders, 100% of the income dividends paid during the Fund's fiscal year ended August 31, 2003 qualified for the dividends received deduction.
For federal income tax purposes, the Fund designates $400,000, or the maximum amount allowable under tax law, as qualified dividend income.
Please consult a tax advisor if you have questions about federal or state income tax laws, or on how to prepare your tax returns. If you have specific questions about your account, please call 1-800-SCUDDER.
The following table presents certain information regarding the Trustees and Officers of the fund as of August 31, 2003. Each individual's age is set forth in parentheses after his or her name. Unless otherwise noted, (i) each individual has engaged in the principal occupation(s) noted in the table for at least the most recent five years, although not necessarily in the same capacity, and (ii) the address of each individual is c/o Deutsche Asset Management, 222 South Riverside Plaza, Chicago, Illinois, 60606. Each Trustee's term of office extends until the next shareholder's meeting called for the purpose of electing Trustees and until the election and qualification of a successor, or until such Trustee sooner dies, resigns or is removed as provided in the governing documents of the fund.
Independent Trustees | ||
| Name, Age, Position(s) Held with the Fund and Length of Time Served1 | Principal Occupation(s) During Past 5 Years and Other Directorships Held | Number of Funds in Fund Complex Overseen |
| John W. Ballantine (57) Trustee, 1999-present | Retired; formerly, Executive Vice President and Chief Risk Management Officer, First Chicago NBD Corporation/The First National Bank of Chicago (1996-1998); Executive Vice President and Head of International Banking (1995-1996). Directorships: Enron Corporation (energy trading firm) (effective May 30, 2002); First Oak Brook Bancshares, Inc.; Oak Brook Bank; Tokheim Corporation (designer, manufacturer and servicer of electronic and mechanical petroleum marketing systems); American Healthways, Inc. (provider of disease and care management services). | 82 |
| Lewis A. Burnham (70) Trustee, 1977-present | Retired; formerly, Director of Management Consulting, McNulty & Company (1990-1998); prior thereto, Executive Vice President, Anchor Glass Container Corporation. | 82 |
| Donald L. Dunaway (66) Trustee, 1980-present | Retired; formerly, Executive Vice President, A.O. Smith Corporation (diversified manufacturer) (1963-1994). | 82 |
| James R. Edgar (57) Trustee, 1999-present | Distinguished Fellow, University of Illinois, Institute of Government and Public Affairs (1999-present); formerly, Governor, State of Illinois (1991-1999). Directorships: Kemper Insurance Companies; John B. Sanfilippo & Son, Inc. (processor/packager/marketer of nuts, snacks and candy products); Horizon Group Properties, Inc.; Youbet.com (online wagering platform); Alberto-Culver Company (manufactures, distributes and markets health and beauty-care products). | 82 |
| Paul K. Freeman (53) Trustee, 2002-present | President, Cook Street Holdings (consulting); Adjunct Professor, University of Denver; Consultant, World Bank/Inter-American Development Bank; formerly, Project Leader, International Institute for Applied Systems Analysis (1998-2001); Chief Executive Officer, The Eric Group, Inc. (environmental insurance) (1986-1998). | 82 |
| Robert B. Hoffman (66) Trustee, 1981-present | Retired; formerly, Chairman, Harnischfeger Industries, Inc. (machinery for the mining and paper industries) (1999-2000); prior thereto, Vice Chairman and Chief Financial Officer, Monsanto Company (agricultural, pharmaceutical and nutritional/food products) (1994-1999). | 82 |
| Shirley D. Peterson (61) Trustee, 1995-present | Retired; formerly, President, Hood College (1995-2000); prior thereto, Partner, Steptoe & Johnson (law firm); Commissioner, Internal Revenue Service; Assistant Attorney General (Tax), US Department of Justice. Directorships: Bethlehem Steel Corp.; Federal Mogul Corp. (supplier of automotive components and subsystems); Trustee, Bryn Mawr College. | 82 |
| Fred B. Renwick (73) Trustee, 1988-present | Retired; Professor Emeritus of Finance, New York University, Stern School of Business (2001-present); formerly, Professor, New York University Stern School of Business (1965-2001). Directorships: The Wartburg Foundation; Chairman, Finance Committee of Morehouse College Board of Trustees; formerly, Director of Board of Pensions, Evangelical Lutheran Church in America; member of the Investment Committee of Atlanta University Board of Trustees; Chair of the Investment Committee, American Bible Society Board of Trustees. | 82 |
| William P. Sommers (70) Trustee, 1979-present | Retired; formerly, President and Chief Executive Officer, SRI International (research and development) (1994-1998); prior thereto, Executive Vice President, lameter (medical information and educational service provider); Senior Vice President and Director, Booz, Allen & Hamilton Inc. (management consulting firm). Directorships: PSI Inc. (satellite engineering and components); Evergreen Solar, Inc. (develop/manufacture solar electric system engines); H2 Gen (manufacture hydrogen generators); Zassi Medical Evolutions, Inc. (specialists in intellectual property opportunities in medical device arena); Guckenheimer Enterprises (executive food services). | 82 |
| John G. Weithers (70) Trustee, 1993-present | Retired; formerly, Chairman of the Board and Chief Executive Officer, Chicago Stock Exchange. Directorships: Federal Life Insurance Company; Chairman of the Members of the Corporation and Trustee, DePaul University; formerly, International Federation of Stock Exchanges; Records Management Systems. | 82 |
Interested Trustees and Officers2 | ||
| Name, Age, Position(s) Held with the Fund and Length of Time Served1 | Principal Occupation(s) During Past 5 Years and Other Directorships Held | Number of Funds in Fund Complex Overseen |
| Richard T. Hale3 (58) Chairman and Trustee, 2002-present President, 2003-present | Managing Director, Deutsche Investment Management Americas Inc. (2003-present); Managing Director, Deutsche Bank Securities Inc. (formerly Deutsche Banc Alex. Brown Inc.) and Deutsche Asset Management (1999 to present); Director and President, Investment Company Capital Corp. (registered investment advisor) (1996 to present); Director, Deutsche Global Funds, Ltd. (2000 to present), CABEI Fund (2000 to present), North American Income Fund (2000 to present) (registered investment companies); Director, Scudder Global Opportunities Fund (since 2003); Director/Officer Deutsche/Scudder Mutual Funds (various dates); President, Montgomery Street Income Securities, Inc. (2002 to present) (registered investment companies); Vice President, Deutsche Asset Management, Inc. (2000 to present); formerly, Director, ISI Family of Funds (registered investment companies; 4 funds overseen) (1992-1999) | 201 |
| Philip J. Collora (57) Vice President and Assistant Secretary, 1986-present | Director, Deutsche Asset Management | n/a |
| Daniel O. Hirsch3 (49) Vice President and Assistant Secretary, 2002-present | Managing Director, Deutsche Asset Management (2002-present) and Director, Deutsche Global Funds Ltd. (2002-present); formerly, Director, Deutsche Asset Management (1999-2002); Principal, BT Alex. Brown Incorporated (now Deutsche Bank Securities Inc.) (1998-1999); Assistant General Counsel, United States Securities and Exchange Commission (1993-1998) | n/a |
| Kenneth Murphy4 (39) Vice President, 2002-present | Vice President, Deutsche Asset Management (2000-present); Vice President, Scudder Distributors, Inc. (December 2002-present); formerly, Director, John Hancock Signature Services (1992-2000) | n/a |
| Charles A. Rizzo4 (46) Treasurer, 2002-present | Director, Deutsche Asset Management (April 2000-present). Formerly, Vice President and Department Head, BT Alex. Brown Incorporated (now Deutsche Bank Securities Inc.) (1998-1999); Senior Manager, Coopers & Lybrand L.L.P. (now PricewaterhouseCoopers LLP) (1993-1998) | n/a |
| Salvatore Schiavone4 (37) Assistant Treasurer, 2003-present | Director, Deutsche Asset Management | n/a |
| Lucinda H. Stebbins4 (57) Assistant Treasurer, 2003-present | Director, Deutsche Asset Management | n/a |
| Kathleen Sullivan D'Eramo4 (46) Assistant Treasurer, 2003-present | Director, Deutsche Asset Management | n/a |
| John Millette4 (41) Secretary, 2001-present | Director, Deutsche Asset Management | n/a |
| Caroline Pearson4 (41) Assistant Secretary, 1998-present | Managing Director, Deutsche Asset Management | n/a |
1 Length of time served represents the date that each Trustee was first elected to the common board of trustees which oversees a number of investment companies, including the fund, managed by the Advisor. For the Officers of the fund, length of time served represents the date that each Officer was first elected to serve as an officer of any fund overseen by the aforementioned common board of trustees.
2 As a result of their respective positions held with the Advisor, these individuals are considered "interested persons" of the Advisor within the meaning of the 1940 Act, as amended. Interested persons receive no compensation from the fund.
3 Address: One South Street, Baltimore, Maryland
4 Address: Two International Place, Boston, Massachusetts
The fund's Statement of Additional Information ("SAI") includes additional information about the Trustees. The SAI is available, without charge, upon request. If you would like to request a copy of the SAI, you may do so by calling the following toll-free number: 1-800-621-1048.
Scudder Funds |
| Growth Funds Scudder 21st Century Growth Fund Scudder Aggressive Growth Fund Scudder Blue Chip Fund Scudder Capital Growth Fund Scudder Development Fund Scudder Dynamic Growth Fund Scudder Flag Investors Scudder Gold & Precious Metals Fund Scudder Global Biotechnology Fund Scudder Growth Fund Scudder Health Care Fund Scudder Large Company Growth Fund Scudder Micro Cap Fund Scudder Mid Cap Fund Scudder Small Cap Fund Scudder Strategic Growth Fund Scudder Technology Fund Scudder Technology Innovation Fund Scudder Top 50 US Fund Value FundsScudder Contrarian Fund Scudder-Dreman Financial Services Fund Scudder-Dreman High Return Equity Fund Scudder-Dreman Small Cap Value Fund Scudder Flag Investors Equity Scudder Growth and Income Fund Scudder Large Company Value Fund Scudder-RREEF Real Estate Securities Fund Scudder Small Company Stock Fund Scudder Small Company Value Fund Scudder Tax Advantaged Dividend Fund Multicategory/Asset Allocation FundsScudder Balanced Fund Scudder Flag Investors Value Builder Fund Scudder Focus Value+Growth Fund Scudder Lifecycle Mid Range Fund Scudder Lifecycle Long Range Fund Scudder Lifecycle Short Range Fund Scudder Pathway Conservative Portfolio Scudder Pathway Growth Portfolio Scudder Pathway Moderate Portfolio Scudder Target 2013 Fund Scudder Total Return Fund International/Global FundsScudder Emerging Markets Growth Fund Scudder Emerging Markets Income Fund Scudder European Equity Fund Scudder Global Fund Scudder Global Bond Fund Scudder Global Discovery Fund Scudder Greater Europe Growth Fund Scudder International Fund Scudder International Equity Fund Scudder International Select Equity Fund Scudder Japanese Equity Fund Scudder Latin America Fund Scudder New Europe Fund Scudder Pacific Opportunities Fund Income FundsScudder Cash Reserves Fund Scudder Fixed Income Fund Scudder GNMA Fund Scudder High Income Plus Fund (formerly Deutsche High Yield Bond Fund) Scudder High Income Fund (formerly Scudder High Yield Fund) Scudder High Income Opportunity Fund (formerly Scudder High Yield Opportunity Fund) Scudder Income Fund Scudder PreservationPlus Fund Scudder PreservationPlus Income Fund Scudder Short Duration Fund (formerly Scudder Short-Term Fixed Income Fund) Scudder Short-Term Bond Fund Scudder Strategic Income Fund Scudder U.S. Government Securities Fund |
Not all funds are available in all share classes.
Scudder open-end funds are offered by prospectus only. For more complete information on any fund or variable annuity registered in your state, including information about a fund's objectives, strategies, risks, advisory fees, distribution charges, and other expenses, please order a free prospectus. Read the prospectus before investing in any fund to ensure the fund is appropriate for your goals and risk tolerance.
A money market mutual fund investment is not insured or guaranteed by the Federal Deposit Insurance Corporation or any other government agency. Although a money market mutual fund seeks to preserve the value of your investment at $1 per share, it is possible to lose money by investing in such a fund.
The products described should not be considered a solicitation to buy or an offer to sell a security to any person in any jurisdiction where such offer, solicitation, purchase, or sale would be unlawful under the securities laws of such jurisdiction.
Automated Information Lines | ScudderACCESS (800) 972-3060 Personalized account information, information on other Scudder funds and services via touchtone telephone and for Classes A, B, and C only, the ability to exchange or redeem shares. |
Web Site | scudder.com View your account transactions and balances, trade shares, monitor your asset allocation, and change your address, 24 hours a day.Obtain prospectuses and applications, blank forms, interactive worksheets, news about Scudder funds, subscription to fund updates by e-mail, retirement planning information, and more. |
For more information | (800) 621-1048 To speak with a Scudder service representative. |
Written correspondence | Scudder Investments PO Box 219356Kansas City, MO 64121-9356 |
Principal Underwriter | If you have questions, comments or complaints, contact: Scudder Distributors, Inc. 222 South Riverside PlazaChicago, IL 60606 (800) 621-1148 |
Class A | Class B | Class C | |
Nasdaq Symbol | KSAAX | KSABX | KSACX |
CUSIP Number | 811166-701 | 811166-800 | 811166-883 |
Fund Number | 155 | 255 | 355 |
Notes |
Notes |
Notes |
Notes |
Notes |

ITEM 2.         CODE OF ETHICS.

As of the end of the period, August 31, 2003, the Scudder S&P 500 Stock Fund has
adopted a code of ethics,  as defined in Item 2 of Form N-CSR,  that  applies to
its President and Treasurer and its Chief Financial  Officer. A copy of the code
of ethics is filed as an exhibit to this Form N-CSR.

ITEM 3.         AUDIT COMMITTEE FINANCIAL EXPERT.

The Fund's Board of Directors/Trustees has determined that the Fund has at least
one "audit committee financial expert" serving on its audit committee: Mr.
Donald L. Dunaway. This audit committee member is "independent," meaning that he
is not an "interested person" of the Fund (as that term is defined in Section
2(a)(19) of the Investment Company Act of 1940) and he does not accept any
consulting, advisory, or other compensatory fee from the Fund (except in the
capacity as a Board or committee member).

An "audit committee financial expert" is not an "expert" for any purpose,
including for purposes of Section 11 of the Securities Act of 1933, as a result
of being designated as an "audit committee financial expert." Further, the
designation of a person as an "audit committee financial expert" does not mean
that the person has any greater duties, obligations, or liability than those
imposed on the person without the "audit committee financial expert"
designation. Similarly, the designation of a person as an "audit committee
financial expert" does not affect the duties, obligations, or liability of any
other member of the audit committee or board of directors.

ITEM 4.         PRINCIPAL ACCOUNTANT FEES AND SERVICES.

                        Not currently applicable.

ITEM 5.         [RESERVED]

ITEM 6.         [RESERVED]

ITEM 7.         DISCLOSURE OF PROXY VOTING POLICIES AND PROCEDURES FOR
                CLOSED-END MANAGEMENT INVESTMENT COMPANIES.

ITEM 8.         [RESERVED]

ITEM 9.         CONTROLS AND PROCEDURES.


(a) The Chief Executive and Financial Officers concluded that the
Registrant's Disclosure Controls and Procedures are effective based on the
evaluation of the Disclosure Controls and Procedures as of a date within 90 days
of the filing date of this report.


(b) There have been no significant changes in the Registrant's internal controls
or in other factors that could significantly affect these controls subsequent to
the date of their evaluation and until the filing of this report, including any
corrective actions with regard to significant deficiencies and material
weaknesses.

ITEM 10.        EXHIBITS.

(a)(1)   Code of Ethics  pursuant to Item 2 of Form N-CSR is filed and  attached
         hereto as EX-99.CODE ETH.

(a)(2)   Certification  pursuant to Rule 30a-2(a) under the  Investment  Company
         Act of 1940 (17 CFR  270.30a-2(a))  is filed  and  attached  hereto  as
         Exhibit 99.CERT.

(b)      Certification  pursuant to Rule 30a-2(b) under the  Investment  Company
         Act of 1940 (17 CFR  270.30a-2(b))  is furnished and attached hereto as
         Exhibit 99.906CERT.


Form N-CSR Item F

                                   SIGNATURES

Pursuant to the requirements of the Securities Exchange Act of 1934 and the
Investment Company Act of 1940, the registrant has duly caused this report to be
signed on its behalf by the undersigned, thereunto duly authorized.

Registrant:                         Scudder S&P 500 Stock Fund


By:                                 /s/Richard T. Hale
                                    ---------------------------
                                    Richard T. Hale
                                    Chief Executive Officer

Date:                               October 22, 2003
                                    ---------------------------


Pursuant to the requirements of the Securities Exchange Act of 1934 and the
Investment Company Act of 1940, this report has been signed below by the
following persons on behalf of the registrant and in the capacities and on the
dates indicated.

Registrant:                          Scudder S&P 500 Stock Fund


By:                                 /s/Richard T. Hale
                                    ---------------------------
                                    Richard T. Hale
                                    Chief Executive Officer

Date:                               October 22, 2003
                                    ---------------------------


By:                                 /s/Charles A. Rizzo
                                    ---------------------------
                                    Charles A. Rizzo
                                    Chief Financial Officer

Date:                               October 22, 2003
                                    ---------------------------