Exhibit (a)(5)(L)

2011 Half Year Results - 27 July 2011 Strategy review Arch update Stefan Borgas Chief Executive Officer Leading supplier to the life science industry

slide 2 Forward - looking statements Forward - looking statements contained herein are qualified in their entirety as there are certain factors that could cause results to differ materially from those anticipated. Any statements contained herein that are not statements of historical fact (including statements containing the words “believes,” “plans,” “anticipates,” “expects,” “estimates” and similar expressions) should be considered to be forward - looking statements. Statements herein regarding the proposed transaction between Lonza and Arch Chemicals, the expected timetable for completing the transaction, the potential benefits of the transaction, and any other statements about management’s future expectations, beliefs, goals, plans or prospects also constitute forward - looking statements. Investors are cautioned that all forward - looking statements involve risks and uncertainty. There are a number of important factors that could cause actual results or events to differ materially from those indicated by such forward - looking statements, including: the timing and strength of new product offerings; pricing strategies of competitors; the company’s ability to continue to receive adequate products from its vendors on acceptable terms, or at all, and to continue to obtain sufficient financing to meet its liquidity needs; uncertainties as to the timing of the tender offer and merger; uncertainties as to how many shareholders will tender their stock in the offer; the possibility that various closing conditions for the transaction may not be satisfied or waived; and the effects of disruption from the transaction making it more difficult to maintain relationships with employees, customers, and other business partners; and changes in the political, social and regulatory framework in which the company operates, or in economic or technological trends or conditions, including currency fluctuations, inflation and consumer confidence, on a global, regional or national basis. Except as otherwise required by law, Lonza disclaims any intention or obligation to update any forward - looking statements as a result of developments occurring after this presentation was made. 2011 Half Year Results – 27 July 2011

slide 3 Agenda ▪ H1 results and outlook ▪ Financial highlights ▪ Business highlights ▪ Sectors ▪ Strategy update ▪ Arch acquisition update 2011 Half Year Results – 27 July 2011

slide 4 2011 Half Year Results – Financial highlights ▪ Revenues increased 4.8%, EBIT increased 4.6% in constant currencies ▪ Strong headwind from currencies resulted in EBIT impact of CHF - 44 mn ▪ Positive results driven by increased capacity utilization in biological custom manufacturing ▪ Sales of CHF 1193 mn ( - 8.3 %), up 4.8% in constant currencies ▪ EBITDA margins solid at 22.2%, 23.6% in constant currencies ▪ EBIT of CHF 136 mn, margin 11.4% or 13.3% in constant currencies – similar to H1 2010 ▪ Core EPS at CHF 2.09/share ( - 22% vs. H1 2010); +3.7% in constant currencies ▪ RONOA 8.4% ▪ Cash flow before change in NWC of CHF 213 mn ▪ CAPEX at CHF 117 mn (CHF 152 mn in H1 2010) 2011 Half Year Results – 27 July 2011

slide 5 2011 Half Year Results – Key financial figures * = in %; (1) CER = constant exchange rates 2011 Half Year Results – 27 July 2011 CHF mn 1st half 2010 1st half 2011 Change YoY * CER 1 Sales 1 301 1 193 (8.3) 4.8 EBITDA 309 265 (14.2) 3.9 EBITDA margin 23.8% 22.2% 23.6% EBIT 173 136 (21.4) 4.6 EBIT margin 13.3% 11.4% 13.3% Financing costs (21) (19) (9.5) Tax rate 14.0% 14.0% Profit for the period 135 97 (28.1) (2.2) EPS (CHF) basic 2.62 1.90 (27.5) (2.3) EPS (CHF) basic CORE 2.69 2.09 (22.3) 3.7 Cash flow before change in net working capital 255 213 (16.5) Change in net working capital 91 84 (8.7) Capital expenditures 152 117 (23.0) RONOA 9.7 8.4 Net debt 1 251 1 249 (0.2) Number of employees 8 220 8 306 1.0

slide 6 Lonza overall ▪ Underlying satisfactory demand growth in all markets ▪ Continuing and increasing strong translation and transaction effects (Visp site) due to strong CHF ▪ Countermeasures to offset strong Swiss franc launched at the Swiss sites (increased working hours) ▪ Raw material prices increased until mid of Q2 and remains at high levels ▪ Growth projects moving forward ▪ Regulatory approval processes remain stringent and unpredictable Lonza Life Science Ingredients ▪ Market demand high but margins are substantially impacted by FX, increasing raw material prices and competition induced price pressure in certain markets ▪ Microbial Control on target Lonza Custom Manufacturing ▪ Increased project pipeline and capacity utilization in both Chemical and Biological Manufacturing ▪ Strong performance in Development Services Lonza Bioscience ▪ Cell therapy experiencing a solid recovery with new clinical candidates moving forward ▪ Governmental funding remains constrained 2011 Half Year Results – Business highlights 2011 Half Year Results – 27 July 2011

slide 7 EBIT bridge H1 2010 – H1 2011 17 8 9 44 20 21 173 136 189 0 0 50 100 150 200 250 EBIT H1 2010 Re- Engineering Cost Benefits Underlying EBIT growth Singapore start-up, Japan, Libya Delayed approvals, Product mix Regular EBIT Higher Raw Material Costs FX EBIT H1 2011

slide 8 Lonza’s life - science platform Custom Manufacturing Nutrition Ingredients Microbial Control Performance Intermediates Therapeutic Cell Solutions Testing Solutions Research Solutions Chemical Manufacturing Biological Manufacturing Development Services Life Science Ingredients Bioscience 2011 Half Year Results – 27 July 2011

slide 9 Financial summary and highlights EBIT and margin progression Key figures ▪ Volume increase in all businesses except agrochemicals ▪ Microbial Control on track: picking up in Asia ▪ Lower margins due to higher raw material prices and unfavorable exchange rates - p rice increases passed on with expected time lag in most areas ▪ Growth projects under full execution CHF million 1st-half 2011 Change YoY * CER (1) Sales 519 (3.2%) 9.3% EBIT 41 (49.4%) (29.6%) Margin 7.9% 9.7% EBITDA 78 (33.9%) (19.5%) Margin 15.0% 7.9% 15.1% 14.0% 13.5% 13.6% 15.2% 14.6% 14.8% 0 25 50 75 100 H1/04H1/05H1/06H1/07H1/08H1/09H1/10H1/11 EBIT (CHF million) 5% 10% 15% 20% 25% 30% EBIT Margin EBIT (CHF mn) Margin Life Science Ingredients 2011 Half Year Results – 27 July 2011 * = in %; (1) CER = constant exchange rates

slide 10 Life Science Ingredients Nutrition Ingredients ▪ Vitamin B3 sales volumes on target despite a difficult market environment; margins continue to be impacted by increased raw materials and competition ▪ Metaldehyde volumes lower due to dry weather conditions; promising outlook based on a re - registration for European markets Performance Intermediates ▪ High volumes and solid margins in high performance materials driven by electronics, aerospace and construction industries ▪ Commodity margins under significant pressure due to high European acetic acid prices and strong CHF (Visp cost base) ▪ Weak volumes in agro custom manufacturing but strong order placement over next 12 months Microbial Control ▪ Sales increased by 9.5% (constant currencies) in western markets in H1 ▪ Strong sales performance in China with significant pick - up in Q2 ▪ Hygiene and wood above target ▪ Raw material prices remain volatile 2011 Half Year Results – 27 July 2011

slide 11 Number of projects Project pipeline (new products) Life Science Ingredients 0 20 40 60 80 100 120 140 End of 2007 End of 2008 End of 2009 End of 2010 Q1/2011 Q2/2011 Implementation Development Innovation/Discovery 2011 Half Year Results – 27 July 2011

slide 12 Lonza’s life - science platform Custom Manufacturing Nutrition Ingredients Microbial Control Performance Intermediates Therapeutic Cell Solutions Testing Solutions Research Solutions Chemical Manufacturing Biological Manufacturing Development Services Life Science Ingredients Bioscience 2011 Half Year Results – 27 July 2011

slide 13 ▪ Sales stable and increased EBIT margins ▪ Continued good pipeline increase in both Chemical and Biological Manufacturing ▪ Robust contract signing increases long - term capacity utilization ▪ Order placements from existing customers ensures stronger H2 ▪ Visibility continues to increase but volatility remains Custom Manufacturing EBIT and margin progression Key figures CHF million 1st half 2011 Change YoY * CER (1) Sales 568 (13.7%) (0.9%) EBIT 98 4.3% 34.0% Margin 17.3% 19.3% EBITDA 179 (1.1%) 18.8% Margin 31.5% 33.0% 2011 Half Year Results – 27 July 2011 0 25 50 75 100 125 150 H1/04H1/05H1/06H1/07H1/08H1/09H1/10H1/11 EBIT (CHF million) 0% 10% 20% EBIT Margin EBIT (CHF mn) Margin 9.0% 13.3% 16.3% 18.2% 18.4% 12.9% 14.3% 17.3% * = in %; (1) CER = constant exchange rates

slide 14 27 - Jul - 11 Chemical Manufacturing ▪ High capacity utilization, backed by robust demand for all technologies ▪ Reduced profitability due to product mix ▪ Pipeline increase especially in strategic new technologies ▪ Increasing demand for HAPI (highly active pharmaceutical ingredients) ▪ CHF 25 mn investment into new cytotoxic facility in Visp expands center of excellence for high potency manufacturing ▪ Nansha site with first FDA approval and start - up of cGMP kg laboratory ▪ Regulatory challenges and approval weakness in peptides addressed with exploration of innovative solutions and new pipeline gains Custom Manufacturing Business highlights (I) 2011 Half Year Results – 27 July 2011

slide 15 27 - Jul - 11 Biological Manufacturing ▪ High capacity utilization ▪ New Singapore facility complete and started - up on time ▪ Process qualification / validation for the first commercial product initiated ▪ Received Silver Operational Safety Award by Singapore’s Ministry of Manpower ▪ Strong pipeline development to balance ongoing approval volatility ▪ Approved GBP 16 mn (CHF 12 mn) investment in Slough (UK) facility expansion Development Services ▪ New GS System™ medium and feed platform reaches 10g/L resulting in higher yields, more reliable process, lower cost of goods ▪ Launch of LightPath™: efficient and focused material supply service for early stage novel biologics development ▪ R&D expansion in Singapore to meet increasing global demand for Development Services Custom Manufacturing Business highlights (II) 2011 Half Year Results – 27 July 2011

slide 16 Chemical Manufacturing – Pipeline and utilization Capacity utilization ( in %) Project pipeline ( Number of projects) Custom Manufacturing 0 50 100 150 200 250 300 350 End of 2004 End of 2005 End of 2006 End of 2007 End of 2008 End of 2009 End of 2010 Q1 2011Q2 2011 preclinical phase I phase II + III launched 2011 Half Year Results – 27 July 2011

slide 17 0 25 50 75 100 2004 2005 2006 2007 2008 2009 2010 Q1 2011 Q2 2011 Project pipeline ( Number of projects) Capacity utilization ( in %) Biological Manufacturing & Development Services : Pipeline and utilization Custom Manufacturing 2011 Half Year Results – 27 July 2011 0 50 100 150 200 250 300 350 End of 2004 End of 2005 End of 2006 End of 2007 End of 2008 End of 2009 End of 2010 Q1 2011 Q2 2011 preclinical phase I phase II + III launched

slide 18 Lonza’s life - science platform Custom Manufacturing Nutrition Ingredients Microbial Control Performance Intermediates Therapeutic Cell Solutions Testing Solutions Research Solutions Chemical Manufacturing Biological Manufacturing Development Services Life Science Ingredients Bioscience 2011 Half Year Results – 27 July 2011

slide 19 12.8% 15.0% 6.8% 14.6% 8.5% 0 5 10 15 20 25 H1/07H1/08H1/09H1/10H1/11 EBIT (CHF million) 0% 5% 10% 15% 20% 25% EBIT Margin EBIT (CHF mn) Margin Financial summary and highlights ▪ Double digit sales growth at constant currency (+13.2%) in almost all areas (except Research Solutions) ▪ EBIT decline mainly due to currency effects, lower capacity utilization in custom manufacturing and approval delays in Therapeutic Cell Solutions, and weak US academia spending ▪ New product launches: ▪ 4D Nucleofector™ launch complete with good market acceptance ▪ First products and services launched for stem cells EBIT and margin progression Key figures CHF mn 1st half 2011 Change YoY* CER (1) Sales 103 (2.8%) 13.2% EBIT 7 (22.2%) (22.2%) Margin 6.8% 5.8% EBITDA 14 (17.6%) (11.8) Margin 13.6% 12.5% Bioscience 2011 Half Year Results – 27 July 2011 * = in %; (1) CER = constant exchange rates

slide 20 Bioscience Research Solutions Strong sales growth in EU and Asia driven by cell assays, nucleofection and bulk agarose ▪ Lower than 2010 sales to academia due to reduced research spending in USA and EU Testing Solutions ▪ Endotoxin business grew in all regions ▪ Increased customer interest in MODA paperless quality - control solutions but long sales cycle due to budget constrains at customers ▪ MicroCompass TM launch delayed till Q1/2012 due to technical issues with hardware Therapeutic Cell Solutions ▪ Strong increase media revenue compared to H1/2010 ▪ Lower capacity utilization due to delays regulatory approvals ▪ Significantly increased interest in viral capabilities and viral fill & finish: capacity expansion approved Bioscience 2011 Half Year Results – 27 July 2011

slide 21 Bioscience project pipeline – New products and therapeutic clients New products (Research Solutions, Testing Solutions & Therapeutic Cell Solutions) Therapeutic clients (Therapeutic Cell Solutions) 0 50 100 150 200 250 Q2 2010Q3 2010Q4 2010Q1 2011Q2 2011 Number of projects Proof of Principle Early Development Late Development Transfer to Manufacturing Launch 0 20 40 60 80 100 120 140 160 180 Q2 2010Q3 2010Q4 2010Q1 2011Q2 2011 Number of projects Preclinical Phase I Phase II + III Commercial 2011 Half Year Results – 27 July 2011

slide 22 Summary ▪ Revenues and EBIT increased by 5% at constant currency ▪ Underlying business growth for 2011 on track ▪ New contracts signed ▪ Increased capacity utilization ▪ New technologies and development services performing well ▪ EBITDA margins resilient ▪ CHF - 44 mn currency impact (strong CHF, weak USD, EURO, GBP) ▪ Countermeasures launched at the Swiss sites ▪ Growth projects moving forward ▪ Strong cash flow and balance sheet 2011 Half Year Results – 27 July 2011

slide 23 ▪ On track to deliver continued underlying revenue and EBIT growth ▪ Currency impact of strong Swiss franc actively managed: ▪ Short term mitigation in Visp and Basel through immediate increase in working hours ▪ Mid term improvement project Visp will focus on productivity increase, introduction of new technologies and portfolio upgrades ▪ Long term growth potential based on core strength and sharpened strategy ▪ Life science strategy validated: outsourcing trend intact and new contracts signed ▪ Build a second global leading business by acquiring Arch and merging with Lonza Microbial Control Outlook 2011 Half Year Results – 27 July 2011

Lonza Group – Strategy review

slide 25 Strategy review ▪ Increasing volatility in pharma markets, especially CMO ▪ Need to capture new business opportunities in BRICS ▪ Opportunity to capture more of the value chain downstream ▪ Raw materials price inflation ▪ Currency impact of strong Swiss franc ▪ Address unsatisfactory business performance in Bioscience and peptides ▪ Initiated by Lonza Management Committee and the Board of Directors ▪ Intensive involvement of 150 Lonza leaders ▪ 9 months process ▪ Sharpen direction of Lonza Group on 5 year view ▪ Bottom - up business plans per business unit ▪ Defined growth projects Recognizing the challenges Approach Outcome

slide 26 Key findings ▪ Products and services that are complex, regulated and contact the human body: pharma, anti - microbial, nutrition, agriculture, personal care Key strengths and focus in innovation scale - up and market introduction Innovation partnerships and alliances will become more important From the active ingredient towards formulations, packaging and distribution Partnerships to become more important Lonza's life sciences focus confirmed Lonza remains innovation and technology driven Deepen the value chain towards consumer / patient Balance of business portfolio Further balance of CMO vs non CMO, pharma vs. other life science markets, currencies, regions Cross divisional synergies Lonza’s businesses benefit from each other via manufacturing, research, regulatory Peptides, Bioscience to start benefit from other businesses

slide 27 Moving closer to consumer / patient Pharma markets Life science markets (beyond Pharma) Research markets Continued strong technology development at 4 - 5% of sales (R&D expenses: CHF 140 mn CHF 200 mn) Expand into Asia 12% 18% Biogenerics and generics partnerships and organic growth Classical Lonza: active substances (chem & bio molecules) Continue to expand leadership in pharmaceutical custom manufacturing organic growth, capex driven Build global leader in Microbial Control focus on integration, synergy, innovation, growth Refocusing Lonza – Major projects

slide 28 Examples Microbial control ▪ Creating the global leader in microbial control with the proposed acquisition of Arch Chemicals ▪ Move up the value chain into B2C business ▪ Strong platform to develop innovative new products and solutions ▪ Strengthens and balances Lonza’s portfolio and allows further expansion into BRICS markets Biosimilars ▪ Development of affordable biosimilars in JV with Teva ▪ Move towards patients ▪ First product in clinical trials ▪ Expansion of selected products currently under evaluation Formulated products ▪ Extend the approach taken on biosimilars to small molecule generics ▪ Develop off - patent formulated drug products (with product registrations) for sale via partner (with focus on emerging markets) ▪ Lonza to be recognized as leading supplier of specialized products and the supplier of choice for local marketing specialists

slide 29 External Partnerships 2011 - 2016 Lonza Strategy: Building on our strengths In clearly defined life - science markets, we focus on customers’ R&D and manufacturing needs, as well as end - consumer needs. We offer technology solutions based on biological and chemical platforms and end - use applications within these platforms. We deliver Operational Excellence in innovation , leadership , operations and all processes which are valued by our customers. 1 2 3 Technology and Innovation Sustainable and profitable growth RONOA >15% Safety & Health Environment & Energy Consumers Patients Customers OUR VISION We strive to be the leading supplier using science and technology to improve quality of life OUR MISSION We work with passion, using advanced technologies to transform life science into new possibilities for our customers OUR VALUES Influential, Enterprising, Connected

Proposed acquisition of Arch fits our strategy perfectly 27 July 2011 Arch update

slide 31 Expands life science platform. Balances solidly growing but volatile pharma CMO business Arch strengthens and balances Lonza’s portfolio Strengthens and expands business in growth markets of China, India, Brazil and South Africa from USD 35 mn sales to now USD 249 mn sales Improves natural currency hedge cost : revenue (in %) 2010 2012 USD 40:50 47:50 EUR 18:20 19:20 Moves Lonza closer to the end consumer

slide 32 Arch balances the Lonza life science platform Lonza Bioscience (10%) Lonza Custom Manufacturing (50%) Lonza Life Science Ingredients – Nutrition & Performance Intermediates (26%) Lonza Microbial Control & Arch (43%) Lonza Custom Manufacturing (35%) Lonza Bioscience (5%) Lonza Life Science Ingredients Nutrition & Performance Intermediates (17%) Lonza Microbial Control (14%) Sales CHF 2680 mn Pro - forma sales CHF ~4116 mn Based on 2010 full year results Today Tomorrow

slide 33 Microbial Control – A life science business Arch is not a chemicals business ! CHEMICALS / CMO LIFE SCIENCES Capex heavy Capex light Low RONOA High RONOA Production cost and process driven Low level of R&D and innovation Regulation expertise limited Application and customer integration driven R&D and innovation is major driver Regulation expertise a critical success factor • Arch • Arch • Arch • Arch • Arch

slide 34 scale Increasingly regulated environment • Combined business has over 15% global market share Customer demands create inter - regional cross selling opportunities • Combined business has strong position in 5 growth market segment Leverage proven technologies across the globe • Combined business has 19 registered actives Emerging markets represent attractive growth opportunities • Combined business has access to 4 of 5 BRICS markets Get closer to the end consumer with broader offerings and scale • Arch brings direct access to retail in US, EU, South Africa, Brazil Combined global innovation provides a key competitive advantage • Combined business allows above average increase in R&D efforts Combined business meets all critical success factors

slide 35 Attractive value creation from year one ▪ Expected to be EPS accretive from year one (>CHF 0.4/share) ▪ Expected to be EVA positive from year two ▪ Also increases Lonza’s FCF generation and improves RONOA by > 150 bp in year 2 ▪ At least USD 50 mn targeted in year two ▪ One - time integration cost of USD 85 mn over two years ▪ Cross selling of larger product portfolio ▪ Extended market and regional reach ▪ Additional potential in the future driven by increased R&D efforts Meets Lonza’s acquisition criteria Substantial cost synergy from administrative functions Increased sales of at least USD 40 mn by year three
slide 36 Transaction update ▪ Stakeholder feedback very positive: employees, customers, shareholders ▪ Tender offer commenced 15 July 2011 ▪ Antitrust regulatory approval submissions anticipated in US, Germany and France ▪ Bridge finance committed, mandate letter executed ▪ Completion expected later in 2011
slide 37 ▪ Important Lonza Group dates ▪ 27 October 2011 Third - quarter 2011 business update ▪ 25 January 2012 Full Year Results 2011 ▪ 03 April 2012 Annual General Meeting ▪ 25 April 2012 First - quarter 2012 business update • Contacts Dominik Werner Dirk Oehlers Corporate Communications Investor Relations T +41 61 316 8798 T +41 61 316 8540 F +41 61 316 9798 F +41 61 316 9540 dominik.werner@lonza.com dirk.oehlers@lonza.com Calendar of events and contacts 2011 Half Year Results – 27 July 2011
slide 38 Additional information This communication is for informational purposes only and is not a recommendation, an offer to purchase or a solicitation of an offer to sell shares of Arch Chemicals. LG Acquisition Corp., Lonza’s indirect wholly owned subsidiary, has filed a tender offer statement on Schedule TO with the U.S. Securities and Exchange Commission, and Arch Chemicals has filed a solicitation/recommendation statement on Schedule 14D - 9 with respect to the tender offer. Investors and Arch Chemicals shareholders are strongly advised to carefully read the tender offer statement (including the offer to purchase, the letter of transmittal and the related tender offer documents) and the related solicitation/recommendation statement, as well as any amendments thereto and other relevant documents filed with the SEC when they become available, because they will contain important information. Investors and Arch Chemicals shareholders may obtain a free copy of the tender offer statement, the solicitation/recommendation statement and other documents (when available) filed with the SEC at the SEC’s website at www.sec.gov. The tender offer statement and other documents that LG Acquisition Corp. files with the SEC may also be obtained free of charge by directing a request by mail to MacKenzie Partners, Inc. at 105 Madison Avenue, New York, New York 10016, by calling toll - free at +1 800 322 2885 or by email to tenderoffer@mackenziepartners.com.
slide 39 2011 Half Year Results - 27 July 2011 Strategy review Arch update Stefan Borgas Chief Executive Officer Leading supplier to the life science industry
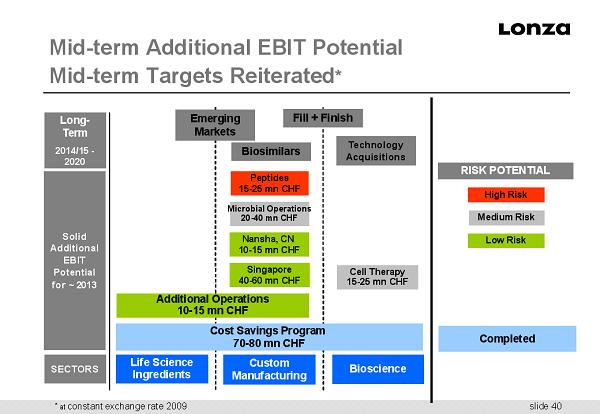
slide 40 Mid - term Additional EBIT Potential Mid - term Targets Reiterated * Solid Additional EBIT Potential for ~ 2013 Custom Manufacturing Life Science Ingredients Bioscience SECTORS Additional Operations 10 - 15 mn CHF Nansha, CN 10 - 15 mn CHF Peptides 15 - 25 mn CHF Microbial Operations 20 - 40 mn CHF Cell Therapy 15 - 25 mn CHF Cost Savings Program 70 - 80 mn CHF Singapore 40 - 60 mn CHF Long - Term 2014/15 - 2020 Fill + Finish Technology Acquisitions Biosimilars Emerging Markets RISK POTENTIAL Completed Medium Risk Low Risk High Risk * at constant exchange rate 2009


