0000107263us-gaap:FairValueInputsLevel3Memberus-gaap:FairValueMeasurementsRecurringMember2023-12-31
UNITED STATES SECURITIES AND EXCHANGE COMMISSION
Washington, D.C. 20549
Form 10-K
(Mark One)
| | | | | | | | |
| ☑ | ANNUAL REPORT PURSUANT TO SECTION 13 OR 15(d) OF THE SECURITIES EXCHANGE ACT OF 1934 |
| For the fiscal year ended | December 31, 2024 |
| OR |
| ☐ | TRANSITION REPORT PURSUANT TO SECTION 13 OR 15(d) OF THE SECURITIES EXCHANGE ACT OF 1934 |
| For the transition period from to |
The Williams Companies, Inc.
Transcontinental Gas Pipe Line Company, LLC
Northwest Pipeline LLC
(Exact Name of Registrant as Specified in Its Charter)
| | | | | | | | | | | |
| Commission file number: | State or Other Jurisdiction of Incorporation or Organization: | IRS Employer Identification No.: |
| The Williams Companies, Inc. | 1-4174 | Delaware | 73-0569878 |
| Transcontinental Gas Pipe Line Company, LLC | 1-7584 | Delaware | 74-1079400 |
| Northwest Pipeline LLC | 1-7414 | Delaware | 26-1157701 |
| | | | | | | | | | | |
| Address of Principal Executive Offices: | Zip Code: | Registrant’s Telephone Number, Including Area Code: |
| The Williams Companies, Inc. | One Williams Center, Tulsa, Oklahoma | 74172 | 800-945-5426 (800-WILLIAMS) |
| Transcontinental Gas Pipe Line Company, LLC | 2800 Post Oak Boulevard, Houston, Texas | 77056 | 713-215-2000 |
| Northwest Pipeline LLC | One Williams Center, Tulsa, Oklahoma | 74172 | 800-945-5426 |
Securities registered pursuant to Section 12(b) of the Act:
| | | | | | | | | | | |
| Title of Each Class | Trading Symbol(s) | Name of Each Exchange on Which Registered |
| The Williams Companies, Inc. | Common Stock, $1.00 par value | WMB | New York Stock Exchange |
| Transcontinental Gas Pipe Line Company, LLC | None | None | None |
| Northwest Pipeline LLC | None | None | None |
Securities registered pursuant to Section 12(g) of the Act:
None
Indicate by check mark if the registrant is a well-known seasoned issuer, as defined in Rule 405 of the Securities Act.
| | | | | | | | | | | | | | |
| The Williams Companies, Inc. | Yes | ☑ | No | ☐ |
| Transcontinental Gas Pipe Line Company, LLC | Yes | ☐ | No | ☑ |
| Northwest Pipeline LLC | Yes | ☐ | No | ☑ |
Indicate by check mark if the registrant is not required to file reports pursuant to Section 13 or Section 15(d) of the Act.
| | | | | | | | | | | | | | |
| The Williams Companies, Inc. | Yes | ☐ | No | ☑ |
| Transcontinental Gas Pipe Line Company, LLC | Yes | ☐ | No | ☑ |
| Northwest Pipeline LLC | Yes | ☐ | No | ☑ |
Indicate by check mark whether the registrant: (1) has filed all reports required to be filed by Section 13 or 15(d) of the Securities Exchange Act of 1934 during the preceding 12 months (or for such shorter period that the registrant was required to file such reports), and (2) has been subject to such filing requirements for the past 90 days.
| | | | | | | | | | | | | | |
| The Williams Companies, Inc. | Yes | ☑ | No | ☐ |
| Transcontinental Gas Pipe Line Company, LLC | Yes | ☑ | No | ☐ |
| Northwest Pipeline LLC | Yes | ☑ | No | ☐ |
Indicate by check mark whether the registrant has submitted electronically every Interactive Data File required to be submitted pursuant to Rule 405 of Regulation S-T (§232.405 of this chapter) during the preceding 12 months (or for such shorter period that the registrant was required to submit such files).
| | | | | | | | | | | | | | |
| The Williams Companies, Inc. | Yes | ☑ | No | ☐ |
| Transcontinental Gas Pipe Line Company, LLC | Yes | ☑ | No | ☐ |
| Northwest Pipeline LLC | Yes | ☑ | No | ☐ |
Indicate by check mark whether the registrant is a large accelerated filer, an accelerated filer, a non-accelerated filer, a smaller reporting company, or an emerging growth company. See the definitions of “large accelerated filer,” “accelerated filer,” “smaller reporting company,” and “emerging growth company” in Rule 12b-2 of the Exchange Act.
| | | | | | | | | | | | | | | | | | | | | | | | | | | | | | | | |
| The Williams Companies, Inc. | Large accelerated filer | ☑ | Accelerated filer | ☐ | Non-accelerated filer | ☐ | Smaller reporting company | ☐ | Emerging growth company | ☐ |
| Transcontinental Gas Pipe Line Company, LLC | Large accelerated filer | ☐ | Accelerated filer | ☐ | Non-accelerated filer | ☑ | Smaller reporting company | ☐ | Emerging growth company | ☐ |
| Northwest Pipeline LLC | Large accelerated filer | ☐ | Accelerated filer | ☐ | Non-accelerated filer | ☑ | Smaller reporting company | ☐ | Emerging growth company | ☐ |
If an emerging growth company, indicate by check mark if the registrant has elected not to use the extended transition period for complying with any new or revised financial accounting standards provided pursuant to Section 13(a) of the Exchange Act.
| | | | | |
| The Williams Companies, Inc. | ☐ |
| Transcontinental Gas Pipe Line Company, LLC | ☐ |
| Northwest Pipeline LLC | ☐ |
Indicate by check mark whether the registrant has filed a report on and attestation to its management’s assessment of the effectiveness of its internal control over financial reporting under Section 404(b) of the Sarbanes-Oxley Act (15 U.S.C. 7262(b)) by the registered public accounting firm that prepared or issued its audit report.
| | | | | |
| The Williams Companies, Inc. | ☑ |
| Transcontinental Gas Pipe Line Company, LLC | ☐ |
| Northwest Pipeline LLC | ☐ |
If securities are registered pursuant to Section 12(b) of the Act, indicate by check mark whether the financial statements of the registrant included in the filing reflect the correction of an error to previously issued financial statements.
| | | | | |
| The Williams Companies, Inc. | ☑ |
| Transcontinental Gas Pipe Line Company, LLC | ☐ |
| Northwest Pipeline LLC | ☐ |
Indicate by check mark whether any of those error corrections are restatements that required a recovery analysis of incentive-based compensation received by any of the registrant’s executive officers during the relevant recovery period pursuant to §240.10D-1(b).
| | | | | |
| The Williams Companies, Inc. | ☐ |
| Transcontinental Gas Pipe Line Company, LLC | ☐ |
| Northwest Pipeline LLC | ☐ |
Indicate by check mark whether the registrant is a shell company (as defined in Rule 12b-2 of the Act).
| | | | | | | | | | | | | | |
| The Williams Companies, Inc. | Yes | ☐ | No | ☑ |
| Transcontinental Gas Pipe Line Company, LLC | Yes | ☐ | No | ☑ |
| Northwest Pipeline LLC | Yes | ☐ | No | ☑ |
The aggregate market value of the voting and nonvoting common equity held by nonaffiliates computed by reference to the price at which the common equity was last sold as of the last business day of the registrant’s most recently completed second quarter was approximately:
| | | | | |
| The Williams Companies, Inc. | $49,974,668,630 |
| Transcontinental Gas Pipe Line Company, LLC | None |
| Northwest Pipeline LLC | None |
The number of shares outstanding of the registrant’s common stock outstanding at February 20, 2025 was:
| | | | | |
| The Williams Companies, Inc. | 1,219,369,295 |
| Transcontinental Gas Pipe Line Company, LLC | None |
| Northwest Pipeline LLC | None |
DOCUMENTS INCORPORATED BY REFERENCE
| | | | | |
| The Williams Companies, Inc. | Portions of the Williams’ Definitive Proxy Statement for the Williams’ Annual Meeting of Stockholders to be held on April 29, 2025, are incorporated into Part III, as specifically set forth in Part III. |
| Transcontinental Gas Pipe Line Company, LLC | None |
| Northwest Pipeline LLC | None |
Both Transcontinental Gas Pipe Line Company, LLC and Northwest Pipeline LLC meet the conditions set forth in General Instructions I(1)(a) and (b) of Form 10-K and is therefore filing this Form 10-K with the reduced disclosure format specified in General Instructions I(2)(b), (c), and (d) of Form 10-K.
This combined Form 10-K is separately filed by The Williams Companies, Inc., Transcontinental Gas Pipe Line Company, LLC, and Northwest Pipeline LLC. Information contained herein relating to any individual registrant is filed by such registrant on its own behalf. Each registrant makes no representation as to information relating to the other registrants.
FORM 10-K
TABLE OF CONTENTS
| | | | | | | | |
| | | Page |
| PART I |
| | |
| Item 1. | | |
| | |
| | |
| | |
| | |
| | |
| | |
| | |
| | |
| | |
| | |
| | |
| | |
| | |
| | |
| | |
| Item 1A. | | |
| Item 1B. | | |
| Item 1C. | | |
| Item 2. | | |
| Item 3. | | |
| Item 4. | | |
| | |
| | |
| PART II | |
| | |
| Item 5. | | |
| | |
| Item 7. | | |
| Item 7A. | | |
| Item 8. | | |
| | |
| | |
| Item 9. | | |
| Item 9A. | | |
| Item 9B. | | |
| Item 9C. | | |
| | |
| PART III | |
| | |
| Item 10. | | |
| Item 11. | | |
| Item 12. | | |
| Item 13. | | |
| Item 14. | | |
| | |
| PART IV | |
| | |
| Item 15. | | |
| Item 16. | | |
DEFINITIONS
The following is a listing of certain abbreviations, acronyms, and other industry terminology that may be used throughout this Form 10-K.
Measurements:
Barrel or Bbl: One barrel of petroleum products that equals 42 U.S. gallons
Mbbls/d: One thousand barrels per day
Bcf : One billion cubic feet of natural gas
Bcf/d: One billion cubic feet of natural gas per day
MMcf/d: One million cubic feet of natural gas per day
British Thermal Unit (Btu): A unit of energy needed to raise the temperature of one pound of water by one degree Fahrenheit
MMBtu: One million British thermal units
Dekatherms (Dth): A unit of energy equal to one million British thermal units
Mdth/d: One thousand dekatherms per day
MMdth: One million dekatherms or approximately one trillion British thermal units
MMdth/d: One million dekatherms per day
Government and Regulatory:
EPA: Environmental Protection Agency
Exchange Act, the: Securities and Exchange Act of 1934, as amended
FERC: Federal Energy Regulatory Commission
IRS: Internal Revenue Service
NGA: Natural Gas Act of 1938, as amended
SEC: Securities and Exchange Commission
Securities Act, the: Securities Act of 1933, as amended
Other:
Note: References to numerical notes refer to the Combined Notes to Financial Statements.
EBITDA: Earnings before interest, taxes, depreciation, and amortization
Fractionation: The process by which a mixed stream of natural gas liquids is separated into constituent products, such as ethane, propane, and butane
GAAP: U.S. generally accepted accounting principles
LNG: Liquefied natural gas; natural gas which has been liquefied at cryogenic temperatures
MVC: Minimum volume commitments
NGLs: Natural gas liquids; natural gas liquids result from natural gas processing and crude oil refining and are used as petrochemical feedstocks, heating fuels, and gasoline additives, among other applications.
Equity NGL margins: NGL revenues less Btu replacement cost, plant fuel, transportation, and fractionation
Registrants: The Williams Companies, Inc. (Williams), and Williams’ wholly owned subsidiaries Transcontinental Gas Pipe Line Company, LLC (Transco) and Northwest Pipeline LLC (NWP) are each individually referred to as a Registrant and collectively as the Registrants.
Appalachia Midstream Investments: Williams’ equity-method investments with an approximate average 66 percent interest in multiple gas gathering systems in the Marcellus Shale region
Crowheart Acquisition: On November 1, 2024, Williams closed on the acquisition of Crowheart Energy, LLC, resulting in more than a 90 percent ownership interest in certain crude oil and natural gas properties in the Wamsutter basin in Wyoming. Prior to this acquisition, Williams held a 75 percent undivided interest in each well’s working interest.
Discovery Acquisition: On August 1, 2024, Williams closed on the acquisition of the remaining 40 percent interest in Discovery Producer Services, LLC (Discovery) which operates a natural gas gathering and transportation system in the Gulf of America and processing and fractionation facilities in Louisiana, along with certain other assets.
DJ Basin Acquisitions: On November 30, 2023, Williams closed on the acquisition of 100 percent of Cureton Front Range, LLC (Cureton) (Cureton Acquisition) and also closed on the acquisition of the remaining 50 percent interest in Rocky Mountain Midstream Holdings LLC (RMM) (RMM Acquisition), both of which operate midstream assets in the Denver-Julesberg (DJ) Basin.
Gulf Coast Storage Acquisition: On January 3, 2024, Williams closed on the acquisition of 100 percent of both Hartree Cardinal Gas, LLC and Hartree Natural Gas Storage, LLC (collectively, “Hartree”), which own natural gas storage facilities and pipelines in Louisiana and Mississippi.
MountainWest Acquisition: On February 14, 2023, Williams closed on the acquisition of 100 percent of MountainWest Pipelines Holding Company (MountainWest), which includes FERC-regulated interstate natural gas pipeline systems and natural gas storage capacity.
Trace Acquisition: On April 29, 2022, Williams closed on the acquisition of 100 percent of Gemini Arklatex, LLC through which the Haynesville Shale region gas gathering and related assets were acquired.
NorTex Asset Purchase: On August 31, 2022, Williams purchased a group of assets in north Texas, primarily natural gas storage facilities and pipelines, from NorTex Midstream Holdings, LLC.
PART I
Item 1. Business
This report includes information for multiple registrants, specifically The Williams Companies, Inc. (Williams), as well as Transcontinental Gas Pipe Line Company, LLC (Transco) and Northwest Pipeline LLC (NWP) both of which are wholly owned subsidiaries of Williams (collectively, the Registrants). References to subsidiaries by name, including equity-method investees, Transco, and NWP, refer exclusively to those businesses and operations.
General
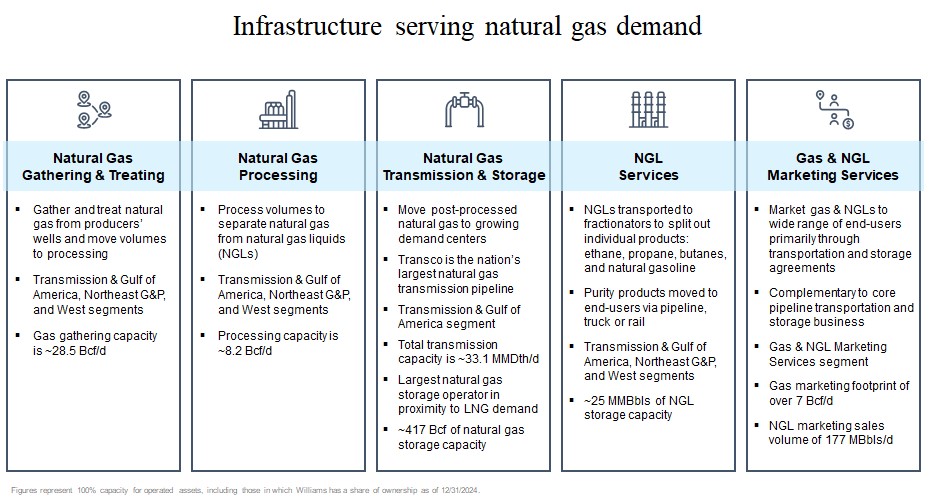
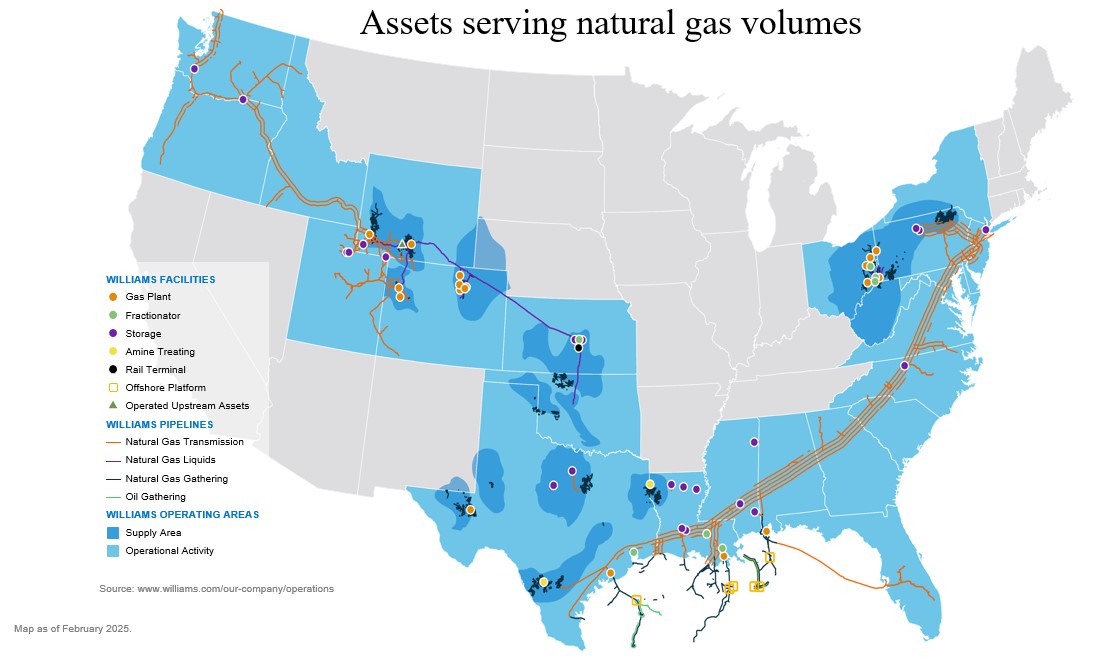
Williams is an energy company committed to being the leader in providing infrastructure that safely delivers natural gas products to reliably fuel the clean energy economy. Williams has operations in 12 supply areas that provide natural gas gathering, processing, and transmission services; NGLs fractionation, transportation, and storage services; and marketing services to approximately 800 customers. Williams owns an interest in and operates over 33,000 miles of pipelines in 24 states, 34 natural gas processing facilities, 9 NGL fractionation facilities, approximately 25 million barrels of NGL storage capacity, and 417 Bcf of natural gas storage capacity, and delivers natural gas that is used every day for clean-power generation, heating, and industrial use.
Williams was founded in 1908, originally incorporated under the laws of the state of Nevada in 1949 and reincorporated under the laws of the state of Delaware in 1987. Its common stock trades on the New York Stock Exchange under the symbol “WMB.” Its operations are located in the United States. Williams’ headquarters are located in Tulsa, Oklahoma, with other major offices in Houston, Texas; Pittsburgh, Pennsylvania; and Salt Lake City, Utah.
Transco owns and operates an approximately 9,700-mile natural gas pipeline system extending from Texas, Louisiana, Mississippi and the Gulf of America through Alabama, Georgia, South Carolina, North Carolina, Virginia, Maryland, Delaware, Pennsylvania and New Jersey to the New York City metropolitan area. The system serves customers in Texas and the 12 southeast and Atlantic seaboard states mentioned above, including major metropolitan areas in Georgia, Washington D.C., Maryland, North Carolina, New York, New Jersey, and Pennsylvania. Transco’s principal business is the interstate transportation of natural gas, which is regulated by the FERC.
NWP owns and operates an approximately 3,900-mile natural gas pipeline system, extending from the San Juan basin in northwestern New Mexico and southwestern Colorado through Colorado, Utah, Wyoming, Idaho, Oregon, and Washington to a point on the Canadian border near Sumas, Washington. The system serves customers in Washington, Oregon, Idaho, Wyoming, Nevada, Utah, Colorado, New Mexico, California, and Arizona, either directly or indirectly through interconnections with other pipelines. NWP’s principal business is the interstate transportation of natural gas, which is regulated by FERC.
Service Assets, Customers, and Contracts
Key variables for Williams’ businesses will continue to be:
•Obstacles to Williams’ expansion efforts, including delays or denials of necessary permits and opposition to hydrocarbon-based energy development;
•Producer drilling activities impacting natural gas supplies supporting Williams’ gathering and processing volumes;
•Retaining and attracting customers by continuing to provide reliable services;
•Revenue growth associated with additional infrastructure either completed or currently under construction;
•Prices impacting Williams’ commodity-based activities;
•Disciplined growth in Williams’ service areas.
Interstate Natural Gas Pipeline Assets
Williams’ interstate natural gas pipelines, which are presented in the Transmission & Gulf of America segment as described under the heading “Business Segments,” are subject to regulation by the FERC and as such, rates and charges for the transportation of natural gas in interstate commerce are subject to regulation. The rates are established primarily through the FERC’s ratemaking process, but rates may also be negotiated with customers pursuant to the terms of tariffs and FERC policy.
Williams’ interstate natural gas pipelines transport and store natural gas for a broad mix of customers, including local natural gas distribution companies, public utilities, municipalities, direct industrial users, electric power generators, and natural gas marketers and producers. Most of Williams’ interstate natural gas transmission businesses are fully contracted under long-term firm reservation contracts with high credit quality customers. These contracts have various expiration dates and account for the major portion of these regulated businesses. Additionally, Williams offers storage services and interruptible transportation services under shorter-term agreements. The top ten customers of the interstate natural gas pipelines in 2024 accounted for approximately 45 percent of Williams’ regulated interstate natural gas transportation and storage revenues.
Transco’s three largest customers in 2024 accounted for approximately 20 percent of Transco’s total operating revenues. Transco’s firm transportation agreements are generally long-term agreements with various expiration dates and account for the major portion of its business.
During 2024, NWP’s three largest customers were Puget Sound Energy, Inc., Cascade Natural Gas Corporation, and Northwest Natural Gas Company, which accounted for approximately 31 percent, 10 percent, and 11 percent, respectively, of NWP total operating revenues for the year ended December 31, 2024. No other customer accounted for more than 10 percent of NWP total operating revenues during that period.
Natural Gas Gathering and Processing Assets
Williams’ gathering, processing, and treating operations are presented within the Transmission & Gulf of America, Northeast G&P, and West reporting segments as described under the heading “Business Segments.”
Williams’ gathering systems receive natural gas from producers’ crude oil and natural gas wells and gather these volumes to gas processing, treating, or redelivery facilities. Typically, natural gas, in its raw form, is not acceptable for transportation in major interstate natural gas pipelines or for commercial use as a fuel. Williams’ treating facilities remove water vapor, carbon dioxide, and other contaminants, and collect condensate. Williams is generally paid a fee based on the volume of natural gas gathered and/or treated, generally measured in the Btu heating value.
In addition, natural gas contains various amounts of NGLs, which generally have a higher value when separated from the natural gas stream. Williams’ processing plants extract the NGLs, which include ethane, primarily used in the petrochemical industry; propane, used for heating, fuel, and also in the petrochemical industry; and, normal butane, isobutane, and natural gasoline, primarily used by the refining industry.
Williams’ gas processing services generate revenues primarily from the following types of contracts:
•Fee-based: A cash fee is received based on the volume of natural gas processed, generally measured in the Btu heating value. A portion of Williams’ fee-based processing revenue includes a share of the margins on the NGLs produced. For the year ended December 31, 2024, approximately 95 percent of NGL production volumes were under fee-based contracts.
•Noncash commodity-based: Gas is also processed under two types of commodity-based contracts, keep-whole and percent-of-liquids, where consideration for services is received in the form of NGLs. For a keep-whole arrangement Williams replaces the Btu content of the retained NGLs with natural gas purchases, also known as shrink replacement gas. For a percent-of-liquids arrangement, Williams delivers an agreed-upon percentage of the extracted NGLs and retains the remainder. Retained NGLs, referred to as equity NGL production, are then sold. Per-unit NGL margins are calculated based on sales of these equity volumes at the processing plants. For the year ended December 31, 2024, approximately 5 percent of NGL production volumes were under noncash commodity-based contracts.
Generally, Williams’ gathering and processing agreements are long-term agreements, with terms ranging from month-to-month to the life of the producing lease. Certain contracts include cost-of-service mechanisms that are designed to support a return on invested capital and allow gathering rates to be adjusted, subject to specified caps in certain cases, to account for variability in volume, capital expenditures, commodity price fluctuations, compression, and other expenses. Williams also has certain gas gathering and processing agreements with MVC, whereby the customer is obligated to pay a contractually determined fee based on any shortfall between the actual gathered and processed volumes and the MVC for a stated period.
Demand for gas gathering and processing services is dependent on producers’ drilling activities, which is impacted by the strength of the economy, commodity prices, and the resulting demand for natural gas by manufacturing and industrial companies and consumers. Williams’ gathering, processing, and treating businesses do not have direct exposure to crude oil prices. Williams’ on-shore natural gas gathering and processing businesses are substantially focused on gas-directed drilling basins rather than crude oil, with a broad diversity of basins and customers served. Declines in crude oil drilling would be expected to result in less associated natural gas production, which could drive more demand for natural gas produced from gas-directed basins served.
During 2024, Williams’ facilities gathered and processed gas for approximately 248 customers. The top ten customers accounted for approximately 59 percent of gathering and processing fee revenues and NGL margins from noncash commodity-based agreements. Williams believes counterparty credit concerns in its gathering and processing businesses are significantly mitigated by the physical nature of Williams’ services, where gathering occurs at the wellhead and therefore is critical to a producer’s ability to move product to market.
Gas and NGL Marketing
Williams’ natural gas and NGL marketing services are presented primarily within its Gas & NGL Marketing Services segment. Williams markets natural gas and NGL products to a wide range of users in the energy and petrochemical industries. In 2024, the three largest natural gas marketing customers accounted for approximately 10 percent of Williams’ gross natural gas marketing sales, and the three largest NGL marketing customers accounted for approximately 37 percent of Williams’ NGL marketing sales.
Williams’ gas marketing business markets natural gas and provides natural gas asset management and wholesale marketing, trading, storage, and transportation for a diverse set of natural gas and electric utilities, municipalities, power generators, and producers, including for Williams’ upstream properties. Additionally, Williams’ gas marketing business moves and optimizes natural gas to markets through transportation and storage agreements on Williams’ own strategically positioned assets. Williams’ gas and NGL marketing services provide customers with access to diverse sources of supply and to various natural gas demand markets, including the southeastern and Gulf Coast regions which are the fastest growing natural gas demand regions in the United States.
Williams purchases natural gas for storage when the current market price paid to buy and transport natural gas plus the cost to store and finance the natural gas is less than an estimated, forward market price that can be received in the future, resulting in positive net product sales. Commodity-based exchange-traded futures contracts and over-the-counter (OTC) contracts are used to sell natural gas at that future price to substantially protect the natural gas revenues that will ultimately be realized when the stored natural gas is sold. Additionally, Williams enters into transactions to secure transportation capacity between delivery points in order to serve Williams’ customers and various markets. Commodity-based exchange-traded futures contracts and OTC contracts are used to capture the price differential or spread between the locations served by the capacity in order to substantially protect the natural gas revenues that will ultimately be realized when the physical flow of natural gas between receipt and delivery points occurs.
Monthly demand charges incurred for the contracted storage and transportation capacity and payments associated with asset management agreements are substantially indirectly reimbursed by customers. As Williams is acting as an agent, natural gas marketing revenues are presented net of the related costs of those activities. In addition, all of Williams’ natural gas marketing derivative activities qualify as held for trading purposes, which requires net presentation in Williams Consolidated Statement of Income.
Williams’ NGL marketing business transports and markets equity NGLs from the production at Williams’ processing plants, NGLs from the production at Williams’ upstream properties, and also NGLs on behalf of third-party NGL producers, including some of our fee-based processing customers, as well as the NGL volumes owned by certain of Williams’ equity-method investments. The NGL marketing business bears the risk of price changes in these NGL volumes while they are being transported to final sales delivery points. In order to meet sales contract obligations, Williams may purchase products in the spot market for resale.
Williams is exposed to commodity price risk. To manage this volatility, various contracts are used in the marketing and trading activities that generally meet the definition of derivatives. Williams enters into commodity-related derivatives to hedge exposures to natural gas and NGLs and retain exposure to price changes that can, in a volatile energy market, be material and can adversely affect results of operations.
Williams experiences significant earnings volatility from the fair value accounting required for the derivatives used to hedge a portion of the economic value of the underlying transportation and storage portfolio as well as upstream related production. However, the unrealized fair value measurement gains and losses are generally offset by valuation changes in the economic value of the underlying production or transportation and storage contracts, which is not recognized until the underlying transaction occurs.
Crude Oil Transportation and Production Handling Assets
Williams’ crude oil transportation operations, which are primarily presented in the Transmission & Gulf of America segment as described under the heading “Business Segments,” earn revenues primarily from a combination of fixed-monthly fees, contractual fixed or variable fees applied to production volumes, and contributions in aid of
construction (CIAC) arrangements. Generally, fixed-monthly fees associated with production handling and export revenues are recognized on a units-of-production basis utilizing either contractually determined maximum daily quantities or expected remaining production. CIAC arrangements are recognized on a units of production basis, utilizing expected remaining production. Williams’ crude oil transportation business is supported mostly by major oil producers with long-cycle perspectives.
Standalone, Market-Based Rate Natural Gas Storage Assets
Williams’ standalone, market-based rate natural gas storage assets are presented in the Transmission & Gulf of America segment as described under the heading “Business Segments” and include Williams’ North Texas Assets (NorTex) acquired in August 2022 and Williams’ Gulf Coast storage assets acquired in January 2024. These natural gas storage assets provide natural gas storage services in interstate commerce under the jurisdiction of the FERC pursuant to the Natural Gas Act or Section 311 of the Natural Gas Policy Act. Williams is authorized to charge and collect market-based rates for all of the services that these natural gas storage assets provide.
Williams stores natural gas for a broad mix of customers, including local natural gas distribution companies, public utilities, municipalities, direct industrial users, electric power generators, and natural gas marketers and producers. Most of these natural gas storage businesses are fully contracted under long-term firm reservation contracts with high credit quality customers. The contracts have various expiration dates and account for the major portion of the entities’ businesses. The three largest customers of this business in 2024 accounted for approximately 21 percent of its total operating revenues.
Business Segments
Consistent with the manner in which Williams’ chief operating decision maker evaluates performance and allocates resources, Williams’ operations are conducted, managed, and presented in Part I of this Annual Report within the following reportable segments: Transmission & Gulf of America, Northeast G&P, West, and Gas & NGL Marketing Services. All remaining business activities, including upstream operations, certain new energy ventures, and corporate activities, are included in Other.
Williams’ reportable segments are comprised of the following business activities:
•Transmission & Gulf of America is comprised of the Transco, NWP, and MountainWest interstate natural gas pipelines, and their related natural gas storage facilities, as well as natural gas gathering and processing and crude oil production handling and transportation assets in the Gulf Coast region, including Discovery, a former 60 percent equity-method investment in which Williams acquired the remaining ownership interest in August 2024, a 51 percent interest in Gulfstar One LLC (Gulfstar One), and a 50 percent equity-method investment in Gulfstream Natural Gas System, L.L.C. (Gulfstream). Transmission & Gulf of America also includes natural gas storage facilities and pipelines providing services in north Texas, Louisiana, and Mississippi.
•Northeast G&P is comprised of midstream gathering, processing, and fractionation businesses in the Marcellus Shale region primarily in Pennsylvania and New York, and the Utica Shale region of eastern Ohio, as well as a 65 percent interest in Ohio Valley Midstream LLC (Northeast JV) which operates in West Virginia, Ohio, and Pennsylvania, a 66 percent interest in Cardinal Gas Services, L.L.C. (Cardinal) which operates in Ohio, a 69 percent equity-method investment in Laurel Mountain Midstream, LLC (Laurel Mountain), a 50 percent equity-method investment in Blue Racer Midstream LLC (Blue Racer), and Appalachia Midstream Investments.
•West is comprised of gas gathering, processing, and treating operations in the Rocky Mountain region of Colorado and Wyoming, the Barnett Shale region of north-central Texas, the Eagle Ford Shale region of south Texas, the Haynesville Shale region of east Texas and northwest Louisiana, the Mid-Continent region which includes the Anadarko and Permian basins, and the DJ Basin of Colorado which includes RMM, a former 50 percent equity-method investment in which Williams acquired the remaining ownership interest in November 2023. This segment also includes NGL storage facilities, an undivided 50 percent interest in
an NGL fractionator near Conway, Kansas, and a 50 percent equity-method investment in Overland Pass Pipeline Company LLC (OPPL).
•Gas & NGL Marketing Services is comprised of NGL and natural gas marketing and trading operations, which includes risk management and transactions related to the storage and transportation of natural gas and NGLs on strategically positioned assets.
Detailed discussion of each of our reportable segments follows. For a discussion of ongoing expansion projects, see Part II, Item 7. Management’s Discussion and Analysis of Financial Condition and Results of Operations.
Transmission & Gulf of America
Interstate Natural Gas Pipeline Assets
Transco
At December 31, 2024, Transco’s system had a design capacity totaling approximately 19.8 MMdth/d. During 2024, Transco began full service on the Regional Energy Access expansion project which added approximately 0.4 MMdth/d of firm transportation capacity to its pipeline, partial early service on the Southside Reliability Enhancement expansion project which added approximately 0.4 MMdth/d of firm transportation capacity, and full service on Carolina Market Link expansion project which added approximately 0.1 MMdth/d of firm transportation capacity. In addition, a reduction of approximately 0.1 MMdth/d of firm transportation capacity is attributable to unsubscribed capacity as well as a reduction of approximately 0.1 MMdth/d of firm transportation capacity is attributable to termination of interim service related to the Regional Energy Access expansion project. Transco’s system includes 61 compressor stations, four underground storage fields, and one LNG storage facility. Compression facilities at sea level-rated capacity total approximately 2.6 million horsepower.
Transco has natural gas storage capacity in four underground storage fields located on or near its pipeline system or market areas and operates two of these storage fields. Transco also has storage capacity in an LNG storage facility that it owns and operates. The total usable gas storage capacity available to Transco and its customers in such underground storage fields and LNG storage facility and through storage service contracts is approximately 188 Bcf of natural gas. At December 31, 2024, Transco’s customers had stored in its facilities approximately 137 Bcf of natural gas. Storage capacity permits Transco’s customers to inject gas into storage during the summer and off-peak periods for delivery during peak winter demand periods.
NWP
At December 31, 2024, NWP’s system had a design capacity totaling approximately 3.8 MMdth/d. NWP’s system includes 42 transmission compressor stations having a combined sea level-rated capacity of approximately 476,000 horsepower.
NWP owns a one-third undivided interest in the Jackson Prairie underground storage facility in Washington. NWP also owns and operates an LNG storage facility in Washington. These storage facilities have an aggregate working natural gas storage capacity of approximately 10 Bcf. NWP also contracts for natural gas storage services for approximately 3 Bcf at the Clay basin underground storage reservoir with a Williams’ affiliate, MountainWest. These natural gas storage facilities, which are substantially utilized for third-party natural gas, enable NWP to balance daily receipts and deliveries and provide storage services to customers.
MountainWest Acquisition
On February 14, 2023, Williams closed on the acquisition of 100 percent of MountainWest Pipelines Holding Company. MountainWest is an interstate natural gas transmission company that owns and operates an approximately 2,000-mile natural gas pipeline system which is regulated by the FERC. At December 31, 2024, MountainWest’s system has a design capacity totaling 8.0 MMdth/d. The system is comprised of MountainWest Pipeline, LLC; MountainWest Overthrust Pipeline, LLC; a 50 percent equity-method interest in White River Hub, LLC; and 64 Bcf of natural gas storage capacity, including the Clay basin underground storage reservoir in Utah. During 2024, MountainWest increased its natural gas storage capacity at the Clay basin underground storage reservoir by
approximately 8 Bcf. MountainWest is located in the Rocky Mountains near six producing areas, including the Greater Green River basin in Wyoming, the Uinta basin in Utah, and the Piceance basin in Colorado.
Gulfstream
Williams owns a 50 percent equity-method investment in Gulfstream, a 745-mile interstate natural gas pipeline system extending from the Mobile Bay area in Alabama to markets in Florida, which has a capacity to transport 1.4 Bcf/d. Operating responsibilities for Gulfstream are shared with the other 50 percent owner.
Standalone, Market-Based Rate Natural Gas Storage Assets
Gulf Coast Storage Acquisition
On January 3, 2024, Williams closed on the Gulf Coast Storage Acquisition. At December 31, 2024, these assets include a strategic portfolio of approximately 230 miles of natural gas transmission pipelines and six underground storage facilities with a capacity of approximately 118 Bcf of natural gas storage across Louisiana and Mississippi and direct access to LNG export facilities and interstate pipelines. These assets expand Williams’ natural gas storage footprint in the Gulf Coast region.
North Texas Assets (NorTex)
On August 31, 2022, Williams purchased a group of assets in north Texas from NorTex Midstream Holdings, LLC. At December 31, 2024, NorTex includes approximately 94 miles of natural gas transmission pipelines and 37 Bcf of natural gas storage in the Dallas-Fort Worth market. In addition to providing gas supply to power generation in north Texas, these assets also provide storage services for Permian gas directed toward growing Gulf Coast LNG demand.
Natural Gas Gathering and Processing Assets
The following tables summarize the significant owned and operated gathering and processing assets of this segment:
| | | | | | | | | | | | | | | | | | | | | | | | | | | | | | | | |
| | Offshore Natural Gas Gathering Pipelines |
| | Location | | Pipeline Miles | | Inlet Capacity (Bcf/d) | | Ownership Interest | | Supply Basins |
| Consolidated: | | | | | | | | | | |
| Canyon Chief, including Blind Faith and Gulfstar extensions | | Deepwater Gulf of America | | 156 | | 0.5 | | 100% | | Eastern Gulf of America |
| Norphlet | | Deepwater Gulf of America | | 58 | | 0.3 | | 100% | | Eastern Gulf of America |
| Other Eastern Gulf | | Offshore shelf and other | | 46 | | 0.2 | | 100% | | Eastern Gulf of America |
| Seahawk | | Deepwater Gulf of America | | 115 | | 0.4 | | 100% | | Western Gulf of America |
| Perdido Norte | | Deepwater Gulf of America | | 105 | | 0.3 | | 100% | | Western Gulf of America |
| Whale | | Deepwater Gulf of America | | 26 | | 0.2 | | 100% | | Western Gulf of America |
| Other Western Gulf | | Offshore shelf and other | | 53 | | 0.2 | | 100% | | Western Gulf of America |
| | | | | | | | | | |
| Discovery | | Central Gulf of America | | 594 | | 0.6 | | 100% | | Central Gulf of America |
| | | | | | | | | | | | | | | | | | | | | | | | | | | | | | | | |
| | Natural Gas Processing Facilities |
| | Location | | Inlet Capacity (Bcf/d) | | NGL Production Capacity (Mbbls/d) | | Ownership Interest | | Supply Basins |
| Consolidated: | | | | | | | | | | |
| Markham | | Markham, TX | | 0.5 | | 45 | | 100% | | Western Gulf of America |
| Mobile Bay | | Coden, AL | | 0.7 | | 35 | | 100% | | Eastern Gulf of America |
| | | | | | | | | | |
| | | | | | | | | | |
| Discovery | | Larose, LA | | 0.6 | | 35 | | 100% | | Central Gulf of America |
Crude Oil Transportation and Production Handling Assets
In addition to Williams’ natural gas assets, Williams owns and operates four deepwater crude oil pipelines and owns and operates production platforms serving the deepwater in the Gulf of America. Williams’ offshore floating production platforms provide centralized services to deepwater producers such as compression, separation, production handling, water removal, and pipeline landings.
The following tables summarize the significant operated crude oil transportation pipelines and production handling platforms of this segment:
| | | | | | | | | | | | | | | | | | | | | | | | | | |
| | Crude Oil Pipelines |
| | Pipeline Miles | | Capacity (Mbbls/d) | | Ownership Interest | | Supply Basins |
| Consolidated: | | |
| Mountaineer, including Blind Faith and Gulfstar extensions | | 155 | | 150 | | 100% | | Eastern Gulf of America |
| BANJO | | 57 | | 90 | | 100% | | Western Gulf of America |
| Alpine | | 96 | | 85 | | 100% | | Western Gulf of America |
| Perdido Norte | | 74 | | 150 | | 100% | | Western Gulf of America |
| Whale | | 124 | | 140 | | 100% | | Western Gulf of America |
| | | | | | | | |
| | |
| | | | | | | | |
| | | | | | | | | | | | | | | | | | | | | | | | | | |
| | Production Handling Platforms |
| | Gas Inlet Capacity (MMcf/d) | | Crude/NGL Handling Capacity (Mbbls/d) | | Ownership Interest | | Supply Basins |
| Consolidated: | | | | | | | | |
| Devils Tower | | 110 | | 60 | | 100% | | Eastern Gulf of America |
| Gulfstar I FPS (1) | | 172 | | 80 | | 51% | | Eastern Gulf of America |
| | | | | | | | |
| | | | | | | | |
| Discovery | | 75 | | 10 | | 100% | | Central Gulf of America |
__________
(1)Statistics reflect 100 percent of the assets from Williams’ 51 percent interest in Gulfstar One floating production system (FPS).
Discovery Acquisition
On August 1, 2024, Williams closed on the acquisition of the remaining 40 percent interest in Discovery, along with certain other assets. Discovery’s assets include a 600 MMcf/d cryogenic natural gas processing plant near Larose, Louisiana, a 35 Mbbls/d NGL fractionator plant near Paradis, Louisiana, and a 594-mile offshore natural gas gathering and transportation system in the Gulf of America. Discovery’s mainline has a gathering inlet capacity of 600 MMcf/d. Discovery’s assets also include a crude oil production handling platform with capacity of 10 Mbbls/d and gas handling and separation capacity of 75 MMcf/d.
Deepwater Whale Expansion Project
In August 2021, Williams reached an agreement with two third-parties to provide offshore natural gas gathering and crude oil transportation services as well as onshore natural gas processing services. The project expanded its
existing Western Gulf of America offshore infrastructure via a 26-mile gas lateral pipeline from the Whale platform to the existing Perdido gas pipeline and added a new 124-mile oil pipeline from the Whale platform to Williams’ existing junction platform. This project was placed into service in January 2025.
Transmission & Gulf of America Operating Statistics
| | | | | | | | | | | | | | | | | |
| 2024 | | 2023 | | 2022 |
| (Annual Average Amounts) |
Consolidated: | | | | | |
| Interstate natural gas pipeline throughput (MMdth/d) (1) (2) | 20.2 | | | 20.4 | | | 16.9 | |
| Gathering volumes (Bcf/d) | 0.55 | | | 0.26 | | | 0.29 | |
| Plant inlet natural gas volumes (Bcf/d) | 0.71 | | | 0.44 | | | 0.47 | |
| NGL production (Mbbls/d) | 47 | | | 27 | | | 28 | |
| NGL equity sales (Mbbls/d) | 10 | | | 6 | | | 6 | |
| Crude oil transportation (Mbbls/d) | 113 | | | 123 | | | 119 | |
| | | | | |
| Non-consolidated: (3) | | | | | |
| Interstate natural gas pipeline throughput (MMdth/d) (1) | 1.2 | | | 1.2 | | | 1.3 | |
| Gathering volumes (Bcf/d) | — | | | 0.34 | | | 0.40 | |
| Plant inlet natural gas volumes (Bcf/d) | — | | | 0.34 | | | 0.40 | |
| NGL production (Mbbls/d) | — | | | 27 | | | 28 | |
| NGL equity sales (Mbbls/d) | — | | | 7 | | | 8 | |
| | | | | |
_____________
(1)Tbtu converted to MMdth at one trillion British thermal units = one million dekatherms.
(2)Includes volumes for natural gas transmission assets acquired in the MountainWest Acquisition after the purchase on February 14, 2023, including 100 percent of the volumes associate with the operated equity-method investment White River Hub, LLC. Further, the amounts for the acquired assets are averaged over the period owned, not over the entire year.
(3)Includes 100 percent of the volumes associated with operated equity-method investments Gulfstream and Discovery, prior to the acquisition of the remaining 40 percent interest in Discovery on August 1, 2024. Volumes associated with the Discovery assets for 2024 are presented entirely in the Consolidated section.
Northeast G&P
Natural Gas Gathering and Processing Assets
This segment includes Williams’ natural gas gathering, compression, processing, and NGL fractionation businesses in the Marcellus and Utica Shale regions in Pennsylvania, West Virginia, New York, and Ohio.
The following tables summarize the significant operated assets of this segment:
| | | | | | | | | | | | | | | | | | | | | | | | | | | | | | | | |
| | | Natural Gas Gathering Assets |
| | | Location | | Pipeline Miles | | Inlet Capacity (Bcf/d) | | Ownership Interest | | Supply Basins |
| Consolidated: | | | | | | | | | | |
| Ohio Valley Midstream (1) | | Ohio, West Virginia, & Pennsylvania | | 216 | | 0.8 | | 65% | | Appalachian |
| Utica East Ohio Midstream (1) (2) | | Ohio | | 53 | | 0.6 | | 65% | | Appalachian |
| Susquehanna Supply Hub | | Pennsylvania & New York | | 506 | | 4.6 | | 100% | | Appalachian |
| Cardinal (1) | | Ohio | | 429 | | 0.7 | | 66% | | Appalachian |
| Flint | | Ohio | | 100 | | 0.5 | | 100% | | Appalachian |
| | | | | | | | | | |
| Non-consolidated: (3) | | | | | | | | | | |
| Bradford Supply Hub | | Pennsylvania | | 754 | | 4.4 | | 66% | | Appalachian |
| Marcellus South | | Pennsylvania & West Virginia | | 296 | | 1.3 | | 68% | | Appalachian |
| Laurel Mountain | | Pennsylvania | | 1,147 | | 0.9 | | 69% | | Appalachian |
| Blue Racer | | Ohio & West Virginia | | 617 | | 2.0 | | 50% | | Appalachian |
| | | | | | | | | | | | | | | | | | | | | | | | | | | | | | | | |
| | | Natural Gas Processing Facilities |
| | | Location | | Inlet Capacity (Bcf/d) | | NGL Production Capacity (Mbbls/d) | | Ownership Interest | | Supply Basins |
| Consolidated: (1) | | | | | | | | | | |
| Fort Beeler | | Marshall Co., WV | | 0.5 | | 62 | | 65% | | Appalachian |
| Oak Grove | | Marshall Co., WV | | 0.6 | | 75 | | 65% | | Appalachian |
| Kensington | | Columbiana Co., OH | | 0.6 | | 68 | | 65% | | Appalachian |
| Leesville | | Carroll Co., OH | | 0.2 | | 18 | | 65% | | Appalachian |
| | | | | | | | | | |
| Non-consolidated: (3) | | | | | | | | | | |
| Berne | | Monroe Co., OH | | 0.4 | | 60 | | 50% | | Appalachian |
| Natrium | | Marshall Co., WV | | 0.8 | | 120 | | 50% | | Appalachian |
_____________
(1)Statistics reflect 100 percent of the assets from Williams’ 65 percent ownership in its Northeast JV and 66 percent ownership of Cardinal gathering system.
(2)Utica East Ohio Midstream inlet capacity consists of 1.3 Bcf/d of a high-pressure gathering pipeline that delivers Cardinal gathering volumes to Utica East Ohio Midstream processing facilities. The listed inlet capacity of 0.6 Bcf/d is incremental capacity to the Cardinal gathering capacity of 0.7 Bcf/d.
(3)Includes 100 percent of the statistics associated with operated equity-method investments.
Other NGL Operations
As part of its Northeast G&P business, Williams owns and operates a 43 Mbbls/d NGL fractionation facility at Moundsville, West Virginia, nearby condensate stabilization facilities capable of handling approximately 17 Mbbls/d of field condensate, a de-ethanization facility at its Oak Grove processing plant, an ethane pipeline, and an NGL pipeline. The Oak Grove de-ethanizer is capable of handling up to approximately 80 Mbbls/d of mixed NGLs to extract up to approximately 40 Mbbls/d of ethane. Williams also owns and operates a 135 Mbbls/d NGL fractionation facility and approximately 970,000 barrels of NGL storage capacity in Harrison County, Ohio, as well as 44 Mbbls/d of condensate stabilization capacity, and other ancillary assets, including loading and terminal facilities in Harrison, Carroll, and Columbiana Counties, Ohio.
NGLs are extracted from the natural gas stream in Williams’ Oak Grove and Fort Beeler cryogenic processing plants. Ethane produced at the Oak Grove de-ethanizer is transported to markets via its 50-mile ethane pipeline to Houston, Pennsylvania. The remaining mixed NGL stream from the de-ethanizer is then transported via Williams’
50-mile NGL pipeline and fractionated at either its Moundsville or Harrison fractionation facility. The resulting products are then transported on truck, rail, or pipeline. Ohio Valley Midstream provides residue natural gas take away options for customers with interconnections to three interstate transmission pipelines.
Certain Equity-Method Investments
Appalachia Midstream Investments
Through the Appalachia Midstream Investments, Williams operates and owns an approximate average 66 percent interest in the Bradford Supply Hub gathering system and owns an approximate average 68 percent interest in the Marcellus South gathering system, together which consist of approximately 1,050 miles of gathering pipeline in the Marcellus Shale region with the capacity to gather 5,700 MMcf/d of natural gas. The majority of Williams’ volumes in the region are gathered from northern Pennsylvania, southwestern Pennsylvania, and the northwestern panhandle of West Virginia in core areas of the Marcellus Shale. Williams operates the assets primarily under long-term, 100 percent fixed-fee gathering agreements that include significant acreage dedications. Additionally, some Marcellus South agreements have MVCs.
Laurel Mountain
Williams operates and owns a 69 percent interest in a joint venture, Laurel Mountain, which includes a 1,147-mile gathering system in western Pennsylvania with the capacity to gather 0.9 Bcf/d of natural gas. Laurel Mountain has a long-term, dedicated, volumetric-based fee agreement, with exposure to natural gas prices, to gather the anchor customer’s production in the western Pennsylvania area of the Marcellus Shale. Additionally, certain Laurel Mountain agreements have MVCs.
Blue Racer
Williams operates and owns a 50 percent interest in Blue Racer. Blue Racer is a joint venture to own, operate, develop, and acquire midstream assets in the Utica Shale and certain adjacent areas in the Marcellus Shale. Blue Racer’s assets include 617 miles of gathering pipelines and the Natrium complex in Marshall County, West Virginia, with a cryogenic processing capacity of 800 MMcf/d and fractionation capacity of approximately 134 Mbbls/d. Blue Racer also owns the Berne complex in Monroe County, Ohio, with a cryogenic processing capacity of 400 MMcf/d, and 102 miles of NGL and condensate pipelines connecting Natrium to Berne. Blue Racer provides gathering, processing, and marketing services primarily under percent-of-liquids and fixed-fee agreements.
Northeast G&P Operating Statistics
| | | | | | | | | | | | | | | | | |
| 2024 | | 2023 | | 2022 |
| (Annual Average Amounts) |
| Consolidated: | | | | | |
| Gathering volumes (Bcf/d) | 4.16 | | | 4.45 | | | 4.19 | |
| Plant inlet natural gas volumes (Bcf/d) | 1.86 | | | 1.89 | | | 1.65 | |
| NGL production (Mbbls/d) | 139 | | | 139 | | | 120 | |
| NGL equity sales (Mbbls/d) | 1 | | | 1 | | | 1 | |
| | | | | |
| Non-consolidated: (1) | | | | | |
| Gathering volumes (Bcf/d) | 6.46 | | | 6.92 | | | 6.61 | |
| Plant inlet natural gas volumes (Bcf/d) | 0.98 | | | 0.93 | | | 0.71 | |
| NGL production (Mbbls/d) | 72 | | | 65 | | | 51 | |
| NGL equity sales (Mbbls/d) | 5 | | | 4 | | | 3 | |
__________
(1) Includes 100 percent of the volumes associated with operated equity-method investments, including Laurel Mountain and Blue Racer; as well as the Bradford Supply Hub and Marcellus South within Appalachia Midstream Investments.
West
Natural Gas Gathering and Processing Assets
The following tables summarize the significant operated assets of this segment:
| | | | | | | | | | | | | | | | | | | | | | | | | | | | | | | | |
| | Natural Gas Gathering Assets |
| | Location | | Pipeline Miles | | Inlet Capacity (Bcf/d) | | Ownership Interest | | Supply Basins/Shale Formations |
| Consolidated: | | | | | | | | | | |
| Wamsutter | | Wyoming | | 2,251 | | 0.7 | | 100% | | Wamsutter |
| Southwest Wyoming | | Wyoming | | 1,613 | | 0.5 | | 100% | | Southwest Wyoming |
| Piceance | | Colorado | | 352 | | 1.8 | | 100% | | Piceance |
| Barnett Shale | | Texas | | 815 | | 0.5 | | 100% | | Barnett Shale |
| Eagle Ford Shale | | Texas | | 1,258 | | 0.5 | | 100% | | Eagle Ford Shale |
| Haynesville Shale | | Louisiana & Texas | | 869 | | 5.0 | | 100% | | Haynesville Shale, Bossier Shale |
| Permian | | Texas | | 113 | | 0.1 | | 100% | | Permian |
| Mid-Continent | | Oklahoma & Texas | | 1,695 | | 0.2 | | 100% | | Miss-Lime, Granite Wash, Colony Wash |
| DJ Basin | | Colorado | | 472 | | 0.8 | | 100% | | Denver-Julesburg |
| | | | | | | | | | |
| | | | | | | | | | |
| | | | | | | | | | |
| | | | | | | | | | | | | | | | | | | | | | | | | | | | | | | | |
| | Natural Gas Processing Facilities |
| | Location | | Inlet Capacity (Bcf/d) | | NGL Production Capacity (Mbbls/d) | | Ownership Interest | | Supply Basins |
| Consolidated: | | | | | | | | | | |
| Echo Springs | | Echo Springs, WY | | 0.6 | | 48 | | 100% | | Wamsutter |
| Opal | | Opal, WY | | 0.7 | | 39 | | 100% | | Southwest Wyoming |
| Willow Creek | | Rio Blanco Co., CO | | 0.5 | | 30 | | 100% | | Piceance |
| Parachute | | Garfield Co., CO | | 1.0 | | 5 | | 100% | | Piceance |
| Fort Lupton | | Weld Co., CO | | 0.3 | | 50 | | 100% | | Denver-Julesburg |
| Keenesburg I | | Weld Co., CO | | 0.2 | | 40 | | 100% | | Denver-Julesburg |
| Front Range | | Weld Co., CO | | 0.1 | | 12 | | 100% | | Denver-Julesburg |
| | | | | | | | | | |
| | | | | | | | | | |
| | | | | | | | | | |
| | | | | | | | | | |
DJ Basin Acquisitions
On November 30, 2023, Williams closed on the acquisition of 100 percent of Cureton Front Range, LLC and the acquisition of the remaining 50 percent interest in Rocky Mountain Midstream Holdings LLC, both of which operate midstream assets in Colorado’s DJ Basin. The Cureton Acquisition includes natural gas gathering pipelines and one in-service processing plant. The RMM Acquisition was the purchase of a partner’s 50 percent interest, resulting in 100 percent ownership by Williams. RMM includes a natural gas gathering pipeline, an approximate 100-mile crude oil transportation pipeline, and natural gas processing assets in the DJ Basin. It also includes crude oil storage and compression assets.
Trace Acquisition
On April 29, 2022, Williams closed on the acquisition of 100 percent of Gemini Arklatex, LLC, through which the gas gathering and related assets of Trace Midstream were acquired. The purpose of this acquisition was to expand Williams’ footprint into the east Texas area of the Haynesville Shale region, increasing in-basin scale.
Other NGL Operations
Williams owns interests in and/or operates NGL fractionation and storage assets in central Kansas near Conway. These assets include a 50 percent interest in an NGL fractionation facility with capacity of slightly more than 100 Mbbls/d and also approximately 23 million barrels of NGL storage capacity. In addition, Williams owns a 189-mile NGL pipeline from a fractionator near Conway, Kansas, to an interconnection with a third-party NGL pipeline system in Oklahoma.
Overland Pass Pipeline Equity-Method Investment
Williams operates and owns a 50 percent interest in OPPL. OPPL is capable of transporting 245 Mbbls/d of NGLs and includes 1,035 miles of NGL pipeline extending from Opal, Wyoming, to the Mid-Continent NGL market center near Conway, Kansas, along with extensions into the Piceance and DJ basins in Colorado and the Bakken Shale in the Williston basin in North Dakota. The equity NGL volumes from Williams’ Wyoming plants as well as certain Colorado plants are dedicated for transport on OPPL under long-term transportation agreements.
West Operating Statistics
| | | | | | | | | | | | | | | | | |
| 2024 | | 2023 | | 2022 |
| (Annual Average Amounts) |
| Consolidated: | | | | | |
| Gathering volumes (Bcf/d) (1) | 5.46 | | | 6.02 | | | 5.19 | |
| Plant inlet natural gas volumes (Bcf/d) | 1.54 | | | 1.54 | | | 1.15 | |
| NGL production (Mbbls/d) | 90 | | | 91 | | | 43 | |
| NGL equity sales (Mbbls/d) | 7 | | | 14 | | | 14 | |
| Non-Consolidated: (2) | | | | | |
| Gathering volumes (Bcf/d) | — | | | — | | | 0.29 | |
| Plant inlet natural gas volumes (Bcf/d) | — | | | — | | | 0.28 | |
| NGL production (Mbbls/d) | — | | | — | | | 33 | |
________________
(1) Includes volumes for gathering assets acquired in the Trace Acquisition after the purchase on April 29, 2022 as well as volumes for gathering assets acquired in the DJ Basin Acquisitions after the purchase on November 30, 2023. Further, the amounts for the acquired assets are averaged over the period owned, not over the entire year.
(2) Includes 100 percent of the volumes associated with operated equity-method investment RMM prior to acquisition of the remaining 50 percent interest on November 30, 2023. Volumes associated with the RMM assets for 2023 are presented entirely in the Consolidated section.
Gas & NGL Marketing Services
Williams’ natural gas marketing business provides asset management and the wholesale marketing, trading, storage, and transportation of natural gas for a diverse set of natural gas and electric utilities, municipalities, power generators, and producers and markets natural gas from the production at its upstream properties. Williams’ NGL marketing business transports and markets its equity NGLs from the production at its processing plants, NGLs from the production at its upstream properties, and NGLs on behalf of third-party NGL producers, including some of its fee-based processing customers. See the Gas and NGL Marketing section of Service Assets, Customers, and Contracts in Item 1. Business for additional information related to this business segment.
Gas & NGL Marketing Services Operating Statistics
| | | | | | | | | | | | | | | | | |
| 2024 | | 2023 | | 2022 |
| (Annual Average Amounts) |
| Sales Volumes: | | | | | |
| Natural Gas (Bcf/d) | 7.11 | | | 7.05 | | | 7.20 | |
| NGLs (Mbbls/d) | 177 | | | 223 | | | 250 | |
| | | | | |
Other
Other includes upstream operations, certain new energy ventures, and minor business activities that are not reportable segments, as well as corporate operations.
Upstream Ventures
Williams acquired certain crude oil and natural gas properties in the Wamsutter basin in February 2021. Williams had an agreement regarding these properties in which it owned 75 percent of the venture’s undivided interest in each well’s working interest. In November 2024, Williams closed on the acquisition of the third-party operator Crowheart Energy, LLC. After closing on the acquisition Williams is the operator and owns more than a 90 percent working interest in each well.
Certain natural gas properties in Louisiana were transferred to Williams in November 2020 as part of a bankruptcy resolution with a customer. In the third quarter of 2021, Williams sold 50 percent of the existing wells and wellbore rights in the South Mansfield area of the Haynesville Shale region to a third party operator, in a strategic effort to develop the acreage, thereby enhancing the value of Williams midstream natural gas infrastructure. Under the agreement, the third party operates the upstream position and develops the undeveloped acreage. The third-party’s interest in new wells increased to 75 percent in early 2023 when a certain drilling hurdle was met. Williams retained ownership in the undeveloped acreage until a separate acreage earning hurdle was met in the fourth quarter of 2023, at which time remaining undeveloped acreage was conveyed to the third party resulting in the third party owning 75 percent and Williams owning 25 percent.
Operating Statistics
| | | | | | | | | | | | | | | | | |
| 2024 (1) | | 2023 | | 2022 |
| (Annual Average Amounts) |
| Net Product Sales Volumes: | | | | | |
| Natural Gas (Bcf/d) | 0.31 | | | 0.29 | | | 0.22 | |
| NGLs (Mbbls/d) | 11 | | | 7 | | | 7 | |
| Crude Oil (Mbbls/d) | 6 | | | 4 | | | 2 | |
________________
(1) Includes volumes for the Crowheart Acquisition after the purchase on November 1, 2024. Further, the amounts for the acquired assets are averaged over the period owned, not over the entire year.
New Energy Ventures
Williams’ Other segment also includes investments in certain new energy ventures related to hydrogen, solar, renewable natural gas, and NextGen Gas. NextGen Gas is natural gas that has been independently certified as low emissions gas across all segments of the value chain.
Rate Matters
FERC regulation requires all terms and conditions of service, including the rates charged, to be filed with and accepted by the FERC before any changes can go into effect. Our interstate natural gas pipelines establish their rates primarily through the FERC’s ratemaking process, but also may negotiate rates with their customers pursuant to the terms of their tariff and FERC policy. Key determinants in the ratemaking process are: (1) costs of providing service, including depreciation expense; (2) allowed rate of return, including the equity component of the capital structure and related income taxes; and (3) contract and volume throughput assumptions. The allowed rate of return is determined in each rate case. Rate design and the allocation of costs between the reservation and commodity rates also impact profitability. As a result of rate case proceedings, certain revenues may be collected subject to refund. Estimates of rate refund liabilities may be recorded considering their and third-party regulatory proceedings, advice of counsel and other risks.
Consistent with FERC policy, our interstate natural gas pipelines design their rates using the straight fixed-variable (SFV) method of rate design. Under the SFV method of rate design, substantially all fixed costs, including
return on equity and income taxes, are included in a reservation charge to customers and all variable costs are recovered through a commodity charge to customers. While the use of SFV rate design limits our pipelines’ opportunity to earn incremental revenues through increased throughput, it also limits their risk associated with fluctuations in throughput.
Transco Rate Case Filing
On August 30, 2024, Transco filed a general rate case with the FERC for an overall increase in rates. In September 2024, with the exception of certain rates that reflected a rate decrease, the FERC accepted and suspended our general rate filing to be effective March 1, 2025, subject to refund and the outcome of hearing procedures established by the FERC. The specific rates that reflected a rate decrease were accepted, without suspension, to be effective October 1, 2024, as requested by Transco, and will not be subject to refund. The impact of the rates reflecting a rate decrease is expected to reduce revenues by approximately $1 million per month beginning October 1, 2024.
NWP Rate Case Settlement
On November 15, 2022, the FERC approved NWP’s Petition for Approval of Pre-Filing Stipulation and Settlement Agreement (Settlement) in Docket No. RP22-1155. The Settlement established a new general system firm Rate Schedule TF-1 (Large Customer) daily reservation rate of $0.37250/Dth with a $0.00935/Dth commodity rate (which were made effective January 1, 2023), resolved other rate issues, established a Modernization and Emission Reduction Program and satisfied our rate case filing obligation under our settlement in Docket No. RP17-346. Provisions were included in the Settlement that establish a moratorium on any NGA Section 4 or 5 proceedings that would seek to place new rates in effect any earlier than January 1, 2026. The Settlement also provides that Northwest Pipeline file an NGA Section 4 general rate case with rates to be effective not later than April 1, 2028, unless (a) Northwest Pipeline has entered into a pre-filing settlement or (b) a Section 5 general rate case has been filed on or before April 1, 2028.
As a result of the Settlement, in January 2023, NWP refunded approximately $126 million, including interest, associated with the decrease in federal tax rates due to the Tax Cuts and Jobs Act of 2017 (Tax Reform), which reduced current Regulatory liabilities on NWP’s Balance Sheet.
Regulatory Matters
FERC
Williams’ natural gas pipeline interstate transmission and storage activities, including activities of Transco and NWP, are subject to FERC regulation under the NGA and under the Natural Gas Policy Act of 1978, as amended, and, as such, the rates and charges for the transportation of natural gas in interstate commerce, accounting, and the extension, enlargement, or abandonment of the jurisdictional facilities, among other things, are subject to regulation. Each of Williams’ natural gas pipeline companies, including Transco and NWP, holds certificates of public convenience and necessity issued by the FERC authorizing ownership and operation of all pipelines, facilities, and properties for which certificates are required under the NGA. FERC Standards of Conduct govern how the interstate pipelines communicate and conduct transmission transactions with an affiliate that engages in marketing functions. Among other things, the Standards of Conduct require that interstate gas pipelines treat all transmission customers, affiliated and non-affiliated, on a not unduly discriminatory basis. FERC Standards of Conduct govern the relationship between natural gas transmission providers and marketing function employees as defined by the rule. The Standards of Conduct are intended to prevent natural gas transmission providers from preferentially benefiting gas marketing functions by requiring the employees of a transmission provider that perform transmission functions to function independently from marketing function employees and by restricting the information that transmission providers may provide to marketing function employees. Under the Energy Policy Act of 2005, the FERC is authorized to impose civil penalties of more than $1.5 million per day for each violation of its rules.
FERC regulation requires all terms and conditions of service, including the rates charged, to be filed with and accepted by the FERC before any changes can go into effect. Williams’ interstate gas pipeline companies, including
Transco and NWP, establish rates through the FERC’s ratemaking process. In addition, Williams’ interstate gas pipelines, including Transco and NWP, may enter into agreements with customers for negotiated rates, which may be less than, equal to, or greater than the otherwise applicable cost-based recourse rates. Williams, including Transco, has also received authority to charge market-based rates for certain of our storage services. Key determinants in the FERC ratemaking process include:
•Costs of providing service, including depreciation expense;
•Allowed rate of return, including the equity component of the capital structure and related income taxes;
•Contract and volume throughput assumptions.
The allowed rate of return is determined in each rate case. Rate design and the allocation of costs between the reservation and commodity rates also impact profitability. During the pendency of rate case proceedings, certain revenues collected may be subject to refund.
Williams also owns interests in and operates natural gas liquids pipelines that are regulated by various federal and state governmental agencies. Services provided on the interstate natural gas liquids pipelines are subject to regulation under the Interstate Commerce Act by the FERC, which has authority over the terms and conditions of service; rates, including depreciation and amortization policies; and initiation of service. Williams’ intrastate natural gas liquids pipelines providing common carrier service are subject to regulation by various state regulatory agencies.
Updated Certificate Policy Statement and Interim Greenhouse Gas (GHG) Policy Statement
On February 18, 2022, the FERC issued an Updated Certificate Policy Statement and an Interim GHG Policy Statement, which were to provide guidance for consideration of interstate natural gas pipeline projects. The Updated Certificate Policy Statement was intended to provide an analytical framework for how the FERC would consider whether a project is in the public convenience and necessity. The Interim GHG Policy Statement was intended to set forth how the FERC would assess the impacts of natural gas infrastructure projects on climate change in its reviews under the National Environmental Policy Act and the NGA. On March 24, 2022, the FERC converted the Updated Certificate Policy Statement and the Interim GHG Policy Statement into draft policy statements, and on January 24, 2025, the FERC terminated the Interim GHG Policy Statement proceeding. The FERC has not yet issued final guidance on the Updated Certificate Policy Statement.
Pipeline Safety
Williams’ interstate natural gas pipelines, including Transco and NWP, are subject to the Natural Gas Pipeline Safety Act of 1968, as amended, the Pipeline Safety Improvement Act of 2002, the Pipeline Safety, Regulatory Certainty, and Jobs Creation Act of 2011, and the Protecting Our Infrastructure of Pipelines and Enhancing Safety Act of 2016 and 2020, which regulate safety requirements in the design, construction, operation, and maintenance of interstate natural gas transmission facilities. The United States Department of Transportation Pipeline and Hazardous Materials Safety Administration (PHMSA) administers federal pipeline safety laws.
Federal pipeline safety laws authorize PHMSA to establish minimum safety standards for pipeline facilities and persons engaged in the transportation of gas or hazardous liquids by pipeline. These safety standards apply to the design, construction, testing, operation, and maintenance of gas and hazardous liquids pipeline facilities affecting interstate or foreign commerce. PHMSA has also established reporting requirements for operators of gas and hazardous liquid pipeline facilities, as well as provisions for establishing the qualification of pipeline personnel and requirements for managing the integrity of gas transmission and distribution lines and certain hazardous liquid pipelines. To ensure compliance with these provisions, PHMSA performs pipeline safety inspections and has the authority to initiate enforcement actions.
In August 2022, PHMSA published Rule 2, which is the last in the three-part Mega Rule set of regulations. Rule 2 went into effect in May 2023, but a Stay of Enforcement until February 2024 limited the amount of the regulation that was implemented. Since the rule was published in 2022, Williams, including Transco and NWP, has worked to understand the regulatory changes and modify procedures as needed and will continue to monitor impacts, if any, from recently published amendments.
Pipeline Integrity Regulations
Williams has an enterprise-wide Gas Integrity Management Plan, which includes Transco and NWP, that meets the PHMSA final rule issued pursuant to the requirements of the Pipeline Safety Improvement Act of 2002. To meet the PHMSA regulations, Williams has identified all pipelines in high consequence areas (HCAs) and developed baseline assessment plans for all applicable pipelines. In response to the PHMSA Mega Rule, implemented in 2021, Williams identified Moderate Consequence Areas, and integrated those segments into its integrity program along with Class 3 and 4 pipeline locations required by the rule.
Regulatory changes as part of the Mega Rule, effective in 2024, impose stricter requirements for repairing crack-like, dent, and metal loss features. This has led to increased remediation efforts and higher costs compared to previous years. Additionally, advancements in identifying, evaluating, and remediating hard spot defects have contributed to higher spending.
Williams estimates that the cost to be incurred in 2025 with its entire Gas Integrity Management program to be approximately $219 million, which includes $168 million and $38 million for Transco and NWP, respectively. Management considers these costs to be prudent and incurred in the ordinary course of business and, the maintenance capital costs to be recoverable through rate case filings by Williams’ interstate pipelines.
Williams also has an enterprise-wide Liquid Integrity Management Plan that meets PHMSA requirements including HCA identification and a baseline assessment plan. Williams estimates that the cost to be incurred in 2025 associated with this program will be approximately $2 million. Williams considers these costs to be prudent and incurred in the ordinary course of business.
Cybersecurity Matters
In 2024, the Transportation Security Administration (TSA) issued two updated security directives to further enhance cybersecurity resilience for pipeline operators. Security Directive Pipeline-2021-01D, effective May 29, 2024, continues to require owners/operators of critical pipelines to: (1) report cybersecurity incidents to the Cybersecurity and Infrastructure Security Agency (CISA) within 24 hours; (2) designate a Cybersecurity Coordinator available 24 hours a day, seven days a week, to coordinate cybersecurity practices and incident responses; and (3) conduct comprehensive reviews of cybersecurity practices, identify gaps, and report results to TSA and CISA.
Additionally, Security Directive Pipeline-2021-02E, effective July 27, 2024, builds on previous directives by requiring pipeline operators to: (1) implement a TSA-approved Cybersecurity Implementation Plan, incorporating network segmentation, continuous monitoring, and access control measures; (2) develop and maintain a robust Cybersecurity Incident Response Plan to reduce risks to critical systems during an incident; and (3) establish a Cybersecurity Assessment Plan with annual updates and reports to evaluate the effectiveness of implemented measures and identify vulnerabilities.
Williams, including Transco and NWP, has established and received TSA approval for its Cybersecurity Implementation Plan and Cybersecurity Assessment Plan, and is compliant with the remaining requirements established in Security Directives 1D and 2E.
Additionally, the United States Coast Guard issued a final rule in January 2025, establishing baseline cybersecurity requirements for maritime transportation assets, including vessels and facilities regulated under the Maritime Transportation Security Act. This rule mandates the development and maintenance of a Cybersecurity Plan, designation of a Cybersecurity Officer, implementation of security measures for account, device, and data protection, regular cybersecurity assessments, and reporting of cyber incidents. Compliance timelines for these requirements are phased, with key milestones such as cybersecurity assessments and plan submissions required within 24 months of the rule’s effective date.
Williams is actively monitoring evolving regulatory requirements to ensure compliance across its operations, including Transco and NWP. Williams is assessing the applicability of various regulations to its assets and implementing necessary measures to align with these standards. Williams, including Transco and NWP, remains
committed to safeguarding its infrastructure, minimizing risks, and maintaining the resilience of its operations in the face of evolving cybersecurity threats
See Part I, Item 1A. “Risk Factors” — “A breach of information technology infrastructure, including a breach caused by a cybersecurity attack on Williams, Transco, or NWP, or the third parties with whom they are interconnected, may interfere with the safe operation of assets, result in the disclosure of personal or proprietary information, and cause reputational harm.”
Gathering Regulations
Williams’ onshore midstream gathering operations are subject to laws and regulations in the various states in which it operates. For example, the Texas Railroad Commission has the authority to regulate the terms of service for Williams’ intrastate natural gas gathering business in Texas. Although the applicable state regulations vary widely, they generally require that pipeline rates and practices be reasonable and nondiscriminatory, and may include provisions covering marketing, pricing, pollution, environment, and human health and safety. Some states, such as New York and Ohio, have specific regulations pertaining to the design, construction, and operations of gathering lines within such state.
Williams has been actively implementing PHMSA’s 2021 Gas Gathering final rule that requires all onshore gas gathering lines to report incidents and file annual reports. The final rule also established a new Type C regulated gathering line and now requires Type C gathering lines to comply with specifically identified PHMSA regulations in 49 Code of Federal Regulations Part 192. Since the rule was published, Williams has worked to understand the regulatory changes and modify our procedures as needed.
Liquids Pipelines
Williams’ liquids pipelines are regulated by the Louisiana Department of Natural Resources, the Texas Railroad Commission, and various other state and federal agencies. These pipelines are also subject to the liquid pipeline safety and integrity regulations discussed above since both Louisiana and Texas have adopted the integrity management regulations defined in PHMSA.
Outer Continental Shelf Lands Act
Williams’ offshore gas and liquids pipelines located on the outer continental shelf, including Transco, are subject to the Outer Continental Shelf Lands Act, which provides in part that outer continental shelf pipelines “must provide open and nondiscriminatory access to both owner and non-owner shippers.”
See Part I, Item 1A. “Risk Factors” — “The operation of Williams’, Transco’s, and NWP’s businesses might be adversely affected by regulatory proceedings, changes in government regulations or in their interpretation or implementation, or the introduction of new laws or regulations applicable to Williams’, Transco’s, and NWP’s businesses or customers,” and “The natural gas sales, transportation, and storage operations of Williams’, Transco’s, and NWP’s natural gas pipelines are subject to regulation by the FERC, which could have an adverse impact on their ability to establish transportation and storage rates that would allow them to recover the full cost of operating their respective pipelines and storage assets, including a reasonable rate of return.”
Environmental Matters
Williams’ operations, including Transco and NWP, are subject to federal environmental laws and regulations as well as the state, local, and tribal laws and regulations adopted by the jurisdictions in which they operate. Williams, Transco, and NWP could incur liability to governments or third parties for any unlawful discharge of pollutants into the air, soil, or water, as well as liability for cleanup costs. Materials could be released into the environment in several ways including, but not limited to:
•Leakage from gathering systems, underground gas storage caverns, pipelines, processing or treating facilities, transportation facilities, and storage tanks;
•Damage to facilities resulting from accidents during normal operations;
•Damages to onshore and offshore equipment and facilities resulting from storm events or natural disasters;
•Blowouts, cratering, and explosions.
In addition, Williams, Transco, and NWP may be liable for environmental damage caused by former owners or operators of our properties.
Williams, Transco, and NWP believe compliance with current environmental laws and regulations will not have a material adverse effect on their capital expenditures, earnings, or current competitive position. However, environmental laws and regulations could affect their business in various ways from time to time, including incurring capital and maintenance expenditures, fines and penalties, and creating the need to seek relief from the FERC for rate increases to recover the costs of certain capital expenditures and operation and maintenance expenses.
NWP - Washington State Climate Commitment Act
In 2021, the state of Washington passed its Climate Commitment Act establishing a market-based cap-and-invest program to reduce carbon emissions. This program took effect on January 1, 2023, and sets a limit, or cap, on overall carbon emissions in the state and requires businesses like NWP to obtain allowances equal to their annual covered carbon emissions. The state’s cap will be reduced over time to meet the state’s carbon emissions reduction targets, which means fewer carbon emissions allowances will be available to purchase each year. These allowances can be purchased through quarterly auctions hosted by the state or bought and sold on a secondary market. In 2023, NWP began purchasing allowances for the carbon emissions from nine of its thirteen compressor stations within the state whose annual carbon emissions have exceeded 25,000 metric tons of carbon dioxide equivalent at least once since 2015. NWP also began purchasing allowances for NWP’s delivery of natural gas to certain of their customers and certain of their facilities in the state whose annual carbon emissions are insufficient to require their direct participation in the program. NWP’s latest rate case settlement allows them to recover the costs of purchasing allowances under the program in their next rate case.
For additional information regarding the potential impact of federal, state, tribal, or local regulatory measures on business and specific environmental issues, please refer to Part 1, Item 1A. “Risk Factors” — “Williams’, Transco’s, and NWP’s operations are subject to environmental laws and regulations, including laws and regulations relating to climate change and greenhouse gas emissions, which may expose them to significant costs, liabilities, and expenditures that could exceed expectations,” and Part II, Item 7 “Management’s Discussion and Analysis of Financial Condition and Results of Operations — Environmental” and “Environmental Matters” in Part II, Item 8. Financial Statements and Supplementary Data — Note 18 – Contingencies and Commitments.
Competition
Williams’ competitive strategy spans all of its product and service offerings. Williams has a narrowed natural gas value chain focus that supports the exceptional reliability and quality services that are valued by our customers.
Gathering and Processing
Competition for natural gas gathering, processing, treating, transportation, and storage, as well as NGLs transportation, fractionation, and storage continues to increase as United States production continues to grow. Williams’ midstream services compete with similar facilities that are in close proximity to its assets.
Williams faces competition from companies of varying size and financial capabilities, including major and independent natural gas midstream providers, private equity firms, and major integrated oil and natural gas companies that gather, transport, process, fractionate, store, and market natural gas and NGLs, as well as some larger exploration and production companies that are choosing to develop midstream services to handle their own natural gas.
Williams’ gathering and processing agreements are generally long-term agreements that may include acreage dedication. Competition for natural gas volumes is primarily based on reputation, flexibility of commercial terms (including but not limited to fees charged, products retained, volume commitments), available capacity, array and quality of services provided, as well as efficiency, reliability, and safety of services. Williams believes its significant
presence in key supply basins, expertise and reputation as a reliable and safe operator, commitment to sustainability, and ability to offer integrated packages of services positions it well against competition.
Regulated Interstate Natural Gas Transportation and Storage
The market for supplying natural gas is highly competitive and new pipelines, storage facilities, and other related services are expanding to service the growing demand for natural gas. Additionally, pipeline capacity in many natural gas supply basins is constrained and facing more regulation and opposition causing competition to increase among pipeline companies as they strive to connect those basins to major natural gas demand centers.
Williams predominately competes with major intrastate and interstate natural gas pipelines. Some local distribution companies are also involved in the long-haul transportation business through joint venture pipelines. The principle elements of competition in the interstate natural gas pipeline business are based on available capacity, rates, reliability, quality of customer service, diversity and flexibility of supply, and proximity or access to customers and market hubs.
Williams faces competition in a number of key markets, and competes with other interstate and intrastate pipelines for deliveries to customers who can take deliveries at multiple points. Natural gas delivered on Williams’ system competes with alternative energy sources used to generate electricity such as hydroelectric power, solar, wind, coal, fuel oil, and nuclear. Future demand for natural gas within the power sector could be increased by growing power demand and by regulations limiting or discouraging coal use in power generation. Conversely, natural gas demand could be adversely affected by laws mandating or encouraging solar and wind power sources or restricting the use of natural gas in power generation.
Significant entrance barriers to build new pipelines exist, including increased federal and state regulations and elevated public opposition against new pipeline builds, and these factors will continue to impact potential competition for the foreseeable future. However, Williams believes past success in working with regulators and the public, the position of its existing infrastructure, established strategic long-term contracts, and the fact that Williams’ pipelines have numerous receipt and delivery points provide it a competitive advantage, especially along the eastern seaboard and northwestern United States.
Energy Management and Marketing Services
Williams’ Gas & NGL Marketing Services segment competes with national and regional full-service energy providers, producers, and pipeline marketing affiliates or other marketing companies that aggregate commodities with transportation and storage capacity.
For additional information regarding competition for Williams services or otherwise affecting our business, please refer to Part 1, Item 1A. “Risk Factors” - “The business, operating results, and financial condition of Williams’, Transco’s, and NWP’s natural gas transportation and midstream businesses are dependent on the continued availability of natural gas supplies in the supply basins and demand for those supplies in the markets that they serve,” “The energy industry is highly competitive, and increased competitive pressure could adversely affect Williams’, Transco’s, and NWP’s businesses and operating results,” and “Williams, Transco, and NWP may not be able to replace, extend, or add additional customer contracts or contracted volumes on favorable terms, or at all, as applicable, which could affect Williams’, Transco’s, and NWP’s financial condition and ability to grow, as well as the amount of cash available to Williams to pay dividends.”
Human Capital Resources
Williams is committed to maintaining a work environment that enables Williams to attract, develop, and retain a highly skilled and diverse group of talented employees who help promote long-term value creation now and into the clean energy future.
Employees
As of February 1, 2025, Williams had 5,829 full-time employees located throughout the United States. During 2024, Williams’ voluntary turnover rate was 5.0 percent.
Transco and NWP have no employees. Operations, management and certain administrative services are provided by Williams for both Transco and NWP.
Williams’ 2023 Sustainability Report is available on its website for more information about human capital programs and initiatives. The 2024 Sustainability Report will be available in the summer of 2025. Nothing on Williams’ website shall be deemed incorporated by reference into this Annual Report on Form 10-K.
Workforce Safety
Williams continues to advance a safety-first culture by developing and empowering employees to operate assets in a safe, reliable, and customer-focused way. Williams strives to continuously improve safety and implement best practices to progress towards zero safety incidents. When a safety hazard is recognized, every employee has the authority and responsibility to stop work activities, make changes to enhance safety, and share the lessons learned with the organization on how we made it right.
Williams includes three safety and environmental metrics as a part of its Annual Incentive Program design. For 2024, these goals included Critical Tier 3 Loss of Primary Containment (LOPC) Ratio, a High Potential Hazard Identification to Incident Ratio goal aimed to focus attention on behaviors that are the leading causes of incidents, as well as a Methane Emissions Reduction goal focusing on efforts to reduce greenhouse gas emissions by safely and reliably operating and maintaining assets. These three metrics comprise 15 percent of Williams annual incentive program for eligible employees, and reinforce the importance of incident prevention and a commitment to environmental and safety-focused improvements.
For 2024, the LOPC Ratio, High Potential Hazard Identification to Incident Ratio and Methane Emissions Reduction goals outperformed the established targets.
Workforce Health, Engagement, and Development
Williams’ employees are its most valued resource, are instrumental in our mission to safely deliver products that support the clean energy economy, and are the driving force behind Williams’ reputation as a safe, reliable company that does the right thing, every time. Cultivating a healthy work environment increases productivity, enhances employee satisfaction, and promotes long-term value creation.
Williams provides a competitive total rewards program that includes base salary, an annual incentive program, retirement benefits, and health benefits, including wellness and employee assistance programs. Williams provides employees with company-paid life insurance, disability coverage, and paid parental leave for both birth and non-birth parents, as well as adoption assistance. The annual incentive program is a key component of Williams’ commitment to a performance culture focused on recognizing and rewarding high performance.
In order to attract and retain top talent, Williams creates and is committed to maintaining a safe, inclusive workplace where employees feel valued, heard, respected, and supported in their personal and professional development. Williams leverages social and digital platforms like a careers site, external job boards, virtual and in-person career fairs and community events to attract candidates who have the specific skills we need. Further, leaders participate in inclusion training and utilize interview guides with collaboration and inclusion-focused questions to ensure they are equipped with interviewer best practices that help them holistically evaluate candidates. Williams utilizes employee surveys and employee-led advisory councils to understand the needs of the business from the perspective of employees regarding engagement, development and inclusion. Additionally, Williams supports employee engagement through formal programming including professional development, mentoring, and succession planning.
Williams provides extensive corporate and technical training programs that are agile and robust. These programs are designed to support the professional, skill, and technological development of employees, which in turn creates a competitive advantage. Williams is committed to adding long-term value by investing in employees’ growth and development. In addition to internal development programming, Williams also supports external development opportunities to further enhance employees’ professional and technical skills. Performance is measured considering both the achieved results associated with attaining annual goals and the observable skills and behaviors based on defined competencies that contribute to workplace effectiveness and career success. All formal leaders are
evaluated on two additional competencies around building inclusive, high-performing teams. Including the defined competencies in the annual performance assessments illustrates Williams’ emphasis on, and commitment to, achieving results in the right way.
Additionally, Williams is committed to strengthening the communities where we operate through philanthropy and volunteerism. Williams supports Science, Technology, Engineering, and Math education initiatives, community benefit projects, environmental conservation, first responder efforts, and the work of United Way agencies across the United States.
The Compensation and Management Development Committee of Williams’ Board of Directors oversees executive compensation and equity-based compensation plans and the material risks associated with the compensation program, as well as the oversight elements of human capital management, including talent development and diversity and inclusion.
Inclusive Workforce
Williams is committed to creating an inclusive culture, where differences are embraced and employees feel valued, welcomed, appreciated, and compelled to reach their full potential. Williams believes that inclusion fosters innovation, collaboration, and drives business growth and long-term success. To create a culture of inclusion, Williams embraces, appreciates, and fully leverages the diversity of background and experience within teams. Williams believes that incorporating differences into a team of people who are working toward the same goal provides a competitive advantage.
To create space for employees to share personal experiences and perspectives, and to appreciate differences, Williams offers Employee Resource Groups (ERGs). These groups are employee-led and based on similar interests and experiences, represent different communities and their allies, and are open to everyone. ERG members participate in community events, volunteer, lend professional and personal support to one another, and promote inclusion across the company. Each ERG leadership team includes one or two vice president sponsors to help the group champion efforts. These leadership teams coordinate and prioritize efforts with corporate oversight and support.
Williams is committed to helping all employees develop and succeed. Williams seeks inclusive representation at all levels of the organization through our talent management practices and employee development programs, including required baseline inclusion training for all leaders across the company.
Williams’ Diversity and Inclusion Council, which includes members of the executive officer team, organizational and operational leaders, and individual employees, promotes policies, practices, and procedures that support the growth of a high-performing workforce where all individuals can achieve their full potential. The council serves as the governing body over enterprise inclusion initiatives, including events, organized and hosted by one of Williams 10 ERGs, and annual awards that recognize an outstanding leader and an individual contributor who champion inclusion.
As of December 31, 2024, Williams’ Board of Directors includes 12 members, 11 of whom are independent members, including the Chairman. As part of the director selection and nominating process, the Governance and Sustainability Committee annually assesses the Board’s effectiveness. Williams strives to maintain a board of directors with varied occupational and personal backgrounds.
Transactions with Affiliates
Transco and NWP engage in transactions with Williams and its subsidiaries. Please see Part II, Item 8. Financial Statements and Supplementary Data — Note 1 – General, Description of Business, Basis of Presentation, and Summary of Significant Accounting Policies and Note 4 – Related Party Transactions.
Website Access To Reports and Other Information
Williams files its annual report on Form 10-K, quarterly reports on Form 10-Q, current reports on Form 8-K, proxy statements, and other documents electronically with the SEC under the Exchange Act.
Williams’ Internet website is www.williams.com. Williams makes available, free of charge, through the Investors tab of its Internet website its annual report on Form 10-K, quarterly reports on Form 10-Q, current reports on Form 8‑K, and amendments to those reports filed or furnished pursuant to Section 13(a) or 15(d) of the Exchange Act as soon as reasonably practicable after Williams electronically files such material with, or furnishes it to, the SEC. Williams Corporate Governance Guidelines, Sustainability Report, Board committee charters, and the Williams Code of Business Conduct are also available on the Internet website. Williams will also provide, free of charge, a copy of any of our corporate documents listed above upon written request to Williams’ Corporate Secretary, One Williams Center, Suite 4700, Tulsa, Oklahoma 74172.
Item 1A. Risk Factors
FORWARD-LOOKING STATEMENTS AND CAUTIONARY STATEMENT
FOR PURPOSES OF THE “SAFE HARBOR” PROVISIONS OF
THE PRIVATE SECURITIES LITIGATION REFORM ACT OF 1995
The reports, filings, and other public announcements of Williams, Transco, and NWP may contain or incorporate by reference statements that do not directly or exclusively relate to historical facts. Such statements are “forward-looking statements” within the meaning of Section 27A of the Securities Act and Section 21E of the Exchange Act. These forward-looking statements relate to anticipated financial performance, management’s plans and objectives for future operations, business prospects, outcomes of regulatory proceedings, market conditions, and other matters. Williams, Transco, and NWP make these forward-looking statements in reliance on the safe harbor protections provided under the Private Securities Litigation Reform Act of 1995, as applicable.
All statements, other than statements of historical facts, included in this report that address activities, events, or developments that Williams, Transco, and NWP expect, believe, or anticipate will exist or may occur in the future, are forward-looking statements. Forward-looking statements can be identified by various forms of words such as “anticipates,” “believes,” “seeks,” “could,” “may,” “should,” “continues,” “estimates,” “expects,” “forecasts,” “intends,” “might,” “goals,” “objectives,” “targets,” “planned,” “potential,” “projects,” “scheduled,” “will,” “assumes,” “guidance,” “outlook,” “in-service date,” or other similar expressions. These forward-looking statements are based on management’s beliefs and assumptions and on information currently available to management and include, among others, statements regarding:
•Levels of dividends to Williams’ stockholders;
•Future credit ratings of Transco, NWP, and Williams and its affiliates;
•Amounts and nature of future capital expenditures;
•Expansion and growth of business and operations;
•Expected in-service dates for capital projects;
•Financial condition and liquidity;
•Business strategy;
•Cash flow from operations or results of operations;
•Rate case filings;
•Seasonality of certain business components;
•Natural gas, natural gas liquids, and crude oil prices, supply, and demand;
•Demand for services.
Forward-looking statements are based on numerous assumptions, uncertainties, and risks that could cause future events or results to be materially different from those stated or implied in this report. Many of the factors that will determine these results are beyond Williams’, Transco’s, and NWP’s ability to control or predict. Specific factors that could cause actual results to differ from results contemplated by the forward-looking statements include, among others, the following:
•Availability of supplies, market demand, and volatility of prices;
•Development and rate of adoption of alternative energy sources;
•The impact of existing and future laws and regulations, the regulatory environment, environmental matters, and litigation, as well as the ability and the ability of other energy companies with whom Williams, Transco, and NWP conduct or seek to conduct business, to obtain necessary permits and approvals, and the ability to achieve favorable rate proceeding outcomes;
•Exposure to the credit risk of customers and counterparties;
•Williams’ ability to acquire new businesses and assets and successfully integrate those operations and assets into existing businesses as well as successfully expand facilities and consummate asset sales on acceptable terms;
•The ability to successfully identify, evaluate, and timely execute on capital projects and investment opportunities;
•The strength and financial resources of competitors and the effects of competition;
•The amount of cash distributions from and capital requirements of Williams’ investments and joint ventures in which Williams participates;
•The ability of Williams to effectively execute on its financing plan;
•Increasing scrutiny and changing expectations from stakeholders with respect to environmental, social, and governance practices;
•The physical and financial risks associated with climate change;
•The impacts of operational and developmental hazards and unforeseen interruptions;
•The risks resulting from outbreaks or other public health crises;
•Risks associated with weather and natural phenomena, including climate conditions and physical damage to facilities;
•Acts of terrorism, cybersecurity incidents, and related disruptions;
•Williams’ costs and funding obligations for defined benefit pension plans and other postretirement benefit plans, and Transco’s and NWP’s allocations regarding the same;
•Changes in maintenance and construction costs, as well as the ability to obtain sufficient construction- related inputs, including skilled labor;
•Inflation, interest rates, tariffs on foreign-made materials and goods (including steel and steel pipes) necessary to conduct business, and general economic conditions (including future disruptions and volatility in the global credit markets and the impact of these events on customers and suppliers);
•Risks related to financing, including restrictions stemming from debt agreements, future changes in credit ratings as determined by nationally recognized credit rating agencies, and the availability and cost of capital;
•The ability of the members of the Organization of Petroleum Exporting Countries (OPEC) and other oil exporting nations to agree to and maintain oil price and production controls and the impact on domestic production;
•Changes in the current geopolitical situation, including the Russian invasion of Ukraine and conflicts in the Middle East;
•Changes in U.S. governmental administration and policies;
•Whether Williams is able to pay current and expected levels of dividends;
•Additional risks described in Williams’, Transco’s, and NWP’s SEC filings.
Given the uncertainties and risk factors that could cause Williams’, Transco’s, and NWP’s actual results to differ materially from those contained in any forward-looking statement, Williams, Transco, and NWP caution investors not to unduly rely on these forward-looking statements. Williams, Transco, and NWP disclaim any obligations to, and do not intend to, update the above list or announce publicly the result of any revisions to any of the forward-looking statements to reflect future events or developments.
In addition to causing actual results to differ, the factors listed above and referred to below may cause Williams’, Transco’s, and NWP’s intentions to change from those statements of intention set forth in this report.
Such changes in intentions may also cause results to differ. Williams, Transco, and NWP may change intentions, at any time and without notice, based upon changes in such factors, assumptions, or otherwise.
Because forward-looking statements involve risks and uncertainties, Williams, Transco, and NWP caution that there are important factors, in addition to those listed above, that may cause actual results to differ materially from those contained in the forward-looking statements. These factors are described in the following section.
Summary of Risk Factors
You should carefully consider the following risk factors in addition to the other information in this report. Each of these factors could adversely affect Williams’, Transco’s, and NWP’s businesses, prospects, financial condition, results of operations, cash flows, and, in some cases, reputation. The occurrence of any of such risks could also adversely affect the value of an investment in securities. These factors are summarized below and described in more detail following the summary.
Risks Related to Business
•The business, operating results, and financial condition of Williams’, Transco’s, and NWP’s natural gas transportation and midstream businesses are dependent on the continued availability of natural gas supplies in the supply basins and demand for those supplies in the markets that they serve.
•Prices for natural gas, NGLs, oil, and other commodities are volatile, and this volatility has and could continue to adversely affect Williams’ financial condition, results of operations, cash flows, access to capital, and ability to maintain or grow its business.
•Significant prolonged changes in natural gas prices could affect supply and demand for Transco and NWP and cause a reduction in or termination of their long-term transportation and storage contracts or throughput on their systems.
•Williams, Transco, and NWP are exposed to the credit risk of customers and counterparties, and credit risk management will not be able to completely eliminate such risk.
•Williams, Transco, and NWP face opposition to the operation and expansion of pipelines and facilities from various individuals and groups.
•Williams, Transco, and NWP may not be able to grow or effectively manage growth.
•The energy industry is highly competitive, and increased competitive pressure could adversely affect Williams’, Transco’s, and NWP’s businesses and operating results.
•Williams does not own 100 percent of the equity interests of certain subsidiaries, including the nonconsolidated entities, which may limit its ability to operate and control these subsidiaries. Certain operations, including the nonconsolidated entities, are conducted through arrangements that may limit Williams’ ability to operate and control these operations.
•Williams, Transco, and NWP may not be able to replace, extend, or add additional customer contracts or contracted volumes on favorable terms, or at all, as applicable, which could affect Williams’, Transco’s, and NWP’s financial condition and ability to grow, as well as the amount of cash available to Williams to pay dividends.
•Certain of Williams’, Transco’s, and NWP’s natural gas pipeline services are subject to long-term, fixed-price contracts that are not subject to adjustment, even if the cost to perform such services exceeds the revenues received from such contracts.
•Some of Williams’, Transco’s, and NWP’s businesses are exposed to supplier concentration risks arising from dependence on a single or a limited number of suppliers.
•Transco and NWP depend on certain key customers for a significant portion of their revenues. The loss of any of these key customers or the loss of any contracted volumes could result in a decline in Transco’s and NWP’s respective businesses.
•Failure of service providers or disruptions to outsourcing relationships might negatively impact Williams’, Transco’s, and NWP’s ability to conduct business.
•An impairment of Williams’ assets, including property, plant, and equipment, intangible assets, and/or equity-method investments, could reduce Williams’ earnings.
•Increasing scrutiny and changing expectations from stakeholders with respect to environmental, social and governance practices may impose additional costs or risks.
•Williams, Transco, and NWP may be subject to physical and financial risks associated with climate change.
•Williams’, Transco’s, and NWP’s operations are subject to operational hazards that might result in unforeseen interruptions.
•Williams’, Transco’s, and NWP’s assets and operations, as well as their customers’ assets and operations, can be adversely affected by weather and other natural phenomena.
•Williams’, Transco’s, and NWP’s businesses could be negatively impacted by acts of terrorism and related disruptions.
•A breach of information technology infrastructure, including a breach caused by a cybersecurity attack on Williams, Transco, or NWP, or the third parties with whom they are interconnected, may interfere with the safe operation of assets, result in the disclosure of personal or proprietary information, and cause reputational harm.
•If third-party pipelines and other facilities interconnected to Williams’, Transco’s, and NWP’s pipelines and facilities become unavailable to transport natural gas and NGLs or to treat natural gas, as applicable, Williams’, Transco’s, and NWP’s revenues could be adversely affected.
•Williams’ operating results for certain components of its business might fluctuate on a seasonal basis.
•Williams, Transco, and NWP do not own all of the land on which their pipelines and facilities are located, which could disrupt operations.
•Williams’ business could be negatively impacted as a result of stockholder activism.
•Williams’ costs and funding obligations for defined benefit pension plans and other postretirement benefit plans, and Transco’s and NWP’s allocations regarding the same, are affected by factors beyond Williams’ control.
Risks Related to Financing
•A downgrade of Williams’, Transco’s, and NWP’s credit ratings, which are determined outside of their control by independent third parties, could impact liquidity, access to capital, and costs of doing business, and the ability of Transco and NWP to obtain credit in the future could be affected by Williams’ credit ratings.
•Difficult conditions in the global financial markets and the economy in general could negatively affect Williams’, Transco’s, and NWP’s businesses and results of operations.
•Restrictions in Williams’, Transco’s, and NWP’s debt agreements and the amount of indebtedness may affect future financial and operating flexibility.
•Changes to interest rates or increases in interest rates could adversely impact Williams’, Transco’s, and NWP’s access to credit, share price and ability to issue securities or incur debt for acquisitions or other purposes, as applicable, and Williams’ ability to make cash dividends at intended levels.
•Williams’ hedging activities might not be effective and could increase the volatility of Williams’ results.
•Access to capital could be affected by financial institutions’ policies concerning fossil-fuel related businesses.
•Williams can exercise substantial control over Transco’s and NWP’s distribution policies, businesses and operations and may do so in a manner that is adverse to Transco’s and NWP’s interests.
Risks Related to Regulations
•The operation of Williams’, Transco’s, and NWP’s businesses might be adversely affected by regulatory proceedings, changes in government regulations or in their interpretation or implementation, or the introduction of new laws or regulations applicable to Williams’, Transco’s, and NWP’s businesses or customers.
•The natural gas sales, transportation, and storage operations of Williams’, Transco’s, and NWP’s natural gas pipelines are subject to regulation by the FERC, which could have an adverse impact on their ability to establish transportation and storage rates that would allow them to recover the full cost of operating their respective pipelines and storage assets, including a reasonable rate of return.
•Williams’, Transco’s, and NWP’s operations are subject to environmental laws and regulations, including laws and regulations relating to climate change and greenhouse gas emissions, which may expose them to significant costs, liabilities, and expenditures that could exceed expectations.
General Risk Factors
•Williams, Transco, and NWP do not insure against all potential risks and losses and could be seriously harmed by unexpected liabilities or by the inability of insurers to satisfy claims.
•Failure to attract and retain an appropriately qualified workforce could negatively impact Williams’, Transco’s, and NWP’s results of operations.
•Holders of Williams’ common stock may not receive dividends in the amount expected or any dividends.
Risk Factors
Risks Related to Business
The business, operating results, and financial condition of Williams’, Transco’s, and NWP’s natural gas transportation and midstream businesses are dependent on the continued availability of natural gas supplies in the supply basins and demand for those supplies in the markets that they serve.
The ability of Williams, Transco, and NWP to maintain and expand their natural gas transportation and midstream businesses depends on the level of drilling and production, predominantly by third parties, in the supply basins near Williams’, Transco’s, and NWP’s pipelines and gathering systems. Production from existing wells and natural gas supply basins with access to Williams’, Transco’s, and NWP’s pipeline and gathering systems will naturally decline over time. The amount of natural gas reserves underlying these existing wells may also be less than anticipated, and the rate at which production from these reserves declines may be greater than anticipated. Williams, Transco, and NWP do not obtain independent evaluations of natural gas reserves, and thus, do not have independent estimates of total reserves dedicated to, or the anticipated life of reserves connected to, Williams’, Transco’s, and NWP’s systems and processing facilities. In addition, low prices for natural gas, regulatory limitations, including permitting and environmental regulations, or the lack of available capital have, and may continue to, adversely affect the development and production of existing or additional natural gas reserves, the installation of gathering, storage, and pipeline transportation facilities, and the import and export of natural gas suppliers. Localized low natural gas prices in one or more of the existing supply basins connected to Williams, Transco, or NWP, whether caused by a lack of infrastructure or otherwise, could also result in depressed natural gas production in such basins and limit the supply of natural gas available. The competition for natural gas supplies to serve other markets could also reduce the amount of natural gas supply for customers. A failure to obtain access to sufficient natural gas supplies will adversely impact Williams’, Transco’s, and NWP’s ability to maximize the capacities of their gathering, transportation, and processing facilities, as applicable.
Demand for Williams’, Transco’s, and NWP’s services is dependent on the demand for gas in the markets served. Demand for natural gas can be affected by weather, future industrial and economic conditions, fuel conservation measures, alternative fuel sources such as electricity, coal, fuel oils, or nuclear energy, technological advances in fuel economy, energy generation, and renewable sources of energy, and governmentally imposed constraints, such as prohibitions on natural gas hookups in newly constructed buildings, all of which are matters beyond Williams’, Transco’s, and NWP’s control.
A failure to obtain access to sufficient natural gas supplies or a reduction in demand for services in the markets served by Williams, Transco, and NWP could result in impairments of Williams’ assets and have a material adverse effect on Williams’, Transco’s, and NWP’s businesses, financial condition, results of operations, and cash flows.
Prices for natural gas, NGLs, oil, and other commodities are volatile, and this volatility has and could continue to adversely affect Williams’ financial condition, results of operations, cash flows, access to capital, and ability to maintain or grow its business.
Williams’ revenues, operating results, future rate of growth, and the value of certain components of its business depend primarily upon the prices of natural gas, NGLs, oil, or other commodities, and the differences between prices of these commodities, and could be materially adversely affected by an extended period of low commodity prices or a decline in commodity prices. Price volatility has and could continue to impact both the amount Williams receives for products and services and the volume of products and services sold. Prices affect the amount of cash flow available for capital expenditures and Williams’ ability to borrow money or raise additional capital. Price volatility has had, and could continue to have, an adverse effect on Williams’ business, results of operations, financial condition, and cash flows.
The markets for natural gas, NGLs, oil, and other commodities are likely to continue to be volatile. Wide fluctuations in prices might result from one or more factors beyond Williams’ control, including:
•Imbalances in supply and demand whether rising from worldwide or domestic supplies of and demand for natural gas, NGLs, oil, and related commodities;
•Geopolitical turmoil in the Middle East, Eastern Europe, and other producing regions;
•The activities of OPEC and other countries, whether acting independently of or informally aligned with OPEC, which have significant oil, natural gas, or other commodity production capabilities, including Russia;
•The level of consumer demand;
•The price and availability of other types of fuels or feedstocks;
•The availability of pipeline capacity;
•Supply disruptions, including plant outages and transportation disruptions;
•The price and quantity of foreign imports and domestic exports of natural gas and oil;
•Domestic and foreign governmental regulations and taxes; and
•The credit of participants in the markets where products are bought and sold.
Significant prolonged changes in natural gas prices could affect supply and demand for Transco and NWP and cause a reduction in or termination of their long-term transportation and storage contracts or throughput on their systems.
Higher natural gas prices over the long term could result in a decline in the demand for natural gas and, therefore, in Transco’s and NWP’s long-term transportation and storage contracts or throughput on their systems. Also, lower natural gas prices over the long term could result in a decline in the production of natural gas, resulting in reduced contracts or throughput on their systems. As a result, significant prolonged changes in natural gas prices could have a material adverse effect on Transco’s and NWP’s businesses, financial condition, results of operations, and cash flows.
Williams, Transco, and NWP are exposed to the credit risk of customers and counterparties, and credit risk management will not be able to completely eliminate such risk.
Williams, Transco, and NWP are subject to the risk of loss resulting from nonpayment and/or nonperformance by customers and counterparties in the ordinary course of business. Generally, Williams’, Transco’s, and NWP’s customers are rated investment grade, are otherwise considered creditworthy, are required to make prepayments or provide security to satisfy credit concerns, or are dependent upon Williams, Transco or NWP, in some cases without a readily available alternative, to provide necessary services. However, Williams’, Transco’s, and NWP’s credit
procedures and policies cannot completely eliminate customer and counterparty credit risk. Williams’, Transco’s, and NWP’s customers and counterparties include industrial customers, local distribution companies, natural gas producers, and marketers whose creditworthiness may be suddenly and disparately impacted by, among other factors, commodity price volatility, deteriorating energy market conditions, and public and regulatory opposition to energy producing activities. In a low commodity price environment, certain customers have been or could be negatively impacted, causing them significant economic stress resulting, in some cases, in a customer bankruptcy filing or an effort to renegotiate contracts. To the extent one or more of Williams’, Transco’s, or NWP’s key customers commences bankruptcy proceedings, the contracts with such customers may be subject to rejection under applicable provisions of the United States Bankruptcy Code or may be renegotiated. Further, during any such bankruptcy proceeding, prior to assumption, rejection, or renegotiation of such contracts, the bankruptcy court may temporarily authorize the payment of value for services less than contractually required, which could have a material adverse effect on Williams’, Transco’s, and NWP’s businesses, results of operations, cash flows, and financial condition. If Williams, Transco, and NWP fail to adequately assess the creditworthiness of existing or future customers and counterparties or otherwise do not take sufficient mitigating actions, including obtaining sufficient collateral, deterioration in their creditworthiness and any resulting increase in nonpayment and/or nonperformance by them could cause Williams, Transco, or NWP to write down or write off accounts receivable. Such write-downs or write-offs could negatively affect Williams’, Transco’s, or NWP’s operating results for the period in which they occur, and, if significant, could have a material adverse effect on Williams’, Transco’s, or NWP’s businesses, financial condition, results of operations, and cash flows.
Williams, Transco, and NWP face opposition to the operation and expansion of pipelines and facilities from various individuals and groups.
Williams, Transco, and NWP have experienced, and anticipate continuing to face, opposition to the operation and expansion of pipelines and facilities from governmental officials, environmental groups, landowners, tribal groups, local groups, and other advocates. In some instances, Williams, Transco, and NWP encounter opposition that disfavors hydrocarbon-based energy supplies regardless of practical implementation or financial considerations. Opposition to operation and expansion can take many forms, including the delay or denial of required governmental permits, organized protests, attempts to block or sabotage operations, intervention in regulatory or administrative proceedings involving assets, or lawsuits or other actions designed to prevent, disrupt, or delay the operation or expansion of assets and business. In addition, acts of sabotage or eco-terrorism could cause significant damage or injury to people, property, or the environment or lead to extended interruptions of operations. Any such event that delays or prevents the expansion of Williams’, Transco’s, or NWP’s businesses, that interrupts the revenues generated by operations, or that causes significant expenditures not covered by insurance, could adversely affect Williams’, Transco’s, and NWP’s financial condition and results of operations.
Williams, Transco, and NWP may not be able to grow or effectively manage growth.
As part of Williams’ growth strategy, Williams considers acquisition opportunities. Suitable acquisition candidates or assets may not be available on terms and conditions Williams finds acceptable or, where multiple parties are trying to acquire an acquisition candidate or assets, Williams may not be chosen as the acquirer. If Williams is able to acquire a targeted business, Williams may not be able to successfully integrate the acquired businesses and realize anticipated benefits in a timely manner.
Additionally, as part of Williams’, Transco’s, and NWP’s growth strategy, Williams, Transco, and NWP engage in significant capital projects and have both a project lifecycle process and an investment evaluation process. These are the processes used to identify, evaluate, and execute on capital projects, and the investment evaluation process is used by Williams’ to identify, evaluate, and execute on acquisitions. Williams, Transco, and NWP may not always have sufficient and accurate information to identify and value potential opportunities and risks or the investment evaluation process may be incomplete or flawed. Growth may also be dependent upon the construction of new natural gas gathering, transportation, compression, processing, or treating pipelines and facilities, NGL transportation, or fractionation or storage facilities as well as the expansion of existing facilities. Additional risks associated with construction may include the inability to obtain rights-of-way, skilled labor, equipment, materials, permits, and other required inputs in a timely manner such that projects are completed, on time or at all, and the risk that construction cost overruns, including due to inflation or the imposition of tariffs on foreign-made materials and
goods (including steel and steel pipes) necessary to conduct business, could cause total project costs to exceed budgeted costs. Additional risks associated with growing the business include, among others, that:
•Changing circumstances and deviations in variables could negatively impact the investment analysis, including projections of revenues, earnings, and cash flow relating to potential investment targets, resulting in outcomes that are materially different than anticipated;
•Williams, Transco, or NWP could be required to contribute additional capital to support acquired businesses or assets, and Williams, Transco, or NWP may assume liabilities that were not disclosed, exceed estimates and for which contractual protections are either unavailable or prove inadequate;
•Acquisitions could disrupt ongoing business, distract management, divert financial and operational resources from existing operations, and make it difficult to maintain current business standards, controls, and procedures;
•Acquisitions and capital projects may require substantial new capital, including the issuance of debt or equity, and Williams, Transco, or NWP may not be able to access credit or capital markets or obtain acceptable terms.
If realized, any of these risks could have an adverse impact on Williams’, Transco’s, and NWP’s financial condition, results of operations, including the possible impairment of assets, or cash flows.
The energy industry is highly competitive, and increased competitive pressure could adversely affect Williams’, Transco’s, and NWP’s businesses and operating results.
Williams has numerous competitors in all aspects of its businesses, and additional competitors may enter its markets. Any current or future competitor that delivers natural gas, NGLs, or other commodities into the areas that Williams operates could offer transportation services that are more desirable to shippers than those Williams provides because of price, location, facilities, or other factors. In addition, current or potential competitors may make strategic acquisitions or have greater financial resources, which could affect Williams’ ability to make strategic investments or acquisitions. Competitors may be able to respond more quickly to new laws or regulations or emerging technologies or to devote greater resources to the construction, expansion, or refurbishment of their facilities. Further, natural gas also competes with other forms of energy available to customers, including electricity, coal, fuel oils, and other alternative energy sources. Failure to successfully compete against current and future competitors could have a material adverse effect on Williams’ business, results of operations, financial condition, and cash flows.
Similarly, Transco and NWP compete primarily with other interstate pipelines and storage facilities in the transportation and storage of natural gas. The principal elements of competition among interstate natural gas transportation and storage assets are rates, terms of service, access to natural gas supplies, flexibility, and reliability. Although most of Transco’s and NWP’s current capacity is fully contracted, the FERC has taken certain actions to strengthen market forces in the interstate natural gas pipeline industry that have led to increased competition throughout the industry. Similarly, a highly liquid competitive commodity market in natural gas, and increasingly competitive markets for natural gas services, including competitive secondary markets in pipeline capacity, have developed. As a result, pipeline capacity is being used more efficiently, and peaking and storage services are increasingly effective substitutes for annual pipeline capacity. As a result, Transco and NWP could experience some “turnback” of firm capacity as the primary terms of existing agreements expire. If Transco and NWP are unable to remarket this capacity or can remarket it only at substantially discounted rates compared to previous contracts, they or their remaining customers, may have to bear the costs associated with the turned back capacity. Moreover, Williams and its other affiliates may not be limited in their ability to compete with Transco and NWP.
Additionally, some of Transco’s and NWP’s competitors may have greater financial resources and access to greater supplies of natural gas than they do. Some of these competitors may expand or construct transportation and storage systems that would create additional competition for natural gas supplies or the services provided to customers. In a number of key markets, interstate pipelines are now facing competitive pressure from other major pipeline systems, enabling local distribution companies and end users to choose a transmission provider based on considerations other than location. Other entities could construct new pipelines or expand existing pipelines that could potentially serve the same markets as Transco’s and NWP’s pipeline systems. Any such new pipelines could
offer transportation services that are more desirable to shippers because of locations, facilities, or other factors. These new pipelines could charge rates or provide service to locations that would result in greater net profit for shippers and producers, and thereby force Transco and NWP to lower the rates charged for service on their pipelines to extend existing transportation service agreements or to attract new customers. Transco and NWP are aware of proposals by competitors to expand pipeline capacity in certain markets Transco and NWP also serve, which, if the proposed projects proceed, could increase the competitive pressure upon Transco and NWP. Transco and NWP may not be able to successfully compete against current and future competitors and any failure to do so could have a material adverse effect on Transco’s and NWP’s businesses, financial condition, results of operations, and cash flows.
Williams does not own 100 percent of the equity interests of certain subsidiaries, including the nonconsolidated entities, which may limit its ability to operate and control these subsidiaries. Certain operations, including the nonconsolidated entities, are conducted through arrangements that may limit Williams’ ability to operate and control these operations.
The operations of Williams’ current non-wholly owned subsidiaries are conducted in accordance with their organizational documents. Williams anticipates that it will enter into more such arrangements, including through new joint venture structures. Williams may have limited operational flexibility in such current and future arrangements and may not be able to control the timing or amount of cash distributions received. In certain cases:
•Williams cannot control the amount of cash reserves determined to be necessary to operate the business, which reduces cash available for distributions;
•Williams cannot control the amount of capital expenditures that it is required to fund, and Williams is dependent on third parties to fund their required share of capital expenditures;
•Williams may be subject to restrictions or limitations on its ability to sell or transfer its interests in the jointly owned assets;
•Williams may be forced to offer rights of participation to other joint venture participants in the area of mutual interest;
•Williams has limited ability to influence or control certain day to day activities affecting the operations; and
•Williams may have additional obligations, such as required capital contributions that are important to the success of the operations.
In addition, conflicts of interest may arise between Williams, on the one hand, and other interest owners, on the other hand. If such conflicts of interest arise, Williams may not have the ability to control the outcome with respect to the matter in question. Disputes between Williams and other interest owners may also result in delays, litigation, or operational impasses.
The risks described above or the failure to continue such arrangements could adversely affect Williams’ ability to conduct the operations that are the subject of such arrangements which could, in turn, negatively affect Williams’ business, growth strategy, financial condition, and results of operations.
Williams, Transco, and NWP may not be able to replace, extend, or add additional customer contracts or contracted volumes on favorable terms, or at all, as applicable, which could affect Williams’, Transco’s, and NWP’s financial condition and ability to grow, as well as the amount of cash available to Williams to pay dividends.
Williams, Transco, and NWP rely on a limited number of customers and producers for a significant portion of revenues and supply of natural gas and NGLs, as applicable. Although many of Williams’, Transco’s, and NWP’s customers and suppliers are subject to long-term contracts, if Williams, Transco, and NWP are unable to replace or extend such contracts, add additional customers, or otherwise increase the contracted volumes of natural gas provided to it by current producers, in each case on favorable terms, if at all, Williams’, Transco’s, and NWP’s businesses, financial condition, results of operations, and cash flows, as well as Williams’ growth plans and the amount of cash available to pay dividends could be materially adversely affected.
Williams’, Transco’s, and NWP’s ability to replace, extend, or add additional customer or supplier contracts, or increase contracted volumes of natural gas from current producers, on favorable terms, or at all, is subject to a number of factors, some of which are beyond their control, including:
•The level of existing and new competition in Williams’, Transco’s, and NWP’s businesses or from alternative sources, such as electricity, renewable resources, coal, fuel oils, or nuclear energy;
•General economic, financial markets, and industry conditions;
•The effects of regulation on Williams, Transco, and NWP, their customers, and their contracting practices;
•Williams’, Transco’s, and NWP’s ability to understand their customers’ expectations, efficiently and reliably deliver high quality services, and effectively manage customer relationships. The results of these efforts will impact Williams’, Transco’s, and NWP’s reputation and positioning in the market.
In addition, Williams’ markets are affected by natural gas and NGL prices, demand, availability, and margins. Higher prices for energy commodities related to Williams’ businesses could result in a decline in the demand for those commodities and, therefore, in customer contracts or throughput on the pipeline systems. Lower energy commodity prices could negatively impact the ability to maintain or achieve favorable contractual terms, including pricing, and could also result in a decline in the production of energy commodities resulting in reduced customer contracts, supply contracts, and throughput on the pipeline systems.
Certain of Williams’, Transco’s, and NWP’s natural gas pipeline services are subject to long-term, fixed-price contracts that are not subject to adjustment, even if the cost to perform such services exceeds the revenues received from such contracts.
Williams’, Transco’s, and NWP’s natural gas pipelines provide some services pursuant to long-term, fixed-price contracts. It is possible that costs to perform services under such contracts will exceed the revenues collected. Although other services are priced at cost-based rates that are subject to adjustment in rate cases, under FERC policy, a regulated service provider and a customer may mutually agree to sign a contract for service at a “negotiated rate” that may be above or below the FERC regulated cost-based rate for that service. These “negotiated rate” contracts are not generally subject to adjustment for increased costs that could be produced by inflation or other factors relating to the specific facilities being used to perform the services.
Further, the costs of testing, maintaining, or repairing regulated facilities for Williams, Transco, and NWP may exceed Williams’, Transco’s and NWP’s expectations, and the FERC may not allow, or competition in the markets may prevent, recovery of such costs in the rates charged for applicable services at Williams’, Transco’s, and NWP’s regulated pipelines and facilities. Williams, Transco and NWP have experienced and could experience in the future unexpected leaks or ruptures on their regulated natural gas pipeline systems or storage facilities. Either as a preventative measure or in response to a leak or another issue, Williams, Transco and NWP could be required by regulatory authorities to test or undertake modifications to their regulated systems. If the cost of testing, maintaining, or repairing regulated facilities exceeds expectations, and the FERC does not allow recovery, or competition in the markets prevents recovering such costs in the rates charged for Williams’, Transco’s and NWP’s regulated services, such costs could have a material adverse impact on Williams’, Transco’s and NWP’s businesses, financial condition, results of operation, and cash flows.
Some of Williams’, Transco’s, and NWP’s businesses are exposed to supplier concentration risks arising from dependence on a single or a limited number of suppliers.
Some of Williams’, Transco’s, and NWP’s businesses may be dependent on a small number of suppliers for the delivery of critical goods or services. If a supplier on which one of the businesses depends were to fail to timely supply required goods and services, such business may not be able to replace such goods and services in a timely manner or otherwise on favorable terms or at all. If Williams’, Transco’s, and NWP’s businesses are unable to adequately diversify or otherwise mitigate such supplier concentration risks, and such risks were realized, such businesses could be subject to reduced revenues and increased expenses, which could have a material adverse effect on Williams’, Transco’s, and NWP’s financial condition, results of operations, and cash flows.
Transco and NWP depend on certain key customers for a significant portion of their revenues. The loss of any of these key customers or the loss of any contracted volumes could result in a decline in Transco’s and NWP’s respective businesses.
Transco and NWP rely on a limited number of customers for a significant portion of their revenues. Although some of these customers are subject to long-term contracts, Transco and NWP may be unable to negotiate extensions or replacements of these contracts on favorable terms, or at all. For the year ended December 31, 2024, Transco’s largest customer was Dominion Energy, Inc., which accounted for approximately 7 percent of its operating revenue, and NWP’s largest customer was Puget Sound Energy, Inc., which accounted for approximately 31 percent of its operating revenue. The loss of all, or even a portion of, the revenues from contracted volumes supplied by Transco’s and NWP’s key customers, as a result of competition, creditworthiness, inability to negotiate extensions or replacements of contracts, or otherwise, could have a material adverse effect on their businesses, financial condition, results of operations, and cash flows. For more information regarding Transco’s and NWP’s customer revenues, please read Note 16 – Fair Value Measurements, Guarantees, and Concentration of Credit Risk.
Failure of service providers or disruptions to outsourcing relationships might negatively impact Williams’, Transco’s, and NWP’s ability to conduct their businesses.
Transco and NWP rely on Williams and other third parties for certain services necessary for Transco and NWP to be able to conduct business. Certain of Williams’ accounting and information technology services, which are relied upon by Transco and NWP, are currently provided by third-party vendors, and sometimes from service centers outside of the United States. Services provided pursuant to these arrangements could be disrupted. Similarly, the expiration of agreements associated with such arrangements or the transition of services between providers could lead to loss of institutional knowledge or service disruptions. Williams’ reliance on others as service providers, and Transco’s and NWP’s reliance on Williams’ reliance on others as service providers, could have a material adverse effect on Williams’, Transco’s, and NWP’s businesses, financial condition, results of operations, and cash flows.
An impairment of Williams’ assets, including property, plant, and equipment, intangible assets, and/or equity-method investments, could reduce Williams’ earnings.
GAAP requires Williams to test certain assets for impairment on either an annual basis or when events or circumstances occur which indicate that the carrying value of such assets might be impaired. The outcome of such testing could result in impairments of Williams’ assets including property, plant, and equipment, intangible assets, and/ or equity-method investments. Additionally, any asset monetizations could result in impairments if any assets are sold or otherwise exchanged for amounts less than their carrying value. If Williams determines that an impairment has occurred, Williams would be required to take an immediate noncash charge to earnings.
Increasing scrutiny and changing expectations from stakeholders with respect to environmental, social and governance practices may impose additional costs or risks.
Companies across all industries are facing increasing scrutiny from stakeholders related to their environmental, social and governance (“ESG”) practices. Investor advocacy groups, institutional investors, investment funds and other influential investors are also increasingly focused on ESG practices and in recent years have placed increasing importance on the implications and social cost of their investments. Regardless of the industry, investors’ increased focus and activism related to ESG (as proponents or opponents) and similar matters may hinder access to capital, as investors may decide to reallocate capital or to not commit capital as a result of their assessment of a company’s ESG practices. Companies that do not adapt to or comply with investor or other stakeholder expectations and standards, which are evolving, or that are perceived to have not responded appropriately to the concern for ESG issues, regardless of whether there is a legal requirement to do so, may suffer from reputational damage, and the business, financial condition, and/or stock price of such a company could be materially and adversely affected.
Williams, Transco, and NWP face pressures from their stakeholders, who are increasingly focused on climate change, to prioritize sustainable energy practices, reduce carbon footprint, and promote sustainability. Williams’ stockholders may require Williams to implement ESG procedures or standards to continue engaging with Williams, to remain invested in Williams, or before they may make further investments in Williams. Additionally, Williams, Transco, and NWP may face reputational challenges in the event their ESG procedures or standards do not meet the standards set by certain constituencies. Williams, Transco, and NWP adopted certain practices as highlighted in Williams’ 2023 Sustainability Report, including with respect to air emissions, biodiversity and land use, climate
change, and environmental stewardship. It is possible, however, that Williams’, Transco’s, and NWP’s stakeholders might not be satisfied with these sustainability efforts or the speed of their adoption. If Williams, Transco and NWP do not meet stakeholders’ expectations, Williams’, Transco’s, and NWP’s businesses, ability to access capital, and/or Williams’ stock price could be harmed.
Additionally, adverse effects upon the oil and gas industry related to the worldwide social and political environments, including uncertainty or instability resulting from climate change, changes in political leadership and environmental policies, changes in geopolitical-social views toward fossil fuels and renewable energy, concern about the environmental impact of climate change, and investors’ expectations regarding ESG matters, may also adversely affect demand for Williams’, Transco’s, and NWP’s services. Any long-term material adverse effect on the oil and gas industry could have a significant financial and operational adverse impact on Williams’, Transco’s, and NWP’s businesses.
The occurrence of any of the foregoing could have a material adverse effect on the price of Williams’ stock and Williams’, Transco’s, and NWP’s businesses and financial condition.
Williams, Transco, and NWP may be subject to physical and financial risks associated with climate change.
The threat of global climate change may create physical and financial risks to Williams’, Transco’s, and NWP’s businesses. Energy needs vary with weather conditions. To the extent weather conditions may be affected by climate change, energy use could increase or decrease depending on the duration and magnitude of any changes. Increased energy use due to weather changes may require Williams, Transco, and NWP to invest in more pipelines and other infrastructure to serve increased demand. A decrease in energy use due to weather changes may affect Williams’, Transco’s, and NWP’s financial condition through decreased revenues. Extreme weather conditions in general require more system backup, adding to costs, and can contribute to increased system stresses, including service interruptions. Weather conditions outside of Williams’, Transco’s, and NWP’s operating territory could also have an impact on their revenues. To the extent the frequency of extreme weather events increases, this could increase the cost of providing service. Williams, Transco, and NWP may not be able to pass on the higher costs to customers or recover all costs related to mitigating these physical risks.
Additionally, many climate models indicate that global warming is likely to result in rising sea levels and increased frequency and severity of weather events, which may lead to higher insurance costs, or a decrease in available coverage, for Williams’, Transco’s, and NWP’s assets in areas subject to severe weather. These climate-related changes could damage physical assets, especially operations located in low-lying areas near coasts and river banks, and facilities situated in hurricane-prone and rain-susceptible regions.
To the extent financial markets view climate change and greenhouse gas (“GHG”) emissions as a financial risk, this could negatively impact Williams’, Transco’s, and NWP’s cost of and access to capital. Climate change and GHG regulation could also reduce demand for Williams’, Transco’s, and NWP’s services. The business could also be affected by the potential for lawsuits against GHG emitters, based on links drawn between GHG emissions and climate change.
Williams’, Transco’s, and NWP’s operations are subject to operational risks and hazards that might result in accidents and unforeseen interruptions.
There are operational risks and hazards associated with the gathering, transporting, storage, processing, and treating of natural gas, the fractionation, transportation, and storage of NGLs, and crude oil transportation and production handling, including:
•Aging infrastructure and mechanical problems;
•Damages to pipelines and pipeline blockages or other pipeline interruptions;
•Uncontrolled releases of natural gas (including sour gas), NGLs, crude oil, or other products;
•Collapse or failure of storage facilities or caverns, as applicable;
•Operator error;
•Damage caused by third-party activity, such as operation of construction equipment;
•Pollution and other environmental risks;
•Fires, explosions, craterings, and blowouts;
•Security risks, including cybersecurity;
•Operating in a marine environment, as applicable.
Any of these risks could result in loss of human life, personal injuries, significant damage to property, environmental pollution, impairment of operations, loss of services to customers, reputational damage, and substantial losses to Williams, Transco, and NWP. The location of certain segments of Williams’, Transco’s, and NWP’s facilities in or near populated areas, including residential areas, commercial business centers, and industrial sites, could increase the level of damage resulting from these risks. An event such as those described above could have a material adverse effect on Williams’, Transco’s, and NWP’s financial condition and results of operations, particularly if the event is not fully covered by insurance.
Williams’, Transco’s, and NWP’s assets and operations, as well as their customers’ assets and operations, can be adversely affected by weather and other natural phenomena.
Williams’, Transco’s, and NWP’s assets and operations, especially those located offshore, and their customers’ assets and operations can be adversely affected by hurricanes, floods, earthquakes, landslides, tornadoes, fires, and other natural phenomena and weather conditions, including extreme or unseasonable temperatures, making it more difficult for Williams, Transco, and NWP to realize the historic rates of return associated with their assets and operations. A significant disruption in Williams’, Transco’s, and NWP’s or their customers’ operations or the occurrence of a significant liability for which Williams, Transco, and NWP are not fully insured could have a material adverse effect on their businesses, financial condition, results of operations, and cash flows.
Williams’, Transco’s, and NWP’s businesses could be negatively impacted by acts of terrorism and related disruptions.
Given the volatile nature of the commodities Williams, Transco, and NWP transport, process, store, and sell, their assets and the assets of their customers and others in the industry may be targets of terrorist activities. Uncertainty surrounding the Russian invasion of Ukraine, conflicts in the Middle East, or other sustained military campaigns, may affect Williams’, Transco’s, and NWP’s operations in unpredictable ways, including the possibility that infrastructure facilities could be direct targets of, or indirect casualties of, an act of terrorism. A terrorist attack could create significant price volatility, disrupt business, limit access to capital markets, or cause significant harm to operations, such as full or partial disruption to Williams’, Transco’s, and NWP’s ability to produce, process, transport, or distribute natural gas, NGLs, or other commodities, as applicable. Acts of terrorism, as well as events occurring in response to or in connection with acts of terrorism, could cause environmental repercussions that could result in a significant decrease in revenues or significant reconstruction or remediation costs, which could have a material adverse effect on Williams’, Transco’s, and NWP’s businesses, financial condition, results of operations, and cash flows.
A breach of information technology infrastructure, including a breach caused by a cybersecurity attack on Williams, Transco, or NWP, or the third parties with whom they are interconnected, may interfere with the safe operation of assets, result in the disclosure of personal or proprietary information, and cause reputational harm.
Williams relies on its information technology infrastructure to process, transmit, and store electronic information, including information used to safely operate Williams’, Transco’s, and NWP’s assets. Transco and NWP rely on Williams for their information technology infrastructure. The Williams Board of Directors has oversight responsibility with regard to cybersecurity risks, and reviews management’s efforts to address and mitigate cybersecurity risks, including the establishment and implementation of policies to address cybersecurity threats. Williams has invested, and expects to continue to invest, significant time, manpower, and capital in its information technology infrastructure. However, the age, operating systems, or condition of the current information technology infrastructure and software assets and the ability to maintain and upgrade such assets could affect Williams’, and thus Transco’s and NWP’s, ability to resist cybersecurity threats. While Williams believes that it maintains appropriate information security policies, practices, and protocols, Williams regularly faces cybersecurity and other security threats to its information technology infrastructure, including risks that may be enhanced through the use of artificial intelligence, which could include threats to operational industrial control systems and safety systems that
operate its pipelines, plants, and assets. Williams faces unlawful attempts to gain access to its information technology infrastructure, including coordinated attacks from hackers, whether state-sponsored groups, “hacktivists”, or private individuals. Williams faces the threat of theft and misuse of sensitive data and information, including customer and employee information. Williams also faces attempts to gain access to information related to its assets through attempts to obtain unauthorized access by targeting acts of deception against individuals with legitimate access to physical locations or information. Williams is also subject to cybersecurity risks arising from the fact that Williams’, Transco’s, and NWP’s business operations are interconnected with third parties, including third-party pipelines, other facilities and contractors and vendors. In addition, the breach of certain business systems could affect Williams’ ability to correctly record, process, and report financial information. Breaches in Williams’, Transco’s, and NWP’s information technology infrastructure or physical facilities, or other disruptions including those arising from theft, vandalism, fraud, or unethical conduct, which may increase as a result of the Russian invasion of Ukraine or other geopolitical tensions and conflicts, could result in damage to or destruction of assets, unnecessary waste, safety incidents, damage to the environment, reputational damage, potential liability, the loss of contracts, the imposition of significant costs associated with remediation and litigation, heightened regulatory scrutiny, increased insurance costs, and have a material adverse effect on Williams’, Transco’s, and NWP’s operations, financial condition, results of operations, and cash flows.
If third-party pipelines and other facilities interconnected to Williams’, Transco’s, and NWP’s pipelines and facilities become unavailable to transport natural gas and NGLs or to treat natural gas, as applicable, Williams’, Transco’s, and NWP’s revenues could be adversely affected.
Williams, Transco, and NWP depend upon third-party pipelines and other facilities that provide delivery options to and from their pipelines and storage facilities for the benefit of their customers. Because Williams, Transco, and NWP do not own these third-party pipelines or other facilities, their continuing operation is not within Williams’, Transco’s or NWP’s control. If these pipelines or facilities were to become temporarily or permanently unavailable for any reason, or if throughput were reduced because of testing, line repair, damage to pipelines or facilities, reduced operating pressures, lack of capacity, increased credit requirements or rates charged by such pipelines or facilities or other causes, Williams, Transco, and NWP and their customers would have reduced capacity to transport, store, or deliver natural gas or NGL products to end use markets or to receive deliveries of mixed NGLs, as applicable, thereby reducing revenues. Any temporary or permanent interruption at any key pipeline interconnection or in operations on third-party pipelines or facilities that would cause a material reduction in volumes transported on Williams’, Transco’s, or NWP’s pipelines or gathering systems, as applicable, or processed, fractionated, treated, or stored at Williams’, Transco’s, or NWP’s facilities, as applicable, could have a material adverse effect on Williams’, Transco’s, and NWP’s businesses, financial condition, results of operations, and cash flows.
Williams’ operating results for certain components of its business might fluctuate on a seasonal basis.
Revenues from certain components of Williams’ business can have seasonal characteristics. In many parts of the country, demand for natural gas and other fuels peaks during the winter. As a result, Williams’ overall operating results in the future might fluctuate substantially on a seasonal basis. Demand for natural gas and other fuels could vary significantly from Williams’ expectations depending on the nature and location of its facilities and pipeline systems and the terms of the natural gas transportation arrangements relative to demand created by unusual weather patterns.
Williams, Transco, and NWP do not own all of the land on which their pipelines and facilities are located, which could disrupt operations.
Williams, Transco, and NWP do not own all of the land on which their pipelines and facilities have been constructed. As such, Williams, Transco, and NWP are subject to the possibility of increased costs to retain necessary land use. In those instances in which Williams, Transco and NWP do not own the land on which their facilities are located, Williams, Transco, and NWP obtain the rights to construct and operate their facilities and gathering systems on land owned by third parties and governmental agencies for a specific period of time. In addition, some of Williams’ and NWP’s facilities cross Native American lands pursuant to rights-of-way of limited terms. Williams and NWP may not have the right of eminent domain over land owned by Native American tribes. Williams’, Transco’s, and NWP’s loss of any of these rights, through their inability to renew right-of-way contracts
or otherwise, could have a material adverse effect on their businesses, financial condition, results of operations, and cash flows.
Williams’ business could be negatively impacted as a result of stockholder activism.
In recent years, stockholder activism, including threatened or actual proxy contests, has been directed against numerous public companies, including Williams. Williams was the target of a proxy contest from a stockholder activist, which resulted in Williams incurring significant costs. If stockholder activists were to again take or threaten to take actions against Williams or seek to involve themselves in the governance, strategic direction, or operations of Williams, Williams could incur significant costs as well as the distraction of management, which could have an adverse effect on Williams’ business or financial results. In addition, actions of activist stockholders may cause significant fluctuations in Williams’ stock price based on temporary or speculative market perceptions or other factors that do not necessarily reflect the underlying fundamentals and prospects of Williams’ business.
Williams’ costs and funding obligations for defined benefit pension plans and other postretirement benefit plans, and Transco’s and NWP’s allocations regarding the same, are affected by factors beyond Williams’ control.
Williams has defined benefit pension plans and other postretirement benefit plans. The timing and amount of the funding requirements under the defined benefit pension plans depend upon a number of factors that Williams’ controls, including changes to pension plan benefits, as well as factors outside of Williams’ control, such as asset returns, interest rates, and changes in pension laws. Changes to these and other factors can significantly increase Williams’ funding requirements and could have a significant adverse effect on Williams’ financial condition and results of operations.
Transco and NWP have no employees; employees of Williams and its affiliates provide services to Transco and NWP. As a result, Transco and NWP are allocated a portion of Williams’ cost for defined benefit pension plans and other postretirement benefit plans. The timing and amount of these allocations depends on factors that Williams controls, and any changes can significantly increase the allocations, which could have a significant adverse effect on Transco’s and NWP’s financial condition and results of operations.
Risks Related to Financing
A downgrade of Williams’, Transco’s, and NWP’s credit ratings, which are determined outside of their control by independent third parties, could impact their liquidity, access to capital, and costs of doing business, and the ability of Transco and NWP to obtain credit in the future could be affected by Williams’ credit ratings.
Downgrades of Williams’, Transco’s, and NWP’s credit ratings increase cost of borrowing and could require Williams, Transco, and NWP to provide collateral to their counterparties, negatively impacting available liquidity. In addition, Williams’, Transco’s, and NWP’s ability to access capital markets could be limited by the downgrading of their credit ratings.
Credit rating agencies perform independent analysis when assigning credit ratings. The analysis includes a number of criteria such as business composition, market and operational risks, as well as various financial tests.
Credit rating agencies continue to review the criteria for industry sectors and various debt ratings and may make changes to those criteria from time to time. Credit ratings are subject to revision or withdrawal at any time by the ratings agencies. As of the date of the filing of this report, Williams, Transco, and NWP have been assigned an investment-grade credit rating by the credit ratings agencies.
In addition, substantially all of Williams’ operations are conducted through its subsidiaries. Williams’ cash flows are substantially derived from loans, dividends, and distributions paid to it by its subsidiaries. Due to the relationship of Transco and NWP as subsidiaries of Williams, Transco’s and NWP’s ability to obtain credit will be affected by Williams’ credit ratings. Any downgrading of a Williams credit rating could result in a downgrading of a Transco and NWP credit rating, which could adversely affect Transco’s and NWP’s access to capital and limit their ability to obtain financing in the future upon favorable terms, if at all.
Difficult conditions in the global financial markets and the economy in general could negatively affect Williams’, Transco’s, and NWP’s businesses and results of operations.
Williams’, Transco’s, and NWP’s businesses may be negatively impacted by adverse economic conditions or future disruptions in the global financial markets. Included among these potential negative impacts are industrial or economic contraction leading to reduced energy demand and lower prices for Williams’, Transco’s, and NWP’s products and services and increased difficulty in collecting amounts owed to them by customers. Geopolitical tensions and conflicts, including those in the Middle East, as well as the ongoing Russian invasion of Ukraine and the actions undertaken by western nations in response to these conflicts, have had, and may continue to have, adverse impacts on global financial markets. If financing is not available when needed, or is available only on unfavorable terms, Williams, Transco, and NWP may be unable to implement their business plans or otherwise take advantage of business opportunities or respond to competitive pressures. In addition, financial markets have periodically been affected by concerns over U.S. fiscal and monetary policies. These concerns, as well as actions taken by the U.S. federal government in response to these concerns, could significantly and adversely impact the global and U.S. economies and financial markets, which could negatively impact Williams, Transco, and NWP in the manner described above.
Williams, Transco and NWP are party to a credit agreement with aggregate commitments available of $3.75 billion, with up to an additional $500 million increase in aggregate commitments available under certain circumstances. Transco and NWP are each subject to a $500 million borrowing sublimit. The ability of Williams, Transco, and NWP to borrow under that facility could be impaired if one or more of the lenders fails to honor its contractual obligation to lend. For more information regarding financing, please read Note 13 – Debt and Banking Arrangements.
Restrictions in Williams’, Transco’s, and NWP’s debt agreements and the amount of their indebtedness may affect their future financial and operating flexibility.
Williams’ total outstanding long-term debt (including current portion and commercial paper) as of December 31, 2024, was $26.9 billion, including the long-term debt of Transco and NWP. The total outstanding long-term debt (including current portion) as of December 31, 2024, for Transco and NWP was $5.2 billion and $582 million, respectively.
The agreements governing Williams’, Transco’s, and NWP’s indebtedness contain covenants that restrict Williams’, Transco’s, and NWP’s, as applicable, and their respective subsidiaries’, ability to incur certain liens to support indebtedness, and ability to merge or consolidate or sell all or substantially all of its respective assets in certain circumstances. In addition, certain of Williams’, Transco’s, and NWP’s debt agreements contain various covenants that restrict or limit, among other things, the ability to make certain distributions during the continuation of an event of default, and to enter into certain affiliate transactions and certain restrictive agreements. Additionally, Transco has a debt covenant in one series of its notes restricting its ability and that of its subsidiaries to guarantee certain indebtedness. Certain of Williams’, Transco’s, and NWP’s debt agreements also contain, and those Williams, Transco, and NWP enter into in the future may contain, financial covenants, and other limitations with which they will need to comply.
Williams’, Transco’s, and NWP’s debt service obligations and the covenants described above could have important consequences. For example, they could:
•Make it more difficult for Williams, Transco, and NWP to satisfy their obligations with respect to their indebtedness, which could in turn result in an event of default on such indebtedness;
•Impair Williams’, Transco’s, and NWP’s ability to obtain additional financing in the future for working capital, capital expenditures, acquisitions, general corporate purposes or limited liability company purposes, as applicable, or other purposes;
•Diminish Williams’, Transco’s, and NWP’s ability to withstand a continued or future downturn in their business or the economy generally;
•Require Williams, Transco, and NWP to dedicate a substantial portion of their cash flow from operations to debt service payments, thereby reducing the availability of cash for working capital, capital expenditures,
acquisitions, the payments of dividends, general corporate purposes or limited liability company purposes, as applicable, or other purposes;
•Limit Williams’, Transco’s, and NWP’s flexibility in planning for, or reacting to, changes in their business and the industry in which they operate, including limiting their ability to expand or pursue business activities and preventing Williams, Transco, and NWP from engaging in certain transactions that might otherwise be considered beneficial to Williams, Transco, and NWP.
Williams’, Transco’s, and NWP’s ability to comply with their debt covenants, to repay, extend, or refinance their existing debt obligations and to obtain future credit will depend primarily on their operating performance. Williams’, Transco’s, and NWP’s ability to refinance existing debt obligations or obtain future credit will also depend upon the current conditions in the credit markets and the availability of credit generally. If Williams, Transco, and NWP are unable to comply with these covenants, meet their debt service obligations, or obtain future credit on favorable terms, or at all, Williams, Transco, and NWP could be forced to restructure or refinance their indebtedness, seek additional equity capital or sell assets. Williams, Transco, and NWP may be unable to obtain financing or sell assets on satisfactory terms, or at all.
Williams’, Transco’s, and NWP’s failure to comply with the covenants in the documents governing their indebtedness could result in events of default, which could render such indebtedness due and payable. Williams, Transco, and NWP may not have sufficient liquidity to repay their indebtedness in such circumstances. In addition, cross-default or cross-acceleration provisions in each of Williams’, Transco’s, and NWP’s debt agreements could cause a default or acceleration to have a wider impact on their liquidity than might otherwise arise from a default or acceleration of a single debt instrument. For more information regarding debt agreements, please read Note 13 – Debt and Banking Arrangements.
Changes to interest rates or increases in interest rates could adversely impact Williams’, Transco’s, and NWP’s access to credit, share price, and ability to issue securities or incur debt for acquisitions or other purposes, as applicable, and Williams’ ability to make cash dividends at intended levels.
Interest rates have fluctuated in recent years but could increase in the future. As a result, interest rates on future credit facilities and debt offerings could be higher than current levels, causing Williams’, Transco’s, and NWP’s financing costs to increase accordingly. As with other yield-oriented securities, Williams’ share price will be impacted by the level of Williams’ dividends and implied dividend yield. The dividend yield is often used by investors to compare and rank yield-oriented securities for investment decision-making purposes. Therefore, changes in interest rates, either positive or negative, may affect the yield requirements of investors who invest in Williams’ shares, and a rising interest rate environment could have an adverse impact on Williams’ share price and Williams’ ability to issue equity or pay cash dividends at intended levels or Williams’, Transco’s, and NWP’s ability to incur debt.
Williams’ hedging activities might not be effective and could increase the volatility of Williams’ results.
In an effort to manage Williams’ financial exposure related to commodity price and market fluctuations, Williams has entered, and may in the future enter into contracts to hedge certain risks associated with its assets and operations. In these hedging activities, Williams has used, and may in the future use, fixed-price, forward, physical purchase, and sales contracts, futures, financial swaps, and option contracts traded in the over-the-counter markets or on exchanges. Nevertheless, no single hedging arrangement can adequately address all risks present in a given contract. For example, a forward contract that would be effective in hedging commodity price volatility risks would not hedge the contract’s counterparty credit or performance risk. Therefore, unhedged risks will always continue to exist. While Williams attempts to manage counterparty credit risk within guidelines established by its credit policy, Williams may not be able to successfully manage all credit risk and as such, future cash flows and results of operations could be impacted by counterparty default. The difference in accounting treatment for the underlying position and the financial instrument used to hedge the value of the contract can cause volatility in Williams’ reported net income while the positions are open due to mark-to-market accounting.
Access to capital could be affected by financial institutions’ policies concerning fossil fuel related businesses.
Public concern regarding the potential effects of climate change has directed increased attention towards the funding sources of fossil-fuel energy companies. As a result, certain financial institutions, funds, and other sources
of capital have restricted or eliminated their investment in certain market segments of fossil-fuel related energy. Ultimately, limiting fossil-fuel related companies’ access to capital could make it more difficult for Williams’, Transco’s, and NWP’s customers to secure funding for exploration and production activities or for Williams, Transco, and NWP to secure funding for growth projects. Such a lack of capital could also both indirectly affect demand for Williams’, Transco’s, and NWP’s services and directly affect their ability to fund construction or other capital projects.
Williams can exercise substantial control over Transco’s and NWP’s distribution policies, businesses, and operations and may do so in a manner that is adverse to Transco’s and NWP’s interests.
Because Transco and NWP are indirect wholly owned subsidiaries of Williams, Williams exercises substantial control over their businesses and operations and makes determinations with respect to, among other things, the following:
•Payment of distributions and repayment of advances;
•Decisions on financings and capital raising activities;
•Mergers or other business combinations;
•Acquisition or disposition of assets.
Williams could decide to increase distributions or advances to Transco’s and NWP’s member consistent with existing debt covenants. This could adversely affect Transco’s or NWP’s liquidity.
Risks Related to Regulations
The operation of Williams’, Transco’s, and NWP’s businesses might be adversely affected by regulatory proceedings, changes in government regulations or in their interpretation or implementation, or the introduction of new laws or regulations applicable to Williams’, Transco’s, and NWP’s businesses or customers.
Public and regulatory scrutiny of the energy industry has resulted in the proposal and/or implementation of increased regulations. Such scrutiny has also resulted in various inquiries, investigations, and court proceedings, including litigation of energy industry matters. Both the shippers on Williams’, Transco’s, and NWP’s pipelines and regulators have rights to challenge the rates charged under certain circumstances. Any successful challenge could materially affect Williams’, Transco’s, and NWP’s results of operations.
Certain inquiries, investigations, and court proceedings are ongoing. Adverse effects may continue as a result of the uncertainty of ongoing inquiries, investigations, and court proceedings, or additional inquiries and proceedings by federal or state regulatory agencies or private plaintiffs. In addition, Williams, Transco, and NWP cannot predict the outcome of any of these inquiries or whether these inquiries will lead to additional legal proceedings against them, civil or criminal fines and/or penalties, or other regulatory action, including legislation, which might be materially adverse to the operation of Williams’, Transco’s, and NWP’s businesses and results of operations or increase their operating costs in other ways. Current legal proceedings or other matters, including environmental matters, suits, regulatory appeals, and similar matters might result in adverse decisions against Williams, Transco, and NWP which, among other outcomes, could result in the imposition of substantial penalties and fines and could damage their reputation. The result of such adverse decisions, either individually or in the aggregate, could be material and may not be covered fully or at all by insurance.
In addition, existing regulations, including those pertaining to financial assurances to be provided by Williams’, Transco’s, and NWP’s businesses in respect of potential asset decommissioning and abandonment activities, might be revised, reinterpreted, or otherwise enforced in a manner that differs from prior regulatory action. New laws and regulations, including those pertaining to oil and gas hedging and cash collateral requirements, might also be adopted or become applicable to Williams, Transco, and NWP, their customers, or their business activities. If new laws or regulations are imposed relating to oil and gas extraction, or if additional or revised levels of reporting, regulation, or permitting moratoria are required or imposed, including those related to hydraulic fracturing, the volumes of natural gas and other products that Williams, Transco, and NWP transport, gather, process, and treat could decline, compliance costs could increase, and results of operations could be adversely affected.
The natural gas sales, transportation, and storage operations of Williams’, Transco’s, and NWP’s natural gas pipelines are subject to regulation by the FERC, which could have an adverse impact on their ability to establish transportation and storage rates that would allow them to recover the full cost of operating their respective pipelines and storage assets, including a reasonable rate of return.
In addition to regulation by other federal, state, and local regulatory authorities, interstate pipeline transportation and storage services and related assets are subject to regulation by the FERC. Federal regulation extends to such matters as:
•Transportation and sale for resale of natural gas in interstate commerce;
•Rates, operating terms, types of services, and conditions of service;
•Certification and construction of new interstate pipelines and storage facilities;
•Acquisition, extension, disposition, or abandonment of existing interstate pipelines and storage facilities;
•Accounts and records;
•Depreciation and amortization policies;
•Relationships with affiliated companies that are involved in marketing functions of the natural gas business;
•Market manipulation in connection with interstate sales, purchases, or transportation of natural gas.
Regulatory or administrative actions in these areas, including successful complaints or protests against the rates of the gas pipelines, can affect Williams’, Transco’s, and NWP’s businesses in many ways, including decreasing tariff rates and revenues or setting future tariff rates to levels such that revenues are inadequate to recover increases in operating costs or to sustain an adequate return on capital investments, decreasing volumes in the pipelines, increasing costs, and otherwise altering the profitability of the pipeline business.
Furthermore, Transco charges its transportation customers a separate fee to access its offshore facilities in the Gulf of America, unlike other interstate pipelines that own facilities offshore. The separate charge is referred to as an “IT feeder” charge. The “IT feeder” rate is charged only when gas is actually transported on the applicable facilities and typically it is paid by producers or marketers. Because the “IT feeder” rate is typically paid by producers and marketers, it generally results in netback prices to producers that are slightly lower than the netbacks realized by producers transporting on other interstate pipelines. This rate design disparity can result in producers bypassing Transco’s offshore facilities in favor of alternative transportation facilities.
Williams’, Transco’s, and NWP’s operations are subject to environmental laws and regulations, including laws and regulations relating to climate change and greenhouse gas emissions, which may expose them to significant costs, liabilities, and expenditures that could exceed expectations.
Williams’, Transco’s, and NWP’s operations are subject to extensive federal, state, tribal, and local laws and regulations governing environmental protection, endangered and threatened species, the discharge of materials into the environment, and the security of chemical and industrial facilities. Substantial costs, liabilities, delays, and other significant issues related to environmental laws and regulations are inherent in the gathering, transportation, storage, processing, and treating of natural gas, fractionation, transportation, and storage of NGLs, and crude oil transportation and production handling as well as waste disposal practices and construction activities, as applicable. New or amended environmental laws and regulations can also result in significant increases in capital costs incurred to comply with such laws and regulations. Failure to comply with these laws, regulations, and permits may result in the assessment of administrative, civil and/or criminal penalties, the imposition of remedial obligations, the imposition of stricter conditions on or revocation of permits, the issuance of injunctions limiting or preventing some or all operations, and delays or denials in granting permits.
Joint and several strict liability may be incurred without regard to fault under certain environmental laws and regulations, for the remediation of contaminated areas and in connection with spills or releases of materials associated with natural gas, oil, and wastes on, under, or from Williams’, Transco’s, and NWP’s properties and facilities. Private parties, including the owners of properties through which Williams’, Transco’s, and NWP’s pipeline and gathering systems pass and facilities where their wastes are taken for reclamation or disposal, may have the right to pursue legal actions to enforce compliance as well as to seek damages for noncompliance with
environmental laws and regulations or for personal injury or property damage arising from their operations. Some sites at which Williams, Transco, and NWP operate are located near current or former third-party hydrocarbon storage and processing or oil and natural gas operations or facilities, and there is a risk that contamination has migrated from those sites.
Williams, Transco, and NWP are generally responsible for all liabilities associated with the environmental condition of their facilities and assets, whether acquired or developed, regardless of when the liabilities arose and whether they are known or unknown. In connection with certain acquisitions and divestitures, Williams, Transco, and NWP could acquire, or be required to provide indemnification against, environmental liabilities that could expose them to material losses, which may not be covered by insurance. In addition, the steps Williams, Transco and NWP could be required to take to bring certain facilities into compliance could be prohibitively expensive, and Williams, Transco, and NWP might be required to shut down, divest, or alter the operation of those facilities, which might cause them to incur losses.
In addition, climate change regulations and the costs that may be associated with such regulations and with the regulation of emissions of GHGs have the potential to affect the businesses of Williams, Transco, and NWP. Regulatory actions by the Environmental Protection Agency or the passage of new climate change laws or regulations could result in increased costs to operate and maintain facilities, install new emission controls on facilities, or administer and manage any GHG emissions program. Williams, Transco, and NWP believe it is possible that future governmental legislation and/or regulation may require them either to limit GHG emissions associated with operations or to purchase allowances for such emissions. Williams, Transco, and NWP could also be subjected to a carbon tax assessed on the basis of carbon dioxide emissions or otherwise. However, Williams, Transco, and NWP cannot predict precisely what form these future regulations might take, the stringency of any such regulations or when they might become effective. Several legislative bills have been introduced in the United States Congress that would require carbon dioxide emission reductions. Previously considered proposals have included, among other things, limitations on the amount of GHGs that can be emitted (so called “caps”) together with systems of permitted emissions allowances. These proposals could require Williams, Transco, and NWP to reduce emissions or to purchase allowances for such emissions.
In addition to activities on the federal level, state and regional initiatives could also lead to the regulation of GHG emissions sooner than and/or independent of federal regulation. These regulations could be more stringent than any federal legislation that may be adopted. Future legislation and/or regulation designed to reduce GHG emissions could make some of Williams’, Transco’s, and NWP’s activities uneconomic to maintain or operate. Williams, Transco, and NWP continue to monitor legislative and regulatory developments in this area and otherwise take efforts to limit and reduce GHG emissions from their facilities. Although the regulation of GHG emissions may have a material impact on Williams’, Transco’s, and NWP’s operations and rates, Williams, Transco, and NWP believe it is premature to attempt to quantify the potential costs of the impacts.
If Williams, Transco, and NWP are unable to recover or pass through a significant level of costs related to complying with climate change regulatory requirements, it could have a material adverse effect on Williams’, Transco’s, and NWP’s results of operations and financial condition.
General Risk Factors
Williams, Transco, and NWP do not insure against all potential risks and losses and could be seriously harmed by unexpected liabilities or by the inability of their insurers to satisfy their claims.
In accordance with customary industry practice, Williams, Transco, and NWP maintain insurance against some, but not all, risks and losses, and only at levels they believe to be appropriate. The occurrence of any risks not fully covered by Williams’, Transco’s, and NWP’s insurance could have a material adverse effect on their businesses, financial condition, results of operations, and cash flows and their ability to repay debt.
Failure to attract and retain an appropriately qualified workforce could negatively impact Williams’, Transco’s, and NWP’s results of operations.
Events such as an aging workforce without appropriate replacements, mismatch of skill sets to future needs, the challenges of attracting new, qualified workers to the midstream energy industry, or unavailability of contract labor may lead to operating challenges such as lack of resources, loss of knowledge, and a lengthy time period associated
with skill development, including with the workforce needs associated with projects and ongoing operations. Transco and NWP have no employees; employees of Williams and its affiliates provide services. Williams’ failure to hire and adequately obtain replacement employees, including the ability to transfer significant internal historical knowledge and expertise to the new employees, or the future availability and cost of contract labor may adversely affect Williams’, Transco’s, and NWP’s ability to manage and operate the businesses. If Williams is unable to successfully attract and retain an appropriately qualified workforce, including members of senior management, results of operations could be negatively impacted.
Holders of Williams’ common stock may not receive dividends in the amount expected or any dividends.
Williams may not have sufficient cash each quarter to pay dividends or maintain current or expected levels of dividends. The actual amount of cash Williams pays as a dividend may fluctuate from quarter to quarter and will depend on various factors, some of which are beyond Williams’ control, including:
•The amount of cash that Williams’ subsidiaries distribute to it;
•The amount of cash Williams generates from its operations, Williams’ working capital needs, Williams’ level of capital expenditures, and Williams’ ability to borrow;
•The restrictions contained in Williams’ indentures and credit facility and Williams’ debt service requirements;
•The cost of acquisitions, if any.
A failure either to pay dividends or to pay dividends at expected levels could result in a loss of investor confidence, reputational damage, and a decrease in the value of Williams’ stock price.
Item 1B. Unresolved Staff Comments
Not applicable.
Item 1C. Cybersecurity
Management for Williams, Transco, and NWP recognizes the increasing volume and sophistication of cyber threats and takes its responsibility to protect the information and systems under its purview seriously. Management’s cybersecurity processes aim to provide a comprehensive approach to assess, identify, and manage material risks arising from these cybersecurity threats.
Comprehensive Cybersecurity Program: Management has implemented a comprehensive cybersecurity risk management program (Cybersecurity Program) that is aligned with the National Institute for Standards and Technology Cybersecurity Framework. The Cybersecurity Program provides a risk-based approach to cybersecurity, and security controls are tailored so that cost-effective controls can be applied commensurate with the risk and sensitivity of specific information systems, control systems, and enterprise data. The Cybersecurity Program incorporates best practices and industry standards from multiple sources and is designed to comply with applicable regulations. The Cybersecurity Program includes, but is not limited to, the following elements: risk assessment, policies and procedures, contract management, training and awareness, auditing, compliance monitoring and testing, table-top exercises, and incident response.
Integration with Overall Risk Management: Management’s cybersecurity processes have been integrated into overall risk management system and processes. Management considers cybersecurity threat risks alongside other Company risks as part of its overall risk assessment process. Cybersecurity risk professionals collaborate with subject matter specialists, as necessary, to gather insights for identifying and assessing material cybersecurity threat risks, their severity, and potential mitigations.
Engagement of Third Parties: Management often engages with specialized third-party assessors, consultants, auditors, and other experts to review, validate, and enhance its cybersecurity practices. Third-party independent assessments provide an external perspective on management’s cybersecurity posture, allowing it to leverage best practices from the industry and ensure its defenses remain robust. All third parties engaged for such processes are subjected to rigorous scrutiny to ensure the third parties meet management’s security standards.
Oversight of Third-party Service Providers: Management acknowledges the potential risks associated with the use of third-party service providers. Therefore, management has established processes to oversee and identify material cybersecurity risks that may be associated with third-party service providers with whom it engages. This includes conducting thorough, risk-based due diligence before onboarding, performing security assessments, and confirming adherence to management’s cybersecurity requirements. Management also maintains active communication channels with these providers to stay informed about any potential security incidents or concerns.
Disclosure of Risks: Management describes how risks from cybersecurity threats could materially affect its business strategy, results of operations, or financial condition, as part of its risk factor disclosures at Part I, Item 1A of this Annual Report on Form 10-K.
Management is committed to continually enhancing its cybersecurity processes and practices to address the dynamic nature of the threats it faces and to ensure the security and integrity of its systems and data.
Cybersecurity Governance
Cybersecurity is an important part of the risk management processes and an area of focus for the Board of Directors and management. Each member of Williams’ organization, which includes Transco and NWP, from facility operators to board members, has a responsibility to safeguard the organization’s cybersecurity. The Chief Information Security Officer (CISO) is responsible for the cybersecurity strategy and execution, while the Board and the Audit Committee are responsible for oversight of cybersecurity risk.
The Cybersecurity Governance Committee is led by the CISO and includes cybersecurity managers and other subject matter experts as standing members. The Cybersecurity Governance Committee is tasked with developing, implementing, and maintaining the Cybersecurity Program. The Cybersecurity Executive Advisory Board (Executive Advisory Board) is led by the CISO, with the Chief Information Officer (CIO), Chief Financial Officer, Chief Human Resources Officer, the General Counsel, and the Chief Operations Officer as standing members. The Executive Advisory Board’s purpose is to ensure enterprise alignment with the Cybersecurity Program and provide executive oversight of the Cybersecurity Program.
The Board of Directors oversees cybersecurity-related policy and strategy. As part of this oversight, the CISO provides a cybersecurity dashboard that is reviewed by the Board at every regularly scheduled Board meeting, which includes key performance indicators for cybersecurity process maturity, operational performance, and enterprise performance toward Transportation Security Administration (TSA) compliance. Additionally, the CIO and/or CISO presents to the Board bi-annually regarding the cybersecurity risks and strategies, including as part of the Board’s annual long-term strategy session. The Audit Committee, comprised of independent directors, reviews the implementation and effectiveness of cybersecurity risk management protocols and reviews the effectiveness of cybersecurity as part of the Company’s accounting and internal control policies. As part of this oversight, the CIO presents to the Audit Committee bi-annually, as well as periodically in conjunction with any internal audits related to cybersecurity. Additionally, management has protocols by which cybersecurity incidents that meet established reporting thresholds are escalated internally and, where appropriate, are reported to the Board, as well as ongoing updates regarding any such incident until it has been addressed.
Williams’ new CIO joined the company in February 2025, and will succeed the company’s retiring CIO, who is retiring in March 2025. The new CIO brings over 20 years of experience in information technology and leadership within the energy industry and has extensive expertise in digital transformation, cloud strategies, enterprise AI initiatives, and cybersecurity, as well as managing large-scale system implementations and integrations. He holds an Executive MBA from the University of Texas at San Antonio, a Master of Computer Science and Engineering from the University of Texas at Arlington, and a Bachelor of Information Science and Engineering from Bangalore University.
The retiring CIO had been in his role at Williams for over 10 years and had over 30 years of combined information technology experience with a broad scope of responsibility. He provided senior leadership support of the cybersecurity and risk management programs since 2013. He holds a bachelor’s degree in management information systems (MIS) from the University of Oklahoma and a Master of Business Administration in MIS from the University of Dallas.
The CISO has been at Williams for over 25 years. During that time, he has held a variety of information technology positions at multiple levels in the organization ranging from network engineering to application development and project management, as well as several IT Manager and Director roles. He has had oversight of the cybersecurity and risk management programs since 2017. Active in government and private sector partnerships, he is currently serving as the Chair of Emergency Response Working Group under the Oil & Natural Gas Subsector Coordinating Council and recently acted as the Chair of the Interstate Natural Gas Association of America security committee. He holds degrees in Business Administration and MIS from the University of Oklahoma and is certified in Leadership from Harvard Business School’s executive education. In 2018, he obtained his Chief Information Security Officer certification from Carnegie Mellon University.
Item 2. Properties
Please read “Business” for a description of the location and general character of Williams’ principal physical properties. We generally own our facilities in fee simple, although a substantial portion of our pipeline and gathering facilities is constructed and maintained pursuant to rights-of-way, easements, permits, licenses, or consents on and across properties owned by others.
Transco
Transco’s gas pipeline facilities are generally owned in fee simple. However, a substantial portion of such facilities is constructed and maintained pursuant to rights-of-way, easements, permits, licenses or consents on and across properties owned by others. Compressor stations, with appurtenant facilities, are located in whole or in part either on lands owned or on sites held under leases or permits issued or approved by public authorities. Transco’s storage facilities are either owned or contracted for under long-term leases or easements. Transco leases their company offices in Houston, Texas.
NWP
NWP’s gas pipeline facilities are generally owned in fee simple. However, a substantial portion of such facilities are constructed and maintained on and across properties owned by others pursuant to rights-of-way, easements, permits, licenses or consents. NWP’s compressor stations, with associated facilities, are located in whole or in part upon lands owned by them and upon sites held under leases or permits issued or approved by public authorities. Land owned by others, but used by NWP under rights-of-way, easements, permits, leases, licenses, or consents, includes land owned by private parties, federal, state, and local governments, quasi-governmental agencies, or Native American tribes. The Plymouth LNG facility is located on lands owned in fee simple by NWP. Various credit arrangements restrict the sale or disposal of a major portion of our pipeline system. NWP leases its company offices in Salt Lake City, Utah.
Item 3. Legal Proceedings
Environmental
Certain reportable legal proceedings involving governmental authorities under federal, state, and local laws regulating the discharge of materials into the environment are described below. While it is not possible for Williams to predict the final outcome of the proceedings that are still pending, it does not anticipate a material effect on its consolidated financial position if it received an unfavorable outcome in any one or more of such proceedings. Williams’ threshold for disclosing material environmental legal proceedings involving a governmental authority where potential monetary sanctions are involved is $1 million.
Other environmental matters called for by this Item are described under the caption “Environmental Matters” in Note 18 – Contingencies and Commitments included under Part II, Item 8 Financial Statements of this report, which information is incorporated by reference into this Item.
Other Litigation
The additional information called for by this Item is provided in Note 18 – Contingencies and Commitments included under Part II, Item 8 Financial Statements of this report, which information is incorporated by reference into this Item.
Item 4. Mine Safety Disclosures
Not applicable.
Information About Williams’ Executive Officers
The name, title, age, period of service, and recent business experience of each of Williams’ executive officers as of February 25, 2025, are listed below.
| | | | | | | | | | | | | | | | | | | | |
| Name and Position | | Age | | Business Experience in Past Five Years (or Relevant Business Experience) |
| | | | | | |
| Alan S. Armstrong | | 62 | | 2011 to present | | Director, Chief Executive Officer, and President, The Williams Companies, Inc. |
| Director, Chief Executive Officer, and President | | | | 2015 to 2018 | | Chairman of the Board, Williams Partners L.P. |
| | | | | 2014 to 2018 | | Chief Executive Officer, Williams Partners L.P. |
| | | | 2012 to 2018 | | Director of the general partner, Williams Partners L.P. |
| Micheal G. Dunn | | 59 | | 2017 to present | | Executive Vice President and Chief Operating Officer, The Williams Companies, Inc. |
| Executive Vice President and Chief Operating Officer | | | | 2017 to 2018 | | Director of the general partner, Williams Partners L.P. |
| Mary A. Hausman | | 53 | | 2022 to present | | Vice President, Chief Accounting Officer and Controller, The Williams Companies, Inc. |
| Vice President, Chief Accounting Officer and Controller | | | | 2019 to 2022 | | Staff Vice President of Internal Audit, The Williams Companies, Inc. |
| | | | 2019 | | Director Special Projects, The Williams Companies, Inc. |
| | | | 2013 to 2019 | | Vice President and Chief Accounting Officer, NV Energy (a Berkshire Hathaway Energy Company) |
| Larry C. Larsen | | 50 | | 2022 to present | | Senior Vice President Gathering & Processing, The Williams Companies, Inc. |
| Senior Vice President Gathering & Processing | | | | 2020 to 2022 | | Vice President Strategic Development, The Williams Companies, Inc. |
| | | | 2019 to 2020 | | Vice President Rocky Mountain Midstream, The Williams Companies, Inc. |
| | | | 2018 to 2019 | | Vice President GM Rocky Mountain Midstream, The Williams Companies, Inc. |
| | | | 2017 to 2018 | | Vice President Central Services, The Williams Companies, Inc. |
| Eric J. Ormond | | 38 | | 2023 to present | | Senior Vice President Project Execution, The Williams Companies, Inc. |
| Senior Vice President Project Execution | | | | 2023 | | Senior Vice President Commercial Operations, Engineering & Project Management, Crestwood Midstream Partners LP |
| | | | 2020 to 2023 | | Senior Vice President Engineering & Project Management, Crestwood Midstream Partners LP |
| | | | 2017 to 2020 | | Vice President Strategic Development & New Ventures, Crestwood Midstream Partners LP |
| Debbie L. (Cowan) Pickle | | 47 | | 2018 to present | | Senior Vice President and Chief Human Resources Officer, The Williams Companies, Inc. |
| Senior Vice President and Chief Human Resources Officer | | | | 2013 to 2018 | | Global Vice President of Human Resources, Koch Chemical Technology Group, LLC |
| | | | | | |
| | | | | | | | | | | | | | | | | | | | |
| Name and Position | | Age | | Business Experience in Past Five Years (or Relevant Business Experience) |
| | | | | | |
| John D. Porter | | 55 | | 2022 to present | | Senior Vice President and Chief Financial Officer, The Williams Companies, Inc. |
| Senior Vice President and Chief Financial Officer | | | | 2020 to 2021 | | Vice President, Chief Accounting Officer, Controller and Financial Planning & Analysis, The Williams Companies, Inc. |
| | | | 2017 to 2019 | | Vice President Enterprise Financial Planning & Analysis and Investor Relations, The Williams Companies, Inc. |
| | | | 2013 to 2017 | | Director of Investor Relations & Enterprise Planning, The Williams Companies, Inc. |
| Chad A. Teply | | 53 | | 2023 to present | | Senior Vice President – Transmission & Gulf of America, The Williams Companies, Inc. |
| Senior Vice President – Transmission & Gulf of America | | | | 2020 to 2023 | | Senior Vice President – Project Execution, The Williams Companies, Inc. |
| | | | 2017 to 2020 | | Senior Vice President – Business Policy and Development, PacifiCorp (a Berkshire Hathaway Energy Company) |
| T. Lane Wilson | | 58 | | 2017 to present | | Senior Vice President and General Counsel, The Williams Companies, Inc. |
| Senior Vice President and General Counsel | | | | | | |
| Chad J. Zamarin | | 48 | | 2023 to present | | Executive Vice President of Corporate Strategic Development, The Williams Companies, Inc. |
| Executive Vice President of Corporate Strategic Development | | | | 2017 to 2023 | | Senior Vice President – Corporate Strategic Development, The Williams Companies, Inc. |
| | | | 2017 to 2018 | | Director of the general partner, Williams Partners L.P. |
| | | | 2014 to 2017 | | President – Pipeline and Midstream, Cheniere Energy, Inc. |
| | | | | | |
PART II
Item 5. Market for Registrant’s Common Equity, Related Stockholder Matters and Issuer Purchases of Equity Securities
Williams’ common stock is listed on the New York Stock Exchange under the symbol “WMB.” At the close of business on February 20, 2025, Williams had 5,553 holders of record of common stock.
Transco and NWP are indirectly wholly owned by Williams.
Cash distributions declared and paid to Williams are as follows:
| | | | | | | | | | | | | | |
| | Year Ended December 31, |
| | 2024 | | 2023 |
| | (Millions) |
| Transco | | $ | 1,145 | | | $ | 1,220 | |
| NWP | | $ | 150 | | | $ | 155 | |
In January 2025, Transco and NWP declared and paid cash distributions to Williams of $246 million and $24 million, respectively.
Share Repurchase Program
In September 2021, Williams’ Board of Directors authorized a share repurchase program with a maximum dollar limit of $1.5 billion. Repurchases may be made from time to time in the open market, by block purchases, in privately negotiated transactions, or in such other manner as determined by management. Williams will also determine the timing and amount of any repurchases based on market conditions and other factors. The share repurchase program does not obligate Williams to acquire any particular amount of common stock, and it may be suspended or discontinued at any time. This share repurchase program does not have an expiration date. Williams’ purchases of its equity securities are as follows:
| | | | | | | | | | | | | | | | | | | | | | | | | | |
| Period | |
Total Number of Shares Purchased | |
Average Price Paid Per Share | |
Total Number of Shares Purchased as Part of Publicly Announced Plans or Programs | |
Maximum Number (or Approximate Dollar Value) of Shares that May Yet Be Purchased Under the Plans or Programs |
| October 1 - October 31, 2024 | | — | | | $ | — | | | — | | | $ | 1,360,938,325 | |
| November 1 - November 30, 2024 | | — | | | $ | — | | | — | | | $ | 1,360,938,325 | |
| December 1 - December 31, 2024 | | — | | | $ | — | | | — | | | $ | 1,360,938,325 | |
| Total | | — | | | | | — | | | |
Performance Graph
Set forth below is a line graph comparing Williams’ cumulative total stockholder return on common stock (assuming reinvestment of dividends) with the cumulative total return of the S&P 500 Stock Index, the Bloomberg Americas Pipelines Index, and the Arca Natural Gas Index for the period of five fiscal years commencing January 1, 2020. The Bloomberg Americas Pipelines Index is composed of Enbridge Inc., TC Energy Corporation, Kinder Morgan, Inc., ONEOK, Inc., Cheniere Energy, Inc., Pembina Pipeline Corporation, Targa Resources Corp., and Williams. The Arca Natural Gas Index is comprised of 20 highly capitalized companies in the natural gas industry
involved primarily in natural gas exploration and production and natural gas pipeline transportation and transmission. The graph below assumes an investment of $100 at the beginning of the period.
| | | | | | | | | | | | | | | | | | | | | | | | | | | | | | | | | | | |
| 2019 | | 2020 | | 2021 | | 2022 | | 2023 | | 2024 |
| The Williams Companies, Inc. | 100.0 | | 92.4 | | 127.9 | | 170.1 | | 190.4 | | 309.1 |
| S&P 500 Index | 100.0 | | 118.4 | | 152.3 | | 124.7 | | 157.5 | | 196.8 |
| Bloomberg Americas Pipelines Index | 100.0 | | 79.1 | | 106.1 | | 122.6 | | 131.1 | | 187.2 |
| Arca Natural Gas Index | 100.0 | | 86.5 | | 138.8 | | 177.7 | | 191.5 | | 231.6 |
Item 7. Management’s Discussion and Analysis of Financial Condition and Results of Operations
| | | | | |
| Combined Management’s Discussion and Analysis of Financial Condition and Results of Operations | Page |
| |
| |
| |
| |
| |
| |
| |
| |
General
Williams is an energy company committed to being the leader in providing infrastructure that safely delivers natural gas products to reliably fuel the clean energy economy. Its operations are located in the United States.
Williams’ interstate natural gas pipeline strategy is to create value by maximizing the utilization of its pipeline capacity by providing high-quality, low-cost transportation of natural gas to large and growing markets. Williams’ gas pipeline businesses’ interstate transmission and storage activities are subject to regulation by the FERC. As such, Williams’ rates and charges for the transportation of natural gas in interstate commerce, and the extension, expansion or abandonment of jurisdictional facilities and accounting, among other things, are subject to regulation. The rates are established primarily through the FERC’s ratemaking process, but Williams may also negotiate rates with its customers pursuant to the terms of its tariffs and FERC policy. Changes in commodity prices and volumes transported have limited near-term impact on these revenues because the majority of the cost of service is recovered through firm capacity reservation charges in transportation rates.
The ongoing strategy of Williams’ midstream operations is to safely and reliably operate large-scale midstream infrastructure where its assets can be fully utilized and drive low per-unit costs. Williams focuses on consistently attracting new business by providing highly reliable service to its customers. These services include natural gas gathering, processing, treating, compression and storage; NGL fractionation, transportation and storage; and crude oil production handling and transportation, as well as marketing services for NGL, crude oil, and natural gas.
Consistent with the manner in which Williams’ chief operating decision maker evaluates performance and allocates resources, Williams’ operations are conducted, managed, and presented within the following reportable segments: Transmission & Gulf of America, Northeast G&P, West, and Gas & NGL Marketing Services. All remaining business activities, including upstream operations, certain new energy ventures, and corporate activities, are included in Other. Williams’ reportable segments are comprised of the following business activities:
•Transmission & Gulf of America is comprised of the Transco, NWP, and MountainWest interstate natural gas pipelines, and their related natural gas storage facilities, as well as natural gas gathering and processing and crude oil production handling and transportation assets in the Gulf Coast region, including Discovery, a former 60 percent equity-method investment in which Williams acquired the remaining ownership interest in August 2024 (see Note 3 – Acquisitions and Divestitures), a 51 percent interest in Gulfstar One, and a 50 percent equity-method investment in Gulfstream. Transmission & Gulf of America also includes natural gas storage facilities and pipelines providing services in north Texas, and also in Louisiana and Mississippi related to the January 2024 Gulf Coast Storage Acquisition (see Note 3 – Acquisitions and Divestitures).
•Northeast G&P is comprised of midstream gathering, processing, and fractionation businesses in the Marcellus Shale region primarily in Pennsylvania and New York, and the Utica Shale region of eastern Ohio, as well as a 65 percent interest in Northeast JV which operates in West Virginia, Ohio, and Pennsylvania, a 66 percent interest in Cardinal which operates in Ohio, a 69 percent equity-method
Management’s Discussion and Analysis (Continued)
investment in Laurel Mountain, a 50 percent equity-method investment in Blue Racer, and Appalachia Midstream Investments.
•West is comprised of gas gathering, processing, and treating operations in the Rocky Mountain region of Colorado and Wyoming, the Barnett Shale region of north-central Texas, the Eagle Ford Shale region of south Texas, the Haynesville Shale region of east Texas and northwest Louisiana, the Mid-Continent region which includes the Anadarko and Permian basins, and the DJ Basin of Colorado which includes RMM, a former 50 percent equity-method investment in which Williams acquired the remaining ownership interest in November 2023 (see Note 3 – Acquisitions and Divestitures). This segment also includes NGL storage facilities, an undivided 50 percent interest in an NGL fractionator near Conway, Kansas, and a 50 percent equity-method investment in OPPL.
•Gas & NGL Marketing Services is comprised of NGL and natural gas marketing and trading operations, which includes risk management and transactions related to the storage and transportation of natural gas and NGLs on strategically positioned assets.
Unless indicated otherwise, the following discussion and analysis of results of operations and financial condition and liquidity relates to Williams’ current continuing operations and should be read in conjunction with the financial statements and notes thereto included in Part II, Item 8 of this report.
Dividends
In December 2024, Williams paid a regular quarterly dividend of $0.4750 per share. On January 28, 2025, Williams’ board of directors approved a regular quarterly dividend of $0.5000 per share payable on March 31, 2025.
Overview of Year Ended December 31, 2024
Net income (loss) attributable to The Williams Companies, Inc. for the year ended December 31, 2024, decreased $954 million compared to the year ended December 31, 2023. Further discussion of the results is found in this report in the Results of Operations.
Recent Developments
Transco FERC Rate Case Filing
On August 30, 2024, Transco filed a general rate case with the FERC for an overall increase in rates. In September 2024, with the exception of certain rates that reflected a rate decrease, the FERC accepted and suspended Transco’s general rate filing to be effective March 1, 2025, subject to refund and the outcome of hearing procedures established by the FERC. The specific rates that reflected a rate decrease were accepted, without suspension, to be effective October 1, 2024, as requested by Transco, and will not be subject to refund. The impact of the rates reflecting a rate decrease is expected to reduce revenues by approximately $1 million per month beginning October 1, 2024.
Expansion Project Updates
Significant expansion project updates for the period, including projects placed into service are described below. Ongoing major expansion projects are discussed later in Company Outlook.
Transmission & Gulf of America
Deepwater Whale Project
In August 2021, Williams reached an agreement with two third-parties to provide offshore natural gas gathering and crude oil transportation services as well as onshore natural gas processing services. The project expands its existing Western Gulf of America offshore infrastructure via a 26-mile gas lateral pipeline from the
Management’s Discussion and Analysis (Continued)
Whale platform to the existing Perdido gas pipeline and adds a new 124-mile oil pipeline from the Whale platform to Williams’ existing junction platform. This project was placed into service in January 2025.
Southside Reliability Enhancement
In July 2023, Transco received approval from the FERC for the project, which involves an expansion of Transco’s existing natural gas transmission system to provide incremental firm transportation capacity from receipt points in Virginia and North Carolina to delivery points in North Carolina. This project went into service in the fourth quarter of 2024. The project increased capacity by 423 Mdth/d.
Regional Energy Access
In January 2023, Transco received approval from the FERC for the project to expand Transco’s existing natural gas transmission system to provide incremental firm transportation capacity from receipt points in northeastern Pennsylvania to multiple delivery points in Pennsylvania, New Jersey, and Maryland. Transco placed approximately half of the project into service in the fourth quarter of 2023 and placed the remainder of the project into service in August 2024. The project increased capacity by 829 Mdth/d.
On January 24, 2025, the FERC issued an Order on Remand Reinstating Certificate and Abandonment Authorization (Remand Order) for the project. The Remand Order was issued in response to the D.C. Circuit Court of Appeals’ decision in New Jersey Conservation Foundation, et al., v. FERC, which vacated the FERC certificate order for the project and remanded the matter to the FERC for appropriate action. In the Remand Order, the FERC (1) continued to find that the project is needed, (2) affirmed its decision not to make a significance determination regarding greenhouse gas emissions, (3) considered Transco’s measures to reduce greenhouse gas emissions, and (4) concluded that the benefits of the project outweigh the adverse impacts. Accordingly, the Remand Order reinstated the certificate and abandonment authority for the project as issued in the FERC’s original certificate order. The authorization took effect upon the issuance of the mandate by the D.C. Circuit Court of Appeals, which occurred on January 29, 2025.
Data Center Power Projects
Williams continues to pursue projects to support the power demands created by new data center development. Williams is in the process of ordering major equipment and long-lead time items for the most mature of these expected projects. These advanced purchases are supported by reimbursement agreements from the potential customer.
Acquisitions and Divestitures
Crowheart Acquisition
As of December 31, 2023, Williams had an agreement regarding certain crude oil and natural gas properties in the Wamsutter basin in Wyoming under which it owned a 75 percent undivided interest in each well’s working interest and proportionally consolidated its undivided interest. On November 1, 2024, Williams closed on the acquisition of a third-party operator, Crowheart Energy, LLC, for $307 million cash, subject to working capital and post-closing adjustments. After closing on the acquisition, Williams owns more than a 90 percent working interest in each well. The purpose of this acquisition was to consolidate Williams’ interests in the Wamsutter basin and further optimize development in the area to continue to supply its gathering and processing assets (see Note 3 – Acquisitions and Divestitures).
Discovery Acquisition
As of December 31, 2023, Williams owned a 60 percent interest in Discovery, which it accounted for as an equity-method investment. On August 1, 2024, Williams closed on the acquisition of the remaining 40 percent interest in Discovery, along with certain other assets, for $170 million cash, subject to working capital and post-closing adjustments. As a result of acquiring this additional interest, Williams obtained control and subsequently consolidates Discovery. Williams recognized a $127 million gain on remeasuring its existing equity-method
Management’s Discussion and Analysis (Continued)
investment to fair value included in Other investing income (loss) – net in the Consolidated Statement of Income in the third quarter of 2024. The purpose of this acquisition was to expand Williams’ gathering, processing, and transportation presence in the Gulf of America region. Discovery continues to be reported within the Transmission & Gulf of America segment (see Note 3 – Acquisitions and Divestitures).
Sale of Aux Sable interest
Also on August 1, 2024, Williams completed the sale of its equity-method investments in Aux Sable in Williams’ Northeast G&P segment for total consideration of $161 million. As a result of this sale, Williams recorded a gain of $149 million included in Other investing income (loss) – net in the Consolidated Statement of Income in the third quarter of 2024 (see Note 8 – Investing Activities).
Gulf Coast Storage Acquisition
On January 3, 2024, Williams closed on the acquisition from Hartree Partners LP for $1.95 billion of 100 percent of a strategic portfolio of natural gas storage facilities and pipelines, located in Louisiana and Mississippi. The purpose of this acquisition, which is reported in the Transmission & Gulf of America segment, was to expand Williams’ natural gas storage footprint in the Gulf Coast region. The Gulf Coast Storage Acquisition was funded with cash on hand and $100 million of deferred consideration. On January 3, 2025, Williams paid the remaining $100 million of the Gulf Coast Storage Acquisition purchase price obligation (see Note 3 – Acquisitions and Divestitures).
Company Outlook
Williams’ strategy is to provide a large-scale, reliable, and clean energy infrastructure designed to maximize the opportunities created by the vast supply of natural gas and natural gas products that exists in the United States. Williams accomplishes this by connecting the growing demand for cleaner fuels and feedstocks with our major positions in the premier natural gas and natural gas products supply basins. Williams continues to maintain a strong commitment to safety, environmental stewardship including seeking opportunities for renewable energy ventures, operational excellence, and customer satisfaction. Williams believes that accomplishing these goals will position us to deliver safe, reliable, clean energy services to its customers and an attractive return to shareholders. Williams’ business plan for 2025 includes a continued focus on earnings and cash flow growth.
In 2025, Williams’ operating results are expected to benefit from the continued growth in the Transmission & Gulf of America segment, primarily reflecting the impacts of numerous expansion projects at Transco and the Gulf of America. Additionally, growth in 2025 includes the impact of the Transco rate case and higher gathering and processing results associated with growth in the DJ Basin and the Northeast. Williams also expects increases in Haynesville Shale volumes, including partial year impact of the Louisiana Energy Gateway expansion project and higher expected results from its upstream operations, including the full year impact of the Crowheart Acquisition. These increases are partially offset by a modest increase in expenses and lower expected Eagle Ford results in our West segment related to minimum volume commitment reductions.
Williams seeks to maintain a strong financial position and liquidity, as well as manage a diversified portfolio of safe, clean, and reliable energy infrastructure assets that continue to serve key growth markets and supply basins in the United States. Williams’ growth capital and investment expenditures in 2025 are expected to range from $1.65 billion to $1.95 billion, excluding acquisitions. Growth capital spending in 2025 primarily includes projects supporting growth in the Haynesville Shale basin (including the Louisiana Energy Gateway expansion project), Transco expansions, all of which are fully contracted with firm transportation agreements, and projects supporting the Northeast G&P business. Williams also expects to invest capital in the development of its upstream oil and gas properties. In addition to growth capital and investment expenditures, Williams also remains committed to projects that maintain its assets for safe and reliable operations, as well as projects that reduce emissions, and meet legal, regulatory, and/or contractual commitments.
Management’s Discussion and Analysis (Continued)
Potential risks and obstacles that could impact the execution of Williams’ plan include:
•A global recession, which could result in downturns in financial markets and commodity prices, as well as impact demand for natural gas and related products;
•Opposition to, and regulations affecting, our infrastructure projects, including the risk of delay or denial in permits and approvals needed for our projects;
•Counterparty credit and performance risk;
•Unexpected significant increases in capital expenditures or delays in capital project execution, including increases from inflation or delays caused by supply chain disruptions;
•Unexpected changes in customer drilling and production activities, which could negatively impact gathering and processing volumes;
•Lower than anticipated demand for natural gas and natural gas products which could result in lower-than-expected volumes, energy commodity prices, and margins;
•General economic, financial markets, or industry downturns, including increased inflation, interest rates, or tariffs;
•Physical damages to facilities, including damage to offshore facilities by weather-related events;
•Other risks set forth under Part I, Item 1A. Risk Factors.
Expansion Projects
Williams’ ongoing major expansion projects include the following:
Transmission & Gulf of America
Deepwater Shenandoah Project
In June 2021, Williams reached an agreement with two third-parties to provide offshore natural gas gathering and transportation services as well as onshore natural gas processing services. The project expands existing Gulf of America offshore infrastructure connecting to a third-party offshore lateral pipeline from the Shenandoah platform to Discovery’s existing Keathley Canyon Connector pipeline, adds onshore processing facilities at Larose, Louisiana to handle the expected rich Shenandoah production, and the natural gas liquids will be fractionated and marketed at Discovery’s Paradis plant in Louisiana. Williams plans to place the project into service in the second quarter of 2025.
Overthrust Westbound Compression Expansion
In October 2024, MountainWest received approval from the FERC for the project, which involves an expansion of MountainWest’s existing natural gas transmission system to provide incremental firm transportation capacity from multiple receipt points in Wamsutter, Wyoming to a delivery point in Opal, Wyoming. MountainWest plans to place the project into service as early as the fourth quarter of 2025, assuming timely receipt of all necessary regulatory approvals. The project is expected to increase capacity by 325 Mdth/d.
Texas to Louisiana Energy Pathway
In January 2024, Transco received approval from the FERC for the project, which involves an expansion of Transco’s existing natural gas transmission system to provide firm transportation capacity from receipt points in south Texas to delivery points in Texas and Louisiana. Transco plans to place the project into service during the first quarter of 2025, assuming timely receipt of all necessary regulatory approvals. The project is expected to provide 364 Mdth/d of new firm transportation service through a combination of increasing capacity, converting interruptible capacity to firm, and utilizing existing capacity.
Management’s Discussion and Analysis (Continued)
Southeast Energy Connector
In November 2023, Transco received approval from the FERC for the project, which involves an expansion of Transco’s existing natural gas transmission system to provide incremental firm transportation capacity from receipt points in Mississippi and Alabama to a delivery point in Alabama. Transco plans to place the project into service in the second quarter of 2025, assuming timely receipt of all necessary regulatory approvals. The project is expected to increase capacity by 150 Mdth/d.
Commonwealth Energy Connector
In November 2023, Transco received approval from the FERC for the project, which involves an expansion of Transco’s existing natural gas transmission system to provide incremental firm transportation capacity in Virginia. Transco plans to place the project into service as early as the fourth quarter of 2025, assuming timely receipt of all necessary regulatory approvals. The project is expected to increase capacity by 105 Mdth/d.
Alabama Georgia Connector
In March 2024, Transco received approval from the FERC for the project, which involves an expansion of Transco’s existing natural gas transmission system to provide incremental firm transportation capacity from Transco’s Station 85 pooling point in Alabama to customers in Georgia. Transco plans to place the project into service as early as the fourth quarter of 2025, assuming timely receipt of all necessary regulatory approvals. The project is expected to increase capacity by 64 Mdth/d.
Southeast Supply Enhancement
In October 2024, Transco filed a certificate application with the FERC for the project, which involves an expansion of Transco’s existing natural gas transmission system to provide incremental firm transportation capacity from receipt points in Virginia to delivery points in Virginia, North Carolina, South Carolina, Georgia, and Alabama. Transco plans to place the project into service as early as the fourth quarter of 2027, assuming timely receipt of all necessary regulatory approvals. The project is expected to increase capacity by 1,597 Mdth/d.
Gillis West
Transco plans to file the prior notice application for the project with the FERC in 2025, which involves an expansion of Transco’s existing natural gas transmission system to provide incremental firm transportation capacity from receipt points in Louisiana to delivery points in Texas. Transco plans to place the project into service as early as the fourth quarter of 2025, assuming timely receipt of all necessary regulatory approvals. The project is expected to increase capacity by 115 Mdth/d.
Ryckman Creek Loop
NWP plans to file the prior notice application for the project with the FERC in 2025. The Ryckman Creek Loop expansion involves an expansion of NWP’s existing natural gas transmission system to provide incremental firm transportation capacity from a receipt point in northeast Oregon (Stanfield) to multiple delivery points in southwest Wyoming. NWP plans to place the project into service as early as the fourth quarter of 2025, assuming timely receipt of all necessary regulatory approvals. The project is expected to increase capacity by 50 MDth/d.
Stanfield South Project
The Stanfield South Project on NWP’s existing natural gas transmission system will provide year-round transportation capacity from the Stanfield receipt point in Oregon to multiple delivery points in Idaho. NWP plans to place the project into service as early as the fourth quarter of 2025, assuming timely receipt of all necessary regulatory approvals. The project is expected to increase capacity by 80 Mdth/d.
Management’s Discussion and Analysis (Continued)
Naughton Coal-to-Gas Conversion
The Naughton Coal-to-Gas Conversion project on NWP’s existing natural gas transmission system will provide year-round transportation capacity to a power plant in southwest Wyoming. NWP plans to place the project into service as early as the second quarter of 2026, assuming timely receipt of all necessary regulatory approvals. The project is expected to increase capacity by 98 Mdth/d.
Kelso-Beaver Reliability Project
The Kelso-Beaver Reliability project on NWP’s existing natural gas transmission system will provide year-round transportation capacity to various receipt and delivery points in Oregon. NWP plans to file the certificate application with the FERC in 2025. NWP plans to place the project into service during the fourth quarter of 2028, assuming timely receipt of all necessary regulatory approvals. The project is expected to increase capacity by 183 Mdth/d.
Huntingdon Connector
The Huntingdon Connector project on NWP’s existing natural gas transmission system will provide year-round transportation capacity from the Sumas receipt point to various delivery points in Washington. NWP plans to file the prior notice application for the project with the FERC in 2026. NWP plans to place the project in service during the fourth quarter of 2026, assuming timely receipt of all necessary regulatory approvals. The project is expected to increase capacity by 87 Mdth/d.
Wild Trail Expansion
The Wild Trail Expansion project on NWP’s existing natural gas transmission system will provide year-round transportation capacity from the White River Hub receipt point in western Colorado to various delivery points in southwest Wyoming and southern Colorado. This project is fully subscribed by an affiliate within Williams’ Gas & NGL Marketing Services segment. NWP plans to file the certificate application with the FERC in 2025. NWP plans to place the project in service during the fourth quarter of 2027, assuming timely receipt of all necessary regulatory approvals. The project is expected to increase capacity by 83 Mdth/d.
West
Louisiana Energy Gateway
In August 2024, Williams began construction activities on new natural gas gathering assets which are expected to gather 1.8 Bcf/d of natural gas produced in the Haynesville Shale basin for delivery to premium markets, including Transco, industrial markets, and growing LNG export demand along the Gulf Coast. This project is expected to go into service in the third quarter of 2025.
Haynesville Gathering Expansion
In February 2023, Williams announced its agreement with a third party to facilitate natural gas production growth in the Haynesville Shale basin. Williams is constructing a greenfield gathering system in support of the third party’s 26,000-acre dedication. The system, once completed, will provide natural gas gathering services to the third party. The third party has also agreed to a long-term capacity commitment on Williams’ Louisiana Energy Gateway expansion project. This project is expected to go into service in third quarter 2025.
Critical Accounting Estimates
Preparation of financial statements in conformity with generally accepted accounting principles requires management to make estimates and assumptions. The nature of these estimates and assumptions is material due to the subjectivity and judgment necessary, or the susceptibility of such matters to change, and the impact of these on the financial condition or results of operations.
Management’s Discussion and Analysis (Continued)
Williams’ Pension and Postretirement Obligations
Williams has pension and other postretirement benefit plans that require the use of assumptions and estimates to determine the benefit obligations and costs. These estimates and assumptions involve significant judgment and actual results will likely be different than anticipated. Estimates and assumptions utilized include the expected long-term rates of return on plan assets, discount rates, cash balance interest crediting rate, and employee demographics, including retirement age and mortality. These assumptions are reviewed annually and adjustments are made as needed. The assumptions utilized to compute the benefit obligations and costs are shown in Note 7 – Employee Benefit Plans.
The following table presents the estimated increase (decrease) in net periodic benefit cost and obligations resulting from a one-percentage-point change in the specific assumption.
| | | | | | | | | | | | | | | | | | | | | | | |
| | Benefit Cost | | Benefit Obligation |
| | One-
Percentage-
Point
Increase | | One-
Percentage-
Point
Decrease | | One-
Percentage-
Point
Increase | | One-
Percentage-
Point
Decrease |
| | (Millions) |
| Pension benefits: | | | | | | | |
| Discount rate | $ | 3 | | | $ | (4) | | | $ | (62) | | | $ | 71 | |
| Expected long-term rate of return on plan assets | (11) | | | 11 | | | — | | | — | |
| Cash balance interest crediting rate | 4 | | | (4) | | | 45 | | | (39) | |
| Other postretirement benefits: | | | | | | | |
| Discount rate | (3) | | | 3 | | | (11) | | | 14 | |
| Expected long-term rate of return on plan assets | (3) | | | 3 | | | — | | | — | |
Williams’ expected long-term rates of return on plan assets, as determined at the beginning of each fiscal year, are based on historical returns, forward-looking capital market expectations of at least 10 years from Williams’ third-party independent investment advisor, as well as the investment strategy and relative weightings of the asset classes within the investment portfolio. Williams’ expected long-term rate of return on plan assets used for Williams’ pension plans was 5.31 percent in 2024. The 2024 actual return on plan assets for Williams’ pension plans was approximately 8.0 percent. The 10-year average rate of return on pension plan assets through December 2024 was approximately 6.6 percent. The expected rates of return on plan assets are long-term in nature and are not significantly impacted by short-term market performance.
The discount rates for Williams’ pension and other postretirement benefit plans are determined separately based on an approach specific to Williams’ plans, which considers a yield curve of high-quality corporate bonds and the duration of the expected benefit cash flows of each plan.
The cash balance interest crediting rate assumption represents the average long-term rate by which the pension plans’ cash balance accounts are expected to grow. Interest on the cash balance accounts is based on the 30-year U.S. Treasury securities rate.
Regulatory Accounting
Transco and NWP are regulated by the FERC. Accounting Standards Codification (ASC) Topic 980, “Regulated Operations,” (ASC 980) provides that certain costs that would otherwise be charged to expense should be deferred as regulatory assets, based on the expected recovery from customers in future rates. Likewise, certain actual or anticipated credits that would otherwise reduce expense should be deferred as regulatory liabilities, based on the expected return to customers in future rates. Management’s expected recovery of deferred costs and return of deferred credits generally results from specific decisions by regulators granting such ratemaking treatment. Transco and NWP record certain incurred costs and obligations as regulatory assets or liabilities if, based on regulatory orders or other available evidence, it is probable that the costs or obligations will be included in amounts allowable for recovery or refunded in future rates.
Management’s Discussion and Analysis (Continued)
Accounting for businesses that are regulated and apply the provisions of ASC 980 can differ from the accounting requirements for non-regulated businesses. Transactions that are recorded differently as a result of regulatory accounting requirements include the capitalization of an equity return component on regulated capital projects, capitalization of other project costs, retirements of general plant assets, levelized cost of service, employee-related benefits, environmental costs, negative salvage, asset retirement obligations (ARO) and other costs and taxes included in, or expected to be included in, future rates. As rate-regulated entities, Transco’s and NWP’s management has determined that it is appropriate to apply the accounting prescribed by ASC 980 and, accordingly, the accompanying financial statements include the effects of the types of transactions described above that result from regulatory accounting requirements. Management’s assessment of the probability of recovery or pass through of regulatory assets and liabilities requires judgment and interpretation of laws and regulatory commission orders. If, for any reason, either Transco or NWP ceases to meet the criteria for application of regulatory accounting treatment for all or part of our operations, the regulatory assets and liabilities related to those portions ceasing to meet such criteria would be eliminated from the Balance Sheet and included in the Statement of Net Income for the period in which the discontinuance of regulatory accounting treatment occurs and can be estimated, unless otherwise required to be recorded under other provisions of U.S. generally accepted accounting principles.
The aggregate amount of regulatory assets reflected on Transco’s and NWP’s Balance Sheets at December 31, 2024, is $394 million and $55 million, respectively. The aggregate amount of regulatory liabilities reflected on Transco’s and NWP’s Balance Sheets at December 31, 2024, is $1.0 billion and $253 million, respectively. A summary of regulatory assets and liabilities is included in Note 10 – Regulatory Assets and Liabilities.
Management’s Discussion and Analysis (Continued)
Results of Operations
Williams’ Consolidated Overview
The following table and discussion is a summary of Williams’ consolidated results of operations for the three years ended December 31, 2024, and should be read in conjunction with the results of operations by segment, as discussed in further detail following this consolidated overview discussion.
| | | | | | | | | | | | | | | | | | | | | | | | | | | | | | | | | | | | | | | | | | | | | | | | | | | | | | | |
| | | | | | | | | | | | | | | | | | | | | | | | | | | |
| | | | | | | | | | Year Ended December 31, |
| | | | | | | | | | | | | | | | | | | |
| | | | | | | | | | 2024 | | | | | | | | $ Change from 2023* | | % Change from 2023* | | 2023 | | $ Change from 2022* | | % Change from 2022* | | 2022 |
| | | | | | (Dollars in millions) |
| Revenues: | | | | | | | | | | | | | | | | | | | | | | | | | | | |
| Service revenues | | | | | | | | | $ | 7,628 | | | | | | | | | +602 | | | +9 | % | | $ | 7,026 | | | +490 | | | +7 | % | | $ | 6,536 | |
| | | | | | | | | | | | | | | | | | | | | | | | | | | |
| Product sales and service revenues – commodity consideration | | | | | | | | | 3,125 | | | | | | | | | +200 | | | +7 | % | | 2,925 | | | -1,891 | | | -39 | % | | 4,816 | |
| Net gain (loss) from commodity derivatives | | | | | | | | | (250) | | | | | | | | | -1,206 | | | NM | | 956 | | | +1,343 | | | NM | | (387) | |
| Total revenues | | | | | | | | | 10,503 | | | | | | | | | | | | | 10,907 | | | | | | | 10,965 | |
| Costs and expenses: | | | | | | | | | | | | | | | | | | | | | | | | | | | |
| Product costs and net processing commodity expenses | | | | | | | | | 2,118 | | | | | | | | | -83 | | | -4 | % | | 2,035 | | | +1,422 | | | +41 | % | | 3,457 | |
| | | | | | | | | | | | | | | | | | | | | | | | | | | |
| Operating and maintenance expenses | | | | | | | | | 2,179 | | | | | | | | | -195 | | | -10 | % | | 1,984 | | | -167 | | | -9 | % | | 1,817 | |
| Depreciation and amortization expenses | | | | | | | | | 2,219 | | | | | | | | | -148 | | | -7 | % | | 2,071 | | | -62 | | | -3 | % | | 2,009 | |
| Selling, general, and administrative expenses | | | | | | | | | 708 | | | | | | | | | -43 | | | -6 | % | | 665 | | | -29 | | | -5 | % | | 636 | |
| | | | | | | | | | | | | | | | | | | | | | | | | | | |
| | | | | | | | | | | | | | | | | | | | | | | | | | | |
| Gain on sale of business | | | | | | | | | — | | | | | | | | | -129 | | | -100 | % | | (129) | | | +129 | | | NM | | — | |
| | | | | | | | | | | | | | | | | | | | | | | | | | | |
| Other (income) expense – net | | | | | | | | | (60) | | | | | | | | | +30 | | | +100 | % | | (30) | | | +58 | | | NM | | 28 | |
| Total costs and expenses | | | | | | | | | 7,164 | | | | | | | | | | | | | 6,596 | | | | | | | 7,947 | |
| Operating income (loss) | | | | | | | | | 3,339 | | | | | | | | | | | | | 4,311 | | | | | | | 3,018 | |
| Equity earnings (losses) | | | | | | | | | 560 | | | | | | | | | -29 | | | -5 | % | | 589 | | | -48 | | | -8 | % | | 637 | |
| | | | | | | | | | | | | | | | | | | | | | | | | | | |
| Other investing income (loss) – net | | | | | | | | | 343 | | | | | | | | | +235 | | | NM | | 108 | | | +92 | | | NM | | 16 | |
| Interest expense | | | | | | | | | (1,364) | | | | | | | | | -128 | | | -10 | % | | (1,236) | | | -89 | | | -8 | % | | (1,147) | |
| Net gain from Energy Transfer litigation judgment | | | | | | | | | — | | | | | | | | | -534 | | | -100 | % | | 534 | | | +534 | | | NM | | — | |
| Other income (expense) – net | | | | | | | | | 108 | | | | | | | | | +9 | | | +9 | % | | 99 | | | +81 | | | NM | | 18 | |
| Income (loss) before income taxes | | | | | | | | | 2,986 | | | | | | | | | | | | | 4,405 | | | | | | | 2,542 | |
| Less: Provision (benefit) for income taxes | | | | | | | | | 640 | | | | | | | | | +365 | | | +36 | % | | 1,005 | | | -580 | | | -136 | % | | 425 | |
| Income (loss) from continuing operations | | | | | | | | | 2,346 | | | | | | | | | | | | | 3,400 | | | | | | | 2,117 | |
| Income (loss) from discontinued operations | | | | | | | | | — | | | | | | | | | +97 | | | +100 | % | | (97) | | | -97 | | | NM | | — | |
| Net income (loss) | | | | | | | | | 2,346 | | | | | | | | | | | | | 3,303 | | | | | | | 2,117 | |
| Less: Net income attributable to noncontrolling interests | | | | | | | | | 121 | | | | | | | | | +3 | | | +2 | % | | 124 | | | -56 | | | -82 | % | | 68 | |
| Net income (loss) attributable to The Williams Companies, Inc. | | | | | | | | | $ | 2,225 | | | | | | | | | -954 | | | -30 | % | | $ | 3,179 | | | +1,130 | | | +55 | % | | $ | 2,049 | |
_______
* + = Favorable change; - = Unfavorable change; NM = A percentage calculation is not meaningful due to a change in signs, a zero-value denominator, or a percentage change greater than 200.
Management’s Discussion and Analysis (Continued)
2024 vs. 2023
Service revenues increased primarily due to:
•Higher volumes from the November 2023 DJ Basin Acquisitions at the West segment and the January 2024 Gulf Coast Storage, August 2024 Discovery, and February 2023 MountainWest Acquisitions at the Transmission & Gulf of America segment; partially offset by lower volumes from the September 2023 sale of certain liquids pipelines at the Transmission & Gulf of America segment (See Note 3 – Acquisitions and Divestitures),
•Higher revenues associated with expansion projects at the Transmission & Gulf of America segment, partially offset by
•Lower gathering volumes at the West and Northeast G&P segments.
The net sum of Product sales and service revenues – commodity consideration, Product costs and net processing commodity expenses, and net realized gains and losses on commodity derivatives related to sales of product and shrink gas purchases for processing plants for the reportable segments comprise Commodity Margins. Service revenues - commodity consideration represent payments received in the form of commodities for processing services provided. Most of these commodity volumes are sold during the month processed and are offset within Product costs and net processing commodity expenses. The sum of Product sales and net realized gains and losses on commodity derivatives related to the upstream operations comprise Net realized product sales.
The Product sales and service revenues – commodity consideration increase primarily consists of:
•Higher marketing sales activities primarily at the West segment primarily related to the DJ Basin Acquisitions and Transmission & Gulf of America segment primarily related to the Discovery Acquisition, as previously discussed; partially offset by lower marketing sales activities related to NGLs at the Gas & NGL Marketing Services segment, primarily related to activity associated with the sale certain liquids pipelines, as previously discussed. Net natural gas marketing sales were impacted by higher storage costs; partially offset by
•Lower system management gas sales primarily at the Transmission & Gulf of America segment;
•Lower product sales from upstream operations; partially offset by higher volumes from the November 2024 Crowheart Acquisition at Other (See Note 3 – Acquisitions and Divestitures);
•Lower equity NGL sales and commodity consideration revenues associated with NGL production activity primarily at the West segment; partially offset by higher activity in the Transmission & Gulf of America segment primarily due to the Discovery Acquisition, as previously discussed.
As Williams is acting as agent for natural gas marketing customers, its natural gas marketing product sales are presented net of the related costs of those activities within the Gas & NGL Marketing Services segment.
Net gain (loss) from commodity derivatives includes realized and unrealized gains and losses from derivative instruments reflected within Total revenues primarily in the Gas & NGL Marketing Services and West segments, and at Other (see Note 17 – Commodity Derivatives).
Williams experiences significant earnings volatility from the fair value accounting required for the derivatives used to hedge a portion of the economic value of the underlying transportation and storage capacity portfolios as well as upstream-related production. However, the unrealized fair value measurement gains and losses are generally offset by valuation changes in the economic value of the underlying production or transportation and storage capacity contracts, which are not recognized until the underlying transaction occurs.
Management’s Discussion and Analysis (Continued)
The Product costs and net processing commodity expenses increase primarily consists of:
•Higher marketing activities primarily at the West segment primarily related to the DJ Basin Acquisitions and Transmission & Gulf of America segment primarily related to the Discovery Acquisition, as previously discussed; partially offset by lower marketing activities primarily related to NGLs at the Gas & NGL Marketing Services segment; partially offset by
•Lower shrink natural gas purchases and commodity consideration costs associated with Williams’ equity NGL production activities primarily at the West segment.
Operating and maintenance expenses increased primarily due to operating costs of the assets acquired at the West and Transmission & Gulf of America segments; as well as unfavorable changes in employee-related costs, including the impact of a change in a practice related to payroll timing; and the net imbalance liability due to changes in pricing.
Depreciation and amortization expenses increased primarily related to the assets acquired at the Transmission & Gulf of America and West segments and an increase at Transco related to additional assets placed in service. The increase is partially offset by lower amortization of intangibles related to the acquisition of Sequent Energy Management, L.P. and Sequent Energy Canada, Corp. (Sequent) in 2021.
Selling, general, and administrative expenses increased primarily due to employee-related costs, including the impact of a change in a practice related to payroll timing, partially offset by lower acquisition and transition-related costs associated with the MountainWest Acquisition (see Note 3 – Acquisitions and Divestitures).
Gain on sale of business reflects a gain from the sale of certain liquids pipelines in the Transmission & Gulf of America segment in 2023, as previously discussed.
Other (income) expense – net within Operating income (loss) includes lower project feasibility costs at our Transmission & Gulf of America segment; partially offset by the absence of a 2023 gain related to a contract settlement.
Equity earnings (losses) changed unfavorably primarily due to the impacts of the consolidation of RMM and Discovery, as previously discussed, and the sale of the interests in Aux Sable (see Note 8 – Investing Activities), partially offset by the absence of the share of a loss contingency accrual in 2023 at Aux Sable and favorable results at OPPL.
Other investing income (loss) – net includes gains on the sale of the interests in Aux Sable and the gain on remeasuring the existing equity-method investment in Discovery to fair value with the acquisition of the remaining 40 percent ownership, as previously discussed, partially offset by the absence the 2023 gain on remeasuring the existing equity-method investment in RMM to fair value with the acquisition of the remaining 50 percent ownership (see Note 8 – Investing Activities).
The increase in Interest expense was primarily due to Williams’ 2023 and 2024 debt issuances, and imputed interest on deferred consideration obligations related to the DJ Basin and Gulf Coast Storage Acquisitions, as previously discussed, partially offset by 2023 and 2024 debt retirements (see Note 13 – Debt and Banking Arrangements).
Net gain from Energy Transfer litigation judgment resulted from a favorable ruling on the final order and judgment of Williams’ complaint against Energy Transfer in 2023 (see Note 1 – General, Description of Business, Basis of Presentation, and Summary of Significant Accounting Policies).
Provision (benefit) for income taxes changed favorably primarily due to lower pre-tax income and a higher benefit associated with decreases in Williams’ estimate of the state deferred income tax rate in both periods. See Note 6 – Provision (Benefit) for Income Taxes for a discussion of the effective tax rate compared to the federal statutory rate for both periods.
Management’s Discussion and Analysis (Continued)
Income (loss) from discontinued operations in 2023 includes a pre-tax charge of $125 million to increase the accrued liability associated with the Alaska refinery contamination litigation, partially offset by the related income tax effect (see Note 1 – General, Description of Business, Basis of Presentation, and Summary of Significant Accounting Policies).
2023 vs. 2022
Service revenues increased primarily due to:
•Higher volumes from acquisitions at the Transmission & Gulf of America segment;
•Higher volumes and rates at the Northeast G&P segment; partially offset by
•Lower rates, partially offset by higher volumes at the West segment.
The Product sales and service revenues – commodity consideration decrease primarily consists of:
•Lower marketing sales activities at the Gas & NGL Marketing Services segment;
•Lower sales from upstream operations at Other;
•Lower equity NGL sales prices primarily at the West and Transmission & Gulf of America segments;
•Lower system management gas sales primarily at the West and Transmission & Gulf of America segments.
Net gain (loss) from commodity derivatives includes realized and unrealized gains and losses from derivative instruments reflected within Total revenues primarily in the Gas & NGL Marketing Services and West segments, and at Other.
The Product costs and net processing commodity expenses decrease primarily consists of:
•Lower marketing activities at the Gas & NGL Marketing Services segment;
•Lower costs associated with NGLs acquired as commodity consideration related to Williams’ equity NGL production activities;
•Lower system management gas purchases primarily at the West and Transmission & Gulf of America segments.
•Unfavorable change in unrealized gains and losses from commodity derivatives related to processing plant shrink gas purchases;
•Partially offset by lower natural gas purchases due to lower prices associated with Williams’ equity NGL production activities primarily at the West and Transmission & Gulf of America segments.
Operating and maintenance expenses increased primarily due to higher operating costs, including increased costs associated with the February 2023 MountainWest Acquisition, the April 2022 Trace Acquisition, and the August 2022 NorTex Asset Purchase, and increased scope and timing of operating and maintenance activities.
Depreciation and amortization expenses increased primarily related to the upstream assets, and assets acquired in the February 2023 MountainWest Acquisition, the April 2022 Trace Acquisition, and the August 2022 NorTex Asset Purchase. The increase is partially offset by lower amortization of intangibles related to the acquisition of Sequent in 2021.
Selling, general, and administrative expenses increased primarily due to acquisition and transition-related costs associated with the MountainWest Acquisition.
Management’s Discussion and Analysis (Continued)
Gain on sale of business resulted from the sale of certain liquids pipelines in the Gulf Coast region, as previously discussed.
Other (income) expense – net within Operating income (loss) changed favorably primarily due to:
•A favorable change associated with regulatory liabilities established for the impacts of deferred income taxes at NWP and the absence of 2022 regulatory charges associated with a decrease in Transco’s estimated deferred state income tax rate;
•The absence of a 2022 loss related to Eminence storage cavern abandonments;
•A 2023 gain related to a contract settlement.
Equity earnings (losses) changed unfavorably primarily due to a decrease at Laurel Mountain and the share of a loss contingency accrual related to the 14 percent ownership in Aux Sable, partially offset by increases at Blue Racer and OPPL.
The favorable change in Other investing income (loss) – net includes higher interest income earned on higher cash and cash equivalent balances, and a gain on remeasuring the existing equity-method investment in RMM, as previously discussed.
The increase in Interest expense was primarily due to Williams’ 2023 debt issuances and MountainWest’s long-term debt, partially offset by an increase in interest capitalized related to ongoing expansion projects.
Net gain from Energy Transfer litigation judgment resulted from a favorable ruling on the final order and judgment of Williams’ complaint against Energy Transfer, as previously discussed.
The favorable change in Other income (expense) – net below Operating income (loss) includes an increase in equity allowance for funds used during construction (equity AFUDC) at the Transmission & Gulf of America segment and the related effects of deferred taxes within Other.
Income (loss) from discontinued operations in 2023 includes a pre-tax charge of $125 million to increase the accrued liability associated with our Alaska refinery contamination litigation, partially offset by the related income tax effect.
Provision (benefit) for income taxes changed unfavorably primarily due to higher pre-tax income, the absence of a benefit related to the release of valuation allowances on deferred income tax assets in 2022, a lower benefit associated with decreases in the Williams’ estimate of the state deferred income tax rate in both periods, and the absence of 2022 federal income tax settlements.
The unfavorable change in Net income (loss) attributable to noncontrolling interests is primarily due to higher results at Cardinal and the Northeast JV.
Period-Over-Period Operating Results – Williams’ Segments
Williams’ chief operating decision maker evaluates segment operating performance based upon Modified EBITDA. Note 19 – Segment Disclosures includes a reconciliation of this non-GAAP measure to Income (loss) before income taxes from continuing operations. Management uses Modified EBITDA because it is an accepted financial indicator used by investors to compare company performance. In addition, management believes that this measure provides investors an enhanced perspective of the operating performance of Williams’ assets. Modified EBITDA should not be considered in isolation or as a substitute for a measure of performance prepared in accordance with GAAP.
Management’s Discussion and Analysis (Continued)
Transmission & Gulf of America
| | | | | | | | | | | | | | | | | | | | | |
| | | | | Year Ended December 31, |
| | | | | |
| | | | | 2024 | | 2023 | | 2022 |
| | | | | (Millions) |
| Service revenues | | | | | $ | 4,246 | | | $ | 3,858 | | | $ | 3,579 | |
| | | | | | | | | |
| | | | | | | | | |
| Product sales and service revenues – commodity consideration (1) | | | | | 382 | | | 290 | | | 468 | |
| Net realized gain (loss) from commodity derivatives (1) | | | | | — | | | 2 | | | — | |
| Segment revenues | | | | | 4,628 | | | 4,150 | | | 4,047 | |
| | | | | | | | | |
| | | | | | | | | |
| | | | | | | | | |
| Product costs and net processing commodity expenses (1) | | | | | (329) | | | (259) | | | (425) | |
| Other segment costs and expenses | | | | | (1,199) | | | (1,157) | | | (1,141) | |
| | | | | | | | | |
| | | | | | | | | |
| Gain on sale of business | | | | | — | | | 129 | | | — | |
| Proportional Modified EBITDA of equity-method investments | | | | | 173 | | | 205 | | | 193 | |
| Transmission & Gulf of America Modified EBITDA | | | | | $ | 3,273 | | | $ | 3,068 | | | $ | 2,674 | |
| | | | | | | | | |
| Commodity margins | | | | | $ | 53 | | | $ | 33 | | | $ | 43 | |
_______________
(1)Included as a component of Commodity margins.
2024 vs. 2023
Transmission & Gulf of America Modified EBITDA increased primarily due to higher Service revenues, partially offset by the absence of a Gain on sale of business, higher Other segment costs and expenses, and lower Proportional Modified EBITDA of equity-method investments.
Service revenues increased primarily due to:
•A $220 million increase primarily in storage revenues due to the Gulf Coast Storage Acquisition in January 2024 (see Note 3 – Acquisitions and Divestitures);
•A $121 million increase in Transco’s revenues primarily associated with expansion projects and higher park and loan services;
•A $41 million increase primarily in gathering revenues due to the Discovery Acquisition in August 2024 (see Note 3 – Acquisitions and Divestitures);
•A $38 million increase in primarily transportation and storage revenues due to the MountainWest Acquisition in February 2023 (see Note 3 – Acquisitions and Divestitures);
•A $22 million increase in NorTex’s revenues primarily associated with higher storage rates; partially offset by
•A $39 million decrease primarily in transportation revenues due to the sale of certain liquids pipelines in the Gulf Coast region in September 2023 (see Note 3 – Acquisitions and Divestitures);
•A $34 million decrease in the Eastern Gulf region primarily due to shut-ins for producer operational issues at Gulfstar One in the Gunflint and Tubular Bells fields and weather-related events, partially offset by higher primarily production handling volumes from a new well at Gulfstar One in the Pickerel field.
Other segment costs and expenses increased primarily due to:
•Higher operating expenses and administrative costs including higher operating, acquisition and transition costs related to Williams’ Gulf Coast Storage and Discovery Acquisitions, as previously discussed; and
Management’s Discussion and Analysis (Continued)
employee-related costs, including the impact of a change in a practice related to payroll timing; partially offset by significantly lower acquisition and transition costs related to Williams’ MountainWest Acquisition, as previously discussed, contract services at Transco, and operating costs related to the sale of certain liquids pipelines in the Gulf Coast region, as previously discussed;
•Unfavorable change in the amortization of regulatory pension liabilities at Transco; partially offset by
•Lower project feasibility costs;
•A favorable change in equity AFUDC primarily as a result of increased capital expenditures at Williams’ regulated businesses.
Commodity margins increased primarily due to a $19 million increase from Williams’ equity NGLs primarily due to the Discovery Acquisition, as previously discussed.
Gain on sale of business reflects a gain recognized on the sale of certain liquids pipelines in the Gulf Coast region in September 2023, as previously discussed.
Proportional Modified EBITDA of equity-method investments decreased primarily due to lower proportional results as Discovery was consolidated, as previously discussed.
2023 vs. 2022
Transmission & Gulf of America Modified EBITDA increased primarily due to higher Service revenues and a Gain on sale of business.
Service revenues increased primarily due to:
•A $222 million increase due to the acquisition of MountainWest primarily in transportation and storage revenues;
•A $42 million increase due to the NorTex Asset Purchase primarily in storage and transportation revenues;
•A $30 million increase in the Eastern Gulf Coast region primarily due to higher production handling volumes from new wells at Devils Tower, partially offset by lower volumes from the Norphlet pipeline due to natural decline;
•A $15 million increase in Transco’s revenues associated with the Regional Energy Access expansion project placed partially in-service in the fourth quarter of 2023;
•A $12 million increase in Transco’s and Northwest Pipeline’s revenues associated with short-term firm transportation; partially offset by
•A $19 million decrease due to lower rates from the FERC rate case settlement effective January 1, 2023, at Northwest Pipeline;
•A $14 million decrease in reimbursable electric power costs and storage rates, offset by similar changes in electricity charges and storage costs, reflected in Other segment costs and expenses;
•A $10 million decrease due to the sale of certain liquids pipelines in the Gulf Coast region in September 2023 primarily in transportation revenues.
Commodity margins decreased primarily due to a $15 million decrease from Williams’ equity NGLs, driven by unfavorable net realized pricing for equity NGL sales, partially offset by lower prices for natural gas purchases associated with its equity NGL production activities.
Management’s Discussion and Analysis (Continued)
Other segment costs and expenses increased primarily due to:
•Higher operating and administrative costs including higher operating, acquisition, and transition costs related to Williams’ MountainWest Acquisition and NorTex Asset Purchase; and higher costs related to timing and scope of general maintenance activities primarily at Transco, partially offset by lower reimbursable electric power costs and storage costs, which are offset by a similar change in electricity reimbursements and storage revenues reflected in Service revenues; and lower employee-related costs;
•Higher project feasibility costs; partially offset by
•Favorable changes associated with regulatory liabilities established for the impacts of deferred income taxes at Northwest Pipeline associated with the FERC rate case settlement mentioned above in Service revenues and the absence of 2022 regulatory charges associated with decreases in Transco’s estimated deferred state income tax rate;
•A favorable change in equity AFUDC as a result of increased capital expenditures at Transco;
•The absence of losses related to Eminence storage cavern abandonments in 2022.
Gain on sale of business reflects a gain recognized on the sale of certain liquids pipelines in the Gulf Coast region in September 2023, as previously discussed.
Northeast G&P
| | | | | | | | | | | | | | | | | | | | | |
| | | | | Year Ended December 31, |
| | | | | |
| | | | | 2024 | | 2023 | | 2022 |
| | | | | (Millions) |
| Service revenues | | | | | $ | 1,913 | | | $ | 1,896 | | | $ | 1,654 | |
| Product sales and service revenues – commodity consideration (1) | | | | | 112 | | | 137 | | | 148 | |
| Segment revenues | | | | | 2,025 | | | 2,033 | | | 1,802 | |
| | | | | | | | | |
| Product costs and net processing commodity expenses (1) | | | | | (88) | | | (125) | | | (138) | |
| Other segment costs and expenses | | | | | (581) | | | (566) | | | (522) | |
| | | | | | | | | |
| Proportional Modified EBITDA of equity-method investments | | | | | 602 | | | 574 | | | 654 | |
| Northeast G&P Modified EBITDA | | | | | $ | 1,958 | | | $ | 1,916 | | | $ | 1,796 | |
| | | | | | | | | |
| Commodity margins | | | | | $ | 24 | | | $ | 12 | | | $ | 10 | |
(1)Included as a component of Commodity margins.
2024 vs. 2023
Northeast G&P Modified EBITDA increased primarily due to higher Proportional Modified EBITDA of equity-method investments, higher Service revenues, and higher Commodity margins, partially offset by higher Other segment costs and expenses.
Service revenues increased primarily due to:
•A $20 million increase in revenues at the Northeast JV primarily related to higher gathering volumes as well as higher transportation & fractionation, gathering, and processing rates, partially offset by lower transportation & fractionation and processing volumes;
Management’s Discussion and Analysis (Continued)
•A $16 million increase in joint venture operating fees primarily related to assuming operatorship of Blue Racer effective January 1, 2024, (which is significantly offset by higher Other segment costs and expenses discussed below);
•An $11 million increase in revenues associated with reimbursable expenses, which is offset by similar changes in the charges reflected in Other segment costs and expenses; partially offset by
•A $19 million decrease in gathering revenues at Susquehanna Supply Hub primarily related to lower volumes partially offset by escalated rates;
•A $16 million decrease in gathering revenues in the Utica Shale region primarily related to lower volumes at Flint and Cardinal partially offset by escalated rates.
Commodity margins increased due to a restructured gas purchase deal in 2024 which allowed for margin gain on residue pricing and liquids from fixed recoveries. In addition, Williams was not significantly impacted by system constraints which impacted margins in 2023.
Other segment costs and expenses increased primarily due to higher employee-related costs, including the impact of a change in a practice related to payroll timing, as well as higher operating expenses, including higher electricity and fuel, and increased support costs related to assuming operatorship of Blue Racer effective January 1, 2024 (substantially offset by higher Service revenues discussed above). The increase was partially offset by lower maintenance expenses and the absence of the 2023 loss contingency accrual.
Proportional Modified EBITDA of equity-method investments increased at Aux Sable Liquid Products LP primarily due to the absence of Williams’ $31 million share of a loss contingency accrual related to its former ownership in 2023, as well as the terms of the new product marketing agreement, partially offset by the sale of Williams’ investment in Aux Sable Liquid Products LP in the third quarter of 2024. Additionally, Appalachia Midstream Investments increased primarily driven by higher gathering rates partially offset by lower volumes and higher expenses.
2023 vs. 2022
Northeast G&P Modified EBITDA increased primarily due to higher Service revenues, partially offset by lower Proportional Modified EBITDA of equity-method investments and higher Other segment costs and expenses.
Service revenues increased primarily due to:
•A $92 million increase in revenues at the Northeast JV primarily related to higher transportation & fractionation, processing, and gathering volumes as well as higher processing rates;
•An $84 million increase in revenues in the Utica Shale region primarily related to higher gathering rates resulting from annual cost-of-service contract redeterminations and higher volumes, partially offset by the absence of proceeds from the release of an acreage dedication in 2022;
•A $61 million increase in gathering revenues at Susquehanna Supply Hub primarily related to escalated rates as well as higher volumes.
Other segment costs and expenses increased primarily due to increased scope of operations, a loss contingency accrual, and higher operating taxes.
Proportional Modified EBITDA of equity-method investments decreased at Laurel Mountain due to lower commodity-based gathering rates, MVC, and volumes, and at Aux Sable Liquid Products LP primarily due to Williams’ $31 million share of a loss contingency accrual related to its former ownership in 2023. The decrease was partially offset by an increase at Blue Racer primarily driven by higher gathering and processing volumes. Additionally, Appalachia Midstream Investments increased primarily driven by higher gathering volumes and
Management’s Discussion and Analysis (Continued)
annual rate escalations at Marcellus South, partially offset by lower gathering rates resulting from annual cost-of-service contract redeterminations and lower volumes at the Bradford Supply Hub.
West
| | | | | | | | | | | | | | | | | | | | | |
| | | | | Year Ended December 31, |
| | | | | |
| | | | | 2024 | | 2023 | | 2022 |
| | | | | (Millions) |
| Service revenues | | | | | $ | 1,718 | | | $ | 1,502 | | | $ | 1,542 | |
| Product sales and service revenues – commodity consideration (1) | | | | | 947 | | | 544 | | | 1,023 | |
| | | | | | | | | |
| Net realized gain (loss) from commodity derivatives relating to service revenues | | | | | 10 | | | 82 | | | (1) | |
| Net realized gain (loss) from commodity derivatives relating to product sales (1) | | | | | (6) | | | 7 | | | (3) | |
| Net realized gain (loss) from commodity derivatives | | | | | 4 | | | 89 | | | (4) | |
| | | | | | | | | |
| Segment revenues | | | | | 2,669 | | | 2,135 | | | 2,561 | |
| | | | | | | | | |
| Product costs and net processing commodity expenses (1) | | | | | (844) | | | (517) | | | (918) | |
| Other segment costs and expenses | | | | | (645) | | | (542) | | | (564) | |
| | | | | | | | | |
| Proportional Modified EBITDA of equity-method investments | | | | | 132 | | | 162 | | | 132 | |
| West Modified EBITDA | | | | | $ | 1,312 | | | $ | 1,238 | | | $ | 1,211 | |
| | | | | | | | | |
| Commodity margins | | | | | $ | 97 | | | $ | 34 | | | $ | 102 | |
| | | | | | | | | |
________________
(1) Included as a component of Commodity margins.
2024 vs. 2023
West Modified EBITDA increased primarily due higher Service revenues and Commodity margins, partially offset by higher Other segment costs and expenses, an unfavorable change in Net realized gain (loss) from commodity derivatives relating to service revenues, and lower Proportional Modified EBITDA of equity-method investments.
Service revenues increased primarily due to:
•A $249 million increase in the DJ Basin region associated with the DJ Basin Acquisitions in November 2023 (see Note 3 – Acquisitions and Divestitures);
•A $35 million increase in other NGL operations associated with higher fractionation and transportation revenue due to higher volumes and higher storage fees primarily due to a new contract;
•A $14 million increase in the Wamsutter region primarily associated with higher gathering volumes from increased producer activity as well as higher volumes associated with the absence of weather-related events in first-quarter 2023;
•A $12 million increase associated with reimbursable compressor power and fuel purchases primarily due to the DJ Basin Acquisitions as previously discussed, which are offset by similar changes in Other segment costs and expenses; partially offset by
•A $45 million decrease in the Haynesville Shale region primarily due to lower gathering volumes from decreased producer activity, partially offset by higher gathering rates;
•A $31 million decrease in the Eagle Ford Shale region primarily due to lower MVC revenues;
Management’s Discussion and Analysis (Continued)
•A $24 million decrease in the Barnett Shale region primarily due to lower gathering rates driven by unfavorable commodity pricing and lower gathering volumes.
Net realized gain (loss) from commodity derivatives relating to service revenues reflects an unfavorable change in settled commodity prices relative to Williams’ natural gas hedge positions.
Commodity margins increased $63 million primarily due to $39 million higher margins associated with the DJ Basin Acquisitions, as previously discussed. Margins also increased $21 million from Williams’ equity NGLs primarily due to lower net realized prices for natural gas purchases and lower volumes of natural gas purchased both associated with equity NGL production activities; partially offset by lower volumes of equity NGL sold and lower net realized NGL sales prices.
Other segment costs and expenses increased primarily due to higher operating and employee-related expenses including those resulting from the DJ Basin Acquisitions, as previously discussed, the absence of favorable contract settlements in first-quarter 2023, an unfavorable change in Williams’ net imbalance liability due to changes in pricing, higher reimbursable compressor power and fuel purchases which are offset in Service revenues, and the impact of a change in a practice related to payroll timing; partially offset by higher system gains and the absence of a fourth quarter 2023 write-down of assets held for sale.
Proportional Modified EBITDA of equity-method investments decreased primarily due to lower proportional results as RMM was consolidated related to the DJ Basin Acquisitions, as previously discussed, partially offset by higher volumes and higher commodity prices at OPPL.
2023 vs. 2022
West Modified EBITDA increased primarily due to a favorable change in Net realized gain (loss) from commodity derivatives relating to service revenues, higher Proportional Modified EBITDA of equity-method investments, and lower Other segment costs and expenses, partially offset by lower Commodity margins and Service revenues.
Service revenues decreased primarily due to:
•A $120 million decrease in the Barnett Shale region primarily due to lower gathering rates driven by unfavorable commodity pricing;
•A $13 million decrease in the Eagle Ford Shale region primarily due to lower MVC revenues, partially offset by escalated gathering rates and higher gathering volumes;
•A $6 million decrease associated with reimbursable compressor power and fuel purchases primarily due to lower prices, which are offset by similar changes in Other segment costs and expenses; partially offset by
•A $69 million increase in the Haynesville Shale region primarily associated with higher gathering volumes including from increased producer activity and the Trace Acquisition in April 2022, partially offset by lower rates driven by unfavorable commodity pricing;
•A $25 million increase in the DJ Basin region primarily associated with the DJ Basin Acquisitions in November 2023 as previously discussed;
•A $15 million increase in our other NGL operations associated with higher storage fees primarily due to a new contract as well as higher fractionation fees primarily due to higher volumes partially offset by lower rates from lower natural gas prices.
Net realized gain (loss) from commodity derivatives relating to service revenues reflects a favorable change in settled commodity prices relative to Williams’ natural gas hedge positions.
Commodity margins decreased $68 million primarily due a $46 million decrease from Williams’ equity NGLs and a $14 million decrease from other sales activities, both primarily due to lower net realized commodity pricing.
Management’s Discussion and Analysis (Continued)
Other segment costs and expenses decreased primarily due to a favorable change in Williams’ net imbalance liability due to changes in pricing, favorable contract settlements in first-quarter 2023, lower corporate allocations, and lower reimbursable compressor power and fuel purchases which are substantially offset in Service revenues. These items were partially offset by higher operating expenses related to operations including those acquired in the Trace Acquisition and the DJ Basin Acquisitions, lower system gains at Wamsutter, and a fourth quarter 2023 write-down of assets held for sale.
Proportional Modified EBITDA of equity-method investments increased primarily due to higher volumes at OPPL as well as higher volumes at RMM, partially offset by lower proportional results as RMM was consolidated related to the DJ Basin Acquisitions.
Gas & NGL Marketing Services
| | | | | | | | | | | | | | | | | | | | | |
| | | | | Year Ended December 31, |
| | | | | |
| | | | | 2024 | | 2023 | | 2022 |
| | | | | (Millions) |
| Service revenues | | | | | $ | — | | | $ | 1 | | | $ | 3 | |
| Product sales (1) | | | | | 2,052 | | | 2,060 | | | 3,534 | |
| | | | | | | | | |
| Net realized gain (loss) from commodity derivative instruments (1) | | | | | 72 | | | 115 | | | 17 | |
| Net unrealized gain (loss) from commodity derivative instruments | | | | | (335) | | | 702 | | | (321) | |
| Net gain (loss) from commodity derivatives | | | | | (263) | | | 817 | | | (304) | |
| | | | | | | | | |
| Segment revenues | | | | | 1,789 | | | 2,878 | | | 3,233 | |
| | | | | | | | | |
| Product costs (1) | | | | | (1,799) | | | (1,786) | | | (3,228) | |
Net unrealized gain (loss) from commodity derivative instruments within Net processing commodity expenses | | | | | (6) | | | (43) | | | 47 | |
| Other segment costs and expenses | | | | | (108) | | | (99) | | | (92) | |
| Gas & NGL Marketing Services Modified EBITDA | | | | | $ | (124) | | | $ | 950 | | | $ | (40) | |
| | | | | | | | | |
| Commodity margins | | | | | $ | 325 | | | $ | 389 | | | $ | 323 | |
________________(1) Included as a component of Commodity margins.
2024 vs. 2023
Gas & NGL Marketing Services Modified EBITDA decreased primarily due to an unfavorable change in Net unrealized gain (loss) from commodity derivative instruments and lower Commodity margins.
Commodity margins decreased $64 million primarily due to:
•A $44 million decrease in Williams’ natural gas marketing margins including $35 million of lower natural gas transportation capacity marketing margins due to less favorable net realized pricing spreads. The decrease in its natural gas marketing margins also includes $9 million of lower natural gas storage marketing margins primarily driven by higher storage fees and less favorable realized derivative gains, partially offset by a favorable change of $14 million in lower cost or net realizable value inventory adjustment;
•A $20 million decrease in Williams’ NGL marketing margins including an unfavorable change in net realized gains and losses on sale of inventory in 2024 compared to 2023 driven by unfavorable changes in non-ethane prices.
Management’s Discussion and Analysis (Continued)
The change in Net unrealized gain (loss) from commodity derivative instruments within Segment revenues and Net processing commodity expenses relates to derivative contracts that are not designated as hedges for accounting purposes. The change from 2023 is primarily due to a change in forward commodity prices relative to Williams’ hedge positions in 2024 compared to 2023.
2023 vs. 2022
Gas & NGL Marketing Services Modified EBITDA increased primarily due to a favorable change in Net unrealized gain (loss) from commodity derivative instruments within Segment revenues and higher Commodity margins, partially offset by an unfavorable change in Net unrealized gain (loss) from commodity derivative instruments within Net processing commodity expenses.
Commodity margins increased $66 million primarily due to:
•A $65 million increase from Williams’ natural gas marketing operations including $129 million of higher natural gas storage marketing margins primarily driven by a favorable change of $111 million in lower of cost or net realizable value adjustment; and the absence of a $15 million charge related to the remaining recognition of a purchase accounting inventory fair value adjustment in 2022. The increase in its natural gas marketing margins was partially offset by $64 million of lower natural gas transportation capacity marketing margins due to less favorable net realized pricing spreads;
•A $1 million increase in Williams’ NGL marketing margins including a $20 million favorable change in lower of cost or net realizable value inventory adjustments, partially offset by higher transportation and fractionation fees and an unfavorable change in net realized gains and losses on sale of inventory in 2023 compared to 2022 driven by an unfavorable change in NGL prices.
Net unrealized gain (loss) from commodity derivative instruments within Segment revenues and Net processing commodity expenses. The change from 2022 is primarily due to a change in forward commodity prices relative to Williams’ hedge positions in 2023 compared to 2022.
Other
| | | | | | | | | | | | | | | | | | | | | |
| | | | | | Year Ended December 31, |
| | | | | |
| | | | | | 2024 | | 2023 | | 2022 |
| | | | | | (Millions) |
| Service revenues | | | | | $ | 15 | | | $ | 16 | | | $ | 24 | |
| Product sales (1) | | | | | 420 | | | 442 | | | 706 | |
| | | | | | | | | |
| Net realized gain (loss) from derivative instruments (1) | | | | | 35 | | | 47 | | | (104) | |
| Net unrealized gain (loss) from derivative instruments | | | | | (26) | | | 1 | | | 25 | |
| Net gain (loss) from commodity derivatives | | | | | 9 | | | 48 | | | (79) | |
| | | | | | | | | |
| Net revenues from upstream operations, corporate, and other business activities. | | | | | 444 | | | 506 | | | 651 | |
| | | | | | | | | |
| Other costs and expenses | | | | | (209) | | | (197) | | | (217) | |
| Net gain from Energy Transfer litigation judgment | | | | | — | | | 534 | | | — | |
| Proportional Modified EBITDA of equity-method investments | | | | | 2 | | | (2) | | | — | |
| Modified EBITDA from upstream operations, corporate, and other business activities | | | | | $ | 237 | | | $ | 841 | | | $ | 434 | |
| | | | | | | | | |
| Net realized product sales | | | | | $ | 455 | | | $ | 489 | | | $ | 602 | |
________________(1) Included as a component of Net realized product sales.
Management’s Discussion and Analysis (Continued)
2024 vs. 2023
Modified EBITDA from upstream operations, corporate, and other business activities decreased primarily due to:
•A $34 million decrease in Net realized product sales from upstream operations primarily due to lower volumes and lower net realized commodity prices associated with Williams’ South Mansfield production in the Haynesville Shale region, and lower net realized commodity prices associated with Williams’ Wamsutter region. These decreases were partially offset by higher production volumes associated with Williams’ Wamsutter region production, including from the Crowheart Acquisition in the fourth quarter of 2024.
•A $27 million unfavorable change in Net unrealized gain (loss) from derivative instruments due to a change in forward commodity prices relative to hedge positions in 2024 compared to 2023;
•A $12 million unfavorable change in other costs and expenses primarily related to upstream operations; and
•The absence of a 2023 gain related to a favorable ruling on the final order and judgement of Williams’ complaint against Energy Transfer reflected in Net gain from Energy Transfer litigation judgment (see Note 1 – General, Description of Business, Basis of Presentation, and Summary of Significant Accounting Policies).
2023 vs. 2022
Modified EBITDA from upstream operations, corporate, and other business activities increased primarily due to the Net gain from Energy Transfer litigation judgment, as previously discussed, partially offset by lower results from Williams’ upstream operations, which included the following:
•A $113 million decrease in Net realized product sales primarily due to lower net realized commodity prices, partially offset by higher sales associated with increased production volumes. Higher natural gas production volumes from new wells in the Haynesville Shale region and higher crude oil production volumes from new wells in the Wamsutter region were partially offset by lower natural gas and NGL production volumes in the Wamsutter region driven by the impact of severe winter weather in 2023;
•A $24 million unfavorable change in Net unrealized gain (loss) from derivative instruments due to a change in forward commodity prices relative to Williams’ hedge positions in 2023 compared to 2022; partially offset by
•An increase in Other costs and expenses associated with upstream operations primarily due to increased production volumes and expenses related to severe winter weather in 2023, partially offset by lower associated ad valorem and production taxes, which were impacted by lower commodity prices and lower natural gas and NGL production volumes in the Wamsutter region.
Other costs and expenses not associated with upstream operations decreased primarily due to the absence of an $11 million charge related to an accrual for loss contingency in the third quarter of 2022 and a $19 million favorable change associated with regulatory assets related to the effects of deferred taxes on equity funds used during construction.
Management’s Discussion and Analysis (Continued)
Transco
| | | | | | | | | | | | | | | | | | | | | | | | | | |
| | Year Ended December 31, |
| | 2024 | | $ Change from 2023* | | % Change from 2023* | | 2023 |
| | (Millions) |
| Revenues: | | | | | | | | |
| Natural gas transportation service revenues | | $ | 2,619 | | | +113 | | | +5 | % | | $ | 2,506 | |
| Natural gas storage service revenues | | 200 | | | +14 | | | +8 | % | | 186 | |
| Natural gas product sales | | 118 | | | -19 | | | -14 | % | | 137 | |
| Other service revenues | | 27 | | | -10 | | | -27 | % | | 37 | |
| Total revenues | | 2,964 | | | | | | | 2,866 | |
| | | | | | | | |
| Costs and expenses: | | | | | | | | |
| Natural gas product costs | | 118 | | | +19 | | | +14 | % | | 137 | |
| Operating and maintenance expenses | | 510 | | | +7 | | | +1 | % | | 517 | |
| Selling, general, and administrative expenses | | 216 | | | -1 | | | — | % | | 215 | |
| Depreciation and amortization expenses | | 545 | | | -26 | | | -5 | % | | 519 | |
| Taxes, other than income taxes | | 111 | | | -6 | | | -6 | % | | 105 | |
| | | | | | | | |
| Other (income) expense – net | | (35) | | | -3 | | | -8 | % | | (38) | |
| Total costs and expenses | | 1,465 | | | | | | | 1,455 | |
| | | | | | | | |
| Operating income (loss) | | 1,499 | | | +88 | | | +6 | % | | 1,411 | |
| | | | | | | | |
| Interest expense | | (324) | | | — | | | — | % | | (324) | |
| Interest income | | 58 | | | -29 | | | -33 | % | | 87 | |
| Allowance for equity and borrowed funds used during construction (AFUDC) | | 88 | | | +11 | | | +14 | % | | 77 | |
| Other income (expense) – net | | (8) | | | -4 | | | -100 | % | | (4) | |
| | | | | | | | |
| Net income (loss) | | $ | 1,313 | | | +66 | | | +5 | % | | $ | 1,247 | |
_______
* + = Favorable change; - = Unfavorable change; NM = A percentage calculation is not meaningful due to a change in signs, a zero-value denominator, or a percentage change greater than 200.
2024 vs. 2023
Variances due to the changes in natural gas prices and transportation volumes have little impact on revenues because, under our rate design methodology, the majority of overall cost of service is recovered through firm capacity reservation charges in Transco’s transportation rates.
Transco has cash out sales, which settle gas imbalances with shippers. In the course of providing transportation services to customers, Transco may receive different quantities of gas from shippers than the quantities delivered on behalf of those shippers. Additionally, Transco transports gas on various pipeline systems, which may deliver different quantities of gas on Transco’s behalf than the quantities of gas received from Transco. These transactions
Management’s Discussion and Analysis (Continued)
result in gas transportation and exchange imbalance receivables and payables. Transco’s tariff includes a method whereby the majority of transportation imbalances are settled on a monthly basis through cash out sales or purchases. The cash out sales have no impact on Transco’s operating income.
Revenues increased primarily due to:
•A $113 million increase in Natural gas transportation service revenues due to additional capacity from placing the Regional Energy Access Expansion into service during the fourth quarter of 2023 and in August 2024, the impact of placing the Carolina Market Link Expansion into service during the first quarter of 2024, the impact of placing partially the Southside Reliable Enhancement into service in November 2024, and an additional billing day, partially offset by lower electric power costs in 2024. Electric power costs are recovered from our customers through transportation rates and are offset in Operating and maintenance expenses resulting in no net impact on our results of operations;
•A $14 million increase in Natural gas storage service revenues primarily due to an increase in rates and an additional billing day;
•A $19 million decrease in Natural gas product sales due to lower pricing offset by higher cash-out volumes, which directly offsets in Natural gas product costs resulting in no net impact on our results of operations;
•A $10 million decrease in Other service revenues primarily due to park and loan services.
Natural gas product costs decreased, directly offsetting Natural gas product sales and resulting in no net impact on our results of operations.
Operating and maintenance expenses decreased primarily due to lower electric power costs. Electric power costs are recovered from customers through transportation rates and are offset in Natural gas transportation service revenues resulting in no net impact on results of operations; additionally there were increases in Operating and maintenance expenses costs from employee-related costs, including the impact of a change in a practice related to payroll timing, offset by a decrease in contractor services costs.
Depreciation and amortization expenses increased as a result of additional assets placed in service and an increase in ARO-related depreciation (offset in Other income (expense) – net resulting in no net impact on our results of operations).
Taxes, other than income taxes increased primarily due to an increase in property tax as a result of valuation increases in 2024.
Other (income) expense – net incurred an unfavorable change primarily driven by an unfavorable change in the amortization of the regulatory pension liabilities, partially offset by a favorable change in the materials and supplies obsolete inventory reserve and a favorable change associated with the deferral of ARO related depreciation (offset in Depreciation and amortization expenses resulting in no net impact on our results of operations).
Interest income decreased due to a decrease in affiliated interest income on our advances to Williams due to a lower note receivable balance during 2024.
Allowance for equity and borrowed funds used during construction (AFUDC) increased as a result of increased capital expenditures.
Other income (expense) – net increased resulting from various increased expenses incurred in 2024.
Management’s Discussion and Analysis (Continued)
NWP
| | | | | | | | | | | | | | | | | | | | | | | | | | |
| | Year Ended December 31, |
| | 2024 | | $ Change from 2023* | | % Change from 2023* | | 2023 |
| | (Millions) |
| Revenues: | | | | | | | | |
| Natural gas transportation service revenues | | $ | 416 | | | $ | +1 | | | — | % | | $ | 415 | |
| Natural gas storage service revenues | | 15 | | | — | | | — | % | | 15 | |
| Other service revenues | | 13 | | | +3 | | | +30 | % | | 10 | |
| Total revenues | | 444 | | | | | | | 440 | |
| | | | | | | | |
| Costs and expenses: | | | | | | | | |
| Operating and maintenance expenses | | 95 | | | -7 | | | -8 | % | | 88 | |
| Selling, general, and administrative expenses | | 51 | | | — | | | — | % | | 51 | |
| Depreciation and amortization expenses | | 111 | | | — | | | — | % | | 111 | |
| Taxes, other than income taxes | | 14 | | | -2 | | | -17 | % | | 12 | |
| | | | | | | | |
| Other (income) expense - net | | (18) | | | +2 | | | +13 | % | | (16) | |
| Total costs and expenses | | 253 | | | | | | | 246 | |
| | | | | | | | |
| Operating income (loss) | | 191 | | | -3 | | | -2 | % | | 194 | |
| | | | | | | | |
| Interest expense | | (28) | | | — | | | — | % | | (28) | |
| Allowance for equity and borrowed funds used during construction (AFUDC) | | 10 | | | +6 | | | +150 | % | | 4 | |
| Other income (expense) – net | | 7 | | | -3 | | | -30 | % | | 10 | |
| | | | | | | | |
| Net income (loss) | | $ | 180 | | | $ | — | | | — | % | | $ | 180 | |
_______
* + = Favorable change; - = Unfavorable change; NM = A percentage calculation is not meaningful due to a change in signs, a zero-value denominator, or a percentage change greater than 200.
2024 vs. 2023
Variances due to changes in natural gas prices and transportation volumes have little impact on revenues, because under our rate design methodology, the majority of overall cost of service is recovered through firm capacity reservation charges in our transportation rates.
Revenues increased primarily due to:
•A $1 million increase in Natural gas transportation service revenues primarily due to an additional billing day in the leap year;
•A $3 million increase in Other service revenues from higher park and loan services.
Management’s Discussion and Analysis (Continued)
Operating and maintenance expenses increased due to higher labor costs, electricity expenses, and higher contract services related to pipeline maintenance inspection activities.
Allowance for equity and borrowed funds used during construction (AFUDC) increased due to increased capital expenditures in 2024.
Other income (expense) – net decreased due to lower interest income earned on NWP’s advances to affiliates, which had a reduced balance in 2024.
Management’s Discussion and Analysis (Continued)
Management’s Discussion and Analysis of Financial Condition and Liquidity
Overview
Williams
During 2024, investing and financing expenditures included $2.6 billion of capital expenditures, $2.2 billion of acquisitions including Gulf Coast Storage, Discovery, and Crowheart, and $2.3 billion of dividends paid to common shareholders. These expenditures were funded primarily by $4.974 billion of cash provided by operating activities. Williams ended the year with $60 million of Cash and cash equivalents. See also the following section titled Sources (Uses) of Cash.
Transco and NWP
Transco and NWP fund their capital requirements with cash flows from operating activities, equity contributions and advances from Williams, accessing capital markets, and, if required, borrowings under the credit facility (see Note 13 – Debt and Banking Arrangements).
Transco and NWP may raise capital through private debt offerings, as well as offerings registered pursuant to offering-specific registration statements. Interest rates, market conditions, and industry conditions will affect amounts raised, if any, in the capital markets. Transco and NWP anticipate that they will be able to access public and private debt markets on terms commensurate with their credit ratings to finance their capital requirements, when needed.
Transco and NWP are also participants in Williams’ cash management program, and both make advances to and receive advances from Williams. At December 31, 2024, Transco’s advances to Williams totaled approximately $638 million and NWP’s advances from Williams totaled approximately $26 million. These advances are represented by demand notes. See Note 4 – Related Party Transactions.
Outlook
Williams
Growth capital and investment expenditures in 2025 are expected to range from $1.65 billion to $1.95 billion, excluding acquisitions. Growth capital spending in 2025 primarily includes projects supporting growth in the Haynesville Shale basin (including Louisiana Energy Gateway expansion project), Transco expansions, all of which are fully contracted with firm transportation agreements and projects supporting the Northeast G&P business. Williams also expects to invest capital in the development of its upstream oil and gas properties. In addition to growth capital and investment expenditures, Williams also remains committed to projects that maintain its assets for safe and reliable operations, as well as projects that reduce emissions, and meet legal, regulatory, and/or contractual commitments. Williams intends to fund substantially all planned 2025 capital spending with cash available after paying dividends. Williams retains the flexibility to adjust planned levels of growth capital and investment expenditures in response to changes in economic conditions or business opportunities including the repurchase of its common stock.
On January 9, 2025, Williams issued $1.5 billion of long-term debt and on January 15, 2025, Williams retired $750 million of long term debt (see Note 13 – Debt and Banking Arrangements).
As of December 31, 2024, Williams has approximately $1.7 billion of long-term debt due within one year. Williams’ potential sources of liquidity available to address these maturities include cash on hand, proceeds from refinancing, the credit facility, or the commercial paper program, as well as proceeds from asset monetizations.
Transco and NWP
Transco and NWP categorize their capital expenditures as either maintenance capital expenditures or growth capital expenditures. Maintenance capital expenditures are those expenditures required to maintain the existing
Management’s Discussion and Analysis (Continued)
operating capacity and service capability of their assets, including replacement of system components and equipment that are worn, obsolete, completing their useful life, or necessary to remain in compliance with environmental laws and regulations. Growth capital expenditures improve the service capability of existing assets, extend useful lives, increase transmission or storage capacities from existing levels, reduce costs or enhance revenues. Transco and NWP anticipate 2025 growth capital expenditures will be approximately $336 million and $43 million, respectively, primarily for expansion projects, and $423 million and $186 million, respectively, for maintenance projects. They expect to fund these capital expenditures with cash from operations.
Liquidity
Williams expects to have sufficient liquidity to manage its businesses in 2025 based on forecasted levels of cash flow from operations and other sources of liquidity. Williams’ potential material internal and external sources and uses of liquidity are as follows:
| | | | | |
| Sources: | |
| Cash and cash equivalents on hand |
| Cash generated from operations |
| Distributions from equity-method investees |
| Utilization of the credit facility and/or commercial paper program |
| Cash proceeds from issuance of debt and/or equity securities |
| Proceeds from asset monetizations |
| Uses: | |
| Working capital requirements |
| Capital and investment expenditures |
| Product costs |
| Gas & NGL Marketing Services payments for transportation and storage capacity and gas supply |
| Other operating costs including human capital expenses |
| Quarterly dividends to shareholders |
| Repayments of borrowings under the credit facility and/or commercial paper program |
| Debt service payments, including payments of long-term debt |
| Distributions to noncontrolling interests |
| Share repurchase program |
As of December 31, 2024, Williams has approximately $24.7 billion of long-term debt due after one year. Potential sources of liquidity available to address these maturities include cash generated from operations, proceeds from refinancing, the credit facility, or the commercial paper program, as well as proceeds from asset monetizations.
Potential risks associated with Williams’ planned levels of liquidity discussed above include those previously discussed in Company Outlook.
As of December 31, 2024, Williams had a working capital deficit of $2.651 billion, including cash and cash equivalents and long-term debt due within one year. Williams available liquidity is as follows:
| | | | | | | | |
| | December 31, 2024 |
| | | (Millions) |
| Cash and cash equivalents | | $ | 60 | |
| Capacity available under Williams’ $3.75 billion credit facility, less amounts outstanding under Williams’ $3.5 billion commercial paper program (1) | | 3,295 | |
| | $ | 3,355 | |
__________
(1)In managing its available liquidity, Williams does not expect a maximum outstanding amount in excess of the capacity of its credit facility inclusive of any outstanding amounts under its commercial paper program. Williams had $455 million of Commercial paper (at par value) outstanding as of December 31, 2024. Through
Management’s Discussion and Analysis (Continued)
December 31, 2024, the highest amount outstanding under the commercial paper program and credit facility during 2024 was $730 million. Williams expects to be in compliance with the financial covenants associated with the credit facility for the December 31, 2024, reporting period.
Dividends
Williams increased the regular quarterly cash dividend to common stockholders by approximately 6.1 percent from the $0.4475 per share paid in each quarter of 2023, to $0.4750 per share paid in each quarter of 2024. On January 28, 2025, Williams’ board of directors approved a regular quarterly dividend of $0.5000 per share payable on March 31, 2025.
Registrations
In February 2024, Williams filed a shelf registration statement as a well-known seasoned issuer.
Distributions from Equity-Method Investees
The organizational documents of entities in which Williams has an equity-method investment generally require periodic distributions of their available cash to their members. In each case, available cash is reduced, in part, by reserves appropriate for operating their respective businesses. See Note 8 – Investing Activities for our more significant equity-method investees.
Credit Ratings
The interest rates at which Williams is able to borrow money are impacted by its credit ratings, which are currently as follows:
| | | | | | | | | | | | | | |
| Rating Agency | | Outlook | | Senior Unsecured
Debt Rating |
| S&P Global Ratings | | Positive | | BBB |
| Moody’s Investors Service | | Stable | | Baa2 |
| Fitch Ratings | | Positive | | BBB |
In January 2025, Fitch Ratings changed its Outlook from Stable to Positive.
These credit ratings are included for informational purposes and are not recommendations to buy, sell, or hold Williams securities, and each rating should be evaluated independently of any other rating. No assurance can be given that the credit rating agencies will continue to assign Williams investment-grade ratings even if it meets or exceeds their current criteria for investment-grade ratios. A downgrade of its credit ratings might increase Williams’ future cost of borrowing and, if ratings were to fall below investment-grade, could require it to provide additional collateral to third parties, negatively impacting Williams’ available liquidity.
Management’s Discussion and Analysis (Continued)
Sources (Uses) of Cash
The following table summarizes the sources (uses) of cash and cash equivalents for each of the periods presented in the Williams Consolidated Statement of Cash Flows:
| | | | | | | | | | | | | | | | | | | | | | | |
| | Cash Flow | | Year Ended December 31, |
| | Category | | 2024 | | 2023 | | 2022 |
| | | | (Millions) |
| Sources of cash and cash equivalents: | | | | | | | |
| Net cash provided (used) by operating activities | Operating | | $ | 4,974 | | | $ | 5,938 | | | $ | 4,889 | |
| Proceeds from long-term debt (Note 13) | Financing | | 3,594 | | | 2,755 | | | 1,755 | |
| | | | | | | |
Proceeds from sale of business (Note 3) | Investing | | — | | | 346 | | | — | |
| | | | | | | |
| Proceeds from dispositions of equity-method investments (Note 3) | Investing | | 161 | | | — | | | — | |
| Proceeds from commercial paper – net | Financing | | — | | | 372 | | | 345 | |
| | | | | | | |
| Uses of cash and cash equivalents: | | | | | | | |
| Payments of long-term debt | Financing | | (2,946) | | | (634) | | | (2,876) | |
Purchases of businesses, net of cash acquired (Note 3) | Investing | | (2,244) | | | (1,568) | | | (933) | |
| Common dividends paid | Financing | | (2,316) | | | (2,179) | | | (2,071) | |
| Capital expenditures | Investing | | (2,573) | | | (2,516) | | | (2,253) | |
| | | | | | | |
| Dividends and distributions paid to noncontrolling interests | Financing | | (242) | | | (213) | | | (204) | |
| Payments of commercial paper – net | Financing | | (269) | | | — | | | — | |
| Purchases of and contributions to equity-method investments | Investing | | (114) | | | (141) | | | (166) | |
| Purchases of treasury stock | Financing | | — | | | (130) | | | (9) | |
| | | | | | | |
| Other sources / (uses) – net | Financing and Investing | | (115) | | | (32) | | | (5) | |
| Increase (decrease) in cash and cash equivalents | | | $ | (2,090) | | | $ | 1,998 | | | $ | (1,528) | |
Operating activities
The factors that determine Williams’ operating activities are largely the same as those that affect Net income (loss), with the exception of noncash items such as Depreciation and amortization, Provision (benefit) for deferred income taxes, Equity (earnings) losses, Net unrealized (gain) loss from commodity derivative instruments, Gain on sale of business, Gain on disposition of equity-method investments, Gain on remeasurement of equity-method investments , Inventory write-downs, and Amortization of stock-based awards.
Williams’ Net cash provided (used) by operating activities for the year ended December 31, 2024, decreased from the same period in 2023 primarily due to unfavorable changes in margin requirements, lower operating income (excluding non-cash items previously discussed), and unfavorable changes in net operating working capital.
Williams’ Net cash provided (used) by operating activities in 2023 increased from 2022 primarily due to higher operating income (excluding noncash items as previously discussed), as well as favorable changes in net operating working capital and margin requirements, partially offset by lower Distributions from equity-method investees.
Environmental
Williams is a participant in certain environmental activities in various stages including assessment studies, cleanup operations, and/or remedial processes at certain sites, some of which it currently does not own (see Note 18 – Contingencies and Commitments). Williams is monitoring these sites in a coordinated effort with other potentially responsible parties, the EPA, or other governmental authorities. Williams is jointly and severally liable along with unrelated third parties in some of these activities and solely responsible in others. Current estimates of the most likely costs of such activities are approximately $42 million, all of which are included in Other current liabilities
Management’s Discussion and Analysis (Continued)
and Regulatory liabilities, deferred income, and other at December 31, 2024. Williams will seek to recover approximately $3 million of accrued costs related to remediation activities by its interstate gas pipelines through future natural gas transmission rates. The remainder of these costs will be funded from operations. During 2024, Williams paid approximately $11 million for cleanup and/or remediation and monitoring activities. Williams expects to pay approximately $5 million in 2025 for these activities. Estimates of the most likely costs of cleanup are generally based on completed assessment studies, preliminary results of studies, or Williams’ experience with other similar cleanup operations. At December 31, 2024, certain assessment studies were still in process for which the ultimate outcome may yield different estimates of most likely costs. Therefore, the actual costs incurred will depend on the final amount, type, and extent of contamination discovered at these sites, the final cleanup standards mandated by the EPA or other governmental authorities, and other factors.
The EPA and various state regulatory agencies routinely propose and promulgate new rules and issue updated guidance to existing rules. These rulemakings include, but are not limited to, rules for reciprocating internal combustion engine and combustion turbine maximum achievable control technology, reviews and updates to the National Ambient Air Quality Standards, and rules for new and existing source performance standards for volatile organic compounds and methane. Williams continuously monitors these regulatory changes and how they may impact its operations. Implementation of new or modified regulations may result in impacts to Williams’ operations and increase the cost of additions to Property, plant, and equipment – net for both new and existing facilities in affected areas; however, due to regulatory uncertainty on final rule content and applicability timeframes, Williams is unable to reasonably estimate the cost these regulatory impacts at this time.
Williams considers prudently incurred environmental assessment and remediation costs and the costs associated with compliance with environmental standards to be recoverable through rates for its interstate natural gas transmission pipelines. Historically, with limited exceptions, Williams has been permitted recovery of these environmental costs, and the intent is to continue seeking recovery of such costs through future rate filings.
Item 7A. Quantitative and Qualitative Disclosures About Market Risk
Interest Rate Risk
Williams
Williams’ current interest rate risk exposure, inclusive of subsidiaries, is related primarily to its debt portfolio. The debt portfolio is primarily comprised of fixed rate debt, which mitigates the impact of fluctuations in interest rates. Any borrowings under the credit facility and any issuances under Williams’ commercial paper program could be at a variable interest rate and could expose it to the risk of increasing interest rates. The maturity of Williams’ long-term debt portfolio is partially influenced by the expected lives of its operating assets. Williams may utilize interest rate derivative instruments to hedge interest rate risk associated with future debt issuances (see Note 13 – Debt and Banking Arrangements).
The tables below provide information by maturity date about the interest rate risk-sensitive instruments as of December 31, 2024 and 2023. The tables exclude unamortized debt issuance costs and net unamortized debt premium (discount) as disclosed in Note 13 – Debt and Banking Arrangements. See Note 16 – Fair Value Measurements, Guarantees, and Concentration of Credit Risk for the methods used in determining the fair value of Williams’ long-term debt.
| | | | | | | | | | | | | | | | | | | | | | | | | | | | | | | | | | | | | | | | | | | | | | | | | | |
| | 2025 | | 2026 | | 2027 | | 2028 | | 2029 | | Thereafter | | Total | | Fair Value December 31, 2024 |
| (Millions) |
| Long-term debt, including current portion: | | | | | | | | | | | | | | | | |
| Fixed rate | | $ | 1,720 | | | $ | 2,345 | | | $ | 1,994 | | | $ | 1,445 | | | $ | 1,600 | | | $ | 17,618 | | | $ | 26,722 | | | $ | 25,830 | |
| Weighted-average interest rate | | 5.1 | % | | 5.1 | % | | 5.0 | % | | 5.1 | % | | 5.1 | % | | 5.2 | % | | | | |
| Commercial paper (1) | | $ | 455 | | | $ | — | | | $ | — | | | $ | — | | | $ | — | | | $ | — | | | $ | 455 | | | $ | 455 | |
| | | | | | | | | | | | | | | | |
| | 2024 | | 2025 | | 2026 | | 2027 | | 2028 | | Thereafter | | Total | | Fair Value December 31, 2023 |
| (Millions) |
| Long-term debt, including current portion: | | | | | | | | | | | | | | | | |
| Fixed rate | | $ | 2,338 | | | $ | 2,263 | | | $ | 2,345 | | | $ | 1,993 | | | $ | 1,445 | | | $ | 15,583 | | | $ | 25,967 | | | $ | 25,553 | |
| Weighted-average interest rate | | 4.9 | % | | 5.0 | % | | 5.1 | % | | 5.0 | % | | 5.1 | % | | 5.1 | % | | | | |
| | | | | | | | | | | | | | | | |
| | | | | | | | | | | | | | | | |
| Commercial paper (1) | | $ | 725 | | | $ | — | | | $ | — | | | $ | — | | | $ | — | | | $ | — | | | $ | 725 | | | $ | 725 | |
| | | | | | | | | | | | | | | | |
| | | | | | | | | | | | | | | | |
| | | | | | | | | | | | | | | | |
| | | | | | | | | | | | | | | | |
| |
| | | | | | | | | | | | | | | | |
| | | | | | | | | | | | | | | | |
| | | | | | | | | | | | | | | | |
| | | | | | | | | | | | | | | | |
| | | | | | | | | | | | | | | | |
| | | | | | | | | | | | | | | | |
| | | | | | | | | | | | | | | | |
| | | | | | | | | | | | | | | | |
__________________
(1) The weighted-average interest rate for commercial paper as of December 31, 2024 and 2023 was 4.6 percent and 5.6 percent, respectively.
Transco
At December 31, 2024 and 2023, Transco’s debt portfolio included only fixed rate debt, which mitigates the impact of fluctuations in interest rates. Any borrowings under the credit facility would be at a variable interest rate and would expose it to the risk of increasing interest rates. The following tables provide Transco’s information by maturity date about the interest rate risk-sensitive instruments, as of December 31, 2024 and 2023. The tables exclude unamortized debt issuance costs and net unamortized debt premium (discount) as disclosed in Note 13 – Debt and Banking Arrangements. See Note 16 – Fair Value Measurements, Guarantees, and Concentration of Credit Risk for the methods used in determining the fair value of Transco’s long-term debt.
| | | | | | | | | | | | | | | | | | | | | | | | | | | | | | | | | | | | | | | | | | | | | | | | | | |
| | 2025 | | 2026 | | 2027 | | 2028 | | 2029 | | Thereafter | | Total | | Fair Value December 31, 2024 |
| (Millions) |
| Long-term debt, excluding other financing obligation: | | | | | | | | | | | | | | | | |
| Fixed rate | | $ | — | | | $ | 1,208 | | | $ | — | | | $ | 400 | | | $ | — | | | $ | 2,575 | | | $ | 4,183 | | | $ | 3,858 | |
| Weighted-average interest rate | | 5.2 | % | | 4.8 | % | | 4.2 | % | | 4.2 | % | | 4.2 | % | | 4.5 | % | | | | |
| | | | | | | | | | | | | | | | |
| Other financing obligations, including current portion: | | | | | | | | | | | | | | | | |
| Fixed rate | | $ | 35 | | | $ | 37 | | | $ | 41 | | | $ | 45 | | | $ | 50 | | | $ | 878 | | | $ | 1,086 | | | $ | 1,418 | |
| Weighted-average interest rate | | 9.2 | % | | 9.2 | % | | 9.2 | % | | 9.2 | % | | 9.2 | % | | 9.3 | % | | | | |
| | | | | | | | | | | | | | | | |
| | 2024 | | 2025 | | 2026 | | 2027 | | 2028 | | Thereafter | | Total | | Fair Value December 31, 2023 |
| (Millions) |
| Long-term debt, excluding other financing obligation: | | | | | | | | | | | | | | | | |
| Fixed rate | | $ | — | | | $ | — | | | $ | 1,208 | | | $ | — | | | $ | 400 | | | $ | 2,575 | | | $ | 4,183 | | | $ | 3,948 | |
| Weighted-average interest rate | | 5.2 | % | | 5.2 | % | | 4.4 | % | | 4.2 | % | | 4.2 | % | | 4.4 | % | | | | |
| | | | | | | | | | | | | | | | |
| Other financing obligations, including current portion: | | | | | | | | | | | | | | | | |
| Fixed rate | | $ | 32 | | | $ | 35 | | | $ | 37 | | | $ | 41 | | | $ | 45 | | | $ | 926 | | | $ | 1,116 | | | $ | 1,490 | |
| Weighted-average interest rate | | 9.2 | % | | 9.2 | % | | 9.2 | % | | 9.2 | % | | 9.2 | % | | 9.3 | % | | | | |
| | | | | | | | | | | | | | | | |
| | | | | | | | | | | | | | | | |
| | | | | | | | | | | | | | | | |
| | | | | | | | | | | | | | | | |
| | | | | | | | | | | | | | | | |
| | | | | | | | | | | | | | | | |
| |
| | | | | | | | | | | | | | | | |
| | | | | | | | | | | | | | | | |
| | | | | | | | | | | | | | | | |
| | | | | | | | | | | | | | | | |
| | | | | | | | | | | | | | | | |
| | | | | | | | | | | | | | | | |
| | | | | | | | | | | | | | | | |
| | | | | | | | | | | | | | | | |
NWP
At December 31, 2024 and 2023, NWP’s debt portfolio included only fixed rate debt, which mitigates the impact of fluctuations in interest rates. Any borrowings under the credit facility would be at a variable interest rate and would expose it to the risk of increasing interest rates. The following tables provide NWP’s information by maturity date about the interest rate risk-sensitive instruments, as of December 31, 2024 and 2023. The tables exclude unamortized debt issuance costs and net unamortized debt premium (discount) as disclosed in Note 13 – Debt and Banking Arrangements. See Note 16 – Fair Value Measurements, Guarantees, and Concentration of Credit Risk for the methods used in determining the fair value of NWP’s long-term debt.
| | | | | | | | | | | | | | | | | | | | | | | | | | | | | | | | | | | | | | | | | | | | | | | | | | |
| | 2025 | | 2026 | | 2027 | | 2028 | | 2029 | | Thereafter | | Total | | Fair Value December 31, 2024 |
| (Millions) |
| Long-term debt, including current portion: | | | | | | | | | | | | | | | | |
| Fixed rate | | $ | 85 | | | $ | — | | | $ | 500 | | | $ | — | | | $ | — | | | $ | — | | | $ | 585 | | | $ | 573 | |
| Weighted-average interest rate | | 4.2 | % | | 4.0 | % | | — | % | | — | % | | — | % | | — | % | | | | |
| | | | | | | | | | | | | | | | |
| | 2024 | | 2025 | | 2026 | | 2027 | | 2028 | | Thereafter | | Total | | Fair Value December 31, 2023 |
| (Millions) |
| Long-term debt: | | | | | | | | | | | | | | | | |
| Fixed rate | | $ | — | | | $ | 85 | | | $ | — | | | $ | 500 | | | $ | — | | | $ | — | | | $ | 585 | | | $ | 581 | |
| Weighted-average interest rate | | 4.5 | % | | 4.2 | % | | 4.0 | % | | — | % | | — | % | | — | % | | | | |
| | | | | | | | | | | | | | | | |
| | | | | | | | | | | | | | | | |
| | | | | | | | | | | | | | | | |
| | | | | | | | | | | | | | | | |
| | | | | | | | | | | | | | | | |
| | | | | | | | | | | | | | | | |
| |
| | | | | | | | | | | | | | | | |
| | | | | | | | | | | | | | | | |
| | | | | | | | | | | | | | | | |
| | | | | | | | | | | | | | | | |
| | | | | | | | | | | | | | | | |
| | | | | | | | | | | | | | | | |
| | | | | | | | | | | | | | | | |
| | | | | | | | | | | | | | | | |
Commodity Price Risk
Williams is exposed to commodity price risk through its natural gas and NGL marketing activities, including contracts to purchase, sell, transport, and store product. Williams routinely manages this risk with a variety of exchange-traded and OTC energy contracts such as forward contracts, futures contracts, and basis swaps, as well as physical transactions. Although many of the contracts used to manage commodity exposure are derivative instruments, these economic hedges are not designated or do not qualify for hedge accounting treatment.
Williams is also exposed to commodity prices through the upstream business and certain gathering and processing contracts. Williams uses derivative instruments to lock in forward sales prices on a portion of expected future production and to lock in NGL margin on a portion of commodity-exposed gathering and processing volumes. These economic hedges are not designated for hedge accounting treatment.
The fair value measurements and maturities of Williams’ commodity derivative assets (liabilities) at December 31, 2024 and 2023, were as follows:
| | | | | | | | | | | | | | | | | | | | | | | | | | |
| | Total
Fair
Value | | Maturity |
| Fair Value Measurements Level (1) | | | 2025 | | 2026 - 2027 | | 2028 - 2029+ |
| | (Millions) |
| Level 1 (2) | | $ | (105) | | | $ | (41) | | | $ | (56) | | | $ | (8) | |
| Level 2 | | (287) | | | (97) | | | (112) | | | (78) | |
| Level 3 | | 48 | | | 11 | | | 8 | | | 29 | |
| Fair value of contracts outstanding at December 31, 2024 | | $ | (344) | | | $ | (127) | | | $ | (160) | | | $ | (57) | |
| | | | | | | | | | | | | | | | | | | | | | | | | | |
| | Total
Fair
Value | | Maturity |
| Fair Value Measurements Level (1) | | | 2024 | | 2025 - 2026 | | 2027 - 2028+ |
| | (Millions) |
| Level 1 (3) | | $ | 138 | | | $ | 110 | | | $ | 33 | | | $ | (5) | |
| Level 2 | | (166) | | | 14 | | | (71) | | | (109) | |
| Level 3 | | 53 | | | 2 | | | 16 | | | 35 | |
| Fair value of contracts outstanding at December 31, 2023 | | $ | 25 | | | $ | 126 | | | $ | (22) | | | $ | (79) | |
_______________
(1)See Note 16 – Fair Value Measurements, Guarantees, and Concentration of Credit Risk for discussion of valuation techniques by level within the fair value hierarchy. See Note 17 – Commodity Derivatives for the amount of change in fair value recognized in Williams’ Consolidated Statement of Income.
(2)Commodity derivative assets and liabilities exclude $288 million of net cash collateral in Level 1.
(3)Commodity derivative assets and liabilities exclude $2 million of net cash collateral in Level 1.
Value at Risk (VaR)
VaR is the maximum predicted loss in portfolio value over a specified time period that is not expected to be exceeded within a given degree of probability. Williams’ VaR may not be comparable to that of other companies due to differences in the factors used to calculate VaR. Williams’ VaR is determined using parametric models with 95 percent confidence intervals and one-day holding periods, which means that 95 percent of the time, the risk of loss in a day from a portfolio of positions is expected to be less than or equal to the amount of VaR calculated. Williams’ open exposure is managed in accordance with established policies that limit market risk and require daily reporting of predicted financial loss to management. Because Williams generally manages physical gas assets and economically protects its positions by hedging in the futures markets, its open exposure is generally mitigated. Williams employs daily risk testing, using both VaR and stress testing, to evaluate the risk of its positions.
Williams actively monitors open commodity marketing positions and the resulting VaR and maintain a relatively small risk exposure as total buy volume is close to sell volume, with minimal open natural gas price risk.
The VaR associated with Williams’ integrated natural gas trading operations was $4 million at December 31, 2024 and $9 million at December 31, 2023. Williams had the following VaRs for the period shown:
| | | | | | | | | | | | | | | | | | | | | | | |
| | Year Ended
December 31, 2024 | | Year Ended December 31, 2023 | | | | | | | |
| | | | | | | | | |
| | (Millions) | | | |
| Average | | $ | 3 | | | $ | 6 | | | | | | | | |
| High | | $ | 15 | | | $ | 13 | | | | | | | | |
| Low | | $ | 1 | | | $ | 4 | | | | | | | | |
Williams’ non-trading portfolio primarily consists of commodity derivatives that hedge Williams’ upstream business and certain gathering and processing contracts. The VaR associated with these commodity derivatives was $8 million at December 31, 2024 and $3 million at December 31, 2023. Williams had the following VaRs for the period shown:
| | | | | | | | | | | | | | | | | | | | | | | |
| | Year Ended
December 31, 2024 | | Year Ended December 31, 2023 | | | | | | | |
| | | | | | | | | | | |
| | (Millions) | | | |
| Average | | $ | 5 | | | $ | 4 | | | | | | | | |
| High | | $ | 8 | | | $ | 8 | | | | | | | | |
| Low | | $ | 3 | | | $ | 2 | | | | | | | | |
Item 8. Financial Statements and Supplementary Data
| | | | | |
| Page |
| Williams: | |
| |
| |
| |
| |
| |
| |
| Transco: | |
| |
| |
| |
| |
| |
| NWP: | |
| |
| |
| |
| |
| |
| |
| |
| |
Report of Independent Registered Public Accounting Firm
To the Stockholders and the Board of Directors of
The Williams Companies, Inc.
Opinion on the Financial Statements
We have audited the accompanying consolidated balance sheet of The Williams Companies, Inc. (the Company) as of December 31, 2024 and 2023, the related consolidated statements of income, comprehensive income (loss), changes in equity, and cash flows for each of the three years in the period ended December 31, 2024, and the related notes and financial statement schedule listed in the Index at Item 15(a) (collectively referred to as the “consolidated financial statements”). In our opinion, the consolidated financial statements present fairly, in all material respects, the consolidated financial position of the Company at December 31, 2024 and 2023, and the consolidated results of its operations and its cash flows for each of the three years in the period ended December 31, 2024, in conformity with U.S. generally accepted accounting principles.
We also have audited, in accordance with the standards of the Public Company Accounting Oversight Board (United States) (PCAOB), the Company’s internal control over financial reporting as of December 31, 2024, based on criteria established in Internal Control-Integrated Framework issued by the Committee of Sponsoring Organizations of the Treadway Commission (2013 framework) and our report dated February 25, 2025 expressed an unqualified opinion thereon.
Basis for Opinion
These consolidated financial statements are the responsibility of the Company’s management. Our responsibility is to express an opinion on the Company’s consolidated financial statements based on our audits. We are a public accounting firm registered with the PCAOB and are required to be independent with respect to the Company in accordance with the U.S. federal securities laws and the applicable rules and regulations of the Securities and Exchange Commission and the PCAOB.
We conducted our audits in accordance with the standards of the PCAOB. Those standards require that we plan and perform the audit to obtain reasonable assurance about whether the consolidated financial statements are free of material misstatement, whether due to error or fraud. Our audits included performing procedures to assess the risks of material misstatement of the consolidated financial statements, whether due to error or fraud, and performing procedures that respond to those risks. Such procedures included examining, on a test basis, evidence regarding the amounts and disclosures in the consolidated financial statements. Our audits also included evaluating the accounting principles used and significant estimates made by management, as well as evaluating the overall presentation of the consolidated financial statements. We believe that our audits provide a reasonable basis for our opinion.
| | | | | | | | | | | | | | |
| Critical Audit Matters | |
| The critical audit matter communicated below is a matter arising from the current period audit of the consolidated financial statements that was communicated or required to be communicated to the audit committee and that (1) relates to accounts or disclosures that are material to the consolidated financial statements and (2) involved our especially challenging, subjective or complex judgments. The communication of the critical audit matter does not alter in any way our opinion on the consolidated financial statements, taken as a whole, and we are not, by communicating the critical audit matter below, providing a separate opinion on the critical audit matter or on the account or disclosures to which it relates. |
| | | Pension Benefits Obligation |
| Description of the Matter | | | At December 31, 2024, the Company’s aggregate pension benefits obligation was $937 million and was exceeded by the fair value of pension plan assets of $1,183 million, resulting in an overfunded pension benefits obligation of $246 million. As explained in Note 7 to the consolidated financial statements, the Company utilized key assumptions to determine the pension benefits obligation.
Auditing the pension benefits obligation is complex and required the involvement of specialists due to the nature of the actuarial assumptions (e.g., discount rates and cash balance interest crediting rate) used in the measurement process. These assumptions have a significant effect on the projected benefit obligation. |
| How We Addressed the Matter in Our Audit | | | We obtained an understanding, evaluated the design, and tested the operating effectiveness of controls relating to the measurement and valuation of the pension benefits obligation, including controls over management’s review of the pension benefits obligation, the significant actuarial assumptions and the data inputs.
To test the pension benefits obligation, our audit procedures included, among others, evaluating the methodologies used, the significant actuarial assumptions discussed above, and the underlying data used by the Company. We compared the actuarial assumptions used by management to historical trends and evaluated the changes in the funded status from prior year. In addition, we involved our actuarial specialists to assist with our procedures. For example, we evaluated management’s methodology for determining the discount rates that reflect the maturity and duration of the benefit payments and are used to measure the pension benefits obligation. As part of this assessment, we independently developed a range of yield curves, we compared the projected cash flows to prior year, and compared the current year benefits paid to the prior year projected cash flows. To test the cash balance interest crediting rate, we independently calculated a range of rates and compared them to the rate used by management. We also tested the completeness and accuracy of the underlying data, including the participant data. |
/s/ Ernst & Young LLP
We have served as the Company’s auditor since 1962.
Tulsa, Oklahoma
February 25, 2025
The Williams Companies, Inc.
Consolidated Statement of Income
| | | | | | | | | | | | | | | | | | | | | | | | |
| | | | | | Year Ended December 31, |
| | | | | | |
| | | | | | 2024 | | 2023 | | 2022 |
| | | | | | (Millions, except per-share amounts) |
| Revenues: | | | | | | | | | | |
| Service revenues | | | | | | $ | 7,628 | | | $ | 7,026 | | | $ | 6,536 | |
| Service revenues – commodity consideration | | | | | | 134 | | | 146 | | | 260 | |
| Product sales | | | | | | 2,991 | | | 2,779 | | | 4,556 | |
| Net gain (loss) from commodity derivatives | | | | | | (250) | | | 956 | | | (387) | |
| Total revenues | | | | | | 10,503 | | | 10,907 | | | 10,965 | |
| Costs and expenses: | | | | | | | | | | |
| Product costs | | | | | | 2,075 | | | 1,884 | | | 3,369 | |
| Net processing commodity expenses | | | | | | 43 | | | 151 | | | 88 | |
| Operating and maintenance expenses | | | | | | 2,179 | | | 1,984 | | | 1,817 | |
| Depreciation and amortization expenses | | | | | | 2,219 | | | 2,071 | | | 2,009 | |
| Selling, general, and administrative expenses | | | | | | 708 | | | 665 | | | 636 | |
| | | | | | | | | | |
| | | | | | | | | | |
| | | | | | | | | | |
| Gain on sale of business (Note 3) | | | | | | — | | | (129) | | | — | |
| Other (income) expense – net | | | | | | (60) | | | (30) | | | 28 | |
| Total costs and expenses | | | | | | 7,164 | | | 6,596 | | | 7,947 | |
| Operating income (loss) | | | | | | 3,339 | | | 4,311 | | | 3,018 | |
| Equity earnings (losses) | | | | | | 560 | | | 589 | | | 637 | |
| | | | | | | | | | |
| | | | | | | | | | |
| Other investing income (loss) – net | | | | | | 343 | | | 108 | | | 16 | |
| Interest expense | | | | | | (1,364) | | | (1,236) | | | (1,147) | |
| | | | | | | | | | |
| | | | | | | | | | |
| Net gain from Energy Transfer litigation judgment (Note 1) | | | | | | — | | | 534 | | | — | |
| Other income (expense) – net | | | | | | 108 | | | 99 | | | 18 | |
| Income (loss) before income taxes | | | | | | 2,986 | | | 4,405 | | | 2,542 | |
| Less: Provision (benefit) for income taxes | | | | | | 640 | | | 1,005 | | | 425 | |
| Income (loss) from continuing operations | | | | | | 2,346 | | | 3,400 | | | 2,117 | |
| Income (loss) from discontinued operations (Note 1) | | | | | | — | | | (97) | | | — | |
| Net income (loss) | | | | | | 2,346 | | | 3,303 | | | 2,117 | |
| Less: Net income (loss) attributable to noncontrolling interests | | | | | | 121 | | | 124 | | | 68 | |
| Net income (loss) attributable to The Williams Companies, Inc. | | | | | | 2,225 | | | 3,179 | | | 2,049 | |
| Less: Preferred stock dividends | | | | | | 3 | | | 3 | | | 3 | |
| Net income (loss) available to common stockholders | | | | | | $ | 2,222 | | | $ | 3,176 | | | $ | 2,046 | |
| Amounts attributable to The Williams Companies, Inc. available to common stockholders: | | | | | | | | | | |
| Income (loss) from continuing operations | | | | | | $ | 2,222 | | | $ | 3,273 | | | $ | 2,046 | |
| Income (loss) from discontinued operations (Note 1) | | | | | | — | | | (97) | | | — | |
| Net income (loss) available to common stockholders | | | | | | $ | 2,222 | | | $ | 3,176 | | | $ | 2,046 | |
| Basic earnings (loss) per common share: | | | | | | | | | | |
| Income (loss) from continuing operations | | | | | | $ | 1.82 | | | $ | 2.69 | | | $ | 1.68 | |
| Income (loss) from discontinued operations | | | | | | — | | | (.08) | | | — | |
| Net income (loss) available to common stockholders | | | | | | $ | 1.82 | | | $ | 2.61 | | | $ | 1.68 | |
| Weighted-average shares (thousands) | | | | | | 1,219,184 | | | 1,217,784 | | | 1,218,362 | |
| Diluted earnings (loss) per common share: | | | | | | | | | | |
| Income (loss) from continuing operations | | | | | | $ | 1.82 | | | $ | 2.68 | | | $ | 1.67 | |
| Income (loss) from discontinued operations | | | | | | — | | | (.08) | | | — | |
| Net income (loss) available to common stockholders | | | | | | $ | 1.82 | | | $ | 2.60 | | | $ | 1.67 | |
| Weighted-average shares (thousands) | | | | | | 1,222,954 | | | 1,222,715 | | | 1,222,672 | |
See the Combined Notes to Financial Statements.
The Williams Companies, Inc.
Consolidated Statement of Comprehensive Income (Loss)
| | | | | | | | | | | | | | | | | | | | | | | | |
| | | | | | Year Ended December 31, |
| | | | | | |
| | | | | | 2024 | | 2023 | | 2022 |
| | | | | | (Millions) |
| Net income (loss) | | | | | | $ | 2,346 | | | $ | 3,303 | | | $ | 2,117 | |
| Other comprehensive income (loss): | | | | | | | | | | |
| Designated interest rate cash flow hedging activities: | | | | | | | | | | |
| | | | | | | | | | |
| Net unrealized gain (loss) from derivative instruments, net of taxes of $(2), $(8), and $1 in 2024, 2023, and 2022, respectively | | | | | | 6 | | | 26 | | | (3) | |
| | | | | | | | | | |
| Reclassifications into earnings of net derivative instruments (gain) loss, net of taxes of $1, $1 and $— in 2024, 2023, and 2022, respectively | | | | | | (2) | | | (2) | | | — | |
| | | | | | | | | | |
| | | | | | | | | | |
| | | | | | | | | | |
| Pension and other postretirement benefits: | | | | | | | | | | |
| | | | | | | | | | |
| | | | | | | | | | |
| Net actuarial gain (loss) arising during the year, net of taxes of $(24), $—, and $1 in 2024, 2023, and 2022, respectively | | | | | | 72 | | | (2) | | | 1 | |
| Amortization of actuarial (gain) loss and net actuarial loss from settlements included in net periodic benefit cost (credit), net of taxes of $1, $—, and $(4) in 2024, 2023, and 2022, respectively | | | | | | — | | | 3 | | | 11 | |
| | | | | | | | | | |
| | | | | | | | | | |
| | | | | | | | | | |
| | | | | | | | | | |
| | | | | | | | | | |
| Other comprehensive income (loss) | | | | | | 76 | | | 25 | | | 9 | |
| Comprehensive income (loss) | | | | | | 2,422 | | | 3,328 | | | 2,126 | |
| Less: Comprehensive income (loss) attributable to noncontrolling interests | | | | | | 121 | | | 124 | | | 68 | |
| Comprehensive income (loss) attributable to The Williams Companies, Inc. | | | | | | $ | 2,301 | | | $ | 3,204 | | | $ | 2,058 | |
See the Combined Notes to Financial Statements.
The Williams Companies, Inc.
Consolidated Balance Sheet
| | | | | | | | | | | | | | |
| | December 31, |
| | | | |
| | 2024 | | 2023 |
| | (Millions, except per-share amounts) |
| ASSETS | | | | |
| Current assets: | | | | |
| Cash and cash equivalents | | $ | 60 | | | $ | 2,150 | |
| Trade accounts and other receivables (net of allowance of ($1) at December 31, 2024 and ($3) at December 31, 2023) | | 1,863 | | | 1,655 | |
| Inventories | | 279 | | | 274 | |
| Derivative assets | | 267 | | | 239 | |
| Other current assets and deferred charges | | 192 | | | 195 | |
| Total current assets | | 2,661 | | | 4,513 | |
| | | | |
| Investments | | 4,140 | | | 4,637 | |
| Property, plant, and equipment – net | | 38,692 | | | 34,311 | |
| Intangible assets – net of accumulated amortization | | 7,209 | | | 7,593 | |
| Regulatory assets, deferred charges, and other | | 1,830 | | | 1,573 | |
| Total assets | | $ | 54,532 | | | $ | 52,627 | |
| | | | |
| LIABILITIES AND EQUITY | | | | |
| Current liabilities: | | | | |
| Accounts payable | | $ | 1,613 | | | $ | 1,379 | |
| Derivative liabilities | | 164 | | | 105 | |
| Other current liabilities | | 1,360 | | | 1,284 | |
| Commercial paper | | 455 | | | 725 | |
| Long-term debt due within one year | | 1,720 | | | 2,337 | |
| Total current liabilities | | 5,312 | | | 5,830 | |
| | | | |
| Long-term debt | | 24,736 | | | 23,376 | |
| Deferred income tax liabilities | | 4,376 | | | 3,846 | |
| Regulatory liabilities, deferred income, and other | | 5,268 | | | 4,684 | |
| Contingent liabilities and commitments (Note 18) | | | | |
| | | | |
| Equity: | | | | |
| Stockholders’ equity: | | | | |
| Preferred stock ($1 par value; 30 million shares authorized at December 31, 2024 and December 31, 2023; 35 thousand shares issued at December 31, 2024 and December 31, 2023) | | 35 | | | 35 | |
| Common stock ($1 par value; 1,470 million shares authorized at December 31, 2024 and December 31, 2023; 1,258 million shares issued at December 31, 2024 and 1,256 million shares issued at December 31, 2023) | | 1,258 | | | 1,256 | |
| Capital in excess of par value | | 24,643 | | | 24,578 | |
| Retained deficit | | (12,396) | | | (12,287) | |
| Accumulated other comprehensive income (loss) | | 76 | | | — | |
| Treasury stock, at cost (39 million shares at December 31, 2024 and December 31, 2023 of common stock) | | (1,180) | | | (1,180) | |
| Total stockholders’ equity | | 12,436 | | | 12,402 | |
| Noncontrolling interests in consolidated subsidiaries | | 2,404 | | | 2,489 | |
| Total equity | | 14,840 | | | 14,891 | |
| Total liabilities and equity | | $ | 54,532 | | | $ | 52,627 | |
See the Combined Notes to Financial Statements.
The Williams Companies, Inc.
Consolidated Statement of Changes in Equity
| | | | | | | | | | | | | | | | | | | | | | | | | | | | | | | | | | | | | | | | | | | | | | | | | | | | | |
| The Williams Companies, Inc. Stockholders | | | | |
| Preferred Stock | | Common
Stock | | Capital in
Excess of
Par Value | | Retained
Deficit | | AOCI* | | Treasury
Stock | | Total
Stockholders’
Equity | | Noncontrolling
Interests | | Total Equity |
| (Millions) |
| Balance at December 31, 2021 | $ | 35 | | | $ | 1,250 | | | $ | 24,449 | | | $ | (13,237) | | | $ | (33) | | | $ | (1,041) | | | $ | 11,423 | | | $ | 2,678 | | | $ | 14,101 | |
| Net income (loss) | — | | | — | | | — | | | 2,049 | | | — | | | — | | | 2,049 | | | 68 | | | 2,117 | |
| Other comprehensive income (loss) | — | | | — | | | — | | | — | | | 9 | | | — | | | 9 | | | — | | | 9 | |
| | | | | | | | | | | | | | | | | |
| | | | | | | | | | | | | | | | | |
| Cash dividends – common stock ($1.70 per share) | — | | | — | | | — | | | (2,071) | | | — | | | — | | | (2,071) | | | — | | | (2,071) | |
| Stock-based compensation and related common stock issuances, net of tax | — | | | 3 | | | 93 | | | — | | | — | | | — | | | 96 | | | — | | | 96 | |
| Dividends and distributions to noncontrolling interests | — | | | — | | | — | | | — | | | — | | | — | | | — | | | (204) | | | (204) | |
| | | | | | | | | | | | | | | | | |
| | | | | | | | | | | | | | | | | |
| Contributions from noncontrolling interests | — | | | — | | | — | | | — | | | — | | | — | | | — | | | 18 | | | 18 | |
| | | | | | | | | | | | | | | | | |
| Purchases of treasury stock | — | | | — | | | — | | | — | | | — | | | (9) | | | (9) | | | — | | | (9) | |
| Other | — | | | — | | | — | | | (12) | | | — | | | — | | | (12) | | | — | | | (12) | |
| Net increase (decrease) in equity | — | | | 3 | | | 93 | | | (34) | | | 9 | | | (9) | | | 62 | | | (118) | | | (56) | |
| | | | | | | | | | | | | | | | | |
| | | | | | | | | | | | | | | | | |
| Balance at December 31, 2022 | $ | 35 | | | $ | 1,253 | | | $ | 24,542 | | | $ | (13,271) | | | $ | (24) | | | $ | (1,050) | | | $ | 11,485 | | | $ | 2,560 | | | $ | 14,045 | |
| Net income (loss) | — | | | — | | | — | | | 3,179 | | | — | | | — | | | 3,179 | | | 124 | | | 3,303 | |
| Other comprehensive income (loss) | — | | | — | | | — | | | — | | | 25 | | | — | | | 25 | | | — | | | 25 | |
| Cash dividends – common stock ($1.79 per share) | — | | | — | | | — | | | (2,179) | | | — | | | — | | | (2,179) | | | — | | | (2,179) | |
| Stock-based compensation and related common stock issuances, net of tax | — | | | 3 | | | 35 | | | — | | | — | | | — | | | 38 | | | — | | | 38 | |
| Dividends and distributions to noncontrolling interests | — | | | — | | | — | | | — | | | — | | | — | | | — | | | (213) | | | (213) | |
| | | | | | | | | | | | | | | | | |
| Contributions from noncontrolling interests | — | | | — | | | — | | | — | | | — | | | — | | | — | | | 18 | | | 18 | |
| Purchases of treasury stock | — | | | — | | | — | | | — | | | — | | | (130) | | | (130) | | | — | | | (130) | |
| Other | — | | | — | | | 1 | | | (16) | | | (1) | | | — | | | (16) | | | — | | | (16) | |
| Net increase (decrease) in equity | — | | | 3 | | | 36 | | | 984 | | | 24 | | | (130) | | | 917 | | | (71) | | | 846 | |
| Balance at December 31, 2023 | $ | 35 | | | $ | 1,256 | | | $ | 24,578 | | | $ | (12,287) | | | $ | — | | | $ | (1,180) | | | $ | 12,402 | | | $ | 2,489 | | | $ | 14,891 | |
| Net income (loss) | — | | | — | | | — | | | 2,225 | | | — | | | — | | | 2,225 | | | 121 | | | 2,346 | |
| Other comprehensive income (loss) | — | | | — | | | — | | | — | | | 76 | | | — | | | 76 | | | — | | | 76 | |
| Cash dividends – common stock ($1.90 per share) | — | | | — | | | — | | | (2,316) | | | — | | | — | | | (2,316) | | | — | | | (2,316) | |
| Stock-based compensation and related common stock issuances, net of tax | — | | | 2 | | | 65 | | | — | | | — | | | — | | | 67 | | | — | | | 67 | |
| Dividends and distributions to noncontrolling interests | — | | | — | | | — | | | — | | | — | | | — | | | — | | | (242) | | | (242) | |
| | | | | | | | | | | | | | | | | |
| | | | | | | | | | | | | | | | | |
| Contributions from noncontrolling interests | — | | | — | | | — | | | — | | | — | | | — | | | — | | | 36 | | | 36 | |
| | | | | | | | | | | | | | | | | |
| | | | | | | | | | | | | | | | | |
| Other | — | | | — | | | — | | | (18) | | | — | | | — | | | (18) | | | — | | | (18) | |
| Net increase (decrease) in equity | — | | | 2 | | | 65 | | | (109) | | | 76 | | | — | | | 34 | | | (85) | | | (51) | |
| Balance at December 31, 2024 | $ | 35 | | | $ | 1,258 | | | $ | 24,643 | | | $ | (12,396) | | | $ | 76 | | | $ | (1,180) | | | $ | 12,436 | | | $ | 2,404 | | | $ | 14,840 | |
| | | | | | | | | | | | | | | | | |
| | | | | | | | | | | | | | | | | |
| | | | | | | | | | | | | | | | | |
| | | | | | | | | | | | | | | | | |
| | | | | | | | | | | | | | | | | |
| | | | | | | | | | | | | | | | | |
| | | | | | | | | | | | | | | | | |
| | | | | | | | | | | | | | | | | |
*Accumulated Other Comprehensive Income (Loss)
See the Combined Notes to Financial Statements.
The Williams Companies, Inc.
Consolidated Statement of Cash Flows
| | | | | | | | | | | | | | | | | | | | |
| | | Year Ended December 31, |
| | 2024 | | 2023 | | 2022 |
| | (Millions) |
| OPERATING ACTIVITIES: | | | | | | |
| Net income (loss) | | $ | 2,346 | | | $ | 3,303 | | | $ | 2,117 | |
| Adjustments to reconcile to net cash provided (used) by operating activities: | | | | | | |
| Depreciation and amortization | | 2,219 | | | 2,071 | | | 2,009 | |
| Provision (benefit) for deferred income taxes | | 506 | | | 951 | | | 431 | |
| Equity (earnings) losses | | (560) | | | (589) | | | (637) | |
| Distributions from equity-method investees (Note 8) | | 789 | | | 796 | | | 865 | |
| | | | | | |
| | | | | | |
| | | | | | |
| Net unrealized (gain) loss from commodity derivative instruments | | 367 | | | (660) | | | 249 | |
| Gain on sale of business (Note 3) | | — | | | (129) | | | — | |
| Gain on disposition of equity-method investments (Note 8) | | (149) | | | — | | | — | |
| Gain on remeasurement of equity-method investments (Note 3) | | (127) | | | (30) | | | — | |
| Inventory write-downs | | 10 | | | 30 | | | 161 | |
| Amortization of stock-based awards | | 99 | | | 77 | | | 73 | |
| Cash provided (used) by changes in current assets and liabilities: | | | | | | |
| Accounts receivable | | (169) | | | 1,089 | | | (733) | |
| Inventories | | (9) | | | 13 | | | (110) | |
| Other current assets and deferred charges | | 9 | | | 60 | | | (33) | |
| Accounts payable | | 139 | | | (1,009) | | | 410 | |
| Other current liabilities | | 35 | | | (19) | | | 209 | |
| Changes in current and noncurrent commodity derivative assets and liabilities | | (286) | | | 200 | | | 94 | |
| Other, including changes in noncurrent assets and liabilities | | (245) | | | (216) | | | (216) | |
| Net cash provided (used) by operating activities | | 4,974 | | | 5,938 | | | 4,889 | |
| FINANCING ACTIVITIES: | | | | | | |
| Proceeds from (payments of) commercial paper – net | | (269) | | | 372 | | | 345 | |
| Proceeds from long-term debt | | 3,594 | | | 2,755 | | | 1,755 | |
| Payments of long-term debt | | (2,946) | | | (634) | | | (2,876) | |
| Payments for debt issuance costs | | (32) | | | (23) | | | (17) | |
| Proceeds from issuance of common stock | | 10 | | | 6 | | | 54 | |
| Purchases of treasury stock | | — | | | (130) | | | (9) | |
| Common dividends paid | | (2,316) | | | (2,179) | | | (2,071) | |
| Dividends and distributions paid to noncontrolling interests | | (242) | | | (213) | | | (204) | |
| Contributions from noncontrolling interests | | 36 | | | 18 | | | 18 | |
| Other – net | | (36) | | | (21) | | | (37) | |
| Net cash provided (used) by financing activities | | (2,201) | | | (49) | | | (3,042) | |
| INVESTING ACTIVITIES: | | | | | | |
| Property, plant, and equipment: | | | | | | |
| Capital expenditures (1) | | (2,573) | | | (2,516) | | | (2,253) | |
| Dispositions – net | | (105) | | | (51) | | | (30) | |
| | | | | | |
| Proceeds from sale of business (Note 3) | | — | | | 346 | | | — | |
| Purchases of businesses, net of cash acquired (Note 3) | | (2,244) | | | (1,568) | | | (933) | |
| Proceeds from dispositions of equity-method investments (Note 8) | | 161 | | | — | | | — | |
| Purchases of and contributions to equity-method investments (Note 8) | | (114) | | | (141) | | | (166) | |
| Other – net | | 12 | | | 39 | | | 7 | |
| Net cash provided (used) by investing activities | | (4,863) | | | (3,891) | | | (3,375) | |
| Increase (decrease) in cash and cash equivalents | | (2,090) | | | 1,998 | | | (1,528) | |
| Cash and cash equivalents at beginning of year | | 2,150 | | | 152 | | | 1,680 | |
| Cash and cash equivalents at end of year | | $ | 60 | | | $ | 2,150 | | | $ | 152 | |
| _________ | | | | | | |
| (1) Increases to property, plant, and equipment | | $ | (2,581) | | | $ | (2,564) | | | $ | (2,394) | |
| Changes in related accounts payable and accrued liabilities | | 8 | | | 48 | | | 141 | |
| Capital expenditures | | $ | (2,573) | | | $ | (2,516) | | | $ | (2,253) | |
See the Combined Notes to Financial Statements.
Report of Independent Registered Public Accounting Firm
To the Management Committee and Member of Transcontinental Gas Pipe Line Company, LLC
Opinion on the Financial Statements
We have audited the accompanying balance sheets of Transcontinental Gas Pipe Line Company, LLC (the Company) as of December 31, 2024 and 2023, the related statements of net income, changes in member’s equity and cash flows for each of the three years in the period ended December 31, 2024, and the related notes (collectively referred to as the “financial statements”). In our opinion, the financial statements present fairly, in all material respects, the financial position of the Company at December 31, 2024 and 2023, and the results of its operations and its cash flows for each of the three years in the period ended December 31, 2024, in conformity with U.S. generally accepted accounting principles.
Basis for Opinion
These financial statements are the responsibility of the Company’s management. Our responsibility is to express an opinion on the Company’s financial statements based on our audits. We are a public accounting firm registered with the Public Company Accounting Oversight Board (United States) (PCAOB) and are required to be independent with respect to the Company in accordance with the U.S. federal securities laws and the applicable rules and regulations of the Securities and Exchange Commission and the PCAOB.
We conducted our audits in accordance with the standards of the PCAOB. Those standards require that we plan and perform the audit to obtain reasonable assurance about whether the financial statements are free of material misstatement, whether due to error or fraud. The Company is not required to have, nor were we engaged to perform, an audit of its internal control over financial reporting. As part of our audits we are required to obtain an understanding of internal control over financial reporting but not for the purpose of expressing an opinion on the effectiveness of the Company’s internal control over financial reporting. Accordingly, we express no such opinion.
Our audits included performing procedures to assess the risks of material misstatement of the financial statements, whether due to error or fraud, and performing procedures that respond to those risks. Such procedures included examining, on a test basis, evidence regarding the amounts and disclosures in the financial statements. Our audits also included evaluating the accounting principles used and significant estimates made by management, as well as evaluating the overall presentation of the financial statements. We believe that our audits provide a reasonable basis for our opinion.
Critical Audit Matter
The critical audit matter communicated below is a matter arising from the current period audit of the financial statements that was communicated or required to be communicated to the audit committee and that: (1) relates to accounts or disclosures that are material to the financial statements and (2) involved our especially challenging, subjective or complex judgments. The communication of the critical audit matter does not alter in any way our opinion on the financial statements, taken as a whole, and we are not, by communicating the critical audit matter below, providing a separate opinion on the critical audit matter or on the accounts or disclosures to which it relates.
| | | | | | | | | | | |
Description of the Matter | | | Regulatory Assets and Liabilities As discussed in Note 1 to the financial statements, the Company is an interstate natural gas transmission company that is regulated by the Federal Energy Regulatory Commission (“FERC”) and applies accounting principles in Topic 980 for regulated operations. As such, certain incurred costs that would otherwise be charged to expense are deferred as regulatory assets, based on the expected recovery from customers in future rates. Likewise, certain actual or anticipated credits that would otherwise reduce expense are deferred as regulatory liabilities, based on the expected return to customers in future rates. The Company records items as regulatory assets or liabilities if, based on regulatory orders or other available evidence, it is probable that the costs or obligations will be included in amounts allowable for recovery or refunded in future rates. Auditing regulatory assets and liabilities is complex as it requires specialized knowledge of rate-regulated activities and judgments about matters that could affect the recording of regulatory assets and liabilities. |
| How We Addressed the Matter in Our Audit | | | We obtained an understanding, evaluated the design, and tested the operating effectiveness of internal controls over the Company’s accounting for regulatory assets and liabilities, including, among others, controls over the evaluation of filings with regulatory bodies and their effects on existing regulatory assets and liabilities, including factors that may affect the timing or nature of recoverability. We performed audit procedures that included, among others, reviewing evidence of correspondence with regulatory bodies to test that the Company evaluated information obtained from regulatory rulings. For example, we assessed the recoverability, considering information obtained from regulatory orders, of regulatory assets. In addition, we tested calculations of regulatory assets and liabilities, including that the amortization for certain regulatory assets and liabilities corresponded to relevant regulatory filings and/or orders. |
/s/ Ernst & Young LLP
We have served as the Company’s auditor since 1995.
Houston, Texas
February 25, 2025
Transcontinental Gas Pipe Line Company, LLC
Statement of Net Income
| | | | | | | | | | | | | | | | | | | | |
| | Year Ended December 31, |
| | 2024 | | 2023 | | 2022 |
| | (Millions) |
| Revenues: | | | | | | |
| Natural gas transportation service revenues | | $ | 2,619 | | | $ | 2,506 | | | $ | 2,503 | |
| Natural gas storage service revenues | | 200 | | | 186 | | | 193 | |
| Natural gas product sales | | 118 | | | 137 | | | 179 | |
| Other service revenues | | 27 | | | 37 | | | 34 | |
| Total revenues | | 2,964 | | | 2,866 | | | 2,909 | |
| | | | | | |
| Costs and expenses: | | | | | | |
| Natural gas product costs | | 118 | | | 137 | | | 179 | |
| Operating and maintenance expenses | | 510 | | | 517 | | | 531 | |
| Selling, general, and administrative expenses | | 216 | | | 215 | | | 225 | |
| Depreciation and amortization expenses | | 545 | | | 519 | | | 513 | |
| Taxes, other than income taxes | | 111 | | | 105 | | | 98 | |
| | | | | | |
| Other (income) expense – net | | (35) | | | (38) | | | (7) | |
| Total costs and expenses | | 1,465 | | | 1,455 | | | 1,539 | |
| | | | | | |
| Operating income (loss) | | 1,499 | | | 1,411 | | | 1,370 | |
| | | | | | |
| Interest expense | | (324) | | | (324) | | | (327) | |
| Interest income | | 58 | | | 87 | | | 36 | |
| Allowance for equity and borrowed funds used during construction (AFUDC) | | 88 | | | 77 | | | 28 | |
| Other income (expense) – net | | (8) | | | (4) | | | (7) | |
| | | | | | |
| Net income (loss) | | $ | 1,313 | | | $ | 1,247 | | | $ | 1,100 | |
See the Combined Notes to Financial Statements.
Transcontinental Gas Pipe Line Company, LLC
Balance Sheet
| | | | | | | | | | | |
| December 31, |
| 2024 | | 2023 |
| (Millions) |
| ASSETS | | | |
| Current assets: | | | |
| Cash and cash equivalents | $ | — | | | $ | — | |
| Trade accounts and other receivables: | | | |
| Advances to affiliate | 638 | | | 1,353 | |
| Trade | 250 | | | 251 | |
| Affiliates | 24 | | | 10 | |
| Other | 12 | | | 11 | |
| | | |
| Inventories | 81 | | | 83 | |
| | | |
| | | |
| | | |
| Regulatory assets | 74 | | | 87 | |
| Other current assets and deferred charges | 24 | | | 14 | |
| Total current assets | 1,103 | | | 1,809 | |
| | | |
| | | |
| | | |
| Property, plant, and equipment – net | 14,103 | | | 13,330 | |
| | | |
| | | |
| Regulatory assets | 320 | | | 299 | |
| Deferred charges and other | 405 | | | 350 | |
| | | |
| | | |
| | | |
| Total assets | $ | 15,931 | | | $ | 15,788 | |
| | | |
| LIABILITIES AND MEMBER’S EQUITY | | | |
| Current liabilities: | | | |
| Payables: | | | |
| Trade | $ | 258 | | | $ | 278 | |
| Affiliates | 55 | | | 55 | |
| Regulatory liabilities | 58 | | | 49 | |
| Other current liabilities | 181 | | | 190 | |
| Asset retirement obligations | 22 | | | 96 | |
| Long-term debt due within one year | 35 | | | 32 | |
| Total current liabilities | 609 | | | 700 | |
| Long-term debt | 5,200 | | | 5,229 | |
| Regulatory liabilities | 976 | | | 956 | |
| Asset retirement obligations | 593 | | | 524 | |
| Deferred income and other | 248 | | | 242 | |
| Contingent liabilities and commitments (Note 18) | | | |
| | | |
| Member’s equity: | | | |
| Member’s capital | 5,088 | | | 5,088 | |
| Retained earnings | 3,217 | | | 3,049 | |
| Total member’s equity | $ | 8,305 | | | $ | 8,137 | |
| Total liabilities and member’s equity | $ | 15,931 | | | $ | 15,788 | |
See the Combined Notes to Financial Statements.
Transcontinental Gas Pipe Line Company, LLC
Statement of Changes in Member’s Equity
| | | | | | | | | | | | | | | | | | | | |
| | Year Ended December 31, |
| | 2024 | | 2023 | | 2022 |
| | (Millions) |
| Member’s Capital: | | | | | | |
| Balance at beginning of year | | $ | 5,088 | | | $ | 5,088 | | | $ | 4,960 | |
| Cash contributions from parent | | — | | | — | | | 128 | |
| | | | | | |
| | | | | | |
| Balance at end of year | | 5,088 | | | 5,088 | | | 5,088 | |
| Retained Earnings: | | | | | | |
| Balance at beginning of year | | 3,049 | | | 3,022 | | | 2,760 | |
| Net income | | 1,313 | | | 1,247 | | | 1,100 | |
| Cash distributions to parent | | (1,145) | | | (1,220) | | | (838) | |
| | | | | | |
| | | | | | |
| Balance at end of year | | 3,217 | | | 3,049 | | | 3,022 | |
| | | | | | |
| Total Member’s Equity | | $ | 8,305 | | | $ | 8,137 | | | $ | 8,110 | |
See the Combined Notes to Financial Statements.
Transcontinental Gas Pipe Line Company, LLC
Statement of Cash Flows
| | | | | | | | | | | | | | | | | |
| Year Ended December 31, |
| 2024 | | 2023 | | 2022 |
| (Millions) |
| OPERATING ACTIVITIES: | | | | | |
| Net income (loss) | $ | 1,313 | | | $ | 1,247 | | | $ | 1,100 | |
| Adjustments to reconcile net cash provided (used) by operating activities: | | | | | |
| Depreciation and amortization | 545 | | | 519 | | | 513 | |
| | | | | |
| Allowance for equity funds used during construction (equity AFUDC) | (71) | | | (63) | | | (23) | |
| | | | | |
| Cash provided (used) by changes in current assets and liabilities: | | | | | |
| Affiliate receivables | (14) | | | (1) | | | (1) | |
| Trade and other accounts receivable | — | | | 6 | | | (20) | |
| | | | | |
| Inventories | 2 | | | 10 | | | (39) | |
| Regulatory assets | 13 | | | 37 | | | (10) | |
| Other current assets and deferred charges | (10) | | | 27 | | | (17) | |
| Trade accounts payable | (4) | | | (18) | | | 21 | |
| Affiliate payables | — | | | 1 | | | (15) | |
| | | | | |
| Other current liabilities | (63) | | | 72 | | | (31) | |
| | | | | |
| Other, including changes in noncurrent assets and liabilities | (15) | | | (122) | | | 38 | |
| Net cash provided (used) by operating activities | 1,696 | | | 1,715 | | | 1,516 | |
| | | | | |
| FINANCING ACTIVITIES: | | | | | |
| | | | | |
| Proceeds from other financing obligations | 2 | | | 7 | | | 9 | |
| | | | | |
| Payments on other financing obligations | (32) | | | (29) | | | (26) | |
| | | | | |
| Cash distributions to parent | (1,145) | | | (1,220) | | | (838) | |
| Cash contributions from parent | — | | | — | | | 128 | |
| | | | | |
| Net cash provided (used) by financing activities | (1,175) | | | (1,242) | | | (727) | |
| INVESTING ACTIVITIES: | | | | | |
| Property, plant, and equipment: | | | | | |
| Capital expenditures (1) | (1,140) | | | (894) | | | (603) | |
| Contributions and advances for construction costs | 16 | | | 21 | | | 1 | |
| Dispositions - net | (110) | | | (51) | | | (33) | |
| Advances to affiliate - net | 715 | | | 460 | | | (143) | |
| | | | | |
| Purchase of asset retirement obligations trust investments | (23) | | | (22) | | | (21) | |
| Proceeds from sale of asset retirement obligations trust investments | 21 | | | 13 | | | 10 | |
| | | | | |
| Net cash provided (used) by investing activities | (521) | | | (473) | | | (789) | |
| | | | | |
| | | | | |
| Increase (decrease) in cash and cash equivalents | — | | | — | | | — | |
| Cash and cash equivalents at beginning of year | — | | | — | | | — | |
| Cash and cash equivalents at end of year | $ | — | | | $ | — | | | $ | — | |
| ____________________________ | | | | | |
| (1) Increase to property, plant and equipment, exclusive of equity AFUDC | $ | (1,112) | | | $ | (991) | | | $ | (587) | |
| Changes in related accounts payable and accrued liabilities | (28) | | | 97 | | | (16) | |
| Capital expenditures | $ | (1,140) | | | $ | (894) | | | $ | (603) | |
| | | | | |
| | | | | |
| | | | | |
| | | | | |
| | | | | |
See the Combined Notes to Financial Statements.
Report of Independent Registered Public Accounting Firm
To the Management Committee and Member of Northwest Pipeline LLC
Opinion on the Financial Statements
We have audited the accompanying balance sheets of Northwest Pipeline LLC (the Company) as of December 31, 2024 and 2023, the related statements of net income, changes in member’s equity and cash flows for each of the three years in the period ended December 31, 2024, and the related notes (collectively referred to as the “financial statements”). In our opinion, the financial statements present fairly, in all material respects, the financial position of the Company at December 31, 2024 and 2023, and the results of its operations and its cash flows for each of the three years in the period ended December 31, 2024, in conformity with U.S. generally accepted accounting principles.
Basis for Opinion
These financial statements are the responsibility of the Company’s management. Our responsibility is to express an opinion on the Company’s financial statements based on our audits. We are a public accounting firm registered with the Public Company Accounting Oversight Board (United States) (PCAOB) and are required to be independent with respect to the Company in accordance with the U.S. federal securities laws and the applicable rules and regulations of the Securities and Exchange Commission and the PCAOB.
We conducted our audits in accordance with the standards of the PCAOB. Those standards require that we plan and perform the audit to obtain reasonable assurance about whether the financial statements are free of material misstatement, whether due to error or fraud. The Company is not required to have, nor were we engaged to perform, an audit of its internal control over financial reporting. As part of our audits we are required to obtain an understanding of internal control over financial reporting but not for the purpose of expressing an opinion on the effectiveness of the Company’s internal control over financial reporting. Accordingly, we express no such opinion.
Our audits included performing procedures to assess the risks of material misstatement of the financial statements, whether due to error or fraud, and performing procedures that respond to those risks. Such procedures included examining, on a test basis, evidence regarding the amounts and disclosures in the financial statements. Our audits also included evaluating the accounting principles used and significant estimates made by management, as well as evaluating the overall presentation of the financial statements. We believe that our audits provide a reasonable basis for our opinion.
Critical Audit Matter
The critical audit matter communicated below is a matter arising from the current period audit of the financial statements that was communicated or required to be communicated to the audit committee and that: (1) relates to accounts or disclosures that are material to the financial statements and (2) involved our especially challenging, subjective or complex judgments. The communication of the critical audit matter does not alter in any way our opinion on the financial statements, taken as a whole, and we are not, by communicating the critical audit matter below, providing a separate opinion on the critical audit matter or on the accounts or disclosures to which it relates.
| | | | | | | | | | | |
Description of the Matter | | | Regulatory Assets and Liabilities As discussed in Note 1 to the financial statements, the Company is an interstate natural gas transmission company that is regulated by the Federal Energy Regulatory Commission (“FERC”) and applies accounting principles in Topic 980 for regulated operations. As such, certain incurred costs that would otherwise be charged to expense are deferred as regulatory assets, based on the expected recovery from customers in future rates. Likewise, certain actual or anticipated credits that would otherwise reduce expense are deferred as regulatory liabilities, based on the expected return to customers in future rates. The Company records items as regulatory assets or liabilities if, based on regulatory orders or other available evidence, it is probable that the costs or obligations will be included in amounts allowable for recovery or refunded in future rates. Auditing regulatory assets and liabilities is complex as it requires specialized knowledge of rate-regulated activities and judgments about matters that could affect the recording of regulatory assets and liabilities. |
| How We Addressed the Matter in Our Audit | | | We obtained an understanding, evaluated the design, and tested the operating effectiveness of internal controls over the Company’s accounting for regulatory assets and liabilities, including, among others, controls over the evaluation of filings with regulatory bodies and their effects on existing regulatory assets and liabilities, including factors that may affect the timing or nature of recoverability. We performed audit procedures that included, among others, reviewing evidence of correspondence with regulatory bodies to test that the Company evaluated information obtained from regulatory rulings. For example, we assessed the recoverability, considering information obtained from regulatory orders, of regulatory assets. In addition, we tested calculations of regulatory assets and liabilities, including that amortization for certain regulatory assets and liabilities corresponded to relevant regulatory filings and/or orders. |
/s/ Ernst & Young LLP
We have served as the Company’s auditor since 1986.
Houston, Texas
February 25, 2025
Northwest Pipeline LLC
Statement of Net Income
| | | | | | | | | | | | | | | | | |
| Year Ended December 31, |
| 2024 | | 2023 | | 2022 |
| (Millions) |
| Revenues: | | | | | |
| Natural gas transportation service revenues | $ | 416 | | | $ | 415 | | | $ | 430 | |
| Natural gas storage service revenues | 15 | | | 15 | | | 13 | |
| Other service revenues | 13 | | | 10 | | | 5 | |
| Total revenues | 444 | | | 440 | | | 448 | |
| | | | | |
| Costs and expenses: | | | | | |
| Operating and maintenance expenses | 95 | | | 88 | | | 84 | |
| Selling, general, and administrative expenses | 51 | | | 51 | | | 52 | |
| Depreciation and amortization expenses | 111 | | | 111 | | | 114 | |
| Taxes, other than income taxes | 14 | | | 12 | | | 17 | |
| | | | | |
| Other (income) expense - net | (18) | | | (16) | | | 22 | |
| Total costs and expenses | 253 | | | 246 | | | 289 | |
| | | | | |
| Operating income (loss) | 191 | | | 194 | | | 159 | |
| | | | | |
| Interest expense | (28) | | | (28) | | | (31) | |
| Allowance for equity and borrowed funds used during construction (AFUDC) | 10 | | | 4 | | | 3 | |
| Other income (expense) – net | 7 | | | 10 | | | 6 | |
| | | | | |
| Net income (loss) | 180 | | | 180 | | | 137 | |
| | | | | |
| | | | | |
| | | | | |
See the Combined Notes to Financial Statements.
Northwest Pipeline LLC
Balance Sheet
| | | | | | | | | | | |
| December 31, |
| 2024 | | 2023 |
| (Millions) |
| ASSETS | | | |
| Current Assets: | | | |
| Cash and cash equivalents | $ | — | | | $ | — | |
| Trade accounts and other receivables: | | | |
| Advances to affiliate | — | | | 158 | |
| Trade | 39 | | | 39 | |
| Affiliates | — | | | 1 | |
| Other | 2 | | | 1 | |
| | | |
| Inventories | 9 | | | 8 | |
| | | |
| | | |
| | | |
| Regulatory assets | 6 | | | 2 | |
| Other current assets and deferred charges | 6 | | | 5 | |
| Total current assets | 62 | | | 214 | |
| | | |
| | | |
| | | |
| Property, plant, and equipment – net | 2,129 | | | 1,949 | |
| | | |
| | | |
| Regulatory assets | 49 | | | 36 | |
| Deferred charges and other | 29 | | | 28 | |
| | | |
| | | |
| | | |
| Total assets | $ | 2,269 | | | $ | 2,227 | |
| | | |
| LIABILITIES AND MEMBER’S EQUITY | | | |
| Current Liabilities: | | | |
| Payables: | | | |
| Advances from affiliate | $ | 26 | | | $ | — | |
| Trade | 48 | | | 48 | |
| Affiliates | 12 | | | 13 | |
| Regulatory liabilities | 20 | | | 21 | |
| Other current liabilities | 34 | | | 34 | |
| | | |
| Long-term debt due within one year | 85 | | | — | |
| Total current liabilities | 225 | | | 116 | |
| Long-term debt | 497 | | | 581 | |
| Regulatory liabilities | 233 | | | 252 | |
| Asset retirement obligations | 144 | | | 136 | |
| Deferred income and other | 7 | | | 9 | |
| Contingent liabilities and commitments (Note 18) | | | |
| | | |
| Member’s Equity: | | | |
| Member’s capital | 1,074 | | | 1,074 | |
| Retained earnings | 89 | | | 59 | |
| Total member’s equity | $ | 1,163 | | | $ | 1,133 | |
| Total liabilities and member’s equity | $ | 2,269 | | | $ | 2,227 | |
See the Combined Notes to Financial Statements.
Northwest Pipeline LLC
Statement of Changes in Member’s Equity
| | | | | | | | | | | | | | | | | |
| Year Ended December 31, |
| 2024 | | 2023 | | 2022 |
| (Millions) |
| Member’s Capital: | | | | | |
| Balance at beginning and end of year | $ | 1,074 | | | $ | 1,074 | | | $ | 1,074 | |
| Retained Earnings: | | | | | |
| Balance at beginning of year | 59 | | | 34 | | | 35 | |
| Net income | 180 | | | 180 | | | 137 | |
| Cash distributions to parent | (150) | | | (155) | | | (138) | |
| Balance at end of year | 89 | | | 59 | | | 34 | |
| | | | | |
| | | | | |
| | | | | |
| | | | | |
| | | | | |
| | | | | |
| Total Member’s Equity | $ | 1,163 | | | $ | 1,133 | | | $ | 1,108 | |
See the Combined Notes to Financial Statements.
Northwest Pipeline LLC
Statement of Cash Flows
| | | | | | | | | | | | | | | | | |
| Year Ended December 31, |
| 2024 | | 2023 | | 2022 |
| (Millions) |
| OPERATING ACTIVITIES: | | | | | |
| Net income (loss) | $ | 180 | | | $ | 180 | | | $ | 137 | |
| Adjustments to reconcile net cash provided (used) by operating activities: | | | | | |
| Depreciation and amortization | 111 | | | 111 | | | 114 | |
| | | | | |
| | | | | |
| | | | | |
| Allowance for equity funds used during construction (equity AFUDC) | (8) | | | (3) | | | (2) | |
| Cash provided (used) by changes in current assets and liabilities: | | | | | |
| Affiliate receivables | 1 | | | — | | | (1) | |
| Trade and other accounts receivable | (1) | | | — | | | (1) | |
| | | | | |
| Inventories | (1) | | | 1 | | | — | |
| | | | | |
| Other current assets and deferred charges | (2) | | | 1 | | | — | |
| Trade accounts payable | (3) | | | 4 | | | (1) | |
| Affiliate payables | (1) | | | 1 | | | (1) | |
| | | | | |
| Regulatory liabilities | 1 | | | (126) | | | 145 | |
| Other current liabilities | (3) | | | 3 | | | 1 | |
| Other, including changes in noncurrent assets and liabilities: | | | | | |
| Regulatory assets | (15) | | | (29) | | | — | |
| Regulatory liabilities | (27) | | | (20) | | | (120) | |
| Other, net | 7 | | | 6 | | | (3) | |
| Net cash provided (used) by operating activities | 239 | | | 129 | | | 268 | |
| | | | | |
| FINANCING ACTIVITIES: | | | | | |
| | | | | |
| | | | | |
| | | | | |
| Cash distributions to parent | (150) | | | (155) | | | (138) | |
| Advances from affiliate, net | 26 | | | — | | | — | |
| Net cash provided (used) by financing activities | (124) | | | (155) | | | (138) | |
| | | | | |
| INVESTING ACTIVITIES: | | | | | |
| Property, plant, and equipment: | | | | | |
| Capital expenditures (1) | (266) | | | (125) | | | (107) | |
| Contributions and advances for construction costs | 5 | | | 6 | | | 11 | |
| Dispositions - net | (12) | | | (8) | | | (5) | |
| Advances to affiliate - net | 158 | | | 153 | | | (29) | |
| | | | | |
| Net cash provided (used) by investing activities | (115) | | | 26 | | | (130) | |
| | | | | |
| Increase (decrease) in cash and cash equivalents | — | | | — | | | — | |
| Cash and cash equivalents at beginning of year | — | | | — | | | — | |
| Cash and cash equivalents at end of year | $ | — | | | $ | — | | | $ | — | |
| ____________________________________ | | | | | |
| (1) Increases to property, plant and equipment, exclusive of equity AFUDC | $ | (266) | | | $ | (140) | | | $ | (109) | |
| Changes in related accounts payable and accrued liabilities | — | | | 15 | | | 2 | |
| Capital expenditures | $ | (266) | | | $ | (125) | | | $ | (107) | |
See the Combined Notes to Financial Statements.
Index of Combined Notes to Financial Statements
The Combined Notes to Financial Statements include information for multiple registrants, specifically The Williams Companies, Inc. (Williams), as well as Transcontinental Gas Pipe Line Company, LLC (Transco) and Northwest Pipeline LLC (NWP), both of which are wholly owned subsidiaries of Williams (collectively, the Registrants). The following list indicates the Registrants to which each of the combined notes apply. Specific disclosures within each combined note may apply to all Registrants unless indicated otherwise.
| | | | | | | | | | | | | | |
| Note | | Registrant | | Page |
| | Williams, Transco, NWP | | |
| | Williams | | |
| | Williams | | |
| | Williams, Transco, NWP | | |
| | Williams, Transco, NWP | | |
| | Williams | | |
| | Williams | | |
| | Williams | | |
| | Williams, Transco, NWP | | |
| | Williams, Transco, NWP | | |
| | Williams | | |
| | Williams, Transco, NWP | | |
| | Williams, Transco, NWP | | |
| | Williams, Transco, NWP | | |
| | Williams | | |
| | Williams, Transco, NWP | | |
| | Williams | | |
| | Williams, Transco, NWP | | |
| | Williams, Transco, NWP | | |
| | Williams | | |
Note 1 – General, Description of Business, Basis of Presentation, and Summary of Significant Accounting Policies
General
This report includes information for multiple registrants, specifically The Williams Companies, Inc. (Williams), as well as Transcontinental Gas Pipe Line Company, LLC (Transco) and Northwest Pipeline LLC (NWP) both of which are wholly owned subsidiaries of Williams (collectively, the Registrants). References to subsidiaries by name, including equity-method investees, Transco, and NWP, refer exclusively to those businesses and operations.
Description of Business
Williams
Williams is a Delaware corporation whose common stock is listed and traded on the New York Stock Exchange. Its operations are located in the United States and are presented within the following reportable segments:
Transmission & Gulf of America, Northeast G&P, West, and Gas & NGL Marketing Services, consistent with the manner in which Williams’ Chief Executive Officer, the chief operating decision maker, evaluates performance and allocates resources. All remaining business activities, including upstream operations, certain new energy ventures, and corporate activities, are included in Other.
Transmission & Gulf of America is comprised of the Transco, NWP, and MountainWest Pipelines Holding Company (MountainWest) interstate natural gas pipelines and their related natural gas storage facilities, as well as the natural gas gathering and processing and crude oil production handling and transportation assets in the Gulf Coast region, including Discovery Producer Services LLC (Discovery), a former 60 percent equity-method investment in which Williams acquired the remaining ownership interest in August 2024 (see Note 3 – Acquisitions and Divestitures), a 51 percent interest in Gulfstar One LLC (Gulfstar One) (a consolidated variable interest entity, or VIE), and a 50 percent equity-method investment in Gulfstream Natural Gas System, L.L.C. (Gulfstream). Transmission & Gulf of America also includes natural gas storage facilities and pipelines providing services in north Texas, and also in Louisiana and Mississippi related to the January 2024 Gulf Coast Storage Acquisition (see Note 3 – Acquisitions and Divestitures).
Northeast G&P is comprised of Williams’ midstream gathering, processing, and fractionation businesses in the Marcellus Shale region primarily in Pennsylvania and New York, and the Utica Shale region of eastern Ohio, as well as a 65 percent interest in Ohio Valley Midstream LLC (Northeast JV) (a consolidated VIE) which operates in West Virginia, Ohio, and Pennsylvania, a 66 percent interest in Cardinal Gas Services, L.L.C. (Cardinal) (a consolidated VIE) which operates in Ohio, a 69 percent equity-method investment in Laurel Mountain Midstream, LLC (Laurel Mountain), a 50 percent equity-method investment in Blue Racer Midstream LLC (Blue Racer), and Appalachia Midstream Services, LLC, a wholly owned subsidiary that owns equity-method investments with an approximate average 66 percent interest in multiple gas gathering systems in the Marcellus Shale region (Appalachia Midstream Investments).
West is comprised of Williams’ gas gathering, processing, and treating operations in the Rocky Mountain region of Colorado and Wyoming, the Barnett Shale region of north-central Texas, the Eagle Ford Shale region of south Texas, the Haynesville Shale region of east Texas and northwest Louisiana, the Mid-Continent region which includes the Anadarko and Permian basins, and the Denver-Julesberg Basin (DJ Basin) of Colorado which includes Rocky Mountain Midstream Holdings LLC (RMM), a former 50 percent equity-method investment that Williams acquired the remaining ownership interest in November 2023 (see Note 3 – Acquisitions and Divestitures). This segment also includes Williams’ natural gas liquid (NGL) storage facilities, an undivided 50 percent interest in an NGL fractionator near Conway, Kansas, and a 50 percent equity-method investment in Overland Pass Pipeline Company LLC (OPPL).
Gas & NGL Marketing Services is comprised of Williams’ NGL and natural gas marketing and trading operations, which includes risk management and transactions related to the storage and transportation of natural gas and NGLs on strategically positioned assets.
Transco
Transco is an interstate natural gas transmission company that owns and operates a natural gas pipeline system extending from Texas, Louisiana, Mississippi and the Gulf of America through Alabama, Georgia, South Carolina, North Carolina, Virginia, Maryland, Delaware, Pennsylvania, and New Jersey to the New York City metropolitan area. The system serves customers in Texas and the 12 southeast and Atlantic seaboard states mentioned above, including major metropolitan areas in Georgia, Washington D.C., Maryland, North Carolina, New York, New Jersey, and Pennsylvania. Transco is a single-member limited liability company, and as such, single-member losses are limited to the amount of its investment.
NWP
NWP owns and operates an interstate pipeline system for the mainline transmission of natural gas. This system extends from the San Juan Basin in northwestern New Mexico and southwestern Colorado through Colorado, Utah, Wyoming, Idaho, Oregon, and Washington to a point on the Canadian border near Sumas, Washington. NWP is a single-member limited liability company, and as such, single-member losses are limited to the amount of its investment.
Basis of Presentation
Discontinued Operations
During 2023, Williams recorded pre-tax charges of $125 million to Income (loss) from discontinued operations in the Consolidated Statement of Income related to litigation associated with its former Alaska refinery. Payments were made in January 2024 and the claims against Williams are now resolved. Except for this item and unless indicated otherwise, the information in the Combined Notes to Financial Statements relates to continuing operations.
Net gain from Energy Transfer Litigation Judgment
In November 2023, Williams received a $627 million payment from Energy Transfer Equity, L.P. (Energy Transfer) for the final order and judgment in connection to a lawsuit for breach of the Agreement and Plan of Merger with Energy Transfer. On the same day, Williams paid attorney fees which had been incurred on a contingent fee basis. This resulted in a net gain of $534 million reported as Net gain from Energy Transfer litigation judgment in the Consolidated Statement of Income for the year ended December 31, 2023.
Reclassifications
Certain prior-year amounts for Transco and NWP have been reclassified to conform to the current year’s presentation. These reclassifications had no impact on Transco’s or NWP’s net income (loss), working capital, cash flows or total member’s equity previously reported.
Summary of Significant Accounting Policies
Principles of Consolidation
Williams’ consolidated financial statements include the accounts of all entities that Williams controls and its proportionate interest in the accounts of certain ventures in which it owns an undivided interest. Management’s judgment is required to evaluate whether it controls an entity. Key areas of that evaluation include:
•Determining whether an entity is a VIE (see Note 2 – Variable Interest Entities);
•Determining whether Williams is the primary beneficiary of a VIE, including evaluating which activities of a VIE most significantly impact its economic performance and the degree of power that Williams and its related parties have over those activities through its variable interests;
•Identifying events that require reconsideration of whether an entity is a VIE and continuously evaluating whether Williams is a VIE’s primary beneficiary;
•Evaluating whether other owners in entities that are not VIEs are able to effectively participate in significant decisions that would be expected to be made in the ordinary course of business such that Williams does not have the power to control such entities.
Williams applies the equity method of accounting to investments over which it exercises significant influence but does not control. Distributions received from equity-method investees are presented in the Consolidated Statement of Cash Flows according to the nature of the distributions approach, which classifies distributions
received from equity-method investees as either returns on investment (cash inflows from operating activities) or returns of investment (cash inflows from investing activities) based on the nature of the activities of the equity-method investee that generated the distribution.
Use of Estimates
The preparation of financial statements in conformity with accounting principles generally accepted in the United States requires management to make estimates and assumptions that affect the amounts reported in the financial statements and accompanying combined notes. Actual results could differ from those estimates.
Significant estimates and assumptions may include:
•Impairment assessments of investments, property, plant, and equipment, and intangible assets;
•Litigation-related contingencies;
•Environmental remediation obligations;
•Depreciation and amortization of long-lived assets, which are comprised of property, plant, and equipment, and intangible assets;
•Depreciation and/or amortization of equity-method investment basis differences;
•Asset retirement obligations (AROs);
•Measurement of fair value of commodity derivatives;
•Pension and postretirement valuation variables;
•Measurement of regulatory assets and liabilities;
•Measurement of deferred income tax assets and liabilities, including assumptions related to the realization of deferred income tax assets;
•Revenue recognition, including estimates utilized in recognition of deferred revenue;
•Purchase price accounting.
These estimates are discussed further throughout these combined notes.
Regulatory Accounting
Transco, NWP, and MountainWest are regulated by the Federal Energy Regulatory Commission (FERC), and these regulated entities’ rates may also be negotiated with customers pursuant to the terms of tariffs and FERC policy. Therefore, management has determined that it is appropriate under Accounting Standards Codification (ASC) Topic 980, “Regulated Operations,” (ASC 980) that certain costs that would otherwise be charged to expense should be deferred as regulatory assets, based on the expected recovery from customers in future rates. Likewise, certain actual or anticipated credits that would otherwise reduce expense should be deferred as regulatory liabilities, based on the expected return to customers in future rates. Management’s expected recovery of deferred costs and return of deferred credits generally results from specific decisions by regulators granting such ratemaking treatment. Certain incurred costs and obligations are recorded as regulatory assets or liabilities if, based on regulatory orders or other available evidence, it is probable that the costs or obligations will be included in amounts allowable for recovery or refunded in future rates. Accounting for these operations that are regulated can differ from the accounting requirements for nonregulated operations. For example, for regulated operations, allowance for funds used during construction (AFUDC) represents the estimated cost of debt and equity funds applicable to utility plant in the process of construction and is capitalized as a cost of property, plant, and equipment because it constitutes an
actual cost of construction under established regulatory practices; nonregulated operations are only allowed to capitalize the cost of debt funds related to construction activities, while a component for equity is prohibited. Management has determined that for its regulated entities, it is appropriate to apply the accounting prescribed by ASC 980 and, accordingly, the accompanying financial statements include the effects of the types of transactions described above that result from regulatory accounting requirements (see Note 10 – Regulatory Assets and Liabilities).
The FERC has prescribed a formula to be used in computing separate allowances for borrowed and equity AFUDC. These allowances are recorded as follows:
Transco
| | | | | | | | | | | | | | | | | |
| | Year Ended December 31, |
| | 2024 | | 2023 | | 2022 |
| | (Millions) |
| Allowance for borrowed funds used during construction | $ | 17 | | | $ | 14 | | | $ | 5 | |
| Allowance for equity funds used during construction | 71 | | | 63 | | | 23 | |
| Allowance for equity and borrowed funds used during construction (AFUDC) | $ | 88 | | | $ | 77 | | | $ | 28 | |
NWP
| | | | | | | | | | | | | | | | | |
| | Year Ended December 31, |
| | 2024 | | 2023 | | 2022 |
| | (Millions) |
| Allowance for borrowed funds used during construction | $ | 2 | | | $ | 1 | | | $ | 1 | |
| Allowance for equity funds used during construction | 8 | | | 3 | | | 2 | |
| Allowance for equity and borrowed funds used during construction (AFUDC) | $ | 10 | | | $ | 4 | | | $ | 3 | |
Revenue Recognition
Customers in Williams’ gas pipeline businesses, including Transco and NWP, are comprised of public utilities, municipalities, gas marketers and producers, intrastate pipelines, direct industrial users, and electrical power generators. Customers in Williams’ midstream businesses are comprised of oil and natural gas producer counterparties. Customers for Williams’ product sales are comprised of public utilities, gas marketers, and direct industrial users.
Service revenue contracts from Williams’ gas pipeline and midstream businesses, including Transco and NWP, contain a series of distinct services, with the majority of the contracts having a single performance obligation that is satisfied over time as the customer simultaneously receives and consumes the benefits provided. Most of the product sales contracts have a single performance obligation with revenue recognized at a point in time when the products have been sold and delivered to the customer.
Certain customers reimburse Williams for costs it incurs associated with construction of property, plant, and equipment utilized in its operations. For Williams’ rate-regulated gas pipeline businesses, including Transco and NWP, that apply ASC 980, Williams follows FERC guidelines with respect to reimbursement of construction costs. FERC tariffs only allow for cost reimbursement and are non-negotiable in nature; thus, in management’s judgment, the construction activities do not represent an ongoing major and central operation of the gas pipeline businesses and are not within the scope of ASC Topic 606, “Revenue from Contracts with Customers”. Accordingly, cost reimbursements are treated as a reduction to the cost of the constructed asset. For the midstream businesses, reimbursement and service contracts with customers are viewed together as providing the same commercial objective, as Williams has the ability to negotiate the mix of consideration between reimbursements and amounts
billed over time. Accordingly, Williams generally recognizes reimbursements of construction costs from customers on a gross basis as a contract liability separate from the associated costs included within property, plant, and equipment. The contract liability is recognized into service revenues as the underlying performance obligations are satisfied.
Service Revenues
Gas pipeline businesses
Revenues from the regulated interstate natural gas pipeline businesses, including Transco and NWP, which are subject to regulation by certain state and federal authorities, including the FERC, include both firm and interruptible transportation and storage contracts. Firm transportation and storage agreements provide for a daily or monthly reservation charge based on the pipeline or storage capacity reserved, and a commodity charge based on the volume of natural gas delivered/stored, each at rates specified in the FERC tariffs or based on negotiated contractual rates, with contract terms that are generally long-term in nature. Most of the long-term contracts contain an evergreen provision, which allows the contracts to be extended for periods primarily up to one year in length an indefinite number of times following the specified contract term and until terminated generally by either party. Interruptible transportation and storage agreements provide for a volumetric charge based on actual commodity transportation or storage utilized in the period in which those services are provided, and the contracts are generally limited to one-month periods or less. The related performance obligations include the following:
•Firm transportation or storage under firm transportation and storage contracts—an integrated package of services typically constituting a single performance obligation, which includes standing ready to provide such services and receiving, transporting or storing (as applicable), and redelivering commodities;
•Interruptible transportation or storage under interruptible transportation and storage contracts—an integrated package of services typically constituting a single performance obligation once scheduled, which includes receiving, transporting or storing (as applicable), and redelivering commodities.
In situations where, in management’s judgment, it considers the integrated package of services as a single performance obligation, which represents a majority of its interstate natural gas pipeline contracts with customers, management does not consider there to be multiple performance obligations because the nature of the overall promise in the contract is to stand ready (with regard to firm transportation and storage contracts), receive, transport or store, and redeliver natural gas to the customer; therefore, revenue is recognized over time upon satisfaction of the daily stand ready performance obligation.
Revenues are recognized for reservation charges over the performance obligation period, which is the contract term, regardless of the volume of natural gas that is transported or stored. Revenues for commodity charges from both firm and interruptible transportation services and storage services are recognized when natural gas is delivered at the agreed upon delivery point or when natural gas is injected or withdrawn from the storage facility because they specifically relate to efforts to provide these distinct services. Generally, reservation charges and commodity charges in the interstate natural gas pipeline businesses are recognized as revenue in the same period they are invoiced to its customers. As a result of the ratemaking process, certain amounts collected may be subject to refund upon the issuance of final orders by the FERC in pending rate proceedings. Management uses judgment to record estimates of rate refund liabilities considering its and other third-party regulatory proceedings, advice of counsel, and other risks. As of December 31, 2024 and 2023, there were no such rate refund liabilities for Transco and NWP.
Midstream businesses
Revenues from the nonregulated gathering, processing, transportation, and storage midstream businesses include contracts for natural gas gathering, processing, treating, compression, transportation, and other related services with contract terms that are generally long-term in nature and may extend up to the production life of the associated reservoir. Additionally, the midstream businesses generate revenues from fees charged for storing customers’ natural gas and NGLs, generally under prepaid contracted storage capacity contracts. In situations where, in management’s judgment, it provides an integrated package of services combined into a single performance obligation, which represents a majority of this class of contracts with customers, Williams does not consider there to be multiple performance obligations because the nature of the overall promise in the contract is to provide gathering, processing, transportation, storage, and related services resulting in the delivery, or redelivery in the context of storage services, of pipeline-quality natural gas and NGLs to the customer. As such, revenue is recognized at the daily completion of the integrated package of services as the integrated package represents a single performance obligation. Additionally, certain contracts in the midstream businesses contain fixed or upfront payment terms that result in the deferral of revenues until such services have been performed or such capacity has been made available.
Williams also earns revenues from offshore crude oil and natural gas gathering and transportation and offshore production handling. These services represent an integrated package of services and are considered a single distinct performance obligation for which Williams recognizes revenues as the services are provided to the customer.
Williams generally earns a contractually stated fee per unit for the volume of product transported, gathered, processed, or stored. The rate is generally fixed; however, certain contracts contain variable rates that are subject to change based on commodity prices, levels of throughput, or an annual adjustment based on a formulaic cost-of-service calculation. In addition, Williams has contracts with contractually stated fees that decline over the contract term, such as declines based on the passage of time periods or achievement of cumulative throughput amounts. The excess of consideration received over revenue recognized results in the deferral of those amounts until future periods based on a units of production or straight-line methodology as these methods appropriately match the consumption of services provided to the customer. The units of production methodology requires the use of production estimates that are uncertain and the use of judgment when developing estimates of future production volumes, thus impacting the rate of revenue recognition. Production estimates are monitored as circumstances and events warrant. Certain of Williams’ gas gathering and processing agreements have minimum volume commitments (MVC). If a customer under such an agreement fails to meet its MVC for a specified period (thus not exercising all the contractual rights to gathering and processing services within the specified period, herein referred to as “breakage”), it is obligated to pay a contractually determined fee based upon the shortfall between the actual gathered or processed volumes and the MVC for the period contained in the contract. When Williams concludes, based on management’s judgment, it is probable that the customer will not exercise all or a portion of its remaining rights, Williams recognizes revenue associated with such breakage amount in proportion to the pattern of exercised rights within the respective MVC period.
Under keep-whole and percent-of-liquids processing contracts, Williams receives commodity consideration in the form of NGLs and takes title to the NGLs at the tailgate of the plant. Williams recognizes such commodity consideration as service revenue based on the market value of the NGLs retained at the time the processing is provided. The current market value, as opposed to the market value at the contract inception date, is used due to a combination of factors, including the fact that the volume, mix, and market price of NGL consideration to be received is unknown at the time of contract execution and is not specified in Williams’ contracts with customers. Additionally, product sales revenue (discussed below) is recognized upon the sale of the NGLs to a third party based on the sales price at the time of sale. As a result, revenue is recognized in the Consolidated Statement of Income both at the time the processing service is provided in Service revenues – commodity consideration and at the time the NGLs retained as part of the processing service are sold in Product
sales. The recognition of revenue related to commodity consideration has the impact of increasing the book value of NGL inventory, resulting in higher cost of goods sold at the time of sale.
Product Sales
In the course of providing transportation services to customers of the gas pipeline businesses, including Transco, and gathering and processing services to customers of the midstream businesses, different quantities of natural gas may be received from customers than the quantities delivered on behalf of those customers. The resulting imbalances are primarily settled monthly through the purchase or sale of natural gas with each customer under terms provided for in FERC tariffs or gathering and processing agreements, respectively. Revenue is recognized for Transco from the sale of natural gas upon settlement of imbalances (see Gas Imbalances below).
In certain instances, Williams purchases NGLs, crude oil, and natural gas from its oil and natural gas producer customers which Williams remarkets. In addition, Williams retains NGLs as consideration in certain processing arrangements, as discussed above in the Service Revenues - Midstream businesses section. Williams also markets natural gas and NGLs from the production at its upstream properties. Williams recognizes revenue from the sale of these commodities when the products have been sold and delivered. Williams’ product sales contracts are primarily short-term contracts based on prevailing market rates at the time of the transaction.
Williams purchases natural gas for storage when the current market price paid to buy and transport natural gas plus the cost to store and finance the natural gas is less than an estimated, forward market price that can be received in the future, resulting in positive net product sales. Commodity-based exchange-traded futures contracts and over-the-counter (OTC) contracts are used to sell natural gas at that future price to substantially protect the natural gas revenues that will ultimately be realized when the stored natural gas is sold. Additionally, Williams enters into transactions to secure transportation capacity between delivery points in order to serve its customers and various markets.
The physical purchase, transportation, storage, and sale of natural gas associated with these natural gas purchases are accounted for on a weighted-average cost or accrual basis, as appropriate, unlike the fair value basis utilized for the commodity derivatives used to mitigate the natural gas price risk associated with the storage and transportation portfolio. Monthly demand charges are incurred for contracted storage and transportation capacity and payments associated with asset management agreements and these demand charges and payments are recognized in the Consolidated Statement of Income in the period they are incurred.
As Williams is acting as an agent for its natural gas marketing customers and engages in energy trading activities, its natural gas marketing revenues are presented net of the related costs of those activities.
Contract Assets
Williams
Contract assets in the Consolidated Balance Sheet primarily consist of revenue recognized under contracts containing MVC features whereby management has concluded it is probable there will be a short-fall payment at the end of the current MVC period, which typically follows the calendar year, and that a significant reversal of revenue recognized currently for the future MVC payment will not occur. As a result, Williams’ contract assets related to its future MVC payments are generally expected to be collected within the next 12 months and are included within Other current assets and deferred charges in the Consolidated Balance Sheet until such time as the MVC short-fall payments are invoiced to the customer.
Transco and NWP
Transco’s contract assets primarily result from the modification of an existing contract resulting in increased rates. NWP’s contract assets consist of discounts provided to customers in the beginning of the contract term that are recognized on a straight-line basis over the entire contract term resulting in revenue
recognition occurring prior to actual billings. Current and noncurrent contract assets are included within Other current assets and deferred charges and Deferred charges and other, respectively, in the Balance Sheets.
Contract Liabilities
Williams
Contract liabilities in the Consolidated Balance Sheet consist of advance payments primarily from midstream business customers which include construction reimbursements, prepayments, and other billings and transactions for which future services are to be provided under the contract. These amounts are deferred until recognized in revenue when the associated performance obligation has been satisfied, which is primarily based on a units of production methodology over the remaining contractual service periods, and are classified as current or noncurrent according to when such amounts are expected to be recognized. Current and noncurrent contract liabilities are included within Other current liabilities and Regulatory liabilities, deferred income, and other, respectively, in the Consolidated Balance Sheet.
Contracts requiring advance payments and the recognition of contract liabilities are evaluated to determine whether the advance payments provide Williams with a significant financing benefit. This determination is based on the combined effect of the expected length of time between when Williams transfers the promised good or service to the customer, when the customer pays for those goods or services, and the prevailing interest rates. Williams has assessed its contracts for significant financing components and determined, in management’s judgment, that one group of contracts entered into in contemplation of one another for certain capital reimbursements contains a significant financing component. As a result, Williams recognizes noncash interest expense based on the effective interest method and revenue (noncash) is recognized when the underlying asset is placed into service utilizing a units of production or straight-line methodology over the life of the corresponding customer contract.
Transco and NWP
Transco’s contract liabilities consist of advance payments from customers, which include prepayments, and other billings for which future services are to be provided under the contract, and NWP’s contract liabilities consist of a fixed rate facility charge billed to customers with a declining rate structure in its tariffs. Transco assessed its contracts and determined none contain a significant financing component. These liabilities are classified as current or noncurrent according to when such amounts are expected to be recognized. Current and noncurrent contract liabilities are included within Other current liabilities and Deferred charges and other, respectively, in the Balance Sheets.
Commodity Derivative Instruments and Hedging Activities
Williams is exposed to commodity price risk and utilizes derivatives to manage a portion of its commodity price risk. These instruments consist primarily of swaps, futures, and forward contracts involving short- and long-term purchases and sales of energy commodities. Williams purchases natural gas for storage when the current market price paid to buy and transport natural gas plus the cost to store and finance the natural gas is less than an estimated, forward market price that can be received in the future. Additionally, Williams enters into transactions to secure transportation capacity between delivery points in order to serve its customers and various markets. Commodity-based exchange-traded futures contracts and OTC contracts are used to capture the price differential or spread between the locations served by the capacity in order to substantially protect the natural gas revenues that will ultimately be realized when the physical flow of natural gas between receipt and delivery points occurs. Some commodity derivative contracts require physical delivery as opposed to financial settlement, and this type of derivative is both common and prevalent within the natural gas marketing operations. These contracts generally meet the definition of derivatives and are typically not designated as hedges for accounting purposes. When a commodity derivative contract is settled physically, any cumulative unrealized gain or loss is reversed, and the contract price is recognized in the respective line item in the Consolidated Statement of Income representing the
actual price of the underlying goods being delivered. As of December 31, 2024 and 2023, Williams is not applying hedge accounting to any commodity derivative instruments.
Unrealized gains and losses from physically settled commodity derivative contracts for commodity sales transactions are recognized in Net gain (loss) from commodity derivatives in the Consolidated Statement of Income. Realized and unrealized gains and losses from non-designated commodity derivative contracts for commodity sales transactions that are financially settled are reported in Net gain (loss) from commodity derivatives in the Consolidated Statement of Income. Net gains and losses from derivatives for shrink gas purchases for processing plants are reported in Net processing commodity expenses in the Consolidated Statement of Income.
Williams experiences significant earnings volatility from the fair value accounting required for the derivatives used to hedge a portion of the economic value of the underlying transportation and storage portfolio as well as upstream related production. However, the unrealized fair value measurement gains and losses are generally offset by valuation changes in the economic value of the underlying production or transportation and storage contracts, which is not recognized until the underlying transaction occurs. (See Note 17 – Commodity Derivatives.)
Williams reports the fair value of derivatives, except those for which the normal purchases and normal sales exception has been elected, in Derivative assets; Regulatory assets, deferred charges, and other; Derivative liabilities; or Regulatory liabilities, deferred income, and other in the Consolidated Balance Sheet. These amounts are presented on a net basis and reflect the netting of asset and liability positions permitted under the terms of master netting arrangements and cash held on deposit in margin accounts that Williams has received or remitted to collateralize certain derivative positions. Williams determines the current and noncurrent classification based on the timing of expected future cash flows of individual trades.
The accounting for the changes in fair value of a commodity derivative can be summarized as follows:
| | | | | | | | |
| Derivative Treatment | | Accounting Method |
| Normal purchases and normal sales exception | | Accrual accounting |
| All other derivatives | | Mark-to-market accounting |
Williams may elect the normal purchases and normal sales exception for certain short- and long-term purchases and sales of physical energy commodities. Under accrual accounting, any change in the fair value of these derivatives is not reflected in the Consolidated Balance Sheet after the initial election of the exception.
Interest Capitalized
For its non-regulated companies, Williams capitalizes interest on its debt using the weighted-average interest rate on debt excluding debt issued by Transco, NWP, and MountainWest. This is included in Interest expense in Williams’ Consolidated Statement of Income.
For Williams’ regulated interstate natural gas pipelines, including Transco, NWP, and MountainWest, interest is capitalized from its borrowed funds and from internally generated funds (equity AFUDC) (see Regulatory Accounting). The former is included in Interest expense and the latter is included in Other income (expense) – net below Operating income (loss) in Williams’ Consolidated Statement of Income and Allowance for equity and borrowed funds used during construction (AFUDC) in Transco and NWP’s Statement of Net Income (see Note 9 – Property, Plant, and Equipment).
Income Taxes
Williams includes the operations of its domestic corporate subsidiaries and income from its subsidiary partnerships, as well as income from Transco and NWP which are treated as pass-through entities for state and local income tax purposes, in its consolidated federal income tax return and also files tax returns in various foreign and state jurisdictions as required. Deferred income taxes are computed using the liability method and are provided on
all temporary differences between the financial basis and the tax basis of its assets and liabilities. Management’s judgment and income tax assumptions are used to determine the levels, if any, of valuation allowances associated with deferred tax assets.
Earnings (Loss) Per Common Share
Williams’ Basic earnings (loss) per common share in the Consolidated Statement of Income is based on the sum of the weighted-average number of common shares outstanding and vested restricted stock units. Diluted earnings (loss) per common share in the Consolidated Statement of Income primarily includes any dilutive effect of nonvested restricted stock units and stock options. Diluted earnings (loss) per common share may also include any dilutive effect of Williams’ preferred stock. Diluted earnings (loss) per common share is calculated using the treasury-stock method.
Cash and Cash Equivalents
Cash and cash equivalents in the Consolidated Balance Sheet consist of highly liquid investments with original maturities of three months or less when acquired.
Accounts Receivable
Accounts receivable are carried on a gross basis, with no discounting, less an allowance for doubtful accounts. Management estimates the allowance for doubtful accounts, considering current expected credit losses using a forward-looking “expected loss” model, the financial condition of its customers, and the age of past due accounts. The majority of trade receivable balances are due within 30 days. Management monitors the credit quality of its counterparties through review of collection trends, credit ratings, and other analyses, such as bankruptcy monitoring. Williams’ financial assets from its natural gas transmission business, natural gas storage business, gathering, processing and transportation business, marketing business, and upstream operations, as applicable, are segregated into separate pools for evaluation due to different counterparty risks inherent in each business, with Transco’s and NWP’s financial assets each evaluated as one pool. Changes in counterparty risk factors could lead to reassessment of the composition of financial assets as one pool, separate pools, or the need for additional pools. Management calculates its allowance for credit losses incorporating an aging method. In estimating its expected credit losses, management utilizes historical loss rates over many years, which for Williams includes periods of both high and low commodity prices. Transco’s and NWP’s expected credit loss estimates considered both internal and external forward-looking commodity price expectations, as well as counterparty credit ratings, and factors impacting near-term liquidity.
Commodity prices could have a significant impact on a portion of Williams’ gathering and processing and upstream counterparties’ financial health and ability to satisfy current obligations. Williams’ expected credit loss estimate considers both internal and external forward-looking commodity price expectations, as well as counterparty credit ratings, and factors impacting near-term liquidity. In addition, Williams’ expected credit loss estimate considers potential contractual, physical, and commercial protections and outcomes in the case of a counterparty bankruptcy. The physical location and nature of Williams’ services help to mitigate collectability concerns of its gathering and processing producer customers. Williams’ gathering lines in many cases are physically connected to the customers’ wellheads and pads, and there may not be alternative gathering lines nearby. The construction of gathering systems is capital intensive and it would be costly for others to replicate, especially considering the depletion to date of the associated reserves. As a result, Williams plays a critical role in getting customers’ production from the wellhead to a marketable condition and location. This tends to reduce collectability risk as Williams’ services enable producers to generate operating cash flows. Commodity price movements generally do not impact the majority of Williams’ natural gas transmission businesses customers’ financial condition.
Williams also provides marketing and risk management services to retail and wholesale gas marketers, utility companies, upstream producers, and industrial customers. These counterparties utilize netting agreements that enable Williams to net receivables and payables by counterparty upon settlement. Williams also nets across product lines and against cash collateral received to collateralize receivable positions, provided the netting and cash
collateral agreements include such provisions. While the amounts due from, or owed to, Williams’ counterparties are settled net, these amounts are recorded on a gross basis in the Consolidated Balance Sheet as accounts receivable and accounts payable.
Extended payment terms are not offered and payments are typically received within one month. Receivables are considered past due if full payment is not received by the contractual due date. Past due accounts are generally written off against the allowance for doubtful accounts only after all collection attempts have been exhausted. Neither Williams, Transco, nor NWP have a material amount of significantly aged receivables at December 31, 2024 or 2023.
Gas Imbalances
Transco
Transco transports gas on various pipeline systems which may deliver different quantities of gas on behalf of Transco than the quantities of gas received from Transco. These transactions result in gas transportation and exchange imbalance receivables and payables which are recovered or repaid in cash or through the receipt or delivery of gas in the future and are recorded in the accompanying Balance Sheet. Revenues received from the cash-out of transportation imbalances in excess of costs incurred are deferred and offset by the deferral of costs incurred in excess of revenues received. At the end of each annual August through July reporting period, if the cumulative revenues received exceed the costs incurred, the over recovered amounts are applied to any prior under recovery balance or refunded. If the cumulative revenues received are less than the costs incurred, the net under recovered amounts are carried forward and offset against any future net over recoveries that may occur in a subsequent annual reporting period. These deferred recoveries are recognized as Regulatory assets in Transco’s Balance Sheet (see Note 10 – Regulatory Assets and Liabilities).
The settlement of imbalances requires agreement between the pipelines and shippers as to allocations of volumes to specific transportation contracts and timing of delivery of gas based on operational conditions. These imbalances are classified as Other current assets and deferred charges and Other current liabilities in Transco’s Balance Sheet (see Note 10 – Regulatory Assets and Liabilities). Transco utilizes the average cost method of accounting for gas imbalances.
NWP
In the course of providing transportation services to customers, NWP may receive different quantities of natural gas from customers than the quantities delivered on behalf of those customers or consumed in fuel to operate NWP’s system. The resulting customer imbalances are typically settled through the receipt or delivery of gas in the future based on the timelines outlined in NWP’s tariff, whereas the over/under recovery of fuel is cleared up through NWP’s semi-annual fuel tracker. Customer imbalances to be repaid or recovered in-kind are recorded as Other current assets and deferred charges or Other current liabilities in NWP’s Balance Sheet. The under recovery of fuel is recorded as Regulatory assets and the over recovery is recorded in Regulatory liabilities in NWP’s Balance Sheet (see Note 10 – Regulatory Assets and Liabilities). These imbalances are valued at published spot rates.
Inventories
Inventories in Williams’ Consolidated Balance Sheet primarily consist of NGLs, materials and supplies, and natural gas in underground storage and are primarily stated at the lower of cost or net realizable value. The cost of inventories are primarily determined using the average cost method. Inventories in Transco’s and NWP’s Balance Sheets primarily consist of materials and supplies and natural gas in underground storage.
Transco and NWP Environmental Matters
Transco and NWP are subject to federal, state, and local environmental laws and regulations. Environmental expenditures are expensed or capitalized depending on the economic benefit and potential for rate recovery. These
entities believe that expenditures required to meet applicable environmental laws and regulations are prudently incurred in the ordinary course of business and such expenditures would be permitted to be recovered through rates with limited exceptions.
In accordance with the Climate Commitment Act of the state of Washington, which established a market-based cap-and-invest program, NWP is required to obtain emission allowances for the carbon emissions from nine of NWP’s thirteen compressor stations within the state of Washington whose annual carbon emissions exceed 25,000 metric tons of carbon dioxide equivalent at least once since 2015. NWP records the purchased emission allowances at cost and the associated accumulated interest to a regulatory asset. The difference between the allowances held and the allowances required based on actual emissions for the period are measured using an estimate based on NWP’s most recent cost of allowances and accrued to a current liability and to a regulatory asset. NWP’s Petition for Approval of Pre-Filing Stipulation and Settlement Agreement (Settlement) in Docket No. RP22-1155, which FERC approved in 2022, allows NWP to recover the costs of purchasing allowances under the program in its next rate case (see Note 18 – Contingencies and Commitments).
Property, Plant, and Equipment
Property, plant, and equipment is initially recorded at cost. The carrying value of these assets is based on estimates, assumptions, and judgments relative to capitalized costs, useful lives, and salvage values. For the Transco, NWP, and MountainWest interstate natural gas pipelines, these estimates, assumptions and judgments reflect FERC regulations, as well as historical experience and expectations regarding future industry conditions and operations. The FERC identifies installation, construction and replacement costs that are to be capitalized. All other costs are expensed as incurred.
As regulated entities, Transco, NWP and MountainWest provide for depreciation primarily under the composite (group) method using straight-line FERC-prescribed rates. Under this method, assets with similar lives and characteristics are grouped and depreciated as one asset. These regulated entities’ depreciation rates are subject to change each time these regulated entities file a general rate case with the FERC. Included in Transco’s and NWP’s depreciation rates is a negative salvage component (net cost of removal) that Transco and NWP currently collect in rates that is recorded as a regulatory liability in the Balance Sheets (see Note 10 – Regulatory Assets and Liabilities).
Depreciation for Williams’ nonregulated entities is provided primarily on the straight-line method over estimated useful lives.
Williams follows the successful efforts method of accounting for its upstream properties. Its oil and gas producing property costs are depreciated using the units of production method.
Gains or losses from the ordinary sale or retirement of property, plant, and equipment for the Transco, NWP, and MountainWest interstate natural gas pipelines are credited or charged to accumulated depreciation; certain other gains or losses are recorded in Other (income) expense – net included in Operating income (loss) in the statements of income. Gains or losses from the ordinary sale or retirement of property, plant, and equipment for Williams’ nonregulated assets are primarily recorded in Other (income) expense – net included in Operating income (loss) in the Consolidated Statement of Income.
Ordinary maintenance and repair costs are generally expensed as incurred. Costs of major renewals and replacements are capitalized as property, plant, and equipment.
Williams records a liability and increases the basis in the underlying asset for the present value of each expected future ARO at the time the liability is initially incurred, typically when the asset is acquired or constructed. For Williams’ upstream properties, the ARO is recorded based on Williams’ working interest in the underlying properties. As regulated entities, Transco’s and NWP’s depreciation expense and accretion expense are offset and recorded as a regulatory asset as the regulated entities expect to recover these accretion expenses in future rates and measure changes in the liability due to passage of time by applying an interest rate to the liability balance. This step
is recognized as an increase in the carrying amount of the liability included in Operating and maintenance expenses and as a corresponding accretion expense included in Other (income) expense - net in the Consolidated Statement of Income. The regulatory asset is amortized commensurate with these regulated entities’ collection of those costs in rates.
Measurements of AROs include, as a component of future expected costs, an estimate of the price that a third party would demand, and could expect to receive, for bearing the uncertainties inherent in the obligations, sometimes referred to as a market-risk premium.
Goodwill
Goodwill included within Intangible assets – net of accumulated amortization in Williams’ Consolidated Balance Sheet, as of December 31, 2024, represents the excess of the consideration, plus the fair value of any noncontrolling interest or any previously held equity interest, over the fair value of the net assets acquired. It is not subject to amortization but is evaluated annually as of October 1 for impairment or more frequently if impairment indicators are present that would indicate it is more likely than not that the fair value of the reporting unit is less than its carrying amount. Management first performs a qualitative assessment to test goodwill on a reporting unit by reporting unit basis to determine whether it is more likely than not that the fair value of a reporting unit is less than its carrying amount, management compares its estimate of fair value of the reporting unit to its carrying amount, including goodwill. Judgments and assumptions are inherent in management’s estimates of fair value.
Other Identifiable Intangible Assets
Williams’ other identifiable intangible assets included within Intangible assets – net of accumulated amortization in the Consolidated Balance Sheet are primarily related to gas gathering, processing, and fractionation customer relationships. Williams’ other identifiable intangible assets are generally amortized on a straight-line basis over the period in which these assets contribute to its cash flows. Williams evaluates these assets for changes in the expected remaining useful lives and reflects any changes prospectively through amortization over the revised remaining useful life.
Impairment of Property, Plant, and Equipment, Intangible Assets, and Investments
Management evaluates property, plant, and equipment and intangible assets for impairment when, in its judgment, events or circumstances, including probable abandonment, indicate that the carrying value of such assets may not be recoverable. When an indicator of impairment has occurred, management compares its estimate of undiscounted future cash flows attributable to the assets to the carrying value of the assets to determine whether an impairment has occurred and may apply a probability-weighted approach to consider the likelihood of different cash flow assumptions and possible outcomes, including selling the assets in the near term or holding them for the asset’s remaining estimated useful life. If an impairment of the carrying value has occurred, management determines the amount of the impairment to be recognized in the financial statements by estimating the fair value of the assets and recording a loss for the amount that the carrying value exceeds the estimated fair value. This evaluation is performed at the lowest level for which separately identifiable cash flows exist.
For assets identified to be disposed of in the future and considered held for sale, management compares the carrying value to the estimated fair value less the cost to sell to determine if recognition of an impairment is required. Until the assets are disposed of, the estimated fair value, which includes estimated cash flows from operations until the assumed date of sale, is recalculated when related events or circumstances change.
Williams’ investments are evaluated for impairment when, in management’s judgment, events or circumstances indicate that the carrying value of such investments may have experienced an other-than-temporary decline in value. When evidence of loss in value has occurred, management compares its estimate of fair value of the investment to the carrying value of the investment to determine whether an impairment has occurred. If the estimated fair value is
less than the carrying value and management considers the decline in value to be other-than-temporary, the excess of the carrying value over the fair value is recognized in the financial statements as an impairment charge.
Judgment and assumptions are inherent in the estimate of undiscounted future cash flows and an asset’s or investment’s fair value. Additionally, judgment is used to determine the probability of sale with respect to assets considered for disposal.
Equity-Method Investment Basis Differences
Differences between the carrying value of Williams’ equity-method investments and the underlying equity in the net assets of investees are accounted for as if the investees were consolidated subsidiaries. Equity earnings (losses) in the Consolidated Statement of Income includes Williams’ allocable share of net income (loss) of investees adjusted for any depreciation and amortization, as applicable, associated with basis differences.
Leases
Williams, Transco, and NWP recognize operating lease liabilities based on the present value of the future lease payments and have elected to combine lease and nonlease components for all classes of leased assets in the calculation of the lease liability and the offsetting right-of-use asset in the respective Balance Sheets.
Williams’, Transco’s, and NWP’s lease agreements require both fixed and variable periodic payments, with initial terms typically ranging from one year to 20 years for Williams and up to 30 years for Transco and NWP. Payment provisions in certain lease agreements contain escalation factors which may be based on stated rates or a change in a published index at a future time. The amount by which a lease escalates based on the change in a published index, which is not known at lease commencement, is considered a variable payment and is not included in the present value of the future lease payments, which only includes those that are stated or can be calculated based on the lease agreement at lease commencement. In addition to the noncancellable periods, many of Williams’ lease agreements provide for one or more extensions of the lease agreement for periods ranging from one year in length to an indefinite number of times following the specified contract term. Other lease agreements provide for extension terms that allow Williams, Transco, and NWP to utilize the identified leased asset for an indefinite period of time so long as the asset continues to be utilized in its operations. In consideration of these renewal features, management assesses the term of the lease agreements, which includes using judgment in the determination of which renewal periods and termination provisions, when at its sole election, will be reasonably certain of being exercised. Periods after the initial term or extension terms that allow for either party to the lease to cancel the lease are not considered in the assessment of the lease term. Additionally, management has elected to exclude leases with an original term of one year or less, including renewal periods, from the calculation of the lease liability and the offsetting right-of-use asset.
Judgment is used in determining the discount rate upon which the present value of the future lease payments is determined. This rate is based on a collateralized interest rate corresponding to the term of the lease agreement using company, industry, and market information available.
When permitted under its lease agreements, Williams may sublease certain unused office space for fixed periods that could extend up to the length of the original lease agreement.
Pension and Other Postretirement Benefits
The funded status of each of the pension and other postretirement benefit plans is recognized separately in Williams’ Consolidated Balance Sheet as either an asset or liability. The plans’ benefit obligations and net periodic benefit costs (credits) are actuarially determined and impacted by various assumptions and estimates.
The discount rates are determined separately for each of Williams’ pension and other postretirement benefit plans based on an approach specific to Williams’ plans. The year-end discount rates are determined considering a
yield curve comprised of high-quality corporate bonds and the timing of the expected benefit cash flows of each plan.
The expected long-term rates of return on plan assets are determined by combining a review of the historical returns within the portfolio, the investment strategy included in the plans’ investment policy statement, and capital market projections for the asset classes in which the portfolio is invested, as well as the weighting of each asset class.
Unrecognized actuarial gains and losses are deferred and recorded in AOCI or, for Transco and NWP, as a regulatory asset or liability, until amortized as a component of net periodic benefit cost (credit). The unrecognized net actuarial gains (losses) deferred in AOCI at December 31, 2024 and 2023 were $55 million and ($17) million, respectively. Unrecognized actuarial gains and losses in excess of 10 percent of the greater of the benefit obligation or the market-related value of plan assets are amortized over the participants’ average remaining future years of service, which is approximately 9 years for Williams’ pension plans and approximately 4 years for Williams’ other postretirement benefit plan.
The expected return on plan assets component of net periodic benefit cost (credit) is calculated using the market-related value of plan assets. For Williams’ pension plans, the market-related value of plan assets is equal to the fair value of plan assets adjusted to reflect the amortization of gains or losses associated with the difference between the expected and actual return on plan assets over a 5-year period. Additionally, the market-related value of assets may be no more than 110 percent or less than 90 percent of the fair value of plan assets at the beginning of the year. The market-related value of plan assets for Williams’ other postretirement benefit plan is equal to the unadjusted fair value of plan assets at the beginning of the year.
Contingent Liabilities
Liabilities for loss contingencies, including environmental matters, are recorded when management assesses that a loss is probable and the amount of the loss can be reasonably estimated. These liabilities are calculated based upon management’s assumptions and estimates with respect to the likelihood or amount of loss and upon advice of legal counsel, engineers, or other third parties regarding the probable outcomes of the matters. These calculations are made without consideration of any potential recovery from third parties. Insurance recoveries or reimbursements from others are recognized when realizable. Revisions to these liabilities are generally reflected in income when new or different facts or information become known or circumstances change that affect the previous assumptions or estimates.
Treasury Stock
Treasury stock purchases are accounted for under the cost method whereby the entire cost of the acquired stock is recorded as Treasury stock, at cost in Williams’ Consolidated Balance Sheet. Gains and losses on the subsequent reissuance of shares are credited or charged to Capital in excess of par value in the Consolidated Balance Sheet using the average cost method.
Cash Flows from Operating Activities
Williams, Transco, and NWP use the indirect method to report cash flows from operating activities, which requires adjustments to net income to reconcile to net cash flows provided by operating activities.
Cash Flows from Revolving Credit Facility and Commercial Paper Program
Proceeds and payments related to borrowings under Williams’ revolving credit facility are reflected in the financing activities in the Consolidated Statement of Cash Flows on a gross basis. Proceeds and payments related to borrowings under Williams’ commercial paper program are reflected in the financing activities in the Consolidated Statement of Cash Flows on a net basis, as the outstanding notes generally have maturity dates less than three months from the date of issuance. (See Note 13 – Debt and Banking Arrangements.)
Accounting Standards Issued But Not Yet Adopted
In December 2023, the Financial Accounting Standards Board (FASB) issued Accounting Standard Update (ASU) 2023-09, Income Taxes: Improvements to Income Tax Disclosures, which requires disclosure of specific categories in the rate reconciliation and additional information for reconciling items that meet a quantitative threshold. This ASU is effective for fiscal years beginning after December 15, 2024, and early adoption is permitted. The adoption of ASU 2023-09 is not expected to have a material impact on the financial statements.
In November 2024, the FASB issued ASU 2024-03, Income Statement - Reporting Comprehensive Income - Expense Disaggregation Disclosures, which requires public entities to disclose additional information in the notes to financial statements for certain types of expenses (including purchases of inventory, employee compensation, depreciation, amortization, and depletion) in commonly presented expense captions (such as cost of sales, selling, general & administrative expenses, and research and development). The amendments are effective for annual periods beginning after December 15, 2026, and interim periods within fiscal years beginning after December 15, 2027 with early adoption permitted. The impact of this standard is currently being evaluated.
Share Repurchase Program
In September 2021, Williams’ Board of Directors authorized a share repurchase program with a maximum dollar limit of $1.5 billion. Repurchases may be made from time to time in the open market, by block purchases, in privately negotiated transactions, or in such other manner as determined by management. Williams will also determine the timing and amount of any repurchases based on market conditions and other factors. The share repurchase program does not obligate Williams to acquire any particular amount of common stock, and it may be suspended or discontinued at any time. This share repurchase program does not have an expiration date. There were $0 million, $130 million and $9 million of repurchases under the program in 2024, 2023, and 2022, respectively, which are included in the Consolidated Statement of Changes in Equity. Cumulative repurchases to date under the program total $139 million.
Significant Risks and Uncertainties
Management believes that the carrying value of certain of Williams’ property, plant, and equipment and intangible assets, notably certain assets acquired by Williams accounted for as business combinations between 2012 and 2014, may be in excess of current fair value. However, the carrying value of these assets, in management’s judgment, continues to be recoverable. It is reasonably possible that future strategic decisions, including transactions such as monetizing assets or contributing assets to new ventures with third parties, as well as unfavorable changes in expected producer activities, could impact management’s assumptions and ultimately result in impairments of these assets. Such transactions or developments may also indicate that certain Williams’ equity-method investments have experienced other-than-temporary declines in value, which could result in impairment.
Note 2 – Variable Interest Entities
Consolidated VIEs
As of December 31, 2024, Williams consolidated the following VIEs:
Northeast JV
Williams owns a 65 percent interest in the Northeast JV, a subsidiary that is a VIE due to certain voting rights being disproportionate to the obligation to absorb losses and substantially all of the Northeast JV’s activities being performed on Williams’ behalf. Williams is the primary beneficiary because it has the power to direct the activities that most significantly impact the Northeast JV’s economic performance. The Northeast JV provides midstream services for producers in the Marcellus Shale and Utica Shale regions. Future expansion activity is expected to be funded with capital contributions from Williams and the other equity partner on a proportional basis.
Gulfstar One
Williams owns a 51 percent interest in Gulfstar One, a subsidiary that, due to certain risk-sharing provisions in its customer contracts, is a VIE. Gulfstar One includes a proprietary floating-production system, Gulfstar FPS, and associated pipelines that provide production handling and gathering services in the eastern deepwater Gulf of America. Williams is the primary beneficiary because it has the power to direct the activities that most significantly impact Gulfstar One’s economic performance.
Cardinal
Williams owns a 66 percent interest in Cardinal, a subsidiary that provides gathering services for the Utica Shale region and is a VIE due to certain risks shared with customers. Williams is the primary beneficiary because it has the power to direct the activities that most significantly impact Cardinal’s economic performance. In order to meet contractual gas gathering commitments, Williams may fund more than its proportional share of future expansion activity, which could ultimately impact relative ownership.
The following table presents amounts included in the Consolidated Balance Sheet that are only for the use or obligation of the consolidated VIEs:
| | | | | | | | | | | |
| |
| December 31, |
| 2024 | | 2023 |
| (Millions) |
| Assets (liabilities): | | | |
| Cash and cash equivalents | $ | 15 | | | $ | 33 | |
| Trade accounts and other receivables – net | 178 | | | 215 | |
| Inventories | 5 | | | 5 | |
| Other current assets and deferred charges | 7 | | | 4 | |
| Property, plant, and equipment – net | 4,896 | | | 5,046 | |
| Intangible assets – net of accumulated amortization | 1,940 | | | 2,049 | |
| Regulatory assets, deferred charges, and other | 27 | | | 31 | |
| Accounts payable | (57) | | | (109) | |
| Other current liabilities | (29) | | | (28) | |
| | | |
| Regulatory liabilities, deferred income, and other | (263) | | | (268) | |
Nonconsolidated VIEs
Williams owns certain equity-method investments that are VIEs due primarily to its limited participating rights as a minority equity holder. Williams’ maximum exposure to loss is limited to the carrying value of these investments (included within Investments in the Consolidated Balance Sheet), which totaled $72 million at December 31, 2024.
Note 3 – Acquisitions and Divestitures
Crowheart Acquisition
As of December 31, 2023, Williams had an agreement regarding certain crude oil and natural gas properties in the Wamsutter basin in Wyoming under which it owned a 75 percent undivided interest in each well’s working interest and proportionally consolidated its undivided interest. On November 1, 2024, Williams closed on the acquisition of a third-party operator, Crowheart Energy, LLC, for $307 million cash, subject to working capital and post-closing adjustments (Crowheart Acquisition). After closing on the acquisition, Williams owns more than a 90 percent working interest in each well. The purpose of this acquisition was to consolidate Williams’ interests in the Wamsutter basin and further optimize development in the area to continue to supply its gathering and processing assets. Assets acquired, acquisition-related costs incurred, and results of operations realized are included at Other.
During the period from the acquisition date of November 1, 2024 to December 31, 2024, the additional interest acquired in the Crowheart Acquisition contributed Revenues of $20 million and Modified EBITDA (as defined in Note 19 – Segment Disclosures) of $7 million.
Williams accounted for the Crowheart Acquisition as a business combination, which requires, among other things, that identifiable assets acquired and liabilities assumed be recognized at their acquisition date fair values.
The following table presents the preliminary allocation of the acquisition date fair value of the major classes of the assets acquired and liabilities assumed at November 1, 2024. The allocation is considered preliminary because the valuation work has not been completed due to the ongoing review of the valuation results and validation of significant inputs and assumptions. Preliminary fair value measurements were made for certain acquired assets and liabilities, primarily property, plant, and equipment, which utilized the income approach for proved developed producing reserves and the market approach for undeveloped reserves; however, adjustments to those measurements may be made in subsequent periods, up to one year from the acquisition date, as new information related to facts and circumstances as of the acquisition date may be identified.
| | | | | |
| (Millions) |
| Cash and cash equivalents | $ | 94 | |
| Other current assets | 15 | |
| Property, plant, and equipment – net | 400 | |
| Other noncurrent assets | 2 | |
| Total assets acquired | 511 | |
| |
| Current liabilities | (45) | |
| Noncurrent liabilities | (115) | |
| Total liabilities assumed | (160) | |
| |
| Net assets acquired | $ | 351 | |
Discovery Acquisition
As of December 31, 2023, Williams owned a 60 percent interest in Discovery, which it accounted for as an equity-method investment. On August 1, 2024, Williams closed on the acquisition of the remaining 40 percent interest in Discovery, along with certain other assets, for $170 million cash, subject to working capital and post-closing adjustments (Discovery Acquisition). As a result of acquiring this additional interest, Williams obtained control and subsequently consolidates Discovery. The purpose of this acquisition was to expand Williams’ gathering, processing, and transportation presence in the Gulf of America region. Assets acquired, acquisition-related costs incurred, and results of operations realized are included within Williams’ Transmission & Gulf of America segment.
During the period from the acquisition date of August 1, 2024 to December 31, 2024, the operations acquired in the Discovery Acquisition contributed Revenues of $144 million and Modified EBITDA of $42 million.
Acquisition-related costs for the Discovery Acquisition total $1 million and are included in Selling, general, and administrative expenses in the Williams Consolidated Statement of Income.
Williams accounted for the Discovery Acquisition as a business combination. The book value of its existing equity-method investment prior to the acquisition date of August 1, 2024, was $381 million. Williams recognized a $127 million gain on remeasuring its existing equity-method investment to fair value included in Other investing income (loss) – net in the Williams Consolidated Statement of Income during 2024, which is not included in the pro forma Discovery adjustments below. Williams utilized the income approach to fair value its previous equity-method investment in Discovery.
The following table presents the preliminary allocation of the acquisition date fair value of the major classes of the assets acquired and liabilities assumed at August 1, 2024. The allocation is considered preliminary because the valuation work has not been completed due to the ongoing review of the valuation results and validation of significant inputs and assumptions. Preliminary fair value measurements were made for certain acquired assets and liabilities, primarily property, plant, and equipment, which utilized the cost approach; however, adjustments to those measurements may be made in subsequent periods, up to one year from the acquisition date, as new information related to facts and circumstances as of the acquisition date may be identified.
| | | | | |
| (Millions) |
| Cash and cash equivalents | $ | 22 | |
| Other current assets | 19 | |
| Property, plant, and equipment – net | 941 | |
| Other noncurrent assets | 39 | |
| Total assets acquired | 1,021 | |
| |
| Current liabilities | (40) | |
| Noncurrent liabilities | (296) | |
| Total liabilities assumed | (336) | |
| |
| Net assets acquired | $ | 685 | |
Gulf Coast Storage Acquisition
On January 3, 2024, Williams closed on the acquisition from Hartree Partners LP for $1.95 billion of 100 percent of a strategic portfolio of natural gas storage facilities and pipelines, located in Louisiana and Mississippi (Gulf Coast Storage Acquisition). The purpose of this acquisition was to expand Williams’ natural gas storage footprint in the Gulf Coast region. Assets acquired, acquisition-related costs incurred, and results of operations realized are included within Williams’ Transmission & Gulf of America segment. The Gulf Coast Storage Acquisition was funded with cash on hand and $100 million of deferred consideration that did not accrue interest and was payable one year from the acquisition date. The obligation is presented within Long-term debt due within one year in the Williams Consolidated Balance Sheet as of December 31, 2024, owed by Williams’ wholly owned subsidiary Williams Field Services Group, LLC. On January 3, 2025, Williams paid the remaining $100 million of the Gulf Coast Storage Acquisition purchase price obligation.
During the period from the acquisition date of January 3, 2024 to December 31, 2024, the operations acquired in the Gulf Coast Storage Acquisition contributed Revenues of $228 million and Modified EBITDA of $160 million, which is impacted by acquisition-related costs. Acquisition-related costs for the Gulf Coast Storage Acquisition total $15 million, including $14 million incurred in 2024, and are included in Selling, general, and administrative expenses in the Williams Consolidated Statement of Income.
Williams accounted for the Gulf Coast Storage Acquisition as a business combination. The valuation technique used consisted of the cost approach for property, plant, and equipment.
The following table presents the allocation of the acquisition date fair value of the major classes of the assets acquired and liabilities assumed at January 3, 2024.
| | | | | |
| (Millions) |
| Cash and cash equivalents | $ | 46 | |
| Other current assets | 18 | |
| Property, plant, and equipment – net | 2,035 | |
| Other noncurrent assets | 2 | |
| Total assets acquired | 2,101 | |
| |
| Current liabilities | (11) | |
| Noncurrent liabilities | (107) | |
| Total liabilities assumed | (118) | |
| |
| Net assets acquired | $ | 1,983 | |
DJ Basin Acquisitions
Cureton Acquisition
On November 30, 2023, Williams closed on the acquisition of 100 percent of Cureton Front Range, LLC (Cureton Acquisition), whose operations are located in the DJ Basin, for $546 million. The purpose of this acquisition was to expand Williams’ gathering and processing footprint and create operational synergies for its operations in the DJ Basin. Assets acquired, acquisition-related costs incurred, and results of operations realized are included within Williams’ West segment. The Cureton Acquisition was funded with cash on hand.
During the period from the acquisition date of November 30, 2023 to December 31, 2023, the operations acquired in the Cureton Acquisition contributed Revenues of $35 million and Modified EBITDA of $7 million.
Acquisition-related costs for the Cureton Acquisition total $8 million, including $6 million incurred in 2023, and are included in Selling, general, and administrative expenses in the Williams Consolidated Statement of Income.
Williams accounted for the Cureton Acquisition as a business combination. The valuation techniques used consisted of the cost approach for property, plant, and equipment and the income approach for valuation of other intangible assets.
The following table presents the allocation of the acquisition date fair value of the major classes of the assets acquired and liabilities assumed at November 30, 2023.
| | | | | |
| (Millions) |
| Cash and cash equivalents | $ | 6 | |
| Other current assets | 21 | |
| Property, plant, and equipment – net | 433 | |
| Intangible assets – net of accumulated amortization | 117 | |
| Other noncurrent assets | 1 | |
| Total identifiable assets acquired | 578 | |
| |
| Current liabilities | (29) | |
| Noncurrent liabilities | (14) | |
| Total liabilities assumed | (43) | |
| |
| Net identifiable assets acquired | 535 | |
| |
Goodwill included in Intangible assets – net of accumulated amortization | 11 | |
| Net assets acquired | $ | 546 | |
Other intangible assets recognized in the Cureton Acquisition are related to contractual customer relationships from gas gathering and processing agreements with customers. The basis for determining the value of these intangible assets is estimated future net cash flows to be derived from acquired contractual customer relationships discounted using a risk-adjusted discount rate. These intangible assets are being amortized on a straight-line basis over an initial period of 20 years which represents the term over which the contractual customer relationships are expected to contribute to Williams’ cash flows. Approximately 24 percent of the expected future revenues from these contractual customer relationships are impacted by Williams’ ability and intent to renew or renegotiate existing customer contracts. Williams expenses costs incurred to renew or extend the terms of its gas gathering contracts with customers. Based on the estimated future revenues during the current contract periods (as estimated at the time of the acquisition), the weighted-average period prior to the next renewal or extension of the existing contractual customer relationships is approximately 10 years. See Note 11 – Goodwill and Other Intangible Assets.
RMM Acquisition
As of December 31, 2022, Williams owned a 50 percent interest in RMM which it accounted for as an equity-method investment. On November 30, 2023, Williams closed on the acquisition of the remaining 50 percent interest in RMM (RMM Acquisition) for $704 million. As a result of acquiring this additional interest, Williams obtained control and subsequently consolidates RMM. The purpose of this acquisition was to expand Williams’ gathering and processing footprint and create operational synergies for its operations in the DJ Basin. Assets acquired and results of operations realized are included within Williams’ West segment. Substantially all of the RMM purchase price was not due to the seller until the first quarter of 2025, would not accrue interest until November 2, 2024, and could be repaid early without penalty. It was recorded as a deferred consideration obligation at fair value using an income approach, which resulted in a discount to the contractual amount due which was imputed as interest expense over the term of the obligation. On November 1, 2024, Williams paid the remaining $651 million of the RMM purchase price obligation.
During the period from the acquisition date of November 30, 2023 to December 31, 2023, RMM contributed Revenues of $53 million and Modified EBITDA of $12 million.
Williams accounted for the RMM Acquisition as a business combination. The book value of Williams’ existing equity-method investment prior to the acquisition date of November 30, 2023, was $406 million. Williams recognized a $30 million gain on remeasuring its existing equity-method investment to fair value included in Other investing income (loss) – net in the Williams Consolidated Statement of Income during the fourth quarter of 2023,
which is not included in the pro forma DJ Basin adjustments below. The valuation techniques used consisted of the income approach for Williams’ previous equity-method investment in RMM and the valuation of other intangible assets, and the cost approach for property, plant, and equipment.
The following table presents the allocation of the acquisition date fair value of the major classes of the assets acquired and liabilities assumed at November 30, 2023. The net assets acquired primarily reflect the noncash consideration transferred, which includes the fair value of both Williams’ previous equity-method investment and the deferred consideration obligation.
| | | | | |
| (Millions) |
| Cash and cash equivalents | $ | 28 | |
| Other current assets | 4 | |
| Investments | 20 | |
| Property, plant, and equipment – net | 1,041 | |
| Intangible assets – net of accumulated amortization | 63 | |
| Other noncurrent assets | 12 | |
| Total identifiable assets acquired | 1,168 | |
| |
| Current liabilities | (44) | |
| Noncurrent liabilities | (103) | |
| Total liabilities assumed | (147) | |
| |
| Net identifiable assets acquired | 1,021 | |
| |
Goodwill included in Intangible assets – net of accumulated amortization | 55 | |
| Net assets acquired | $ | 1,076 | |
Goodwill recognized in the RMM Acquisition relates primarily to enhancing and diversifying Williams’ basin positions as well as delivering operational synergies, including increasing volumes on its existing processing facilities and increasing revenues on its NGL transportation, fractionation, and storage assets, and is reported within Williams’ West segment. Substantially all of the goodwill is deductible for tax purposes.
Other intangible assets recognized in the RMM Acquisition are related to contractual customer relationships from gas gathering and processing agreements with customers. The basis for determining the value of these intangible assets is estimated future net cash flows to be derived from acquired contractual customer relationships discounted using a risk-adjusted discount rate. These intangible assets are being amortized on a straight-line basis over an initial period of 20 years which represents the term over which the contractual customer relationships are expected to contribute to Williams’ cash flows. Approximately 18 percent of the expected future revenues from these contractual customer relationships are impacted by Williams’ ability and intent to renew or renegotiate existing customer contracts. Williams expenses costs incurred to renew or extend the terms of its gas gathering contracts with customers. Based on the estimated future revenues during the current contract periods (as estimated at the time of the acquisition), the weighted-average period prior to the next renewal or extension of the existing contractual customer relationships is approximately 10 years. See Note 11 – Goodwill and Other Intangible Assets.
MountainWest Acquisition
On February 14, 2023, Williams closed on the acquisition of 100 percent of MountainWest, which includes FERC-regulated interstate natural gas pipeline systems and natural gas storage capacity (MountainWest Acquisition), for $1.08 billion of cash, funded with available sources of short-term liquidity, and retaining $430 million outstanding principal amount of MountainWest long-term debt. For 2023, $1.024 billion is presented in Purchases of businesses, net of cash acquired in the Williams Consolidated Statement of Cash Flows reflecting the cash purchase price, reduced for post-closing adjustments and the cash acquired as presented in the purchase price
allocation. The purpose of the MountainWest Acquisition was to expand Williams’ existing transmission and storage infrastructure footprint into major markets in Utah, Wyoming, and Colorado. Assets acquired, acquisition-related costs incurred, and results of operations realized are included within Williams’ Transmission & Gulf of America segment.
During the period from the acquisition date of February 14, 2023 to December 31, 2023, the operations acquired in the MountainWest Acquisition contributed Revenues of $225 million and Modified EBITDA of $122 million, which includes $27 million of transition-related costs.
Acquisition-related costs for the MountainWest Acquisition total $18 million, including $16 million incurred in 2023, and are included in Selling, general, and administrative expenses in the Williams Consolidated Statement of Income.
Williams accounted for the MountainWest Acquisition as a business combination. The valuation techniques used consisted of the cost approach for nonregulated property, plant, and equipment, as well as the market approach for the assumed long-term debt consistent with the valuation technique discussed in Note 16 – Fair Value Measurements, Guarantees, and Concentration of Credit Risk. MountainWest’s regulated operations are accounted for pursuant to ASC 980. The fair value of assets and liabilities subject to rate making and cost recovery provisions were determined utilizing the income approach. MountainWest’s expected return on rate base is consistent with expected returns of similarly situated assets, resulting in carryover basis of these assets and liabilities equaling their fair value.
The following table presents the allocation of the acquisition date fair value of the major classes of the assets acquired and liabilities assumed at February 14, 2023. The fair value of accounts receivable acquired equals contractual amounts receivable.
| | | | | |
| (Millions) |
| Cash and cash equivalents | $ | 23 | |
| Trade accounts and other receivables | 33 | |
| Other current assets | 26 | |
| Investments | 20 | |
| Property, plant, and equipment – net | 1,019 | |
| Other noncurrent assets | 33 | |
| Total identifiable assets acquired | 1,154 | |
| |
| Current liabilities | (47) | |
| Long-term debt | (365) | |
| Other noncurrent liabilities | (95) | |
| Total liabilities assumed | (507) | |
| |
| Net identifiable assets acquired | 647 | |
| |
Goodwill included in Intangible assets – net of accumulated amortization | 400 | |
| Net assets acquired | $ | 1,047 | |
Goodwill recognized in the MountainWest Acquisition relates primarily to enhancing and diversifying Williams’ basin positions and the long-term value associated with rate regulated businesses and is reported within its Transmission & Gulf of America segment. Substantially all of the goodwill is deductible for tax purposes.
Trace Acquisition
On April 29, 2022, Williams closed on the acquisition of 100 percent of Gemini Arklatex, LLC through which it acquired the Haynesville Shale region gas gathering and related assets of Trace Midstream for $972 million of cash
funded with cash on hand and proceeds from issuance of commercial paper (Trace Acquisition). The purpose of the Trace Acquisition was to expand Williams’ footprint into the east Texas area of the Haynesville Shale region, increasing in-basin scale in one of the largest growth basins in the country. Assets acquired, acquisition-related costs incurred, and results of operations realized are included within Williams’ West segment.
During the period from the acquisition date of April 29, 2022 to December 31, 2022, the operations acquired in the Trace Acquisition contributed Revenues of $148 million and Modified EBITDA of $73 million.
Acquisition-related costs for the Trace Acquisition of $8 million were included in Selling, general, and administrative expenses in the Williams Consolidated Statement of Income during 2022.
Williams accounted for the Trace Acquisition as a business combination. The following table presents the allocation of the acquisition date fair value of the major classes of the assets acquired and liabilities assumed at April 29, 2022. The valuation techniques used consisted of the income approach for valuation of intangible assets and the cost approach for property, plant, and equipment.
| | | | | |
| (Millions) |
| Cash and cash equivalents | $ | 39 | |
| Trade accounts and other receivables | 18 | |
| Property, plant, and equipment – net | 448 | |
| Intangible assets – net of accumulated amortization | 472 | |
| Other noncurrent assets | 20 | |
| Total assets acquired | 997 | |
| |
| Accounts payable | (12) | |
| Other current liabilities | (5) | |
| Other noncurrent liabilities | (8) | |
| Total liabilities assumed | (25) | |
| |
| Net assets acquired | $ | 972 | |
Other intangible assets recognized in the Trace Acquisition are related to contractual customer relationships from gas gathering agreements with customers. The basis for determining the value of these intangible assets is estimated future net cash flows to be derived from acquired contractual customer relationships discounted using a risk-adjusted discount rate. These intangible assets are being amortized on a straight-line basis over an initial period of 20 years which represents the term over which the contractual customer relationships are expected to contribute to Williams’ cash flows. Approximately 2 percent of the expected future revenues from these contractual customer relationships are impacted by Williams’ ability and intent to renew or renegotiate existing customer contracts. Williams expenses costs incurred to renew or extend the terms of its gas gathering contracts with customers. Based on the estimated future revenues during the current contract periods (as estimated at the time of the acquisition), the weighted-average period prior to the next renewal or extension of the existing contractual customer relationships is approximately 19 years. See Note 11 – Goodwill and Other Intangible Assets.
Supplemental Pro Forma
The following pro forma Revenues and Net income (loss) attributable to The Williams Companies, Inc. for 2024, 2023, and 2022, are presented as if the Crowheart Acquisition, Discovery Acquisition, and Gulf Coast Storage Acquisition had been completed on January 1, 2023, the DJ Basin Acquisitions and MountainWest Acquisition had been completed on January 1, 2022, and the Trace Acquisition had been completed on January 1, 2021. These pro forma amounts are not necessarily indicative of what the actual results would have been if the acquisitions had in fact occurred on the dates or for the periods indicated, nor do they purport to project Revenues or Net income (loss) attributable to The Williams Companies, Inc. for any future periods or as of any date. These amounts do not give
effect to any potential cost savings, operating synergies, or revenue enhancements to result from the transactions or the potential costs to achieve these cost savings, operating synergies, and revenue enhancements.
| | | | | | | | | | | | | | | | | | | | | | | | | | | | | | | | | | | | | | | | | |
| |
| | | | | | | | | | | | | |
| |
| | | | | | | | | | | | | |
| | | | | | | | | | | | | |
| | | | | | | | | | | | | |
| |
| | | | | | | | | | | | | |
| |
| | | | | | | | | | | | | |
| | | | | | | | | | | | | |
| | | | | | | | | | | | | |
| Year Ended December 31, 2024 |
| As Reported | | Pro Forma Crowheart (1) | | Pro Forma Discovery (1) | | | | | | | | Pro Forma Combined |
| (Millions) |
| Revenues | $ | 10,503 | | | $ | 60 | | | $ | 58 | | | | | | | | | $ | 10,621 | |
| Net income (loss) attributable to The Williams Companies, Inc. | 2,225 | | | 8 | | | (5) | | | | | | | | | 2,228 | |
| | | | | | | | | | | | | |
| Year Ended December 31, 2023 |
| As Reported | | Pro Forma Crowheart | | Pro Forma Discovery | | Pro Forma Gulf Coast Storage | | Pro Forma DJ Basin (1) | | Pro Forma MountainWest (1) | | Pro Forma Combined |
| (Millions) |
| Revenues | $ | 10,907 | | | $ | 74 | | | $ | 129 | | | $ | 202 | | | $ | 270 | | | $ | 35 | | | $ | 11,617 | |
| Net income (loss) attributable to The Williams Companies, Inc. | 3,179 | | | 19 | | | (1) | | | 53 | | | 17 | | | 6 | | | 3,273 | |
| | | | | | | | | | | | | |
| Year Ended December 31, 2022 |
| As Reported | | | | | | Pro Forma DJ Basin | | Pro Forma MountainWest | | Pro Forma Trace (1) | | Pro Forma Combined |
| (Millions) |
| Revenues | $ | 10,965 | | | | | | | $ | 218 | | | $ | 265 | | | $ | 45 | | | $ | 11,493 | |
| Net income (loss) attributable to The Williams Companies, Inc. | 2,049 | | | | | | | 13 | | | 170 | | | 18 | | | 2,250 | |
(1)Excludes results from operations acquired in the acquisition for the period beginning on the acquisition date, as these results are included in the amounts as reported.
NorTex Asset Purchase
On August 31, 2022, Williams purchased a group of assets in north Texas, primarily natural gas storage facilities and pipelines, from NorTex Midstream Holdings, LLC (NorTex Asset Purchase) for approximately $424 million. These assets are included in Williams’ Transmission & Gulf of America segment.
Sale of Certain Gulf Coast Liquids Pipelines
On September 29, 2023, Williams completed the sale of various petrochemical and feedstock pipelines and associated contracts in the Gulf Coast region for $348 million. As a result of this sale, Williams recorded a gain of $129 million in 2023 in its Transmission & Gulf of America segment. The gain is reflected in Gain on sale of business in the Williams Consolidated Statement of Income. The results of operations for this disposal group, excluding the gain noted, were not significant for the reporting periods.
Note 4 – Related Party Transactions
Williams
Transactions with Equity-Method Investees
Williams has costs and expenses associated with its equity-method investees of $266 million, $776 million, and $1.3 billion for 2024, 2023, and 2022, respectively in its Consolidated Statement of Income. Substantially all of
these expenses are included in Product costs. Williams also has revenue from its equity-method investees of $2 million, $5 million, and $76 million for 2024, 2023, and 2022, respectively. In addition, Williams has $1 million and $2 million included in Trade accounts and other receivables and $19 million and $33 million included in Accounts payable in its Consolidated Balance Sheet with its equity-method investees at December 31, 2024 and 2023, respectively.
Williams has operating agreements with certain equity-method investees. These operating agreements typically provide for reimbursement or payment to Williams for certain direct operational payroll and employee benefit costs, materials, supplies, and other charges and also for management services. The total charges to equity-method investees for these fees are $52 million, $64 million, and $65 million for 2024, 2023, and 2022, respectively.
Board of Directors
Two members of Williams’ Board of Directors are also executive officers at certain of its counterparties. Williams recorded $59 million, $90 million, and $180 million in Product sales and $40 million, $25 million, and $86 million in Product costs in its Consolidated Statement of Income from these companies for the purchase and sale of natural gas for 2024, 2023, and 2022, respectively.
Transco and NWP Affiliate Transactions
Benefit Plans
Transco and NWP do not have employees. Certain of the costs charged to them by Williams associated with employees who directly support them are described below. Additionally, allocated corporate expenses from Williams also include amounts related to these same employee benefits, which are not included in the amounts presented immediately below.
Pension and Other Postretirement Benefit Plans
Williams’ pension and other postretirement benefit plans are single-employer plans. However, Transco and NWP follow multiemployer plan accounting whereby the amount charged to them and thus paid by them, is based on their share of net periodic benefit cost (see Note 7 – Employee Benefit Plans).
Pension costs charged to Transco by Williams were $1 million, $2 million, and $4 million for 2024, 2023, and 2022, respectively. NWP received pension credits from Williams of $1 million in 2024, $0 million in 2023, and pension charges of $1 million in 2022.
Williams makes annual cash contributions to the pension plans, based on annual actuarial estimates, which Transco recovers through rates that are set through periodic general rate filings. Effective with Transco’s Docket No. RP18-1126 rate case settlement, any amounts of annual contributions that fall below a threshold are recorded as adjustments to income and refunded through future rate adjustments. The amounts of deferred pension collections recorded as regulatory liabilities at December 31, 2024 and 2023 were $30 million and $26 million, respectively. Also effective with Transco’s Docket No. RP18-1126 rate case settlement, the pension regulatory liability as of March 1, 2019 was amortized over a five-year period, and the amortization was completed in February 2024.
Transco recognized other postretirement benefit income of $8 million, $6 million, and $5 million for 2024, 2023, and 2022, respectively, while NWP recognized other postretirement benefit income of $1 million, $0 million, and $1 million, respectively for the same periods. These credits were recorded as regulatory liabilities.
Transco and NWP have been allowed by rate case settlements to collect or refund in future rates any differences between the actuarially determined costs and amounts currently being recovered in rates related to other postretirement benefits. Any differences between the annual actuarially determined cost and amounts currently being recovered in rates are recorded as regulatory assets or liabilities and collected or refunded through future rate
adjustments. The amounts of other postretirement benefits costs deferred as regulatory liabilities at December 31, 2024 and 2023 are $31 million and $31 million, for Transco respectively, and $43 million and $42 million, for NWP respectively. Effective with the Docket No. RP18-1126 rate case settlement, Transco’s other postretirement benefits regulatory liability as of March 1, 2019 was amortized over a period of approximately five years, and the amortization was completed in July 2024.
Defined Contribution Plan
Williams maintains a defined contribution plan for substantially all of its employees. Williams charged Transco compensation expense of $13 million, $12 million, and $11 million in 2024, 2023, and 2022, respectively, and charged NWP compensation expense of $3 million, $3 million, and $3 million in 2024, 2023, and 2022, respectively, for Williams’ company contributions to this plan.
Employee Stock-Based Compensation Plan Information (see Note 15 – Equity-Based Compensation)
Williams currently bills Transco and NWP directly for compensation expense related to stock-based compensation awards based on the fair value of the awards. Transco and NWP are also billed for their proportionate share of Williams’ and other affiliates’ stock-based compensation expense through various allocation processes.
Total stock-based compensation expense for the years ended December 31, 2024, 2023, and 2022 was $6 million, $6 million, and $6 million, for Transco respectively, and $2 million, $2 million, and $1 million, for NWP respectively.
Cash Management Program
Transco and NWP are participants in Williams’ cash management program, and thus make advances to and receive advances from Williams. At December 31, 2024 and 2023, Transco’s advances to Williams totaled approximately $638 million and $1.4 billion, respectively. These advances are represented by demand notes and are classified as Trade accounts and other receivables - Advances to affiliate in the Balance Sheet. NWP’s advances from Williams totaled approximately $26 million at December 31, 2024. These advances from Williams are classified as Payables - Advances from affiliate. Advances to Williams from NWP totaled approximately $158 million at December 31, 2023. These advances are represented by demand notes and are classified as Trade accounts and other receivables - Advances to affiliate in the Balance Sheet. Advances are stated at the historical carrying amounts. Interest expense and income are recognized when earned and the collectability is reasonably assured. The interest rate on these intercompany demand notes is based upon the daily overnight investment rate paid on Williams’ excess cash at the end of each month, which was approximately 4 percent at December 31, 2024. The net interest income from these advances was $51 million, $81 million, and $31 million during years ended December 31, 2024, 2023, and 2022, for Transco respectively, and $5 million, $8 million, and $5 million for the years ended December 31, 2024, 2023, and 2022 for NWP respectively. Such interest income is included in Interest income in the Statement of Net Income for Transco and Other income (expense) – net in the Statement of Net Income for NWP.
Other Affiliate Transactions
Included in Transco’s Total revenues in the Statement of Net Income for 2024, 2023, and 2022 are revenues received from affiliates of $76 million, $56 million, and $89 million, respectively.
Included in Transco’s Natural gas product costs in the Statement of Net Income for 2024, 2023, and 2022 are costs of gas purchased from affiliates of $5 million, $7 million, and $18 million, respectively. All gas purchases are made at market or contract prices.
Services necessary to operate Transco and NWP are provided by Williams and certain affiliates of Williams. Transco and NWP reimburse Williams and its affiliates for all direct and indirect expenses incurred or payments made (including salary, bonus, incentive compensation, and benefits) in connection with these services. Employees of Williams also provide general, administrative, and management services, and Transco and NWP are charged for certain administrative expenses incurred by Williams. These charges are either directly assigned or allocated. Allocated charges are specific or general. Specific allocations are based on a relationship with the delivery of services and general allocations are based on a three-factor formula, which considers revenues; property, plant, and equipment; and payroll. In management’s estimation, the allocation methodologies used are reasonable and result in a reasonable allocation of costs of doing business incurred by Williams. For the years ended December 31, 2024, 2023, and 2022, Transco has recorded $344 million, $324 million, and $345 million, respectively, and NWP has recorded $91 million, $86 million, and $88 million, respectively, for these service expenses, which are primarily included in Operating and maintenance expenses and Selling, general, and administrative expenses in the Statement of Net Income.
Transco provides services to certain of its affiliates. Transco recorded reductions in operating expenses for services provided to and reimbursed by affiliates of $6 million, $14 million, and $10 million for the years ended December 31, 2024, 2023, and 2022, respectively.
During January 2025, Transco and NWP declared and paid cash distributions of $246 million and $24 million, respectively, to Williams, and Williams made a cash contribution to NWP of $85 million.
Note 5 – Revenue Recognition
Revenue by Category
The following table presents Williams’ revenue disaggregated by major service line:
| | | | | | | | | | | | | | | | | | | | | | | | | | | | | | | | | | | | | | | | | |
| Transmission & Gulf of America | | Northeast G&P | | West | | Gas & NGL Marketing Services | | Other | | Eliminations | | Total |
| (Millions) |
| | |
| | | | | | | | | | | | | |
| | | | | | | | | | | | | |
| | | | | | | | | | | | | |
| | | | | | | | | | | | | |
| | | | | | | | | | | | | |
| | | | | | | | | | | | | |
| | | | | | | | | | | | | |
| | | | | | | | | | | | | |
| | | | | | | | | | | | | |
| | | | | | | | | | | | | |
| | | | | | | | | | | | | |
| | | | | | | | | | | | | |
| | | | | | | | | | | | | |
| | | | | | | | | | | | | |
| 2024 | | |
| Revenues from contracts with customers: | | | | | | | | | | | | | |
| Service revenues: | | | | | | | | | | | | | |
| Regulated interstate natural gas transportation and storage | $ | 3,500 | | | $ | — | | | $ | — | | | $ | — | | | $ | — | | | $ | (81) | | | $ | 3,419 | |
| Gathering, processing, transportation, fractionation, and storage: | | | | | | | | | | | | | |
| Monetary consideration | 661 | | | 1,778 | | | 1,693 | | | — | | | — | | | (162) | | | 3,970 | |
| Commodity consideration | 54 | | | 2 | | | 78 | | | — | | | — | | | — | | | 134 | |
| Other | 46 | | | 92 | | | 21 | | | — | | | — | | | (19) | | | 140 | |
| Total service revenues | 4,261 | | | 1,872 | | | 1,792 | | | — | | | — | | | (262) | | | 7,663 | |
| Product sales | 328 | | | 110 | | | 869 | | | 4,530 | | | 420 | | | (1,288) | | | 4,969 | |
| Total revenues from contracts with customers | 4,589 | | | 1,982 | | | 2,661 | | | 4,530 | | | 420 | | | (1,550) | | | 12,632 | |
| Other revenues (1) | 39 | | | 43 | | | 8 | | | 2,236 | | | 24 | | | (2) | | | 2,348 | |
| Other adjustments (2) | — | | | — | | | — | | | (4,977) | | | — | | | 500 | | | (4,477) | |
| Total revenues | $ | 4,628 | | | $ | 2,025 | | | $ | 2,669 | | | $ | 1,789 | | | $ | 444 | | | $ | (1,052) | | | $ | 10,503 | |
| | | | | | | | | | | | | |
| 2023 | | |
| Revenues from contracts with customers: | | | | | | | | | | | | | |
| Service revenues: | | | | | | | | | | | | | |
| Regulated interstate natural gas transportation and storage | $ | 3,334 | | | $ | — | | | $ | — | | | $ | — | | | $ | — | | | $ | (60) | | | $ | 3,274 | |
| Gathering, processing, transportation, fractionation, and storage: | | | | | | | | | | | | | |
| Monetary consideration | 443 | | | 1,782 | | | 1,478 | | | — | | | — | | | (170) | | | 3,533 | |
| Commodity consideration | 38 | | | 5 | | | 103 | | | — | | | — | | | — | | | 146 | |
| Other | 30 | | | 87 | | | 12 | | | 1 | | | — | | | (15) | | | 115 | |
| Total service revenues | 3,845 | | | 1,874 | | | 1,593 | | | 1 | | | — | | | (245) | | | 7,068 | |
| Product sales | 252 | | | 132 | | | 441 | | | 4,615 | | | 442 | | | (954) | | | 4,928 | |
| Total revenues from contracts with customers | 4,097 | | | 2,006 | | | 2,034 | | | 4,616 | | | 442 | | | (1,199) | | | 11,996 | |
| Other revenues (1) | 53 | | | 27 | | | 101 | | | 4,294 | | | 64 | | | (2) | | | 4,537 | |
| Other adjustments (2) | — | | | — | | | — | | | (6,032) | | | — | | | 406 | | | (5,626) | |
| Total revenues | $ | 4,150 | | | $ | 2,033 | | | $ | 2,135 | | | $ | 2,878 | | | $ | 506 | | | $ | (795) | | | $ | 10,907 | |
| | | | | | | | | | | | | |
| | | | | | | | | | | | | | | | | | | | | | | | | | | | | | | | | | | | | | | | | |
| Transmission & Gulf of America | | Northeast G&P | | West | | Gas & NGL Marketing Services | | Other | | Eliminations | | Total |
| (Millions) |
| 2022 | | |
| Revenues from contracts with customers: | | | | | | | | | | | | | |
| Service revenues: | | | | | | | | | | | | | |
| Regulated interstate natural gas transportation and storage | $ | 3,139 | | | $ | — | | | $ | — | | | $ | — | | | $ | — | | | $ | (72) | | | $ | 3,067 | |
| Gathering, processing, transportation, fractionation, and storage: | | | | | | | | | | | | | |
| Monetary consideration | 381 | | | 1,526 | | | 1,518 | | | — | | | — | | | (167) | | | 3,258 | |
| Commodity consideration | 64 | | | 14 | | | 182 | | | — | | | — | | | — | | | 260 | |
| Other | 21 | | | 102 | | | 12 | | | 3 | | | — | | | (16) | | | 122 | |
| Total service revenues | 3,605 | | | 1,642 | | | 1,712 | | | 3 | | | — | | | (255) | | | 6,707 | |
| Product sales | 404 | | | 134 | | | 841 | | | 10,768 | | | 706 | | | (1,787) | | | 11,066 | |
| Total revenues from contracts with customers | 4,009 | | | 1,776 | | | 2,553 | | | 10,771 | | | 706 | | | (2,042) | | | 17,773 | |
| Other revenues (1) | 38 | | | 26 | | | 8 | | | 7,929 | | | (55) | | | (11) | | | 7,935 | |
| Other adjustments (2) | — | | | — | | | — | | | (15,467) | | | — | | | 724 | | | (14,743) | |
| Total revenues | $ | 4,047 | | | $ | 1,802 | | | $ | 2,561 | | | $ | 3,233 | | | $ | 651 | | | $ | (1,329) | | | $ | 10,965 | |
| | | | | | | | | | | | | |
______________________________
(1)Revenues not derived from contracts with customers primarily consist of physical product sales related to commodity derivative contracts, realized and unrealized gains and losses associated with Williams’ commodity derivative contracts, which are reported in Net gain (loss) from commodity derivatives in the Consolidated Statement of Income, management fees received for certain services provided to operated equity-method investments, and leasing revenues associated with the Williams headquarters building.
(2)Other adjustments reflect certain costs of Gas & NGL Marketing Services’ risk management activities. As Williams is acting as agent for natural gas marketing customers or engages in energy trading activities, the resulting revenues are presented net of the related costs of those activities in the Consolidated Statement of Income.
For Transco and NWP, revenue disaggregation by major service line includes Natural gas transportation, Natural gas storage, Natural gas product sales, and Other, which are separately presented on their Statements of Net Income.
Contract Assets
The following tables present a reconciliation of contract assets:
Williams
| | | | | | | | | | | | | | | |
| | | Year Ended December 31, |
| | | | | 2024 | | 2023 |
| | | | | (Millions) |
| Balance at beginning of year | | | | | $ | 36 | | | $ | 29 | |
| Revenue recognized in excess of amounts invoiced | | | | | 170 | | | 183 | |
| Minimum volume commitments invoiced | | | | | (144) | | | (176) | |
| Contract assets acquired | | | | | 36 | | | — | |
| Balance at end of year | | | | | $ | 98 | | | $ | 36 | |
Transco
| | | | | | | | | | | | | | | |
| | | Year Ended December 31, |
| | | | | 2024 | | 2023 |
| | | | | (Millions) |
| Balance at beginning of year | | | | | $ | — | | | $ | — | |
| Revenue recognized in excess of amounts invoiced | | | | | 10 | | | — | |
| | | | | | | |
| | | | | | | |
| Balance at end of year | | | | | $ | 10 | | | $ | — | |
NWP
| | | | | | | | | | | | | | | |
| | | Year Ended December 31, |
| | | | | 2024 | | 2023 |
| | (Millions) |
| Balance at beginning of year | | | | | $ | 17 | | | $ | 13 | |
| Revenue recognized in excess of amounts invoiced | | | | | 6 | | | 6 | |
| Amortization of contract assets | | | | | (2) | | | (2) | |
| | | | | | | |
| Balance at end of year | | | | | $ | 21 | | | $ | 17 | |
Contract Liabilities
The following tables present a reconciliation of contract liabilities:
Williams
| | | | | | | | | | | | | | | |
| | | Year Ended December 31, |
| | | | | 2024 | | 2023 |
| | | | | (Millions) |
| Balance at beginning of year | | | | | $ | 1,081 | | | $ | 1,043 | |
| Payments received and deferred | | | | | 183 | | | 190 | |
| Significant financing component | | | | | 8 | | | 9 | |
| Contract liability acquired (disposed) – net | | | | | 53 | | | 115 | |
| Recognized in revenue | | | | | (279) | | | (276) | |
| Balance at end of year | | | | | $ | 1,046 | | | $ | 1,081 | |
Transco
| | | | | | | | | | | | | | | |
| | | Year Ended December 31, |
| | | | | 2024 | | 2023 |
| | | | | (Millions) |
| Balance at beginning of year | | | | | $ | 184 | | | $ | 194 | |
| | | | | | | |
| | | | | | | |
| Recognized in revenue | | | | | (11) | | | (10) | |
| Balance at end of year | | | | | $ | 173 | | | $ | 184 | |
NWP
| | | | | | | | | | | | | | | |
| | | Year Ended December 31, |
| | | | | 2024 | | 2023 |
| | | | | (Millions) |
| Balance at beginning of year | | | | | $ | 2 | | | $ | 3 | |
| | | | | | | |
| | | | | | | |
| Recognized in revenue | | | | | (2) | | | (1) | |
| Balance at end of year | | | | | $ | — | | | $ | 2 | |
Remaining Performance Obligations
Remaining performance obligations primarily include reservation charges on contracted capacity for Williams’ gas pipeline firm transportation contracts with customers, storage capacity contracts, long-term contracts containing MVC associated with midstream businesses, and fixed payments associated with offshore production handling. For Williams’ interstate natural gas pipeline businesses, including Transco and NWP, remaining performance obligations reflect the rates for such services in its current effective FERC tariffs for the life of the related contracts; however, these rates may change based on future tariffs approved by the FERC and the amount and timing of these changes are not currently known.
Remaining performance obligations exclude variable consideration, including contracts with variable consideration for which it has elected the practical expedient for consideration recognized in revenue as billed. Certain of its contracts contain evergreen and other renewal provisions for periods beyond the initial term of the contract. The remaining performance obligation amounts as of December 31, 2024, do not consider potential future performance obligations for which the renewal has not been exercised and exclude contracts with customers for which the underlying facilities have not received FERC authorization to be placed into service. Consideration received prior to December 31, 2024, that will be recognized in future periods is also excluded from its remaining performance obligations and is instead reflected in contract liabilities.
The following tables present the amount of the contract liabilities balance expected to be recognized as revenue when performance obligations are satisfied and the transaction price allocated to the remaining performance obligations under certain contracts as of December 31, 2024.
Williams | | | | | | | | | | | |
| Contract Liabilities | | Remaining Performance Obligations |
| (Millions) |
| 2025 (one year) | $ | 173 | | | $ | 4,132 | |
| 2026 (one year) | 146 | | | 3,860 | |
| 2027 (one year) | 141 | | | 3,623 | |
| 2028 (one year) | 118 | | | 2,778 | |
| 2029 (one year) | 100 | | | 2,564 | |
| Thereafter | 368 | | | 14,102 | |
| Total | $ | 1,046 | | | $ | 31,059 | |
Transco
| | | | | | | | | | | |
| Contract Liabilities | | Remaining Performance Obligations |
| (Millions) |
| 2025 (one year) | $ | 10 | | | $ | 2,726 | |
| 2026 (one year) | 10 | | | 2,536 | |
| 2027 (one year) | 11 | | | 2,438 | |
| 2028 (one year) | 11 | | | 1,784 | |
| 2029 (one year) | 11 | | | 1,693 | |
| Thereafter | 120 | | | 10,421 | |
| Total | $ | 173 | | | $ | 21,598 | |
NWP
| | | | | | | | | | | |
| Contract Liabilities | | Remaining Performance Obligations |
| (Millions) |
| 2025 (one year) | $ | — | | | $ | 391 | |
| 2026 (one year) | — | | | 386 | |
| 2027 (one year) | — | | | 373 | |
| 2028 (one year) | — | | | 368 | |
| 2029 (one year) | — | | | 349 | |
| Thereafter | — | | | 2,234 | |
| Total | $ | — | | | $ | 4,101 | |
Note 6 – Provision (Benefit) for Income Taxes
The Provision (benefit) for income taxes from continuing operations includes:
| | | | | | | | | | | | | | | | | | | | | |
| | | Year Ended December 31, |
| | | | | 2024 | | 2023 | | 2022 |
| | | | | (Millions) |
| Current: | | | | | | | | | |
| Federal | | | | | $ | 125 | | | $ | 3 | | | $ | (25) | |
| State | | | | | 9 | | | 21 | | | 19 | |
| | | | | | | | | |
| | | | | 134 | | | 24 | | | (6) | |
| Deferred: | | | | | | | | | |
| Federal | | | | | 472 | | | 872 | | | 424 | |
| State | | | | | 34 | | | 109 | | | 7 | |
| | | | | | | | | |
| | | | | 506 | | | 981 | | | 431 | |
| Provision (benefit) for income taxes | | | | | $ | 640 | | | $ | 1,005 | | | $ | 425 | |
Reconciliations from the Provision (benefit) at statutory rate from continuing operations to recorded Provision (benefit) for income taxes are as follows:
| | | | | | | | | | | | | | | | | |
| | Year Ended December 31, |
| | 2024 | | 2023 | | 2022 |
| | (Millions) |
| Provision (benefit) at statutory rate | $ | 627 | | | $ | 925 | | | $ | 534 | |
| Increases (decreases) in taxes resulting from: | | | | | |
| State income taxes (net of federal benefit) | 79 | | | 129 | | | 113 | |
| State deferred income tax rate change | (44) | | | (25) | | | (92) | |
| Federal valuation allowance | — | | | — | | | (70) | |
| Federal settlements | — | | | — | | | (45) | |
| Impact of nontaxable noncontrolling interests | (25) | | | (26) | | | (14) | |
| Other – net | 3 | | | 2 | | | (1) | |
| Provision (benefit) for income taxes | $ | 640 | | | $ | 1,005 | | | $ | 425 | |
The State deferred income tax rate change benefit of $44 million, $25 million and $92 million in 2024, 2023 and 2022, respectively, is related to a decrease in Williams’ estimate of the deferred state income tax rate (net of federal effect). The 2024 benefit is driven primarily by a decrease in the Louisiana state income tax rate and the enacted decline in the Pennsylvania state income tax rate over the next several years.
During the course of audits of its business by domestic and foreign tax authorities, Williams frequently faces challenges regarding the amount of taxes due. These challenges include questions regarding the timing and amount of deductions and the allocation of income among various tax jurisdictions. In evaluating the liability associated with its various filing positions, Williams applies the two-step process of recognition and measurement. In association with this liability, Williams records an estimate of related interest and tax exposure as a component of its tax provision. The impact of this accrual is included within Other – net in its reconciliation of the Provision (benefit) at statutory rate to recorded Provision (benefit) for income taxes.
Significant components of Deferred income tax liabilities are as follows:
| | | | | | | | | | | |
| | December 31, |
| | 2024 | | 2023 |
| (Millions) |
| Gross deferred income tax liabilities: | | | |
| Property, plant and equipment | $ | 4,501 | | | $ | 3,541 | |
| Investments | 1,733 | | | 1,740 | |
| Other | 193 | | | 146 | |
| Total gross deferred income tax liabilities | 6,427 | | | 5,427 | |
| Gross deferred income tax assets: | | | |
| Accrued liabilities | 1,146 | | | 868 | |
| Corporate alternative minimum tax credits | 108 | | | — | |
| Foreign tax credits | — | | | 35 | |
| Federal loss carryovers | 325 | | | 398 | |
| Disallowed business interest expense carryforward | 247 | | | 67 | |
| State losses and credits | 224 | | | 293 | |
| Other | 92 | | | 103 | |
| Total gross deferred income tax assets | 2,142 | | | 1,764 | |
| Less valuation allowance | 91 | | | 183 | |
| Net deferred income tax assets | 2,051 | | | 1,581 | |
| Deferred income tax liabilities | $ | 4,376 | | | $ | 3,846 | |
The valuation allowance at December 31, 2024 and 2023 serves to reduce the available deferred income tax assets to an amount that will, more likely than not, be realized. Williams considered all available positive and negative evidence, which incorporates available tax planning strategies, and management’s estimate of future reversals of existing taxable temporary differences and has determined that a portion of its deferred income tax assets related to State losses and credits may not be realized. The change from prior year for the Foreign tax credits reflects a decrease of $35 million due to its expiration in 2024. The amounts presented in the table above are, with respect to state items, before any federal benefit. The change from prior year for the State losses and credits reflects increases in losses and credits generated in the current and prior years less losses and/or credits utilized in the current year. Williams has loss and credit carryovers in multiple state taxing jurisdictions. These attributes generally expire between 2025 and 2043 with some carryovers having indefinite carryforward periods.
Federal loss carryovers at December 31, 2024 reflect deferred tax assets on net operating loss carryovers with no expiration date.
Disallowed business interest expense carryforward reflects Williams’ federal interest expense carryforward which has no expiration date.
Cash payments for income taxes (net of refunds) were $68 million, $31 million and $13 million in 2024, 2023 and 2022 respectively.
During the second quarter of 2022, Williams finalized settlements for 2011 through 2014 on certain contested matters with the Internal Revenue Service (IRS) that resulted in a 2022 year-to-date tax benefit of approximately $45 million and Williams received cash refunds totaling $7 million. During the fourth quarter of 2023, Williams closed the audit for 2018 and made a $5 million payment.
Williams recognizes related interest and penalties as a component of Provision (benefit) for income taxes. There were no significant interest and penalties recognized for any period presented. There were no interest or penalties relating to uncertain tax positions accrued as of December 31, 2024 and December 31, 2023.
Consolidated U.S. Federal income tax returns are open to IRS examination for tax years after 2020. The statute of limitations for most states expires one year after expiration of the IRS statute.
Note 7 – Employee Benefit Plans
Pension Plans
Williams has noncontributory defined benefit pension plans for eligible employees hired prior to January 1, 2019. Eligible employees earn compensation credits based on a cash balance formula. As of January 1, 2020, certain active employees are no longer eligible to receive compensation credits.
Other Postretirement Benefits
Williams provides subsidized retiree medical benefits to a closed group of participants as well as retiree life insurance benefits to eligible participants. Medical benefits for Medicare eligible participants are paid through contributions to health reimbursement accounts. Benefits for all other participants are provided through a self-insured medical plan, which includes participant contributions and contains other cost-sharing features such as deductibles, co-payments, and co-insurance.
Defined Contribution Plan
Williams has a defined contribution plan for the benefit of substantially all employees. Plan participants may contribute a portion of their compensation on a pre-tax or after-tax basis. Generally, Williams matches employee contributions up to 6 percent of eligible compensation. Additionally, eligible active employees that do not receive compensation credits under the defined benefit pension plan are eligible for an additional annual fixed-percentage contribution made by Williams to the defined contribution plan. Williams’ contributions charged to expense were $69 million in 2024, $60 million in 2023, and $53 million in 2022.
Funded Status
The following table presents the changes in benefit obligations and plan assets for pension benefits and other postretirement benefits for the years indicated:
| | | | | | | | | | | | | | | | | | | | | | | |
| | Pension Benefits | | Other
Postretirement Benefits |
| | 2024 | | 2023 | | 2024 | | 2023 |
| | (Millions) |
| Change in benefit obligation: | | | | | | | |
| Benefit obligation at beginning of year | $ | 1,006 | | | $ | 940 | | | $ | 145 | | | $ | 152 | |
| Service cost | 25 | | | 23 | | | 1 | | | 1 | |
| Interest cost | 47 | | | 46 | | | 7 | | | 7 | |
| Plan participants’ contributions | — | | | — | | | 2 | | | 2 | |
| Benefits paid | (73) | | | (71) | | | (11) | | | (13) | |
| Net actuarial loss (gain) (1) | (65) | | | 68 | | | (12) | | | (4) | |
| Settlements | (3) | | | — | | | — | | | — | |
| Net increase (decrease) in benefit obligation | (69) | | | 66 | | | (13) | | | (7) | |
| Benefit obligation at end of year | 937 | | | 1,006 | | | 132 | | | 145 | |
| Change in plan assets: | | | | | | | |
| Fair value of plan assets at beginning of year | 1,167 | | | 1,117 | | | 262 | | | 253 | |
| Actual return on plan assets | 88 | | | 120 | | | 16 | | | 17 | |
| Employer contributions | 4 | | | 1 | | | 3 | | | 3 | |
| Plan participants’ contributions | — | | | — | | | 2 | | | 2 | |
| Benefits paid | (73) | | | (71) | | | (11) | | | (13) | |
| Settlements | (3) | | | — | | | — | | | — | |
| Net increase (decrease) in fair value of plan assets | 16 | | | 50 | | | 10 | | | 9 | |
| Fair value of plan assets at end of year | 1,183 | | | 1,167 | | | 272 | | | 262 | |
| Funded status — overfunded (underfunded) | $ | 246 | | | $ | 161 | | | $ | 140 | | | $ | 117 | |
| Amounts recognized in the Consolidated Balance Sheet: | | | | | | | |
| Noncurrent assets | $ | 270 | | | $ | 187 | | | $ | 143 | | | $ | 120 | |
| Current liabilities | (4) | | | (4) | | | (3) | | | (3) | |
| Noncurrent liabilities | (20) | | | (22) | | | — | | | — | |
| Funded status — overfunded (underfunded) | $ | 246 | | | $ | 161 | | | $ | 140 | | | $ | 117 | |
| | | | | | | |
| Accumulated benefit obligation | $ | 929 | | | $ | 998 | | | | | |
____________
(1) 2024 amounts are due primarily to changes in the following factors: Pension Benefits - discount rate assumptions and interest crediting rate assumption; Other Postretirement Benefits - discount rate assumption. 2023 amounts are due primarily to changes in the following factors: Pension Benefits - interest crediting rate assumption and discount rate assumptions.
The following table summarizes information for pension plans with obligations in excess of plan assets at December 31.
| | | | | | | | | | | |
| | 2024 | | 2023 |
| | (Millions) |
| Projected benefit obligation | $ | 23 | | | $ | 26 | |
| Accumulated benefit obligation | 22 | | | 24 | |
| Fair value of plan assets | — | | | — | |
Pre-tax amounts recognized in Accumulated other comprehensive income (loss) at December 31 are as follows:
| | | | | | | | | | | | | | | | | | | | | | | |
| | Pension Benefits | | Other
Postretirement Benefits |
| | 2024 | | 2023 | | 2024 | | 2023 |
| | (Millions) |
| Net actuarial gain (loss) | $ | 49 | | | $ | (45) | | | $ | 20 | | | $ | 19 | |
Additionally, as of December 31, 2024 and 2023, Williams has $139 million and $123 million, respectively, of pension and other postretirement plan amounts included in regulatory liabilities associated with its gas pipeline companies.
Net Periodic Benefit Cost (Credit)
Net periodic benefit cost (credit) for the years ended December 31 consist of the following:
| | | | | | | | | | | | | | | | | | | | | | | | | | | | | | | | | | | |
| | Pension Benefits | | Other
Postretirement Benefits |
| | 2024 | | 2023 | | 2022 | | 2024 | | 2023 | | 2022 |
| | (Millions) |
| Components of net periodic benefit cost (credit): | | | | | | | | | | | |
| Service cost | $ | 25 | | | $ | 23 | | | $ | 28 | | | $ | 1 | | | $ | 1 | | | $ | 1 | |
| Interest cost | 47 | | | 46 | | | 31 | | | 7 | | | 7 | | | 6 | |
| Expected return on plan assets | (60) | | | (57) | | | (44) | | | (11) | | | (10) | | | (10) | |
| Amortization of net actuarial loss (gain) | — | | | 5 | | | 12 | | | (5) | | | (3) | | | — | |
| Net actuarial loss from settlements | 1 | | | — | | | 3 | | | — | | | — | | | — | |
| Reclassification to regulatory liability | — | | | — | | | — | | | — | | | — | | | 1 | |
| Net periodic benefit cost (credit) (1) | $ | 13 | | | $ | 17 | | | $ | 30 | | | $ | (8) | | | $ | (5) | | | $ | (2) | |
____________
(1) Components other than Service cost are included in Other income (expense) – net below Operating income (loss) in Williams’ Consolidated Statement of Income.
Items Recognized in Other Comprehensive Income (Loss)
Other changes in plan assets and benefit obligations recognized in Other comprehensive income (loss) before taxes for the years ended December 31 consist of the following:
| | | | | | | | | | | | | | | | | | | | | | | | | | | | | | | | | | | |
| | Pension Benefits | | Other
Postretirement Benefits |
| | 2024 | | 2023 | | 2022 | | 2024 | | 2023 | | 2022 |
| | (Millions) |
| Net actuarial gain (loss) arising during the year | $ | 93 | | | $ | (5) | | | $ | (14) | | | $ | 3 | | | $ | 3 | | | $ | 14 | |
| Amortization of net actuarial loss (gain) | — | | | 5 | | | 12 | | | (2) | | | (2) | | | — | |
| Net actuarial loss from settlements | 1 | | | — | | | 3 | | | — | | | — | | | — | |
Total recognized in Other comprehensive income (loss) | $ | 94 | | | $ | — | | | $ | 1 | | | $ | 1 | | | $ | 1 | | | $ | 14 | |
Key Assumptions
The weighted-average assumptions utilized to determine benefit obligations and Net periodic benefit cost (credit) as of December 31 are as follows:
| | | | | | | | | | | | | | | | | | | | | | | | | | | | | | | | | | | |
| | Pension Benefits | | Other
Postretirement Benefits |
| | 2024 | | 2023 | | 2022 | | 2024 | | 2023 | | 2022 |
| Benefit obligations: | | | | | | | | | | | |
| Discount rate | 5.60 | % | | 4.98 | % | | 5.16 | % | | 5.67 | % | | 5.01 | % | | 5.20 | % |
| Rate of compensation increase | 3.48 | | | 3.52 | | | 3.58 | | | N/A | | N/A | | N/A |
| Cash balance interest crediting rate | 4.00 | | | 4.50 | | | 3.50 | | | N/A | | N/A | | N/A |
| Net periodic benefit cost (credit): | | | | | | | | | | | |
| Discount rate | 4.98 | % | | 5.16 | % | | 2.84 | % | | 5.01 | % | | 5.20 | % | | 2.93 | % |
| Expected long-term rate of return on plan assets | 5.31 | | | 5.17 | | | 3.81 | | | 4.16 | | | 4.04 | | | 3.67 | |
| Rate of compensation increase | 3.52 | | | 3.58 | | | 3.67 | | | N/A | | N/A | | N/A |
| Cash balance interest crediting rate | 4.50 | | | 3.50 | | | 3.00 | | | N/A | | N/A | | N/A |
Williams uses mortality tables issued by the Society of Actuaries to measure the benefit obligations.
The assumed health care cost trend rate for 2025 is 9.2 percent. This rate decreases to 4.5 percent by 2034.
Plan Assets
The plans’ investment objectives include a framework to manage the volatility of the plans’ funded status and minimize future cash contributions. The plans follow a policy of diversifying the investments across various asset classes, strategies, and investment managers. In order to mitigate risks associated with investing, the investment policy for the pension plans defines target asset allocation percentages and outlines types of investments that are authorized and not authorized under the policy. The December 31, 2024, target asset allocation was 25 percent equity securities and 75 percent fixed income securities, including investments in equity and fixed income commingled investment funds and separate accounts.
The fair values of Williams’ pension and other postretirement benefits plan assets by asset class at December 31 are as follows:
| | | | | | | | | | | | | | | | | | | | | | | | | | | | | | | | | | | |
| | 2024 |
| Pension Benefits | | Other Postretirement Benefits |
| Level 1 (1) | | Level 2 (2) | | Total | | Level 1 (1) | | Level 2 (2) | | Total |
| | (Millions) |
| Cash management funds | $ | 29 | | | $ | — | | | $ | 29 | | | $ | 103 | | | $ | — | | | $ | 103 | |
| Government debt securities | 74 | | | 19 | | | 93 | | | 11 | | | 3 | | | 14 | |
| Corporate debt securities | — | | | 295 | | | 295 | | | — | | | 43 | | | 43 | |
| Other | 1 | | | 4 | | | 5 | | | — | | | — | | | — | |
| $ | 104 | | | $ | 318 | | | 422 | | | $ | 114 | | | $ | 46 | | | 160 | |
| Commingled investment funds (3): | | | | | | | | | | | |
| Equities | | | | | 292 | | | | | | | 43 | |
| Fixed income | | | | | 469 | | | | | | | 69 | |
| Total assets at fair value | | | | | $ | 1,183 | | | | | | | $ | 272 | |
| | | | | | | | | | | | | | | | | | | | | | | | | | | | | | | | | | | |
| | 2023 |
| Pension Benefits | | Other Postretirement Benefits |
| | Level 1 (1) | | Level 2 (2) | | Total | | Level 1 (1) | | Level 2 (2) | | Total |
| | (Millions) |
| Cash management funds | $ | 17 | | | $ | — | | | $ | 17 | | | $ | 99 | | | $ | — | | | $ | 99 | |
| Government debt securities | 61 | | | 17 | | | 78 | | | 9 | | | 2 | | | 11 | |
| Corporate debt securities | — | | | 311 | | | 311 | | | — | | | 44 | | | 44 | |
| Other | 2 | | | 5 | | | 7 | | | 1 | | | — | | | 1 | |
| $ | 80 | | | $ | 333 | | | 413 | | | $ | 109 | | | $ | 46 | | | 155 | |
| Commingled investment funds (3): | | | | | | | | | | | |
| Equities | | | | | 287 | | | | | | | 41 | |
| Fixed income | | | | | 467 | | | | | | | 66 | |
| Total assets at fair value | | | | | $ | 1,167 | | | | | | | $ | 262 | |
____________
(1) Level 1 includes assets with fair values based on quoted prices in active markets for identical assets. Cash management funds and U.S. Treasury securities are included in this level.
(2) Level 2 includes assets with fair values determined by using significant other observable inputs. This level includes fixed income securities, other than U.S. Treasury securities, that are valued primarily using pricing models which incorporate observable inputs such as benchmark yields, reported trades, broker/dealer quotes, and issuer spreads.
(3) The commingled investment funds are measured at fair value using net asset value per share. Certain standard withdrawal restrictions generally apply, which may include redemption notification periods ranging from 1 day to 15 days.
Plan Benefit Payments and Employer Contributions
Following are the expected benefit payments, which reflect the same assumptions previously discussed and future service as appropriate.
| | | | | | | | | | | |
| Pension
Benefits | | Other
Postretirement
Benefits |
| | (Millions) |
| 2025 | $ | 101 | | | $ | 11 | |
| 2026 | 95 | | | 11 | |
| 2027 | 91 | | | 11 | |
| 2028 | 87 | | | 11 | |
| 2029 | 83 | | | 10 | |
| 2030-2034 | 389 | | | 48 | |
In 2025, Williams expects to contribute approximately $1 million to the pension plans and approximately $3 million to the other postretirement benefit plan.
Note 8 – Investing Activities
Equity-Method Investments
| | | | | | | | | | | | | | | | | |
| | Ownership Interest at December 31, 2024 | | December 31, |
| | | 2024 | | 2023 |
| | | | (Millions) |
| Appalachia Midstream Investments | (1) | | $ | 2,810 | | | $ | 2,886 | |
| OPPL | 50% | | 385 | | | 387 | |
| Blue Racer | 50% | | 366 | | | 398 | |
| Gulfstream | 50% | | 196 | | | 210 | |
| Laurel Mountain | 69% | | 171 | | | 184 | |
| Discovery (2) | 100% | | — | | | 361 | |
| Other | Various | | 179 | | | 188 | |
| | | $ | 4,107 | | | $ | 4,614 | |
___________
(1)Includes equity-method investments in multiple gathering systems in the Marcellus Shale region with an approximate average 66 percent interest.
(2)Discovery is a wholly owned subsidiary of Williams as of August 1, 2024. See Note 3 – Acquisitions and Divestitures.
Basis differential
The carrying value of Appalachia Midstream Investments exceeds Williams’ portion of the underlying net assets by approximately $1 billion and $1.1 billion at December 31, 2024 and 2023, respectively. These differences were assigned at the acquisition date to property, plant, and equipment and customer relationship intangible assets.
Certain other equity-method investments have a carrying value less than Williams’ portion of the underlying equity in the net assets primarily due to other than temporary impairments that Williams recognized but were not required to be recognized in the investees’ financial statements. These differences total approximately $634 million and $773 million at December 31, 2024 and 2023, respectively, and were assigned to property, plant, and equipment and customer relationship intangible assets. Differences in the carrying value of Williams’ equity-method investments and its portion of the equity in the underlying net assets are generally amortized over the remaining
useful lives of the associated underlying assets and included in Equity earnings (losses) within Williams’ Consolidated Statement of Income.
Purchases of and contributions to equity-method investments
Williams generally funds its portion of significant expansion or development projects of these investees through additional capital contributions. These transactions increased the carrying value of Williams’ investments and included: | | | | | | | | | | | | | | | | | |
| Year Ended December 31, |
| | 2024 | | 2023 | | 2022 |
| | (Millions) |
| Appalachia Midstream Investments | $ | 74 | | | $ | 59 | | | $ | 83 | |
| Discovery | 37 | | | 40 | | | 41 | |
| OPPL | 2 | | | 1 | | | — | |
| Aux Sable Liquid Products LP | 1 | | | 38 | | | — | |
| Cardinal Pipeline Company, LLC | — | | | — | | | 16 | |
| Gulfstream | — | | | — | | | 14 | |
| | | | | |
| | | | | |
| Other | — | | | 3 | | | 12 | |
| $ | 114 | | | $ | 141 | | | $ | 166 | |
Dividends and distributions
The organizational documents of entities in which Williams has an equity-method investment generally require distribution of available cash to members on at least a quarterly basis. These transactions reduced the carrying value of its investments and included:
| | | | | | | | | | | | | | | | | |
| Year Ended December 31, |
| 2024 | | 2023 | | 2022 |
| | (Millions) |
| Appalachia Midstream Investments | $ | 407 | | | $ | 405 | | | $ | 415 | |
| Gulfstream | 103 | | | 98 | | | 89 | |
| Blue Racer | 95 | | | 62 | | | 49 | |
| OPPL | 90 | | | 56 | | | 34 | |
| Laurel Mountain | 29 | | | 42 | | | 112 | |
| Discovery | 22 | | | 49 | | | 49 | |
| RMM | — | | | 49 | | | 52 | |
| Other | 43 | | | 35 | | | 65 | |
| $ | 789 | | | $ | 796 | | | $ | 865 | |
Summarized Financial Position and Results of Operations of All Equity-Method Investments
| | | | | | | | | | | |
| | December 31, |
| | 2024 | | 2023 |
| | (Millions) |
| Assets (liabilities): | | | |
| Current assets | $ | 564 | | | $ | 669 | |
| Noncurrent assets | 9,439 | | | 11,058 | |
| Current liabilities | (1,146) | | | (358) | |
| Noncurrent liabilities | (2,383) | | | (3,619) | |
| | | | | | | | | | | | | | | | | |
| | Year Ended December 31, |
| | 2024 | | 2023 | | 2022 |
| | (Millions) |
| Gross revenue | $ | 2,880 | | | $ | 3,714 | | | $ | 5,520 | |
| Operating income | 1,190 | | | 966 | | | 1,268 | |
| Net income | 987 | | | 748 | | | 1,102 | |
Sale of Aux Sable Interest
On August 1, 2024, Williams completed the sale of its equity-method investments in Aux Sable Liquid Products Inc., Aux Sable Liquid Products LP, and Aux Sable Midstream LLC (collectively, “Aux Sable”) in Williams’ Northeast G&P segment for total consideration of $161 million. As a result of this sale, Williams recorded a gain of $149 million in the third quarter of 2024. The gain is reflected in Other investing income (loss) – net in Williams’ Consolidated Statement of Income.
Other investing income (loss) – net
The following table presents certain items reflected in Other investing income (loss) – net in Williams’ Consolidated Statement of Income:
| | | | | | | | | | | | | | | | | |
| Year Ended December 31, |
| 2024 | | 2023 | | 2022 |
| | | (Millions) | | |
| Gain on sale of Aux Sable investments | $ | 149 | | | $ | — | | | $ | — | |
| Gain on remeasurement of Discovery investment (Note 3) | 127 | | | — | | | — | |
| Interest income | 67 | | | 79 | | | 15 | |
| Gain on remeasurement of RMM investment (Note 3) | — | | | 30 | | | — | |
| Other | — | | | (1) | | | 1 | |
| $ | 343 | | | $ | 108 | | | $ | 16 | |
Note 9 – Property, Plant, and Equipment
The following tables present Property, plant, and equipment – net for the years ended:
Williams
| | | | | | | | | | | | | | | | | | | | | | | |
| Estimated
Useful Life (1)
(Years) | | Depreciation
Rates (1)
(%) | | December 31, |
| 2024 | | 2023 |
| | | | | | (Millions) |
| Nonregulated: | | | | | | | |
| Natural gas gathering and processing facilities | 5 - 40 | | | | $ | 23,134 | | | $ | 21,357 | |
| Construction in progress | Not applicable | | | | 1,543 | | | 1,138 | |
| Oil and gas properties | Units of production | | | | 1,685 | | | 1,111 | |
| Other | 0 - 45 | | | | 4,798 | | | 3,268 | |
| Regulated: | | | | | | | |
| Natural gas transmission facilities | 0 - 25 | | 1.25 - 10.2 | | 22,763 | | | 21,083 | |
| Construction in progress | Not applicable | | Not applicable | | 542 | | | 1,124 | |
| Other | 5 - 45 | | 0.00 - 33.33 | | 2,930 | | | 2,761 | |
| Total property, plant, and equipment, at cost | | | | | 57,395 | | | 51,842 | |
| Accumulated depreciation and amortization | | | | | (18,703) | | | (17,531) | |
| Property, plant, and equipment — net | | | | | $ | 38,692 | | | $ | 34,311 | |
Depreciation and amortization expense for Property, plant, and equipment – net was $1.8 billion, $1.7 billion, and $1.5 billion in 2024, 2023, and 2022, respectively.
Interest capitalized was $68 million, $54 million, and $20 million in 2024, 2023, and 2022, respectively.
Regulated Property, plant, and equipment – net includes approximately $354 million and $389 million at December 31, 2024 and 2023, respectively, related to the purchase price allocation of $1.5 billion to property, plant and equipment and adjustments to deferred taxes in excess of original cost from Williams’ purchase of Transco in 1995. This amount is being amortized over 40 years using the straight-line amortization method. Current FERC policy does not permit recovery through rates for amounts in excess of original cost of construction.
Transco
| | | | | | | | | | | | | | | | | | |
| | Depreciation
Rates (1)
(%) | | December 31, |
| 2024 | | 2023 |
| | | | | (Millions) |
| Onshore transmission facilities | | 2.50 - 7.13 | | $ | 17,242 | | | $ | 16,031 | |
| Offshore transmission facilities | | 1.25 | | 659 | | | 681 | |
| Storage facilities | | 1.86 - 2.05 | | 948 | | | 830 | |
| Gathering facilities | | 0.00 - 1.00 | | 136 | | | 158 | |
| Construction in progress | | Not applicable | | 420 | | | 1,008 | |
| Other | | 1.77 - 20.00 | | 639 | | | 585 | |
| Total property, plant, and equipment, at cost | | | | 20,044 | | | 19,293 | |
| Accumulated depreciation and amortization | | | | (5,941) | | | (5,963) | |
| Property, plant, and equipment — net | | | | $ | 14,103 | | | $ | 13,330 | |
NWP
| | | | | | | | | | | | | | | | | |
| Depreciation
Rates (1)
(%) | | December 31, |
| 2024 | | 2023 |
| | | | (Millions) |
| Transmission facilities | 2.70 - 10.20 | | $ | 3,821 | | | $ | 3,570 | |
| Storage facilities | 1.60 - 2.76 | | 160 | | | 155 | |
| Construction in progress | Not applicable | | 66 | | | 85 | |
| Other | 0.00 - 33.33 | | 171 | | | 165 | |
| Total property, plant, and equipment, at cost | | | 4,218 | | | 3,975 | |
| Accumulated depreciation and amortization | | | (2,089) | | | (2,026) | |
| Property, plant, and equipment — net | | | $ | 2,129 | | | $ | 1,949 | |
__________
(1) Estimated useful life and depreciation rates are presented as of December 31, 2024. Depreciation rates and estimated useful lives for regulated assets are prescribed by the FERC.
Asset Retirement Obligations
Williams’ accrued obligations primarily relate to offshore platforms and pipelines, oil and gas properties, gas transmission pipelines and facilities, underground storage caverns, gas processing, fractionation, and compression facilities, and gas gathering well connections and pipelines. At the end of the useful life of each respective asset, Williams is legally obligated to dismantle offshore platforms and appropriately abandon offshore pipelines, to remove certain components of gas transmission facilities from the ground, to restore land and remove surface equipment at gas processing, fractionation, and compression facilities, to cap certain gathering pipelines at the wellhead connection and remove any related surface equipment, to plug storage caverns and remove any related surface equipment, and to plug producing wells and remove any related surface equipment.
The following tables present the significant changes to AROs, of which $2.548 billion and $1.978 billion are included in Regulatory liabilities, deferred income, and other with the remaining current portion in Other current liabilities at December 31, 2024 and 2023, respectively.
Williams
| | | | | | | | | | | |
| | Year Ended December 31, |
| | 2024 | | 2023 |
| | (Millions) |
| Balance at beginning of year | $ | 2,084 | | | $ | 1,914 | |
| Liabilities incurred (1) | 474 | | | 42 | |
| Liabilities settled | (68) | | | (43) | |
| Accretion | 118 | | | 97 | |
| Revisions (2) | 31 | | | 74 | |
| | | |
| Balance at end of year | $ | 2,639 | | | $ | 2,084 | |
___________
(1)Includes $250 million, $106 million, and $114 million of ARO in 2024 related to the Discovery, Gulf Coast Storage, and Crowheart Acquisitions, respectively.
(2)Several factors are considered in the annual review process, including inflation rates, current estimates for removal cost, market risk premiums, discount rates, and the estimated remaining useful life of the assets.
Transco
| | | | | | | | | | | |
| | Year Ended December 31, |
| | 2024 | | 2023 |
| | (Millions) |
| Balance at beginning of year | $ | 619 | | | $ | 563 | |
| Liabilities incurred | — | | | 8 | |
| Liabilities settled | (32) | | | (23) | |
| Accretion | 29 | | | 31 | |
| Revisions (1) | (1) | | | 40 | |
| Balance at end of year | $ | 615 | | | $ | 619 | |
___________
(1)Changes in estimates of existing obligations are primarily due to the annual review process, which considers various factors including inflation rate, current estimates for removal costs, discount rates, and the estimated remaining life of assets.
The funds Transco collects through a portion of its rates to fund its AROs are deposited into an external trust account dedicated to funding its AROs (ARO Trust). (See Note 16 – Fair Value Measurements, Guarantees, and Concentration of Credit Risk.)
NWP
| | | | | | | | | | | |
| | Year Ended December 31, |
| | 2024 | | 2023 |
| | (Millions) |
| Balance at beginning of year | $ | 136 | | | $ | 129 | |
| Accretion | 8 | | | 7 | |
| | | |
| Balance at end of year | $ | 144 | | | $ | 136 | |
NWP’s gross regulatory asset balances associated with ARO as of December 31, 2024 and 2023 were $124 million and $116 million, respectively. NWP’s regulatory asset is expected to be fully recovered through the negative salvage component of depreciation included in NWP’s rates; as such, the negative salvage component of accumulated depreciation collected through rates and reflected as a regulatory liability has been netted with the ARO regulatory asset to result in a regulatory liability of $30 million and $31 million at December 31, 2024 and 2023, respectively (See Note 10 – Regulatory Assets and Liabilities).
Note 10 – Regulatory Assets and Liabilities
The components of regulatory assets and liabilities include the effects of deferred taxes on equity funds used during construction, AROs, shipper imbalance activity, fuel and power cost differentials, depreciation, negative salvage, pension and other postretirement benefits, trackers, customer tax refunds, and rate allowances for deferred income taxes at a historically higher federal income tax rate.
Williams | | | | | | | | | | | | | | |
| | December 31, |
| | 2024 | | 2023 |
| | (Millions) |
Current assets reported within Other current assets and deferred charges | | $ | 84 | | | $ | 95 | |
Noncurrent assets reported within Regulatory assets, deferred charges, and other | | 582 | | | 527 | |
| Total regulatory assets | | $ | 666 | | | $ | 622 | |
| | | | |
| | | | |
Current liabilities reported within Other current liabilities | | $ | 85 | | | $ | 77 | |
Noncurrent liabilities reported within Regulatory liabilities, deferred income, and other | | 1,300 | | | 1,288 | |
| Total regulatory liabilities | | $ | 1,385 | | | $ | 1,365 | |
Transco
| | | | | | | | | | | | | | |
| | December 31, |
| | 2024 | | 2023 |
| | (Millions) |
| Current regulatory assets: | | | | |
| Fuel recovery | | $ | 47 | | | $ | 60 | |
| | | | |
| ARO | | 16 | | | 16 | |
| Deferred cash out | | 6 | | | 6 | |
| ARO - Eminence | | 5 | | | 5 | |
| Total current regulatory assets | | 74 | | | 87 | |
| Long-term regulatory assets: | | | | |
| ARO | | 243 | | | 209 | |
| Grossed-up deferred taxes on equity AFUDC | | 29 | | | 31 | |
| ARO - Eminence | | 15 | | | 20 | |
| Slug catcher | | 6 | | | 6 | |
| Deferred cash out | | — | | | 11 | |
| Other | | 27 | | | 22 | |
| Total long-term regulatory assets | | 320 | | | 299 | |
| Total regulatory assets | | $ | 394 | | | $ | 386 | |
| | | | |
| Current regulatory liabilities: | | | | |
| Deferred taxes - liability | | $ | 31 | | | $ | 31 | |
| Postretirement benefits other than pension | | — | | | 8 | |
| Electric power cost | | 26 | | | 7 | |
| Pension | | — | | | 2 | |
| Other | | 1 | | | 1 | |
| Total current regulatory liabilities | | 58 | | | 49 | |
| Long-term regulatory liabilities: | | | | |
| Negative salvage | | 632 | | | 605 | |
| Deferred taxes - liability | | 252 | | | 283 | |
| Postretirement benefits other than pension | | 31 | | | 23 | |
| Pension | | 30 | | | 24 | |
| Sentinel meter station depreciation | | 7 | | | 7 | |
| Other | | 24 | | | 14 | |
| Total long-term regulatory liabilities | | 976 | | | 956 | |
| Total regulatory liabilities | | $ | 1,034 | | | $ | 1,005 | |
The significant regulatory assets and liabilities include:
Fuel recovery: This amount represents the value of the cumulative volumetric difference between the gas retained from customers and the gas consumed in operations. These amounts are not included in the rate base, but assets and liabilities are expected to be recovered or refunded, respectively, in subsequent annual fuel tracker filings.
Electric power cost: This amount represents the value of the difference between the electric power costs recovered from our customers and the electric power costs incurred in operations. These amounts are expected to be recovered by changing the electric power reimbursement rate in subsequent annual electric power tracker filings.
ARO: This regulatory asset balance includes the uncollected ARO depreciation expense and accretion expense. The regulatory asset is being recovered through rates, and is being amortized to expense consistent with the amounts collected in rates (see AROs in Note 9 – Property, Plant, and Equipment).
Deferred cash out: This amount represents the deferral of gains or losses on the purchases and sales of gas imbalances with shippers. These assets and liabilities amounts will be recovered or refunded, respectively, under terms provided for in Transco’s FERC tariff.
Asset retirement costs - Eminence: This regulatory asset balance is associated with the Eminence Storage Field retirement costs. The regulatory asset is being recovered through rates and is being amortized to expense consistent with the amounts collected in rates.
Grossed-up deferred taxes on equity AFUDC: This regulatory asset balance is established to offset the deferred tax for the equity component of the allowance for funds used during the construction of long-lived assets. All amounts were generated during the period that Transco was a taxable entity. Taxes on capitalized funds used during construction and the offsetting deferred income taxes are included in the rate base and are recovered over the depreciable lives of the long-lived assets to which they relate.
Slug catcher: This amount represents certain costs associated with the replacement of a component of a slug catcher which was included in the Docket No. RP18-1126 rate case settlement. A regulatory asset has been established to recognize the recovery of Transco’s investment in the slug catcher as it is collected through Transco’s depreciation rates and is being amortized at the prescribed depreciation rate for onshore transmission facilities (see Note 1 – General, Description of Business, Basis of Presentation, and Summary of Significant Accounting Policies).
Negative salvage: Transco’s rates include a component designed to recover certain future retirement costs for which it is not required to record an ARO. Transco records a regulatory liability representing the cumulative residual amount of recoveries through rates, net of expenditures associated with these retirement costs.
Deferred taxes - liability: This regulatory liability balance was established as a result of a decrease to rate base deferred taxes due to a decrease to the effective federal income tax rate. The timing of the refund of the regulatory liability to rate payers is stated in the Docket No. RP18-1126 rate case settlement. Additionally, as of December 31, 2024, Transco has $13 million of rate base deferred taxes established as a result of a decrease to the effective state income tax rate. This amount and timing of the refund is being addressed in Transco’s ongoing rate case.
Postretirement benefits other than pension: Transco recovers the actuarially determined cost of postretirement benefits through rates that are set through periodic general rate filings. Any differences between the annual actuarially determined cost and the amounts recovered in rates are recorded as regulatory assets or liabilities to be collected or refunded through future rate adjustments. These amounts are not included in the rate base. Effective with the Docket No. RP18-1126 rate case settlement, the other postretirement benefits regulatory liability balance as of March 1, 2019, was fully amortized in 2024 (see Note 7 – Employee Benefit Plans).
Pension: Transco recovers the actuarially determined pension cash contributions through rates that are set through periodic general rate filings. Effective with the Docket No. RP18-1126 rate case settlement, any amounts of annual contributions that fall below the threshold are recorded as adjustments to income and refunded through future rate adjustments. Also effective with the Docket No. RP18-1126 rate case settlement, the pension regulatory liability balance as of March 1, 2019, was fully amortized in 2024 (see Note 7 – Employee Benefit Plans).
Sentinel meter station depreciation: This amount reflects the incremental depreciation being recorded related to the meter station modifications made for three of the Sentinel shippers. These modifications will be recovered through a surcharge over a defined period of time as stated in the Sentinel FERC order. The incremental depreciation represents the difference between the FERC granted depreciation rate for such facilities in the last rate case as compared to the depreciation rates in the Sentinel order which are based on the contractual terms in the surcharge agreements. The incremental depreciation will be recorded through the end of the contractual term and then will be amortized.
NWP | | | | | | | | | | | |
| December 31, |
| 2024 | | 2023 |
| (Millions) |
| Current regulatory assets: | | | |
| Fuel recovery | $ | 4 | | | $ | — | |
| Levelized depreciation | 2 | | | 2 | |
| Total current regulatory assets | 6 | | | 2 | |
| Long-term regulatory assets: | | | |
| Levelized depreciation | 7 | | | 10 | |
| Grossed-up deferred taxes on equity AFUDC | 4 | | | 4 | |
| Washington State Carbon and Greenhouse Gas Tax | 38 | | | 22 | |
| Total long-term regulatory assets | 49 | | | 36 | |
| Total regulatory assets | $ | 55 | | | $ | 38 | |
| | | |
| Current regulatory liabilities: | | | |
| | | |
| Deferred taxes - liability | $ | 20 | | | $ | 20 | |
| | | |
| Fuel recovery | — | | | 1 | |
| Total current regulatory liabilities | 20 | | | 21 | |
| Long-term regulatory liabilities: | | | |
| Deferred taxes - liability | 160 | | | 179 | |
| Postretirement benefits other than pension | 43 | | | 42 | |
| Negative salvage - net | 30 | | | 31 | |
| | | |
| Total long-term regulatory liabilities | 233 | | | 252 | |
| Total regulatory liabilities | $ | 253 | | | $ | 273 | |
The significant regulatory assets and liabilities include:
Fuel recovery: This amount represents the value of the cumulative volumetric difference between the gas retained from customers and the gas consumed in operations. These amounts are not included in the rate base, but assets and liabilities are expected to be recovered or refunded, respectively, in subsequent annual fuel tracker filings.
Levelized depreciation: Levelized depreciation allows contract revenue streams to remain constant over the primary contract terms by recognizing lower than book depreciation in the early years and higher than book depreciation in later years. The depreciation component of the levelized incremental rates will equal the accumulated book depreciation by the end of the primary contract terms. The difference between levelized depreciation and straight-line book depreciation is recorded as a FERC approved regulatory asset or liability and is eliminated over the levelization period.
Grossed-up deferred taxes on equity AFUDC: This regulatory asset balance is established to offset the deferred tax for the equity component of the allowance for funds used during the construction of long-lived assets. All amounts were generated during the period that NWP was a taxable entity. Taxes on capitalized funds used during construction and the offsetting deferred income taxes are included in the rate base and are recovered over the depreciable lives of the long-lived assets to which they relate.
Washington State Carbon and Greenhouse Tax: This amount represents the cost of emission allowances and the associated accumulated interest as a result of the passage of the state of Washington Climate Commitment Act
that took effect January 1, 2023. NWP’s Settlement allows it to recover the costs of purchasing allowances under the program in NWP’s next rate case.
Deferred taxes - liability: This regulatory liability balance was established as a result of a decrease to rate base deferred taxes due to a decrease to the effective federal and state income tax rates. The timing of the refund of the regulatory liability to rate payers is stated in the Docket No. RP22-1155 rate case settlement.
Postretirement benefits other than pension: NWP seeks to recover the actuarially determined cost of postretirement benefits through rates that are set through periodic general rate filings. Any differences between the annual actuarially determined cost and amounts currently being recovered in rates are recorded as regulatory assets or liabilities and collected or refunded through future rate adjustments. These amounts are not included in the rate base, and NWP is not currently recovering postretirement benefit costs in its rates (see Note 7 – Employee Benefit Plans).
Negative salvage, net of ARO asset: This regulatory liability balance reflects the amount that NWP has recovered in rates related to future retirement costs offset by depreciation of the ARO asset and accretion expense of the ARO liability due to the passage of time. AROs are expected to be fully recovered through the net negative salvage component of depreciation included in rates (see AROs in Note 9 – Property, Plant, and Equipment).
Note 11 – Goodwill and Other Intangible Assets
Goodwill
Changes in the carrying amount of goodwill, included in Intangible assets – net of accumulated amortization in Williams’ Consolidated Balance Sheet, by reportable segment for the years indicated are as follows:
| | | | | | | | | | | | | | | | | |
| Transmission & Gulf of America | | West | | Total |
| (Millions) |
| December 31, 2022 | $ | — | | | $ | — | | | $ | — | |
| MountainWest Acquisition (Note 3) | 400 | | | — | | | 400 | |
| Cureton Acquisition (Note 3) | — | | | 6 | | | 6 | |
| RMM Acquisition (Note 3) | — | | | 57 | | | 57 | |
| December 31, 2023 | 400 | | | 63 | | | 463 | |
| | | | | |
| Cureton Acquisition (Note 3) | — | | | 5 | | | 5 | |
| RMM Acquisition (Note 3) | — | | | (2) | | | (2) | |
| December 31, 2024 | $ | 400 | | | $ | 66 | | | $ | 466 | |
Goodwill is not subject to amortization, but is evaluated at least annually for impairment or more frequently if impairment indicators are present. Williams did not identify or recognize any impairments to goodwill in connection with the evaluation of goodwill for impairment during the year ended December 31, 2024.
Other Intangible Assets
The gross carrying amount and accumulated amortization of other intangible assets, included in Intangible assets – net of accumulated amortization in Williams’ Consolidated Balance Sheet, at December 31 are as follows:
| | | | | | | | | | | | | | | | | | | | | | | |
| 2024 | | 2023 |
| Gross Carrying Amount | | Accumulated Amortization | | Gross Carrying Amount | | Accumulated Amortization |
| (Millions) |
| Customer relationships | $ | 10,239 | | | $ | (3,523) | | | $ | 10,237 | | | $ | (3,155) | |
| Transportation and storage capacity contracts | 267 | | | (244) | | | 267 | | | (223) | |
| Other | 6 | | | (2) | | | 6 | | | (2) | |
| Other intangible assets | $ | 10,512 | | | $ | (3,769) | | | $ | 10,510 | | | $ | (3,380) | |
Customer Relationships
Customer relationships primarily relate to gas gathering, processing, and fractionation contractual customer relationships recognized in acquisitions. Contractual customer relationships are being amortized on a straight-line basis over periods of up to 30 years, which represents the term over which the contractual customer relationships are expected to contribute to cash flows.
Williams expenses costs incurred to renew or extend the terms of its gas gathering, processing, and fractionation contracts with customers. Although a significant portion of the expected future cash flows associated with these contractual customer relationships are dependent on the ability to renew or extend the arrangements beyond the initial contract periods, these expected future cash flows are significantly influenced by the scope and pace of Williams’ producer customers’ drilling programs. Once producer customers’ wells are connected to Williams’ gathering infrastructure, their likelihood of switching to another provider before the wells are abandoned is reduced due to the significant capital investment required.
The amortization expense related to customer relationships was $368 million, $360 million, and $353 million in 2024, 2023, and 2022, respectively. The estimated amortization expense for each of the next five succeeding fiscal years is $368 million, $364 million, $360 million, $360 million, and $360 million.
Transportation and Storage Capacity Contracts
Certain transportation and storage capacity contracts were recognized as intangible assets as part of the acquisition of Sequent in 2021. The amortization expense related to transportation and storage capacity contracts was $21 million, $51 million, and $158 million in 2024, 2023, and 2022, respectively. The estimated amortization expense for each of the next five succeeding fiscal years is $10 million, $7 million, $4 million, $2 million, and $0 million.
Note 12 – Other Current Liabilities
Williams
| | | | | | | | | | | |
| | December 31, |
| | 2024 | | 2023 |
| | (Millions) |
| Interest on debt | $ | 350 | | | $ | 322 | |
| Employee costs | 285 | | | 197 | |
| Contract liabilities (Note 5) | 170 | | | 159 | |
| Alaska refinery contamination litigation (Note 1) | — | | | 134 | |
| Asset retirement obligations (Note 9) | 91 | | | 106 | |
| Regulatory liabilities (Note 10) | 85 | | | 77 | |
| Operating lease liabilities (Note 14) | 26 | | | 24 | |
| | | |
| Other, including accrued loss contingencies | 353 | | | 265 | |
| $ | 1,360 | | | $ | 1,284 | |
Transco
| | | | | | | | | | | |
| | December 31, |
| | 2024 | | 2023 |
| | (Millions) |
| Interest on debt | $ | 76 | | | $ | 76 | |
| Contract liabilities | 10 | | | 10 | |
| Customer deposits | 38 | | | 35 | |
| Other | 57 | | | 69 | |
| | | |
| $ | 181 | | | $ | 190 | |
NWP
| | | | | | | | | | | |
| | December 31, |
| | 2024 | | 2023 |
| | (Millions) |
| Interest on debt | $ | 6 | | | $ | 6 | |
| Taxes, other than income taxes | 8 | | | 7 | |
| Contract liabilities | — | | | 1 | |
| Transportation and gas exchange payables | 10 | | | 5 | |
| Other | 10 | | | 15 | |
| | | |
| $ | 34 | | | $ | 34 | |
Note 13 – Debt and Banking Arrangements
Long-Term Debt by Issuing Entity | | | | | | | | | | | |
| December 31, |
| | 2024 | | 2023 |
| (Millions) |
| Transco: | | | |
| 7.08% Debentures due 2026 | $ | 8 | | | $ | 8 | |
| 7.25% Debentures due 2026 | 200 | | | 200 | |
| 7.85% Notes due 2026 | 1,000 | | | 1,000 | |
| 4% Notes due 2028 | 400 | | | 400 | |
| 3.25% Notes due 2030 | 700 | | | 700 | |
| 5.4% Notes due 2041 | 375 | | | 375 | |
| 4.45% Notes due 2042 | 400 | | | 400 | |
| 4.6% Notes due 2048 | 600 | | | 600 | |
| 3.95% Notes due 2050 | 500 | | | 500 | |
| Other financing obligation — Atlantic Sunrise | 764 | | | 790 | |
| Other financing obligation — Leidy South | 75 | | | 76 | |
| Other financing obligation — Dalton | 247 | | | 250 | |
| Unamortized debt issuance costs | (23) | | | (26) | |
| Net unamortized debt premium (discount) | (11) | | | (12) | |
| Total debt — Transco | $ | 5,235 | | | $ | 5,261 | |
| MountainWest: | | | |
| 3.53% Notes due 2028 (Note 3) | $ | 100 | | | $ | 100 | |
| 3.91% Notes due 2038 (Note 3) | 150 | | | 150 | |
| 4.875% Notes due 2041 (Note 3) | 180 | | | 180 | |
| Net unamortized debt premium (discount) | (58) | | | (61) | |
| Total debt — MountainWest | $ | 372 | | | $ | 369 | |
| NWP: | | | |
| 7.125% Debentures due 2025 | $ | 85 | | | $ | 85 | |
| 4% Notes due 2027 | 500 | | | 500 | |
| Unamortized debt issuance costs | (1) | | | (2) | |
| Net unamortized debt premium (discount) | (2) | | | (2) | |
| Total debt — NWP | $ | 582 | | | $ | 581 | |
| Williams: | | | |
| 4.3% Notes due 2024 | $ | — | | | $ | 1,000 | |
| 4.55% Notes due 2024 | — | | | 1,250 | |
| | | |
| 3.9% Notes due 2025 | 750 | | | 750 | |
| 4% Notes due 2025 | 750 | | | 750 | |
| 5.4% Notes due 2026 | 1,100 | | | 1,100 | |
| 7.7% Notes due 2027 | 2 | | | 2 | |
| 3.75% Notes due 2027 | 1,450 | | | 1,450 | |
| 5.3% Notes due 2028 | 900 | | | 900 | |
| 4.9% Notes due 2029 | 1,100 | | | — | |
| 4.8% Notes due 2029 | 450 | | | — | |
| 3.5% Notes due 2030 | 1,000 | | | 1,000 | |
| 2.6% Notes due 2031 | 1,500 | | | 1,500 | |
| 7.5% Debentures due 2031 | 339 | | | 339 | |
| 7.75% Notes due 2031 | 252 | | | 252 | |
| 8.75% Notes due 2032 | 445 | | | 445 | |
| 4.65% Notes due 2032 | 1,000 | | | 1,000 | |
| 5.65% Notes due 2033 | 750 | | | 750 | |
| 5.15% Notes due 2034 | 1,300 | | | — | |
| 6.3% Notes due 2040 | 1,250 | | | 1,250 | |
| 5.8% Notes due 2043 | 400 | | | 400 | |
| | | | | | | | | | | |
| December 31, |
| | 2024 | | 2023 |
| (Millions) |
| 5.4% Notes due 2044 | 500 | | | 500 | |
| 5.75% Notes due 2044 | 650 | | | 650 | |
| 4.9% Notes due 2045 | 500 | | | 500 | |
| 5.1% Notes due 2045 | 1,000 | | | 1,000 | |
| 4.85% Notes due 2048 | 800 | | | 800 | |
| 3.5% Notes due 2051 | 650 | | | 650 | |
| 5.3% Notes due 2052 | 750 | | | 750 | |
| 5.8% Notes due 2054 | 750 | | | — | |
| | | |
| Unamortized debt issuance costs | (130) | | | (112) | |
| Net unamortized debt premium (discount) | (41) | | | (39) | |
| Total debt — Williams | $ | 20,167 | | | $ | 18,837 | |
| RMM deferred consideration obligation (Note 3) | — | | | 665 | |
| Gulf Coast Storage deferred consideration obligation (Note 3) | 100 | | | — | |
| Total debt | $ | 26,456 | | | $ | 25,713 | |
| Long-term debt due within one year — Williams | (1,600) | | | (2,305) | |
| Long-term debt due within one year — Transco | (35) | | | (32) | |
| Long-term debt due within one year — NWP | (85) | | | — | |
| Long-term debt | $ | 24,736 | | | $ | 23,376 | |
Certain of Williams’ debt agreements contain covenants that restrict or limit, among other things, its ability to create liens supporting indebtedness, sell assets, and incur additional debt. Default of these agreements could also restrict Williams’ ability to make certain distributions or repurchase equity.
The following table presents aggregate minimum maturities of long-term debt, other financing obligations, and the Gulf Coast Storage deferred consideration obligation, excluding net unamortized debt premium (discount) and debt issuance costs, for each of the next five years:
| | | | | |
| December 31, 2024 |
| | (Millions) |
| Williams: | |
| 2025 | $ | 1,720 | |
| 2026 | 2,345 | |
| 2027 | 1,994 | |
| 2028 | 1,445 | |
| 2029 | 1,600 | |
| |
| Transco: | |
| 2025 | $ | 35 | |
| 2026 | 1,245 | |
| 2027 | 41 | |
| 2028 | 445 | |
| 2029 | 50 | |
| |
| NWP: | |
| 2025 | $ | 85 | |
| 2027 | 500 | |
Issuances
Williams senior unsecured public debt issuances for the past three years and subsequent to the balance sheet date are as follows:
| | | | | | | | | | | | | | | | | | | | |
| Issue Date | | Maturity Date | | Amount | | Rate |
| | | | (Millions) | | |
| January 9, 2025 | | March 15, 2035 | | $ | 1,000 | | | 5.600% |
| January 9, 2025 | | March 15, 2055 | | 500 | | | 6.000% |
| August 13, 2024 | | November 15, 2029 | | 450 | | | 4.800% |
| August 13, 2024 (1) | | March 15, 2034 | | 300 | | | 5.150% |
| August 13, 2024 | | November 15, 2054 | | 750 | | | 5.800% |
| January 5, 2024 | | March 15, 2029 | | 1,100 | | | 4.900% |
| January 5, 2024 | | March 15, 2034 | | 1,000 | | | 5.150% |
| August 10, 2023 (2) | | March 2, 2026 | | 350 | | | 5.400% |
| August 10, 2023 | | August 15, 2028 | | 900 | | | 5.300% |
| March 2, 2023 | | March 2, 2026 | | 750 | | | 5.400% |
| March 2, 2023 | | March 15, 2033 | | 750 | | | 5.650% |
| August 8, 2022 | | August 15, 2032 | | 1,000 | | | 4.650% |
| August 8, 2022 | | August 15, 2052 | | 750 | | | 5.300% |
| | | | | | |
| | | | | | |
| | | | | | |
| | | | | | |
| | | | | | |
| | | | | | |
________________
(1) Additional issuance of the 5.15 percent senior notes due 2034 issued on January 5, 2024, and trade interchangeably with such notes.
(2) Additional issuance of the 5.40 percent senior notes due 2026 issued on March 2, 2023, and trade interchangeably with such notes.
Retirements
Williams’ senior unsecured public debt retirements for the past three years and subsequent to the balance sheet date are as follows:
| | | | | | | | | | | | | | | | | | | | |
| Date of Retirement | | Maturity Date | | Amount | | Rate |
| | | | (Millions) | | |
| January 15, 2025 | | January 15, 2025 | | $ | 750 | | | 3.900% |
| June 24, 2024 | | June 24, 2024 | | 1,250 | | | 4.550% |
| March 4, 2024 | | March 4, 2024 | | 1,000 | | | 4.300% |
| November 15, 2023 | | November 15, 2023 | | 600 | | | 4.500% |
| October 17, 2022 | | January 15, 2023 | | 850 | | | 3.700% |
| May 16, 2022 | | August 15, 2022 | | 750 | | | 3.350% |
| January 18, 2022 | | March 15, 2022 | | 1,250 | | | 3.600% |
| | | | | | |
| | | | | | |
Other financing obligations
During the construction of the Atlantic Sunrise, Leidy South, and Dalton projects, Transco received funding from co-owners for their proportionate share of construction costs. Amounts received were recorded within
noncurrent liabilities and the costs associated with construction were capitalized. Upon placing these projects into service Transco began utilizing the co-owners’ undivided interest in the assets, including the associated pipeline capacity, and reclassified the funding previously received from its co-owners from noncurrent liabilities to debt. The obligations, which mature in 2038, 2041, and 2052, respectively, require monthly interest and principal payments and bear interest rates of approximately 9 percent, 13 percent, and 9 percent, respectively.
Credit Facility
| | | | | | | | | | | |
| December 31, 2024 |
| Stated Capacity | | Outstanding |
| (Millions) |
| Long-term credit facility (1) | $ | 3,750 | | | $ | — | |
| Letters of credit under certain bilateral bank agreements | | | 15 | |
________________
(1) In managing its available liquidity, Williams does not expect a maximum outstanding amount in excess of the capacity of its credit facility inclusive of any outstanding amounts under the commercial paper program.
Revolving credit facility
In October 2021, Williams along with Transco and NWP, the lenders named therein, and an administrative agent entered into an amended and restated credit agreement (Credit Agreement) that reduced aggregate commitments available from $4.5 billion to $3.75 billion, with up to an additional $500 million increase in aggregate commitments available under certain circumstances. The Credit Agreement was effective on October 8, 2021. In the second quarter of 2023, the maturity date of the Credit Agreement was extended one year and now expires October 8, 2027. The amended Credit Agreement allows the co-borrowers to request up to two extensions of the maturity date each for an additional one-year period to allow a maturity date as late as October 8, 2029, under certain circumstances. Additionally, the amended Credit Agreement replaces the London Interbank Offered Rate with the Term Secured Overnight Financing Rate as the benchmark interest rate index. The Credit Agreement allows for swing line loans up to an aggregate of $200 million, subject to available capacity under the credit facility, and letters of credit commitments of $500 million. Transco and NWP are each able to borrow up to $500 million under this credit facility to the extent not otherwise utilized by the other co-borrowers.
The Credit Agreement contains the following terms and conditions:
•Various covenants may limit, among other things, a borrower’s and its material subsidiaries’ ability to grant certain liens supporting indebtedness, merge or consolidate, sell all or substantially all of its assets in certain circumstances, make certain distributions during an event of default, and each borrower and each borrower’s respective material subsidiaries’ ability to enter into certain restrictive agreements.
•If an event of default with respect to a borrower occurs under the credit facility, the lenders will be able to terminate the commitments for the respective borrowers and accelerate the maturity of the loans of the defaulting borrower under the credit facility and exercise other rights and remedies.
•Other than swing line loans, each time funds are borrowed, the applicable borrower may choose from two methods of calculating interest: a fluctuating base rate equal to an alternative base rate as defined in the Credit Agreement plus an applicable margin or a periodic fixed rate equal to the Term Secured Overnight Financing Rate plus an applicable margin. Williams is required to pay a commitment fee based on the unused portion of the credit facility. The applicable margin is determined by reference to a pricing schedule based on the applicable borrower’s senior unsecured long-term debt ratings and the commitment fee is determined by reference to a pricing schedule based on Williams’ senior unsecured long-term debt ratings.
Significant financial covenants under the Credit Agreement require Williams’ ratio of debt to EBITDA (earnings before interest, taxes, depreciation, and amortization), each as defined in the Credit Agreement, to be no
greater than 5.0 to 1.0, except that for any fiscal quarter in which the funding of the purchase price for an acquisition (whether effectuated as one or a series of related transactions) with an aggregate purchase price of $25 million or more has been effected, and the following two fiscal quarters (in each case subject to certain limitations), the ratio of debt to EBITDA is to be no greater than 5.5 to 1.
The ratio of debt to capitalization (defined as net worth plus debt), each as defined in the Credit Agreement, must be no greater than 65 percent for each of Transco and NWP.
Williams expects to be in compliance with these covenants for the December 31, 2024 reporting period.
Commercial Paper Program
Williams has a $3.5 billion commercial paper program. The maturities of the commercial paper notes vary but may not exceed 397 days from the date of issuance. The commercial paper notes are sold under customary terms in the commercial paper market and are issued at a discount from par, or, alternatively, are sold at par and bear varying interest rates on a fixed or floating basis. The net proceeds of issuances of the commercial paper notes are expected to be used to fund planned capital expenditures and for other general corporate purposes. At December 31, 2024, $455 million commercial paper was outstanding at a weighted-average interest rate of 4.6 percent. At December 31, 2023, $725 million of commercial paper was outstanding at a weighted-average interest rate of 5.6 percent.
Restrictive Debt Covenants
At December 31, 2024, none of Transco’s nor NWP’s debt instruments restrict the amount of distributions to Williams, provided, however, that under the credit facility described above, Transco or NWP are restricted from making distributions to Williams during an event of default if Transco or NWP have directly incurred indebtedness under the credit facility. The debt agreements of Transco and NWP contain restrictions on their ability to incur secured debt beyond certain levels and to guarantee certain indebtedness. The indenture governing Transco’s $1 billion of 7.85 percent Senior Notes due 2026 further restricts its ability to guarantee certain indebtedness. Transco and NWP expect to be in compliance with these covenants, for the December 31, 2024 reporting period.
Cash Payments for Interest by Registrant (Net of Amounts Capitalized)
| | | | | | | | | | | | | | | | | |
| Year Ended December 31, |
| 2024 | | 2023 | | 2022 |
| (Millions) |
| Williams | $ | 1,293 | | | $ | 1,152 | | | $ | 1,117 | |
| Transco | 302 | | | 307 | | | 326 | |
| NWP | 24 | | | 26 | | | 26 | |
Note 14 – Leases
Williams, Transco, and NWP are lessees through noncancellable lease agreements for property and equipment consisting primarily of buildings, land, vehicles, and equipment used in both its operations and administrative functions.
Williams
| | | | | | | | | | | | | | | | | |
| Year Ended December 31, |
| 2024 | | 2023 | | 2022 |
| (Millions) |
| Lease Cost: | | | | | |
| Operating lease cost | $ | 39 | | | $ | 38 | | | $ | 34 | |
| Variable lease cost | 31 | | | 31 | | | 26 | |
| Sublease income | — | | | (1) | | | — | |
| Total lease cost | $ | 70 | | | $ | 68 | | | $ | 60 | |
| Cash paid for operating lease liabilities | $ | 37 | | | $ | 37 | | | $ | 33 | |
| | | | | | | | | | | |
| December 31, |
| 2024 | | 2023 |
| (Dollars in Millions) |
| Other Information: | | | |
Right-of-use assets (included in Regulatory assets, deferred charges, and other) | $ | 154 | | | $ | 159 | |
| Operating lease liabilities: | | | |
Current (included in Other current liabilities) | $ | 26 | | | $ | 24 | |
Noncurrent (included in Regulatory liabilities, deferred income, and other) | $ | 142 | | | $ | 148 | |
Weighted-average remaining lease term – operating leases (years) | 11 | | 11 |
Weighted-average discount rate – operating leases | 4.90% | | 4.78% |
At December 31, 2024, the following table represents operating lease maturities, including renewal provisions Williams has assessed as being reasonably certain of exercise, for each of the years ended December 31:
| | | | | |
| (Millions) |
| 2025 | $ | 34 | |
| 2026 | 33 | |
| 2027 | 30 | |
| 2028 | 22 | |
| 2029 | 19 | |
| Thereafter | 86 | |
| Total future lease payments | 224 | |
| Less: Amount representing interest | 56 | |
| Total obligations under operating leases | $ | 168 | |
Williams is the lessor to certain lease agreements for office space in its headquarters building, which are insignificant to its financial statements.
Transco
| | | | | | | | | | | | | | | | | |
| Year Ended December 31, |
| 2024 | | 2023 | | 2022 |
| (Millions) |
| Lease Cost: | | | | | |
| Operating lease cost | $ | 9 | | | $ | 9 | | | $ | 9 | |
| Variable lease cost | 7 | | | 7 | | | 7 | |
| Total lease cost | $ | 16 | | | $ | 16 | | | $ | 16 | |
| Cash paid for operating lease liabilities | $ | 9 | | | $ | 10 | | | $ | 10 | |
| | | | | |
| | | December 31, |
| | | 2024 | | 2023 |
| | | (Dollars in Millions) |
| Other Information: | | | | | |
Right-of-use assets (included in Deferred charges and other in Transco’s Balance Sheet) | | $ | 48 | | | $ | 53 | |
| Operating lease liabilities: | | | | |
Current (included in Other current liabilities in Transco’s Balance Sheet) | | $ | 6 | | | $ | 6 | |
Noncurrent (included in Deferred income and other in Transco’s Balance Sheet) | | $ | 51 | | | $ | 56 | |
| Weighted-average remaining lease term – operating leases (years) | | 13 | | 13 |
| Weighted-average discount rate – operating leases | | 4.77% | | 4.73% |
As of December 31, 2024, the following table represents operating lease maturities, including renewal provisions that Transco has assessed as being reasonably certain of exercise, for each of the years ended December 31:
| | | | | |
| (Millions) |
| 2025 | $ | 9 | |
| 2026 | 9 | |
| 2027 | 10 | |
| 2028 | 10 | |
| 2029 | 10 | |
| Thereafter | 32 | |
| Total future lease payments | 80 | |
| Less: Amount representing interest | 23 | |
| Total obligations under operating leases | $ | 57 | |
NWP
| | | | | | | | | | | | | | | | | |
| Year Ended December 31, |
| 2024 | | 2023 | 2022 |
| (Millions) |
| Lease Cost: | | | | | |
| Operating lease cost | $ | 3 | | | $ | 1 | | | $ | 1 | |
| Variable lease cost | 1 | | | 1 | | | 1 | |
| Total lease cost | $ | 4 | | | $ | 2 | | | $ | 2 | |
| Cash paid for operating lease liabilities | $ | 2 | | | $ | 1 | | | $ | 1 | |
| | | | | |
| | December 31, |
| | 2024 | | 2023 |
| | (Dollars in Millions) |
| Other Information: | | | | |
Right-of-use assets (included in Deferred charges and other in NWP’s Balance Sheet) | | $ | 5 | | | $ | 9 | |
| Operating lease liabilities: | | | | |
Current (included in Other current liabilities in NWP’s Balance Sheet) | | $ | 1 | | | $ | 1 | |
Noncurrent (included in Deferred income and other in NWP’s Balance Sheet) | | $ | 5 | | | $ | 7 | |
| Weighted-average remaining lease term – operating leases (years) | | 19 | | 15 |
| Weighted-average discount rate – operating leases | | 4.90% | | 4.18% |
As of December 31, 2024, the following table represents operating lease maturities, including renewal provisions that NWP has assessed as being reasonably certain of exercise, for each of the years ended December 31:
| | | | | |
| (Millions) |
| 2025 | $ | 1 | |
| 2026 | — | |
| 2027 | 1 | |
| 2028 | — | |
| 2029 | 1 | |
| Thereafter | 6 | |
| Total future lease payments | 9 | |
| Less: Amount representing interest | 3 | |
| Total obligations under operating leases | $ | 6 | |
Note 15 – Equity-Based Compensation
Williams’ Plan Information
The Williams Companies, Inc. 2007 Incentive Plan (the Plan) provides common-stock-based awards to both employees and nonmanagement directors. To date, 50 million new shares have been authorized for making awards under the Plan. The Plan permits the granting of various types of awards including, but not limited to, restricted stock units and stock options. At December 31, 2024, 17 million shares of common stock were reserved for issuance pursuant to existing and future stock awards, of which 9 million shares were available for future grants.
Additionally, up to 5.2 million new shares of Williams’ common stock have been authorized to date to be available for sale under Williams’ Employee Stock Purchase Plan (ESPP). Employees purchased 240 thousand shares at a weighted-average price of $33.00 per share during 2024. Approximately 0.7 million shares were available for purchase under the ESPP at December 31, 2024.
Williams recognizes compensation expense on employee stock-based awards on a straight-line basis; forfeitures are recognized when they occur. Operating and maintenance expenses and Selling, general, and administrative expenses in Williams’ Consolidated Statement of Income include equity-based compensation expense in 2024, 2023, and 2022 of $99 million, $77 million, and $73 million, respectively. Income tax benefit recognized related to the stock-based compensation expense in 2024, 2023, and 2022 was $24 million, $19 million, and $18 million, respectively. Measured but unrecognized stock-based compensation expense at December 31, 2024, was $70 million, all of which related to restricted stock units. These amounts are expected to be recognized over a weighted-average period of 1.7 years.
Nonvested Restricted Stock Units
At December 31, 2024 and 2023, Williams had restricted stock units outstanding, including performance-based shares, of 6.4 million shares and 6.6 million shares, respectively, with a weighted-average fair value of $32.48 and $28.34, respectively. During 2024 and 2023, Williams granted 3.1 million and 3.8 million shares of restricted stock units with a weighted-average fair value of $31.77 and $27.43, respectively. Restricted stock units generally vest after three years. Performance-based grants may vest at a range from zero percent to 200 percent of the original shares granted based on performance against a target. At December 31, 2024, there were 1.8 million performance-based shares outstanding.
Stock Options
There were no stock options granted in 2024, 2023, or 2022. At December 31, 2024, Williams had 0.4 million stock options that were both outstanding and exercisable, with a weighted-average exercise price of $29.99. The weighted-average remaining contractual life for stock options that were both outstanding and exercisable at December 31, 2024, was 2.4 years. Cash received for the exercise of stock options in 2024 and 2023 was $5 million and $2 million, respectively, and the related income tax benefit recognized in both 2024 and 2023 was $2 million.
Note 16 – Fair Value Measurements, Guarantees, and Concentration of Credit Risk
The following table presents, by level within the fair value hierarchy, certain of Williams’, Transco’s, and NWP’s significant financial assets and liabilities. The carrying values of cash and cash equivalents, accounts receivable, accounts payable, and commercial paper approximate fair value because of the short-term nature of these instruments. Therefore, these assets and liabilities are not presented in the following table.
| | | | | | | | | | | | | | | | | | | | | | | | | | | | | |
| | | | | Fair Value Measurements Using |
| Carrying
Amount | | Fair
Value | | Quoted
Prices In
Active
Markets for
Identical
Assets
(Level 1) | | Significant
Other
Observable
Inputs
(Level 2) | | Significant
Unobservable
Inputs
(Level 3) |
| (Millions) |
| Assets (liabilities) at December 31, 2024: | | | | | | | | | |
| Measured on a recurring basis: | | | | | | | | | |
| ARO Trust investments - Transco | $ | 297 | | | $ | 297 | | | $ | 297 | | | $ | — | | | $ | — | |
| Commodity derivative assets (1) | 344 | | | 726 | | | 427 | | | 188 | | | 111 | |
| Commodity derivative liabilities (1) | (400) | | | (1,070) | | | (532) | | | (475) | | | (63) | |
| | | | | | | | | |
| | | | | | | | | |
| Additional disclosures: | | | | | | | | | |
| | | | | | | | | |
| | | | | | | | | |
| Debt by issuer, including current portion: | | | | | | | | | |
| Williams | (20,167) | | | (19,517) | | | — | | | (19,517) | | | — | |
| Transco | (5,235) | | | (5,276) | | | — | | | (5,276) | | | — | |
| NWP | (582) | | | (573) | | | — | | | (573) | | | — | |
| MountainWest | (372) | | | (364) | | | — | | | (364) | | | — | |
| Gulf Coast Storage deferred consideration obligation (Note 3) | (100) | | | (100) | | | — | | | (100) | | | — | |
| Total debt | (26,456) | | | (25,830) | | | — | | | (25,830) | | | — | |
| | | | | | | | | |
| Guarantees | (36) | | | (28) | | | — | | | (12) | | | (16) | |
| | | | | | | | | |
| Assets (liabilities) at December 31, 2023: | | | | | | | | | |
| Measured on a recurring basis: | | | | | | | | | |
| ARO Trust investments - Transco | $ | 269 | | | $ | 269 | | | $ | 269 | | | $ | — | | | $ | — | |
| Commodity derivative assets (1)(2) | 314 | | | 866 | | | 514 | | | 196 | | | 156 | |
| Commodity derivative liabilities (1)(2) | (287) | | | (841) | | | (376) | | | (362) | | | (103) | |
| Interest rate derivatives | 6 | | 6 | | — | | | 6 | | — | |
| Additional disclosures: | | | | | | | | | |
| | | | | | | | | |
| Debt by issuer, including current portion: | | | | | | | | | |
| Williams | (18,837) | | | (18,494) | | | — | | | (18,494) | | | — | |
| Transco | (5,261) | | | (5,438) | | | — | | | (5,438) | | | — | |
| NWP | (581) | | | (581) | | | — | | | (581) | | | — | |
| MountainWest | (369) | | | (375) | | | — | | | (375) | | | — | |
| RMM deferred consideration obligation (Note 3) | (665) | | | (665) | | | — | | | (665) | | | — | |
| Total debt | (25,713) | | | (25,553) | | | — | | | (25,553) | | | — | |
| | | | | | | | | |
| Guarantees | (37) | | | (28) | | | — | | | (12) | | | (16) | |
(1)The carrying amount is presented net of counterparty offsetting arrangements and collateral (see Note 17 – Commodity Derivatives).
(2)Previously, the fair value of Williams’ commodity derivative assets and liabilities were disclosed by level within the fair value hierarchy net of counterparty offsetting arrangements. The December 31, 2023, amounts have been corrected to disclose the fair values by level on a gross basis, as presented above.
Fair Value Methods
The following methods and assumptions are used in estimating the fair value of financial instruments:
Assets Measured at Fair Value on a Recurring Basis
ARO Trust investments
Transco is entitled to collect rates in the amounts necessary to fund its future AROs and deposits a portion of the collected rates, pursuant to the terms of its Docket Number RP18-1126 rate case settlement, into an ARO Trust. The ARO Trust invests in a moderate risk portfolio of actively traded mutual funds that are measured at fair value on a recurring basis based on quoted prices in an active market and is reported in Regulatory assets, deferred charges, and other in Williams’ Consolidated Balance Sheet and in Deferred charges and other in the Transco Balance Sheet. The Money Market Funds held in the ARO Trust are considered investments. Both realized and unrealized gains and losses are ultimately recorded to the ARO regulatory asset.
Pursuant to the approved stipulation and agreement in Docket Number RP18-1126 the annual funding obligation effective March 1, 2020, is approximately $16 million, with deposits made monthly.
Transco investments within the ARO Trust were as follows:
| | | | | | | | | | | | | | | | | | | | | | | | | | |
| | December 31, 2024 | | December 31, 2023 |
| | Amortized Cost Basis | | Fair Value | | Amortized Cost Basis | | Fair Value |
| | (Millions) |
| Money Market Funds | | $ | 27 | | | $ | 27 | | | $ | 26 | | | $ | 26 | |
| U.S. Equity Funds | | 53 | | | 146 | | | 53 | | | 120 | |
| International Equity Funds | | 32 | | | 40 | | | 32 | | | 39 | |
| Municipal Bond Funds | | 88 | | | 84 | | | 87 | | | 84 | |
| Total | | $ | 200 | | | $ | 297 | | | $ | 198 | | | $ | 269 | |
Commodity derivatives
Williams’ commodity derivatives include exchange-traded contracts and OTC contracts, which consist of physical forwards, futures, and swaps that are measured at fair value on a recurring basis. Williams also has other derivatives related to asset management agreements and other contracts that require physical delivery. Derivatives classified as Level 1 are valued using New York Mercantile Exchange (NYMEX) futures prices. Derivatives classified as Level 2 are valued using basis transactions that represent the cost to transport natural gas from a NYMEX delivery point to the contract delivery point. These transactions are based on quotes obtained either through electronic trading platforms or directly from brokers. Derivatives classified as Level 3 are valued using a combination of observable and unobservable inputs. See Note 17 – Commodity Derivatives for additional information.
The following table presents a reconciliation of changes in fair value of the net commodity derivatives classified as Level 3 in the fair value hierarchy.
| | | | | | | | | | | | | | | |
| | | | | | | |
| | | | | |
| Year Ended December 31, | | |
| 2024 | | 2023 | | | | |
| (Millions) | | | | |
| Balance at beginning of period | $ | 53 | | | $ | (56) | | | | | |
| Gains (losses) included in Williams’ Consolidated Statement of Income | (5) | | | 91 | | | | | |
| Purchases, issuances, and settlements | (1) | | | 20 | | | | | |
| Transfers into Level 3 | 1 | | | — | | | | | |
| Transfers out of Level 3 | — | | | (2) | | | | | |
| Balance at end of period | $ | 48 | | | $ | 53 | | | | | |
A substantial portion of the December 31, 2024, and December 31, 2023, Level 3 derivatives relate to a long-term physical natural gas purchase contract associated with an ongoing pipeline expansion project. The valuation of this contract reflects the extrapolation of forward natural gas prices for periods beyond observable price curves, which is considered a significant unobservable input.
Interest rate derivatives
At December 31, 2023, Williams held interest rate derivative agreements with notional amounts totaling $1.15 billion. During 2024, Williams entered into additional agreements totaling $950 million of notional value and terminated agreements totaling $1.75 billion of notional value coinciding with issuances of long-term debt (see Note 13 – Debt and Banking Arrangements). At December 31, 2024, Williams holds interest rate derivative agreements with notional amounts totaling $350 million. The fair value of these derivatives is determined using discounted cash flows considering forward interest rates and the terms of the agreements, corroborated by counterparty valuations, and is classified as a Level 2 measurement. These derivatives are designated as cash flow hedges to reduce interest rate exposure on future corporate debt issuances. Gains and losses on these derivative agreements are reflected as a component of AOCI and, after the termination of the agreements, are amortized to earnings over the term of the related debt as a component of Interest expense. These interest rate derivative agreements are reported in Derivative assets and Derivative liabilities.
Additional Fair Value Disclosures
Long-term debt, including current portion
The disclosed fair value of long-term debt is determined primarily by a market approach using broker quoted indicative period-end bond prices. The quoted prices are based on observable transactions in less active markets for the debt or similar instruments. The fair values of the financing obligations associated with Transco’s Dalton, Leidy South, and Atlantic Sunrise projects, as well as the deferred consideration obligations associated with the RMM Acquisition and the Gulf Coast Storage Acquisition (see Note 3 – Acquisitions and Divestitures), all included within long-term debt including current portion, were determined using an income approach (see Note 13 – Debt and Banking Arrangements).
Guarantees
Guarantees primarily consist of a guarantee Williams has provided in the event of nonpayment by a previously owned communications subsidiary, Williams Communications Group, Inc., (WilTel), on a lease performance obligation that extends through 2042. Guarantees also include an indemnification related to a disposed operation.
To estimate the fair value of the WilTel guarantee, an estimated default rate is applied to the sum of the future contractual lease payments using an income approach. The estimated default rate is determined by obtaining the
average cumulative issuer-weighted default rate based on the credit rating of WilTel’s current owner and the term of the underlying obligation. The default rate is published by Moody’s Investors Service. The carrying value of the WilTel guarantee is reported in Other current liabilities. The maximum potential undiscounted liquidity exposure is approximately $22 million at December 31, 2024. The exposure declines systematically through the remaining term of WilTel’s obligation.
The fair value of the guarantee associated with the indemnification related to a disposed operation was estimated using an income approach that considered probability-weighted scenarios of potential levels of future performance. The terms of the indemnification do not limit the maximum potential future payments associated with the guarantee. The carrying value of this guarantee is reported in Regulatory liabilities, deferred income, and other.
Williams is required by its revolving credit agreement to indemnify lenders for certain taxes required to be withheld from payments due to the lenders and for certain tax payments made by the lenders. The maximum potential amount of future payments under these indemnifications is based on the related borrowings and such future payments cannot currently be determined. These indemnifications generally continue indefinitely unless limited by the underlying tax regulations and have no carrying value. Williams has never been called upon to perform under these indemnifications and there is no current expectation of a future claim.
Concentration of Credit Risk
Accounts receivable
The following table summarizes Williams’ concentration of receivables, net of allowances:
| | | | | | | | | | | |
| | December 31, |
| | 2024 | | 2023 |
| | (Millions) |
| NGLs, natural gas, and related products and services | $ | 594 | | | $ | 589 | |
| Regulated interstate natural gas transportation and storage | 339 | | | 310 | |
| Marketing of natural gas and NGLs | 516 | | | 321 | |
| Upstream activities | 45 | | | 72 | |
| Accounts receivable related to revenues from contracts with customers | 1,494 | | | 1,292 | |
| Receivables from derivatives | 294 | | | 311 | |
| Other accounts receivable | 75 | | | 52 | |
| Trade accounts and other receivables - net | $ | 1,863 | | | $ | 1,655 | |
Williams’ customers include producers, distribution companies, industrial users, gas marketers, and pipelines primarily located in the continental United States. As a general policy, collateral is not required for receivables with the exception of the marketing receivables discussed below. Customers’ financial condition and credit worthiness are evaluated regularly and, based upon this evaluation, Williams may obtain collateral to support receivables.
Williams uses established credit policies to determine and monitor the creditworthiness of gas marketing and trading counterparties, including requirements to post collateral or other credit security, as well as the quality of pledged collateral. Collateral or credit security is most often in the form of cash or letters of credit from an investment-grade financial institution, but may also include U.S. government securities. Williams also utilizes netting agreements whenever possible to mitigate exposure to gas marketing and trading counterparty credit risk. When more than one derivative transaction with the same counterparty is outstanding and a legally enforceable netting agreement exists with that counterparty, the “net” mark-to-market exposure represents a reasonable measure of the credit risk with that counterparty.
Transco and NWP receivables from contracts with customers are included within Receivables - Trade and Receivables - Affiliates. Receivables that are not related to contracts with customers are included within the balance of Receivables - Advances to affiliate and Receivables - Other.
Revenues
Customers representing 10 percent or more of Transco’s and NWP’s revenues include:
| | | | | | | | | | | | | | | | | |
| Year Ended December 31, |
| 2024 | | 2023 | | 2022 |
| (Millions) |
| Transco: | | | | | |
| Dominion Energy, Inc (1) | $ | 217 | | | $ | 287 | | | $ | 293 | |
| | | | | |
| NWP: | | | | | |
| Puget Sound Energy, Inc. | $ | 136 | | | $ | 126 | | | $ | 131 | |
| Cascade Natural Gas Corporation | 46 | | | 47 | | | 49 | |
| Northwest Natural Gas Company | 47 | | | 47 | | | 49 | |
_______________
(1) The 2024 amount is less than 10 percent of Transco’s revenue.
Note 17 – Commodity Derivatives
Williams is exposed to commodity price risk and utilizes derivatives to manage a portion of that risk. Williams reports the fair value of commodity derivatives in Derivative assets; Regulatory assets, deferred charges, and other; Derivative liabilities; or Regulatory liabilities, deferred income, and other. These amounts are presented on a net basis by counterparty and reflect the netting of asset and liability positions permitted under the terms of master netting arrangements and cash held on deposit in margin accounts that Williams has received or remitted to collateralize certain derivative positions. See Note 16 – Fair Value Measurements, Guarantees, and Concentration of Credit Risk for additional fair value information. In Williams’ Consolidated Statement of Cash Flows, any cash impacts of settled commodity derivatives are recorded as operating activities.
Williams enters into commodity derivatives to economically hedge exposures to natural gas, NGLs, and crude oil and retains exposure to price changes that can, in a volatile energy market, be material and can adversely affect its results of operations.
Volumes
At December 31, 2024, the notional volume of the net long (short) positions for Williams’ commodity derivative contracts were as follows:
| | | | | | | | | | | | | | | | | | | | |
| | Commodity | | Unit of Measure | | Net Long (Short) Position |
| | | | | | |
| | | | |
| | | | | | |
| | | | | | |
| | | | | | |
| | | | | | |
| | | | | | |
| Index Risk | | Natural Gas | | MMBtu | | 592,842,257 |
| Central Hub Risk - Henry Hub | | Natural Gas | | MMBtu | | (50,513,793) |
| Basis Risk | | Natural Gas | | MMBtu | | 13,306,615 |
| Central Hub Risk - Mont Belvieu | | Natural Gas Liquids | | Barrels | | (2,561,000) |
| Basis Risk | | Natural Gas Liquids | | Barrels | | (205,000) |
| Central Hub Risk - WTI | | Crude Oil | | Barrels | | (480,000) |
| | | | | | |
Financial Statement Presentation
The fair value of commodity derivatives, which are not designated as hedging instruments for accounting purposes, is reflected as follows:
| | | | | | | | | | | | | | | | | | | | | | | | | | |
| | December 31,
2024 | | December 31,
2023 |
| Commodity Derivatives Categories | | Assets | | (Liabilities) | | Assets | | (Liabilities) |
| | (Millions) |
| | | | | | | | |
| | | | | | | | |
| | | | | | | | |
| | | | | | | | |
| | | | | | | | |
| Current | | $ | 508 | | | $ | (635) | | | $ | 623 | | | $ | (496) | |
| Noncurrent | | 218 | | | (435) | | | 243 | | | (345) | |
| Total commodity derivatives | | $ | 726 | | | $ | (1,070) | | | $ | 866 | | | $ | (841) | |
| Counterparty and collateral netting offset | | (382) | | | 670 | | | (552) | | | 554 | |
| Amounts recognized in Williams’ Consolidated Balance Sheet | | $ | 344 | | | $ | (400) | | | $ | 314 | | | $ | (287) | |
The pre-tax impacts of Williams’ commodity derivatives, which are not designated as hedging instruments for accounting purposes, are reflected as follows:
| | | | | | | | | | | | | | | | | | | | | | | | |
| | | | | | Year Ended December 31, |
| | | | | | |
| | | | | | 2024 | | 2023 | | 2022 |
| | | | | (Millions) |
Net gain (loss) from commodity derivatives within Total revenues: | | |
| | | | | | | | | | |
| Realized | | | | | | $ | 111 | | | $ | 253 | | | $ | (91) | |
| Unrealized | | | | | | (361) | | | 703 | | | (296) | |
| | | | | | $ | (250) | | | $ | 956 | | | $ | (387) | |
| | | | | | | | | | |
Net gain (loss) from commodity derivatives within Net processing commodity expenses: |
| Realized | | | | | | $ | (8) | | | $ | (4) | | | $ | 16 | |
| Unrealized | | | | | | (6) | | | (43) | | | 47 | |
| | | | | | $ | (14) | | | $ | (47) | | | $ | 63 | |
| Total net gain (loss) from commodity derivatives | | | | | | $ | (264) | | | $ | 909 | | | $ | (324) | |
| | | | | | | | | | |
Contingent Features
Generally, collateral may be provided in the form of a parent guaranty, letter of credit, or cash. If collateral is required, fair value amounts recognized for the right to reclaim cash collateral or the obligation to return cash collateral are offset against fair value amounts recognized for derivatives executed with the same counterparty.
Williams has specific trade and credit contracts that contain minimum credit rating requirements. These credit rating requirements typically give counterparties the right to suspend or terminate credit if Williams’ credit ratings are downgraded to non-investment grade status. Under such circumstances, Williams would need to post collateral to continue transacting business with these counterparties. At December 31, 2024, the contractually required collateral in the event of a credit rating downgrade to non-investment grade status was $6 million.
Williams maintains accounts with brokers or the clearing houses of certain exchanges to facilitate financial derivative transactions. Based on the value of the positions in these accounts and the associated margin requirements, Williams may be required to deposit cash into these accounts. At December 31, 2024, and 2023, net cash collateral held on deposit in broker margin accounts was $288 million, and $2 million, respectively.
Note 18 – Contingencies and Commitments
Royalty Matters
Certain customers, including Expand Energy Corporation (formerly Chesapeake Energy Corporation or Chesapeake), have been named in various lawsuits alleging underpayment of royalties and claiming, among other things, violations of anti-trust laws and the Racketeer Influenced and Corrupt Organizations Act. Williams has also been named as a defendant in certain of these cases filed in Pennsylvania based on allegations that Williams improperly participated with Chesapeake in causing the alleged royalty underpayments. Williams believes that the claims asserted are subject to indemnity obligations owed to Williams by Chesapeake, which obligations survived Chesapeake’s bankruptcy proceedings. Prior to its bankruptcy, Chesapeake reached a settlement to resolve substantially all Pennsylvania royalty cases pending. During the pendency of the bankruptcy, that settlement was renegotiated. The settlement applies to both Chesapeake and Williams and does not require any contribution from Williams. On August 23, 2021, after referral to the United States District Court for the Southern District of Texas by the bankruptcy court, the court approved the settlement. Two objectors filed an appeal with the United States Court of Appeals for the Fifth Circuit. On June 8, 2023, the Court of Appeals vacated the settlement approval and remanded to the United States District Court for the Southern District of Texas with instructions to dismiss the settlement proceedings for lack of jurisdiction. On August 31, 2023, the bankruptcy court entered an order finding the settlement agreements to be null and void. Certain plaintiffs have filed a notice of dismissal of their claims against Chesapeake that arose prior to February 8, 2021, in the United States District Court for the Middle District of Pennsylvania lawsuits. The notice states that plaintiffs are not releasing their claims against the other defendants, including Williams, or claims against Chesapeake that arose after February 9, 2021. Williams continues to believe the claims against Williams are subject to indemnity obligations owed to Williams by Chesapeake.
Rate Matters
On August 30, 2024, Transco filed a general rate case (Docket No. RP24-1035) with the FERC for an overall increase in rates and to comply with the terms of the settlement of its prior rate case to file a rate case no later than August 30, 2024. On September 30, 2024, the FERC issued an order accepting and suspending Transco’s general rate filing to be effective March 1, 2025, subject to refund and the outcome of hearing procedures established by the FERC except that rates for certain services that were proposed as overall rate decreases were accepted, without suspension, to be effective October 1, 2024. The decreased rates will not be subject to refund but may be subject to decrease prospectively under Section 5 of the Natural Gas Act of 1938 as amended.
Construction Litigation
In February 2025, Transco received an adverse judgment related to litigation in the United States Bankruptcy Court for the District of Delaware involving the contractor for the construction of Transco’s Atlantic Sunrise project completed in 2018. The total award to the contractor, estimated at $110 million, included amounts for unpaid invoices, interest, and attorney fees. Management estimates the probable loss from the judgment to be substantially less and Transco has filed a notice of appeal. Transco has capitalized the amount considered probable within noncurrent assets and expects any additional probable loss would also be capitalized. Transco also expects to recover approximately 29 percent of any amount paid from the counterparty on the project.
Environmental Matters
Williams
Williams is a participant in certain environmental activities in various stages including assessment studies, cleanup operations, and/or remedial processes at certain sites, some of which Williams currently does not own. Williams is monitoring these sites in a coordinated effort with other potentially responsible parties, the U.S. Environmental Protection Agency (EPA), or other governmental authorities. Williams is jointly and severally liable along with unrelated third parties in some of these activities and solely responsible in others. Certain of Williams’
subsidiaries have been identified as potentially responsible parties at various Superfund and state waste disposal sites. In addition, these subsidiaries have incurred, or are alleged to have incurred, various other hazardous materials removal or remediation obligations under environmental laws. As of December 31, 2024, Williams has accrued liabilities totaling $42 million for these matters, as discussed below. Estimates of the most likely costs of cleanup are generally based on completed assessment studies, preliminary results of studies, or Williams’ experience with other similar cleanup operations. At December 31, 2024, certain assessment studies were still in process for which the ultimate outcome may yield different estimates of most likely costs. Therefore, the actual costs incurred will depend on the final amount, type, and extent of contamination discovered at these sites, the final cleanup standards mandated by the EPA or other governmental authorities, and other factors.
The EPA, other federal agencies, and various state regulatory agencies routinely propose and promulgate new rules, issue updated guidance to rules, or revise existing rules. These rulemakings include, but are not limited to, reviews and updates to the National Ambient Air Quality Standards, and promulgation of rules for new and existing source performance standards for certain equipment emitting volatile organic compound and methane as well as limitations on emissions of greenhouse gas compounds. Williams continuously monitors these regulatory changes and how they may impact its operations. Implementation of new or revised regulations may result in impacts to Williams’ operations and increase the cost of additions to Property, plant, and equipment – net in the balance sheet for both new and existing facilities in affected areas; however, due to regulatory uncertainty on final rule content or guidance and applicability timeframes, Williams is unable to reasonably estimate the cost of these regulatory impacts at this time.
Continuing operations
Williams’ interstate gas pipelines are involved in remediation and monitoring activities related to certain facilities and locations for polychlorinated biphenyls, mercury, and other hazardous substances. These activities have involved the EPA and various state environmental authorities, resulting in Williams’ identification as a potentially responsible party at various Superfund waste sites. At December 31, 2024, Williams has accrued liabilities of $12 million (see Transco and NWP below) for these costs and expect to recover approximately $4 million through rates.
Williams also accrues environmental remediation costs for natural gas underground storage facilities, primarily related to soil and groundwater contamination. At December 31, 2024, Williams has accrued liabilities totaling $7 million for these costs.
Former operations
Williams has potential obligations in connection with assets and businesses it no longer operates. These potential obligations include remediation activities at the direction of federal and state environmental authorities and the indemnification of the purchasers of certain of these assets and businesses for environmental and other liabilities existing at the time the sale was consummated. At December 31, 2024, Williams has accrued environmental liabilities of $23 million related to these matters.
Transco
Transco has had studies underway for many years to test some of its facilities for the presence of toxic and hazardous substances such as polychlorinated biphenyls (PCBs) and mercury to determine to what extent, if any, remediation may be necessary. Transco has also similarly evaluated past on-site disposal of hydrocarbons at a number of its facilities. Transco has worked closely with and responded to data requests from the EPA and state agencies regarding such potential contamination of certain of their sites. Transco is conducting environmental assessments and implementing a variety of remedial measures that may result in increases or decreases in the total estimated costs. Transco also has a program for monitoring certain environmental activities at their Eminence storage facility. At December 31, 2024, Transco has accrued liabilities of approximately $11 million for the expected ongoing remediation and monitoring costs.
Transco has been identified as a potentially responsible party (PRP) at various Superfund and state waste disposal sites. Based on present volumetric estimates and other factors, their estimated aggregate exposure for remediation of these sites is less than $1 million. The estimated remediation costs for all of these sites are included in the environmental liabilities discussed above. Liability under the Comprehensive Environmental Response, Compensation and Liability Act and applicable state law can be joint and several with other PRPs. Although volumetric allocation is a factor in assessing liability, it is not necessarily determinative; thus, the ultimate liability could be substantially greater than the amounts described above.
Transco considers prudently incurred environmental assessment and remediation costs and the costs associated with compliance with environmental standards to be recoverable through rates. Historically, with limited exceptions, it has been permitted recovery of environmental costs, and it is Transco’s intent to continue seeking recovery of such costs through future rate filings.
NWP
Beginning in the mid-1980s, NWP evaluated many of its facilities for the presence of toxic and hazardous substances to determine to what extent, if any, remediation might be necessary. NWP identified PCB contamination in air compressor systems, soils, and related properties at certain compressor station sites. Similarly, it identified hydrocarbon impacts at these facilities due to the former use of earthen pits, lubricating oil leaks or spills, and excess pipe coating released to the environment. In addition, heavy metals have been identified at these sites due to the former use of mercury containing meters and paint and welding rods containing lead, cadmium, and arsenic. The PCBs were remediated pursuant to a Consent Decree with the EPA in the late 1980s, and NWP conducted a voluntary clean-up of the hydrocarbon and mercury impacts in the early 1990s. In 2005, the Washington Department of Ecology required NWP to re-evaluate previous clean-ups in Washington. During 2006 to 2015, 129 meter stations were evaluated, of which 82 required remediation. As of December 31, 2024, two meter stations are still being remediated. During 2006 to 2018, 14 compressor stations were evaluated, of which 11 required remediation. As of December 31, 2024, four compressor stations are still being remediated. NWP had accrued liabilities totaling approximately $1 million at December 31, 2024 for the ongoing remediation. NWP is conducting environmental assessments and implementing a variety of remedial measures that may result in increases or decreases in the total estimated costs.
Environmental expenditures are expensed or capitalized depending on their future economic benefit and potential for rate recovery. NWP believes that, with respect to any expenditures required to meet applicable standards and regulations, the FERC would grant the requisite rate relief so that substantially all of such expenditures would be permitted to be recovered through rates.
Washington State Climate Commitment Act
In 2021, the state of Washington passed its Climate Commitment Act establishing a market-based cap-and-invest program to reduce carbon emissions. This program took effect on January 1, 2023, and sets a limit, or cap, on overall carbon emissions in the state and requires businesses like NWP to obtain allowances equal to their annual covered carbon emissions. The state’s cap will be reduced over time to meet the state’s carbon emissions reduction targets, which means fewer carbon emissions allowances will be available to purchase each year. These allowances can be purchased through quarterly auctions hosted by the state or bought and sold on a secondary market. In 2023, NWP began purchasing allowances for the carbon emissions from nine of its thirteen compressor stations within the state whose annual carbon emissions have exceeded 25,000 metric tons of carbon dioxide equivalent at least once since 2015. NWP also began purchasing allowances for NWP’s delivery of natural gas to certain of their customers and certain of their facilities in the state whose annual carbon emissions are insufficient to require their direct participation in the program. NWP’s latest rate case settlement allows them to recover the costs of purchasing allowances under the program in their next rate case.
At December 31, 2024 and December 31, 2023, a total of $38 million and $22 million, respectively, were included in Regulatory assets in NWP’s Balance Sheet and was comprised of the cost of the purchased allowances
held, the estimated difference between the allowances held and the allowances required, and the interest income component of the regulatory asset. At December 31, 2024 and December 31, 2023, $3 million and $4 million, respectively, were recorded in Other current liabilities on NWP’s Balance Sheet as the estimated difference. Interest income of $2 million for the year ended December 31, 2024 and $1 million for the year ended December 31, 2023 is reflected in Other income (expense) – net in NWP’s Statement of Net Income.
Other Divestiture Indemnifications
Pursuant to various purchase and sale agreements relating to divested businesses and assets, Williams has indemnified certain purchasers against liabilities that they may incur with respect to the businesses and assets acquired. The indemnities provided to the purchasers are customary in sale transactions and are contingent upon the purchasers incurring liabilities that are not otherwise recoverable from third parties.
At December 31, 2024, other than as previously disclosed, Williams is not aware of any material claims against it involving the above-described indemnities. Any claim for indemnity brought against Williams in the future may have a material adverse effect on Williams’ results of operations in the period in which the claim is made.
In addition to the foregoing, various other proceedings are pending against Williams that are incidental to its operations, none of which are expected to be material to Williams’ expected future annual results of operations, liquidity, and financial position.
Summary
Williams, Transco and NWP have disclosed estimated ranges of reasonably possible losses for certain matters above, as well as all significant matters for which they are unable to reasonably estimate a range of possible loss. Williams, Transco and NWP estimate that for all other matters for which they are able to reasonably estimate a range of loss, the aggregate reasonably possible losses beyond amounts accrued are immaterial to expected future annual results of operations, liquidity, and financial position. These calculations have been made without consideration of any potential recovery from third parties.
Commitments
Commitments for Gas & NGL Marketing Services pipeline transportation capacity and storage capacity are approximately $954 million at December 31, 2024.
Commitments for construction and acquisition of property, plant, and equipment for Williams, Transco, and NWP are approximately $155 million, $2 million, and less than $1 million, respectively at December 31, 2024.
Note 19 – Segment Disclosures
Williams
Williams’ reportable segments are Transmission & Gulf of America, Northeast G&P, West, and Gas & NGL Marketing Services. All remaining business activities are included in Other. (See Note 1 – General, Description of Business, Basis of Presentation, and Summary of Significant Accounting Policies.)
Performance Measurement
Williams’ chief operating decision maker is the Chief Executive Officer. Williams' chief operating decision maker primarily utilizes Modified EBITDA, its measure of segment profit and loss, to evaluate performance and make decisions on capital allocation and human resources. Such evaluation includes periodic comparisons of actual performance versus historical and budget, as well as projections of Modified EBITDA.
Williams defines Modified EBITDA as follows:
•Income (loss) before income taxes from continuing operations before:
◦Depreciation and amortization expenses;
◦Equity earnings (losses);
◦Other investing income (loss) – net;
◦Interest expense; and
◦Accretion expense associated with AROs for nonregulated operations.
•This measure is further adjusted to include Williams’ proportionate share (based on ownership interest) of Modified EBITDA from its equity-method investments calculated consistently with the definition described above.
Significant noncash items which are components of Modified EBITDA may include net unrealized gain (loss) from commodity derivatives within Total revenues, net unrealized gain (loss) from commodity derivatives within Net processing commodity expenses for Williams’ Gas & NGL Marketing Services segment, charges associated with lower of cost or net realizable value adjustments to the Gas & NGL Marketing Services segment inventory within Product sales (for natural gas marketing inventory as these sales are presented net of the related costs) and Product costs (for NGL marketing inventory), and impairments of certain assets within Other (income) expense – net within Operating income (loss).
Intersegment Service revenues primarily represent transportation services provided to Williams’ marketing business and gathering services provided to its oil and gas properties. Intersegment Product sales primarily represent the sale of natural gas and NGLs from Williams’ natural gas processing plants and its oil and gas properties to its marketing business.
Segment assets include Investments, Property, plant, and equipment – net, and Intangible assets – net of accumulated amortization.
The following tables present revenues, Modified EBITDA, significant expenses, and certain segment assets measures, as well as reconciliations to the consolidated totals:
| | | | | | | | | | | | | | | | | | | | | | | | | | | | | | | | | |
| Transmission & Gulf of America | | Northeast G&P | | West | | Gas & NGL Marketing Services (1) | | | | | | Total |
| (Millions) |
| | | | | | | | | | | | |
| | | | | | | | | | | | | |
| | | | | | | | | | | | | |
| | | | | | | | | | | | | |
| | | | | | | | | | | | | |
| | | | | | | | | | | | | |
| | | | | | | | | | | | | |
| | | | | | | | | | | | | |
| | | | | | | | | | | | | |
| | | | | | | | | | | | | |
| | | | | | | | | | | | | |
| | | | | | | | | | | | | |
| | | | | | | | | | | | | |
| | | | | | | | | | | | | |
| | | | | | | | | | | | | |
| | | | | | | | | | | | | |
| | | | | | | | | | | | | |
| | | | | | | | | | | | | |
| | | | | | | | | | | | | |
| | | | | | | | | | | | | |
| | | | | | | | | | | | | |
| | | | | | | | | | | | |
| | | | | | | | | | | | | |
| | | | | | | | | | | | | |
| | | | | | | | | | | | | |
| | | | | | | | | | | | | |
| | | | | | | | | | | | | |
| | | | | | | | | | | | | |
| | | | | | | | | | | | | |
| | | | | | | | | | | | | |
| | | | | | | | | | | | | |
| | | | | | | | | | | | | |
| | | | | | | | | | | | | |
| | | | | | | | | | | | | |
| | | | | | | | | | | | | |
| | | | | | | | | | | | | |
| | | | | | | | | | | | | |
| | | | | | | | | | | | | |
| | | | | | | | | | | | | |
| | | | | | | | | | | | | |
| 2024 | | | | | | | | | | | | |
| Segment revenues: | | | | | | | | | | | | | |
| Service revenues | | | | | | | | | | | | | |
| External | $ | 4,157 | | | $ | 1,900 | | | $ | 1,558 | | | $ | — | | | | | | | $ | 7,615 | |
| Internal | 89 | | | 13 | | | 160 | | | — | | | | | | | 262 | |
| Total service revenues | 4,246 | | | 1,913 | | | 1,718 | | | — | | | | | | | 7,877 | |
| Total service revenues – commodity consideration | 54 | | | 2 | | | 78 | | | — | | | | | | | 134 | |
| Product sales | | | | | | | | | | | | | |
| External | 144 | | | 24 | | | 178 | | | 2,500 | | | | | | | 2,846 | |
| Internal | 184 | | | 86 | | | 691 | | | (448) | | | | | | | 513 | |
| Total product sales | 328 | | | 110 | | | 869 | | | 2,052 | | | | | | | 3,359 | |
| Net gain (loss) from commodity derivatives | | | | | | | | | | | | | |
| Realized | — | | | — | | | 4 | | | 72 | | | | | | | 76 | |
| Unrealized | — | | | — | | | — | | | (335) | | | | | | | (335) | |
| Total net gain (loss) from commodity derivatives (2) | — | | | — | | | 4 | | | (263) | | | | | | | (259) | |
| Total revenues of reportable segments | $ | 4,628 | | | $ | 2,025 | | | $ | 2,669 | | | $ | 1,789 | | | | | | | $ | 11,111 | |
| Reconciliation of revenues: | | | | | | | | | | | | | |
| Revenues from upstream operations, corporate, and other business activities | | | | | | | | | | | | | 470 | |
| Net unrealized gain (loss) from commodity derivatives for upstream operations | | | | | | | | | | | | | (26) | |
| Eliminations | | | | | | | | | | | | | (1,052) | |
| Total consolidated revenues | | | | | | | | | | | | | $ | 10,503 | |
| Segment costs and expenses and Proportional Modified EBITDA of equity-method investments: | | | | | | | | | | | | | |
| Product costs and net realized processing commodity expenses | (329) | | | (88) | | | (844) | | | (1,799) | | | | | | | |
| Net unrealized gain (loss) from commodity derivatives within Net processing commodity expenses | — | | | — | | | — | | | (6) | | | | | | | |
| Operating and administrative expenses (3) | (1,104) | | | (441) | | | (591) | | | (108) | | | | | | | |
| Recoverable power, transportation, and storage costs (4) | (250) | | | (143) | | | (49) | | | — | | | | | | | |
| Other segment income (expenses) - net (5) | 155 | | | 3 | | | (5) | | | — | | | | | | | |
| | | | | | | | | | | | | |
| Proportional Modified EBITDA of equity-method investments | 173 | | | 602 | | | 132 | | | — | | | | | | | |
| Modified EBITDA of reportable segments | $ | 3,273 | | | $ | 1,958 | | | $ | 1,312 | | | $ | (124) | | | | | | | $ | 6,419 | |
| Modified EBITDA from upstream operations, corporate, and other business activities | | | | | | | | | | | | | 237 | |
| Total consolidated Modified EBITDA | | | | | | | | | | | | | $ | 6,656 | |
| Reconciliation of Modified EBITDA: | | | | | | | | | | | | | |
| Depreciation and amortization expenses | | | | | | | | | | | | | $ | (2,219) | |
| Equity earnings (losses) | | | | | | | | | | | | | 560 | |
| Other investing income (loss) - net | | | | | | | | | | | | | 343 | |
| Interest expense | | | | | | | | | | | | | (1,364) | |
| Accretion expense associated with AROs for nonregulated operations | | | | | | | | | | | | | (81) | |
| Proportional Modified EBITDA of equity-method investments | | | | | | | | | | | | | (909) | |
| Income (loss) before income taxes from continuing operations | | | | | | | | | | | | | $ | 2,986 | |
| | | | | | | | | | | | | |
| Equity-method investments by reportable segment | $ | 272 | | | $ | 3,346 | | | $ | 476 | | | $ | — | | | | | | | $ | 4,094 | |
| Other equity-method investments | | | | | | | | | | | | | 13 | |
| Total equity-method investments | | | | | | | | | | | | | $ | 4,107 | |
| | | | | | | | | | | | | |
| Segment assets | $ | 23,149 | | | $ | 12,918 | | | $ | 12,144 | | | $ | 46 | | | | | | | $ | 48,257 | |
| Total current assets | | | | | | | | | | | | | 2,661 | |
| Regulatory assets, deferred charges, and noncurrent assets | | | | | | | | | | | | | 1,830 | |
| Assets of upstream operations, corporate, and other business activities | | | | | | | | | | | | | 1,784 | |
| Total assets | | | | | | | | | | | | | $ | 54,532 | |
| | | | | | | | | | | | | |
| Additions to long-lived segment assets | $ | 4,399 | | | $ | 210 | | | $ | 529 | | | $ | 2 | | | | | | | $ | 5,140 | |
| Additions to long-lived assets of upstream operations, corporate, and other business activities | | | | | | | | | | | | | 458 | |
| Total additions to long-lived assets | | | | | | | | | | | | | $ | 5,598 | |
| | | | | | | | | | | | | |
| | | | | | | | | | | | | | | | | | | | | | | | | | | | | | | | | |
| Transmission & Gulf of America | | Northeast G&P | | West | | Gas & NGL Marketing Services (1) | | | | | | Total |
| (Millions) |
| 2023 | | | | | | | | | | | | |
| Segment revenues: | | | | | | | | | | | | | |
| Service revenues | | | | | | | | | | | | | |
| External | $ | 3,766 | | | $ | 1,868 | | | $ | 1,376 | | | $ | 1 | | | | | | | $ | 7,011 | |
| Internal | 92 | | | 28 | | | 126 | | | — | | | | | | | 246 | |
| Total service revenues | 3,858 | | | 1,896 | | | 1,502 | | | 1 | | | | | | | 7,257 | |
| Total service revenues – commodity consideration | 38 | | | 5 | | | 103 | | | — | | | | | | | 146 | |
| Product sales | | | | | | | | | | | | | |
| External | 146 | | | 34 | | | 80 | | | 2,382 | | | | | | | 2,642 | |
| Internal | 106 | | | 98 | | | 361 | | | (322) | | | | | | | 243 | |
| Total product sales | 252 | | | 132 | | | 441 | | | 2,060 | | | | | | | 2,885 | |
| Net gain (loss) from commodity derivatives | | | | | | | | | | | | | |
| Realized | 2 | | | — | | | 89 | | | 115 | | | | | | | 206 | |
| Unrealized | — | | | — | | | — | | | 702 | | | | | | | 702 | |
| Total net gain (loss) from commodity derivatives (2) | 2 | | | — | | | 89 | | | 817 | | | | | | | 908 | |
| Total revenues of reportable segments | $ | 4,150 | | | $ | 2,033 | | | $ | 2,135 | | | $ | 2,878 | | | | | | | $ | 11,196 | |
| Reconciliation of revenues: | | | | | | | | | | | | | |
| Revenues from upstream operations, corporate, and other business activities | | | | | | | | | | | | | 505 | |
| Net unrealized gain (loss) from commodity derivatives for upstream operations | | | | | | | | | | | | | 1 | |
| Eliminations | | | | | | | | | | | | | (795) | |
| Total consolidated revenues | | | | | | | | | | | | | $ | 10,907 | |
| Segment costs and expenses and Proportional Modified EBITDA of equity-method investments: | | | | | | | | | | | | | |
| Product costs and net realized processing commodity expenses | (259) | | | (125) | | | (517) | | | (1,786) | | | | | | | |
| Net unrealized gain (loss) from commodity derivatives within Net processing commodity expenses | — | | | — | | | — | | | (43) | | | | | | | |
| Operating and administrative expenses (3) | (1,034) | | | (424) | | | (502) | | | (98) | | | | | | | |
| Recoverable power, transportation, and storage costs (4) | (241) | | | (132) | | | (37) | | | — | | | | | | | |
| Other segment income (expenses) - net (5) | 118 | | | (10) | | | (3) | | | (1) | | | | | | | |
| Gain on sale of business (6) | 129 | | | — | | | — | | | — | | | | | | | |
| Proportional Modified EBITDA of equity-method investments | 205 | | | 574 | | | 162 | | | — | | | | | | | |
| Modified EBITDA of reportable segments | $ | 3,068 | | | $ | 1,916 | | | $ | 1,238 | | | $ | 950 | | | | | | | $ | 7,172 | |
| Modified EBITDA from upstream operations, corporate, and other business activities | | | | | | | | | | | | | 307 | |
| Unallocated Net gain from Energy Transfer litigation judgment (7) | | | | | | | | | | | | | 534 | |
| Total consolidated Modified EBITDA | | | | | | | | | | | | | $ | 8,013 | |
| Reconciliation of Modified EBITDA: | | | | | | | | | | | | | |
| Depreciation and amortization expenses | | | | | | | | | | | | | $ | (2,071) | |
| Equity earnings (losses) | | | | | | | | | | | | | 589 | |
| Other investing income (loss) - net | | | | | | | | | | | | | 108 | |
| Interest expense | | | | | | | | | | | | | (1,236) | |
| Accretion expense associated with AROs for nonregulated operations | | | | | | | | | | | | | (59) | |
| Proportional Modified EBITDA of equity-method investments | | | | | | | | | | | | | (939) | |
| Income (loss) before income taxes from continuing operations | | | | | | | | | | | | | $ | 4,405 | |
| | | | | | | | | | | | | |
| Equity-method investments by reportable segment | $ | 652 | | | $ | 3,477 | | | $ | 477 | | | $ | — | | | | | | | $ | 4,606 | |
| Other equity-method investments | | | | | | | | | | | | | 8 | |
| Total equity-method investments | | | | | | | | | | | | | $ | 4,614 | |
| | | | | | | | | | | | | |
| Segment assets | $ | 19,705 | | | $ | 13,319 | | | $ | 12,188 | | | $ | 77 | | | | | | | $ | 45,289 | |
| Total current assets | | | | | | | | | | | | | 4,513 | |
| Regulatory assets, deferred charges, and noncurrent assets | | | | | | | | | | | | | 1,573 | |
| Assets of upstream operations, corporate, and other business activities | | | | | | | | | | | | | 1,252 | |
| Total assets | | | | | | | | | | | | | $ | 52,627 | |
| | | | | | | | | | | | | |
| Additions to long-lived segment assets | $ | 2,501 | | | $ | 340 | | | $ | 1,186 | | | $ | 7 | | | | | | | $ | 4,034 | |
| Additions to long-lived assets of upstream operations, corporate, and other business activities | | | | | | | | | | | | | 279 | |
| Total additions to long-lived assets | | | | | | | | | | | | | $ | 4,313 | |
| | | | | | | | | | | | | |
| | | | | | | | | | | | | | | | | | | | | | | | | | | | | | | | | |
| Transmission & Gulf of America | | Northeast G&P | | West | | Gas & NGL Marketing Services (1) | | | | | | Total |
| (Millions) |
| 2022 | | | | | | | | | | | | | |
| Segment revenues: | | | | | | | | | | | | | |
| Service revenues | | | | | | | | | | | | | |
| External | $ | 3,461 | | | $ | 1,613 | | | $ | 1,443 | | | $ | 3 | | | | | | | $ | 6,520 | |
| Internal | 118 | | | 41 | | | 99 | | | — | | | | | | | 258 | |
| Total service revenues | 3,579 | | | 1,654 | | | 1,542 | | | 3 | | | | | | | 6,778 | |
| Total service revenues – commodity consideration | 64 | | | 14 | | | 182 | | | — | | | | | | | 260 | |
| Product sales | | | | | | | | | | | | | |
| External | 228 | | | 28 | | | 145 | | | 4,052 | | | | | | | 4,453 | |
| Internal | 176 | | | 106 | | | 696 | | | (518) | | | | | | | 460 | |
| Total product sales | 404 | | | 134 | | | 841 | | | 3,534 | | | | | | | 4,913 | |
| Net gain (loss) from commodity derivatives | | | | | | | | | | | | | |
| Realized | — | | | — | | | (4) | | | 17 | | | | | | | 13 | |
| Unrealized | — | | | — | | | — | | | (321) | | | | | | | (321) | |
| Total net gain (loss) from commodity derivatives (2) | — | | | — | | | (4) | | | (304) | | | | | | | (308) | |
| Total revenues of reportable segments | $ | 4,047 | | | $ | 1,802 | | | $ | 2,561 | | | $ | 3,233 | | | | | | | $ | 11,643 | |
| Reconciliation of revenues: | | | | | | | | | | | | | |
| Revenues from upstream operations, corporate, and other business activities | | | | | | | | | | | | | 626 | |
| Net unrealized gain (loss) from commodity derivatives for upstream operations | | | | | | | | | | | | | 25 | |
| Eliminations | | | | | | | | | | | | | (1,329) | |
| Total consolidated revenues | | | | | | | | | | | | | $ | 10,965 | |
| Segment costs and expenses and Proportional Modified EBITDA of equity-method investments: | | | | | | | | | | | | | |
| Product costs and net realized processing commodity expenses | (425) | | | (138) | | | (918) | | | (3,228) | | | | | | | |
| Net unrealized gain (loss) from commodity derivatives within Net processing commodity expenses | — | | | — | | | — | | | 47 | | | | | | | |
| Operating and administrative expenses (3) | (906) | | | (384) | | | (507) | | | (96) | | | | | | | |
| Recoverable power, transportation, and storage costs (4) | (254) | | | (132) | | | (43) | | | — | | | | | | | |
| Other segment income (expenses) - net (5) | 19 | | | (6) | | | (14) | | | 4 | | | | | | | |
| | | | | | | | | | | | | |
| Proportional Modified EBITDA of equity-method investments | 193 | | | 654 | | | 132 | | | — | | | | | | | |
| Modified EBITDA of reportable segments | $ | 2,674 | | | $ | 1,796 | | | $ | 1,211 | | | $ | (40) | | | | | | | $ | 5,641 | |
| Modified EBITDA from upstream operations, corporate, and other business activities | | | | | | | | | | | | | 434 | |
| | | | | | | | | | | | | |
| Total consolidated Modified EBITDA | | | | | | | | | | | | | $ | 6,075 | |
| Reconciliation of Modified EBITDA: | | | | | | | | | | | | | |
| Depreciation and amortization expenses | | | | | | | | | | | | | $ | (2,009) | |
| Equity earnings (losses) | | | | | | | | | | | | | 637 | |
| Other investing income (loss) - net | | | | | | | | | | | | | 16 | |
| Interest expense | | | | | | | | | | | | | (1,147) | |
| Accretion expense associated with AROs for nonregulated operations | | | | | | | | | | | | | (51) | |
| Proportional Modified EBITDA of equity-method investments | | | | | | | | | | | | | (979) | |
| Income (loss) before income taxes from continuing operations | | | | | | | | | | | | | $ | 2,542 | |
| | | | | | | | | | | | | |
| Equity-method investments by reportable segment | $ | 629 | | | $ | 3,566 | | | $ | 843 | | | $ | — | | | | | | | $ | 5,038 | |
| Other equity-method investments | | | | | | | | | | | | | 10 | |
| Total equity-method investments | | | | | | | | | | | | | $ | 5,048 | |
| | | | | | | | | | | | | |
| Segment assets | $ | 17,795 | | | $ | 13,539 | | | $ | 10,710 | | | $ | 130 | | | | | | | $ | 42,174 | |
| Total current assets | | | | | | | | | | | | | 3,797 | |
| Regulatory assets, deferred charges, and noncurrent assets | | | | | | | | | | | | | 1,319 | |
| Assets of upstream operations, corporate, and other business activities | | | | | | | | | | | | | 1,143 | |
| Total assets | | | | | | | | | | | | | $ | 48,433 | |
| | | | | | | | | | | | | |
| Additions to long-lived segment assets | $ | 1,420 | | | $ | 261 | | | $ | 1,507 | | | $ | 4 | | | | | | | $ | 3,192 | |
| Additions to long-lived assets of upstream operations, corporate, and other business activities | | | | | | | | | | | | | 406 | |
| Total additions to long-lived assets | | | | | | | | | | | | | $ | 3,598 | |
_______________________
(1) As Williams is acting as agent for natural gas marketing customers or engages in energy trading activities, the resulting revenues are presented net of the related costs of those activities.
(2) Williams records transactions that qualify as commodity derivatives at fair value with changes in fair value recognized in earnings in the period of change and characterized as unrealized gains or losses. Gains and losses from commodity derivatives held for energy trading purposes are presented on a net basis in revenue.
(3) Segment operating and administrative expenses primarily include payroll, maintenance and operating costs and taxes, and general and administrative expenses, including acquisition and transition-related expenses. It also includes project execution, information technology, finance and accounting, real estate and aviation, central engineering services, safety and operational discipline, supply chain and digital transformation, corporate strategic development, human resources, legal and government affairs, and executive and audit support services costs which are centrally managed and allocated to segments.
(4) Recoverable power, transportation and storage costs are charges incurred which are reimbursable pursuant to FERC stipulations or customer contracts.
(5) Other segment income (expenses) primarily includes equity AFUDC and regulatory credits and charges related to Williams’ regulated operations.
(6) Gain on sale of business reflects a gain recognized on the sale of certain liquids pipelines in the Gulf Coast region in September 2023 (see Note 3 – Acquisitions and Divestitures).
(7) Net gain from Energy Transfer litigation judgment resulted from a favorable ruling in November 2023 (see Note 1 – General, Description of Business, Basis of Presentation, and Summary of Significant Accounting Policies).
Transco
Transco manages and evaluates its business as a single reportable segment. Transco’s chief operating decision maker is the Senior Vice President, Transmission & Gulf of America. Transco’s chief operating decision maker determines resource allocation, measures and evaluates segment operating performance based upon Net income (loss) as reported on the Statement of Net Income.
Significant expenses within net income, include Operating and maintenance expenses and Selling, general, and administrative expenses, which are each separately presented on Transco’s Statement of Net Income. Other segment items within net income include natural gas product costs, depreciation and amortization expense, taxes, other than income taxes, interest expense, interest income, other income (expense) – net, and AFUDC.
Transco’s segment assets include Property, plant, and equipment – net as presented on the Balance Sheet.
NWP
NWP manages and evaluates its business as a single reportable segment. NWP’s chief operating decision maker is the Senior Vice President, Transmission & Gulf of America. NWP’s chief operating decision maker determines resource allocation, measures and evaluates segment operating performance based upon Net income (loss) as reported on the Statement of Net Income.
Significant expenses within net income, include Operating and maintenance expenses and Selling, general, and administrative expenses, which are each separately presented on NWP’s Statement of Net Income. Other segment items within net income include depreciation and amortization expense, taxes, other than income taxes, interest expense, other income (expense) – net, and AFUDC.
NWP’s segment assets include Property, plant, and equipment – net as presented on the Balance Sheet.
Note 20 – Subsequent Events
Quarterly Dividends to Common Stockholders
On January 28, 2025, Williams’ board of directors approved a regular quarterly dividend to common stockholders of $0.500 per share payable on March 31, 2025.
Long-term Debt Issuance and Retirement
In January 2025, Williams issued $1 billion of 5.6 percent senior unsecured notes due March 15, 2035 and $500 million of 6.0 percent senior unsecured notes due March 15, 2055 (see Note 13 – Debt and Banking Arrangements). Also in January 2025, Williams retired $750 million of senior unsecured debt.
The Williams Companies, Inc.
Schedule II — Valuation and Qualifying Accounts
| | | | | | | | | | | | | | | | | | | | | | | | | | | | | |
| | | Additions | | | | |
| | Beginning
Balance | | Charged
(Credited)
To Costs and
Expenses | | Other | | Deductions | | Ending
Balance |
| | (Millions) |
| 2024 | |
| Deferred tax asset valuation allowance (1) | $ | 183 | | | $ | (92) | | | $ | — | | | $ | — | | | $ | 91 | |
| 2023 | | | | | | | | | |
| Deferred tax asset valuation allowance (1) | 200 | | | (17) | | | — | | | — | | | 183 | |
| 2022 | | | | | | | | | |
| Deferred tax asset valuation allowance (1) | 297 | | | (97) | | | — | | | — | | | 200 | |
__________
(1) Deducted from related assets.
Item 9. Changes in and Disagreements with Accountants on Accounting and Financial Disclosure
None.
Item 9A. Controls and Procedures
Williams
Disclosure Controls and Procedures
Williams’ management, including the Principal Executive Officer and Principal Financial Officer, does not expect that disclosure controls and procedures (as defined in Rules 13a - 15(e) and 15d - 15(e) of the Exchange Act) (Disclosure Controls) or internal control over financial reporting (Internal Controls) will prevent all errors and all fraud. A control system, no matter how well conceived and operated, can provide only reasonable, not absolute, assurance that the objectives of the control system are met. Further, the design of a control system must reflect the fact that there are resource constraints, and the benefits of controls must be considered relative to their costs. Because of the inherent limitations in all control systems, no evaluation of controls can provide absolute assurance that all control issues and instances of fraud, if any, within the company have been detected. These inherent limitations include the realities that judgments in decision-making can be faulty, and that breakdowns can occur because of simple errors or mistakes. Additionally, controls can be circumvented by the individual acts of some persons, by collusion of two or more people, or by management override of the control. The design of any system of controls also is based in part upon certain assumptions about the likelihood of future events, and there can be no assurance that any design will succeed in achieving its stated goals under all potential future conditions. Because of the inherent limitations in a cost-effective control system, misstatements due to error or fraud may occur and not be detected. Williams monitors the Disclosure Controls and Internal Controls and makes modifications as necessary; Williams’ intent in this regard is that the Disclosure Controls and Internal Controls will be modified as systems change and conditions warrant.
Evaluation of Disclosure Controls and Procedures
An evaluation of the effectiveness of the design and operation of Williams’ Disclosure Controls was performed as of the end of the period covered by this report. This evaluation was performed under the supervision and with the participation of management, including the Principal Executive Officer and Principal Financial Officer. Based upon that evaluation, the Principal Executive Officer and Principal Financial Officer concluded that these Disclosure Controls are effective at a reasonable assurance level.
As disclosed in Note 3 – Acquisitions and Divestitures, Williams acquired Hartree as part of the Gulf Coast Storage Acquisition on January 3, 2024. Hartree’s total revenues constituted approximately 2 percent of total revenues as shown in Williams’ consolidated financial statements for the year ended December 31, 2024. Hartree’s total assets constituted approximately 4 percent of total assets as shown in Williams’ consolidated financial statements as of December 31, 2024. Williams also acquired Crowheart on November 1, 2024, and its total revenues constituted less than 1 percent of total revenues as shown in Williams’ consolidated financial statements for the year ended December 31, 2024. Crowheart’s total assets constituted approximately 1 percent of total assets as shown in Williams’ consolidated financial statements as of December 31, 2024. Williams has excluded Hartree’s and Crowheart’s disclosure controls and procedures that are subsumed by their internal control over financial reporting from the scope of management’s assessment of the effectiveness of Williams’ disclosure controls and procedures. This exclusion is in accordance with the guidance issued by the Staff of the Securities and Exchange Commission that an assessment of recent business combinations may be omitted from management’s assessment of internal control over financial reporting for one year following the acquisition.
Changes in Internal Control Over Financial Reporting
There have been no changes during the fourth quarter of 2024 that have materially affected, or are reasonably likely to materially affect, Williams’ Internal Control over Financial Reporting.
Management’s Annual Report on Internal Control over Financial Reporting
Management is responsible for establishing and maintaining adequate internal control over financial reporting (as defined in Rules 13a - 15(f) and 15d - 15(f) under the Exchange Act). Williams’ internal control over financial reporting is designed to provide reasonable assurance to management and the board of directors regarding the preparation and fair presentation of financial statements in accordance with accounting principles generally accepted in the United States. Williams’ internal control over financial reporting includes those policies and procedures that (i) pertain to the maintenance of records that, in reasonable detail, accurately and fairly reflect the transactions and dispositions of assets; (ii) provide reasonable assurance that transactions are recorded as to permit preparation of financial statements in accordance with generally accepted accounting principles, and that receipts and expenditures are being made only in accordance with authorization of management and the board of directors; and (iii) provide reasonable assurance regarding prevention or timely detection of unauthorized acquisition, use or disposition of assets that could have a material effect on Williams’ financial statements.
All internal control systems, no matter how well designed, have inherent limitations including the possibility of human error and the circumvention or overriding of controls. Therefore, even those systems determined to be effective can provide only reasonable assurance with respect to financial statement preparation and presentation.
Under the supervision and with the participation of Williams’ management, including the Principal Executive Officer and Principal Financial Officer, Williams assessed the effectiveness of the internal control over financial reporting at December 31, 2024, based on the criteria set forth by the Committee of Sponsoring Organizations of the Treadway Commission (COSO) in Internal Control — Integrated Framework (2013). Based on the assessment, which excluded Hartree and Crowheart’s internal control over financial reporting as previously discussed, it was concluded that, at December 31, 2024, Williams’ internal control over financial reporting was effective.
Ernst & Young LLP, Williams’ independent registered public accounting firm, has audited the internal control over financial reporting, as stated in their report which is included in this Annual Report on Form 10-K.
Report of Independent Registered Public Accounting Firm
To the Stockholders and the Board of Directors of
The Williams Companies, Inc.
Opinion on Internal Control Over Financial Reporting
We have audited The Williams Companies, Inc.’s internal control over financial reporting as of December 31, 2024, based on criteria established in Internal Control-Integrated Framework issued by the Committee of Sponsoring Organizations of the Treadway Commission (2013 framework) (the COSO criteria). In our opinion, The Williams Companies, Inc. (the Company) maintained, in all material respects, effective internal control over financial reporting as of December 31, 2024, based on the COSO criteria.
As indicated in the accompanying Management’s Annual Report on Internal Control over Financial Reporting, management’s assessment of and conclusion on the effectiveness of internal control over financial reporting did not include the internal controls of Hartree Cardinal Gas, LLC, Hartree Natural Gas Storage, LLC and Crowheart Energy, LLC, which are included in the 2024 consolidated financial statements of the Company and collectively constituted approximately five percent of total assets as of December 31, 2024. Our audit of internal control over financial reporting of the Company also did not include an evaluation of the internal control over financial reporting of Hartree Cardinal Gas, LLC, Hartree Natural Gas Storage, LLC and Crowheart Energy, LLC.
We also have audited, in accordance with the standards of the Public Company Accounting Oversight Board (United States) (PCAOB), the consolidated balance sheet of the Company as of December 31, 2024 and 2023, the related consolidated statements of income, comprehensive income (loss), changes in equity and cash flows for each of the three years in the period ended December 31, 2024, and the related notes and the financial statement schedule listed in the index at Item 15(a) and our report dated February 25, 2025 expressed an unqualified opinion thereon.
Basis for Opinion
The Company’s management is responsible for maintaining effective internal control over financial reporting and for its assessment of the effectiveness of internal control over financial reporting included in the accompanying Management’s Annual Report on Internal Control over Financial Reporting. Our responsibility is to express an opinion on the Company’s internal control over financial reporting based on our audit. We are a public accounting firm registered with the PCAOB and are required to be independent with respect to the Company in accordance with the U.S. federal securities laws and the applicable rules and regulations of the Securities and Exchange Commission and the PCAOB.
We conducted our audit in accordance with the standards of the PCAOB. Those standards require that we plan and perform the audit to obtain reasonable assurance about whether effective internal control over financial reporting was maintained in all material respects.
Our audit included obtaining an understanding of internal control over financial reporting, assessing the risk that a material weakness exists, testing and evaluating the design and operating effectiveness of internal control based on the assessed risk, and performing such other procedures as we considered necessary in the circumstances. We believe that our audit provides a reasonable basis for our opinion.
Definition and Limitations of Internal Control Over Financial Reporting
A company’s internal control over financial reporting is a process designed to provide reasonable assurance regarding the reliability of financial reporting and the preparation of financial statements for external purposes in accordance with generally accepted accounting principles. A company’s internal control over financial reporting includes those policies and procedures that (1) pertain to the maintenance of records that, in reasonable detail, accurately and fairly reflect the transactions and dispositions of the assets of the company; (2) provide reasonable assurance that transactions are recorded as necessary to permit preparation of financial statements in accordance with generally accepted accounting principles, and that receipts and expenditures of the company are being made only in accordance with authorizations of management and directors of the company; and (3) provide reasonable assurance regarding prevention or timely detection of unauthorized acquisition, use, or disposition of the company’s assets that could have a material effect on the financial statements.
Because of its inherent limitations, internal control over financial reporting may not prevent or detect misstatements. Also, projections of any evaluation of effectiveness to future periods are subject to the risk that controls may become inadequate because of changes in conditions, or that the degree of compliance with the policies or procedures may deteriorate.
/s/ Ernst & Young LLP
Tulsa, Oklahoma
February 25, 2025
Transco
Disclosure Controls and Procedures
Transco’s management, including the Principal Executive Officer and Principal Financial Officer, does not expect that the disclosure controls and procedures (as defined in Rules 13a - 15(e) and 15d - 15(e) of the Exchange Act) (Disclosure Controls) or internal control over financial reporting (Internal Controls) will prevent all errors and all fraud. A control system, no matter how well conceived and operated, can provide only reasonable, not absolute, assurance that the objectives of the control system are met. Further, the design of a control system must reflect the fact that there are resource constraints, and the benefits of controls must be considered relative to their costs. Because of the inherent limitations in all control systems, no evaluation of controls can provide absolute assurance that all control issues and instances of fraud, if any, within the company have been detected. These inherent limitations include the realities that judgments in decision-making can be faulty, and that breakdowns can occur because of simple errors or mistakes. Additionally, controls can be circumvented by the individual acts of some persons, by collusion of two or more people, or by management override of the control. The design of any system of controls also is based in part upon certain assumptions about the likelihood of future events, and there can be no assurance that any design will succeed in achieving its stated goals under all potential future conditions. Because of the inherent limitations in a cost-effective control system, misstatements due to error or fraud may occur and not be detected. Transco monitors the Disclosure Controls and Internal Controls and makes modifications as necessary; Transco’s intent in this regard is that the Disclosure Controls and Internal Controls will be modified as systems change and conditions warrant.
Evaluation of Disclosure Controls and Procedures
An evaluation of the effectiveness of the design and operation of Transco’s Disclosure Controls was performed as of the end of the period covered by this report. This evaluation was performed under the supervision and with the participation of management, including the Principal Executive Officer and Principal Financial Officer. Based upon that evaluation, the Principal Executive Officer and Principal Financial Officer concluded that these Disclosure Controls are effective at a reasonable assurance level.
Changes in Internal Control Over Financial Reporting
There have been no changes during the fourth quarter of 2024 that have materially affected, or are reasonably likely to materially affect, Transco’s Internal Control over Financial Reporting.
Management’s Annual Report on Internal Control over Financial Reporting
Management is responsible for establishing and maintaining adequate internal control over financial reporting (as defined in Rules 13a - 15(f) and 15d - 15(f) under the Exchange Act). Transco’s internal control over financial reporting is designed to provide reasonable assurance to management regarding the preparation and fair presentation of financial statements in accordance with accounting principles generally accepted in the United States. Transco’s internal control over financial reporting includes those policies and procedures that (i) pertain to the maintenance of records that, in reasonable detail, accurately and fairly reflect the transactions and dispositions of assets; (ii) provide reasonable assurance that transactions are recorded as to permit preparation of financial statements in accordance with generally accepted accounting principles, and that the receipts and expenditures are being made only in accordance with authorization of management; and (iii) provide reasonable assurance regarding prevention or timely
detection of unauthorized acquisition, use or disposition of assets that could have a material effect on Transco’s financial statements.
All internal control systems, no matter how well designed, have inherent limitations including the possibility of human error and the circumvention or overriding of controls. Therefore, even those systems determined to be effective can provide only reasonable assurance with respect to financial statement preparation and presentation.
Under the supervision and with the participation of Transco’s management, including the Principal Executive Officer and Principal Financial Officer, Transco assessed the effectiveness of internal control over financial reporting at December 31, 2024, based on the criteria set forth by the Committee of Sponsoring Organizations of the Treadway Commission (COSO) in Internal Control — Integrated Framework (2013). Based on the assessment, it was concluded that, at December 31, 2024, Transco’s internal control over financial reporting was effective.
NWP
Disclosure Controls and Procedures
NWP’s management, including the Principal Executive Officer and Principal Financial Officer, does not expect that the disclosure controls and procedures (as defined in Rules 13a - 15(e) and 15d - 15(e) of the Exchange Act) (Disclosure Controls) or internal control over financial reporting (Internal Controls) will prevent all errors and all fraud. A control system, no matter how well conceived and operated, can provide only reasonable, not absolute, assurance that the objectives of the control system are met. Further, the design of a control system must reflect the fact that there are resource constraints, and the benefits of controls must be considered relative to their costs. Because of the inherent limitations in all control systems, no evaluation of controls can provide absolute assurance that all control issues and instances of fraud, if any, within the company have been detected. These inherent limitations include the realities that judgments in decision-making can be faulty, and that breakdowns can occur because of simple errors or mistakes. Additionally, controls can be circumvented by the individual acts of some persons, by collusion of two or more people, or by management override of the control. The design of any system of controls also is based in part upon certain assumptions about the likelihood of future events, and there can be no assurance that any design will succeed in achieving its stated goals under all potential future conditions. Because of the inherent limitations in a cost-effective control system, misstatements due to error or fraud may occur and not be detected. NWP monitors the Disclosure Controls and Internal Controls and makes modifications as necessary; NWP’s intent in this regard is that the Disclosure Controls and Internal Controls will be modified as systems change and conditions warrant.
Evaluation of Disclosure Controls and Procedures
An evaluation of the effectiveness of the design and operation of NWP’s Disclosure Controls was performed as of the end of the period covered by this report. This evaluation was performed under the supervision and with the participation of NWP’s management, including the Principal Executive Officer and Principal Financial Officer. Based upon that evaluation, the Principal Executive Officer and Principal Financial Officer concluded that these Disclosure Controls are effective at a reasonable assurance level.
Changes in Internal Control Over Financial Reporting
There have been no changes during the fourth quarter of 2024 that have materially affected, or are reasonably likely to materially affect, NWP’s Internal Control over Financial Reporting.
Management’s Annual Report on Internal Control over Financial Reporting
Management is responsible for establishing and maintaining adequate internal control over financial reporting (as defined in Rules 13a - 15(f) and 15d - 15(f) under the Exchange Act). NWP’s internal control over financial reporting is designed to provide reasonable assurance to management regarding the preparation and fair presentation of financial statements in accordance with accounting principles generally accepted in the United States. NWP’s internal control over financial reporting includes those policies and procedures that (i) pertain to the maintenance of records that, in reasonable detail, accurately and fairly reflect the transactions and dispositions of assets; (ii) provide
reasonable assurance that transactions are recorded as to permit preparation of financial statements in accordance with generally accepted accounting principles, and that receipts and expenditures are being made only in accordance with authorization of management; and (iii) provide reasonable assurance regarding prevention or timely detection of unauthorized acquisition, use or disposition of assets that could have a material effect on NWP’s financial statements.
All internal control systems, no matter how well designed, have inherent limitations including the possibility of human error and the circumvention or overriding of controls. Therefore, even those systems determined to be effective can provide only reasonable assurance with respect to financial statement preparation and presentation.
Under the supervision and with the participation of NWP’s management, including the Principal Executive Officer and Principal Financial Officer, NWP assessed the effectiveness of the internal control over financial reporting at December 31, 2024, based on the criteria set forth by the Committee of Sponsoring Organizations of the Treadway Commission (COSO) in Internal Control — Integrated Framework (2013). Based on the assessment, it was concluded that, at December 31, 2024, NWP’s internal control over financial reporting was effective.
Item 9B. Other Information
During the three months ended December 31, 2024, no director or officer of Williams adopted or terminated a “Rule 10b5-1 trading arrangement” or “non-Rule 10b5-1 trading arrangement,” as each term is defined in Item 408(a) of Regulation S-K.
Item 9C. Disclosure Regarding Foreign Jurisdictions that Prevent Inspections
Not applicable.
PART III
Since Transco and NWP meet the conditions set forth in General Instructions (I)(1)(a) and (b) of Form 10‑K, the information required by Items 10, 11, 12, and 13, is omitted for Transco and NWP.
Item 10. Directors, Executive Officers and Corporate Governance
The information regarding Williams’ directors and nominees for director required by Item 401 of Regulation S-K will be presented under the heading “Election of Directors” in Williams’ definitive proxy statement prepared for the solicitation of proxies in connection with its Annual Meeting of Stockholders to be held April 29, 2025, which shall be filed no later than March 19, 2025 (“Proxy Statement”), which information is incorporated by reference herein.
Information regarding Williams’ executive officers required by Item 401 of Regulation S-K is presented at the end of Part I herein and captioned “Information About Williams’ Executive Officers,” as permitted by General Instruction G(3) and the Instruction to Item 401 of Regulation S-K.
Information required by paragraphs (c)(3), (d)(4) and (d)(5) of Item 407 of Regulation S-K will be included under the heading “Questions and Answers About the Annual Meeting and Voting” and “Corporate Governance” in the Proxy Statement, which information is incorporated by reference herein.
Information regarding Williams’ insider trading policy required by Item 408 of Regulation S-K will be included under the headings “Executing on Effective Corporate Governance” and “Mitigating Risk in Williams’ Compensation Programs” in the Proxy Statement, which information is incorporated by reference herein. Williams has adopted The Williams Policy on Securities Trading (“Securities Trading Policy”) that is applicable to Williams’ directors, officers, employees, and “any other person providing services to Williams who is aware of Material Nonpublic Information relating to Williams or other public companies,” as well as “family members of persons covered by this policy, others living in their households, and entities that are directed by or subject to their influence
or control.” A copy of the Securities Trading Policy is filed as Exhibit 19.1 to this annual report on Form 10‑K. Williams complies with applicable laws, rules, regulations and listing standards when it transacts in its own securities.
Williams’ Corporate Governance Guidelines, the charters for each of Williams’ board committees, and Williams’ Code of Business Conduct applicable to all employees, including Williams’ Chief Executive Officer, Chief Financial Officer, and Chief Accounting Officer, or persons performing similar functions, are available on Williams’ Internet website at www.williams.com. Williams will provide, free of charge, a copy of Williams’ Code of Business Conduct or any of its other corporate documents listed above upon written request to Williams’ Corporate Secretary at Williams, One Williams Center, Suite 4700, Tulsa, Oklahoma 74172. We intend to disclose any amendments to or waivers, in each case, of the Code of Business Conduct on behalf of Williams’ Chief Executive Officer, Chief Financial Officer, Chief Accounting Officer, and persons performing similar functions on the corporate governance section of Williams’ Internet website at www.williams.com, promptly following the date of any such amendment or waiver.
Item 11. Executive Compensation
The information required by Item 402 and paragraphs (e)(4) and (e)(5) of Item 407 of Regulation S-K regarding executive compensation will be presented under the headings “Compensation Discussion and Analysis,” “Executive Compensation Tables and Other Information,” “Director Compensation For Fiscal Year 2024,” “Compensation and Management Development Committee Report,” and “Compensation and Management Development Committee Interlocks and Insider Participation” in the Proxy Statement, which information is incorporated by reference herein. Notwithstanding the foregoing, the information provided under the heading “Compensation and Management Development Committee Report” in the Proxy Statement is furnished and shall not be deemed to be filed for purposes of Section 18 of the Exchange Act, is not subject to the liabilities of that section and is not deemed incorporated by reference in any filing under the Securities Act.
The information required by Item 408(x) regarding policies and practices related to the grant of certain equity awards close in time to the release of material nonpublic information will be presented under the heading “Compensation Discussion and Analysis” in the Proxy Statement, which information is incorporated by reference herein.
Item 12. Security Ownership of Certain Beneficial Owners and Management and Related Stockholder Matters
The information regarding securities authorized for issuance under equity compensation plans required by Item 201(d) of Regulation S-K and the security ownership of certain beneficial owners and management required by Item 403 of Regulation S-K will be presented under the headings “Securities Authorized For Issuance Under Equity Compensation Plans” and “Security Ownership of Certain Beneficial Owners and Management” in the Proxy Statement, which information is incorporated by reference herein.
Item 13. Certain Relationships and Related Transactions, and Director Independence
The information regarding certain relationships and related transactions required by Item 404 and Item 407(a) of Regulation S-K will be presented under the heading “Election of Directors” in the Proxy Statement, which information is incorporated by reference herein.
Item 14. Principal Accountant Fees and Services
The information regarding Williams’ principal accounting fees and services required by Item 9(e) of Schedule 14A will be presented under the heading “Principal Accountant Fees and Services” in the Proxy Statement, which information is incorporated by reference herein. Fees for professional services provided by Transco and NWP’s independent registered public accounting firm in each of the last two fiscal years in each of the following categories are (in millions):
Transco
| | | | | | | | | | | |
| Year Ended December 31, |
| 2024 | | 2023 |
| Audit fees | $ | 1 | | | $ | 1 | |
| Audit-related fees | — | | | — | |
| Tax fees | — | | | — | |
| All other fees | — | | | — | |
| Total fees | $ | 1 | | | $ | 1 | |
NWP
| | | | | | | | | | | |
| Year Ended December 31, |
| 2024 | | 2023 |
| Audit fees | $ | 1 | | | $ | 1 | |
| Audit-related fees | — | | | — | |
| Tax fees | — | | | — | |
| All other fees | — | | | — | |
| Total fees | $ | 1 | | | $ | 1 | |
Fees for audit services include fees associated with the annual audit, the reviews for Transco and NWP’s quarterly reports on Form 10-Q, the reviews for other SEC and FERC filings, and accounting consultation.
As wholly owned subsidiaries of Williams, Transco and NWP do not have separate audit committees. The Williams Audit Committee is responsible for the appointment, compensation, retention, and oversight of Ernst & Young LLP (EY) as such appointment relates to Transco, NWP, and Williams’ other subsidiaries. The Williams Audit Committee is responsible for overseeing the determination of fees associated with EY’s audit of Transco and NWP’s financial statements. The Williams Audit Committee has established a policy regarding pre-approval of all audit and non-audit services provided by EY to Williams and its subsidiaries. On an ongoing basis, management presents specific projects and categories of service, including projects and categories of service relating to Transco and NWP, to the Williams Audit Committee to request advance approval. The Williams Audit Committee reviews those requests and advises management if the Williams Audit Committee approves the engagement of EY. On a periodic basis, management reports to the Williams Audit Committee regarding the actual spending for such projects and services compared to the approved amounts. The Williams Audit Committee may also delegate the authority to pre-approve audit and permitted non-audit services, excluding services related to internal control over financial reporting, to a subcommittee of one or more committee members, provided that any such pre-approvals are reported on at a subsequent Williams Audit Committee meeting.
PART IV
Item 15. Exhibits and Financial Statement Schedules
Williams
(a) 1 and 2.
| | | | | |
| Page |
| Covered by report of independent auditors (PCAOB ID: 42): | |
| |
| |
| |
| |
| |
| |
| Schedule for each year in the three-year period ended December 31, 2024: | |
| |
| |
| |
All other schedules have been omitted since the required information is not present or is not present in amounts sufficient to require submission of the schedule, or because the information required is included in the financial statements and notes thereto.
(a) 3 and (b). The exhibits listed below are filed as part of this annual report.
INDEX TO EXHIBITS
| | | | | | | | |
Exhibit
No. | | Description |
| | |
| 3.1 | — | |
| | |
| 3.2 | — | |
| | |
| 3.3 | — | |
| | |
| 3.4 | — | |
| | |
| 4.1 | — | |
| | |
| | | | | | | | |
Exhibit
No. | | Description |
| | |
| 4.2 | — | |
| | |
| 4.3 | — | Supplemental Indenture No. 3, dated March 31, 1998, among MAPCO Inc., Williams Holdings of Delaware, Inc. and Bank One Trust Company, N.A. (formerly The First National Bank of Chicago), as Trustee (filed on March 30, 1999, as Exhibit 4(J) to Williams Holdings of Delaware, Inc.’s annual report on Form 10-K for the fiscal year ended December 31, 1998 (File No. 000-20555) and incorporated herein by reference). |
| | |
| 4.4 | — | Fourth Supplemental Indenture, dated as of July 31, 1999, among Williams Holdings of Delaware, Inc., The Williams Companies, Inc. and Bank One Trust Company, N.A. (formerly The First National Bank of Chicago), as Trustee (filed on March 28, 2000, as Exhibit 4(q) to The Williams Companies, Inc.’s annual report on Form 10-K (File No. 001-04174) and incorporated herein by reference). |
| | |
| 4.5 | — | |
| | |
| 4.6 | — | |
| | |
| 4.7 | — | |
| | |
| 4.8 | — | |
| | |
| 4.9 | — | |
| | |
| 4.10 | — | |
| | |
| 4.11 | — | |
| | |
| 4.12 | — | |
| | |
| | | | | | | | |
Exhibit
No. | | Description |
| | |
| 4.13 | — | |
| | |
| 4.14 | — | |
| | |
| 4.15 | — | |
| | |
| 4.16 | — | |
| | |
| 4.17 | — | |
| | |
| 4.18 | — | |
| | |
| 4.19 | — | |
| | |
| 4.20 | — | |
| | |
| 4.21 | — | |
| | |
| 4.22 | — | |
| | |
| 4.23 | — | |
| | |
| | | | | | | | |
Exhibit
No. | | Description |
| | |
| 4.24 | — | |
| | |
| 4.25 | — | |
| | |
| 4.26 | — | |
| | |
| 4.27 | — | |
| | |
| 4.28 | — | |
| | |
| 4.29 | — | |
| | |
| 4.30 | — | |
| | |
| 4.31 | — | |
| | |
| 4.32 | — | |
| | |
| 4.33 | — | |
| | |
| 4.34 | — | |
| | |
| 4.35 | — | |
| | |
| | | | | | | | |
Exhibit
No. | | Description |
| | |
| 4.36 | — | |
| | |
| 4.37 | — | |
| | |
| 4.38 | — | |
| | |
| 4.39 | — | |
| | |
| 4.40 | — | |
| | |
| 4.41 | — | |
| | |
| 4.42 | — | |
| | |
| 10.1§ | — | |
| | |
| 10.2§ | — | |
| | |
| 10.3§ | — | |
| | |
| 10.4§ | — | |
| | |
| 10.5§ | — | |
| | |
| 10.6§ | — | |
| | |
| 10.7§ | — | |
| | |
| | | | | | | | |
Exhibit
No. | | Description |
| | |
| 10.8§ | — | |
| | |
| 10.9§ | — | |
| | |
| 10.10§ | — | |
| | |
| 10.11§ | — | |
| | |
| 10.12 | — | |
| | |
| 10.13§ | — | |
| | |
| 10.14§ | — | |
| | |
| 10.15§ | — | |
| | |
| 10.16§ | — | |
| | |
| 10.17§ | — | |
| | |
| 10.18§ | — | |
| | |
| 10.19§ | — | |
| | |
| 10.20§ | — | |
| | |
| | | | | | | | |
Exhibit
No. | | Description |
| | |
| 10.21§ | — | |
| | |
| 10.22§ | — | |
| | |
| 10.23§ | — | |
| | |
| 10.24§ | — | |
| | |
| 10.25§ | — | |
| | |
| 10.26§ | — | |
| | |
| 10.27§ | — | |
| | |
| 10.28§ | — | |
| | |
| 10.29 | — | Amended and Restated Credit Agreement dated as of October 8, 2021, between The Williams Companies, Inc., Northwest Pipeline LLC, and Transcontinental Gas Pipe Line Company, LLC, as borrowers, the lenders named therein, and Wells Fargo Bank, National Association, as Administrative Agent (filed on October 8, 2021, as Exhibit 10.1 to The Williams Companies, Inc.’s current report on Form 8-K (File No. 001-04174) and incorporated herein by reference). |
| | |
| 10.30 | — | |
| | |
| 19.1* | — | |
| | |
| 21* | — | |
| | |
| 23.1* | — | |
| | |
| 31.1* | — | |
| | |
| | | | | | | | |
Exhibit
No. | | Description |
| | |
| 31.2* | — | |
| | |
| 32.1** | — | |
| | |
| 97.1 | — | |
| | |
| 101.INS* | — | XBRL Instance Document. The instance document does not appear in the Interactive Data File because its XBRL tags are embedded within the inline XBRL document. |
| | |
| 101.SCH* | — | XBRL Taxonomy Extension Schema. |
| | |
| 101.CAL* | — | XBRL Taxonomy Extension Calculation Linkbase. |
| | |
| 101.DEF* | — | XBRL Taxonomy Extension Definition Linkbase. |
| | |
| 101.LAB* | — | XBRL Taxonomy Extension Label Linkbase. |
| | |
| 101.PRE* | — | XBRL Taxonomy Extension Presentation Linkbase. |
| | |
| 104* | — | Cover Page Interactive Data File. The cover page interactive data file does not appear in the interactive data file because its XBRL tags are embedded within the inline XBRL document (contained in Exhibit 101). |
| | | | | |
| ______________ |
| * | Filed herewith |
| ** | Furnished herewith |
| § | Management contract or compensatory plan or arrangement |
Transco
(a) 1 and 2.
| | | | | |
| Page |
| Covered by report of independent auditors (PCAOB ID: 42): | |
| |
| |
| |
| |
| |
All other schedules have been omitted since the required information is not present or is not present in amounts sufficient to require submission of the schedule, or because the information required is included in the financial statements and notes thereto.
(a) 3 and (b). The exhibits listed below are filed as part of this annual report.
INDEX TO EXHIBITS
| | | | | | | | |
Exhibit
No. | | Description |
| | |
| 2 | — | |
| | |
| 3.5 | — | |
| | |
| 3.6 | — | |
| | |
| 4.43 | — | |
| | |
| 4.44 | — | |
| | |
| 4.45 | — | |
| | |
| 4.46 | — | |
| | |
| 4.7 | — | |
| | | | | | | | |
Exhibit
No. | | Description |
| | |
| | |
| 4.48 | — | |
| | |
| 10.31 | — | |
| | |
| 10.32 | — | |
| | |
| 10.33 | — | Amended and Restated Credit Agreement dated as of October 8, 2021 between The Williams Companies, Inc., Northwest Pipeline LLC, and Transcontinental Gas Pipeline Company, LLC, as co-borrowers, the lenders named therein, and Wells Fargo Bank, National Association, as Administrative Agent (filed on October 8, 2021 as Exhibit 10.1 to The Williams Companies, Inc.’s Current Report on Form 8-K (File No. 001-04174) and incorporated herein by reference). |
| | |
| 31.3* | — | |
| | |
| 31.4* | — | |
| | |
| 32.2** | — | |
| | |
| 101.INS* | — | XBRL Instance Document. The instance document does not appear in the Interactive Data File because its XBRL tags are embedded within the inline XBRL document. |
| | |
| 101.SCH* | — | XBRL Taxonomy Extension Schema. |
| | |
| 101.CAL* | — | XBRL Taxonomy Extension Calculation Linkbase. |
| | |
| 101.DEF* | — | XBRL Taxonomy Extension Definition Linkbase. |
| | |
| 101.LAB* | — | XBRL Taxonomy Extension Label Linkbase. |
| | |
| 101.PRE* | — | XBRL Taxonomy Extension Presentation Linkbase. |
| | |
| 104* | — | Cover Page Interactive Data File. The cover page interactive data file does not appear in the interactive data file because its XBRL tags are embedded within the inline XBRL document (contained in Exhibit 101). |
| | | | | |
| ______________ |
| * | Filed herewith |
| ** | Furnished herewith |
NWP
(a) 1 and 2.
| | | | | |
| Page |
| Covered by report of independent auditors (PCAOB ID: 42): | |
| |
| |
| |
| |
| |
All other schedules have been omitted since the required information is not present or is not present in amounts sufficient to require submission of the schedule, or because the information required is included in the financial statements and notes thereto.
(a) 3 and (b). The exhibits listed below are filed as part of this annual report.
INDEX TO EXHIBITS
| | | | | | | | |
Exhibit
No. | | Description |
| | |
| 2.1 | — | |
| | |
| 3.7 | — | |
| | |
| 3.8 | — | |
| | |
| 4.49 | — | |
| | |
| 4.50 | — | |
| | |
| 10.34 | — | |
| | |
| 10.35 | — | |
| | |
| 10.36 | — | Amended and Restated Credit Agreement dated as of October 8, 2021 between The Williams Companies, Inc., Northwest Pipeline LLC, and Transcontinental Gas Pipeline Company, LLC, as borrowers, the lenders named therein, and Wells Fargo Bank, National Association, as Administrative Agent (filed on October 8, 2021 as Exhibit 10.1 to The Williams Companies, Inc.’s current report on Form 8-K (File No. 001-04174) and incorporated herein by reference). |
| | |
| | | | | | | | |
Exhibit
No. | | Description |
| | |
| 31.5* | — | |
| | |
| 31.6* | — | |
| | |
| 32.3** | — | |
| | |
| 101.INS* | — | XBRL Instance Document. The instance document does not appear in the Interactive Data File because its XBRL tags are embedded within the inline XBRL document. |
| | |
| 101.SCH* | — | XBRL Taxonomy Extension Schema. |
| | |
| 101.CAL* | — | XBRL Taxonomy Extension Calculation Linkbase. |
| | |
| 101.DEF* | — | XBRL Taxonomy Extension Definition Linkbase. |
| | |
| 101.LAB* | — | XBRL Taxonomy Extension Label Linkbase. |
| | |
| 101.PRE* | — | XBRL Taxonomy Extension Presentation Linkbase. |
| | |
| 104* | — | Cover Page Interactive Data File. The cover page interactive data file does not appear in the interactive data file because its XBRL tags are embedded within the inline XBRL document (contained in Exhibit 101). |
| | | | | |
| ______________ |
| * | Filed herewith |
| ** | Furnished herewith |
Item 16. Form 10-K Summary
Not applicable.
The Williams Companies, Inc.
SIGNATURES
Pursuant to the requirements of Section 13 or 15(d) of the Securities Exchange Act of 1934, the registrant has duly caused this report to be signed on its behalf by the undersigned, thereunto duly authorized.
| | | | | | | | |
THE WILLIAMS COMPANIES, INC. (Registrant) |
| | |
| By: | | /s/ MARY A. HAUSMAN |
| | Mary A. Hausman Vice President, Chief Accounting Officer and Controller |
Date: February 25, 2025
Pursuant to the requirements of the Securities Exchange Act of 1934, this report has been signed below by the following persons on behalf of the registrant and in the capacities and on the dates indicated.
| | | | | | | | | | | | | | |
| Signature | | Title | | Date |
| | | | |
| /s/ ALAN S. ARMSTRONG | | President, Chief Executive Officer and Director | | February 25, 2025 |
| Alan S. Armstrong | | (Principal Executive Officer) | | |
| | | | |
| /s/ JOHN D. PORTER | | Senior Vice President and Chief Financial Officer | | February 25, 2025 |
| John D. Porter | | (Principal Financial Officer) | | |
| | | | |
| /s/ MARY A. HAUSMAN | | Vice President, Chief Accounting Officer and Controller | | February 25, 2025 |
| Mary A. Hausman | | (Principal Accounting Officer) | | |
| | | | |
| /s/ STEPHEN W. BERGSTROM | | Chairman of the Board | | February 25, 2025 |
| Stephen W. Bergstrom | | | | |
| | | | |
| /s/ MICHAEL A. CREEL | | Director | | February 25, 2025 |
| Michael A. Creel | | | | |
| | | | |
| /s/ STACEY H. DORÉ | | Director | | February 25, 2025 |
| Stacey H. Doré | | | | |
| | | | |
| /s/ CARRI A. LOCKHART | | Director | | February 25, 2025 |
| Carri A. Lockhart | | | | |
| | | | |
| /s/ RICHARD E. MUNCRIEF | | Director | | February 25, 2025 |
| Richard E. Muncrief | | | | |
| | | | |
| /s/ PETER A. RAGAUSS | | Director | | February 25, 2025 |
| Peter A. Ragauss | | | | |
| | | | |
| | | | |
| | | | |
| | | | |
| /s/ ROSE M. ROBESON | | Director | | February 25, 2025 |
| Rose M. Robeson | | | | |
| | | | |
| | | | | | | | | | | | | | |
| Signature | | Title | | Date |
| | | | |
| /s/ SCOTT D. SHEFFIELD | | Director | | February 25, 2025 |
| Scott D. Sheffield | | | | |
| | | | |
| /s/ MURRAY D. SMITH | | Director | | February 25, 2025 |
| Murray D. Smith | | | | |
| | | | |
| /s/ WILLIAM H. SPENCE | | Director | | February 25, 2025 |
| William H. Spence | | | | |
| | | | |
| /s/ JESSE J. TYSON | | Director | | February 25, 2025 |
| Jesse J. Tyson | | | | |
Transcontinental Gas Pipe Line Company, LLC
SIGNATURES
Pursuant to the requirements of Section 13 or 15(d) of the Securities Exchange Act of 1934, the registrant has duly caused this report to be signed on its behalf by the undersigned, thereunto duly authorized.
| | | | | | | | |
TRANSCONTINENTAL GAS PIPE LINE COMPANY, LLC (Registrant) |
| | |
| By: | | /s/ BILLEIGH W. MARK |
| | Billeigh W. Mark Controller |
Date: February 25, 2025
Pursuant to the requirements of the Securities Exchange Act of 1934, this report has been signed below by the following persons on behalf of the registrant and in the capacities and on the dates indicated.
| | | | | | | | | | | | | | |
| Signature | | Title | | Date |
| | | | |
| /s/ CHAD A. TEPLY | | Management Committee Member and Senior Vice President | | February 25, 2025 |
| Chad A. Teply | | (Principal Executive Officer) | | |
| | | | |
| /s/ MARY A. HAUSMAN | | Vice President and Chief Accounting Officer | | February 25, 2025 |
| Mary A. Hausman | | (Principal Financial Officer) | | |
| | | | |
| /s/ BILLEIGH W. MARK | | Controller | | February 25, 2025 |
| Billeigh W. Mark | | (Principal Accounting Officer) | | |
Northwest Pipeline LLC
SIGNATURES
Pursuant to the requirements of Section 13 or 15(d) of the Securities Exchange Act of 1934, the registrant has duly caused this report to be signed on its behalf by the undersigned, thereunto duly authorized.
| | | | | | | | |
NORTHWEST PIPELINE LLC (Registrant) |
| | |
| By: | | /s/ BILLEIGH W. MARK |
| | Billeigh W. Mark Controller |
Date: February 25, 2025
Pursuant to the requirements of the Securities Exchange Act of 1934, this report has been signed below by the following persons on behalf of the registrant and in the capacities and on the dates indicated.
| | | | | | | | | | | | | | |
| Signature | | Title | | Date |
| | | | |
| /s/ CHAD A. TEPLY | | Management Committee Member and Senior Vice President | | February 25, 2025 |
| Chad A. Teply | | (Principal Executive Officer) | | |
| | | | |
| /s/ MARY A. HAUSMAN | | Vice President and Chief Accounting Officer | | February 25, 2025 |
| Mary A. Hausman | | (Principal Financial Officer) | | |
| | | | |
| /s/ BILLEIGH W. MARK | | Controller | | February 25, 2025 |
| Billeigh W. Mark | | (Principal Accounting Officer) | | |