|
Exhibit 99.1 
|
Howard Weil Energy Conference
Alan Armstrong, Chief Executive Officer
March 25, 2014
Forward-looking statements
The reports, filings, and other public announcements of The Williams Companies, Inc. (Williams) and Williams Partners L.P. (W PZ) may contain or incorporate by reference statements that do not directly or exclusively relate to historical facts. Such statements are “forward-looking statements” within the meaning of Section 27A of the Securities Act of 1933, as amended, and Section 21E of the Securities Exchange Act of 1934, as amended. We make these forward-looking statements in reliance on the safe harbor protections provided under the Private Securities Litigation Reform Act of 1995. You typically can identify forward-looking statements by various forms of words such as “anticipates,” “believes,” “seeks,” “could,” “may,” “should,” “continues,” “estimates,” “expects,” “forecasts,” “intends,” “might,” “goals,” “objectives,” “targets,” “planned,” “potential,” “projects,” “scheduled,” “will,” “assumes,” “guidance,” “outlook,” “in service date” or other similar expressions. These forward-looking statements are based on management’s beliefs and assumptions and on information currently available to management and include, among others, statements regarding:
Amounts and nature of future capital expenditures; Expansion and growth of our business and operations; Financial condition and liquidity; Business strategy; Cash flow from operations or results of operations;
The levels of dividends to Williams stockholders and of cash distributions to WPZ unitholders; Natural gas, natural gas liquids, and olefins prices, supply, and demand; and Demand for our services.
Forward-looking statements are based on numerous assumptions, uncertainties and risks that could cause future events or results to be materially different from those stated or implied in this presentation. Many of the factors that will determine these results are beyond our ability to control or predict. Specific factors that could cause actual results to differ from results contemplated by the forward-looking statements include, among others, the following:
Whether Williams has sufficient cash to enable it to pay current and expected levels of dividends;
Whether WPZ has sufficient cash from operations to enable it to pay current and expected levels of cash distributions, if any, following establishment of cash reserves and payment of fees and expenses, including payments to WPZ’s general partner;
Availability of supplies, market demand, and volatility of prices;
Inflation, interest rates, and fluctuation in foreign exchange rates and general economic conditions (including future disruptions and volatility in the global credit markets and the impact of these events on our customers and suppliers); The strength and financial resources of our competitors and the effects of competition;
© 2014 The Williams Companies, Inc. All rights reserved.
2 Howard Weil Energy Conference | 3/25/14
Forward-looking statements continued
Whether we are able to successfully identify, evaluate and execute investment opportunities;
Ability to acquire new businesses and assets and successfully integrate those operations and assets into our existing businesses, as well as successfully expand our facilities; Development of alternative energy sources; The impact of operational and development hazards and unforeseen interruptions; Costs of, changes in, or the results of laws, government regulations (including safety and environmental regulations), environmental liabilities, litigation, and rate proceedings;
Williams’ costs and funding obligations for defined benefit pension plans and other postretirement benefit plans sponsored by its affiliates; WPZ’s allocated costs for defined benefit pension plans and other post retirement benefit plans sponsored by its affiliates;
Changes in maintenance and construction costs; Changes in the current geopolitical situation;
Our exposure to the credit risk of our customers and counterparties;
Risks related to financing, including restrictions stemming from our debt agreements, future changes in our credit ratings and the availability and cost of capital; The amount of cash distributions from and capital requirements of our investments and joint ventures in which we participate; Risks associated with weather and natural phenomena, including climate conditions; Acts of terrorism, including cybersecurity threats and related disruptions; and Additional risks described in our filings with the Securities and Exchange Commission (SEC).
Given the uncertainties and risk factors that could cause our actual results to differ materially from those contained in any forward-looking statement, we caution investors not to unduly rely on our forward-looking statements. We disclaim any obligations to and do not intend to update the above list or to announce publicly the result of any revisions to any of the forward-looking statements to reflect future events or developments.
In addition to causing our actual results to differ, the factors listed above may cause our intentions to change from those statements of intention set forth in this announcement. Such changes in our intentions may also cause our results to differ. We may change our intentions, at any time and without notice, based upon changes in such factors, our assumptions, or otherwise.
With respect to WPZ, limited partner interests are inherently different from the capital stock of a corporation, although many of the business risks to which WPZ is subject are similar to those that would be faced by a corporation engaged in a similar business.
Investors are urged to closely consider the disclosures and risk factors in Williams’ and WPZ’s annual reports on Form 10-K filed with the SEC on Feb. 26, 2014, and each of our quarterly reports on Form 10-Q available from our offices or from our websites at www.williams.com and www.williamslp.com.
© 2014 The Williams Companies, Inc. All rights reserved.
3 Howard Weil Energy Conference | 3/25/14
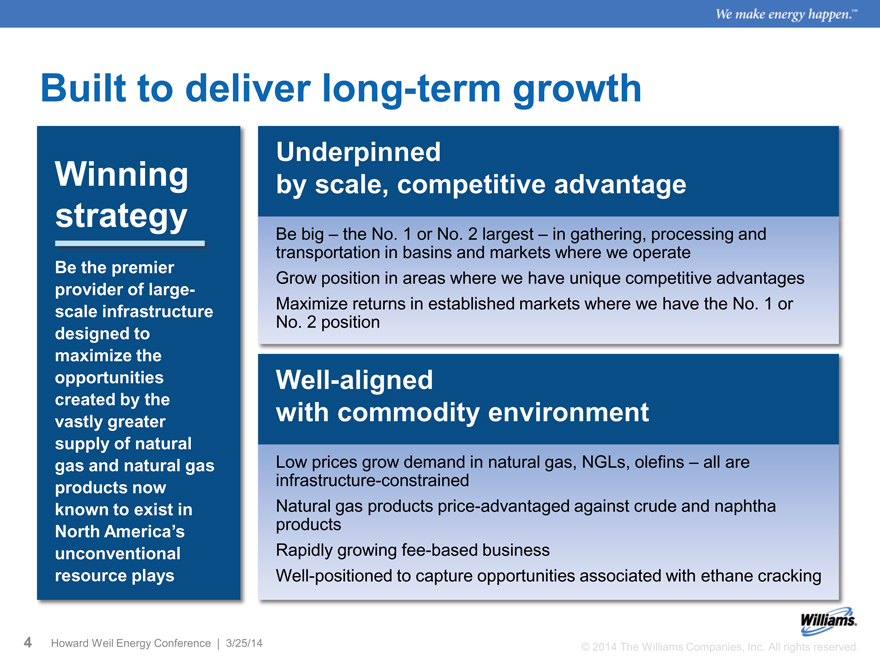
Built to deliver long-term growth
Winning strategy
Be the premier provider of large-scale infrastructure designed to maximize the opportunities created by the vastly greater supply of natural gas and natural gas products now known to exist in
North America’s unconventional
Underpinned by scale, competitive advantage
Be big – the No. 1 or No. 2 largest – in gathering, processing and transportation in basins and markets where we operate Grow position in areas where we have unique competitive advantages Maximize returns in established markets where we have the No. 1 or No. 2 position
Well-aligned with commodity environment
Low prices grow demand in natural gas, NGLs, olefins – all are infrastructure-constrained Natural gas products price-advantaged against crude and naphtha products Rapidly growing fee-based business Well-positioned to capture opportunities associated with ethane cracking
© 2014 The Williams Companies, Inc. All rights reserved.
4 Howard Weil Energy Conference | 3/25/14
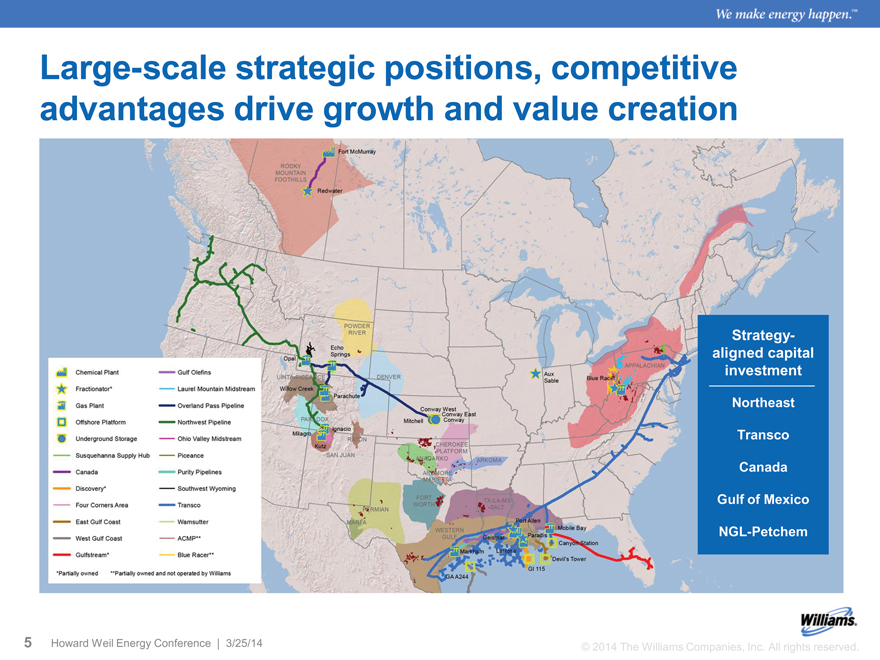
Large-scale strategic positions, competitive advantages drive growth and value creation
Strategy-aligned capital investment
Northeast Transco Canada Gulf of Mexico NGL-Petchem
© 2014 The Williams Companies, Inc. All rights reserved.
5 Howard Weil Energy Conference | 3/25/14
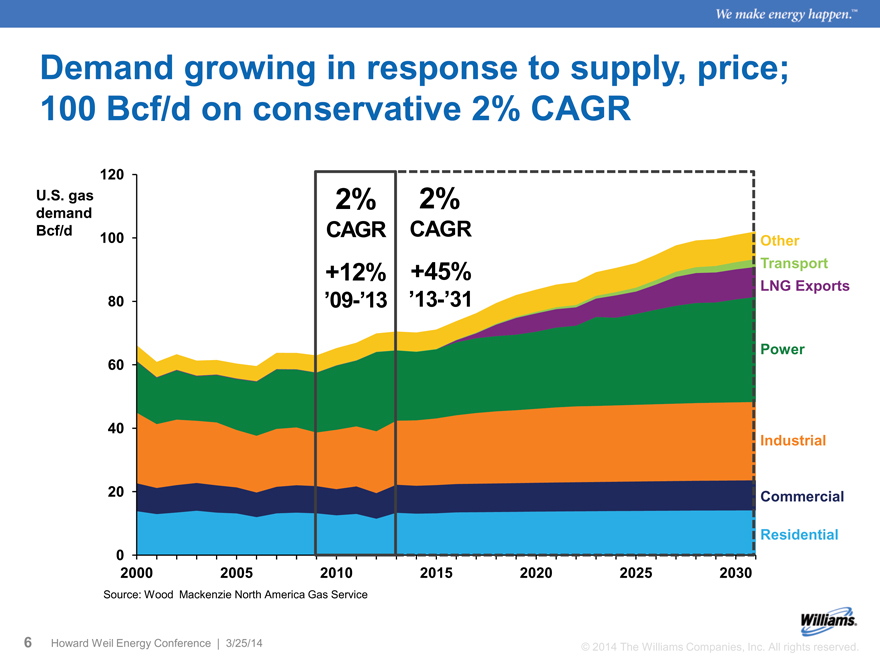
Demand growing in response to supply, price;
100 Bcf/d on conservative 2% CAGR
U.S. gas demand Bcf/d
2%
CAGR
+12%
’09-’13
2%
CAGR
+45%
’13-’31
Other Transport LNG Exports
Power
Industrial
Commercial
Residential
120 100 80 60 40 20 0
2000 2005 2010 2015 2020 2025 2030
Source: Wood Mackenzie North America Gas Service
© 2014 The Williams Companies, Inc. All rights reserved.
6 Howard Weil Energy Conference | 3/25/14
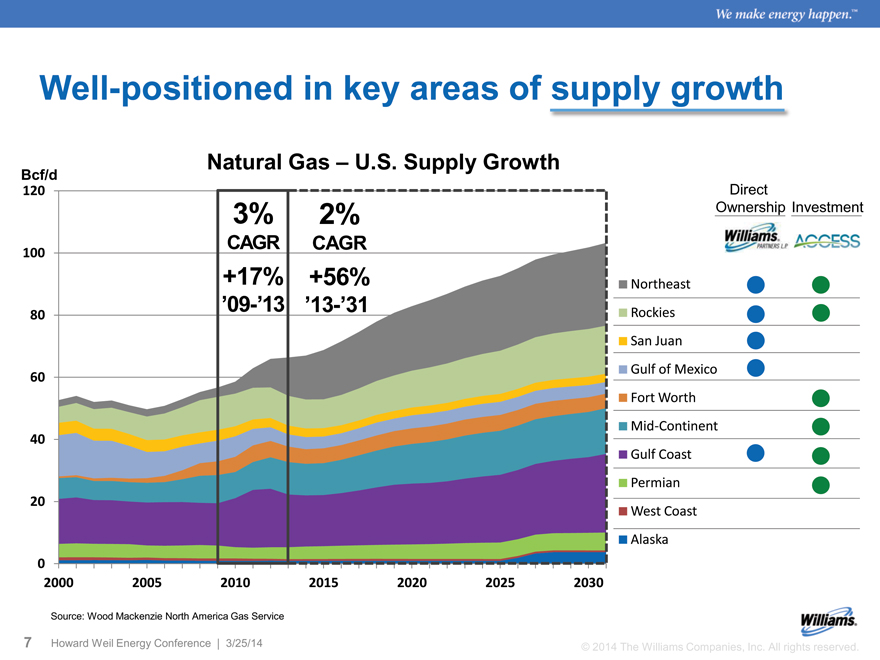
Well-positioned in key areas of supply growth
Direct
Ownership Investment
Northeast
Rockies
San Juan
Gulf of Mexico
Fort Worth
Mid-Continent
Gulf Coast
Permian
West Coast
Alaska
Natural Gas – U.S. Supply Growth
Bcf/d
120
3% 2%
100 CAGR CAGR
+17% +56%
80 ’09-’13 ’13-’31
60
40
20
0
2000 2005 2010 2015 2020 2025 2030
Source: Wood Mackenzie North America Gas Service
© 2014 The Williams Companies, Inc. All rights reserved.
7 Howard Weil Energy Conference | 3/25/14
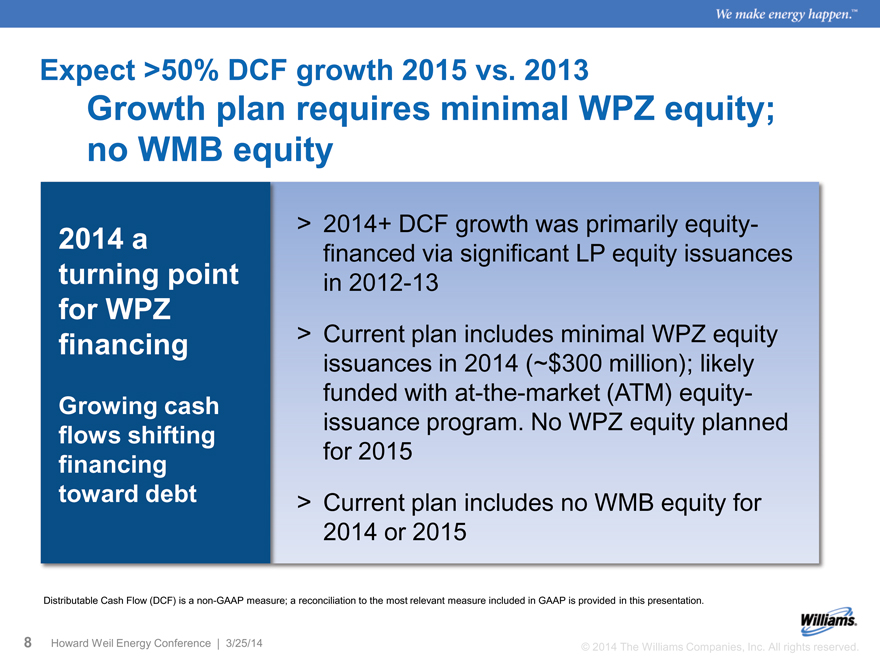
Expect >50% DCF growth 2015 vs. 2013
Growth plan requires minimal WPZ equity; no WMB equity
2014 a > 2014+ DCF growth was primarily equity-
financed via significant LP equity issuances
turning point in 2012-13
for WPZ
financing > Current plan includes minimal WPZ equity
issuances in 2014 (~$300 million); likely
Growing cash funded with at-the-market (ATM) equity-
flows shifting issuance program. No WPZ equity planned
financing for 2015
toward debt > Current plan includes no WMB equity for
2014 or 2015
Distributable Cash Flow (DCF) is a non-GAAP measure; a reconciliation to the most relevant measure included in GAAP is provided in this presentation.
8 Howard Weil Energy Conference | 3/25/14 © 2014 The Williams Companies, Inc. All rights reserved.
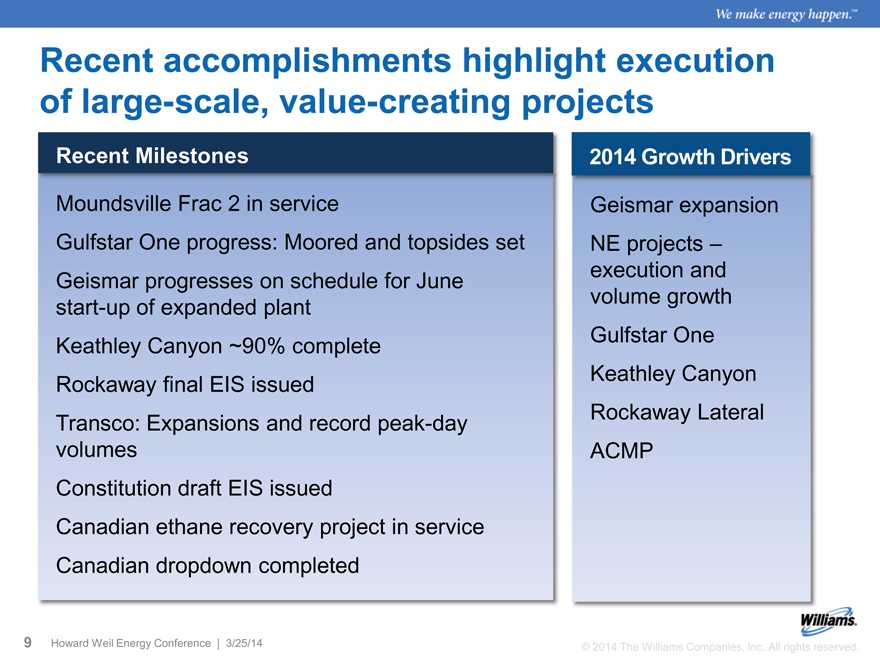
Recent accomplishments highlight execution of large-scale, value-creating projects
Recent Milestones 2014 Growth Drivers
Moundsville Frac 2 in service Geismar expansion
Gulfstar One progress: Moored and topsides set NE projects –
Geismar progresses on schedule for June execution and
start-up of expanded plant volume growth
Keathley Canyon ~90% complete Gulfstar One
Rockaway final EIS issued Keathley Canyon
Transco: Expansions and record peak-day Rockaway Lateral
volumes ACMP
Constitution draft EIS issued
Canadian ethane recovery project in service
Canadian dropdown completed
9 Howard Weil Energy Conference | 3/25/14 © 2014 The Williams Companies, Inc. All rights reserved.
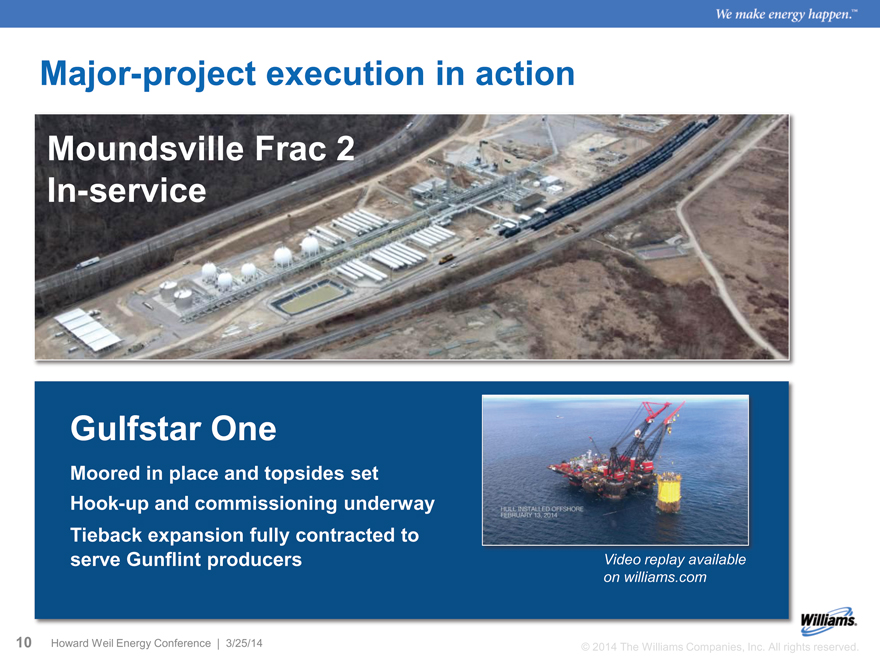
Major-project execution in action
Moundsville Frac 2
In-service
Gulfstar One
Moored in place and topsides set Hook-up and commissioning underway Tieback expansion fully contracted to serve Gunflint producers
Video replay available on williams.com
10 Howard Weil Energy Conference | 3/25/14 © 2014 The Williams Companies, Inc. All rights reserved.
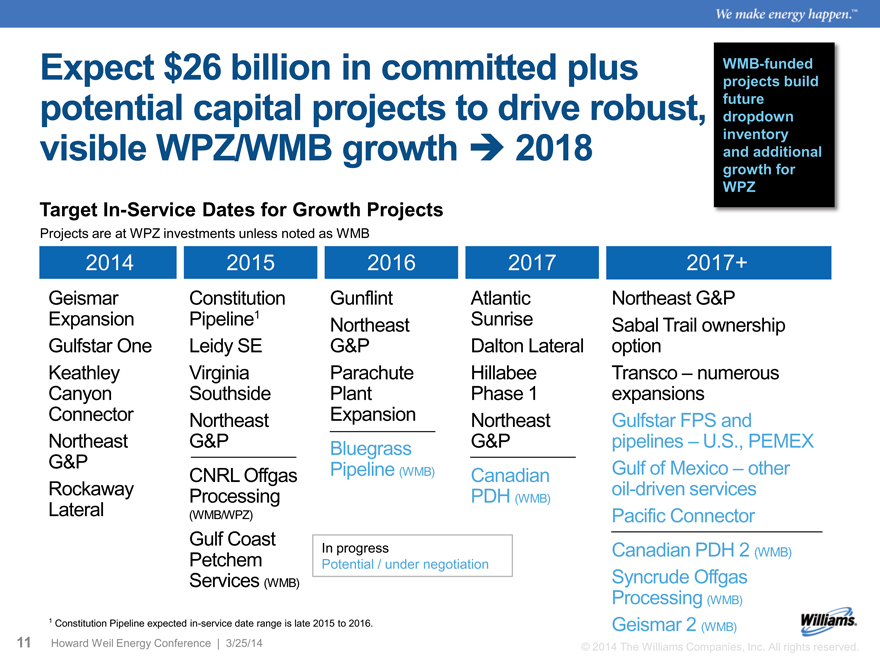
Expect $26 billion in committed plus potential capital projects to drive robust, visible WPZ/WMB growth 2018
Target In-Service Dates for Growth Projects
Projects are at WPZ investments unless noted as WMB
2014 2015 2016 2017 2017+
Geismar Constitution Gunflint Atlantic Northeast G&P
Expansion Pipeline1 Northeast Sunrise Sabal Trail ownership
Gulfstar One Leidy SE G&P Dalton Lateral option
Keathley Virginia Parachute Hillabee Transco – numerous
Canyon Southside Plant Phase 1 expansions
Connector Northeast Expansion Northeast Gulfstar FPS and
Northeast G&P Bluegrass G&P pipelines – U.S., PEMEX
G&P Pipeline Gulf of Mexico – other
CNRL Offgas (WMB) Canadian
Rockaway Processing PDH (WMB) oil-driven services
Lateral (WMB/WPZ) Pacific Connector
Gulf Coast In progress Canadian PDH 2 (WMB)
Petchem Potential / under negotiation
Services (WMB) Syncrude Offgas
Processing (WMB)
1 Constitution Pipeline expected in-service date range is late 2015 to 2016. Geismar 2 (WMB)
11 Howard Weil Energy Conference | 3/25/14 © 2014 The Williams Companies, Inc. All rights reserved.
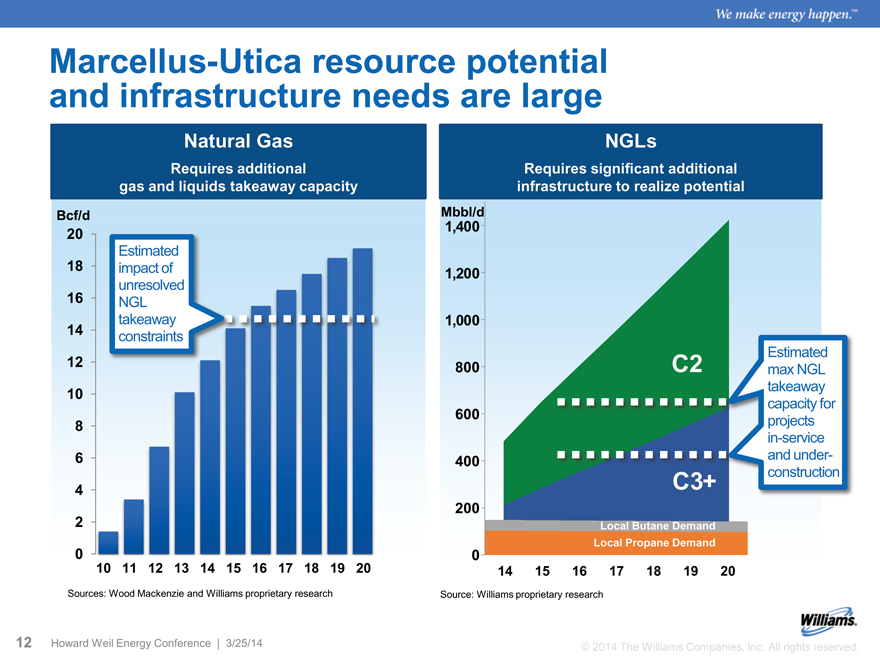
Marcellus-Utica resource potential and infrastructure needs are large
Natural Gas NGLs
Requires additional Requires significant additional
gas and liquids takeaway capacity infrastructure to realize potential
Bcf/d
20
Estimated
18 impact of
unresolved
16 NGL
takeaway
14 constraints
12
10
8
6
4
2
0
10 11 12 13 14 15 16 17 18 19 20
Mbbl/d
1,400
1,200
1,000
Estimated
800 C2 max NGL
takeaway
capacity for
600 projects
in-service
400 and under-
C3+ construction
200
Local Butane Demand
Local Propane Demand
0
Sources: Wood Mackenzie and Williams proprietary research Source: Williams proprietary research
12 Howard Weil Energy Conference | 3/25/14 © 2014 The Williams Companies, Inc. All rights reserved.
Northeast G&P’s rapid growth prospects
Large acreage dedications and enormous potential
WPZ gathering volumes up 64% 2013 vs. 2012
Partners and Investments
Proposed NGL pipeline
Note: Map does not depict ACMP positions.
13 Howard Weil Energy Conference | 3/25/14
Atlantic Sunrise path to Station 85
Gross Dedicated Acres
Laurel Mtn Midstream 500,000
ACMP – Marcellus 1,700,000
Ohio Valley Midstream 236,000
Susquehanna 150,000
Three Rivers JV 275,000
Total Marcellus 2,861,000
ACMP – Utica 1,846,000
Blue Racer JV - Utica >300,000
Total Utica >2,146,000
Total Marcellus + >5,007,000
Utica
Assets at 12/31/13
WPZ Northeast G&P $ 6.2 billion
Capex Guidance ’14-’15
Northeast G&P Capex $ 1.8 billion
Atlantic – Gulf Capex $ 1.5 billion
© 2014 The Williams Companies, Inc. All rights reserved.
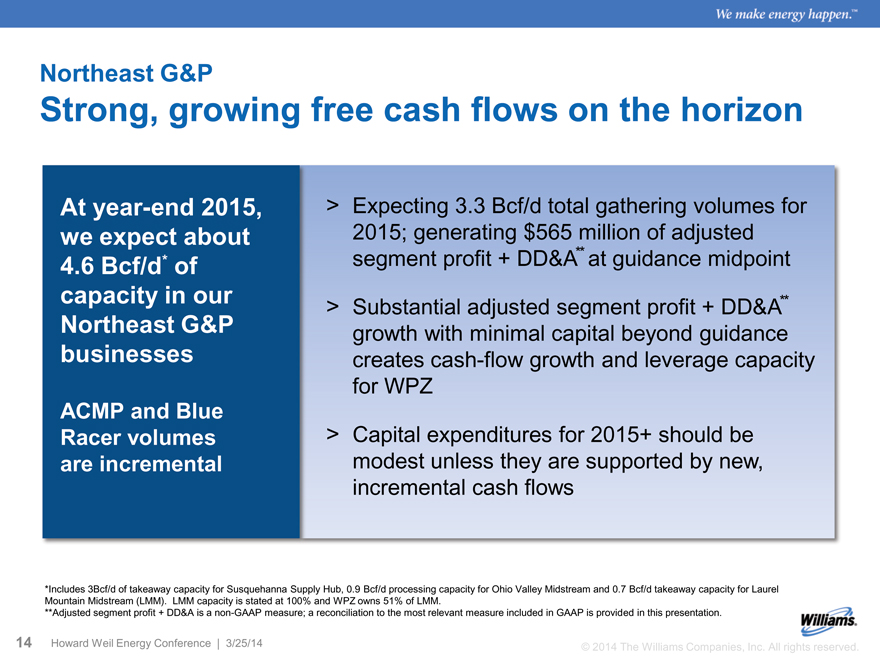
Northeast G&P
Strong, growing free cash flows on the horizon
At year-end 2015, > Expecting 3.3 Bcf/d total gathering volumes for
we expect about 2015; generating $565 million of adjusted
4.6 Bcf/d* of segment profit + DD&A** at guidance midpoint
capacity in our > Substantial adjusted segment profit + DD&A**
Northeast G&P growth with minimal capital beyond guidance
businesses creates cash-flow growth and leverage capacity
for WPZ
ACMP and Blue
Racer volumes > Capital expenditures for 2015+ should be
are incremental modest unless they are supported by new,
incremental cash flows
*Includes 3Bcf/d of takeaway capacity for Susquehanna Supply Hub, 0.9 Bcf/d processing capacity for Ohio Valley Midstream and 0.7 Bcf/d takeaway capacity for Laurel Mountain Midstream (LMM). LMM capacity is stated at 100% and WPZ owns 51% of LMM.
**Adjusted segment profit + DD&A is a non-GAAP measure; a reconciliation to the most relevant measure included in GAAP is provided in this presentation.
14 Howard Weil Energy Conference | 3/25/14 © 2014 The Williams Companies, Inc. All rights reserved.
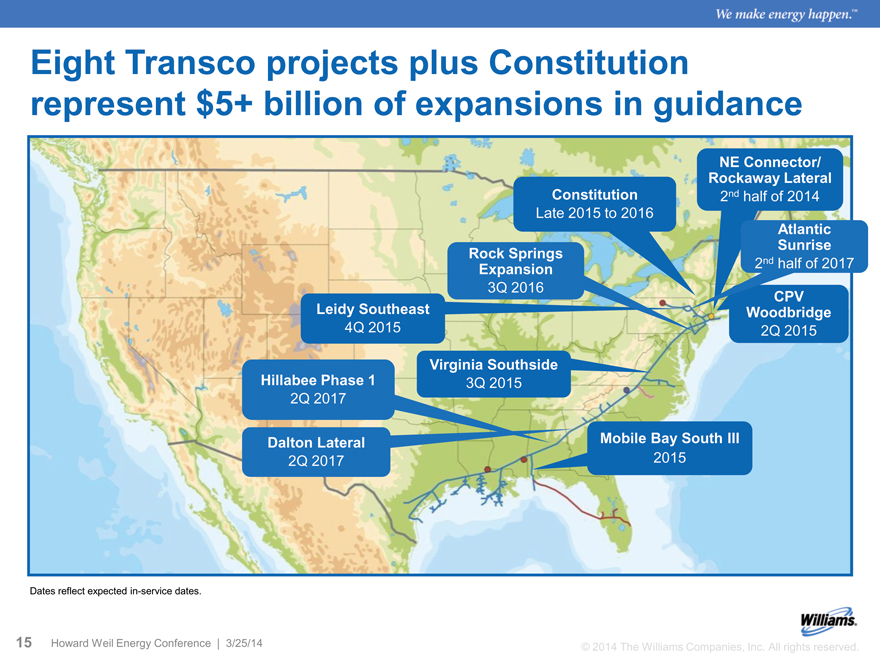
Eight Transco projects plus Constitution represent $5+ billion of expansions in guidance
NE Connector/
Rockaway Lateral
Constitution 2nd half of 2014
Late 2015 to 2016
Atlantic
Rock Springs Sunrise
Expansion 2nd half of 2017
3Q 2016 CPV
Leidy Southeast Woodbridge
4Q 2015 2Q 2015
Virginia Southside
Hillabee Phase 1 3Q 2015
2Q 2017
Dalton Lateral Mobile Bay South III
2Q 2017 2015
Dates reflect expected in-service dates.
15 Howard Weil Energy Conference | 3/25/14 © 2014 The Williams Companies, Inc. All rights reserved.
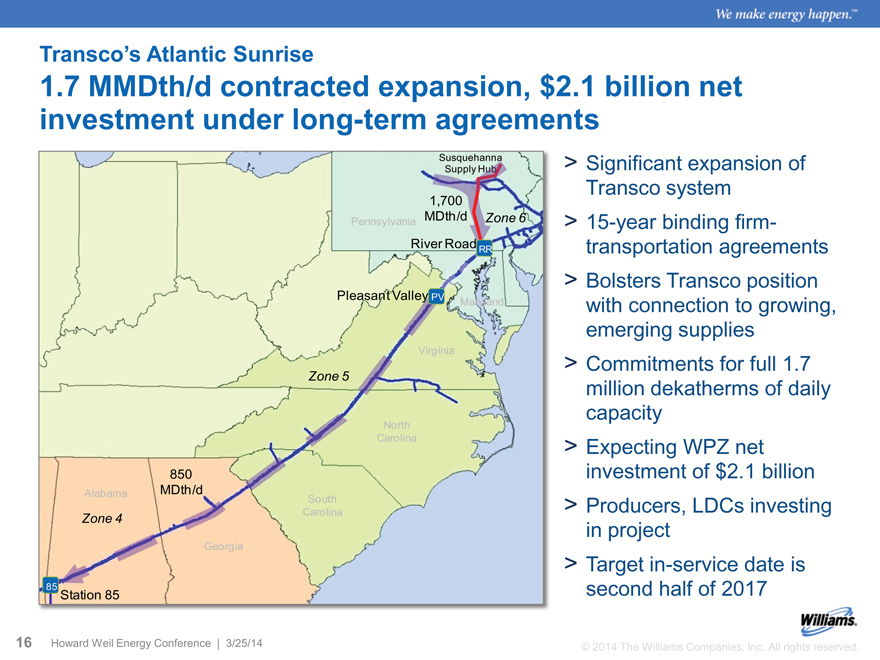
Transcos Atlantic Sunrise
1.7 MMDth/d contracted expansion, $2.1 billion net investment under long-term agreements
Significant expansion of Transco system 15-year binding firm-transportation agreements Bolsters Transco position with connection to growing, emerging supplies Commitments for full 1.7 million dekatherms of daily capacity Expecting WPZ net investment of $2.1 billion Producers, LDCs investing in project Target in-service date is second half of 2017
Susquehanna
Supply Hub
1,700
Pennsylvania MDth/d Zone 6
River Road RR
Pleasant Valley PV Maryland
Virginia
Zone 5
North
Carolina
850
Alabama MDth/d
South
Zone 4 Carolina
Georgia
85 Station 85
© 2014 The Williams Companies, Inc. All rights reserved.
Howard Well Energy Conference 3/25/14
16
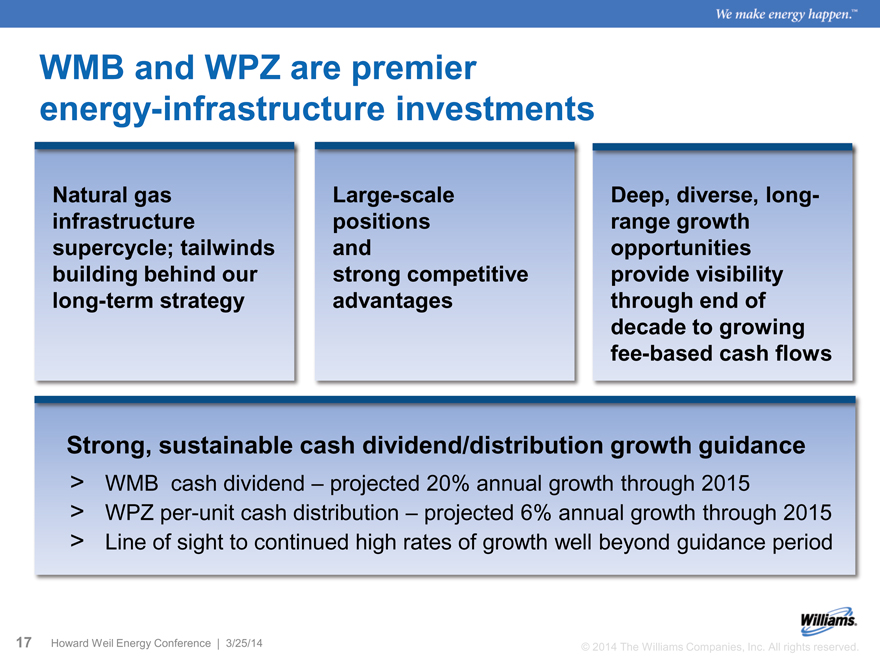
WMB and WPZ are premier energy-infrastructure investments
Natural gas Large-scale Deep, diverse, long-
infrastructure positions range growth
supercycle; tailwinds and opportunities
building behind our strong competitive provide visibility
long-term strategy advantages through end of
decade to growing
fee-based cash flows
Strong, sustainable cash dividend/distribution growth guidance
WMB cash dividend – projected 20% annual growth through 2015
WPZ per-unit cash distribution – projected 6% annual growth through 2015
Line of sight to continued high rates of growth well beyond guidance period
17 Howard Weil Energy Conference | 3/25/14 © 2014 The Williams Companies, Inc. All rights reserved.
WPZ Non-GAAP Reconciliations
WPZ Non-GAAP Reconciliations
WPZ non-GAAP disclaimer
This presentation includes certain financial measures, adjusted segment profit, adjusted segment profit + DD&A, and distributable cash flow that are non-GAAP financial measures as defined under the rules of the Securities and Exchange Commission.
For Williams Partners L.P., adjusted segment profit excludes items of income or loss that we characterize as unrepresentative of our ongoing operations. Adjusted segment profit + DD&A is further adjusted to add back depreciation and amortization expense. Management believes these measures provide investors meaningful insight into Williams Partners L.P.’s results from ongoing operations.
For Williams Partners L.P. we define distributable cash flow as net income plus depreciation and amortization and cash distributions from our equity investments less our earnings from equity investments, income attributable to noncontrolling interests and maintenance capital expenditures. We also adjust for payments and/or reimbursements under omnibus agreements with Williams and certain other adjustments. Total distributable cash flow is reduced by any amounts associated with operations which occurred prior to our ownership of the underlying assets to arrive at distributable cash flow attributable to partnership operations.
This presentation is accompanied by a reconciliation of these non-GAAP financial measures to their nearest GAAP financial measures. Management uses these financial measures because they are accepted financial indicators used by investors to compare company performance. In addition, management believes that these measures provide investors an enhanced perspective of the operating performance of the Partnership’s assets and the cash that the business is generating. Neither adjusted segment profit, adjusted segment profit + DD&A, nor distributable cash flow are intended to represent cash flows for the period, nor are they presented as an alternative to net income or cash flow from operations. They should not be considered in isolation or as substitutes for a measure of performance prepared in accordance with United States generally accepted accounting principles.
19 Howard Weil Energy Conference | 3/25/14 © 2014 The Williams Companies, Inc. All rights reserved.
WPZ Non-GAAP Reconciliations
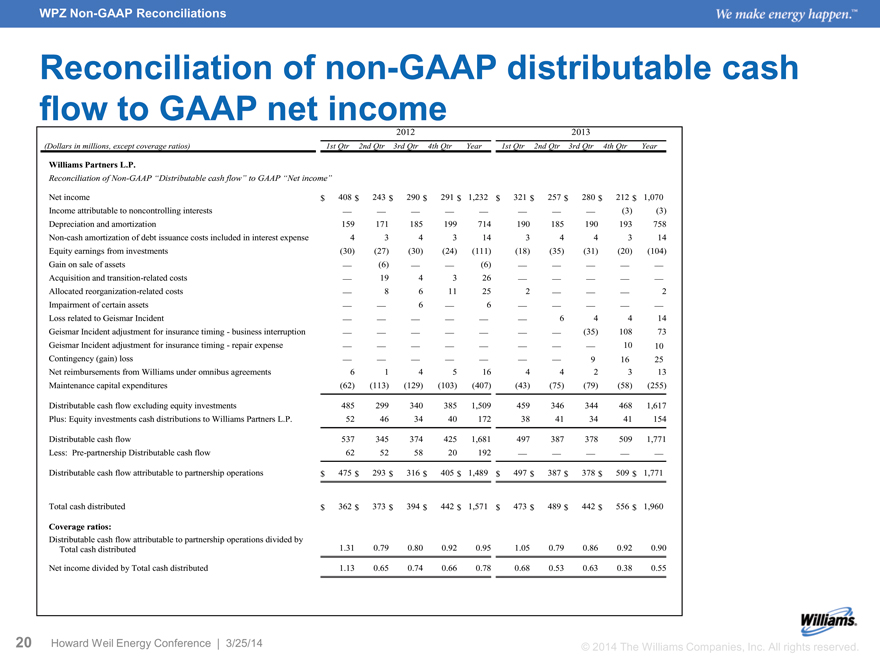
Reconciliation of non-GAAP distributable cash flow to GAAP net income
2012 2013
(Dollars in millions, except coverage ratios) 1st Qtr 2nd Qtr 3rd Qtr 4th Qtr Year 1st Qtr 2nd Qtr 3rd Qtr 4th Qtr Year
Williams Partners L.P.
Reconciliation of Non-GAAP “Distributable cash flow” to GAAP “Net income”
Net income $ 408 $ 243 $ 290 $ 291 $ 1,232 $ 321 $ 257 $ 280 $ 212 $ 1,070
Income attributable to noncontrolling interests — — — — — — — — (3) (3)
Depreciation and amortization 159 171 185 199 714 190 185 190 193 758
Non-cash amortization of debt issuance costs included in interest expense 4 3 4 3 14 3 4 4 3 14
Equity earnings from investments (30) (27) (30) (24) (111) (18) (35) (31) (20) (104)
Gain on sale of assets — (6) — — (6) — — — — —
Acquisition and transition-related costs — 19 4 3 26 — — — — —
Allocated reorganization-related costs — 8 6 11 25 2 — — — 2
Impairment of certain assets — — 6 — 6 — — — — —
Loss related to Geismar Incident — — — — — — 6 4 4 14
Geismar Incident adjustment for insurance timing - business interruption — — — — — — — (35) 108 73
Geismar Incident adjustment for insurance timing - repair expense — — — — — — — — 10 10
Contingency (gain) loss — — — — — — — 9 16 25
Net reimbursements from Williams under omnibus agreements 6 1 4 5 16 4 4 2 3 13
Maintenance capital expenditures (62) (113) (129) (103) (407) (43) (75) (79) (58) (255)
Distributable cash flow excluding equity investments 485 299 340 385 1,509 459 346 344 468 1,617
Plus: Equity investments cash distributions to Williams Partners L.P. 52 46 34 40 172 38 41 34 41 154
Distributable cash flow 537 345 374 425 1,681 497 387 378 509 1,771
Less: Pre-partnership Distributable cash flow 62 52 58 20 192 — — — — —
Distributable cash flow attributable to partnership operations $ 475 $ 293 $ 316 $ 405 $ 1,489 $ 497 $ 387 $ 378 $ 509 $ 1,771
Total cash distributed $ 362 $ 373 $ 394 $ 442 $ 1,571 $ 473 $ 489 $ 442 $ 556 $ 1,960
Coverage ratios:
Distributable cash flow attributable to partnership operations divided by
Total cash distributed 1.31 0.79 0.80 0.92 0.95 1.05 0.79 0.86 0.92 0.90
Net income divided by Total cash distributed 1.13 0.65 0.74 0.66 0.78 0.68 0.53 0.63 0.38 0.55
20 Howard Weil Energy Conference | 3/25/14 © 2014 The Williams Companies, Inc. All rights reserved.
WPZ Non-GAAP Reconciliations
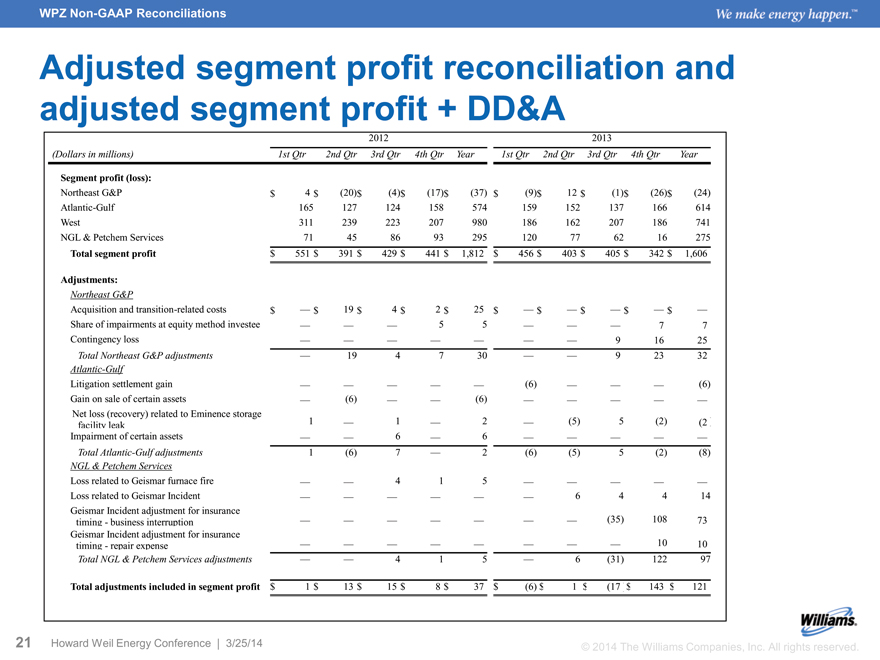
Adjusted segment profit reconciliation and adjusted segment profit + DD&A
2012 2013
(Dollars in millions) 1st Qtr 2nd Qtr 3rd Qtr 4th Qtr Year 1st Qtr 2nd Qtr 3rd Qtr 4th Qtr Year
Segment profit (loss):
Northeast G&P $ 4 $ (20)$ (4)$ (17)$ (37) $ (9)$ 12 $ (1)$ (26)$ (24)
Atlantic-Gulf 165 127 124 158 574 159 152 137 166 614
West 311 239 223 207 980 186 162 207 186 741
NGL & Petchem Services 71 45 86 93 295 120 77 62 16 275
Total segment profit $ 551 $ 391 $ 429 $ 441 $ 1,812 $ 456 $ 403 $ 405 $ 342 $ 1,606
Adjustments:
Northeast G&P
Acquisition and transition-related costs $ — $ 19 $ 4 $ 2 $ 25 $ — $ — $ — $ — $ —
Share of impairments at equity method investee — — — 5 5 — — — 7 7
Contingency loss — — — — — — — 9 16 25
Total Northeast G&P adjustments — 19 4 7 30 — — 9 23 32
Atlantic-Gulf
Litigation settlement gain — — — — — (6) — — — (6)
Gain on sale of certain assets — (6) — — (6) — — — — —
Net loss (recovery) related to Eminence storage
facility leak 1 — 1 — 2 — (5) 5 (2) (2)
Impairment of certain assets — — 6 — 6 — — — — —
Total Atlantic-Gulf adjustments 1 (6) 7 — 2 (6) (5) 5 (2) (8)
NGL & Petchem Services
Loss related to Geismar furnace fire — — 4 1 5 — — — — —
Loss related to Geismar Incident — — — — — — 6 4 4 14
Geismar Incident adjustment for insurance
timing - business interruption — — — — — — — (35) 108 73
Geismar Incident adjustment for insurance
timing - repair expense — — — — — — — — 10 10
Total NGL & Petchem Services adjustments — — 4 1 5 — 6 (31) 122 97
Total adjustments included in segment profit $ 1 $ 13 $ 15 $ 8 $ 37 $ (6) $ 1 $ (17) $ 143 $ 121
21 Howard Weil Energy Conference | 3/25/14 © 2014 The Williams Companies, Inc. All rights reserved.
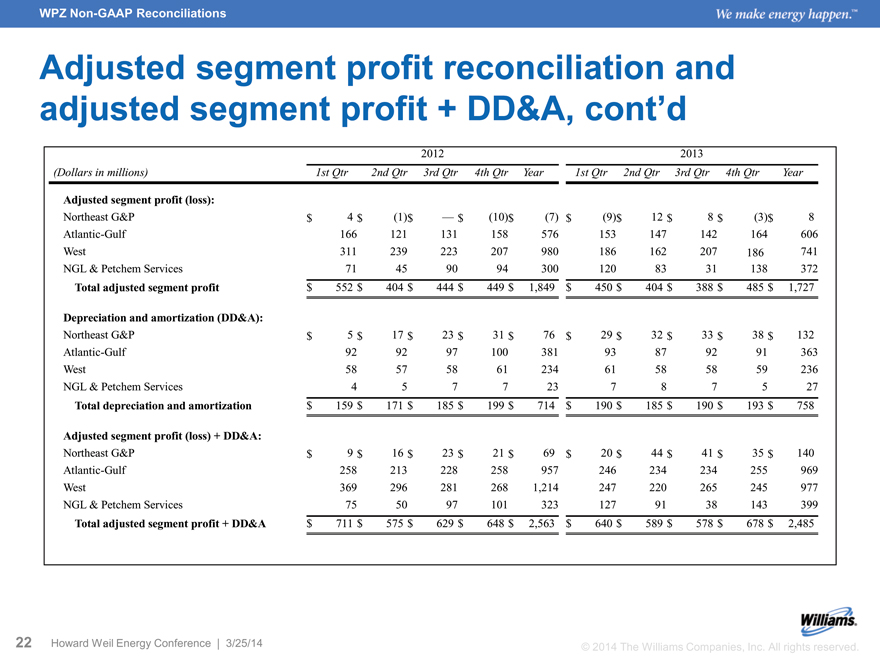
WPZ Non-GAAP Reconciliations
Adjusted segment profit reconciliation and adjusted segment profit + DD&A, cont’d
2012 2013
(Dollars in millions) 1st Qtr 2nd Qtr 3rd Qtr 4th Qtr Year 1st Qtr 2nd Qtr 3rd Qtr 4th Qtr Year
Adjusted segment profit (loss):
Northeast G&P $ 4 $ (1)$ — $ (10)$ (7) $ (9)$ 12 $ 8 $ (3)$ 8
Atlantic-Gulf 166 121 131 158 576 153 147 142 164 606
West 311 239 223 207 980 186 162 207 186 741
NGL & Petchem Services 71 45 90 94 300 120 83 31 138 372
Total adjusted segment profit $ 552 $ 404 $ 444 $ 449 $ 1,849 $ 450 $ 404 $ 388 $ 485 $ 1,727
Depreciation and amortization (DD&A):
Northeast G&P $ 5 $ 17 $ 23 $ 31 $ 76 $ 29 $ 32 $ 33 $ 38 $ 132
Atlantic-Gulf 92 92 97 100 381 93 87 92 91 363
West 58 57 58 61 234 61 58 58 59 236
NGL & Petchem Services 4 5 7 7 23 7 8 7 5 27
Total depreciation and amortization $ 159 $ 171 $ 185 $ 199 $ 714 $ 190 $ 185 $ 190 $ 193 $ 758
Adjusted segment profit (loss) + DD&A:
Northeast G&P $ 9 $ 16 $ 23 $ 21 $ 69 $ 20 $ 44 $ 41 $ 35 $ 140
Atlantic-Gulf 258 213 228 258 957 246 234 234 255 969
West 369 296 281 268 1,214 247 220 265 245 977
NGL & Petchem Services 75 50 97 101 323 127 91 38 143 399
Total adjusted segment profit + DD&A $ 711 $ 575 $ 629 $ 648 $ 2,563 $ 640 $ 589 $ 578 $ 678 $ 2,485
22 Howard Weil Energy Conference | 3/25/14 © 2014 The Williams Companies, Inc. All rights reserved.
WPZ Non-GAAP Reconciliations
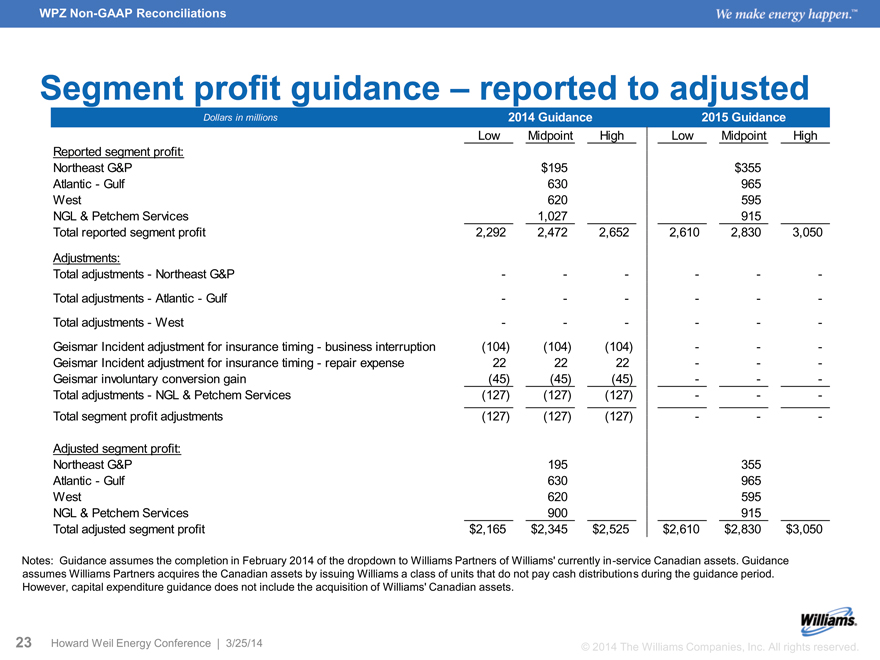
Segment profit guidance – reported to adjusted
Dollars in millions 2014 Guidance 2015 Guidance
Low Midpoint High Low Midpoint High
Reported segment profit:
Northeast G&P $195 $355
Atlantic - Gulf 630 965
West 620 595
NGL & Petchem Services 1,027 915
Total reported segment profit 2,292 2,472 2,652 2,610 2,830 3,050
Adjustments:
Total adjustments - Northeast G&P - - - - - -
Total adjustments - Atlantic - Gulf - - - - - -
Total adjustments - West - - - - - -
Geismar Incident adjustment for insurance timing - business interruption (104) (104) (104) - - -
Geismar Incident adjustment for insurance timing - repair expense 22 22 22 - - -
Geismar involuntary conversion gain (45) (45) (45) - - -
Total adjustments - NGL & Petchem Services (127) (127) (127) - - -
Total segment profit adjustments (127) (127) (127) - - -
Adjusted segment profit:
Northeast G&P 195 355
Atlantic - Gulf 630 965
West 620 595
NGL & Petchem Services 900 915
Total adjusted segment profit $2,165 $2,345 $2,525 $2,610 $2,830 $3,050
Notes: Guidance assumes the completion in February 2014 of the dropdown to Williams Partners of Williams’ currently in-service Canadian assets. Guidance assumes Williams Partners acquires the Canadian assets by issuing Williams a class of units that do not pay cash distributions during the guidance period. However, capital expenditure guidance does not include the acquisition of Williams’ Canadian assets.
23 Howard Weil Energy Conference | 3/25/14 © 2014 The Williams Companies, Inc. All rights reserved.
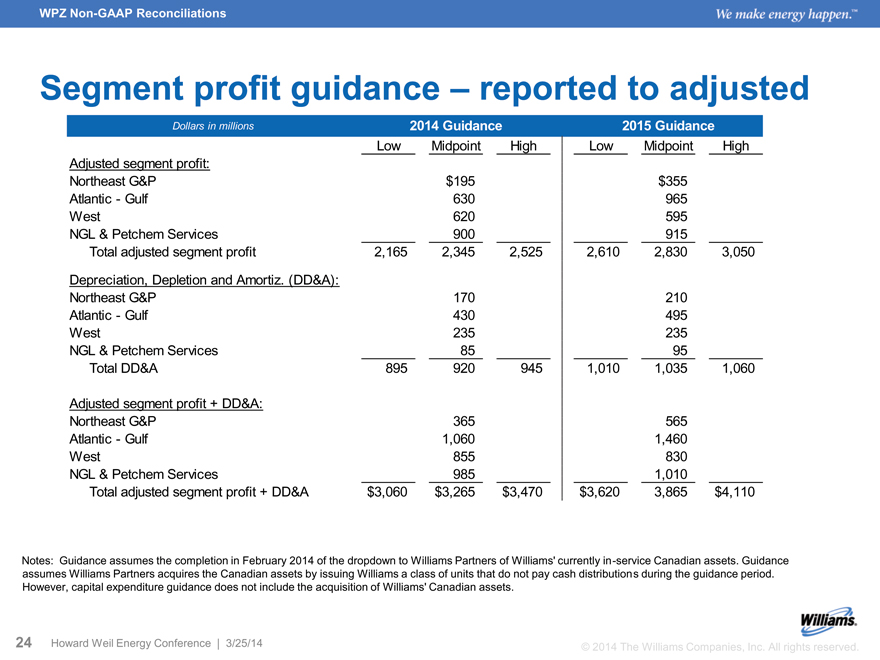
WPZ Non-GAAP Reconciliations
Segment profit guidance – reported to adjusted
Dollars in millions 2014 Guidance 2015 Guidance
Low Midpoint High Low Midpoint High
Adjusted segment profit:
Northeast G&P $195 $355
Atlantic - Gulf 630 965
West 620 595
NGL & Petchem Services 900 915
Total adjusted segment profit 2,165 2,345 2,525 2,610 2,830 3,050
Depreciation, Depletion and Amortiz. (DD&A):
Northeast G&P 170 210
Atlantic - Gulf 430 495
West 235 235
NGL & Petchem Services 85 95
Total DD&A 895 920 945 1,010 1,035 1,060
Adjusted segment profit + DD&A:
Northeast G&P 365 565
Atlantic - Gulf 1,060 1,460
West 855 830
NGL & Petchem Services 985 1,010
Total adjusted segment profit + DD&A $3,060 $3,265 $3,470 $3,620 3,865 $4,110
Notes: Guidance assumes the completion in February 2014 of the dropdown to Williams Partners of Williams’ currently in-service Canadian assets. Guidance assumes Williams Partners acquires the Canadian assets by issuing Williams a class of units that do not pay cash distributions during the guidance period. However, capital expenditure guidance does not include the acquisition of Williams’ Canadian assets.
24 Howard Weil Energy Conference | 3/25/14 © 2014 The Williams Companies, Inc. All rights reserved.
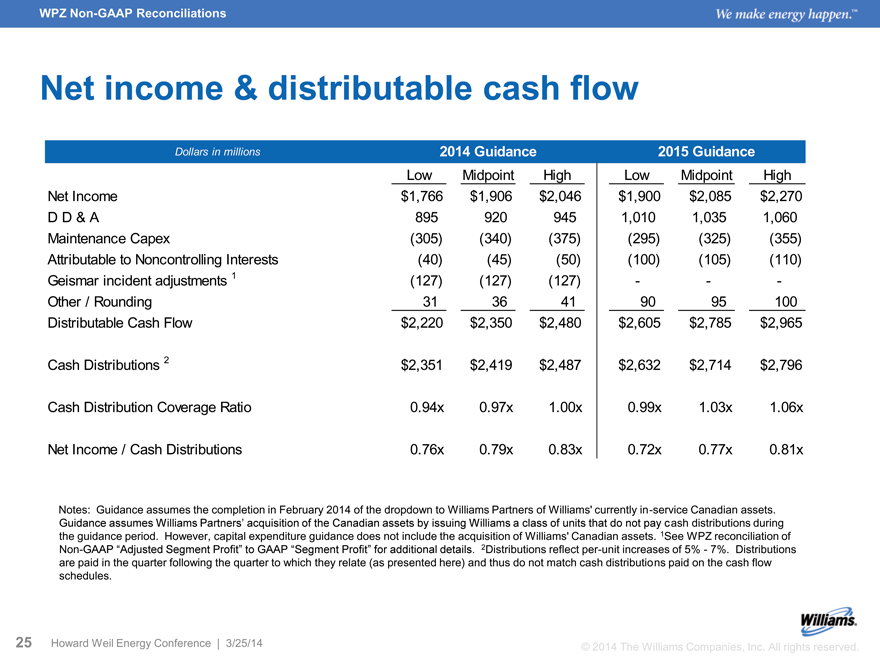
WPZ Non-GAAP Reconciliations
Net income & distributable cash flow
Dollars in millions 2014 Guidance 2015 Guidance
Low Midpoint High Low Midpoint High
Net Income $1,766 $1,906 $2,046 $1,900 $2,085 $2,270
D D & A 895 920 945 1,010 1,035 1,060
Maintenance Capex (305) (340) (375) (295) (325) (355)
Attributable to Noncontrolling Interests (40) (45) (50) (100) (105) (110)
Geismar incident adjustments 1 (127) (127) (127) - - -
Other / Rounding 31 36 41 90 95 100
Distributable Cash Flow $2,220 $2,350 $2,480 $2,605 $2,785 $2,965
Cash Distributions 2 $2,351 $2,419 $2,487 $2,632 $2,714 $2,796
Cash Distribution Coverage Ratio 0.94x 0.97x 1.00x 0.99x 1.03x 1.06x
Net Income / Cash Distributions 0.76x 0.79x 0.83x 0.72x 0.77x 0.81x
Notes: Guidance assumes the completion in February 2014 of the dropdown to Williams Partners of Williams’ currently in-service Canadian assets.
Guidance assumes Williams Partners’ acquisition of the Canadian assets by issuing Williams a class of units that do not pay cash distributions during the guidance period. However, capital expenditure guidance does not include the acquisition of Williams’ Canadian assets. 1See WPZ reconciliation of Non-GAAP “Adjusted Segment Profit” to GAAP “Segment Profit” for additional details. 2Distributions reflect per-unit increases of 5% - 7%. Distributions are paid in the quarter following the quarter to which they relate (as presented here) and thus do not match cash distributions paid on the cash flow schedules.
25 Howard Weil Energy Conference | 3/25/14 © 2014 The Williams Companies, Inc. All rights reserved.