Financial Repositioning for Long-Term, Sustainable Growth January 9, 2017 Williams and Williams Partners Exhibit 99.2
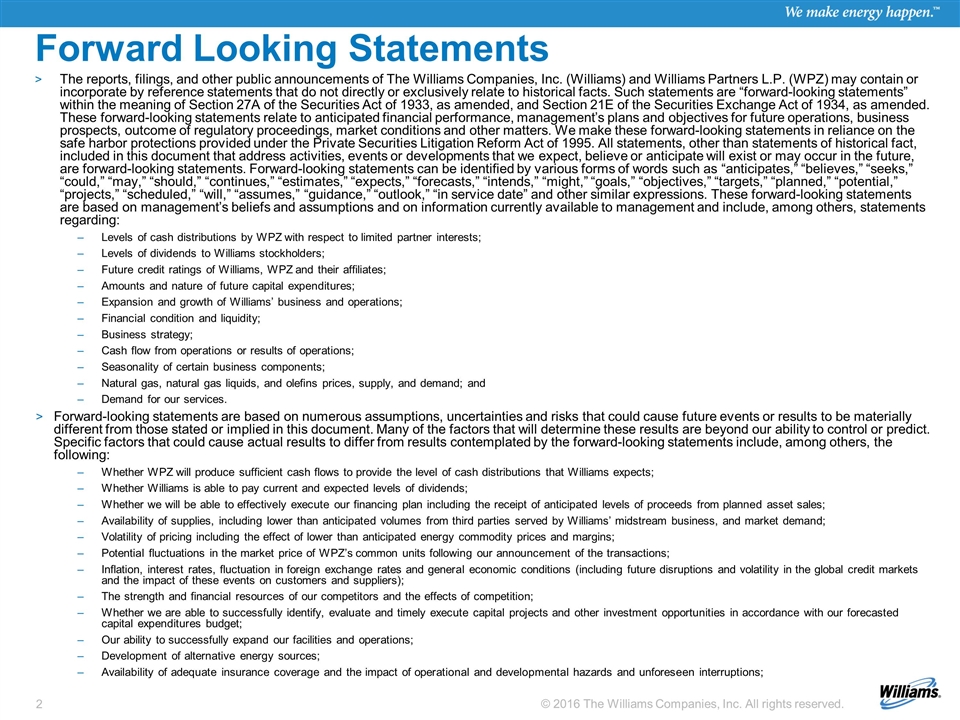
Forward Looking Statements The reports, filings, and other public announcements of The Williams Companies, Inc. (Williams) and Williams Partners L.P. (WPZ) may contain or incorporate by reference statements that do not directly or exclusively relate to historical facts. Such statements are “forward-looking statements” within the meaning of Section 27A of the Securities Act of 1933, as amended, and Section 21E of the Securities Exchange Act of 1934, as amended. These forward-looking statements relate to anticipated financial performance, management’s plans and objectives for future operations, business prospects, outcome of regulatory proceedings, market conditions and other matters. We make these forward-looking statements in reliance on the safe harbor protections provided under the Private Securities Litigation Reform Act of 1995. All statements, other than statements of historical fact, included in this document that address activities, events or developments that we expect, believe or anticipate will exist or may occur in the future, are forward-looking statements. Forward-looking statements can be identified by various forms of words such as “anticipates,” “believes,” “seeks,” “could,” “may,” “should,” “continues,” “estimates,” “expects,” “forecasts,” “intends,” “might,” “goals,” “objectives,” “targets,” “planned,” “potential,” “projects,” “scheduled,” “will,” “assumes,” “guidance,” “outlook,” “in service date” and other similar expressions. These forward-looking statements are based on management’s beliefs and assumptions and on information currently available to management and include, among others, statements regarding: Levels of cash distributions by WPZ with respect to limited partner interests; Levels of dividends to Williams stockholders; Future credit ratings of Williams, WPZ and their affiliates; Amounts and nature of future capital expenditures; Expansion and growth of Williams’ business and operations; Financial condition and liquidity; Business strategy; Cash flow from operations or results of operations; Seasonality of certain business components; Natural gas, natural gas liquids, and olefins prices, supply, and demand; and Demand for our services. Forward-looking statements are based on numerous assumptions, uncertainties and risks that could cause future events or results to be materially different from those stated or implied in this document. Many of the factors that will determine these results are beyond our ability to control or predict. Specific factors that could cause actual results to differ from results contemplated by the forward-looking statements include, among others, the following: Whether WPZ will produce sufficient cash flows to provide the level of cash distributions that Williams expects; Whether Williams is able to pay current and expected levels of dividends; Whether we will be able to effectively execute our financing plan including the receipt of anticipated levels of proceeds from planned asset sales; Availability of supplies, including lower than anticipated volumes from third parties served by Williams’ midstream business, and market demand; Volatility of pricing including the effect of lower than anticipated energy commodity prices and margins; Potential fluctuations in the market price of WPZ’s common units following our announcement of the transactions; Inflation, interest rates, fluctuation in foreign exchange rates and general economic conditions (including future disruptions and volatility in the global credit markets and the impact of these events on customers and suppliers); The strength and financial resources of our competitors and the effects of competition; Whether we are able to successfully identify, evaluate and timely execute capital projects and other investment opportunities in accordance with our forecasted capital expenditures budget; Our ability to successfully expand our facilities and operations; Development of alternative energy sources; Availability of adequate insurance coverage and the impact of operational and developmental hazards and unforeseen interruptions;
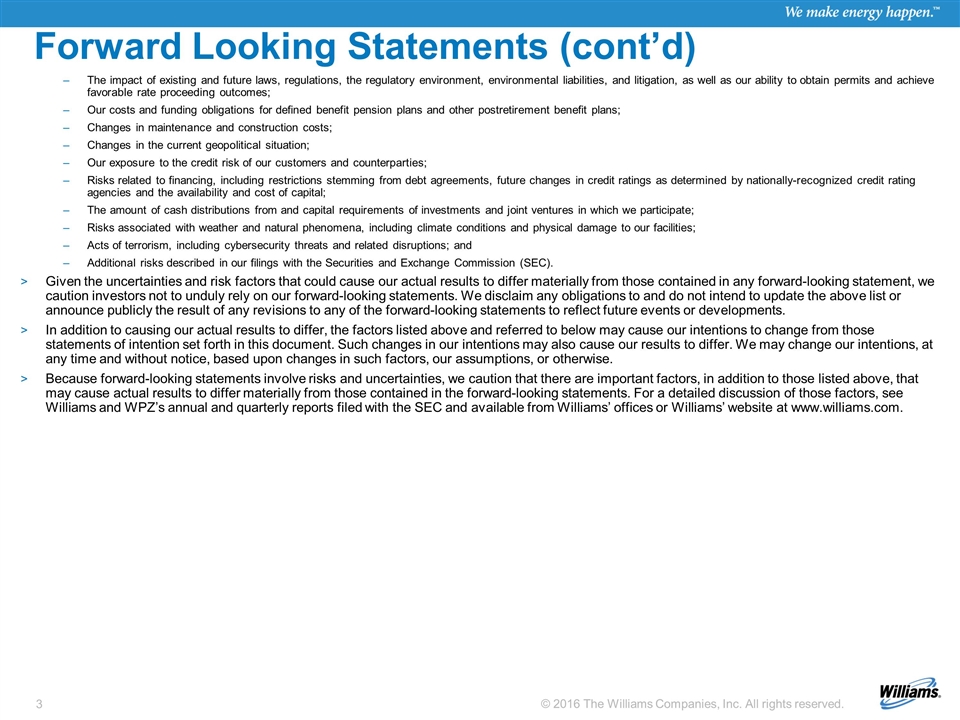
Forward Looking Statements (cont’d) The impact of existing and future laws, regulations, the regulatory environment, environmental liabilities, and litigation, as well as our ability to obtain permits and achieve favorable rate proceeding outcomes; Our costs and funding obligations for defined benefit pension plans and other postretirement benefit plans; Changes in maintenance and construction costs; Changes in the current geopolitical situation; Our exposure to the credit risk of our customers and counterparties; Risks related to financing, including restrictions stemming from debt agreements, future changes in credit ratings as determined by nationally-recognized credit rating agencies and the availability and cost of capital; The amount of cash distributions from and capital requirements of investments and joint ventures in which we participate; Risks associated with weather and natural phenomena, including climate conditions and physical damage to our facilities; Acts of terrorism, including cybersecurity threats and related disruptions; and Additional risks described in our filings with the Securities and Exchange Commission (SEC). Given the uncertainties and risk factors that could cause our actual results to differ materially from those contained in any forward-looking statement, we caution investors not to unduly rely on our forward-looking statements. We disclaim any obligations to and do not intend to update the above list or announce publicly the result of any revisions to any of the forward-looking statements to reflect future events or developments. In addition to causing our actual results to differ, the factors listed above and referred to below may cause our intentions to change from those statements of intention set forth in this document. Such changes in our intentions may also cause our results to differ. We may change our intentions, at any time and without notice, based upon changes in such factors, our assumptions, or otherwise. Because forward-looking statements involve risks and uncertainties, we caution that there are important factors, in addition to those listed above, that may cause actual results to differ materially from those contained in the forward-looking statements. For a detailed discussion of those factors, see Williams and WPZ’s annual and quarterly reports filed with the SEC and available from Williams’ offices or Williams’ website at www.williams.com.
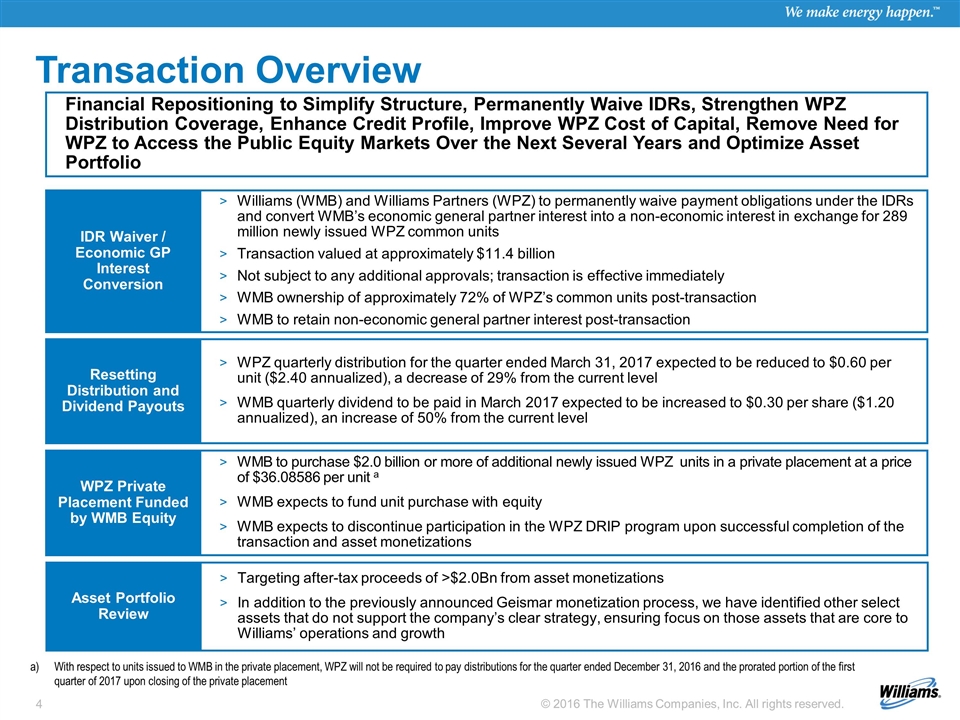
Transaction Overview Williams (WMB) and Williams Partners (WPZ) to permanently waive payment obligations under the IDRs and convert WMB’s economic general partner interest into a non-economic interest in exchange for 289 million newly issued WPZ common units Transaction valued at approximately $11.4 billion Not subject to any additional approvals; transaction is effective immediately WMB ownership of approximately 72% of WPZ’s common units post-transaction WMB to retain non-economic general partner interest post-transaction IDR Waiver / Economic GP Interest Conversion WMB to purchase $2.0 billion or more of additional newly issued WPZ units in a private placement at a price of $36.08586 per unit a WMB expects to fund unit purchase with equity WMB expects to discontinue participation in the WPZ DRIP program upon successful completion of the transaction and asset monetizations WPZ Private Placement Funded by WMB Equity WPZ quarterly distribution for the quarter ended March 31, 2017 expected to be reduced to $0.60 per unit ($2.40 annualized), a decrease of 29% from the current level WMB quarterly dividend to be paid in March 2017 expected to be increased to $0.30 per share ($1.20 annualized), an increase of 50% from the current level Resetting Distribution and Dividend Payouts Targeting after-tax proceeds of >$2.0Bn from asset monetizations In addition to the previously announced Geismar monetization process, we have identified other select assets that do not support the company’s clear strategy, ensuring focus on those assets that are core to Williams’ operations and growth Asset Portfolio Review Financial Repositioning to Simplify Structure, Permanently Waive IDRs, Strengthen WPZ Distribution Coverage, Enhance Credit Profile, Improve WPZ Cost of Capital, Remove Need for WPZ to Access the Public Equity Markets Over the Next Several Years and Optimize Asset Portfolio With respect to units issued to WMB in the private placement, WPZ will not be required to pay distributions for the quarter ended December 31, 2016 and the prorated portion of the first quarter of 2017 upon closing of the private placement
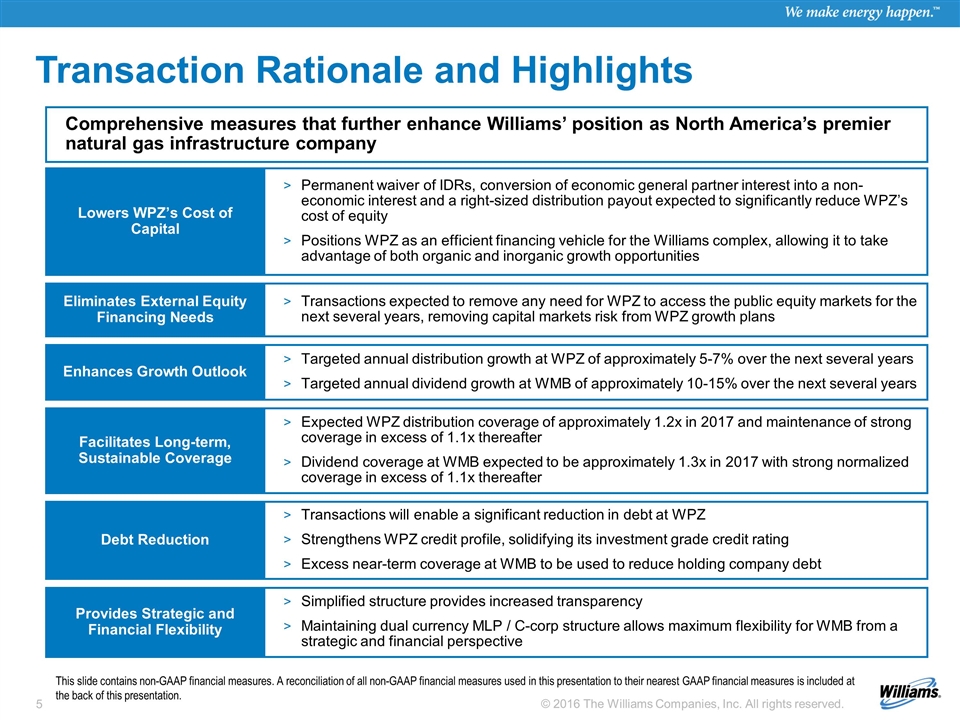
Transaction Rationale and Highlights Permanent waiver of IDRs, conversion of economic general partner interest into a non-economic interest and a right-sized distribution payout expected to significantly reduce WPZ’s cost of equity Positions WPZ as an efficient financing vehicle for the Williams complex, allowing it to take advantage of both organic and inorganic growth opportunities Lowers WPZ’s Cost of Capital Expected WPZ distribution coverage of approximately 1.2x in 2017 and maintenance of strong coverage in excess of 1.1x thereafter Dividend coverage at WMB expected to be approximately 1.3x in 2017 with strong normalized coverage in excess of 1.1x thereafter Facilitates Long-term, Sustainable Coverage Targeted annual distribution growth at WPZ of approximately 5-7% over the next several years Targeted annual dividend growth at WMB of approximately 10-15% over the next several years Enhances Growth Outlook Simplified structure provides increased transparency Maintaining dual currency MLP / C-corp structure allows maximum flexibility for WMB from a strategic and financial perspective Provides Strategic and Financial Flexibility Transactions will enable a significant reduction in debt at WPZ Strengthens WPZ credit profile, solidifying its investment grade credit rating Excess near-term coverage at WMB to be used to reduce holding company debt Debt Reduction Comprehensive measures that further enhance Williams’ position as North America’s premier natural gas infrastructure company Transactions expected to remove any need for WPZ to access the public equity markets for the next several years, removing capital markets risk from WPZ growth plans Eliminates External Equity Financing Needs This slide contains non-GAAP financial measures. A reconciliation of all non-GAAP financial measures used in this presentation to their nearest GAAP financial measures is included at the back of this presentation.
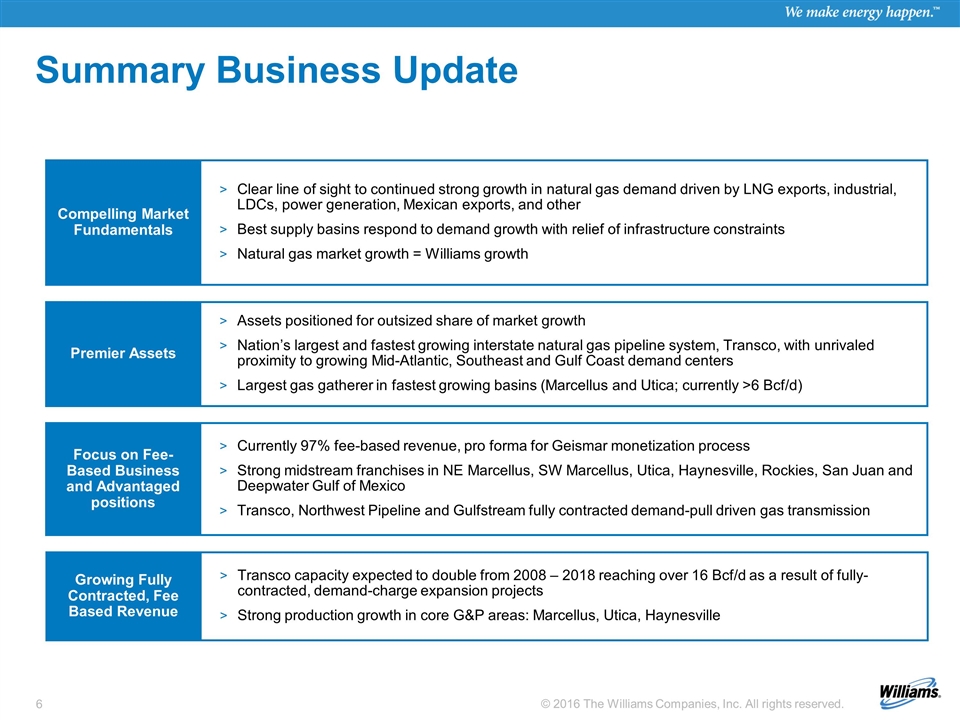
Summary Business Update Clear line of sight to continued strong growth in natural gas demand driven by LNG exports, industrial, LDCs, power generation, Mexican exports, and other Best supply basins respond to demand growth with relief of infrastructure constraints Natural gas market growth = Williams growth Compelling Market Fundamentals Currently 97% fee-based revenue, pro forma for Geismar monetization process Strong midstream franchises in NE Marcellus, SW Marcellus, Utica, Haynesville, Rockies, San Juan and Deepwater Gulf of Mexico Transco, Northwest Pipeline and Gulfstream fully contracted demand-pull driven gas transmission Focus on Fee-Based Business and Advantaged positions Assets positioned for outsized share of market growth Nation’s largest and fastest growing interstate natural gas pipeline system, Transco, with unrivaled proximity to growing Mid-Atlantic, Southeast and Gulf Coast demand centers Largest gas gatherer in fastest growing basins (Marcellus and Utica; currently >6 Bcf/d) Premier Assets Transco capacity expected to double from 2008 – 2018 reaching over 16 Bcf/d as a result of fully-contracted, demand-charge expansion projects Strong production growth in core G&P areas: Marcellus, Utica, Haynesville Growing Fully Contracted, Fee Based Revenue
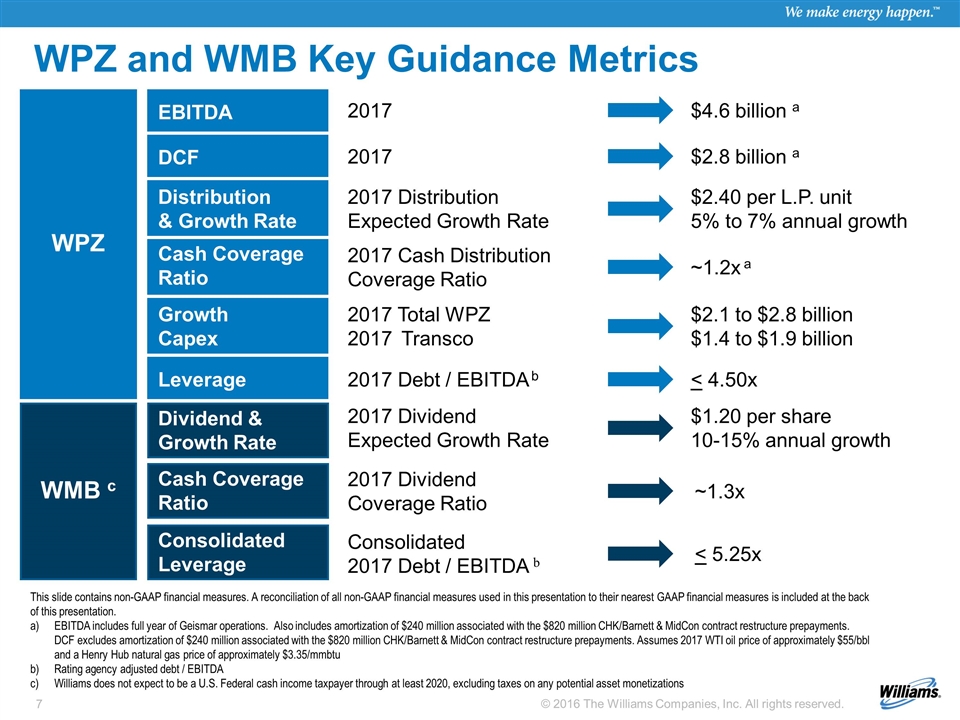
WPZ and WMB Key Guidance Metrics Dividend & Growth Rate 2017 $4.6 billion a 2017 Total WPZ 2017 Transco $2.1 to $2.8 billion $1.4 to $1.9 billion 2017 Distribution Expected Growth Rate $2.40 per L.P. unit 5% to 7% annual growth 2017 Cash Distribution Coverage Ratio ~1.2x a 2017 Debt / EBITDA b < 4.50x 2017 Dividend Expected Growth Rate $1.20 per share 10-15% annual growth 2017 Dividend Coverage Ratio ~1.3x WMB c WPZ This slide contains non-GAAP financial measures. A reconciliation of all non-GAAP financial measures used in this presentation to their nearest GAAP financial measures is included at the back of this presentation. EBITDA includes full year of Geismar operations. Also includes amortization of $240 million associated with the $820 million CHK/Barnett & MidCon contract restructure prepayments. DCF excludes amortization of $240 million associated with the $820 million CHK/Barnett & MidCon contract restructure prepayments. Assumes 2017 WTI oil price of approximately $55/bbl and a Henry Hub natural gas price of approximately $3.35/mmbtu Rating agency adjusted debt / EBITDA Williams does not expect to be a U.S. Federal cash income taxpayer through at least 2020, excluding taxes on any potential asset monetizations 2017 $2.8 billion a EBITDA Distribution & Growth Rate Cash Coverage Ratio Growth Capex Leverage DCF Cash Coverage Ratio Consolidated Leverage Consolidated 2017 Debt / EBITDA b < 5.25x
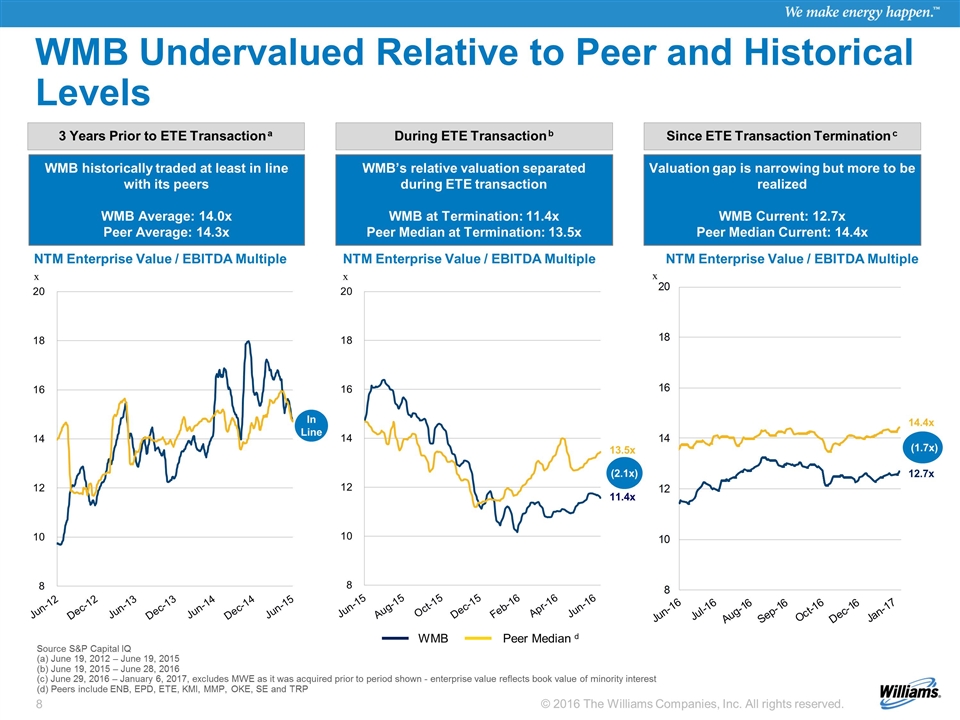
NTM Enterprise Value / EBITDA Multiple x WMB Undervalued Relative to Peer and Historical Levels 3 Years Prior to ETE Transaction a During ETE Transaction b Since ETE Transaction Termination c Source S&P Capital IQ (a) June 19, 2012 – June 19, 2015 (b) June 19, 2015 – June 28, 2016 (c) June 29, 2016 – January 6, 2017, excludes MWE as it was acquired prior to period shown - enterprise value reflects book value of minority interest (d) Peers include ENB, EPD, ETE, KMI, MMP, OKE, SE and TRP WMB historically traded at least in line with its peers WMB Average: 14.0x Peer Average: 14.3x WMB’s relative valuation separated during ETE transaction WMB at Termination: 11.4x Peer Median at Termination: 13.5x Valuation gap is narrowing but more to be realized WMB Current: 12.7x Peer Median Current: 14.4x 13.5x 11.4x (2.1x) 14.4x 12.7x (1.7x) NTM Enterprise Value / EBITDA Multiple x In Line NTM Enterprise Value / EBITDA Multiple x WMB Peer Median d
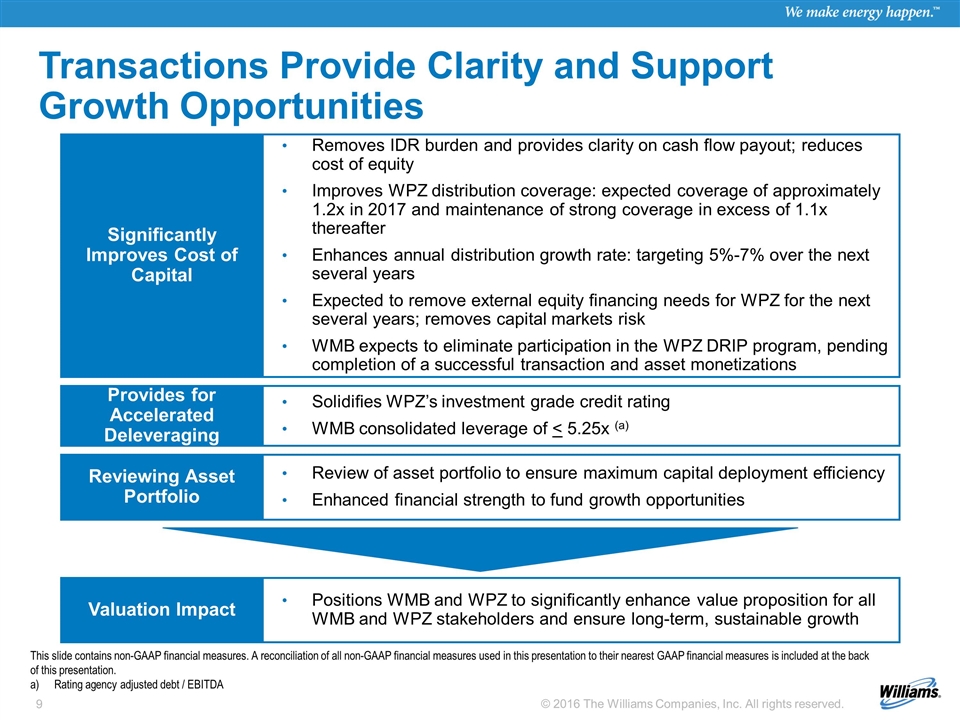
Review of asset portfolio to ensure maximum capital deployment efficiency Enhanced financial strength to fund growth opportunities Transactions Provide Clarity and Support Growth Opportunities Solidifies WPZ’s investment grade credit rating WMB consolidated leverage of < 5.25x (a) Provides for Accelerated Deleveraging Removes IDR burden and provides clarity on cash flow payout; reduces cost of equity Improves WPZ distribution coverage: expected coverage of approximately 1.2x in 2017 and maintenance of strong coverage in excess of 1.1x thereafter Enhances annual distribution growth rate: targeting 5%-7% over the next several years Expected to remove external equity financing needs for WPZ for the next several years; removes capital markets risk WMB expects to eliminate participation in the WPZ DRIP program, pending completion of a successful transaction and asset monetizations Significantly Improves Cost of Capital Positions WMB and WPZ to significantly enhance value proposition for all WMB and WPZ stakeholders and ensure long-term, sustainable growth Valuation Impact 8 Reviewing Asset Portfolio This slide contains non-GAAP financial measures. A reconciliation of all non-GAAP financial measures used in this presentation to their nearest GAAP financial measures is included at the back of this presentation. Rating agency adjusted debt / EBITDA
Appendix 9
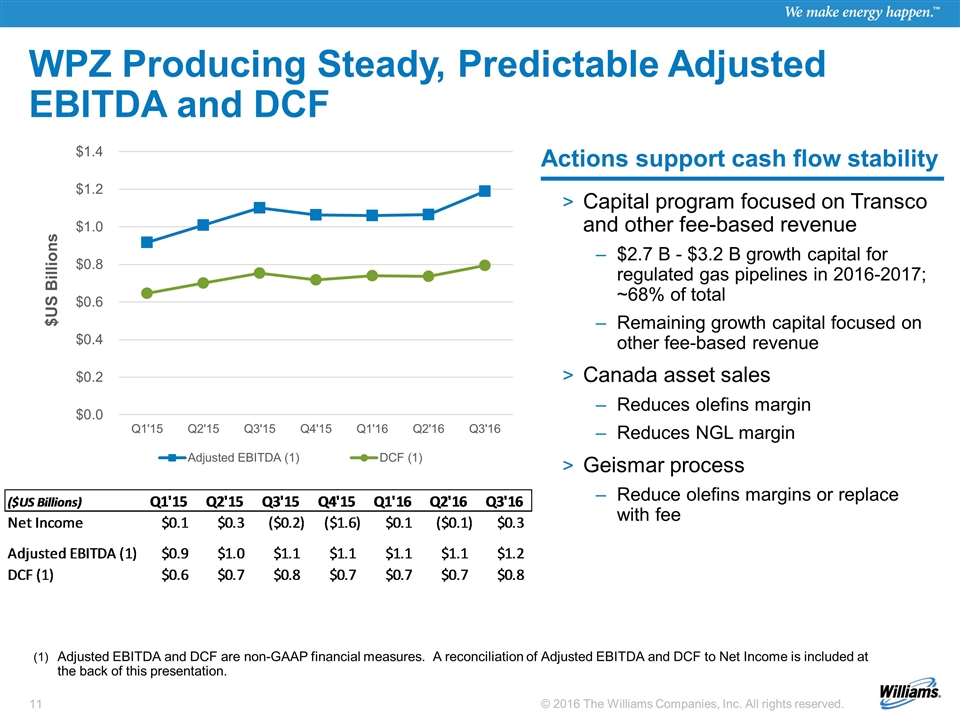
WPZ Producing Steady, Predictable Adjusted EBITDA and DCF Adjusted EBITDA and DCF are non-GAAP financial measures. A reconciliation of Adjusted EBITDA and DCF to Net Income is included at the back of this presentation. Capital program focused on Transco and other fee-based revenue $2.7 B - $3.2 B growth capital for regulated gas pipelines in 2016-2017; ~68% of total Remaining growth capital focused on other fee-based revenue Canada asset sales Reduces olefins margin Reduces NGL margin Geismar process Reduce olefins margins or replace with fee Actions support cash flow stability
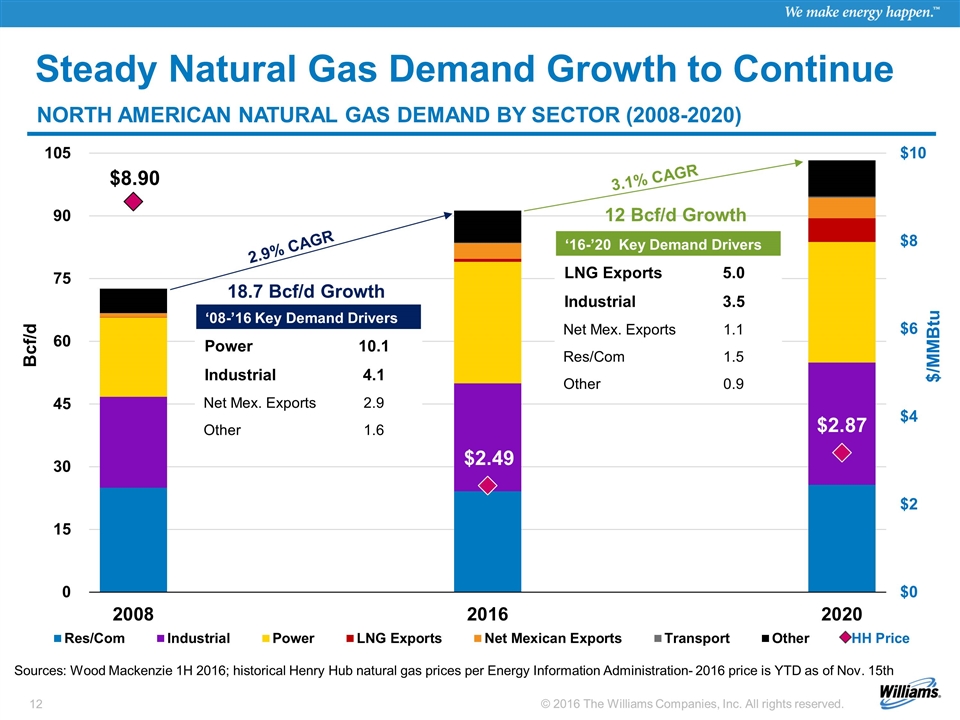
Steady Natural Gas Demand Growth to Continue Sources: Wood Mackenzie 1H 2016; historical Henry Hub natural gas prices per Energy Information Administration- 2016 price is YTD as of Nov. 15th NORTH AMERICAN NATURAL GAS DEMAND BY SECTOR (2008-2020) ‘08-’16 Key Demand Drivers Power 10.1 Industrial 4.1 Net Mex. Exports 2.9 Other 1.6 ‘16-’20 Key Demand Drivers LNG Exports 5.0 Industrial 3.5 Net Mex. Exports 1.1 Res/Com 1.5 Other 0.9 18.7 Bcf/d Growth 12 Bcf/d Growth 2.9% CAGR
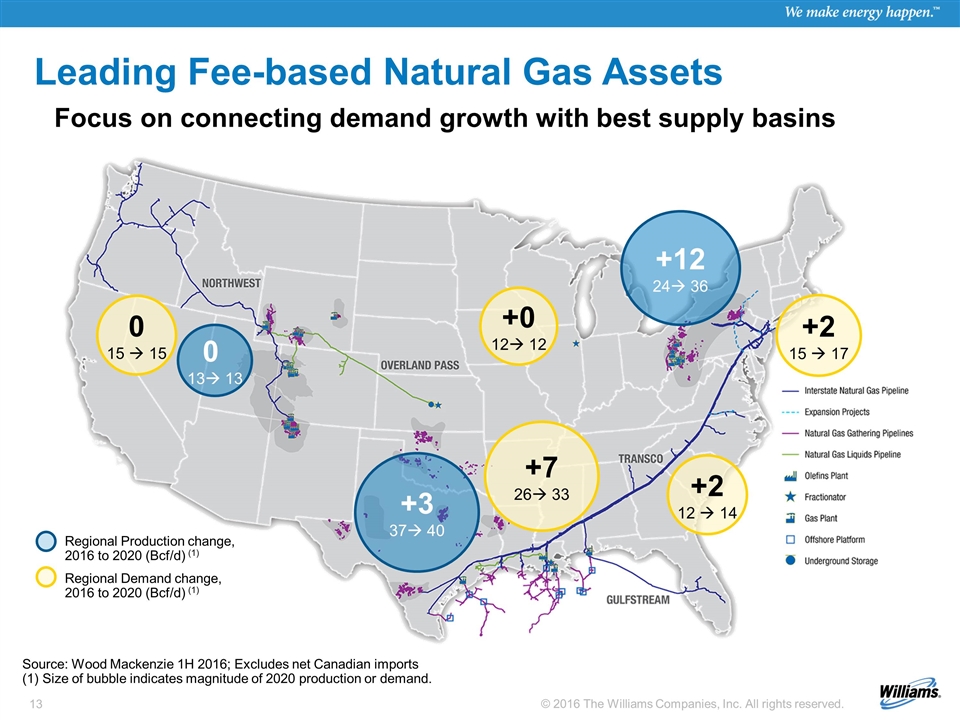
+12 24à 36 +2 15 à 17 +3 37à 40 +7 26à 33 0 13à 13 Regional Production change, 2016 to 2020 (Bcf/d) (1) Regional Demand change, 2016 to 2020 (Bcf/d) (1) Leading Fee-based Natural Gas Assets Focus on connecting demand growth with best supply basins Source: Wood Mackenzie 1H 2016; Excludes net Canadian imports (1) Size of bubble indicates magnitude of 2020 production or demand. +2 12 à 14 0 15 à 15 +0 12à 12
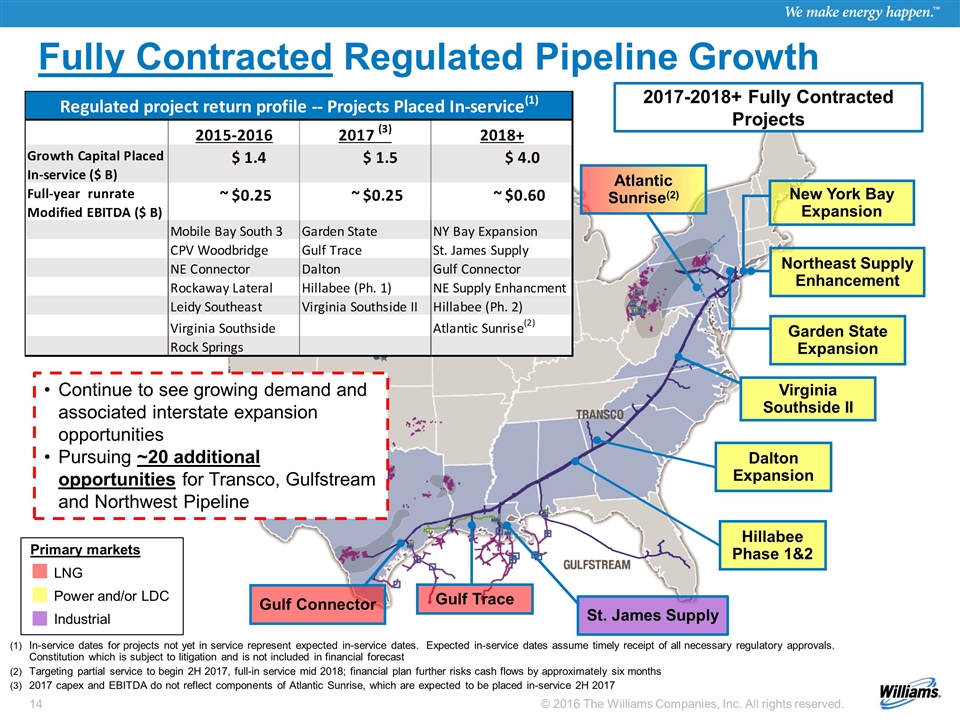
Fully Contracted Regulated Pipeline Growth In-service dates for projects not yet in service represent expected in-service dates. Expected in-service dates assume timely receipt of all necessary regulatory approvals. Constitution which is subject to litigation and is not included in financial forecast Targeting partial service to begin 2H 2017, full-in service mid 2018; financial plan further risks cash flows by approximately six months 2017 capex and EBITDA do not reflect components of Atlantic Sunrise, which are expected to be placed in-service 2H 2017 Virginia Southside II Dalton Expansion Hillabee Phase 1&2 Garden State Expansion Atlantic Sunrise(2) St. James Supply Gulf Trace New York Bay Expansion Gulf Connector Northeast Supply Enhancement Continue to see growing demand and associated interstate expansion opportunities Pursuing ~20 additional opportunities for Transco, Gulfstream and Northwest Pipeline 2017-2018+ Fully Contracted Projects Primary markets LNG Power and/or LDC Industrial Regulated project return profile -- Projects Placed In-service(1) 2015-2016 2017 (3) 2018+ Growth Capital Placed In-service ($ B) $1.4279999999999999 $1.4974000000000001 $4.0350000000000001 Full-year runrate Modified EBITDA ($ B) ~ $0.25 ~ $0.25 ~ $0.60 Mobile Bay South 3 Garden State NY Bay Expansion CPV Woodbridge Gulf Trace St. James Supply NE Connector Dalton Gulf Connector Rockaway Lateral Hillabee (Ph. 1) NE Supply Enhancment Leidy Southeast Virginia Southside II Hillabee (Ph. 2) Virginia Southside Atlantic Sunrise(2) Rock Springs Average Regulated IRR Mid to low 'teens 0.0% 0.0% 0.0% A-S 200% Capital %, 2017 Cap Mobile Bay South 3 $46.2 Garden State $151.4 NY Bay Expansion $121 CPV Woodbridge $41.6 Gulf Trace $279 St. James Supply $29 NE Connector $49.8 Dalton $583 Gulf Connector $176 Exact Fcst Rockaway Lateral $337.2 Hillabee (Ph. 1) $291 NE Supply Enhancment $940 2016 2017 Leidy Southeast $585.5 Virginia Southside 2 $193 Hillabee (Ph. 2) $119 341 244 145 30 Virginia Southside $279.7 Atlantic Sunrise $0 Atlantic Sunrise $2,650 1 72 255 210 0 2650 Rock Springs $88 84 0 121 193 $1,428 $1,497.4 $4,035 77 155 Runrate EBITDA 0 729 EBITDA Mobile Bay South 3 $9.9 Garden State $22.4 NY Bay Expansion $22 CPV Woodbridge $6.3 Gulf Trace $53.6 St. James Supply $5.4 NE Connector $77.5 Dalton $72 Gulf Connector $34.799999999999997 Rockaway Lateral Hillabee (Ph. 1) $47.9 NE Supply Enhancment $105.8 Leidy Southeast $106.6 Virginia Southside 2 $37.6 Hillabee (Ph. 2) $19.2 Virginia Southside $43.2 Atlantic Sunrise $0 Atlantic Sunrise $399.4 1 399.4 Rock Springs $13.3 $256.8 $233.5 $586.59999999999991 ROIC: Run rate EBITDA / Capital Mobile Bay South 3 0.21428571428571427 Garden State 0.14795244385733156 NY Bay Expansion 0.18181818181818182 CPV Woodbridge 0.15144230769230768 Gulf Trace 0.1921146953405018 St. James Supply 0.18620689655172415 NE Connector 0.20025839793281655 Dalton 0.1234991423670669 Gulf Connector 0.19772727272727272 Rockaway Lateral Hillabee (Ph. 1) 0.16460481099656357 NE Supply Enhancment 0.1125531914893617 Leidy Southeast 0.182066609735269 Virginia Southside 2 0.19481865284974095 Hillabee (Ph. 2) 0.16134453781512603 Virginia Southside 0.15445119771183413 Atlantic Sunrise #DIV/0! Rock Springs 0.15113636363636365 0.17983193277310924 0.15593695739281421 0.14537794299876081
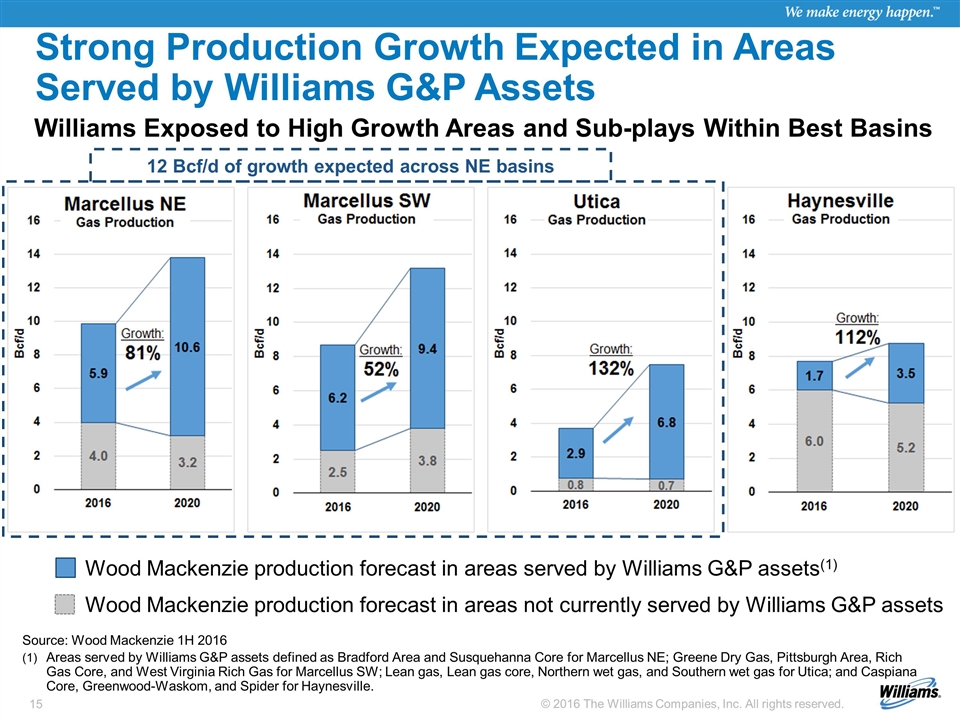
Williams Exposed to High Growth Areas and Sub-plays Within Best Basins Source: Wood Mackenzie 1H 2016 Areas served by Williams G&P assets defined as Bradford Area and Susquehanna Core for Marcellus NE; Greene Dry Gas, Pittsburgh Area, Rich Gas Core, and West Virginia Rich Gas for Marcellus SW; Lean gas, Lean gas core, Northern wet gas, and Southern wet gas for Utica; and Caspiana Core, Greenwood-Waskom, and Spider for Haynesville. Wood Mackenzie production forecast in areas served by Williams G&P assets(1) Wood Mackenzie production forecast in areas not currently served by Williams G&P assets Strong Production Growth Expected in Areas Served by Williams G&P Assets 12 Bcf/d of growth expected across NE basins
Goal: add to our $7 billion of fully contracted 2015-2020 expansions $7 billion of fully contracted Transco expansions are planned to be placed into service 2015-2020 – all supported by long-term firm demand charge contracts Pursuing numerous additional expansion opportunities: Transco, Gulfstream and Northwest Pipeline developing ~20 prospective projects ~4 year development cycle drives early planning for projects with 2020+ ISD Potential projects are primarily demand pull and include expansion of our mainline along existing corridors and pipeline laterals Power generation (new build gas fire and coal conversion) Industrial demand (methanol, other olefins, manufacturing, etc.) LDC demand (residential, commercial and small industrial) LNG / Mexican exports (next tranche of export projects have a lower probability of success) Most opportunities range from $100 MM to $200 MM of capital Smaller number of large scale opportunities exist, but higher returns available Expect further opportunities to develop driven by growing markets our pipelines serve Pace of expansion opportunities will be impacted by changes in market dynamics Regulated Pipeline Project Opportunities Expected to Increase Firm Demand Charge Revenue
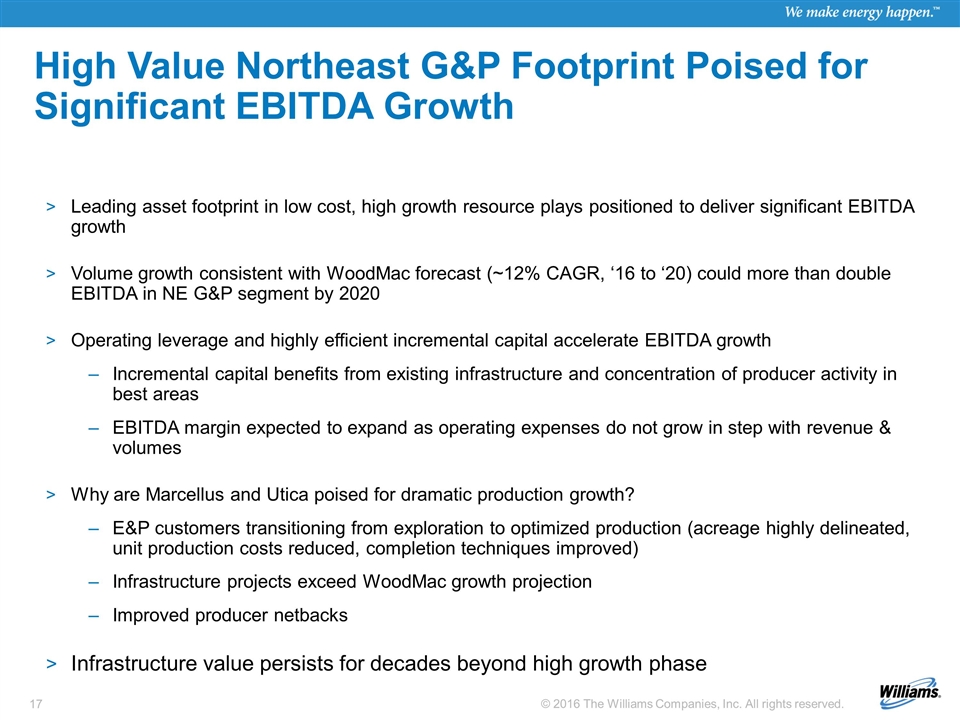
Leading asset footprint in low cost, high growth resource plays positioned to deliver significant EBITDA growth Volume growth consistent with WoodMac forecast (~12% CAGR, ‘16 to ‘20) could more than double EBITDA in NE G&P segment by 2020 Operating leverage and highly efficient incremental capital accelerate EBITDA growth Incremental capital benefits from existing infrastructure and concentration of producer activity in best areas EBITDA margin expected to expand as operating expenses do not grow in step with revenue & volumes Why are Marcellus and Utica poised for dramatic production growth? E&P customers transitioning from exploration to optimized production (acreage highly delineated, unit production costs reduced, completion techniques improved) Infrastructure projects exceed WoodMac growth projection Improved producer netbacks Infrastructure value persists for decades beyond high growth phase High Value Northeast G&P Footprint Poised for Significant EBITDA Growth
Non-GAAP Reconciliations 9
This presentation may include certain financial measures – adjusted EBITDA, distributable cash flow and cash distribution coverage ratio – that are non-GAAP financial measures as defined under the rules of the Securities and Exchange Commission. Our segment performance measure, modified EBITDA, is defined as net income (loss) before income tax expense, net interest expense, equity earnings from equity-method investments, other net investing income, impairments of equity investments and goodwill, depreciation and amortization expense, and accretion expense associated with asset retirement obligations for nonregulated operations. We also add our proportional ownership share (based on ownership interest) of modified EBITDA of equity-method investments. Adjusted EBITDA further excludes items of income or loss that we characterize as unrepresentative of our ongoing operations and may include assumed business interruption insurance related to the Geismar plant. Management believes these measures provide investors meaningful insight into results from ongoing operations. We define distributable cash flow as adjusted EBITDA less maintenance capital expenditures, cash portion of interest expense, income attributable to noncontrolling interests and cash income taxes, plus WPZ restricted stock unit non-cash compensation expense and certain other adjustments that management believes affects the comparability of results. Adjustments for maintenance capital expenditures and cash portion of interest expense include our proportionate share of these items of our equity-method investments. We also calculate the ratio of distributable cash flow to the total cash distributed (cash distribution coverage ratio). This measure reflects the amount of distributable cash flow relative to our cash distribution. We have also provided this ratio using the most directly comparable GAAP measure, net income (loss). This news release is accompanied by a reconciliation of these non-GAAP financial measures to their nearest GAAP financial measures. Management uses these financial measures because they are accepted financial indicators used by investors to compare company performance. In addition, management believes that these measures provide investors an enhanced perspective of the operating performance of the Partnership's assets and the cash that the business is generating. Neither adjusted EBITDA nor distributable cash flow are intended to represent cash flows for the period, nor are they presented as an alternative to net income or cash flow from operations. They should not be considered in isolation or as substitutes for a measure of performance prepared in accordance with United States generally accepted accounting principles. Non-GAAP Disclaimer (WPZ)
This presentation may include certain financial measures – adjusted EBITDA, distributable cash flow, cash available for dividends and other uses, dividend coverage and cash distribution coverage ratio – that are non-GAAP financial measures as defined under the rules of the Securities and Exchange Commission. Our segment performance measure, modified EBITDA, is defined as net income (loss) before income tax expense, net interest expense, equity earnings from equity-method investments, other net investing income, impairments of equity investments and goodwill, depreciation and amortization expense, and accretion expense associated with asset retirement obligations for nonregulated operations. We also add our proportional ownership share (based on ownership interest) of modified EBITDA of equity-method investments. Adjusted EBITDA further excludes items of income or loss that we characterize as unrepresentative of our ongoing operations and may include assumed business interruption insurance related to the Geismar plant. Management believes these measures provide investors meaningful insight into results from ongoing operations. We define distributable cash flow as adjusted EBITDA less maintenance capital expenditures, cash portion of interest expense, income attributable to noncontrolling interests and cash income taxes, plus WPZ restricted stock unit non-cash compensation expense and certain other adjustments that management believes affects the comparability of results. Adjustments for maintenance capital expenditures and cash portion of interest expense include our proportionate share of these items of our equity-method investments. Cash available for dividends and other uses is defined as cash received from our ownership in MLPs, cash received (used) by the Williams NGL & Petchem Services segment (other than cash for capital expenditures) less interest, taxes and maintenance capital expenditures associated with Williams and not the underlying MLPs. We also calculate the ratio of cash available for dividends and other uses to the total cash dividends paid (dividend coverage ratio). This measure reflects our cash available for dividends and other uses relative to actual cash dividends paid. We also calculate the ratio of distributable cash flow to the total cash distributed (cash distribution coverage ratio). This measure reflects the amount of distributable cash flow relative to our cash distribution. We have also provided this ratio using the most directly comparable GAAP measure, net income (loss). This presentation is accompanied by a reconciliation of these non-GAAP financial measures to their nearest GAAP financial measures. Management uses these financial measures because they are accepted financial indicators used by investors to compare company performance. In addition, management believes that these measures provide investors an enhanced perspective of the operating performance of the Partnership's assets and the cash that the business is generating. Neither adjusted EBITDA nor distributable cash flow are intended to represent cash flows for the period, nor are they presented as an alternative to net income or cash flow from operations. They should not be considered in isolation or as substitutes for a measure of performance prepared in accordance with United States generally accepted accounting principles. Non-GAAP Disclaimer (WMB)
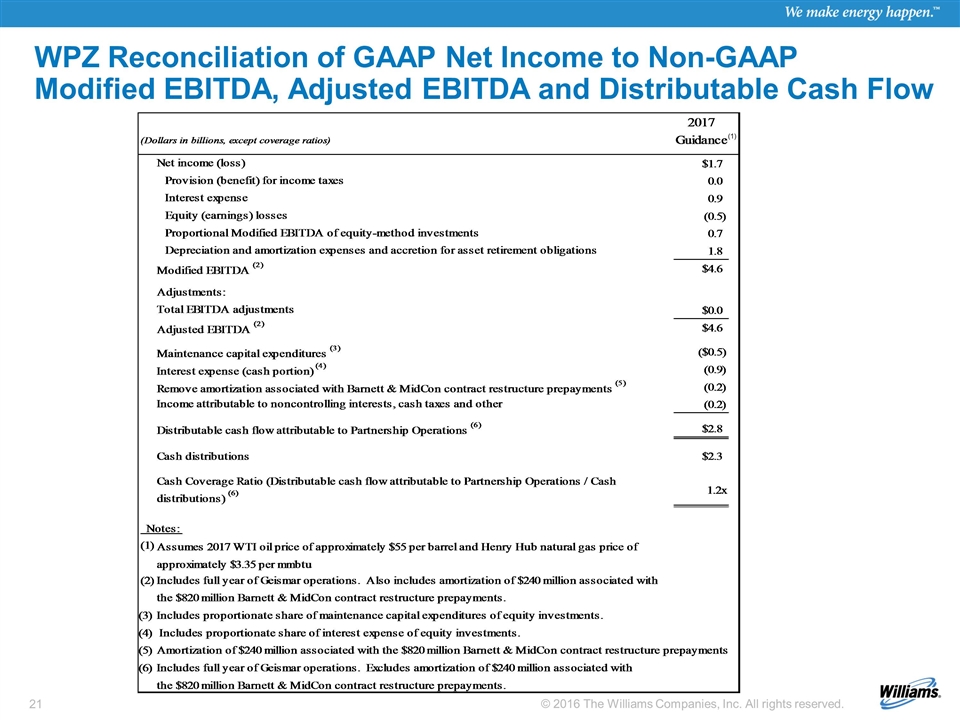
WPZ Reconciliation of GAAP Net Income to Non-GAAP Modified EBITDA, Adjusted EBITDA and Distributable Cash Flow (1) WPZ Reconciliation of GAAP Net Income to Non-GAAP Modified EBITDA, Adjusted EBITDA and Distributable Cash Flow 2017 (Dollars in billions, except coverage ratios) Guidance Net income (loss) $1.7 Provision (benefit) for income taxes 0 Interest expense 0.9 Equity (earnings) losses -0.5 Proportional Modified EBITDA of equity-method investments 0.7 Depreciation and amortization expenses and accretion for asset retirement obligations 1.8 Modified EBITDA (2) $4.5999999999999996 Adjustments: Total EBITDA adjustments $0 Adjusted EBITDA (2) $4.5999999999999996 Maintenance capital expenditures (3) $-0.5 Interest expense (cash portion) (4) -0.9 Remove amortization associated with Barnett & MidCon contract restructure prepayments (5) -0.2 Income attributable to noncontrolling interests, cash taxes and other -0.2 Distributable cash flow attributable to Partnership Operations (6) $2.7999999999999994 Cash distributions $2.2999999999999998 Cash Coverage Ratio (Distributable cash flow attributable to Partnership Operations / Cash distributions) (6) 1.2173913043478259 Notes: (1) Assumes 2017 WTI oil price of approximately $55 per barrel and Henry Hub natural gas price of approximately $3.35 per mmbtu (2) Includes full year of Geismar operations. Also includes amortization of $240 million associated with the $820 million Barnett & MidCon contract restructure prepayments. (3) Includes proportionate share of maintenance capital expenditures of equity investments. (4) Includes proportionate share of interest expense of equity investments. (5) Amortization of $240 million associated with the $820 million Barnett & MidCon contract restructure prepayments. (6) Includes full year of Geismar operations. Excludes amortization of $240 million associated with the $820 million Barnett & MidCon contract restructure prepayments.
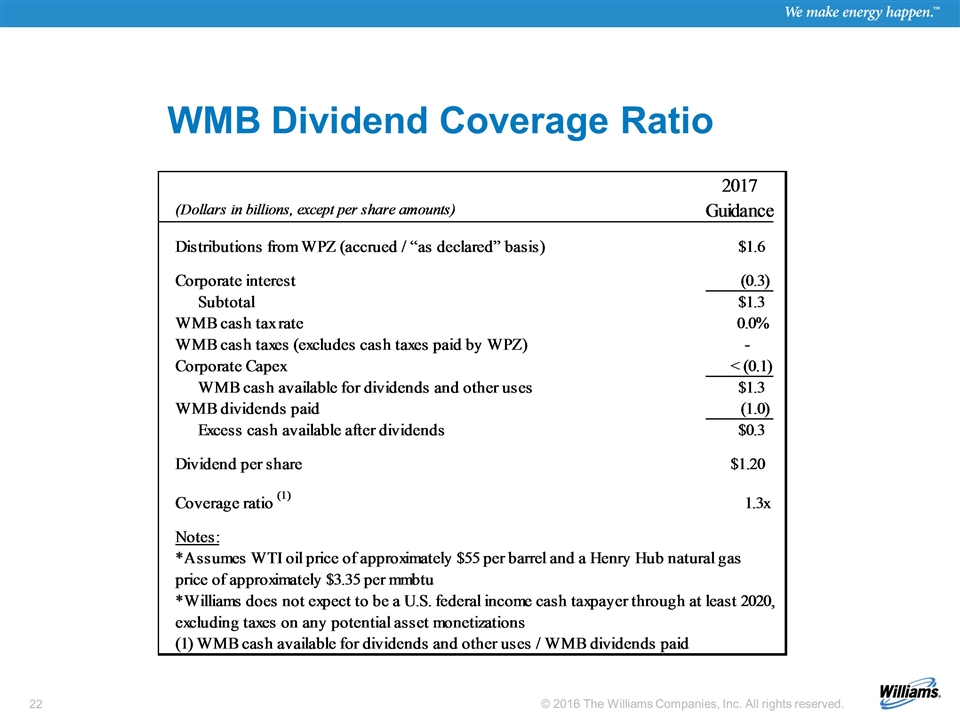
WMB Dividend Coverage Ratio WMB Dividend Coverage Ratio 2017 (Dollars in billions, except per share amounts) Guidance Distributions from WPZ (accrued / “as declared” basis) $1.6 Corporate interest -0.3 Subtotal $1.3 WMB cash tax rate 0.0% WMB cash taxes (excludes cash taxes paid by WPZ) 0 Corporate Capex < (0.1) WMB cash available for dividends and other uses $1.3 WMB dividends paid -1 Excess cash available after dividends $0.30000000000000004 Dividend per share $1.2 Coverage ratio (1) 1.3 Notes: *Assumes WTI oil price of approximately $55 per barrel and a Henry Hub natural gas price of approximately $3.35 per mmbtu *Williams does not expect to be a U.S. federal income cash taxpayer through at least 2020, excluding taxes on any potential asset monetizations (1) WMB cash available for dividends and other uses / WMB dividends paid
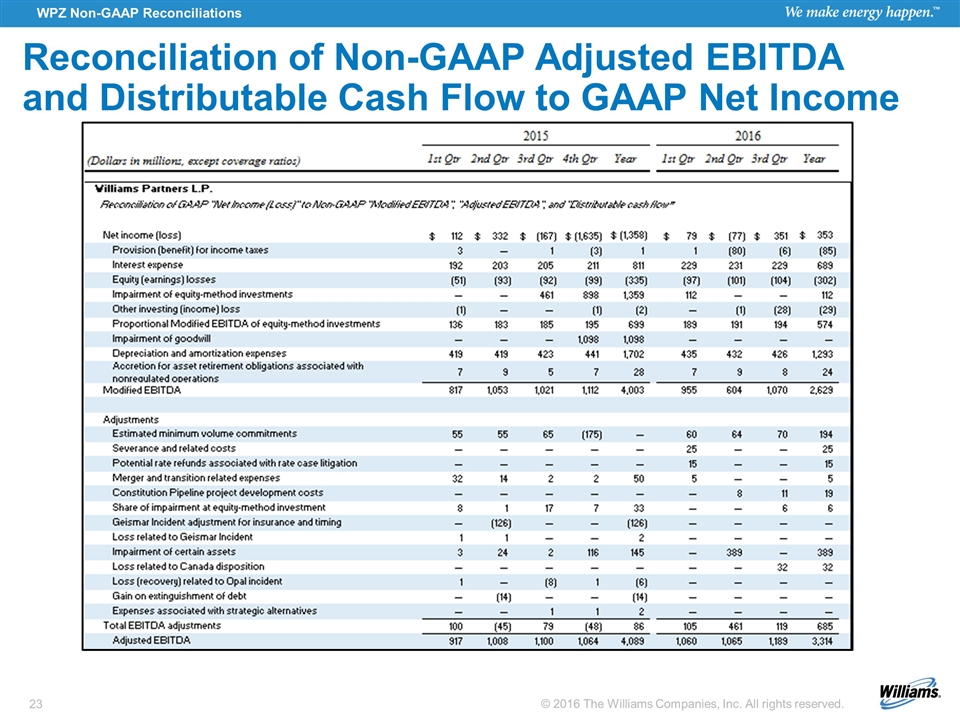
WPZ Non-GAAP Reconciliations Reconciliation of Non-GAAP Adjusted EBITDA and Distributable Cash Flow to GAAP Net Income
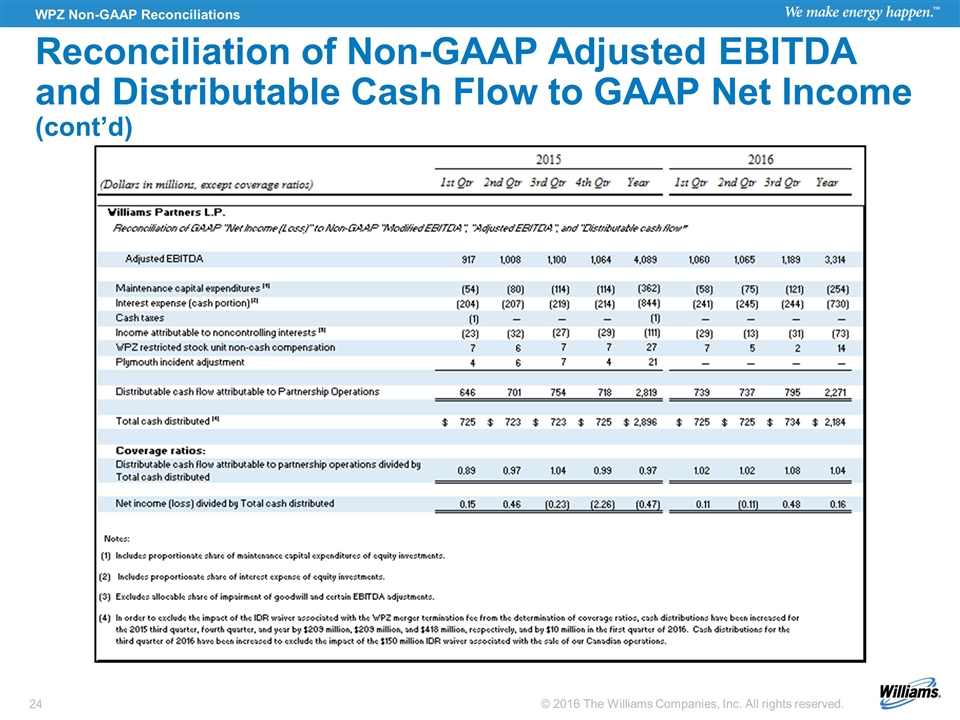
WPZ Non-GAAP Reconciliations Reconciliation of Non-GAAP Adjusted EBITDA and Distributable Cash Flow to GAAP Net Income (cont’d)


