Table of Contents
UNITED STATES
SECURITIES AND EXCHANGE COMMISSION
Washington, D.C. 20549
SCHEDULE 14A
Proxy Statement Pursuant to Section 14(a) of the
Securities Exchange Act of 1934
Filed by the Registrant ☒ Filed by a Party other than the Registrant ☐
Check the appropriate box:
| ☐ | Preliminary Proxy Statement | |||
| ☐ | Confidential, for Use of the Commission Only (as permitted by Rule 14a-6(e)(2)) | |||
| ☒ | Definitive Proxy Statement | |||
| ☐ | Definitive Additional Materials | |||
| ☐ | Soliciting Material under §240.14a-12 | |||
The Williams Companies, Inc. | ||||
(Name of Registrant as Specified In Its Charter) | ||||
(Name of Person(s) Filing Proxy Statement, if other than the Registrant) | ||||
| Payment of Filing Fee (Check the appropriate box): | ||||
| ☒ | No fee required. | |||
| ☐ | Fee paid previously with preliminary materials. | |||
| ☐ | Fee computed on table in exhibit required by Item 25(b) per Exchange Act Rules 14a-6(i)(1) and 0-11 | |||
Table of Contents

Table of Contents
| Chair and CEO Letter
|
March 16, 2023
Dear Fellow Williams Stockholder,
|  |
On behalf of Williams and the Board of Directors, we cordially invite you to our annual meeting of stockholders on April 25, 2023, at 2 p.m. Central Daylight Time. The meeting is once again completely virtual, thus allowing more of our stockholders to participate. During the meeting, we will cover the items of business described in the pages that follow as well as provide a company update and question-and-answer session.
This past year was extraordinary for Williams as we executed on our mission to provide the best transport, storage, and delivery solutions to reliably fuel the clean energy economy. The company moved record volumes of natural gas, expanded our footprint through strategic acquisitions and new projects, and exceeded our financial guidance on all key metrics all while further reducing our leverage. We returned more than $2 billion in dividends this past year to stockholders, continuing a trend started in 1974 of reliably paying dividends every quarter. Our track record speaks for itself, but we are also confident in the continued growth on our systems. We have a large number of fully contracted high return projects in the execution phase. Additionally, the demand for our capacity and services continues to build our book of business for the future.
In 2022, Williams outpaced the industry in key sustainability rankings – including CDP and the Dow Jones Sustainability Index (“DJSI”). Williams was named for the third consecutive year to the DJSI North America index and for the second consecutive year to the DJSI World index. These scores validate the emphasis Williams places on reducing emissions, maintaining strong corporate governance, and providing
metrics that highlight our focus on serving the long-term stockholder.
Williams’ leadership is committed to continually improving our understanding of the needs and priorities of the people who our business touches, including employees, customers, stockholders, and the communities where we operate. We have been focused on an inclusive culture for a long time. Not because it is popular, but because we want all of our employees to be passionate about making Williams the very best. To be the best, we need to attract and retain the very best talent from the biggest talent pool possible.
To be the midstream leader in the clean energy economy, we know we have more work to do. Our employees and leadership are more motivated than ever to solve the challenges society faces today around energy security, affordability, and climate change while continuing to deliver consistently stable returns to our stockholders.
If any company can do it, Williams can. We have the scale, the strategy, and the impassioned workforce to drive significant change for our industry in the years ahead. We thank you for your investment in Williams and look forward to your attendance on April 25th.
Sincerely,
 |  | |
| Alan S. Armstrong | Stephen W. Bergstrom | |
| Chief Executive Officer | Board Chair |
Table of Contents
| NOTICE OF THE 2023 ANNUAL |
| MEETING OF STOCKHOLDERS |
Date & Time Tuesday, April 25, 2023 at 2:00 p.m. CDT
Place This year’s annual meeting of stockholders (“Annual Meeting”) will be conducted online via live, audio webcast at www.meetnow.global/ MN2VXTR. There will be no in-person meeting.
Record Date The record date is the close of business on February 24, 2023. Stockholders of record at such time are entitled to receive notice of and to participate and vote at the Annual Meeting or any adjournments or postponements of the meeting. | How to Attend the Meeting
To attend the Annual Meeting, access the Internet and go to the following site: www.meetnow.global/MN2VXTR.
• If you are (i) a stockholder of record or (ii) a beneficial holder who has obtained a control number from Computershare (each of (i) and (ii) is a “Voting Eligible Party”), then select “Join Meeting Now,” enter your control number located on the Notice of Internet Availability of Proxy Materials, your proxy card or received from Computershare and enter your first and last name and your email address.
• If you are not a Voting Eligible Party, select “Guest,” enter your first and last name, and enter your email address.
|
| ||||||||||||
| Agenda | ||||||||||||||
Proposal | | Board Recommendation | | Page | ||||||||||
|
|
| 1. Elect 12 director nominees for a one-year term. | FOR each nominee | 8 | |||||||||
|
|
| 2. Ratify the selection of Ernst & Young LLP as the Company’s independent registered public accounting firm for the fiscal year ending December 31, 2023. | FOR | 47 | |||||||||
|
|
| 3. Approve, on an advisory basis, the compensation of our named executive officers. | FOR | 50 | |||||||||
|
|
| 4. Approve, on an advisory basis, the frequency of future advisory votes to approve the compensation of our named executive officers. | EVERY YEAR | 51 | |||||||||
|
|
| 5. Transact such other business as may properly come before the Annual Meeting or any adjournments or postponements thereof. | — | — | |||||||||
How to Vote
 |
|
|
|
| ||||
By Internet Vote via the Internet at www.envisionreports. | By Mail If you received a printed version of the proxy materials, mark, sign, date, and return the proxy card in the enclosed postage-paid envelope. | By Phone Call toll-free 1-800- Canada. | Attend the Virtual Meeting Attend the virtual Annual Meeting (steps above) and click on the “Vote” bar. | Scan QR Code Scan the QR code on your proxy card. |


For further instructions on voting, please see the “Questions and Answers about the Annual Meeting and Voting” section of the proxy statement, refer to the Notice of Annual Meeting you received in the mail, or, if you received a printed version of the proxy materials by mail, refer to the enclosed proxy card. Please refer to the proxy statement for more information, including a detailed explanation of the matters being submitted to a vote of the stockholders.
By Order of the Board of Directors,
Robert E. Riley, Jr. Vice President and Assistant General Counsel – Corporate Secretary and Corporate Strategic Development March 16, 2023 | IMPORTANT NOTICE REGARDING THE AVAILABILITY OF PROXY MATERIALS FOR THE ANNUAL MEETING OF STOCKHOLDERS TO BE HELD ON APRIL 25, 2023 We encourage you to access and review all of the important information contained in the proxy materials before voting. The Notice of Annual Meeting, 2023 proxy statement, and 2022 Annual Report, which includes a copy of our annual report on Form 10-K for the fiscal year ended December 31, 2022 (“2022 Annual Report”), are available at www.edocumentview.com/wmb. | |
Table of Contents
| TABLE OF CONTENTS |
| Environmental, Social and Governance (“ESG”) Topics | ||||||||
| 12 | ||||||||
| 36 | ||||||||
| Code of Conduct for Suppliers and Contractors | 27 | |||||||
| 23 | ||||||||
| 42 | ||||||||
| 42 | ||||||||
| 27 | ||||||||
| 6 | ||||||||
| 5 | ||||||||
| 24 | ||||||||
| 35 | ||||||||
| 39 | ||||||||
| ||||||||

Table of Contents
|
| EXECUTIVE SUMMARY |
OUR COMPANY
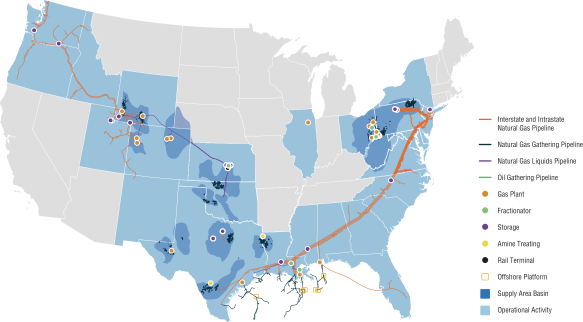
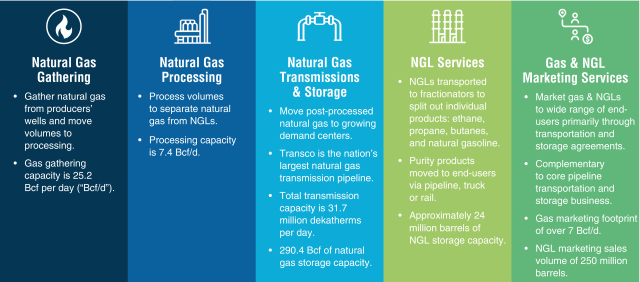
The Williams Companies, Inc. (“Williams”) is an energy company committed to being the leader in providing infrastructure that safely delivers natural gas products to reliably fuel the clean energy economy. As of February 27, 2023, we have operations in 14 supply areas that provide natural gas gathering, processing, and transmission services, natural gas liquids (“NGL”) fractionation, transportation, storage services, and marketing services to more than 700 customers. We own an interest in and operate more than 33,000 miles of pipelines in 25 states, 29 natural gas processing facilities, 7 NGL fractionation facilities, approximately 24 million barrels of NGL storage capacity, and 290.4 billion cubic feet of natural gas (“Bcf”) of natural gas storage capacity. We handle approximately one-third of the natural gas in the United States that is used every day for clean-power generation, heating, and industrial use.
* Figures represent 100% capacity for operated assets, including those in which Williams has a share of ownership as of December 31, 2022, and includes Mountain West systems acquired February 14, 2023.
| WILLIAMS COMPANIES | 2023 PROXY STATEMENT | 1 |
Table of Contents
| Executive Summary
|
OUR 2022 FINANCIAL HIGHLIGHTS
| ||||||||||||||||||
| GAAP Net Income(1) | Non-GAAP Adjusted EBITDA(2) | GAAP Earnings Per Share(1) | Non-GAAP Adjusted Earnings Per Share(2) | |||||||||||||||||
$2.046 billion up 35% vs. 2021 | $6.42 billion up 14% vs. 2021 | $1.67 up 35% vs. 2021 | $1.82 up 34% vs. 2021 | |||||||||||||||||
| Cash Flow From Operations | Available Funds From Operations(2) | Dividend Coverage Ratio | Net Debt-to-Adjusted EBITDA(3) | |||||||||||||||||
$4.89 billion up 24% vs. 2021 | $4.92 billion up 21% vs. 2021 | 2.37x (AFFO basis) | 3.55x improvement of 0.35x vs. 2021 | |||||||||||||||||
(1) Net income amounts are from continuing operations attributable to The Williams Companies, Inc. available to common stockholders. Per share amounts are reported on a diluted basis.
(2) A reconciliation of all non-GAAP financial measures to their nearest GAAP comparable financial measures is included in the Appendix.
(3) Does not represent leverage ratios measured for the Williams credit agreement compliance or leverage ratios as calculated by major credit agencies. Debt is net of cash on hand.
OUR 2022 AND MORE RECENT ESG HIGHLIGHTS
At Williams, we understand the direct link between sustainable business operations, corporate stewardship, and long-term financial success. We approach sustainability with the mindset that, while our mission includes safely delivering natural gas products, our business is about people: our customers, our investors, our employees, and our communities. By integrating ESG practices throughout the Company and into our everyday operations, we hold ourselves accountable through transparent interactions with customers, employees, and stockholders. We rank No. 1 in our peer group on the S&P Global’s Corporate Sustainability Assessment, and we were named to both the Dow Jones Sustainability North American index and the Dow Jones Sustainability World index. Newsweek magazine named Williams one of America’s Most Responsible Companies 2023, and we scored 95 out of 100 on the Human Rights Campaign’s 2023 Corporate Equality Index Criteria. Some of our recent work includes the following:
| Environmental | Social | Governance | ||
• Added and outperformed a methane emissions reduction metric in our annual incentive program.
• Expanded the Task Force on Climate Related Financial Disclosures (“TCFD”)-aligned disclosures in our 2021 Sustainability Report while maintaining our limited third-party assurance.
• In January 2023, joined the Oil and Gas Methane Partnership 2.0 (“OGMP 2.0”) Methane Initiative, a measurement-based international methane emissions reporting framework. | • Published our Diversity and Inclusion Report externally to our website for the first time in March 2022.
• Published our EEO-1 Survey data to our website in March 2022 with annual updates.
• Launched inaugural volunteer week.
• Continued using a third party to conduct annual pay equity analysis. | • Updated 3 out of 4 Board of Director (“Board”) committee charters to formalize existing practices and clarify the delineation of oversight between the full Board and Board committees in several key areas: ESG (including matters related to climate change and energy transition), human capital management, and cybersecurity. |
| 2 |
Table of Contents
| Executive Summary
|
OUR CORPORATE GOVERNANCE
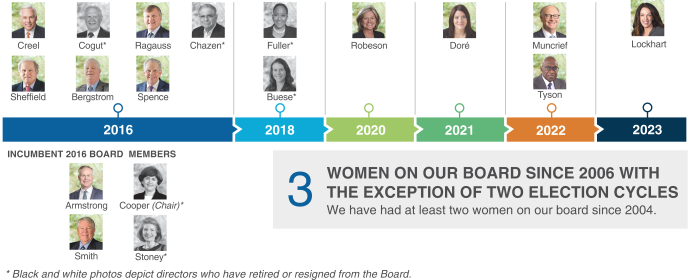
The Board has nominated the following 12 director candidates to serve one-year terms as directors of the Company following the Annual Meeting until the 2024 annual meeting of stockholders: Alan S. Armstrong, Stephen W. Bergstrom, Michael A. Creel, Stacey H. Doré, Carri A. Lockhart, Richard E. Muncrief, Peter A. Ragauss, Rose M. Robeson, Scott D. Sheffield, Murray D. Smith, William H. Spence, and Jesse J. Tyson. Effective February 10, 2023, Nancy K. Buese resigned from the Board, and Ms. Lockhart joined the Board.
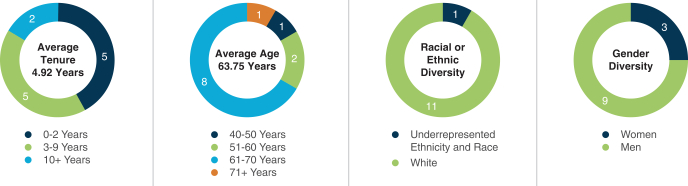
Board Composition*
Our Board and its Governance and Sustainability Committee annually evaluate the Board’s effectiveness and needs and identify director nominees to fill our current and anticipated future needs. The Board seeks a variety of occupational and personal backgrounds to oversee the policies, strategies, risk, and management of the Company. All of our director nominees have the skills, experience, and attributes to fit our strategy.
|
8% RACIALLY/ ETHNICALLY DIVERSE
| |||||||
|  |  | ||||||
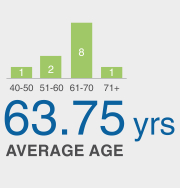
* Reflects the anticipated composition of the Board at the conclusion of the Annual Meeting, assuming stockholders elect all nominees to the Board. Age is calculated as of April 25, 2023.
Board Refreshment Timeline
| WILLIAMS COMPANIES | 2023 PROXY STATEMENT | 3 |
Table of Contents
| Executive Summary
|
OUR BOARD*
Name and Principal Occupation | Age | Director Since | Independent | Committee Memberships | Other Current Public Company Boards | |||||||||||||
| Alan S. Armstrong President & Chief Executive Officer, |
| 60 |
|
| 2011 |
|
|
|
| None | BOK Financial Corporation | ||||||
| Stephen W. Bergstrom Retired Board Chair, President & Chief Executive Officer, American Midstream Partners, GP, LLC |
| 65 |
|
| 2016 |
| ✓ | Non-Executive Board Chair; COMP; GOV | None | ||||||||
| Michael A. Creel Retired Director & Chief Executive Officer, Enterprise Products Partners L.P. |
| 69 |
|
| 2016 |
| ✓ | AUDIT; EHS (Chair) | None | ||||||||
| Stacey H. Doré Executive Vice President of Public Affairs and Chief Strategy and Sustainability Officer, Vistra Corp. |
| 50 |
|
| 2021 |
| ✓ | AUDIT; GOV (Chair) | None | ||||||||
| Carri A. Lockhart Retired Executive Vice President, Technology, Digital, and Innovation Equinor |
| 51 |
|
| 2023 |
| ✓ | COMP; EHS | Dril-Quip, Inc. | ||||||||
| Richard E. Muncrief Director, President & Chief Executive Officer, Devon Energy Corporation |
| 64 |
|
| 2022 |
| ✓ | COMP; EHS | Devon Energy Corporation | ||||||||
| Peter A. Ragauss Retired Senior Vice President & Chief Financial Officer, Baker Hughes Company |
| 65 |
|
| 2016 |
| ✓ | AUDIT; GOV | APA Corporation | ||||||||
| Rose M. Robeson Retired Group Vice President & Chief Financial Officer, DCP Midstream LLC |
| 62 |
|
| 2020 |
| ✓ | AUDIT (Chair); EHS | SM Energy Company Newpark Resources, Inc. | ||||||||
| Scott D. Sheffield Director & Chief Executive Officer, Pioneer Natural Resources Company |
| 70 |
|
| 2016 |
| ✓ | COMP; EHS | Pioneer Natural Resources Company | ||||||||
| Murray D. Smith President of Murray D. Smith and Associates, Former Minister of Energy for Alberta, Canada |
| 73 |
|
| 2012 |
| ✓ | COMP; EHS | Surge Energy Inc. | ||||||||
| William H. Spence Retired Board Chair, President & Chief Executive Officer, PPL Corporation |
| 66 |
|
| 2016 |
| ✓ | COMP (Chair); GOV | Pinnacle West Capital Corporation | ||||||||
| Jesse J. Tyson Retired President & Chief Executive Officer, ExxonMobil Inter-Americas |
| 70 |
|
| 2022 |
| ✓ | AUDIT; GOV | None | ||||||||
| Resigned from the Board effective February 10, 2023 | ||||||||||||||||||
| Nancy K. Buese* Chief Financial Officer, Baker Hughes Company |
| 53 |
|
| 2018 |
| ✓ | COMP; EHS | None | ||||||||


*Reflects the anticipated composition of the Board at the conclusion of the Annual Meeting, assuming stockholders elect all nominees to the Board. Age is calculated as of April 25, 2023.
AUDIT | Audit | |||||||
COMP EHS GOV | Compensation and Management Development Environmental, Health and Safety Governance and Sustainability |
67%
| of our directors have energy transition experience, including through serving as a chief sustainability officer, current or former service as executives or directors for companies heavily involved in tackling emissions reduction, carbon capture, nuclear, wind, solar, and battery storage, and involvement with organizations developing emission reporting frameworks. | |||||
| 4 |
Table of Contents
| Executive Summary
|
OUR GOVERNANCE BEST PRACTICES
Our Board believes that strong corporate governance is critical to achieving our goals and maintaining the trust and confidence of investors, employees, customers, business partners, regulatory agencies, and other stakeholders. Our policies and best practices for good corporate governance include the following:
Director Independence and Board Leadership | • 11 of 12 director nominees are independent.
• Only independent directors serve on Board committees.
• The Board and its committees conduct regular executive sessions without management.
• Board committees utilize an independent registered public accountant and independent compensation consultant.
• The roles of Board Chair and Chief Executive Officer (“CEO”) have been split since 2011. | |
Board Refreshment and Director Qualifications and Evaluation | • The Board is committed to finding highly qualified candidates that offer a wide variety of perspectives, including candidates of diverse race, ethnicity, and gender:
g In 2021, the Board adopted the “Rooney Rule” requiring the consideration of director candidates with a diversity of race, ethnicity, and gender for director vacancies and newly created directorships.
g Effective February 1, 2023, 50% of our standing Board committees (2 of 4) are chaired by a woman.
• Our director retirement policy provides for retirement at the annual meeting after a director turns 75.
• The Board and its committees conduct annual performance self-evaluations.
• The Governance and Sustainability Committee routinely evaluates the size, structure, composition, and function of the Board and its committees. | |
Board and Committee Oversight | • The Board and the Compensation and Management Development Committee annually engage in comprehensive senior management succession planning.
• The Board at least annually evaluates our long-term strategy, risks, and opportunities.
• The Board or its committees exercise strategic oversight over Company risk, including our ESG strategy and policies, cybersecurity, political contributions, human capital management, environmental, health and safety (“EH&S”) matters, and our Ethics and Compliance Program.
| |
Governance Practices | • Review of corporate governance documents annually, including Board committee charters.
• Prohibit pledging, hedging, short sales, and derivative transactions by directors, officers,
• Maintain stock ownership guidelines for directors, and all equity granted to directors remains deferred until retirement from the Board.
• Prohibit director overboarding so that no director serves on more than four public company boards (including our Board) and no Audit Committee member serves on the audit committee of more than three public companies (including our Audit Committee) without Board approval.
• Provide independently managed, toll-free Ethics Reporting Hotline.
• Present comprehensive director onboarding program and continuing education opportunities. | |
Stockholder Rights and Engagement | • Annual election of all directors.
• Majority voting standard for uncontested director elections (plurality voting in contested elections).
• Annual stockholder advisory vote on executive compensation.
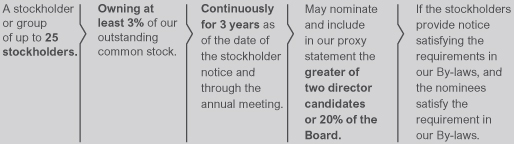
• Proxy access allowing holders of 3% of our stock for at least three years to include the greater of two nominees or nominees representing 20% of our Board in our proxy statement if they meet our By-law eligibility and notice requirements.
• Majority voting standard for the removal of directors, with or without cause.
• Robust year-round stockholder engagement process. | |


| WILLIAMS COMPANIES | 2023 PROXY STATEMENT | 5 |
Table of Contents
| Executive Summary
|
OUR COMPENSATION BEST PRACTICES
The Board and the Compensation and Management Development Committee oversee the design and administration of the compensation program for our CEO and other named executive officers (“NEOs”). The table below highlights the best practices the Compensation and Management Development Committee utilizes in the compensation process.
| What We Do |
 | Pay for Performance. A substantial portion of our CEO and NEOs’ compensation is at-risk and performance-based, which means the compensation they receive will vary every year depending on the Company’s stock price performance, the Company’s performance relative to pre-established performance targets, and the officer’s individual performance. |
| Publish Pre-Established Performance Goals and Fully Disclose Results. Our incentive compensation is aligned to both short-term and long-term Company performance with components that are subject to pre-established performance targets. |
| Independent Administration of Executive Compensation and Utilization of an Independent Compensation Consultant. The Compensation and Management Development Committee determines CEO and NEO pay. All members of the Compensation and Management Development Committee are independent, and the Compensation and Management Development Committee retains an independent compensation consultant to advise on our compensation program. |
| Benchmark Compensation Against a Representative Peer Group. With the assistance of our independent compensation consultant, we annually benchmark our compensation program against a compensation peer group determined based on several factors, including total assets, market capitalization, and enterprise value. |
| Engage with Stockholders to Discuss Executive Compensation. We annually ask stockholders to vote on an advisory basis to approve the compensation of our named executive officers (say-on-pay), and we regularly discuss executive compensation with our stockholders throughout the year. |
| Require Minimum Thresholds and Maximum Award Caps. All of our variable compensation plans have minimum thresholds that must be met prior to any payment and have caps on the total amount that can be paid. Our Annual Incentive Program (“AIP”) awards and our performance-based equity awards cap business performance at 200% of target. |
| Provide for Vesting Period on Stock Awards. All restricted stock unit (“RSU”) awards provided to our NEOs vest three years from the grant date. |
| Require a “Double Trigger” Prior to Equity or Severance Payments for a Change in Control. Severance payments and accelerated vesting of equity awards in the event of a change in control require both a change in control and a termination under certain circumstances without cause (“double trigger”), unless the acquiring company does not assume or replace the awards. |
| Allow Clawbacks of Executive Compensation. The Board may recoup performance-based incentive compensation in certain circumstances. |
| Review Tally Sheets and Pay History Information. Detailed information regarding current and past compensation for each NEO is reviewed prior to making compensation decisions. |
| Maintain Robust Equity Ownership Guidelines. We have established stock ownership guidelines to appropriately align the interests of our executive officers and directors with our stockholders. |
Stock Ownership Guidelines
| Multiple of Base Salary or Annual Cash Retainer | ||
| CEO | 6x | |
| Senior and Executive Vice Presidents | 3x | |
| Directors | 5x | |
| 6 |
Table of Contents
| Executive Summary
|
What We Don’t Do
|
 | No Employment Agreements. We do not have employment agreements with our NEOs other than standard change in control agreements. |
| No Cash Dividend Equivalents on RSUs Until Eligible RSUs Vest and are Distributed. We do not pay cash dividend equivalents on eligible RSUs until the units are earned and distributed to the recipient. |
| No Excise Tax Gross Up Payments. Our change in control plan does not provide for excise tax gross up payments. |
| No Excessive Perquisites. |
| No Repricing or Replacing Underwater Stock Options. |
| No Pricing Stock Options Below Grant Date Fair Market Value. |
| No Hedging or Pledging of Company Stock. Our Policy on Securities Trading prohibits our directors, officers, and employees from engaging in hedging activities related to our securities or from pledging our securities as collateral for a loan. |
| No Share Recycling. We do not allow share recycling for stock options. |
OUR PAY FOR PERFORMANCE PHILOSOPHY
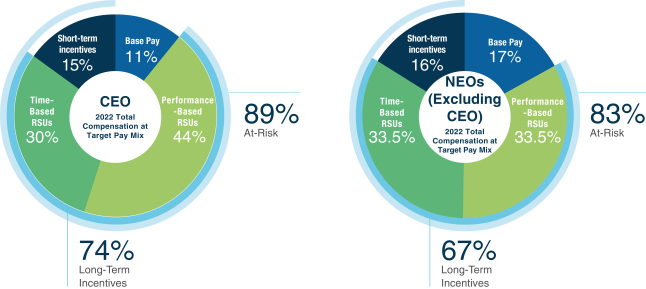
Our executive compensation program reflects our pay philosophy used throughout the entire organization to pay for performance and execution of our corporate strategy on an annual and a long-term basis. The graphics below demonstrate the mix of fixed (base pay) and variable or at-risk compensation (target annual and long-term incentives) for our CEO and other NEOs. As shown below and described in more detail in our “Compensation Discussion and Analysis” section, the majority of our NEOs’ total compensation is dependent on stock price performance and pre-established performance metrics and targets based on Company and individual performance.
| WILLIAMS COMPANIES | 2023 PROXY STATEMENT | 7 |
Table of Contents
|
| CORPORATE GOVERNANCE |
| AND BOARD MATTERS |
PROPOSAL 1: ELECT 12 DIRECTOR NOMINEES FOR A ONE-YEAR TERM.
The Board has nominated 12 director candidates to serve as directors of the Company for one-year terms expiring at the 2024 annual meeting of stockholders as follows: Alan S. Armstrong, Stephen W. Bergstrom, Michael A. Creel, Stacey H. Doré, Carri A. Lockhart, Richard E. Muncrief, Peter A. Ragauss, Rose M. Robeson, Scott D. Sheffield, Murray D. Smith, William H. Spence, and Jesse J. Tyson. Each nominee was previously elected to our Board at our annual meeting of stockholders on April 26, 2022, except for Ms. Lockhart, who joined the Board effective February 10, 2023. An existing Board member referred Ms. Lockhart to the Governance and Sustainability Committee for consideration as a director candidate.
Our By-laws provide for a majority voting standard in uncontested director elections. In other words, assuming the presence of a quorum, a director nominee will be elected to our Board if the votes cast for such nominee’s election exceed the votes cast against such nominee’s election. Each of our directors execute an irrevocable resignation that will become effective if (1) he or she fails to receive a majority of the votes cast in an uncontested election and (2) the Board accepts such resignation. If a director fails to receive the required votes for election, the Governance and Sustainability Committee will make a recommendation to the Board, and the Board will determine whether to accept the resignation. To make the determination, the Governance and Sustainability Committee and the Board may consider any factors they deem relevant. The director whose tendered resignation is under consideration abstains from participating. The Board will publicly disclose its decision within 90 days of the date the election results are certified. If the Board accepts a director’s resignation, the Governance and Sustainability Committee will recommend, and the Board will determine, whether to fill such vacancy or reduce the Board size.
Unless otherwise instructed, the individuals designated by the Board as proxies will vote the proxies received for the director candidates nominated by the Board. Each of the director nominees has consented to serve on the Board, and the Board has no reason to believe any nominees will be unable or unwilling to serve if elected. If a nominee is unable to or unwilling to stand for election as a director, either the designated proxies will vote to elect another nominee recommended by the Board or the Board may choose to reduce its size. The biographical information for the director nominees is set forth below in the “Director Nominee Skills, Experience, and Attributes” section.
 |
The Board unanimously recommends that stockholders vote “FOR” each of the above-listed director nominees. |
| 8 |
Table of Contents
| Corporate Governance and Board Matters
|
IDENTIFYING AND EVALUATING DIRECTOR CANDIDATES
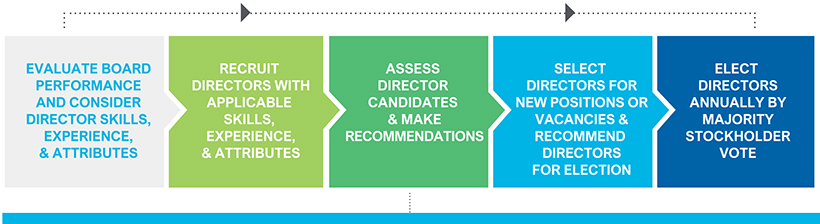
| Evaluate Board Performance and Consider Director Skills, Experience, & Attributes |
Annually, the Board and each Board committee evaluates its performance. For more information on this process, see the “Board Evaluation Process” section. In addition, the Governance and Sustainability Committee routinely evaluates the size, structure, composition, and functioning of the Board and its committees. The Governance and Sustainability Committee further assesses the skills, experience, and attributes that are currently represented on the Board by each individual director, as well as the skills, experience, and attributes that the Board will find valuable in the future, given the Company’s current situation and strategic plans. This assessment enables the Board to update as necessary the skills, experience, and attributes it seeks in the Board as a whole and in individual directors as the Company’s needs evolve and change over time.
Our Board seeks directors with a variety of occupational and personal backgrounds to obtain a range of viewpoints and perspectives. The Board believes that this diversity of experience, geography, race or ethnicity, gender, and age enhances the Board’s effectiveness by leading to varying perspectives and broader discussions. See below and the “Director Skills, Experience, and Attributes” section for a list of the skills, experiences, and attributes the Board has determined are important for oversight of the Company alongside the Board’s efforts to maintain an appropriate balance.
| |
Recruit Directors with Applicable Skills, Experience, & Attributes |
The Governance and Sustainability Committee and the Board recruit directors and receive recommendations for director candidates from a variety of different sources, including referrals from management or existing members of the Board, and the following:
Rooney Rule. In 2021, our Board added the Rooney Rule to our Corporate Governance Guidelines requiring consideration of candidates with a diversity of race, ethnicity, and gender each time the Governance and Sustainability Committee evaluates filling a vacancy or new position on the Board. The Board believes this will result in recruiting candidates from historically underrepresented groups.
Search Firms. The Governance and Sustainability Committee may source candidates through outside search firms, and, in such case, the Rooney Rule still applies to the candidate pool provided.
Stockholder Recommendations. Stockholders may recommend a candidate to the Governance and Sustainability Committee, by sending the candidate’s name and a detailed description of the candidate’s qualifications, a document indicating the candidate’s willingness to serve, and evidence of the stockholders’ stock ownership to: The Williams Companies, Inc., One Williams Center, MD 47, Tulsa, Oklahoma 74172, Attn: Corporate Secretary.
|
| WILLIAMS COMPANIES | 2023 PROXY STATEMENT | 9 |
Table of Contents
| Corporate Governance and Board Matters
|
Stockholder Nominations. Our By-laws also provide that a stockholder may nominate director candidates for election if the stockholder is a stockholder of record (1) when making a nomination and (2) on the record date for the determination of the stockholders entitled to vote at such annual meeting of stockholders. The stockholder must also satisfy the procedures provided in the By-laws of The Williams Companies, Inc. (the “By-laws”), including providing notice of a nomination in proper written form. Our corporate secretary must receive the notice at our principal executive offices not later than the close of business on the 90th calendar day, nor earlier than the close of business on the 120th calendar day, prior to the anniversary of the date of the immediately preceding annual meeting of stockholders. To be timely for our 2024 annual meeting of stockholders, our corporate secretary must receive notices not earlier than December 27, 2023, and not later than January 26, 2024.
Proxy Access. Our By-laws contain a “proxy access” provision allowing stockholders to include in our proxy materials information regarding director candidates nominated by stockholders in certain circumstances.
| ||||||||||||||||||
Under the proxy access option, our corporate secretary must receive the notice at our principal executive offices not later than the close of business on the 120th calendar day, nor earlier than the close of business on the 150th calendar day, prior to the anniversary of the date (as stated in our proxy materials) the definitive proxy statement was first released to stockholders in connection with the preceding year’s annual meeting of stockholders. For our 2024 annual meeting of stockholders, our corporate secretary must receive such notice not earlier than October 18, 2023, and not later than November 17, 2023.
The above-described notice and procedures are summaries and are not complete. For further information, please refer to our By-laws, which are included as an exhibit to our annual report on Form 10-K filed with the Securities and Exchange Commission (“SEC”) and available on our website at www.williams.com.
Universal Proxy Cards. In addition to satisfying the deadlines in the advance notice provisions of our By-laws for stockholder nominations, a stockholder who intends to solicit proxies in support of nominees submitted under these advance notice provisions must provide the notice required under Rule 14a-19 of the Securities Exchange Act of 1934, as amended (the “Exchange Act”) to our corporate secretary no later than 60 days prior to the one-year anniversary of the previous annual meeting of stockholders. To be timely for our 2024 annual meeting of stockholders, our corporate secretary must receive such notice no later than February 26, 2024.
For information concerning submitting a proposal regarding matters other than the election of directors, please see the “Questions and Answers about the Annual Meeting and Voting” section.
| ||||||||||||||||||
| Assess Director Candidates & Make Recommendations |
The Governance and Sustainability Committee is responsible for developing and recommending to the Board qualifications and criteria for identifying and assessing director candidates. The Governance and Sustainability Committee conducts a preliminary assessment of each candidate’s resume, other biographical and background information, and willingness to serve. In evaluating a director nominee and in reviewing the skills, experience, and attributes of the other Board directors or nominees, the Governance and Sustainability Committee considers a variety of factors, including each nominee’s independence, financial literacy, personal and professional accomplishments, and experience in light of the Company’s needs and priorities. For incumbent directors, the Governance and Sustainability Committee also considers past performance.
| |||||||||||||||||
| 10 |
Table of Contents
| Corporate Governance and Board Matters
|
The minimum qualifications the Governance and Sustainability Committee believes a director nominee must possess include:
• an understanding of business and financial affairs and the complexities of a business organization;
• a genuine interest in Williams and in representing all our stockholders;
• a willingness and ability to spend the time required to function effectively as a director;
• an open-minded approach and the resolve to make independent decisions on matters presented for consideration;
• a reputation for honesty and integrity beyond question;
• independence as defined by the New York Stock Exchange (“NYSE”) Listed Company Manual and qualifications otherwise required in accordance with applicable law or regulation;
• strong intellectual capital, performance enhancing ideas, and strong networks that contribute to stockholder value;
• ability to enhance the decision-making process by bringing relevant knowledge, rigorous analysis, and a desire for constructive engagement; and
• demonstrated, seasoned judgment for decisions involving broad and multi-faceted issues.
The Board Chair and the Governance and Sustainability Committee Chair then interview qualified candidates. Candidates also may meet with other directors and senior management. At the conclusion of this process, the Governance and Sustainability Committee makes a recommendation to the Board whether to appoint the candidate to the Board or recommend that our stockholders elect such person as a director at the next annual meeting. The Governance and Sustainability Committee uses the same process to evaluate all candidates regardless of the source of the nomination.
| ||
Select Directors
|
The Board may elect, by a majority vote, a director candidate recommended by the Governance and Sustainability Committee to fill a new opening or a vacancy on the Board. Additionally, the Board, upon the recommendation of the Governance and Sustainability Committee, nominates director candidates for election at the annual meeting of stockholders. Stockholders also have certain rights to nominate director candidates for election as described on the preceding page.
| |
Elect Directors
|
Stockholders annually elect the directors who will serve on our Board at the annual meeting of stockholders by a majority voting standard in uncontested elections and plurality voting standard for contested elections as described in further detail in the “Proposal 1: Elect 12 Director Nominees for a One-year Term” section.
|
| WILLIAMS COMPANIES | 2023 PROXY STATEMENT | 11 |
Table of Contents
| Corporate Governance and Board Matters
|
DIRECTOR NOMINEE SKILLS, EXPERIENCE, AND ATTRIBUTES*
 |  |  |  |  |  |  |  |  |  |  |  | |||||||||||||
Corporate Governance & Public Company Board Experience: Provides knowledge of public company board practices or perspectives from other public company boards, including current or prior experience. | ✓ | ✓ | ✓ | ✓ | ✓ | ✓ | ✓ | ✓ | ✓ | ✓ | ✓ |
| ||||||||||||
Energy Industry: Provides industry perspective and understanding of challenges and opportunities we face. | ✓ | ✓ | ✓ | ✓ | ✓ | ✓ | ✓ | ✓ | ✓ | ✓ | ✓ | ✓ | ||||||||||||
Energy Transition: Provides experience in sustainability or transitioning to alternative non-hydrocarbon energy sources. | ✓ |
|
| ✓ | ✓ | ✓ |
|
| ✓ | ✓ | ✓ | ✓ | ||||||||||||
Engineering & Construction: Provides technical knowledge related to our business operations that aids in risk oversight. | ✓ | ✓ |
|
| ✓ | ✓ |
|
| ✓ |
| ✓ |
| ||||||||||||
Environmental: Provides experience in regulatory schemes and best practices to enhance our environmental stewardship. | ✓ | ✓ | ✓ |
| ✓ | ✓ |
|
| ✓ |
| ✓ | ✓ | ||||||||||||
Executive Leadership: Provides judgment and experience as a “C-Level” executive of a publicly traded entity or large private company. | ✓ | ✓ | ✓ | ✓ | ✓ | ✓ | ✓ | ✓ | ✓ |
| ✓ | ✓ | ||||||||||||
Financial & Accounting: Provides experience in assessing our financial performance and monitoring the integrity of our financial reporting process. |
|
| ✓ | ✓ |
|
| ✓ | ✓ |
|
| ✓ |
| ||||||||||||
Human Capital Management: Provides experience in human resources and best practices to enhance our talent acquisition, retention, and development. | ✓ | ✓ | ✓ | ✓ | ✓ | ✓ |
| ✓ | ✓ |
| ✓ | ✓ | ||||||||||||
Information Technology: Provides understanding of data management, the technology utilized in our business, and cybersecurity. | ✓ |
| ✓ | ✓ | ✓ | ✓ | ✓ | ✓ | ✓ |
| ✓ |
| ||||||||||||
Legal: Provides insight in assessing legal risk. |
|
|
| ✓ |
|
|
|
|
|
|
|
| ||||||||||||
Marketplace Knowledge: Provides perspectives of the marketplace in which we operate. | ✓ | ✓ | ✓ | ✓ | ✓ | ✓ | ✓ | ✓ | ✓ | ✓ | ✓ |
| ||||||||||||
Mergers & Acquisitions: Provides experience in assessment and execution of potential acquisitions. | ✓ | ✓ | ✓ | ✓ | ✓ | ✓ | ✓ | ✓ | ✓ |
| ✓ | ✓ | ||||||||||||
Operations: Provides operational knowledge related to our business to aid in managing risk. | ✓ | ✓ |
| ✓ | ✓ | ✓ |
|
| ✓ |
| ✓ | ✓ | ||||||||||||
Public Policy & Government: Provides understanding on public policy affecting our business and federal and state regulatory experience, including with the Federal Energy Regulatory Commission. | ✓ |
|
| ✓ |
|
|
|
|
| ✓ |
|
| ||||||||||||
Securities & Capital Market: Provides experience evaluating our capital structure, capital market transactions, and other finance-related strategies. |
|
| ✓ |
|
|
| ✓ | ✓ |
|
|
|
| ||||||||||||
Strategy Development/Risk Management: Provides experience in risk management to help oversee the identification and assessment of risks and experience developing short-and-long-term company strategies. | ✓ | ✓ | ✓ | ✓ | ✓ | ✓ |
| ✓ | ✓ |
| ✓ | ✓ | ||||||||||||
Age | 60 | 65 | 69 | 50 | 51 | 64 | 65 | 62 | 70 | 73 | 66 | 70 | ||||||||||||
Gender | M | M | M | F | F | M | M | F | M | M | M | M | ||||||||||||
Black or African-American |
|
|
|
|
|
|
|
|
|
|
| ✓ | ||||||||||||
* Reflects the anticipated composition of the Board at the conclusion of the Annual Meeting, assuming stockholders elect all nominees to the Board. Age is calculated as of April 25, 2023.
| 12 |
Table of Contents
| Corporate Governance and Board Matters
|
* Reflects the anticipated composition of the Board at the conclusion of the Annual Meeting, assuming stockholders elect all nominees to the Board. Age is calculated as of April 25, 2023.
Director Biographies
Below is the biographical information as of April 25, 2023, for each director nominee.
Alan S. Armstrong President and Chief Executive Officer, The Williams Companies, Inc.
| ||||||||
Age: 60
Director Since: 2011
Committees: None
| Qualifications Mr. Armstrong has served as Director, President, and Chief Executive Officer of the Company since 2011. During his tenure, Williams has expanded its reach, currently touching about one-third of all U.S. natural gas volumes through gathering, processing, transportation, and storage services. In addition, Mr. Armstrong also served as Chairman of the Board and Chief Executive Officer of the general partner of Williams Partners L.P. (“WPZ”), the master limited partnership, that prior to its 2018 merger with Williams, owned most of Williams’ gas pipeline and domestic midstream assets. Prior to being named CEO, Mr. Armstrong led the Company’s North American midstream and olefins businesses as Senior Vice President — Midstream. Previously, Mr. Armstrong served as Vice President of Gathering and Processing from 1999 to 2002; Vice President of Commercial Development from 1998 to 1999; Vice President of Retail Energy Services from 1997 to 1998; and Director of Commercial Operations for the Company’s midstream business in the Gulf Coast region from 1995 to 1997. He joined Williams in 1986 as an engineer.
Mr. Armstrong serves on the Board of Directors of the American Petroleum Institute, the President’s National Infrastructure Advisory Council, and as Vice Chairman of the National Petroleum Council. He also serves as a member of the Business Roundtable. Mr. Armstrong also serves on the boards of several education-focused organizations including Junior Achievement USA, 3DE, and the Board of Trustees for the University of Oklahoma Foundation.
Skills, Experience, and Attributes Corporate Governance & Public Company Board Experience, Energy Industry, Energy Transition, Engineering & Construction, Environmental, Executive Leadership, Human Capital Management, Information Technology, Marketplace Knowledge, Mergers & Acquisitions, Operations, Public Policy & Government, Strategy Development/Risk Management
| |||||||
Other Current Public Company Boards: BOK Financial Corporation, | Education: BS, Civil Engineering | |||||||

| WILLIAMS COMPANIES | 2023 PROXY STATEMENT | 13 |
Table of Contents
| Corporate Governance and Board Matters
|
Stephen W. Bergstrom Retired Board Chair, President, and Chief Executive Officer, American Midstream Partners, GP, LLC
| ||||||||
Non-Executive Board Chair
Independent
Age: 65
Director Since: 2016
Committees: Compensation & Management Development Governance & Sustainability | Qualifications Mr. Bergstrom has 42 years of experience in the energy and utility sectors. He was a director on the Board of American Midstream Partners GP, LLC, a natural gas gathering, processing, and transporting company until they merged with ArcLight Capital Partners, LLC in July 2019. From 2013 to 2015, he served as Executive Board Chair, President, and Chief Executive Officer of American Midstream Partners’ general partner. Mr. Bergstrom acted as an exclusive consultant to ArcLight Capital Partners, an energy-focused investment firm, from 2003 to 2015, assisting ArcLight in connection with its energy investments. From 1986 to 2002, Mr. Bergstrom served in several leadership roles for Natural Gas Clearinghouse, which became Dynegy, Inc., a major electric utility company. Mr. Bergstrom acted in various capacities at Dynegy, ultimately serving as President and Chief Operating Officer. Mr. Bergstrom began his career with Transco Energy Company, Inc. in 1980.
Skills, Experience, and Attributes Corporate Governance & Public Company Board Experience, Energy Industry, Engineering & Construction, Environmental, Executive Leadership, Human Capital Management, Marketplace Knowledge, Mergers & Acquisitions, Operations, Strategy Development/Risk Management
| |||||||
| Other Current Public Company Boards: None | Education: BS, Industrial Administration | |||||||

Michael A. Creel Retired Director and Chief Executive Officer, Enterprise Products Partners L.P.
| ||||||||
Independent
Age: 69
Director Since: 2016
Committees: Audit Environmental, Health & Safety (Chair) | Qualifications Mr. Creel is an executive with 43 years of energy experience, including 18 years on large public company boards. Mr. Creel previously served as Director and Chief Executive Officer of Enterprise Products Partners L.P. from 2007 until his retirement in 2015. Earlier, he served in positions of increasing responsibility with the company since 1999. He was also group vice chairman at EPCO, Inc., and Executive Vice President and Chief Financial Officer at Duncan Energy Partners, L.P., a company engaged in natural gas liquids transportation, fractionation, marketing and storage, and petrochemical product transportation, gathering and marketing. He was also President and Chief Executive Officer at the general partner of Enterprise GP Holdings L.P. and held a number of executive management positions with Shell affiliates Tejas Energy and NorAm Energy Corp.
Skills, Experience, and Attributes Corporate Governance & Public Board Company Experience, Energy Industry, Environmental, Executive Leadership, Financial & Accounting, Human Capital Management, Information Technology, Marketplace Knowledge, Mergers & Acquisitions, Securities & Capital Markets, Strategy Development/Risk Management
| |||||||
| Other Current Public Company Boards: None | Education: BS, Accounting Certified Public Accountant | |||||||

| 14 |
Table of Contents
| Corporate Governance and Board Matters
|
Stacey H. Doré Executive Vice President of Public Affairs and Chief Strategy and Sustainability Officer, Vistra Corp.
| ||||||||
Independent
Age: 50
Director Since: 2021
Committees: Audit Governance & Sustainability (Chair) | Qualifications Ms. Doré brings to our Board 25 years of experience in energy and law. In August 2022, she was named Executive Vice President of Public Affairs and was named the first Chief Strategy and Sustainability Officer for Vistra Corp. a premiere Texas-based energy company. Ms. Doré previously served as President and Chief Executive Officer of Sharyland Utilities, LLC, a regulated Texas-based electric transmission utility. She also served as Senior Vice President of Utility and Power Operations for Hunt Energy, a diversified global company that invests in oil and gas exploration and production, refining, and electric power projects. Prior to this, she served as Senior Vice President and General Counsel of InfraREIT, Inc. until its sale in 2019. Ms. Doré previously held leadership positions of increasing responsibility with Energy Future Holdings, a privately held company with a portfolio of competitive and regulated energy companies, eventually serving as Executive Vice President, General Counsel, and Co-Chief Restructuring Officer. Before her entry into the energy industry, Ms. Doré practiced law for more than a decade with Vinson & Elkins.
Skills, Experience, and Attributes Corporate Governance & Public Company Board Experience, Energy Industry, Energy Transition, Executive Leadership, Financial & Accounting, Human Capital Management, Information Technology, Legal, Marketplace Knowledge, Mergers & Acquisitions, Operations, Public Policy & Government, Strategy Development/Risk Management
| |||||||
| Other Current Public Company Boards: None | Education: JD, Harvard Law School BA, Journalism | |||||||

Carri A. Lockhart Former Executive Vice President, Technology, Digital & Innovation, Equinor
| ||||||||
Independent
Age: 51
Director Since: 2023
Committees: Compensation & Management Development | Qualifications With over two decades of experience in the international energy industry, Ms. Lockhart has a broad background in production operations, facility management, and business development. Ms. Lockhart formerly served as Equinor’s (formerly known as Statoil, the Norwegian state oil company) Executive Vice President, Technology, Digital & Innovation. She resigned from the company in March 2022 to return to the U.S. Previously, she served as Equinor’s Senior Vice President Portfolio & Partner Operated in Development & Production International. Prior to this, she was Senior Vice President for Equinor’s U.S. Offshore business. Ms. Lockhart joined Equinor in 2016 and held a variety of leadership roles with experience in offshore, onshore conventional and unconventional assets, field supervision, facilities construction and operations, international country management, strategic planning, and business development. Prior to joining Equinor, she was with Marathon Oil Corporation where she started her career as a reservoir and production/operations engineer in Anchorage, Alaska before going on to senior leadership positions including Director of Business Development—the Americas, Alaska Regional General Manager, Vice President UK – North Sea, Vice President Bakken, and Vice President Eagle Ford.
Skills, Experience, and Attributes Corporate Governance & Public Company Board Experience, Energy Industry, Energy Transition, Engineering & Construction, Environmental, Executive Leadership, Human Capital Management, Information Technology, Marketplace Knowledge, Mergers & Acquisitions, Operations, Strategy Development/Risk Management | |||||||
Other Current Public Company Boards: Dril-Quip, Inc., Audit, Nominating and Governance, and Compensation Committees | Education: BS, Petroleum Engineering Montana College of Mineral Science Technology | |||||||

| WILLIAMS COMPANIES | 2023 PROXY STATEMENT | 15 |
Table of Contents
| Corporate Governance and Board Matters
|
Richard E. Muncrief Director, President, and Chief Executive Officer, Devon Energy Corporation
| ||||||||
Independent
Age: 64
Director Since: 2022
Committees: Compensation & Environmental, Health & | Qualifications Mr. Muncrief has more than 42 years of experience in the oil and gas industry. He has served as President and Chief Executive Officer of Devon Energy Corporation since January 2021 following the merger of Devon Energy Corporation and WPX Energy, Inc. Prior to that, he served as Chief Executive Officer and Board Chair of WPX Energy, Inc. since 2014. He previously served as Senior Vice President, Operations and Resource Development of Continental Resources, Inc. Earlier in his career, Mr. Muncrief served as Corporate Business Manager at Resource Production Company from August 2008 through May 2009. From September 2007 to August 2008, he served as President, Chief Operating Officer and as a Director of Quest Midstream Partners, LP. From 1980 to 2007, he served in various managerial capacities with ConocoPhillips and its predecessor companies Burlington Resources, Meridian Oil, and El Paso Exploration.
Skills, Experience, and Attributes Corporate Governance & Public Company Board Experience, Energy Industry, Energy Transition, Engineering & Construction, Environmental, Executive Leadership, Human Capital Management, Marketplace Knowledge, Mergers & Acquisitions, Operations, Strategy Development/Risk Management
| |||||||
Other Current Public Company Boards: Devon Energy Corporation | Education: BS, Petroleum Engineering | |||||||

Peter A. Ragauss Retired Senior Vice President and Chief Financial Officer, Baker Hughes Company
| ||||||||
Independent
Age: 65
Director Since: 2016
Committees: Audit Governance & Sustainability | Qualifications Mr. Ragauss retired from Baker Hughes Company, an oilfield services company, in November 2014, after serving eight years as Senior Vice President and Chief Financial Officer. From 2003 to 2006, prior to joining Baker Hughes, Mr. Ragauss was Controller, Refining and Marketing for BP Plc. From 2000 to 2003, he was Chief Executive Officer for Air BP. From 1998 to 2000, he was Assistant to Group Chief Executive for BP Amoco. He was Vice President of Finance and Portfolio Management for Amoco Energy International when Amoco Corporation merged with BP Plc. in 1998. Earlier in his career, from 1996 to 1998, Mr. Ragauss served as Vice President of Finance for El Paso Energy International. He held positions of increasing responsibility at Tenneco Inc. from 1993 to 1996 and Kidder, Peabody & Co. Incorporated from 1987 to 1993. He currently serves as a director of Skulte LNG, a private energy company in Latvia.
Skills, Experience, and Attributes Corporate Governance & Public Company Board Experience, Energy Industry, Executive Leadership, Financial & Accounting, Information Technology, Marketplace Knowledge, Mergers & Acquisitions, Securities & Capital Markets
| |||||||
Other Current Public Company Boards: APA Corporation | Education: MBA, Harvard Business School BS, Mechanical Engineering | |||||||

| 16 |
Table of Contents
| Corporate Governance and Board Matters
|
Rose M. Robeson Retired Group Vice President and Chief Financial Officer, DCP Midstream LLC
| ||||||||
Independent
Age: 62
Director Since: 2020
Committees: Audit (Chair) Environmental, Health & | Qualifications Ms. Robeson brings 35 years of experience in the energy industry. She served as Chief Financial Officer of DCP Midstream LLC from January 2002 to May 2012. She also served as the Chief Financial Officer of DCP Midstream GP LLC, the general partner of DCP Midstream Partners, LP, from May 2012 until January 2014. Prior to joining DCP Midstream LLC, Ms. Robeson served as Vice President and Treasurer with Kinder Morgan, Inc. Prior to that, she previously held positions of increasing responsibility with Total Petroleum, Inc. and Ernst & Young and was recognized to the “Top Women in Energy — 2014” by the Denver Business Journal. From 2014 to 2016, she served as a director of American Midstream GP, LLC, the general partner of American Midstream Partners, LP. From 2017 to 2019, she served as a director of AMGP GP LLC, the general partner of Antero Midstream GP LP, a publicly traded limited partnership. In March 2019, when Antero Midstream Corporation was formed, she continued to serve as a director until 2022. She served as a director of Tesco Corporation until its acquisition by Nabors Industries Ltd. in 2017.
Skills, Experience, and Attributes Corporate Governance & Public Company Board Experience, Energy Industry, Executive Leadership, Financial & Accounting, Human Capital Management, Information Technology, Marketplace Knowledge, Mergers & Acquisitions, Securities & Capital Markets, Strategy Development/ Risk Management
| |||||||
Other Current Public Company Boards: SM Energy Company Newpark Resources, Inc. Audit (Chair), Compensation, and Environmental, Social and Governance Committees | Education: BS, Accounting Certified Public Accountant (inactive) | |||||||

Scott D. Sheffield Director and Chief Executive Officer, Pioneer Natural Resources Company
| ||||||||
Independent
Age: 70
Director Since: 2016
Committees: Compensation & Management Development Environmental, Health & | Qualifications Mr. Sheffield has more than 41 years of experience in the energy industry. Since 2019, he has served as a director and Chief Executive Officer of Pioneer Natural Resources Company (“Pioneer”), a large domestic upstream oil and gas company. Mr. Sheffield served as the founding Chief Executive Officer of Pioneer from August 1997 until his retirement in December 2016, and he also served as board chair from 1999 until 2019 when he returned as the Chief Executive Officer. Mr. Sheffield was the Chief Executive Officer of Parker and Parsley Petroleum Company, a predecessor company of Pioneer, from 1985 until it merged with MESA, Inc. to form Pioneer in 1997. Mr. Sheffield joined Parker and Parsley as a petroleum engineer in 1979, was promoted to Vice President of Engineering in 1981, was elected President and a director in 1985, and became board chair and Chief Executive Officer in 1989. Mr. Sheffield served as a director of Santos Limited, an Australian exploration and production company, from 2014 to 2017. He previously served as a director from 1996 to 2004 on the board of Evergreen Resources, Inc., an independent natural gas energy company.
Skills, Experience, and Attributes Corporate Governance & Public Company Board Experience, Energy Industry, Energy Transition, Engineering & Construction, Environmental, Executive Leadership, Human Capital Management, Information Technology Marketplace Knowledge, Mergers & Acquisitions, Operations, Strategy Development/Risk Management
| |||||||
Other Current Public Company Boards: Pioneer Natural Resources Company | Education: BS, Petroleum Engineering | |||||||

| WILLIAMS COMPANIES | 2023 PROXY STATEMENT | 17 |
Table of Contents
| Corporate Governance and Board Matters
|
Murray D. Smith President, Murray D. Smith and Associates and Former Minister of Energy for Alberta, Canada
| ||||||||
Independent
Age: 73
Director Since: 2012
Committees: Compensation & Management Development Environmental, Health & | Qualifications Mr. Smith is currently President of Murray D. Smith and Associates, an energy consulting firm. Previously, he held various positions in the Canadian government. As an elected member of the Legislative Assembly of Alberta, Canada, Mr. Smith served in four different cabinet portfolios between 1993 and 2004. As Minister of Energy of Alberta from 2001 to 2004, Mr. Smith oversaw the transformation of the electricity sector into a competitive wholesale generation market and initiated the largest industrial tax reduction in the province’s history. Mr. Smith served as Representative of the Province of Alberta to the United States of America in Washington, D.C., from 2005 to 2007. Prior to becoming an elected official, Mr. Smith was an independent businessman, owning a number of Alberta-based energy services companies.
Skills, Experience, and Attributes Corporate Governance & Public Company Board Experience, Energy Industry, Energy Transition, Marketplace Knowledge, Public Policy & Government
| |||||||
Other Current Public Company Boards: Surge Energy Inc. | Education: BA, Economics & Political Science, Notre Dame College, Saskatchewan London Business School, | |||||||

William H. Spence Retired Board Chair, President, and Chief Executive Officer, PPL Corporation
| ||||||||
Independent
Age: 66
Director Since: 2016
Committees: Compensation & Management Development (Chair) Governance & Sustainability | Qualifications Mr. Spence is the retired Chair of the Board of PPL Corporation. At the time of his retirement, the PPL family of companies held assets of more than $40 billion, delivering electricity and natural gas to about 10 million customers in the United States and the United Kingdom. Mr. Spence was named PPL President and Chief Executive Officer in 2011 and elected Chair in 2012. Previously, he had 19 years of service with Pepco Holdings, Inc., where he held a number of senior management positions. Mr. Spence has served on various industry boards, including those dealing with research, cyber and physical security, the environment, and electric reliability.
Skills, Experience, and Attributes Corporate Governance & Public Company Board Experience, Energy Industry, Energy Transition, Engineering & Construction, Environmental, Executive Leadership, Financial & Accounting, Human Capital Management, Information Technology, Marketplace Knowledge, Mergers & Acquisitions, Operations, Strategy Development/Risk Management
| |||||||
Other Current Public Company Boards: Pinnacle West Capital Corporation Finance, Human Resources, and Nuclear and Operating Committees | Education: MBA, Bentley College BS, Petroleum & Natural Gas Engineering Pennsylvania State University Executive Development Program, Nuclear Technology Program | |||||||

| 18 |
Table of Contents
| Corporate Governance and Board Matters
|
Jesse J. Tyson Retired President and Chief Executive Officer, ExxonMobil Inter-Americas
| ||||||||
Independent
Age: 70
Director Since: 2022
Committees: Audit Governance & Sustainability | Qualifications Mr. Tyson brings 35 years of experience in the energy industry from his longstanding career with ExxonMobil Corporation. Early/mid-career, he developed Exxon’s US affiliate’s annual financial plan. In addition, he provided oversight of their US fuel distribution operations. He served as Global Aviation Director from October 2008 to March 2011, President and Chief Executive Officer of Exxon Mobil Inter-Americas from October 2002 to October 2008, and Global Customer Service & Logistics Manager from January 2000 to October 2002. He led the global call center consolidation for ExxonMobil. Previously, he held numerous management positions with ExxonMobil. Upon retirement from ExxonMobil in 2011, he became President and Chief Executive Officer of the National Black MBA Association from January 2012 to June 2018. Currently, he owns the majority interest in T&S Food Services, II, LLC, which has a stake in various restaurants and hotels.
Skills, Experience, and Attributes Energy Industry, Energy Transition, Environmental, Executive Leadership, Human Capital Management, Mergers & Acquisitions, Operations, Strategy Development/Risk Management
| |||||||
| Other Current Public Company Boards: None | Education: MBA, The Ohio State University BA, Economics | |||||||


Williams is focused on the safe, reliable and efficient delivery of clean energy to consumers across the United States.
| WILLIAMS COMPANIES | 2023 PROXY STATEMENT | 19 |
Table of Contents
| Corporate Governance and Board Matters
|
DIRECTOR INDEPENDENCE
Our Corporate Governance Guidelines require that all members of the Board, except our CEO, be “independent” as defined by the NYSE Listed Company Manual, and that the Board assess director independence annually. The NYSE’s Listed Company Manual defines independence by providing that the Board affirmatively determine that a director has no material relationship with the Company, either directly or as a partner, shareholder, or officer of an organization that has a relationship with the Company. Material relationships can include commercial, industrial, banking, consulting, legal, accounting, charitable, and familial relationships. In evaluating independence, the NYSE Listed Company Manual provides that a board should broadly consider all relevant facts and circumstances and further provides that a director is not independent if he or she meets certain criteria, including specified dollar and percentage threshold amounts.
Our Governance and Sustainability Committee oversees our director nomination process and conducts a review of director independence to make recommendations to the Board. Our Board makes the final determination of independence. Based on the evaluations performed and recommendations made by the Governance and Sustainability Committee, in January 2023, the Board affirmatively determined that each of Mr. Bergstrom, Ms. Buese, Mr. Creel, Ms. Doré, Mr. Muncrief, Mr. Ragauss, Ms. Robeson, Mr. Sheffield, Mr. Smith, Mr. Spence, and Mr. Tyson are independent as defined by the NYSE’s Listed Company Manual. In January 2022, the Board determined Stephen I. Chazen, and Charles I. Cogut were independent as defined by the NYSE’s Listed Company Manual. Mr. Chazen and Mr. Cogut retired from the Board in April 2022 at the end of their terms. In February 2023, the Board affirmatively determined Carri A. Lockhart was independent in conjunction with appointing her to the Board effective February 10, 2023. Mr. Armstrong is not independent because of his role as the Company’s CEO.
As part of the independence evaluation and determination, the Governance and Sustainability Committee considered the below matters. The Board determined the matters described below occurred in the ordinary course of business, and, where applicable, fell below the relevant thresholds for independence as set forth in the NYSE’s Listed Company Manual. Additionally, none of these matters qualified as related party transactions as defined in Item 404(a) of Regulation S-K under the Securities Act of 1933, as amended, (the “Securities Act”) and the Exchange Act.
Director | Matters Considered | |
Nancy K. Buese | Ordinary course business transactions with Newmont Mining Corporation and Baker Hughes Company. | |
Stephen I. Chazen | Ordinary course business transactions with Occidental Petroleum Corporation. | |
Charles I. Cogut | Ordinary course business transactions with Air Products & Chemicals, Inc. | |
Stacey H. Doré | Ordinary course business transactions with Vistra Corp. and its subsidiaries. | |
Carri A. Lockhart | Ordinary course business transactions with Ascent Resources LLC. | |
Richard E. Muncrief | Ordinary course business transactions with Devon Energy Corporation; ongoing legal and tax matters, including continuing indemnification obligations between Williams and Devon Energy Corporation arising from the Company’s spin off of WPX Energy, Inc. | |
Peter A. Ragauss | Ordinary course business transactions with APA Corporation. | |
Rose M. Robeson | Ordinary course business transactions with Newpark Resources, Inc. and SM Energy Company. | |
Scott D. Sheffield | Ordinary course business transaction with Pioneer Natural Resources Company. | |
In addition to the NYSE’s independence requirements, in January 2023, the Board determined that all the current members of our Audit Committee and our Compensation and Management Development Committee satisfy the heightened independence requirements imposed by the NYSE and the SEC applicable to members of such committees. In February 2023, the Board determined that Carri A. Lockhart, who is a member of our Compensation and Management Development Committee, satisfied the heightened independence requirements imposed by the NSYE and the SEC applicable to that committee.
No related party transactions required review or approval by the Governance and Sustainability Committee, its Chair, or the Board in 2022. For a description of our process for the review of related party transactions, see the “Corporate Governance Policies and Best Practices” section.
| 20 |
Table of Contents
| Corporate Governance and Board Matters
|
BOARD LEADERSHIP
Alan S. Armstrong serves as our President and CEO, and Stephen W. Bergstrom serves as our Board Chair. Pursuant to our By-laws and our Corporate Governance Guidelines, the positions of Board Chair and CEO may be held by the same or different persons. At this time, the Board believes that having an independent Board Chair is the most appropriate Board leadership structure. The Board believes that having an independent Chair aids the Board’s oversight of management and promotes communications among the Board, the CEO, and other members of senior management. In addition, having a separate Board Chair and CEO allows Mr. Armstrong to focus on his responsibilities in managing the Company. The Board retains the flexibility to revise this structure based upon its periodic assessment and review of the Company’s needs and leadership.
Responsibilities of the Board Chair |
Presiding over Board meetings and executive sessions of the independent directors. | |
Overseeing the planning of the annual Board calendar, and, in consultation with the CEO, scheduling and setting the agendas for the Board meetings. | ||
Overseeing the appropriate flow of information to the Board. | ||
Acting as liaison between the independent directors and management. | ||
Assisting the chairs of the various Board committees in preparing agendas for committee meetings. | ||
Chairing the Company’s annual meeting of stockholders. | ||
Performing other functions and responsibilities referred to in the Corporate Governance Guidelines or requested by the Board from time to time.
| ||
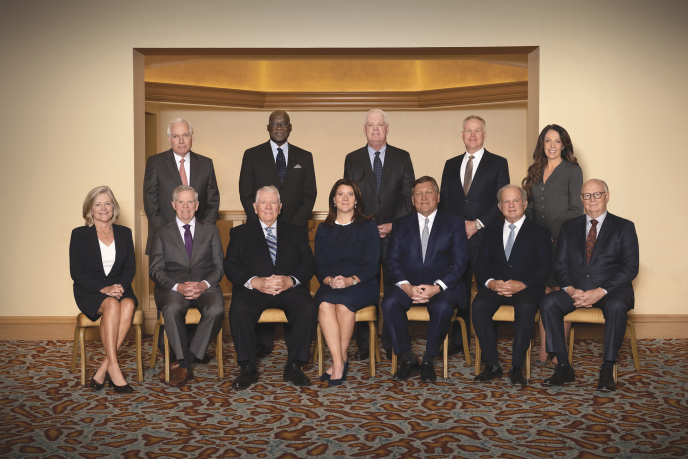
Front row: Robeson, Spence, Smith, Doré, Ragauss, Sheffield, Muncrief
Back row: Creel, Tyson, Bergstrom, Armstrong, Lockhart
| WILLIAMS COMPANIES | 2023 PROXY STATEMENT | 21 |
Table of Contents
| Corporate Governance and Board Matters
|
BOARD STRUCTURE AND OVERSIGHT
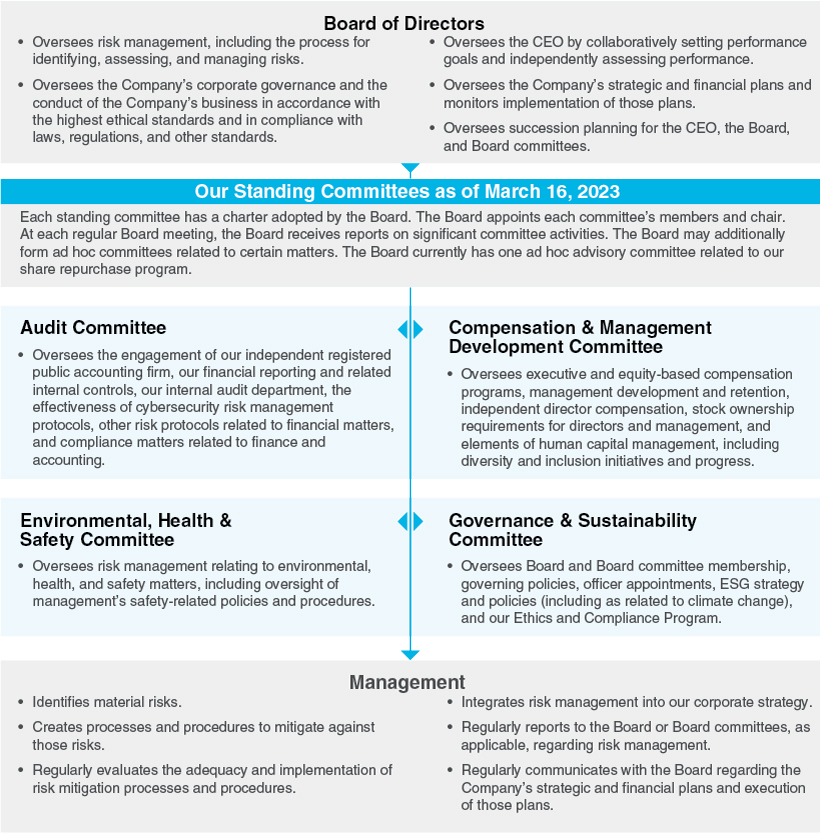
Our Board oversees the overall performance of the Company through the selection and oversight of the CEO and other officers and through the oversight of organizational planning, strategy, and risk-management programs, focusing on the major risks inherent in our business. The Board exercises its oversight through the creation and approval of governance policies and best practices, meeting regularly with and without management, and incorporating feedback received from stockholders. While the Board is ultimately responsible for risk oversight, the Board delegates some of this responsibility to one of four standing Board committees. Management also plays an important role in implementing the processes and procedures designed to mitigate risk and assisting the Board in the exercise of its oversight function.
| 22 |
Table of Contents
| Corporate Governance and Board Matters
|
Board and Board Committee Oversight of Certain Matters
Below are spotlights on how the Board and its committees oversee strategy and risk management related to certain matters. Please also see our “Spotlight on Environmental Sustainability” and “Spotlight on Human Capital Management” sections.
 CYBERSECURITY CYBERSECURITY | ||||||||
The Board and the Audit Committee are responsible for oversight of our cybersecurity risk. The Board oversees cybersecurity-related policy and strategy. As part of this oversight, our Chief Operating Officer reviews a cybersecurity dashboard with the Board at every regularly scheduled Board meeting, which includes key performance indicators for cybersecurity process maturity, operational performance, and enterprise performance toward Transportation Security Administration (“TSA”) compliance. Additionally, our Chief Information Officer (“CIO”), presents to the Board bi-annually regarding our cybersecurity risks and strategies, including as part of our annual long-term strategy session. The Audit Committee, comprised only of independent directors, reviews the implementation and effectiveness of cybersecurity risk management protocols and reviews the effectiveness of information technology security as part of the Company’s accounting and internal control policies. As part of this oversight, our CIO presents to the Audit Committee bi-annually, as well as periodically in conjunction with any internal audits related to cybersecurity.
Our management is at the forefront of cybersecurity risk management for our industry. In August 2022, our CEO was appointed to the President’s National Infrastructure Advisory Council to advise on reducing physical and cyber risks and improving the security and resiliency of the nation’s critical infrastructure. Our Chief | 67% of our directors have experience in IT, including through supervision of IT departments and CIOs, writing computer programming, service as executives for companies with large data management demands, and involvement with organizations developing cybersecurity strategies and technologies related to detection, response, and recovery. | |||||||
Information Security Officer is the current chair of the Oil and Natural Gas Subsector Coordinating Council facilitating industry and government conversations and workstreams relating to intelligence sharing, identifying future opportunities for collaboration, and advising on potential regulations and policies as well as the national critical infrastructure cybersecurity goals and strategy. He also chairs the Security subcommittee for the Interstate Natural Gas Association of America.
Our CIO oversees our enterprise-wide cybersecurity risk management program, which includes (1) targeted policies, procedures, and standards to ensure that effective controls are applied commensurate with the risk and sensitivity of specific information and operation technology systems; (2) a cybersecurity executive advisory board, cybersecurity governance committee, and other information technology (“IT”) teams dedicated to cybersecurity risk management; (3) external assessments and certifications related to our cybersecurity infrastructure; and (4) enterprise-wide training and awareness initiatives. Our cybersecurity-related policies include (1) a Cybersecurity Policy, which provides principles and expectations for cybersecurity for the Company; (2) an Acceptable Use Policy, which outlines the rules that employees and others must follow when using our IT resources or accessing our enterprise data; and (3) an Enterprise Data Classification & Handling Policy, which establishes the framework for classifying the sensitivity of our enterprise data and specifies the handling requirements for each data classification. Our cybersecurity executive advisory board meets quarterly to discuss current cybersecurity risks, ongoing initiatives, and provide executive oversight over the cybersecurity program. The cybersecurity governance committee meets monthly to discuss ongoing initiatives and ensure coordination between enterprise stakeholders. We conduct regular internal audits and IT risk strategy sessions to assess cybersecurity threats, and we complete various cyber-readiness drills focused on maintaining our ability to continue transporting product while under a cybersecurity attack. We engage external vendors to conduct annual benchmark maturity assessments on our implementation of the National Institute of Standards and Technology (“NIST”) Cybersecurity Framework, annual penetration testing of our IT infrastructure, and biennial cybersecurity architecture design reviews to evaluate our systems, networks, and security services to determine if they are designed, built, and operated in a reliable and resilient manner. We also engage with various governmental entities, as needed, to review our information security controls. All employees and vendors who have access to our systems must complete annual training related to cybersecurity. Additionally, we maintain industry-standard cybersecurity insurance to provide further protection against cybersecurity risk.
| ||||||||
 CHIEF EXECUTIVE OFFICER EVALUATION & MANAGEMENT SUCCESSION CHIEF EXECUTIVE OFFICER EVALUATION & MANAGEMENT SUCCESSION | ||||||||
The Board annually meets in executive session to assess the CEO’s performance, and collaborates with the CEO in setting the CEO’s performance goals. The Board maintains a process for planning orderly succession for the CEO and, in conjunction with the Compensation and Management Development Committee, oversees the other executive officer positions and executive officer development and succession planning. | ||||||||
| WILLIAMS COMPANIES | 2023 PROXY STATEMENT | 23 |
Table of Contents
| Corporate Governance and Board Matters
|
 STRATEGIC PLANNING & STRATEGIC RISK ASSESSMENT STRATEGIC PLANNING & STRATEGIC RISK ASSESSMENT | ||||||||
| At each regularly scheduled Board meeting, the directors meet with management to discuss and approve strategic plans, financial goals, capital spending, and other factors critical to successful performance. The Board also participates in an annual strategy session to evaluate our long-term strategy, including evaluating top risks that could affect execution of that strategy. To identify top risks, we utilize the Enterprise Risk Management Integrated Framework developed by the Committee of Sponsoring Organizations of the Treadway Commission. Our risk taxonomy | FOUR custom scenario analyses are used to test our long-term strategy under a range of potential outcomes using a variety of external inputs and internal analysis. | |||||||
| consists of 30 risk categories consolidated into four classifications: Strategic, Operational, Compliance, and Reporting. Through our strategic risk assessment process, we identify the top risks that could have the largest impact on our strategy from the list of 30 risk categories. For each top risk, management identifies a risk tolerance and assigns a risk alignment rating, and a member of our executive management team is responsible for oversight. Management shares the results from the strategic risk assessment with the Board and presents the details of the strategic risk assessment to the Audit Committee. Each Board committee periodically reviews the top risks identified through the strategic risk assessment process that are in the committee’s subject matter expertise. | ||||||||
 POLITICAL ADVOCACY & CONTRIBUTIONS POLITICAL ADVOCACY & CONTRIBUTIONS | ||||||||
| The Governance and Sustainability Committee, comprised solely of independent directors, annually reviews the Company’s political contributions, including trade associations’ and other tax-exempt organizations’ dues attributable to lobbying. We participate in the political process, including contributing to public policy discussions, through the lobbying efforts of our Government Affairs and Outreach department and trade associations. Political contributions are made with both corporate contributions and from WILLCO PAC, Williams’ political action committee, registered with the Federal Election Commission. WILLCO PAC is an independent, nonpartisan entity that raises voluntary contributions from eligible Williams employees to support candidates for congressional and state offices | TRENDSETTER for four consecutive years on the Center for Political Accountability’s CPA-Zicklin Index, scoring over 90% on this comprehensive benchmark rating of political disclosure and accountability policies and practices for election-related spending by S&P 500 companies. | |||||||
| employees to support candidates for congressional and state offices where permitted by law. The WILLCO PAC does not make contributions to Presidential candidates. WILLCO PAC’s giving includes bipartisan contributions to federal and state campaign committees and candidates for elected office. Our corporate giving includes bipartisan contributions to state and local candidates and campaign committees where allowed by applicable law. In determining which candidates and initiatives to support, Williams and WILLCO PAC balance the views promoted by a candidate or ballot initiative, the qualifications and effectiveness of the candidate or organization to which the contribution is made, and the appropriateness of the company’s level of involvement in the election or ballot initiative. With respect to particular candidates, the Company’s considerations include the candidate’s understanding of our industry and support for our positions on issues concerning our businesses; position on key committees that consider legislation critical to our business interests; leadership or potential for leadership; representation where Williams employees or facilities are located; and viability as a successful candidate. We provide a link on our website to the Office of the Clerk for the U.S. House of Representatives, where our federal disclosures for lobbying activities are available, including our aggregate spending for federal lobbying and payments to lobbying service providers. | ||||||||
 CORPORATE ETHICS & COMPLIANCE PROGRAM CORPORATE ETHICS & COMPLIANCE PROGRAM | ||||||||
| Our Governance and Sustainability Committee annually reviews and amends as necessary our Code of Business Conduct and Code of Conduct for Suppliers and Contractors, which set the ethical conduct expectations for our Company, contractors, and suppliers. See the “Corporate Governance Policies and Best | ALL Employees complete annual Code of Business Conduct training. | |||||||
| Practices” section for policy descriptions. We maintain an Ethics and Compliance Program, which is overseen by our Chief Ethics and Compliance Officer (“Chief Compliance Officer”) to administer Code of Business Conduct training and ensure compliance with Company policies, including Federal Energy Regulatory Commission compliance. We encourage our employees to report suspected violations of any law, regulation, or Company policy and offer several confidential mechanisms for reporting. Our Chief Compliance Officer, or his/her delegee, and the General Counsel report to the Audit Committee regarding accounting and auditing concerns and to the Governance and Sustainability Committee regarding all other Code of Business Conduct concerns or calls to our ethics hotline. At least annually, the Governance and Sustainability Committee reviews the effectiveness of our Ethics and Compliance Program. We also have an Ethics Advisory Panel with representatives from across the Company that meets regularly to oversee the effectiveness of the Ethics and Compliance Program, review comparative benchmark metrics, and recommend enhancements as needed. In 2022, we sought a third-party assessment of our Ethics and Compliance Program and presented the results to the Governance and Sustainability Committee in January 2023. | ||||||||
| 24 |
Table of Contents
| Corporate Governance and Board Matters
|
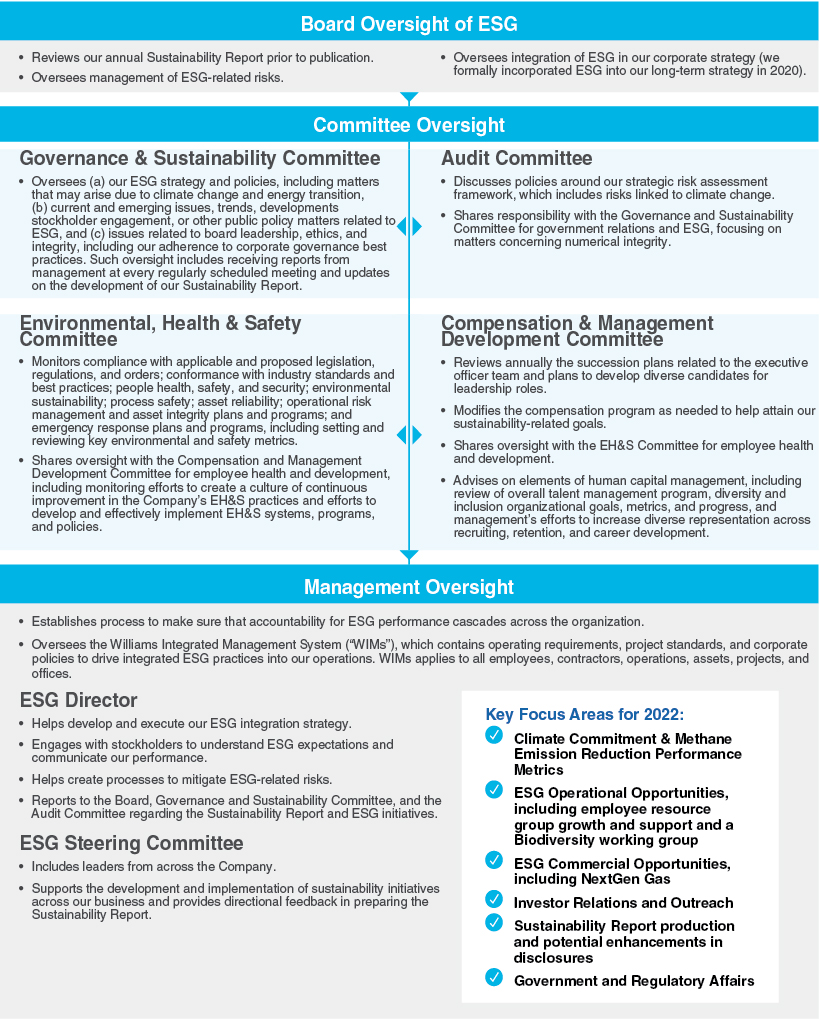
| WILLIAMS COMPANIES | 2023 PROXY STATEMENT | 25 |
Table of Contents
| Corporate Governance and Board Matters
|
CORPORATE GOVERNANCE POLICIES AND BEST PRACTICES
Our Board has developed corporate governance policies and adopted best practices to guide our risk management and ensure that our core values (authentic, reliable performers, safety driven, responsible stewards) are engrained in how we do our work every day on behalf of our stakeholders. Our governing documents are available through the Investors page of our website at www.williams.com. If you prefer to receive printed copies of these documents, please send a written request to our Corporate Secretary at The Williams Companies, Inc., One Williams Center, MD 47, Tulsa, Oklahoma 74172. The information on our website is not incorporated by reference or otherwise made a part of this proxy statement.
| Governing Documents and Policies | |||
Charter & By-laws | Establishes our foundational corporate governance requirements and certain stockholder rights, including the following:
• Establishing our Board with no less than 5 and up to 17 directors annually elected by a majority voting standard for uncontested elections.
• Providing the process, procedures, and requirements for Board meetings.
• Starting in 2013, allowing the removal of directors by stockholders with or without cause, upon a majority vote.
• Giving stockholders certain rights to nominate directors and include them in any proxy materials (as described in more detail in the “Identifying & Evaluating Director Candidates” section). |  | ||
| Committee Charters | Each standing Board committee has its own charter establishing the committee’s responsibilities, the process for self-evaluation and reporting to the full Board, and requiring members be independent as defined by the NYSE. For information on each committee’s duties see the “Board Committees Section.” |  | ||
| Corporate Governance Guidelines | Provides a framework for our corporate governance and addresses the operation, structure, and practice of the Board and its committees, including the following:
• Establishing the Board’s responsibility for the evaluation and compensation of the CEO, management succession, and at least annual review of the Company’s long-term strategic plan.
• Requiring all directors except the CEO to be independent as defined by the NYSE Listed Company Manual and requiring the independent directors to meet without management at each regularly scheduled meeting.
• Allowing for separation of the CEO and Board chair.
• Outlining the criteria important for director candidates, including requiring consideration of candidates with a diversity of race, ethnicity, and gender.
• Requiring stock ownership guidelines for directors and senior officers.
• Limiting the service of our directors on publicly held company boards and investment company boards to no more than four (including our Board) and providing a retirement age for directors.
The Governance and Sustainability Committee reviews these guidelines at least annually and recommends changes to the Board, as necessary. |  | ||
| 26 |
Table of Contents
| Corporate Governance and Board Matters
|
| Governing Documents and Policies | |||||
| Code of Business Conduct | Addresses, among other things, the Company’s Ethics and Compliance Program, the protection of Company assets, compliance with all laws and regulations, and anti-harassment and other policies related to establishing our work environment. Specific policies addressed in the Code of Business Conduct include:
|
| ||||
• Equal Employment Opportunities
| • Prohibitions on Discrimination & Harassment
| |||||
• Political Contributions & Conduct & Government Affairs
| • Gifts to Government & Regulatory Officials & Employees
| |||||
• Commercial Bribery
| • Anti-Corruption
| |||||
• Gifts & Entertainment
| • Antitrust
| |||||
• Internal Reporting & Non-Retaliation Commitment
| • Workplace Violence Risk Reduction & Response
| |||||
• FERC Rules & Regulations
| • Environmental Health & Safety
| |||||
• Drug & Alcohol
| • Personal Information Privacy
| |||||
• Privacy with Respect to Company & Personal Property & Equipment
| • External Communication & Disclosure of Information
| |||||
• Acceptable Use | • Cybersecurity | |||||
The Code of Business Conduct is applicable to every Williams employee, officer, including our CEO, Chief Financial Officer, and Chief Accounting Officer, and the Board. The Board reviews and approves the Code of Business Conduct annually. Additionally, all employees complete annual Code of Business Conduct training, and all leaders annually acknowledge and certify to their understanding and compliance with the Code of Business Conduct.
| ||||||
| Policies & Standards | Our Board and management have developed several other policies to help ensure the Company complies with all laws and regulations, operates with the highest ethical standards, and fosters a workplace environment where all employees feel valued and respected. Those policies include the following:
Policy on Securities Trading. Prohibits employees, including officers and directors, from engaging in short sales, hedging transactions, speculative transactions, pledging, or any transactions designed to hedge or offset any decrease in the market value of Company securities, including common stock, debt, stock options, and other derivative or non-derivative securities related to Company stock.
Policy and Procedures with Respect to Related Person Transactions. Establishes the process and procedures governing transactions with related parties. Our written Policy and Procedures with Respect to Related Person Transactions covers any transaction or proposed transaction involving our Company and a related party that exceeds $120,000, and in which the related party had or will have a direct or indirect material interest in the transaction. Related parties include directors and director nominees, executive officers, shareholders beneficially owning more than 5% of the Company’s voting securities, and the immediate family members of directors, executive officers and beneficial shareholders owning more than 5% of the Company’s voting securities. The Board, excluding the director involved directly or indirectly in the transaction, must review and approve any proposed related person transaction involving a director or the chief executive officer. The Governance and Sustainability Committee reviews proposed transactions with any other related persons that would otherwise require disclosure in our SEC filings. If convening a meeting before a related party transaction occurs is impractical, the committee Chair may review the transaction alone. The Governance and Sustainability Committee, its Chair, or the Board, as applicable, may approve, in good faith, only those related person transactions that are in, or not inconsistent with, the Company’s best interests and the best interests of our stockholders. For this review, considerations include the benefits of the transaction to the Company, the impact on a director’s independence where applicable, the availability of comparable products or services, the transaction terms, the terms available to unrelated third parties and employees generally, and the nature of the relationship between the Company and the related party. No transactions required review or approval by the Governance and Sustainability Committee, its Chair, or the Board in 2022.
Human Rights Policy and Statement. Commits us to principles aimed at promoting, protecting, and supporting all internationally recognized human rights and to avoid complicity in human rights abuses.
Code of Conduct for Suppliers and Contractors. Sets the expectations for those with whom we work regarding our core values, human rights, ethics and legal compliance, asset and information protection, and environmental, health and safety matters. Additionally, the policy provides information regarding how to report any concerns or misconduct. |  | ||||

| WILLIAMS COMPANIES | 2023 PROXY STATEMENT | 27 |
Table of Contents
| Corporate Governance and Board Matters
|
BOARD MEETINGS AND EXECUTIVE SESSIONS
Our Corporate Governance Guidelines require that the Board hold at least four regularly scheduled meetings each year, and that our independent directors meet in executive session, without the CEO present, at each regularly scheduled meeting. Our Board met 5 times in 2022, and our independent directors met in executive session at each of the four regularly scheduled meetings. Each director attended at least 75% of the aggregate total number of Board and applicable Board committee meetings during their time of Board service in 2022. Ten of our directors attended the 2022 annual meeting of stockholders in accordance with our Corporate Governance Guidelines.
| Committees | ||||||||||||
| Board | Audit | Compensation & Management Development | Governance & Sustainability | Environmental, Health & Safety | Total | |||||||
Meetings in 2022 | 5 | 8 | 4 | 4 | 4 | 25 | ||||||
BOARD COMMITTEES*
The chart below shows the committee composition assuming stockholders elect all nominees to the Board at the Annual Meeting.
Director | Audit | Compensation & Management Development | Governance & Sustainability | Environmental, Health & Safety | ||||||
| Alan S. Armstrong CEO | |||||||||
| Stephen W. Bergstrom Board Chair | ✓
| ✓
| |||||||
| Michael A. Creel | ✓ | CHAIR | |||||||
| Stacey H. Doré | ✓ | CHAIR | |||||||
| Carri A. Lockhart | ✓ | ✓ | |||||||
| Richard E. Muncrief | ✓ | ✓ | |||||||
| Peter A. Ragauss | ✓ | ✓ | |||||||
| Rose M. Robeson | CHAIR | ✓ | |||||||
| Scott D. Sheffield | ✓ | ✓ | |||||||
| Murray D. Smith | ✓ | ✓ | |||||||
| William H. Spence | CHAIR | ✓ | |||||||
| Jesse J. Tyson | ✓ | ✓ | |||||||


| CHAIR | Committee Chair | *The Board appointed Ms. Lockhart effective February 10, 2023, and she did not participate in the 2022 Board or committee meetings. Ms. Robeson moved from the Compensation and Management Development Committee to the Audit Committee on March 1, 2022. Effective February 1, 2023, the Board appointed new committee chairs. For 2022, the chairs were as follows: Mr. Ragauss, Audit; Mr. Sheffield, Compensation and Management Development; Mr. Smith, EH&S; and Mr. Spence, Governance and Sustainability. | ||
| ✓ | Committee Member | |||
| 28 |
Table of Contents
| Corporate Governance and Board Matters
|
Audit Committee
| ||||||
Rose M. Robeson, Chair
Members* Michael A. Creel Jesse J. Tyson
Number of Meetings 8 meetings in 2022
Independent Directors 100%
Charter: https://www.williams.com/wp-content/uploads/sites/8/2022/11/2022.10.24-Audit-Committee-Charter-Current.pdf | Key Responsibilities
Standing Audit Committee. Established in accordance with Exchange Act § 3(a)(58)(A).
Oversight of the Independent Auditor. Appoints (taking into account the stockholder vote on ratification), retains, and oversees the independent auditor, including review of independence, qualifications, and performance and approval of all fees paid and audit/non-audit services performed.
Oversight of Financial Reporting. Oversees the Company’s financial reporting processes, including financial statement integrity, earnings releases, and compliance with legal and regulatory requirements.
Oversight of Risk Assessment & Management. Discusses with management policies related to risk assessment and risk management and steps taken to monitor and control exposures.
Oversight of Internal Audit. Reviews the performance of our internal audit function.
Oversight of Compliance Related to Financial Matters. Reviews Code of Business Conduct complaints or other investigations related to financial and accounting matters and shares oversight with the Governance and Sustainability Committee for government relations and ESG focusing on matters related to numerical integrity, including SEC disclosures.
Oversight of Cybersecurity. Oversees the implementation and effectiveness of risk management protocols for information technology and cybersecurity and reviews material breaches and attacks. The full Board retains oversight of cybersecurity policy and strategy.
2022 Highlights
• Recommended amendments to enhance ESG-related oversight and clarify oversight of controls related to cybersecurity and commodity trading.
• Reviewed proposed SEC climate change disclosure rules and discussed the sustainability report process and internal controls.
• Reviewed cybersecurity controls and compliance with related new TSA mandates.
• Approved the updated Commodity Risk Management policy.
• Reviewed accounting matters related to recent acquisitions.
• Discussed efforts to optimize financial and accounting processes in the new ERP system.
• Approved the selection of a new Chief Audit Executive.
• Onboarded two new members.
Evaluation and Transparency
• Reviews the charter annually and recommends any changes.
• Evaluates performance annually and reports the results to the Board.
• Reports activities to the Board at every regularly scheduled Board meeting.
• Approves the Audit Committee Report included in the proxy statement.
| |||||

* Mr. Ragauss served as the Audit Committee Chair for 2022, and Ms. Robeson, who joined the Audit Committee in March 2022, became the Audit Committee Chair effective February 1, 2023. Stephen I. Chazen and Charles I. Cogut served on the Audit Committee in 2022 until they retired at the annual meeting of stockholders in April 2022. Mr. Tyson joined the Audit Committee in March 2022.
| WILLIAMS COMPANIES | 2023 PROXY STATEMENT | 29 |
Table of Contents
| Corporate Governance and Board Matters
|
Independence Requirements
The Board determined that all current members of the Audit Committee meet the heightened independence requirements in the NYSE’s Listed Company Manual and SEC regulations applicable to audit committee members. The Board previously determined Stephen I. Chazen and Charles I. Cogut met the heightened independence requirements under the NYSE’s Listed Company Manual for persons serving on audit committees during their tenure on the committee.
Financial Literacy, Audit Committee Financial Experts
The Board determined that:
| • | all the members of the Audit Committee serving during 2022 and all current members of the Audit Committee are “financially literate” as defined by the NYSE Listed Company Manual and Company policy; and |
| • | the Audit Committee currently has 4 members, including the Chair, that qualify as audit committee financial experts as defined by the SEC: Michael A. Creel, Peter A. Ragauss, Rose M. Robeson, and Jesse J. Tyson. |
Our Corporate Governance Guidelines provide that no member of the Audit Committee may serve on more than three public company audit committees, including the Company’s Audit Committee, unless approved by the Board. As of the date of this proxy statement, no member of the Audit Committee is serving on more than three public company audit committees.

Williams moved record volumes of natural gas in 2022 and expanded its footprint with new projects and strategic acquisitions.
| 30 |
Table of Contents
| Corporate Governance and Board Matters
|
Compensation and Management Development Committee
| ||||||
William H. Spence, Chair
Members* Stephen W. Bergstrom Carri A. Lockhart Richard E. Muncrief Scott D. Sheffield
Number of Meetings 4 meetings in 2022
Independent Directors 100%
Charter: https://www.williams.com/wp-content/uploads/sites/8/2019/11/2022.07.26-CURRENT-Compensation-and-Management-Development-Committee-Charter.pdf | Key Responsibilities
Oversight of Executive & Equity-Based Compensation. Oversees and approves the executive compensation philosophy, policies, and programs that align the interest of our executives with our stockholders, including setting corporate goals for compensation, evaluating the performance of executives in light of those goals and approving executive compensation. Oversees equity-based compensation plans and benefit plans that do not require stockholder approval. Oversees material risks associated with our compensation programs. Engages and oversees any independent compensation consultant.
Oversight of Talent Development and Human Capital Management. Reviews succession plans for executive officer positions and assists the Board with succession planning for the CEO as requested. Advises on elements of human capital management, including annual reviews of diversity and inclusion initiatives and progress and management’s efforts to increase diverse representation across recruiting, retention, and career development.
Oversight of Director Compensation and Director and Executive Officer Stock Ownership. Develops and reviews compliance with stock ownership policies for directors and executive officers. Reviews Board compensation annually and makes any recommendations.
2022 Highlights
• Reviewed the Company’s total rewards program including the Company’s annual pay equity review process.
• Added a third ESG metric in the Company’s annual incentive program by introducing a methane emissions reduction metric.
• Reviewed succession and development plans for executive officers other than the CEO.
• Reviewed the Company’s enterprise-wide talent management process and diversity and inclusion program.
• Considered the effectiveness of the Company’s compensation structure, annual, and long-term incentive programs in supporting Williams’ strategy.
• Reviewed the Company’s focus on pay for performance in our compensation program.
• Onboarded one new member.
Evaluation and Transparency
• Reviews the charter annually and recommends any changes.
• Evaluates performance annually and reports the results to the Board.
• Reports activities to the Board at every regularly scheduled Board meeting.
• Reviews and recommends to the Board the Compensation Discussion and Analysis disclosures for the proxy statement and annual report on Form 10-K.
| |||||

* Mr. Sheffield served as the Compensation and Management Development Committee Chair for 2022, and Mr. Spence became the Compensation and Management Development Committee Chair effective February 1, 2023. Ms. Buese served on the Compensation and Management Development Committee throughout 2022 and until her resignation in February 2023. Ms. Lockhart joined the Compensation and Management Development Committee February 10, 2023, upon her appointment to the Board. Mr. Muncrief joined, and Ms. Robeson rotated off, the Compensation and Management Development Committee in March 2022.
| WILLIAMS COMPANIES | 2023 PROXY STATEMENT | 31 |
Table of Contents
| Corporate Governance and Board Matters
|
Independence Requirements
The Board has determined that all current members of the Compensation and Management Development Committee meet the heightened independence requirements under the NYSE Listed Company Manual for compensation committee members. This determination included Ms. Robeson, who rotated off the Compensation and Management Development Committee in March 2022, Ms. Buese, who resigned from the Board in February 2023, and Ms. Lockhart who joined the Compensation and Management Development Committee in February 2023.
Additionally, members of the Compensation and Management Development Committee must meet the definition of “Non-Employee Director” included in Section 16 of the Exchange Act. In connection with its assessment of independence of each director that serves on the Committee, the Board also determined that all Compensation and Management Development Committee members (including Ms. Buese, Ms. Lockhart, and Ms. Robeson) met the additional independence standards required by the Exchange Act.
Compensation and Management Development Committee Interlocks and Insider Participation
During fiscal year 2022, Stephen W. Bergstrom, Nancy K. Buese, Richard E. Muncrief, Rose M. Robeson, Scott D. Sheffield, Murray D. Smith, and William H. Spence served on the Compensation and Management Development Committee for all or a portion of time. Additionally, Carri A. Lockhart joined the Compensation and Management Development Committee in February 2023. None of these directors has ever been an officer or employee of the Company or any of our subsidiaries, and none has an interlocking relationship requiring disclosure under applicable SEC regulations as follows: (1) none of the Company’s executive officers serve on the Board or compensation committee of a company that has an executive officer that serves on the Williams’ Board or Compensation and Management Development Committee and (2) none of our Board members are executive officers of a company in which one of our executive officers serves as a member of the board of directors or compensation committee of that company.
Independent Executive Compensation Advisor
The Compensation and Management Development Committee selected and retained Frederic W. Cook & Co. (“FW Cook”) as an independent executive compensation consulting firm to provide the following services:
| • | provide competitive market data and advice related to the CEO’s compensation and incentive design; |
| • | review and evaluate management-developed market data and recommendations on compensation, incentive mix, and incentive design for NEOs and certain other executives (excluding the CEO); |
| • | develop the selection criteria and recommend comparator companies for executive compensation and performance comparisons; |
| • | provide information on executive compensation trends and their implications to Williams; and |
| • | provide competitive market data and advice on non-employee director compensation. |
The Compensation and Management Development Committee evaluates the independence of FW Cook, including consideration of the factors specified in Rule 10C-1 under the Exchange Act and the NYSE’s Listed Company Manual, to ensure that the advisor maintains objectivity and independence when rendering advice to the Committee. FW Cook does not provide any additional services to Williams. The compensation consultant reports to the Compensation and Management Development Committee and is independent of management. The Compensation and Management Development Committee has determined that the services FW Cook provides do not create a conflict of interest.
| 32 |
Table of Contents
| Corporate Governance and Board Matters
|
| Environmental, Health and Safety Committee
| |||||
Michael A. Creel, Chair
Members* Carri A. Lockhart Richard E. Muncrief Rose M. Robeson Scott D. Sheffield Murray D. Smith
Number of Meetings 4 meetings in 2022
Independent Directors 100%
Charter:
| Key Responsibilities
Oversight of EH&S. Reviews and monitors the Company’s EH&S activities, including compliance with applicable and proposed legislation, regulations, and orders; conformance with industry standards and best practices; people health, safety, and security; environmental sustainability, process safety; asset reliability; operational risk management and asset integrity plans and programs; and emergency response plans and programs.
Provides oversight for the Company’s EH&S practices, including compliance with legal and regulatory requirements, and evaluates EH&S matters as part of the Company’s business operations and strategy.
Monitors efforts to create a culture of continuous improvement in the Company’s EH&S practices and efforts to develop and effectively implement EH&S systems, programs, and policies.
Reviews critical incidents regarding the Company’s assets or operations and oversees management’s monitoring and enforcement of Company policies to protect the health and safety of employees, contractors, customers, the public, and the environment.
Reviews and monitors significant regulatory audits, findings, orders, reports and/or recommendations issued by or to the Company related to EH&S matters.
2022 Highlights
• Reviewed safety incidents and remediation efforts and recommendations.
• Reviewed and discussed the safety and environmental performance metrics for the Company, including the 2022/2023 annual incentive program metrics and performance related to EH&S.
• Received updates on the Safety Culture Assessment program and franchise specific results.
• Reviewed management’s Safety Overview of Hydrogen Technology.
• Reviewed management’s overview of the Corporate Incident Response Program and Framework.
• Received updates on the Pipeline Integrity Hard Spot Program.
• Continued to manage and provide updates on the COVID-19 pandemic response.
• Onboarded one new member.
Evaluation and Transparency
• Reviews the charter annually and recommends any changes.
• Evaluates performance annually and reports the results to the Board.
• Reports activities to the Board at every regularly scheduled Board meeting.
| |||||
* Mr. Smith served as the EH&S Committee Chair for 2022, and Mr. Creel became the EH&S Committee Chair effective February 1, 2023. Ms. Buese served on the EH&S Committee throughout 2022 and until her resignation in February 2023. Ms. Lockhart joined the EH&S Committee effective February 10, 2023, upon her appointment to the Board. Mr. Muncrief joined the EH&S Committee in March 2022.
| WILLIAMS COMPANIES | 2023 PROXY STATEMENT | 33 |
Table of Contents
| Corporate Governance and Board Matters
|
Governance and Sustainability Committee
| ||||||
Stacey H. Doré, Chair
Members* Stephen W. Bergstrom Peter A. Ragauss William H. Spence Jesse J. Tyson
Number of Meetings 4 meetings in 2022
Independent Directors 100%
Charter:
| Key Responsibilities
Oversight of Board and Committee Membership. Reviews the size, structure and composition of the Board and its committees and recommends any changes to the Board, including developing director qualifications and identifying and recommending any director candidates and conducting a preliminary review of independence, financial literacy, and other expertise required for certain committees.
Oversight of Governing Policies, Practices, & Procedures. Monitors significant developments in corporate governance, reviews stockholder proposals and correspondence, reviews annually key governance documents, including each standing committee’s charter, the Corporate Governance Guidelines, and the Code of Business Conduct.
Oversight of Officer Appointments. Reviews officer recommendations.
Oversight of ESG. Oversee ESG policies and strategy, including matters that may arise due to climate change and energy transition, and reviews emerging issues, trends, major legislative and regulatory developments, stakeholder engagement, or other public policy matters related to ESG that may affect business operations, material financial performance, or the reputation of the Company.
Oversight of Compliance & Ethics. Oversees risks related to our Ethics and Compliance Program, including the implementation and effectiveness of the program and policies and procedures regarding compliance with the Code of Business Conduct. Reviews any related party transactions.
2022 Highlights
• Recommended to the Board amendments to three Board committee charters to memorialize existing practices and clarify responsibilities regarding oversight of cybersecurity, human capital management, and ESG, including related to climate change.
• Reviewed and approved various Company policies to further align with best practices and stakeholder expectations.
• Reviewed various proposed and final SEC rules pertaining to corporate governance and disclosures.
• Led the Board’s recruitment of three new directors, Ms. Lockhart, Mr. Muncrief, and Mr. Tyson.
• Reviewed the implementation and effectiveness of the Company’s Ethics and Compliance Program and requested a third-party assessment.
• Onboarded one new member.
Evaluation and Transparency
• Reviews the charter annually and recommends any changes.
• Evaluates performance annually and reports the results to the Board.
• Oversees and assists the Board in review of its performance.
• Reports activities to the Board at every regularly scheduled Board meeting.
| |||||
* Mr. Spence served as the Governance and Sustainability Committee Chair for 2022, and Ms. Doré became the Governance and Sustainability Committee Chair February 1, 2023. Stephen I. Chazen and Charles I. Cogut served on the Governance and Sustainability Committee in 2022 until they retired at the annual meeting of stockholders in April 2022. Mr. Tyson joined the Governance and Sustainability Committee in March 2022.
| 34 |
Table of Contents
| Corporate Governance and Board Matters
|
STOCKHOLDER ENGAGEMENT
| We proactively seek year-round engagement with stockholders as a cornerstone of our corporate governance practices. Ongoing and constructive dialogue helps us provide the transparency necessary to build relationships and keeps us informed on emerging issues important to our stockholders. The valuable feedback we receive also helps us to better align our strategy with stockholder expectations. We seek out many ways to foster this collaborative relationship, such as through our innovative ESG event held in January 2021. For more information on our engagement with all stakeholders, please see our Sustainability Report published on our website, www.williams.com, which is not incorporated herein. | In 2022, engaged with institutional investment firms representing more than 50% of our shares outstanding. |
Williams Year-Round Engagement Process
|
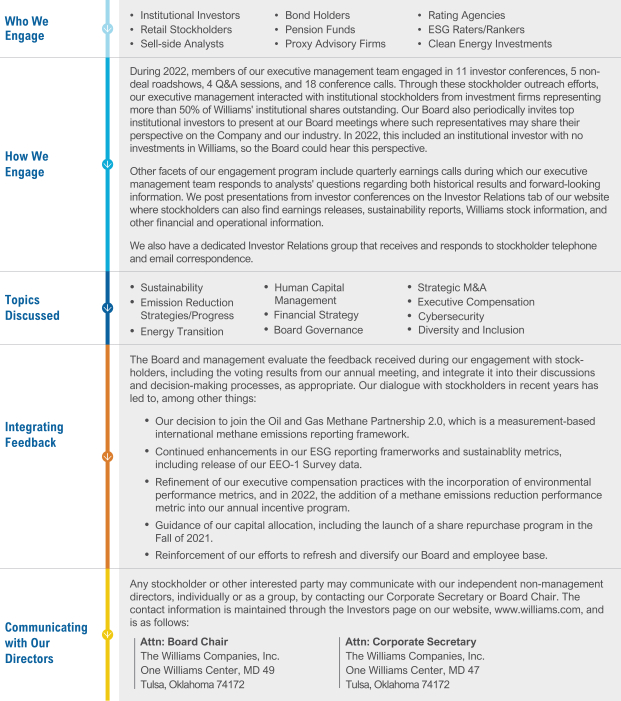
| WILLIAMS COMPANIES | 2023 PROXY STATEMENT | 35 |
Table of Contents
| Corporate Governance and Board Matters
|
SPOTLIGHT ON ENVIRONMENTAL SUSTAINABILITY
As energy demand continues to rise, Williams will be there for the communities that depend on our products and services. We believe we can successfully grow and evolve our reliable operations as the world moves to a low carbon future, while also helping our customers and stakeholders find low-cost solutions to meet their climate goals. We are embracing emerging technologies while providing solutions that are available today to meet clean energy demands. Our approach to address immediate climate risks, maintain reliable, abundant, and affordable energy access; and pursue long-term opportunities includes the following: |
GOAL:
56%
Absolute reduction in Company-wide Scope 1 and Scope 2 greenhouse gas emissions by 2030 vs. 2005 levels, working toward net zero carbon emissions by 2050.*
| |
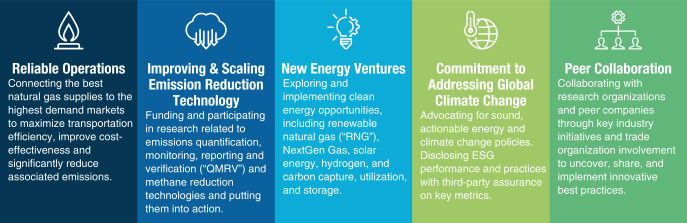
The global climate challenge requires all stakeholders to work together to innovate and develop the needed infrastructure to fuel the clean energy economy. We are engaging with customers, academia, industry partners, non-governmental organizations, and state and federal governments to collaborate on ideas and opportunities to accelerate our clean energy future. It is one thing to talk about creating a cleaner energy future—it’s another to act on it. We have committed to the ONE Future membership target to reduce methane emissions in the natural gas supply chain to 1% by 2025. We co-chaired an initiative with the Energy Infrastructure Council to launch a midstream energy sector reporting template for presenting sustainability metrics in a transparent and comparable way. Williams was the first North American midstream company to establish an actionable climate commitment, and we are leading the way in transparency and action for stakeholders to hold us accountable.
* Gross direct (Scope 1) greenhouse gas emissions in millions of metric tons of CO2 -equivalent. The consolidation approach is operational control and includes CO2, CH4, and N2O. Emissions are based on calendar years. Emissions from facilities that are applicable under the U.S. EPA Greenhouse Gas Reporting Program (“GHGRP”) are calculated using the GHGRP methodology. Emissions from facilities that are not applicable to the GHGRP due to reporting thresholds are calculated referencing GHGRP and ONE Future protocols. Methane emissions from sources that are not applicable under the GHGRP are calculated using ONE Future protocol. Data excludes emissions from offshore assets, corporate office buildings and company vehicles. Global Potential Warming rates are 25 for CH4 and 298 for N2O. No Williams facilities are covered by permits with potential to emit limits for greenhouse gases. Williams does not produce biogenic gases from its direct operations. Williams does not produce hydrochlorofluorocarbons, perfluorocarbons, sulfur hexafluoride or nitrogen trifluoride emissions. Gross location-based energy indirect (Scope 2) greenhouse gas emissions in millions of metric tons of CO2 -equivalent. The consolidation approach is operational control.
| 36 |
Table of Contents
| Corporate Governance and Board Matters
|
Providing Clean, Affordable, and Reliable Energy
Natural gas is perhaps the most powerful and mature tool in quickly accomplishing emissions reductions, both domestically and internationally, by displacing electricity generated from dirtier fuels. Natural gas is also critical to supporting the scaling of renewable energy to the power grid in large quantities while keeping energy reliable and affordable. With one of the largest and most flexible natural gas transmission systems in the United States, Williams can support growing energy demand while maintaining industry-leading emissions rates and reliability.
Environmental stewardship is one of Williams’ Core Values, and we hold ourselves accountable to meet or exceed all applicable environmental, health and safety laws and regulations as we handle approximately one-third of the natural gas in the United States. Our Environmental, Health and Safety Policy outlines our commitment to protect the environment and integrate environmental considerations into our daily business activities. Every employee and contractor is responsible for adhering to this policy. We put this policy into action with WIMs, which serves as our Company-wide platform for providing requirements, guidelines, procedures, standards and specifications to manage and reduce operational and environmental risk. We also undergo internal and third-party audits of our compliance with WIMs.
| We continuously work to reduce our operational GHG emissions, which occur at our assets. These assets primarily include gathering systems and interstate transmission pipelines, compressor stations, natural gas processing plants and liquefied natural gas and underground storage facilities. Our efforts to reduce operational GHG emissions include operating our assets efficiently through preventive maintenance, conducting leak detection and repair assessments, process improvements, such as implementing recompression measures and evaluating usage of gas drivers versus electric motors, and modernizing our facilities, including installing emissions reduction equipment such as compressor vent gas reduction systems and emission control devices. Our Sustainability Report contains our GHG emissions totals and methane intensities by industry segment. | As of December 31, 2021, we have achieved a
47% absolute reduction in company-wide Scope 1 and Scope 2 greenhouse gas emissions vs. 2005 levels* | |
We also work hard to maintain robust reliability in our plans and contingencies to prevent supply disruption to our customers and keep costs low for energy consumers, including a focus on pipeline integrity and maintenance, cybersecurity, and safety. As we work to continuously improve our ability to provide clean, affordable, and reliable energy, some of our near-term initiatives include:
Energy Efficiency. Our business units are reducing methane emissions with advanced monitoring technologies, enhanced leak detection and repair, work practice improvements and evaluating equipment upgrades and modernization on a site-specific basis. | Solar + Storage. We are evaluating the development of photovoltaic solar and battery systems behind the meter to offset current electricity usage at existing facilities and looking to scale these projects for third-party energy demand. These solar facilities will generate renewable energy credits that can be sold into the market or retired to offset Williams’ Scope 2 emissions. | Renewable Natural Gas (“RNG”). Our RNG program includes constructing new interconnects and pipeline extensions to make use of low or negative carbon substitutes for fossil-derived natural gas that come from landfill waste, municipal water treatment facilities, livestock farms or food waste operations. These investments may generate environmental attributes that can be sold into the market or retired to offset our own emissions.
| ||
* Gross direct (Scope 1) greenhouse gas emissions in millions of metric tons of CO2 -equivalent. The consolidation approach is operational control and includes CO2, CH4, and N2O. Emissions are based on calendar years. Emissions from facilities that are applicable under the U.S. EPA GHGRP are calculated using the GHGRP methodology. Emissions from facilities that are not applicable to the GHGRP due to reporting thresholds are calculated referencing GHGRP and ONE Future protocols. Methane emissions from sources that are not applicable under the GHGRP are calculated using ONE Future protocol. Data excludes emissions from offshore assets, corporate office buildings and company vehicles. Global Potential Warming rates are 25 for CH4 and 298 for N2O. No Williams facilities are covered by permits with potential to emit limits for greenhouse gases. Williams does not produce biogenic gases from its direct operations. Williams does not produce hydrochlorofluorocarbons, perfluorocarbons, sulfur hexafluoride or nitrogen trifluoride emissions. Gross location-based energy indirect (Scope 2) greenhouse gas emissions in millions of metric tons of CO2 -equivalent. The consolidation approach is operational control. 2021 emissions were calculated using U.S. EPA Power Profiler Emissions Tool 2020, using emission factors from U.S. EPA eGRID2020 multiplied by kilowatt-hour energy use for all assets that Williams operates.
| WILLIAMS COMPANIES | 2023 PROXY STATEMENT | 37 |
Table of Contents
| Corporate Governance and Board Matters
|
Building the Next Generation Energy Marketplace
In 2021, we launched New Energy Ventures, a business development group focused on commercializing innovative energy technologies, markets, and business models. New Energy Ventures collaborates with talent across Williams to evaluate and implement projects to grow our clean energy business, reduce our operational emissions and costs, and offer opportunities to our customers to achieve their sustainability goals. In 2022, we developed a corporate venture capital program to invest in innovation. The program includes direct investments into start-up companies, participation as a limited partner in a fund set up specifically to invest in low carbon technologies and partnering with other like-minded companies with net zero ambitions to fund the development of technical solutions for decarbonizing energy intensive products or services.
Guiding Principles for Prioritizing Our Areas of Focus and Investment
|  |  |  | |||||||||
Achieve carbon reductions |
| Create economic value | | Target opportunities where | | Provide scalable options for | ||||||

Some of our initiatives include:
NextGen Natural Gas.
We are working with customers and technology partners to offer end-to-end certified gas deliveries, including low-carbon products and carbon-offset gas. These products provide scalable options to lower the emissions footprint of natural gas from the wellhead to the water or burner tip.
Carbon Capture, Utilization and Storage (“CCUS”).
Developing infrastructure required to capture, transport and sequester CO2. We are exploring capturing CO2 at existing Williams gathering and processing assets, compressor stations, and customer facilities; repurposing existing, underutilized transmission assets for CO2 service; establishing sequestration partnerships to ensure captured CO2 will be sequestered permanently; and building, owning and operating greenfield CO2 infrastructure. These projects create an opportunity for Williams to leverage generated environmental attributes and tax credits.
Hydrogen.
Pursuing projects such as developing hydrogen pipelines and storage solutions; blending hydrogen into our existing
transmission lines; producing clean hydrogen from electrolysis with renewable power (green hydrogen) or from NextGen Natural Gas with CCUS (blue hydrogen); consuming hydrogen as fuel to reduce Scope 1 emissions; and producing synthetic natural gas from clean hydrogen combined with captured CO2.
Clean Energy Hubs.
Exploring concepts, including a Williams Wyoming Clean Energy Hub, to integrate renewable power, hydrogen, captured CO2 and methanation into our existing assets, balancing the intermittency of wind and solar power to create a dispatchable, clean molecule to meet energy demand. We are also looking into CCUS hubs with multiple partners working to gather CO2 emissions at scale.
Carbon Markets.
Optimizing environmental attribute credits, including Renewable Energy Certificates from solar, Renewable Identification Numbers from RNG and carbon offsets generated from our own carbon reduction activities toward our own carbon reduction goals or monetizing to help our customers reduce their emissions.
| 38 |
Table of Contents
| Corporate Governance and Board Matters
|
Transparency & Assurance
Our annual Sustainability Report is located on our website, www.williams.com/sustainability/. The Contents are not incorporated herein by reference. Williams also completes and makes available through its website, its annual CDP Climate Change Questionnaire, the contents of which are not incorporated herein by reference. Starting in late 2020, we conducted a second ESG materiality assessment to prioritize sustainability topics that matter most to our stakeholders. In late 2022, we began the process to refresh this ESG materiality assessment.
|  | |||||||||||
The outcome of the 2020 assessment resulted in nine material topics:
| ||||||||||||
• | Public Perception | • | Public Policy | • | Pipeline Safety | |||||||
•
• |
Climate Change
Employee Attraction, Retention, & Development |
•
• |
Diversity & Inclusion
Operational Greenhouse Gas Emissions |
•
• |
Workforce Health & Safety
Energy Affordability & Access | |||||||
The 2021 Sustainability Report focuses on these nine topic areas and was prepared in accordance with the GRI Standards: Core option. The report references the Sustainability Accounting Standards Board (“SASB”), Task Force on Climate-related Financial Disclosures (“TCFD”), and the United Nations Sustainable Development Goals (“SDGs”) frameworks. Additionally, for the 2020 and 2021 Sustainability Reports, we conducted independent third-party limited assurance for select greenhouse gas emissions, pipeline integrity, and safety data. Williams’ internal audit team also reviewed the supporting documentation for the data and verified the evidence. New in our 2021 Sustainability Report, we added the following:
• a TCFD Content Index to allow readers to easily identify the components of the TCFD within the report.
• Scope 1 Methane Emissions and the Sum of Scope 1 and 2 Methane Emissions to the Performance Data Table.
• Third-party assurance of additional metrics. | ||||||||||||
Recognition | ||||||
We earned a B score on the 2022 CDP Climate Change Questionnaire, exceeding the oil and gas storage and transportation activity group average of ‘C’ and the North America regional average ‘C’ as of Dec. 7, 2022.
|
Member of Dow Jones Sustainability Indices
Powered by the S&P Global CSA
We retained our position on the DJSI North America and the DJSI World Indices as of Dec. 9, 2022. | |||||
As of December 15, 2022, we maintained our MSCI ESG Rating of BBB. |
Williams was ranked No. 1 North American company in the oil and gas storage and transportation segment in the 2022 S&P Global Corporate Sustainability Assessment and awarded the highest distinction of Top 1% S&P Global ESG Score as of February 7, 2023. | |||||

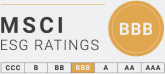

*The use by Williams of any MSCI ESG Research LLC or its affiliates (“MSCI”) data, and the use of MSCI logos, trademarks, service marks or index names herein, do not constitute a sponsorship, endorsement, recommendation, or promotion of Williams by MSCI. MSCI services and data are the property of MSCI or its information providers and are provided ‘as-is’ and without warranty. MSCI names and logos are trademarks or service marks of MSCI.
| WILLIAMS COMPANIES | 2023 PROXY STATEMENT | 39 |
Table of Contents
| Corporate Governance and Board Matters
|
SPOTLIGHT ON HUMAN CAPITAL MANAGEMENT
Our employees are instrumental in our mission to be the leader in providing infrastructure that safely delivers natural gas products that fuel the clean energy economy. As of February 2023, Williams employs more than 5,200 people across the United States, and supporting each of them is key to our success. The Compensation and Management Development Committee oversees elements of our human capital management, including annual review of talent management, diversity & inclusion initiatives and progress, and succession planning programs. For more details on our human capital management, please see our Diversity & Inclusion Report and Sustainability Report on our website, www.williams.com, neither of which are incorporated herein by reference.
Talent Attraction and Retention
Our strategic and operational results rely on attracting and retaining the best talent in the industry. We do this by striving to create a safe, inclusive, and authentic workplace where employees are energized, feel valued, welcomed, and respected for their contributions. The voice of our employees is key to creating a best-in-class workplace. In 2021, we conducted an enterprise-wide Voice of Williams employee engagement survey to better understand how we can accomplish these goals. In 2023, we will pilot a pulse survey to collect the Voice of Williams more frequently. Additionally, our executive officer team is committed to listening to employees firsthand. They host listening lunches, virtual all-employee meetings, and spend time in field-based operational locations to more impactfully engage with employees. We offer robust training programs to support the compliance, safety, skill, and professional development of our employees, including: |
We had 86%
employee participation and over 9,000 comments submitted in our Voice of Williams employee engagement survey conducted in August 2021.
| |||||
• Baseline development programs for all employees including optional Employee Essentials for all employees and Leader Essentials required for all new leaders.
• Supplemental training including access to LinkedIn Learning and Catalyst resources, Safety Leadership, Operations Technician Development, Exploring Leadership, and Leaders and the Law.
In 2022, we also launched several new initiatives, including: |
Nearly 38%
of open positions were filled internally in 2022.
| |||||
• A “Gig” feature in our human capital management system that allows managers to post, and employees to find short-term defined projects or on-the-job experiences throughout the company to build and demonstrate skills for development.
• A quarterly “Building the Bench” publication to provide more transparency into organizational moves, including internal metrics such as our year-over-year promotional trends, which was around 15% for 2022.
Competitive Total Rewards Program
|
Inclusive hiring process initiatives in recent years include:
• Partnerships with
• Masked candidate screening.
• Inclusive job descriptions.
• Revised interview guides.
• Removed salary history
| |||||
Financial
• Competitive salary
• All-employee annual
• Stock awards for |
Health & Wellness
• Comprehensive
• Wellness program
• Employee assistance |
Retirement
• 4.5% fixed annual contribution for new employees + 6% matching contribution with more than 95% employee participation (as of Dec. 2022)
• Employee stock | ||||
| 40 |
Table of Contents
| Corporate Governance and Board Matters
|
| ||||||
| Community Partnerships | ||||||
Volunteer Hours
Our employees logged more than 20,000 volunteer hours in 2022. | Volunteer Week
We completed more than 160 projects across 18 states during the inaugural volunteer week we hosted in 2022. | |||||
Corporate Giving
Williams awarded $13.8 million to approximately 2,100 organizations across 50 states in 2022. | United Way
Williams provided total support exceeding $2.4 million to 130 United Way agencies in 2022. | |||||
Health & Safety
Adhering to our Core Values, we are safety driven in all that we do. We strive to continuously improve and empower our employees to operate our assets in a safe, reliable, and customer-focused way. The Environmental, Health and Safety Committee oversees health and safety matters. We also have included a leading safety performance metric in our annual cash incentive program. Our Safety Commitment & Pillars, developed by employees across the organization, increase focus on our safety culture through individual ownership, operational discipline, shared learning, and prompt action:
|
|
|
| |||
Care for Self & Others | Be Accountable | Execute with Purpose | Individual Commitment |


83,926
hours of safety related training completed in 2022. | 46%
reduction in recordable injuries in 2022.
| 76%
reduction in lost-time injuries year-over-year.
| ||
| WILLIAMS COMPANIES | 2023 PROXY STATEMENT | 41 |
Table of Contents
| Corporate Governance and Board Matters
|
Diversity & Inclusion (“D&I”)
We believe that D&I fosters innovation and collaboration, brings out the best in our people, and drives business success. We are continuing to embed D&I in our daily culture through leadership accountability, employee education, workplace practices, and proactive allyship. The Compensation and Management Development Committee oversees our D&I initiatives and progress, which include the following:
| • | We require leaders to take the baseline D&I training course, Lead with Inclusion, which covers content that equips our leaders with knowledge, skills, and mindsets to be successful. |
| • | All formal leaders are now rated on two additional leadership competencies as part of their year-end performance rating, directly tied to our annual cash incentive program. Values Differences and Builds Effective Teams competencies are intended to improve leadership accountability for creating inclusive teams and fully developing talent. |
Additionally, in 2022, we held a companywide CEO Day of Understanding to leverage the value created by each of our differences, which is part of our CEO’s commitment to the CEO Action for D&I Coalition.
Williams 2022 Diversity Data(1)
| ||||||
Underrepresented Ethnicity & Race | Underrepresented Ethnicity & Race in Management | Gender Diversity | Gender Diversity in Management | |||
|
|
|
| |||
(1) Underrepresented ethnicity & race refers to employees of the following race/ethnicity: American Indian or Alaska Native, Asian, Black or African American, Hispanic or Latino, Native Hawaiian or Other Pacific Islander, or Two or More Races.
| ||||||
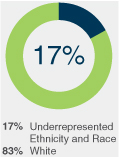
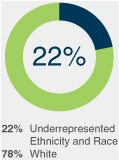
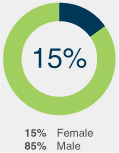

D&I Council Chaired by a senior leader and comprised of organizational leaders, and employees who are generally selected via a self-nomination process, the Council reviews D&I metrics quarterly and provides input regarding our D&I strategy.
|
Employee Resource Groups (ERGs) We maintain 10 active ERGs with members and allies totaling nearly 25% of our employee base. Many employees participate in more than one ERG, and 20 vice presidents have volunteered to be ERG executive sponsors. Our ERGs host opportunities for employees across the company to learn from one another about D&I topics.
|
Randy Barnard Memorial Leave the Ladder Down Award Recognizing a leader and individual contributor for creating an inclusive environment where employees feel respected, valued, and comfortable bringing their authentic selves to work each day. We present this award annually in a Board meeting and donate to a non-profit of the recipients’ choice.
|
Transparency & Accountability
• Published our Diversity and Inclusion Report externally for the first time in 2022. Our D&I Report defines what D&I means at Williams, shares key metrics and trends, provides transparency about opportunities for improvement, and communicates our D&I goals. We also publish our EEO-1 Survey data to our website annually.
• Continued utilizing a third party to conduct annual pay equity analysis.
• Scored 95 out of 100 in the 2023 on the Human Rights Campaign’s 2023 Corporate Equality Index Criteria.
• Participated in Bloomberg’s Gender-Equality Index, and we are listed in their 2022 GEI Report.
|
|
| 42 |
Table of Contents
| Corporate Governance and Board Matters
|
BOARD EVALUATION PROCESS
The Board and each of its standing committees conduct annual evaluations and self-assessments as follows:
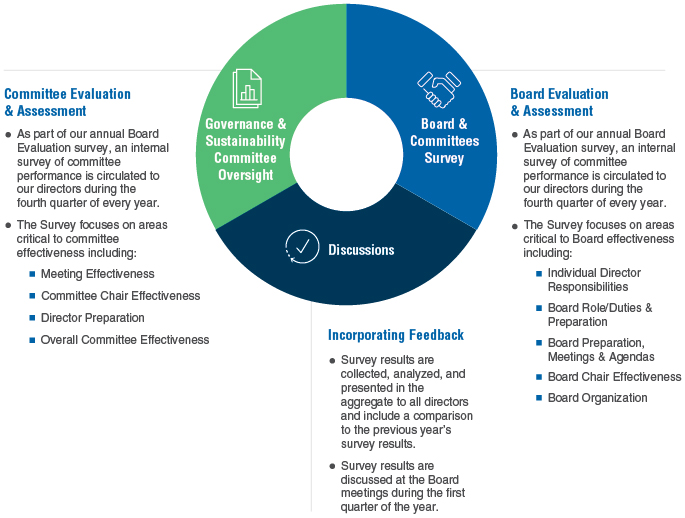
The Governance and Sustainability Committee oversees the evaluation process, including reviewing the evaluation process effectiveness. In addition, the Governance and Sustainability Committee annually evaluates the following:
| • | The size, structure, and composition of the Board. |
| • | The skills, experience, and attributes currently represented on the Board. |
| • | The skills, experience, and attributes that the Board will find valuable in the future based on the Company’s strategic plans. |
| • | The trends and feedback regarding prior year board evaluations and self-assessments. |
This assessment helps the Governance and Sustainability Committee determine which director candidates to nominate to fill a Board vacancy or elect at the annual meeting of stockholders. See also the “Identifying & Evaluating Director Candidates” section.
The Governance and Sustainability Committee also (1) reviews the size and composition of each Board committee to make committee composition recommendations, (2) assesses the adequacy of each Board committee’s charter, and (3) evaluates the effectiveness of the Board committee structure, operations, and reports to the Board. The Governance and Sustainability Committee may also evaluate each director’s individual performance on an as needed basis.
| WILLIAMS COMPANIES | 2023 PROXY STATEMENT | 43 |
Table of Contents
| Corporate Governance and Board Matters
|
DIRECTOR COMPENSATION
All non-employee directors receive both an annual cash retainer and an annual grant of time-based RSUs for their service on the Board totaling $290,000. The below table sets forth the breakdown of payments to our non-employee directors as follows:
Type of Payment | Amount Paid | Terms of Payment | ||||
Annual Cash Retainer | $ | 115,000 | Paid in quarterly installments. | |||
Annual Equity Retainer (RSU) | $ | 175,000 | Paid annually on the date of the annual meeting and deferred until the director’s retirement from the Board. Dividend equivalents on the RSUs are reinvested until distribution. | |||
Directors who perform additional leadership roles receive the following compensation:
Leadership Role | Type of Payment | Amount Paid | Terms of Payment | |||||
Non-Executive Board Chair | Annual Equity Retainer (RSU) | $ | 200,000 | Paid annually on the date of the annual meeting and deferred until the director’s retirement from the Board. Dividend equivalents on the RSUs are reinvested until distribution. | ||||
Audit Committee Chair | Annual Cash Retainer | $ | 30,000 | Paid in quarterly installments. | ||||
Compensation & Management Development Committee Chair | Annual Cash Retainer | $ | 20,000 | Paid in quarterly installments. | ||||
Environmental, Health & Safety Committee Chair | Annual Cash Retainer | $ | 20,000 | Paid in quarterly installments. | ||||
Governance and Sustainability Committee Chair | Annual Cash Retainer | $ | 20,000 | Paid in quarterly installments. | ||||
The annual retainer increased from $275,000 to $290,000 for the 2022-2023 fiscal year to align to the median of market. The annual cash retainer was increased from $110,000 to $115,000 and the annual equity retainer was increased from $165,000 to $175,000. Prior to this, the annual retainers for the non-employee director compensation program had not changed since 2017. It’s important to emphasize the annual equity retainer is deferred until the director’s retirement from the Board.
Non-employee directors generally receive their compensation for a fiscal year beginning on the date of the annual stockholders meeting. The following table shows how compensation is paid to individuals who become non-employee directors after the annual meeting. In this case, the equity retainer would be paid the first of the month following appointment and the cash retainers will be paid on the scheduled quarterly payment dates.
An individual who became a | but before | will receive | ||
after the annual meeting | August 1 | full compensation | ||
on or after August 1 | the next annual meeting | pro-rated compensation | ||
Non-employee directors are reimbursed for expenses (including costs of travel, food, and lodging) incurred in attending Board, committee, and stockholder meetings. Directors are also reimbursed for reasonable expenses associated with other business activities, including participation in director education programs. In addition, Williams pays premiums on directors’ and officers’ liability insurance policies.
Like all Williams employees, directors are eligible to participate in the Williams Matching Grant Program for eligible charitable organizations and the United Way Program. The maximum matching contribution in any calendar year is $10,000 for a participant in the Matching Grant Program and $25,000 for a participant in the United Way Program.
| 44 |
Table of Contents
| Corporate Governance and Board Matters
|
Director Compensation for Fiscal Year 2022
The compensation earned by each director for 2022 service is outlined in the following table:
Name | Fees Earned or Paid in Cash(1) | Fees Earned or Paid in Stock(2) | Option Awards | Non-Equity Incentive Plan Compensation | Change in Pension Value and Nonqualified Deferred Compensation Earnings | All Other Compensation(3) | Total | |||||||||||||||||||||
Stephen W.Bergstrom | $ | 113,750 |
| $ | 375,008 |
| $ | — |
| $ | — |
| $ | — |
| $ | 25,000 |
| $ | 513,758 |
| |||||||
Nancy K. Buese |
| 113,750 |
|
| 175,015 |
|
| — |
|
| — |
|
| — |
|
| — |
|
| 288,765 |
| |||||||
Stephen I. Chazen (4) |
| 27,500 |
|
| 175,015 |
|
| — |
|
| — |
|
| — |
|
| — |
|
| 202,515 |
| |||||||
Charles I. Cogut (4) |
| 27,500 |
|
| 175,015 |
|
| — |
|
| — |
|
| — |
|
| — |
|
| 202,515 |
| |||||||
Michael A. Creel |
| 113,750 |
|
| 175,015 |
|
| — |
|
| — |
|
| — |
|
| 8,500 |
|
| 297,265 |
| |||||||
Stacey H. Doré |
| 113,750 |
|
| 175,015 |
|
| — |
|
| — |
|
| — |
|
| 5,000 |
|
| 293,765 |
| |||||||
Richard E. Muncrief (5) |
| 104,583 |
|
| 202,519 |
|
| — |
|
| — |
|
| — |
|
| — |
|
| 307,102 |
| |||||||
Peter A. Ragauss |
| 143,750 |
|
| 175,015 |
|
| — |
|
| — |
|
| — |
|
| 20,000 |
|
| 338,765 |
| |||||||
Rose M. Robeson |
| 113,750 |
|
| 175,015 |
|
| — |
|
| — |
|
| — |
|
| — |
|
| 288,765 |
| |||||||
Scott D. Sheffield |
| 133,750 |
|
| 175,015 |
|
| — |
|
| — |
|
| — |
|
| 5,000 |
|
| 313,765 |
| |||||||
Murray D. Smith |
| 133,750 |
|
| 175,015 |
|
| — |
|
| — |
|
| — |
|
| — |
|
| 308,765 |
| |||||||
William H. Spence |
| 133,750 |
|
| 175,015 |
|
| — |
|
| — |
|
| — |
|
| 35,000 |
|
| 343,765 |
| |||||||
Jesse J. Tyson (5) |
| 104,583 |
|
| 202,519 |
|
| — |
|
| — |
|
| — |
|
| — |
|
| 307,102 |
| |||||||
(1) The fees paid in cash are itemized in the following chart:
Name | Annual Cash Retainer Including Service on Two Committees | Audit Committee Chair Retainer | Compensation & Management Development Committee Chair Retainer | Governance & Sustainability Committee Chair Retainer | Environmental, Health, & Safety Committee Chair Retainer | Total | ||||||||||||||||||
Bergstrom | $ | 113,750 |
| $ | — |
| $ | — |
| $ | — |
| $ | — |
| $ | 113,750 |
| ||||||
Buese |
| 113,750 |
|
| — |
|
| — |
|
| — |
|
| — |
|
| 113,750 |
| ||||||
Chazen (4) |
| 27,500 |
|
| — |
|
| — |
|
| — |
|
| — |
|
| 27,500 |
| ||||||
Cogut (4) |
| 27,500 |
|
| — |
|
| — |
|
| — |
|
| — |
|
| 27,500 |
| ||||||
Creel |
| 113,750 |
|
| — |
|
| — |
|
| — |
|
| — |
|
| 113,750 |
| ||||||
Doré |
| 113,750 |
|
| — |
|
| — |
|
| — |
|
| — |
|
| 113,750 |
| ||||||
Muncrief (5) |
| 104,583 |
|
| — |
|
| — |
|
| — |
|
| — |
|
| 104,583 |
| ||||||
Ragauss |
| 113,750 |
|
| 30,000 |
|
| — |
|
| — |
|
| — |
|
| 143,750 |
| ||||||
Robeson |
| 113,750 |
|
| — |
|
| — |
|
| — |
|
| — |
|
| 113,750 |
| ||||||
Sheffield |
| 113,750 |
|
| — |
|
| 20,000 |
|
| — |
|
| — |
|
| 133,750 |
| ||||||
Smith |
| 113,750 |
|
| — |
|
| — |
|
| — |
|
| 20,000 |
|
| 133,750 |
| ||||||
Spence |
| 113,750 |
|
| — |
|
| — |
|
| 20,000 |
|
| — |
|
| 133,750 |
| ||||||
Tyson (5) |
| 104,583 |
|
| — |
|
| — |
|
| — |
|
| — |
|
| 104,583 |
| ||||||
(2) Awards were granted under the terms of the 2007 Incentive Plan and represent time-based RSUs. Amounts shown are the grant date fair value of awards computed in accordance with FASB ASC Topic 718. The assumptions used to value the stock awards can be found in our Form 10-K for the year-ended December 31, 2022.
(3) All other compensation includes matching contributions paid in 2022 made on behalf of the Board to charitable organizations through the Matching Grants Program or the United Way Program. It is possible for Directors to make charitable contributions at the end of the year that are not matched by the Company until the following year.
(4) Mr. Chazen and Mr. Cogut retired from the Board in April 2022. The quarterly payment for their service in the fourth quarter of the 2021-2022 fiscal year was paid in early 2022.
(5) Mr. Muncrief and Mr. Tyson were appointed to the Board on March 1, 2022. The pro-rata payment and stock awards for their service in the fourth quarter of the 2021—2022 fiscal year were paid and awarded respectively in early 2022.
| WILLIAMS COMPANIES | 2023 PROXY STATEMENT | 45 |
Table of Contents
| Corporate Governance and Board Matters
|
Outstanding Awards as of Fiscal Year End 2022
The aggregate number of stock options and stock awards held by directors outstanding as of December 31, 2022, is as follows:
Name | Number of Shares or Units of Stock Outstanding | Number of Securities Options Exercisable | |||||||||||||
Bergstrom | 110,615 | — | |||||||||||||
Buese | 39,528 | — | |||||||||||||
Chazen (1) | — | — | |||||||||||||
Cogut (1) | — | — | |||||||||||||
Creel | 47,456 | — | |||||||||||||
Dore | 16,570 | — | |||||||||||||
Muncrief | 6,163 | — | |||||||||||||
Ragauss | 47,456 | — | |||||||||||||
Robeson | 17,554 | — | |||||||||||||
Sheffield | 47,456 | — | |||||||||||||
Smith | 71,934 | — | |||||||||||||
Spence | 53,462 | — | |||||||||||||
Tyson | 6,163 | — | |||||||||||||
(1) Mr. Chazen and Mr. Cogut resigned from the Board effective April 26, 2022, and their stock awards distributed upon resignation.

To attract the best talent, Williams focuses on building an inclusive culture, so employees are comfortable bringing their authentic selves to work.
| 46 |
Table of Contents
| AUDIT MATTERS |
PROPOSAL 2: RATIFY THE SELECTION OF ERNST & YOUNG LLP AS THE COMPANY’S INDEPENDENT REGISTERED PUBLIC ACCOUNTING FIRM FOR THE FISCAL YEAR ENDING DECEMBER 31, 2023.
The Audit Committee is responsible for the appointment, compensation, retention, and oversight of the Company’s independent, registered public accounting firm. At a meeting held on January 30, 2023, the Audit Committee selected Ernst & Young LLP (“EY”) as the independent registered public accounting firm to audit our financial statements for the fiscal year ending December 31, 2023. EY was our independent registered public accounting firm for the 2022 fiscal year and has been our independent auditor since 1962. The Audit Committee believes that the appointment of EY as our independent registered public accounting firm is in the best interests of our stockholders. The Audit Committee considered several factors in selecting EY, including the following: | • Professional Qualifications
• Industry Expertise
• Resources and Capabilities
• Past Performance
• Independence
• Tenure
• Competitiveness of Fees
• Disruption from Auditor Change | |
Benefits of Long Tenure | ||
• Strong Audit Quality. EY’s deep institutional knowledge and expertise regarding the Company’s business, accounting policies and practices, and internal controls over financial reporting enhance audit quality. This knowledge also supports an effective and efficient audit process that enhances responsiveness to material transactions and other changes within the Company when they occur. | • Competitive Audit Fees. EY’s institutional knowledge of the Company helps maintain competitive fees.
• No Onboarding Burden. The Company would incur significant costs and time commitments to switch independent registered public accounting firms and familiarize a new firm with our accounting policies and practices and internal controls. | |
Oversight and Independence Controls | ||
• Pre-approval of all EY Services. The Audit Committee pre-approves all audit and non-audit services provided by EY.
• Lead Partner Selection Process. The Audit Committee chair has direct involvement in selection of EY’s lead engagement partner as part of the mandatory five-year rotation.
• Meeting without Management. The Audit Committee regularly meets with EY in executive session without management present.
• Performance Review. At least annually, the Audit Committee evaluates EY’s qualifications and performance, including obtaining and reviewing a report by the independent auditor describing its internal quality control procedures, any material issues raised by the internal quality control review, or peer review, or by any inquiry or investigation by governmental or professional authorities within the preceding five years regarding independent audits conducted by EY. | • Independence Review. At least annually, the Audit Committee evaluates EY’s independence, and obtains and reviews a report by EY describing any relationships with the Company or individuals in financial reporting oversight roles that may reasonably be thought to bear on independence.
• Internal EY Independence Process. EY conducts periodic internal reviews of its audit and other work, assesses the adequacy of partners and other personnel working on the Company’s account, and rotates the lead assurance engagement partner, the coordinating partner, and other partners on the engagement consistent with independence requirements.
• Regulatory Oversight of External Auditor. EY is an independent registered public accounting firm subject to Public Company Accounting Oversight Board and SEC oversight. | |
| WILLIAMS COMPANIES | 2023 PROXY STATEMENT | 47 |
Table of Contents
| Audit Matters
|
A representative of EY will attend the virtual Annual Meeting and be available to respond to appropriate questions. EY has indicated that it does not intend to make a formal statement. Stockholder approval of the appointment of EY is not required, but the Audit Committee and the Board are submitting the selection of EY for ratification to obtain our stockholders’ views. If a majority of the stockholders do not ratify the selection of EY as the registered public accounting firm to audit our financial statements for the fiscal year 2023, the Audit Committee and the Board will consider the voting results and evaluate whether to select a different independent auditor.
THE PROCESS FOR APPROVAL OF EY’S SERVICES, INCLUDES THE FOLLOWING STEPS: | PRINCIPAL ACCOUNTANT FEES AND SERVICES
Fees for professional services provided by our independent registered public accounting firm for each of the last two fiscal years were as follows: | |||||||||
1 |
On an ongoing basis, our management presents specific projects and categories of service to the Audit Committee to request advance approval. | |||||||||
| 2022 (millions) | 2021 (millions) | |||||||||
Audit Fees | $ 7.7 | $ 8.3 | ||||||||
Audit-Related fees | $ 1.0 | $ 1.7 | ||||||||
Tax Fees | $ 0.1 | $ 0.6 | ||||||||
2 |
The Audit Committee reviews those requests and determines whether to approve the engagement of EY.
| All Other Fees | $ 0.0 | $ 0.4 | ||||||
Total | $ 8.8 | $ 11.0 | ||||||||
| Audit fees include fees associated with the annual audits of all of our registrants | ||||||||||
The Audit Committee may also delegate the authority to pre-approve audit and permitted non-audit services, excluding services related to the Company’s internal controls over financial reporting, to a subcommittee of one or more committee members, provided that any such pre-approvals are reported at a subsequent Audit Committee meeting. | for SEC and Federal Energy Regulatory Commission reporting purposes, the reviews of our quarterly reports on Form 10-Q, the audit of internal controls as required by Section 404 of the Sarbanes-Oxley Act of 2002, and services performed in connection with other SEC filings. Audit-related fees include audits of employee benefit plans and services performed for other compliance purposes. Tax fees include tax planning, tax advice, and tax compliance. EY does not provide tax services to our executives. Fees for 2021 include work related to our enterprise financial systems implementation and acquisition-related work. | |||||||||
In 2022 and 2021, all of EY’s services were pre-approved by the Audit Committee. | ||||||||||
|
The Board unanimously recommends that stockholders vote “FOR” the ratification of the selection of Ernst & Young LLP as the Company’s independent registered public accounting firm for the fiscal year ending December 31, 2023. |
| 48 |
Table of Contents
| Audit Matters
|
Audit Committee Report
The Audit Committee oversees Williams’ financial reporting process on behalf of the Board. Management has the primary responsibility for the financial statements and the reporting process, including the systems of internal controls. The Audit Committee meets separately with management, the internal auditors, the independent auditors, and the General Counsel. The Audit Committee operates under a written charter approved by the Board, a copy of which is available on our website at www.williams.com. The charter, among other things, provides that the Audit Committee has full authority to appoint, oversee, compensate, evaluate, and terminate when appropriate, the independent auditor. In this context, the Audit Committee:
| • | Reviewed and discussed the audited financial statements in Williams’ annual report on Form 10-K with management. |
| • | Discussed with Ernst & Young LLP the matters required to be discussed by the applicable requirements of the Public Company Accounting Oversight Board and the SEC, including the critical audit matters addressed during the audit, the Company’s financial reporting process and the effectiveness of the Company’s internal accounting controls. |
| • | Received the written disclosures and the letter from Ernst & Young LLP required by applicable requirements of the Public Company Accounting Oversight Board regarding Ernst & Young LLP’s communications with the Audit Committee concerning independence. |
| • | Discussed with Ernst & Young LLP its independence from management and Williams. |
| • | Based on the foregoing reviews and discussions, recommended to the Board that the audited financial statements be included in the annual report on Form 10-K for the year ended December 31, 2022 for filing with the SEC. |
By the members of the Audit Committee of the Board:*
Rose M. Robeson, Chair
Michael A. Creel
Stacey H. Doré
Peter A. Ragauss
Jesse J. Tyson
*Mr. Ragauss served as the Audit Committee Chair for 2022, and Ms. Robeson, who joined the Audit Committee in March 2022, became the Audit Committee Chair February 1, 2023. Stephen I. Chazen and Charles I. Cogut served on the Audit Committee in 2022 until they retired at the annual meeting of stockholders in April 2022. Mr. Tyson joined the Audit Committee in March 2022.

Williams is committed to continually improving its understanding of the needs and priorities of the people the business touches, including employees, customers, shareholders, and the communities where we operate.
| WILLIAMS COMPANIES | 2023 PROXY STATEMENT | 49 |
Table of Contents
EXECUTIVE COMPENSATION |
MATTERS |
PROPOSAL 3: APPROVE, ON AN ADVISORY BASIS, THE COMPENSATION OF OUR NAMED EXECUTIVE OFFICERS.
We request our stockholders’ non-binding, advisory vote on our NEO compensation as disclosed, in accordance with the SEC’s rules, in this proxy statement. This proposal is commonly known as a “say-on-pay” proposal.
As discussed in the “Compensation Discussion and Analysis” section as well as in the tables in the “Executive Compensation Tables and Other Information” section, our compensation programs are designed to attract and retain the talent needed to drive stockholder value and help each of our businesses meet or exceed financial and performance targets. Our compensation programs are intended to reward our NEOs for successfully implementing our strategy to grow our business and create long-term stockholder value. We believe our programs effectively link executive pay to the financial performance of the Company while also aligning our NEOs with the interests of our stockholders. The following are some key points that demonstrate our commitment to aligning pay to performance:
| • | the significant majority of NEO target compensation is in the form of long-term equity awards, ensuring pay is linked to the performance of our Company’s common stock; |
| • | we measure performance-based RSU awards by Return on Capital Employed (“ROCE”) and Available Funds from Operations (“AFFO”) per share, with relative Total Shareholder Return (“TSR”) as a modifier, which focuses performance on our commitment to improve ROCE performance, cash generation, and strong stock price performance in relation to our comparator group; and |
| • | our Annual Incentive Program aligns payments to actual performance on pre-established targets effectively linking the Company’s financial and ESG performance to NEO pay. |
We are seeking our stockholders’ support for our NEO compensation as detailed in this proxy statement. This proposal conforms to SEC requirements and seeks our stockholders’ views on our NEO compensation. It is not intended to address any specific element of compensation, but rather the overall compensation provided to our NEOs including our pay philosophy, our pay principles, and our pay practices as described in this proxy statement. The Board asks that you vote “FOR” the following resolution:
RESOLVED, that the stockholders of The Williams Companies, Inc. (the “Company”) approve, on an advisory basis, the executive compensation of the Company’s named executive officers as disclosed within this proxy statement pursuant to the compensation disclosure rules of the Securities Exchange Act of 1934, as amended (Item 402 of Regulation S-K), which includes the Compensation Discussion and Analysis, the compensation tables, and any related narrative discussion contained in this proxy statement.
Your vote is advisory and will not be binding on the Board, overrule any Board decision, or require the Board to take any action. However, the Board will consider the outcome of the vote when evaluating future executive compensation decisions for NEOs. We currently conduct annual advisory votes on executive compensation, and we expect to conduct the next advisory vote at our 2023 annual meeting of stockholders.
| The Board unanimously recommends that stockholders vote “FOR” the proposal to approve, on an advisory basis, the compensation of our named executive officers. |
| 50 |
Table of Contents
| Executive Compensation Matters
|
PROPOSAL 4: APPROVE, ON AN ADVISORY BASIS, THE FREQUENCY OF FUTURE ADVISORY VOTES TO APPROVE THE COMPENSATION OF OUR NAMED EXECUTIVE OFFICERS.
The Dodd-Frank Wall Street Reform and Consumer Protection Act of 2010 provides our stockholders with the opportunity to cast a separate non-binding advisory vote indicating how frequently the Company should seek an advisory vote from stockholders to approve the compensation of our named executive officers (“say-on-pay”). Stockholders may vote to hold a say-on-pay advisory vote (i) every year, (ii) every two years, (iii) every three years, or (iv) abstain from voting.
Our Board recommends the say-on-pay vote occur every year (annually). Our Board believes this frequency is appropriate because we value stockholder input on our compensation programs and believe that an annual advisory vote will provide us with regular and timely input on our executive compensation program. We have been holding a say-on-pay vote every year since 2017 when our stockholders last considered how frequently to hold say-on-pay votes and approved an annual say-on-pay vote.
The frequency option (every year, every two years, or every three years) receiving a majority of the votes cast will be the option selected by the stockholders. If none of the alternatives receives a majority of the votes cast, then the alternative receiving a plurality of the votes cast will be deemed the preferred alternative of our stockholders. Unless otherwise instructed on the proxy card, properly executed proxies will be voted in favor of a say-on-pay vote every year. The outcome of the vote on the frequency of say-on-pay votes is advisory and not binding. Our Board will consider the outcome of the vote but may choose to hold say-on-pay votes on a more or less frequent basis than the option recommended by stockholders.
| The Board unanimously recommends that stockholders vote “EVERY YEAR” for the proposal to approve, on an advisory basis, the frequency of future advisory votes on the compensation of our named executive officers. |
| WILLIAMS COMPANIES | 2023 PROXY STATEMENT | 51 |
Table of Contents
| COMPENSATION DISCUSSION |
| AND ANALYSIS |
Table of Contents | 53 | |||||||||||
| 53 | ||||||||||||
| 57 | ||||||||||||
| 57 | ||||||||||||
| 57 | ||||||||||||
| 58 | ||||||||||||
| 58 | ||||||||||||
| 60 | ||||||||||||
| 61 | ||||||||||||
| 74 | ||||||||||||
| 75 | ||||||||||||
The Compensation Discussion and Analysis (“CD&A”) provides a detailed description of the objectives and principles of Williams’ executive compensation programs. It explains how compensation decisions are linked to performance as compared to the Company’s strategic goals and stockholder interests. Generally, Williams’ executive compensation programs apply to all officers; however, this CD&A focuses on the Named Executive Officers (“NEOs”) for the Company for the 2022 fiscal year. The Company’s NEOs for the 2022 fiscal year are Mr. Armstrong, Mr. Dunn, Mr. Zamarin, Mr. Porter, and Mr. Wilson.
Our Named Executive Officers
 |  |  |  |  | ||||||||||||
| Alan S. Armstrong | Micheal G. Dunn | Chad J. Zamarin | John D. Porter | T. Lane Wilson | ||||||||||||
President and Chief Executive Officer | EVP and Chief Operating Officer | EVP, Corporate Strategic Development | SVP and Chief Financial Officer | SVP and General Counsel | ||||||||||||
We seek stockholder support on our executive compensation pay programs annually. In 2022, our stockholders supported our programs with 96.2 percent “for” votes. Our compensation programs continue to evolve, and certain changes were made in 2022 and 2023. In 2022, we engaged with institutional investment firms representing more than 50 percent of our outstanding shares of Williams common stock, providing the opportunity to discuss human capital management and our compensation programs. We address our compensation program design and the strong linkage between pay and performance throughout this document.
| 52 |
Table of Contents
| Compensation Discussion and Analysis
|
OUR COMMITMENT TO PAY FOR PERFORMANCE
Pay for Performance
We design our compensation programs to support our commitment to performance. In 2022, at target, 79 percent or more of a NEO’s annual target compensation is variable based on our company performance.
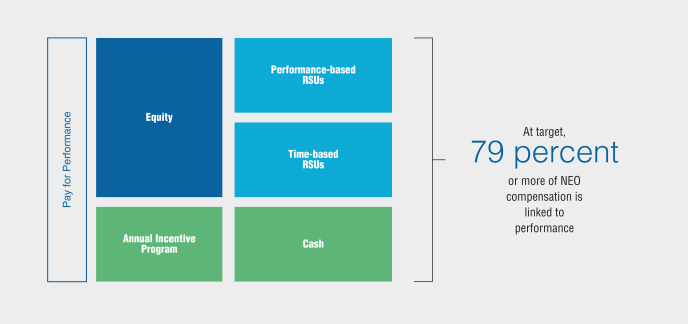
2022 BUSINESS OVERVIEW
Our reliable earnings, healthy balance sheet and strong operational performance produced outstanding results in 2022 as demonstrated in the following table and narrative. This also produced strong results in our Annual Incentive Program and performance-based RSUs demonstrating our alignment between pay and performance. The table details our 2022 performance and compounded annual growth rates (“CAGR”) for Adjusted EBITDA, Adjusted Earnings Per Share, Available Funds from Operations (“AFFO”), Return on Capital Employed (“ROCE”), and Net Debt/Adjusted EBITDA. We also provide information highlighting our leading ESG-related progress. Additionally, the Company has exceeded the midpoint of our guidance to the market for Adjusted EBITDA in each of the five most recently completed calendar years.
| WILLIAMS COMPANIES | 2023 PROXY STATEMENT | 53 |
Table of Contents
| Compensation Discussion and Analysis
|
Growing Our Key Financial and Operational Metrics While Also Reducing Leverage

Note: This table contains non-GAAP measures. A reconciliation of these non-GAAP financial measures to their nearest GAAP comparable financial measure is included in the appendix.
(1) Return on Capital Employed (ROCE) is Adjusted EBITDA, less included depreciation and amortization, divided by the sum of the average balances of Investments, Property, plant, and equipment – net, and Intangible assets – net.
(2) CAGR is compound annual growth rate.
ESG Recognition:
Williams was the first North American midstream company to announce a climate commitment, setting a near-term goal of 56% absolute reduction in company-wide greenhouse gas emissions from 2005 to 2030, which will place the company on a positive trajectory to be net zero carbon emissions by 2050. In 2021, Williams achieved a 47% reduction in company-wide greenhouse gas emissions from the baseline. 2022 produced more ESG-related recognition including:
| • | Ranked #1 in the industry peer group in S&P Global’s 2022 Corporate Sustainability Assessment (CSA) and was awarded ‘Top 1% S&P Global ESG Score’ in The Sustainability Yearbook 2023. |
| • | S&P Global selected Williams as the only North American oil and gas storage and transportation company in the Dow Jones Sustainability Index (DJSI) World while also being retained in the North American index. |
| 54 |
Table of Contents
| Compensation Discussion and Analysis
|
| • | CDP maintained a ‘B’ rating for Williams in the Climate Change Questionnaire, for our commitment to transparency and governance around climate change, ranking above the oil and gas storage and transportation sector (‘C’) and North America regional (‘C’) averages. |
| • | MSCI maintained our ESG Rating at a BBB, illustrating our ongoing emphasis on ESG developments and disclosures. |
| • | Williams received scores from additional ESG Raters & Rankers that reflect strong management of material Environmental, Social, and Governance issues. |
Additional Meaningful 2022 Business Updates Include:
MountainWest Acquisition
| • | On February 14, 2023, we closed on the acquisition of 100 percent of MountainWest Pipelines Holding Company (”MountainWest”) which includes FERC-regulated interstate natural gas pipeline systems and natural gas storage capacity, for $1.08 billion of cash and assumption of $430 million outstanding principal amount of long-term debt, subject to working capital and post-closing adjustments. The MountainWest Acquisition expands our existing transmission and storage infrastructure footprint into major markets in Utah, Wyoming, and Colorado. |
Trace Acquisition
| • | On April 29, 2022, we closed on the acquisition of 100 percent of Gemini Arklatex, LLC through which we acquired the Haynesville Shale region gas gathering and related assets of Trace Midstream for $972 million. The purpose of the Trace Acquisition was to expand our footprint into the east Texas area of the Haynesville Shale region, increasing in-basin scale in one of the largest growth basins in the country. |
Purchase of North Texas Assets
| • | On August 31, 2022, we purchased a group of assets in north Texas, primarily natural gas storage facilities and pipelines, from NorTex Midstream Holdings, LLC for $424 million. |
Northwest Pipeline FERC Rate Case Settlement
| • | On November 15, 2022, Northwest Pipeline received approval from the FERC for a stipulation and settlement agreement which generally reduces rates effective January 1, 2023, resolves other rate issues, establishes a Modernization and Emission Reduction Program, and satisfies its rate case filing obligation. Provisions were included in the settlement that establishes a moratorium on any proceedings that would seek to place new rates in effect any earlier than January 1, 2026, and that a general rate case filing will be made for rates to become effective no later than April 1, 2028, unless we have entered into a pre-filing settlement prior to that date. |
| WILLIAMS COMPANIES | 2023 PROXY STATEMENT | 55 |
Table of Contents
| Compensation Discussion and Analysis
|
The accompanying chart compares Williams’ cumulative TSR on our common stock (assuming reinvestment of dividends) to the cumulative total return of the S&P 500 Stock Index, the Arca Natural Gas Index, and the Bloomberg Americas Pipeline Index assuming the investment of $100 at the end of 2019.
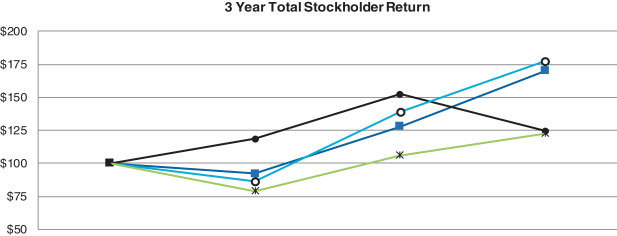
| 2019 | 2020 | 2021 | 2022 | |||||||||||||||
| The Williams Companies, Inc. | $ | 100.00 |
| $ | 92.40 |
| $ | 127.92 |
| $ | 170.05 |
| |||||
| S&P 500 Index | $ | 100.00 |
| $ | 118.39 |
| $ | 152.34 |
| $ | 124.72 |
| |||||
| Arca Natural Gas Index | $ | 100.00 |
| $ | 86.54 |
| $ | 138.82 |
| $ | 177.73 |
| |||||
| Bloomberg Americas Pipeline Index | $ | 100.00 |
| $ | 79.13 |
| $ | 106.10 |
| $ | 122.58 |
| |||||


Long-term Incentives
Annual equity awards provide the most significant differentiation in pay and performance in our executive compensation program. We use equity awards to align compensation with the long-term interests of our stockholders. Equity awards in 2022 consist of performance-based RSUs and time-based RSUs. The largest component of our CEO’s long-term incentive award is performance-based RSUs. The 2019 performance-based RSU awards utilized both relative total shareholder return (“TSR”) and return on capital employed (“ROCE”) as equally weighted metrics to determine performance and the actual number of units that vest. The 2020 performance-based RSU awards utilize ROCE and Debt to EBITDA Ratio as equally weighted metrics measured against preestablished targets. The 2021 and 2022 performance-based RSU awards utilize ROCE and available funds from operations (“AFFO”) per share as equally weighted metrics against preestablished targets. For the 2020, 2021, and 2022 performance-based awards, relative TSR is used as a modifier rather than a core metric and the initial performance result may be increased or decreased by 25 percent.
Annual Incentive Program
Our performance-based cash compensation is paid under our Annual Incentive Program (“AIP”) which is based on the Company’s financial, environmental, and safety performance and the NEO’s individual performance. Under this program, cash compensation reflects annual business performance in 2022 and is based on weighted measures of adjusted EBITDA, controllable costs, environmental and safety performance. Williams produced strong operational and financial results in 2022 which produced an AIP award payout at 171 percent of target.
| 56 |
Table of Contents
| Compensation Discussion and Analysis
|
COMPENSATION SUMMARY
Objective of Our Compensation Programs
The role of compensation is to attract and retain the talent needed to increase stockholder value and to help our businesses meet or exceed financial and operational performance goals. Our compensation programs’ objectives are to reward our NEOs and employees for successfully implementing our strategy to grow our business and create long-term stockholder value. To that end, in 2022 we used ROCE and AFFO per share, with relative TSR as a modifier, to measure long-term performance and we used adjusted EBITDA, controllable costs, safety, and environmental metrics to measure annual performance. We believe using separate annual and long-term metrics to incent and pay NEOs helps ensure that we make business decisions aligned with the long-term interests of our stockholders.
Our Pay Philosophy
Our pay philosophy throughout the entire organization is to pay for performance, be competitive in the marketplace, and consider the value a job provides to the Company. Our compensation programs reward NEOs not just for accomplishing goals, but also for how those goals are pursued. The principles of our pay philosophy influence the design and administration of our pay programs. Decisions about how we pay NEOs are based on these principles. The Committee uses several types of pay that are linked to both our long-term and short-term performance in the executive compensation programs. Included are long-term incentives, annual cash incentives, base pay, and benefits. The following details the linkage between the types of pay we use and our pay principles.
Pay Principles | ||
• Pay should reinforce business objectives and values. | • Pay should foster a culture of collaboration with shared focus and commitment to our Company. | |
• A significant portion of a NEO’s total pay should be variable based on performance. | • Incentives should enforce the importance of ESG within our Company. | |
• Incentive pay should balance long-term, intermediate, and short-term performance. | • Pay opportunities should be competitive. | |
• Incentives should align interest of NEOs with stockholders. | • A portion of pay should be provided to compensate for the core activities required for performing in the role. | |
| WILLIAMS COMPANIES | 2023 PROXY STATEMENT | 57 |
Table of Contents
| Compensation Discussion and Analysis
|
Our Commitment To Pay For Performance
Roles in the Compensation Recommendation and Decision Process
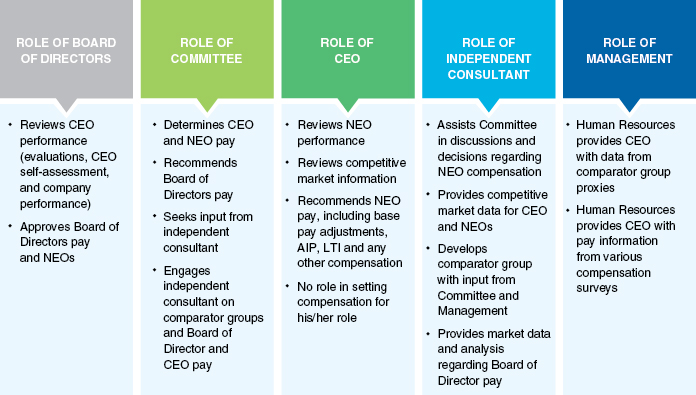
2022 Comparator Group
Determining Our Comparator Group
Companies in our executive compensation benchmarking comparator group have a range of assets, market capitalization, and enterprise value. Business consolidation and unique operating models in our industry create some challenges in identifying comparator companies. Accordingly, we take a broad view of comparability to include organizations that are similar to Williams. This results in compensation that is appropriately scaled and reflects comparable complexities in business operations. We typically aim for a comparator group of 15 to 20 companies so our comparisons will be valid. The 2022 comparator group includes 16 companies which comprise a mix of both direct business competitors and companies with whom we compete for talent. Since 2017, the Committee utilizes a smaller targeted comparator company group for the purposes of measuring relative TSR related to our performance-based RSU awards. While not perfectly aligned to our natural gas strategy, these selected companies are more similar to our specific segment of the energy industry.
How We Use Our Comparator Group
We refer to publicly available information to analyze our comparator companies’ practices including how pay is divided among long-term incentives, annual incentives, base pay, and other forms of compensation. This allows the Committee to ensure competitiveness and appropriateness of proposed compensation packages. When setting pay, the Committee uses market median information of our comparator group, as opposed to market averages, to ensure that the impact of any unusual events that may occur at one or two companies during any particular year is diminished from the analysis. If an event is particularly unusual and surrounded by unique circumstances, the data is completely removed from the assessment. The smaller targeted comparator company group is used solely for the purposes of measuring relative TSR related to our performance-based RSU awards.
| 58 |
Table of Contents
| Compensation Discussion and Analysis
|
The following table shows the range of our 2022 executive compensation benchmarking comparator companies’ assets, market capitalization, and enterprise value as originally reported for 2021 (dollars in millions):
Comparator Company | Ticker | Total Assets | Market Capitalization | Enterprise Value | ||||||||||
CenterPoint Energy Inc. | CNP | $ | 37,679 |
| $ | 17,553 |
| $ | 33,703 |
| ||||
Cheniere Energy Inc. | LNG | $ | 39,258 |
| $ | 25,720 |
| $ | 58,804 |
| ||||
Devon Energy Corp. | DVN | $ | 21,025 |
| $ | 29,205 |
| $ | 33,831 |
| ||||
Dominion Energy, Inc. | D | $ | 99,590 |
| $ | 63,634 |
| $ | 107,833 |
| ||||
Enbridge Inc. (in U.S. dollars) | ENB | $ | 133,500 |
| $ | 79,140 |
| $ | 147,404 |
| ||||
Enterprise Products Partners L.P. | EPD | $ | 67,526 |
| $ | 47,793 |
| $ | 76,213 |
| ||||
EOG Resources, Inc. | EOG | $ | 38,236 |
| $ | 51,989 |
| $ | 52,687 |
| ||||
Magellan Midstream Partners, L.P. | MMP | $ | 8,030 |
| $ | 10,361 |
| $ | 15,621 |
| ||||
Marathon Petroleum Corp. | MPC | $ | 85,373 |
| $ | 37,050 |
| $ | 60,490 |
| ||||
ONEOK Inc. | OKE | $ | 23,622 |
| $ | 26,215 |
| $ | 39,825 |
| ||||
Phillips 66 | PSX | $ | 55,594 |
| $ | 31,756 |
| $ | 46,596 |
| ||||
Pioneer Natural Resources Company | PXD | $ | 36,811 |
| $ | 44,157 |
| $ | 48,087 |
| ||||
Sempra | SRE | $ | 72,045 |
| $ | 41,933 |
| $ | 68,843 |
| ||||
The Southern Company | SO | $ | 127,534 |
| $ | 75,369 |
| $ | 133,734 |
| ||||
Targa Resources Corp. | TRGP | $ | 15,208 |
| $ | 11,922 |
| $ | 22,493 |
| ||||
TC Energy Corp. (in U.S. dollars) | TRP | $ | 82,392 |
| $ | 45,626 |
| $ | 90,004 |
| ||||
| 75th percentile | $ | 83,137 |
| $ | 48,842 |
| $ | 79,661 |
| ||||
| 50th percentile | $ | 47,426 |
| $ | 39,492 |
| $ | 55,746 |
| ||||
|
| 25th percentile | $ | 33,514 |
| $ | 26,091 |
| $ | 38,327 |
| ||||
Williams | WMB | $ | 47,612 |
| $ | 31,639 |
| $ | 56,511 |
| ||||
|
| Percent rank |
| 50% |
|
| 40% |
|
| 51% |
| ||||
The Committee determined that Kinder Morgan, Inc. (KMI) will be an addition to the 16 companies listed in the table above, used to benchmark compensation practices and pay decisions in 2023.
A separate comparator company group is used to specifically measure relative TSR as it pertains to performance-based RSU awards since 2017:
• Enbridge Inc. | • Kinder Morgan, Inc. | • Targa Resources Corp. | ||
• Energy Transfer | • ONEOK, Inc. | • TC Energy Corp. | ||
• Enterprise Products Partners L.P. | • Plains All American Pipeline, L.P. | • Western Midstream Partners, L.P. | ||
| WILLIAMS COMPANIES | 2023 PROXY STATEMENT | 59 |
Table of Contents
| Compensation Discussion and Analysis
|
Our Pay Setting Process
During the first quarter of the year, the Committee completes a review to ensure we are paying competitively, equitably, and in a way that encourages and rewards performance.
The compensation data of our comparator group, disclosed primarily in proxy statements, is the primary market data we use when benchmarking the competitive pay of our NEOs. Aggregate market data obtained from recognized third-party executive compensation survey companies is used to supplement and validate comparator group market data.
| Although the Committee reviews relevant data as it determines compensation packages, other considerations are taken into account. Because market data alone does not reflect the strategic competitive value of various roles within our Company, internal pay equity is also considered when making pay decisions. Other considerations when making pay decisions for the NEOs include individual experience, sustained individual performance, historical pay, and the total aggregate value of the NEOs’ equity awards and holdings. | Multiple internal and external factors are considered when determining NEO compensation packages. |
When setting pay, we determine an annual target pay mix (distribution of pay among base pay, short-term incentives, annual long-term incentives, and other forms of compensation) for the NEOs. Consistent with our pay-for-performance philosophy, the actual amounts paid, excluding benefits, are determined based on Company and individual performance. Because performance is a factor, the target versus actual pay mix will vary, specifically as it relates to the annual cash incentives and long-term incentives.

Safety is the highest priority at Williams where a strong safety culture delivers top-tier safety performance through individual ownership, operational discipline, shared learning, and prompt action.
| 60 |
Table of Contents
| Compensation Discussion and Analysis
|
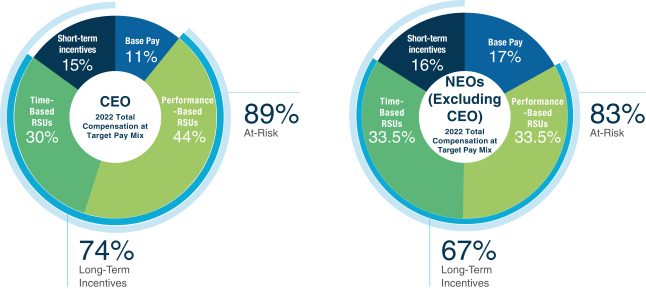
How We Determine Each Type of Pay
Base pay, annual cash incentives, and long-term incentives accomplish different objectives. The table below illustrates a summary of the primary objectives associated with each component of pay listed in the order of most significant to the NEO’s total compensation. The table is followed by specific details regarding each pay component.
Type of Pay & Form | Performance (years) | Objectives | ||||
Fixed | Base pay (cash) | 1 | • Compensates for carrying out the duties of the job
• Recognizes individual experiences, skills, and sustained performance
• Provides attraction and retention | |||
At Risk | Short-term incentive: Annual cash incentive | 1 | • Incents the accomplishment of annual business goals
• Aligns interests of executives to our stockholders
• Provides attraction and retention | |||
Long-term incentive: Performance-based RSUs | 3 | • Incents the accomplishment of long-term sustainable business goals
• Aligns interests of executives to our stockholders
• Promotes ownership in the Company
• Provides attraction and retention | ||||
Long-term incentive: Time-based RSUs | 3 | |||||
| WILLIAMS COMPANIES | 2023 PROXY STATEMENT | 61 |
Table of Contents
| Compensation Discussion and Analysis
|
Base Pay
Base pay compensates the NEOs for carrying out the duties of their jobs and serves as the foundation of our pay program. Most other major components of pay are set based on a relationship to base pay, including annual and long-term annual incentives, as well as retirement benefits.
Base pay for the NEOs is set considering the market median, or 50th percentile, with potential individual variation from the median due to experience, skills, and sustained performance of the individual as part of our pay-for-performance philosophy. Performance is measured in two ways. First, through the achieved results associated with attaining their annual goals, operational and/or functional area strategies, and personal development plans. Second, we also evaluate the NEOs’ observable skills and behaviors related to how they achieved their goals based on our defined competencies that contribute to workplace effectiveness and career success.
Annual Cash Incentives
As previously mentioned in the “Our Commitment to Pay for Performance” section, we pay annual cash incentives to encourage and reward our NEOs for making decisions that improve our annual operating performance through our Annual Incentive Program (“AIP”). The objectives of our AIP are to:
| • | offer sufficient incentive compensation to motivate management to put forth extra effort, take prudent risks, and make effective decisions to maximize stockholder value; |
| • | motivate and incent management to choose strategies and investments that maximize long-term stockholder value; |
| • | provide sufficient total compensation to retain management; and |
| • | limit the cost of compensation to levels that will maximize the return of current stockholders without compromising the other objectives. |
NEOs’ AIP business performance is based on enterprise results of these business metrics in relation to established targets. We only use enterprise-level performance metrics for our NEOs in order to promote teamwork and collaboration by creating a shared goal for the overall Company performance. Our business performance targets are established utilizing the annual financial plan. Goals related to ROCE growth and operating margin improvement are considered when establishing the financial plan. Our incentive program allows the Committee to make adjustments to these business performance metrics to reflect certain business events. When determining which adjustments are appropriate, we are guided by the principle that incentive payments should not result in unearned windfalls or impose undue penalties. In other words, we make adjustments to ensure NEOs are not rewarded for positive results they did not facilitate nor are they penalized for certain unusual circumstances outside their control. Adjustments applied in 2022 to Adjusted EBITDA, which included the collar on E&P and marketing profits, served to reduce the weighted payout result while the adjustments to Controllable Costs, such as removing certain costs associated with assets acquired in 2022 that were not part of the original plan, served to increase the weighted payout result. Despite this adjustment, the Controllable Costs weighted payout result was still below target.
The Committee’s independent compensation consultant, Frederick W. Cook & Co., annually compares our relative performance on various measures, including TSR and earnings per share, with our comparator group of companies. The Committee also uses this analysis to validate the reasonableness of our AIP results. Additionally, the Committee also reviews the annual incentive payout levels for our comparator group of companies over each of the last three completed calendar years.
| 62 |
Table of Contents
| Compensation Discussion and Analysis
|
How We Set the 2022 AIP Goals
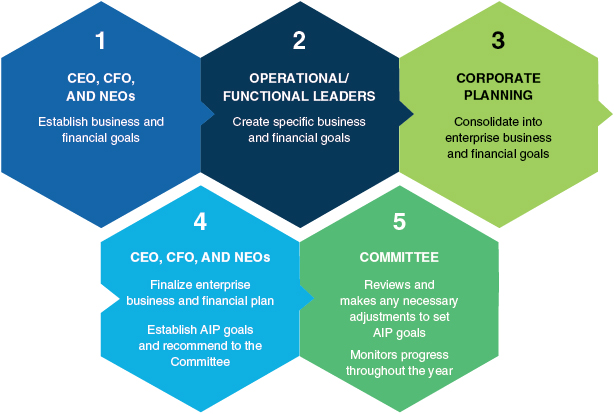
2022 AIP
The AIP Calculation. The 2022 AIP is based on the weighted measures of Adjusted EBITDA, controllable costs, and ESG metrics. Each metric is directly aligned with our business strategy to operationally grow the business, operate safely in everything we do, and continue to align with our dividend growth strategy.
Business Performance Metric & Weighting | Measuring | Importance | ||||
| 50% | Adjusted EBITDA | • Profit Metric | • Maintains a focus on generating expected levels of annual profit | |||
| 35% | Controllable Costs | • Operating & Maintenance (“O&M”) and | • Encourages cost management discipline with achieving our business strategy | |||
| 15% | ESG | • Environmental: Loss of Primary Containment Events
• Environmental: Methane Emissions Reduction
• Safety: Behavioral Near Miss to Incident Ratio | • Drives frontline employee action to address environmental and safety opportunities
• Emphasizes importance of environmental and safety leadership and improvement | |||
The attainment percentage of AIP goals results in a payment of an annual cash incentive along a continuum between threshold and stretch levels, which in total corresponds to 0 percent through 200 percent of the NEO’s annual cash incentive target. The Adjusted EBITDA metric threshold is established at 50 percent of target while the controllable costs threshold is set at 0 percent of target. While the established stretch target is set at 200 percent, these two financial metrics can be extended to 300 percent of target by adding the interval between target and stretch targets to the 200 percent stretch target amount. However, under no circumstance can the total calculated AIP award exceed 200 percent of target.
| WILLIAMS COMPANIES | 2023 PROXY STATEMENT | 63 |
Table of Contents
| Compensation Discussion and Analysis
|
2022 NEO AIP Targets. The starting point to determine annual cash incentive targets (expressed as a percentage of base pay earned during 2022) is competitive market information referencing the market median, or 50th percentile, which provides an idea of what other companies target to pay in annual cash incentives for similar jobs. We also consider the internal value of each job (i.e., how important the job is to execute our strategy compared to other jobs in the Company) before the target is set for the year. The annual cash incentive targets as a percentage of base pay for the NEOs in 2022 were as follows:
Position | 2022 Target | |||||||||
President and Chief Executive Officer | 140 | % | ||||||||
EVP and Chief Operating Officer | 110 | % | ||||||||
EVP, Corporate Strategic Development | 85 | % | ||||||||
SVP and Chief Financial Officer | 90 | % | ||||||||
SVP and General Counsel | 80 | % | ||||||||
Determining 2022 AIP Awards. To determine the funding of the annual cash incentive, we use the following calculation for each NEO:
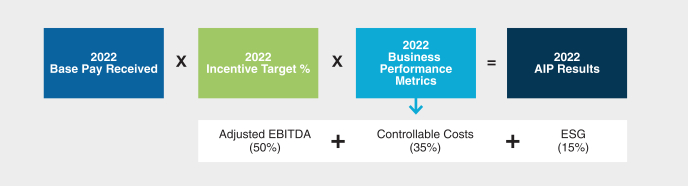
| 64 |
Table of Contents
| Compensation Discussion and Analysis
|
Based on business performance relative to the established goals, the Committee certified business performance results as 171 percent of target as follows.
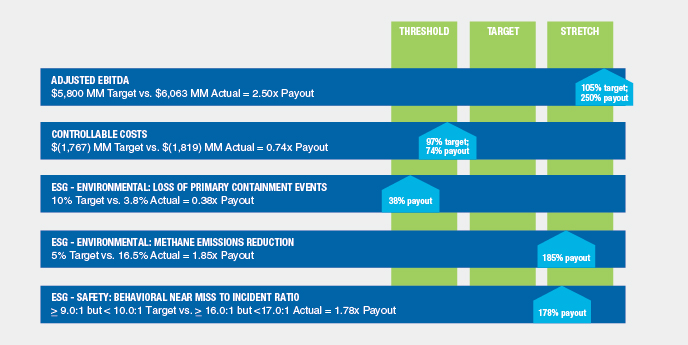
Metrics | Weighting | Threshold | Target | Stretch @ 200% | Actual | Result | Payout % | ||||||||||||||||||||||||||||
Adjusted EBITDA (as adjusted for AIP purposes) |
| 50% |
| $ | 5,550 | $ | 5,800 | $ | 5,975 | $ | 6,063 |
| 250% |
|
| 125% |
| ||||||||||||||||||
Controllable Costs |
| 35% |
| $ | (1,967 | ) | $ | (1,767 | ) | $ | (1,567 | ) | $ | (1,819 | ) |
| 74% |
|
| 26% |
| ||||||||||||||
ESG – Environmental: Loss of Primary Containment Events |
| 5% |
|
| ≤ 0.0% |
|
| 10.0% |
|
| ≥ 30.0% |
|
| 3.8% |
|
| 38% |
|
| 2% |
| ||||||||||||||
ESG – Environmental: Methane Emissions Reduction |
| 5% |
|
| ≤ 0.0% |
|
| 5.0% |
|
| ≥ 20.0% |
|
| 16.5% |
|
| 185% |
|
| 9% |
| ||||||||||||||
ESG – Safety: Behavioral Near Miss to Incident Ratio |
| 5% |
|
| < 4.0:1 |
| | ≥ 9.0:1 but | |
| ≥ 18.0:1 |
| | ≥ 16.0:1 but | |
| 178% |
|
| 9% |
| ||||||||||||||
2022 AIP Business Performance % |
|
|
|
|
|
|
|
|
|
|
|
|
|
|
|
|
|
|
| 171% |
| ||||||||||||||
This award was paid in March 2023. It’s important to note that our metrics and associated targets were approved as part of our normal annual process and the targets were not adjusted due to other 2022 circumstances.
We calculate (a) Adjusted EBITDA as: Gross margin less operating and maintenance expenses, less selling, general and administrative expenses, less other (income) and expense, plus proportionate EBITDA of joint venture partnerships; and (b) Controllable Costs as: operating and maintenance costs and selling, general and administrative costs that are under the responsibility of a cost center manager, less certain expenses that are considered less controllable (such as pension and postretirement benefit costs) or have no net impact on financial performance (such as costs that are passed directly to customers). Operating and maintenance costs, selling, general and administrative costs, and total service revenues include our proportional ownership share of such items recognized by certain equity method investees. The Adjusted EBITDA metric includes a commodity collar mechanism of plus or minus $50 million for the combined commodity margin impact above or below Plan for Commodity Marketing and E&P businesses. This collar was triggered in 2022 and served to reduce the award under this metric.
| WILLIAMS COMPANIES | 2023 PROXY STATEMENT | 65 |
Table of Contents
| Compensation Discussion and Analysis
|
For 2022, we utilized three ESG metrics including the environment metrics Loss of Primary Containment Events (“LOPC”) and Methane Emissions Reduction, and a safety metric Behavioral Near Miss to Incident Ratio (“BNMIR”). The LOPC metric focuses on environmental performance, the reduction of greenhouse gas emissions, and is aligned to our core value of being responsible stewards around the environment and the products we transport. The metric is considered a leading indicator to more significant process safety incidents and is directly related to reducing greenhouse gas emissions. The Methane Emissions Reductions metric focuses on the Company’s commitment to reducing our methane emissions expeditiously. The Behavioral Near Miss to Incident Ratio metric places an emphasis on the identification and mitigation of at-risk behaviors. The environmental metrics are on a payout curve while the safety metric utilizes established incremental tiers from the threshold to stretch payout opportunity.
Individual performance, such as success toward our strategic objectives and individual goals, and successful demonstration of the Company’s leadership competencies which exceeded expectations may be recognized through adjustments. Payments may also be adjusted downward if performance warrants. The Committee chose to apply an adjustment to certain NEOs. In total, the adjustments applied to the calculated NEO awards were approximately two percent of the original calculated awards.
2022 Individual Bonus Award. The Committee provided a $300,000 special bonus award to Mr. Zamarin in recognition of his role in the very successful integration of the 2021 acquisitions of Sequent and the Wamsutter and Haynesville upstream assets. Mr. Zamarin is also recognized for his key role in executing the 2022 acquisitions of NorTex, Trace Midstream, and MountainWest Pipeline, which closed in early 2023.
2023 AIP Design. The 2023 AIP design is unchanged from 2022. Adjusted EBITDA and Controllable Costs will continue to be weighted at 50 percent and 35 percent, respectively. The weighting for ESG metrics will remain at 15 percent after being increased from 10% to 15% for the 2022 AIP. The Environmental Performance Metrics, LOPC and Methane Emissions Reduction, and the Safety Performance Metric, BNMIR, will be weighted at 5 percent each. The Environmental Performance Metrics continue our focus on environmental performance, the reduction of greenhouse gasses, and is aligned with our core value of being responsible stewards around the environment and the products we transport. The LOPC metric is considered a leading indicator to more significant process safety incidents and is directly related to reducing greenhouse gas emissions.
2023 AIP Metrics | Weight | |||||||||
Adjusted EBITDA | 50 | % | ||||||||
Controllable Costs | 35 | % | ||||||||
ESG (15%) | ||||||||||
– Environmental Performance Metrics | 10 | % | ||||||||
– Safety Performance Metric | 5 | % | ||||||||
Long-Term Incentives
To determine the value for long-term incentives granted to a NEO each year, we consider the following factors:
| • | the market median and specific awards made to executives in similar positions within our comparator group of companies; |
| • | the proportion of long-term incentives relative to base pay; |
| • | the NEO’s impact on Company performance and ability to create value; |
| • | long-term business objectives; |
| • | the market demand for the NEO’s particular skills and experience; |
| • | the amount granted to other NEOs in comparable positions at the Company; |
| • | the NEO’s demonstrated historical performance; and |
| • | the NEO’s leadership performance. |
| 66 |
Table of Contents
| Compensation Discussion and Analysis
|
A summary of the long-term incentive program details for 2022 are shown in the following table. The long-term incentive mix for the CEO differs from the mix for the other NEOs. Since the CEO has more opportunity to influence our financial results, the Committee considers it appropriate that a greater percentage of his long-term incentives are directly tied to performance and the Company stock price.
| Performance-based RSUs | Time-based RSUs | |||
CEO Equity Mix | 60% | 40% | ||
NEO Equity Mix | 50% | 50% | ||
Term | Three years | Three years | ||
Frequency | Granted annually | Granted annually | ||
2022 Performance Criteria | ROCE and AFFO per share with |
Retention | ||
Vesting | Cliff vesting after three years | Cliff vesting after three years | ||
Payout | Upon vesting, shares are distributed based on performance certification (0% – 200%) | Upon vesting, shares are | ||
Dividends | Dividend equivalents accrued and paid in cash upon vesting but only on earned shares | Dividend equivalents accrued | ||
The long-term incentive annual equity award mix has remained unchanged since the 2019 annual grant. Dividend equivalents were added to earned performance-based RSUs beginning with the 2022 grant which will vest and pay on any earned units in 2025.
The Summary Compensation Table provides SEC required disclosures for the 2020, 2021, and 2022 calendar years. These disclosures require the reporting of accounting-based grant date fair values for all stock-based compensation. These values remain fixed in Summary Compensation Table disclosures and are not adjusted to reflect how the Company’s business and/or stock price performance actually impact the value of stock awards earned by our NEOs. To supplement the SEC required disclosure, the following chart compares the accounting grant date fair value of stock-based awards for Mr. Armstrong in 2018, 2019, and 2020 which vested in 2021, 2022, and 2023, respectively. The table shows the grant values which were included in the Summary Compensation Table in relation to the realizable value as of the vesting and distribution date of the RSU awards. The realizable value shown for time-based restricted stock unit (“RSU”) awards includes accrued cash dividend equivalents which were paid upon the distribution of the award. The 2018 performance-based awards, which vested in 2021, and the 2019 performance-based award, which vested in 2022, distributed 134.4 percent and 168.8 percent of the targeted number of RSUs, respectively. The 2020 performance-based award, which vested in February 2023, distributed 200.0 percent of the targeted number of RSUs awarded. The 2018 award distributed in 2021 was the first above target award distribution since the 2012 performance-based award vested in early 2015. The 2019 awards included an additional performance-based RSU award granted to executive officers. The performance result for this award, which measured Adjusted EPS results against established targets, was 200 percent of target. It’s important to note 50 percent of the earned units were distributed in February 2022 while the remaining 50 percent was distributed in February 2023. The realizable value for this award reflects the 200 percent performance result and includes the distribution date values of the portions of the award at distribution in February 2022 and 2023 respectively.
| WILLIAMS COMPANIES | 2023 PROXY STATEMENT | 67 |
Table of Contents
| Compensation Discussion and Analysis
|
The following chart details Mr. Armstrong’s realizable equity pay for the equity awards granted in 2018, 2019, and 2020 that vested during 2021, 2022, and 2023. In aggregate, Mr. Armstrong’s realizable equity compensation from annual equity awards during this period is 192.8 percent of what was targeted for his long-term incentive pay. The Compensation and Management Development Committee (“Committee”) believes it is important to demonstrate this correlation between executive pay, business performance, and stock price performance.
CEO’s Equity Award Target Pay Compared to Realizable Equity Pay
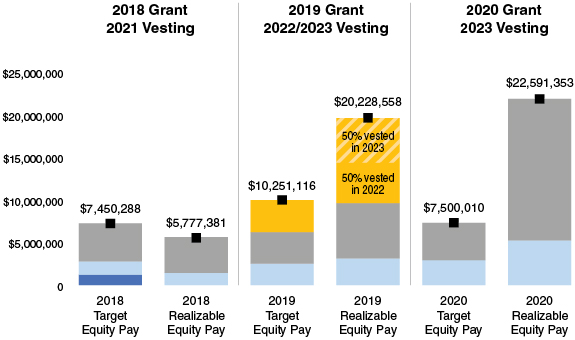
Year of Grant | 2018 | 2019 | 2020 | |||||||||||||||||||||||||||||||||
Year of Vesting | 2021 | 2022/2023 | 2023 | |||||||||||||||||||||||||||||||||
⬛ 2019 Special Performance-Based Award | $ | 0 |
|
|
|
| $ | 0 |
| $ | 3,865,463 |
|
|
|
| $ | 10,263,422 |
| $ | 0 |
|
|
|
| $ | 0 |
| |||||||||
⬛ Performance- Based Awards | $ | 4,590,143 |
|
|
|
| $ | 4,280,298 |
| $ | 3,785,661 |
|
|
|
| $ | 6,715,620 |
| $ | 4,500,007 |
|
|
|
| $ | 17,279,582 |
| |||||||||
��� Time-Based Awards | $ | 1,590,001 |
|
|
|
| $ | 1,497,083 |
| $ | 2,599,992 |
|
|
|
| $ | 3,249,516 |
| $ | 3,000,004 |
|
|
|
| $ | 5,311,771 |
| |||||||||
⬛ Stock Option Awards | $ | 1,270,144 |
|
|
|
| $ | 0 |
| $ | 0 |
|
|
|
| $ | 0 |
| $ | 0 |
|
|
|
| $ | 0 |
| |||||||||
⬛ Total Equity Pay | $ | 7,450,288 |
|
|
|
| $ | 5,777,381 |
| $ | 10,251,116 |
|
|
|
| $ | 20,228,558 |
| $ | 7,500,010 |
|
|
|
| $ | 22,591,353 |
| |||||||||
Percent Difference Between Realizable Equity Pay and Target Equity Pay |
|
|
|
| (22.5%) |
|
|
|
|
|
|
|
| 97.3% |
|
|
|
|
|
|
|
| 201.2% |
|
|
|
| |||||||||
The 2019 equity awards, in total, were the first to payout at above the grant date value of the awards since the 2012 awards vested in 2015.
| 68 |
Table of Contents
| Compensation Discussion and Analysis
|
Performance-based RSUs. Performance-based RSU awards are only earned if we attain specific pre-determined performance results. The 2019 performance-based RSU award utilized relative TSR and ROCE to determine performance and the actual number of units that will vest. The 2020 performance-based RSU award utilizes ROCE and Debt to EBITDA Ratio and the 2021 and 2022 performance-based RSU awards utilizes ROCE and AFFO per share to determine performance. Each award beginning in 2020 applies relative TSR as a performance modifier. The 2019 through 2021 performance-based RSUs did not accrue cash dividend equivalents. Beginning with the 2022 awards, performance-based RSUs accrue cash dividend equivalents on any earned units upon vesting and distribution of the award.
2019 Performance-based RSUs. The 2019 performance-based RSUs utilize two equally weighted metrics to measure performance and can result in a payout range from 0 percent to 200 percent of target. Relative TSR is weighted at 50 percent and ROCE is weighted at 50 percent. Relative TSR provides for up to a 200 percent payout if our relative TSR performance is at the top of our peer group and no payout if our relative TSR performance is at the bottom of the peer group. The payout curve is linear between 0 percent and 200 percent based on our placement within the peer group of companies, unless the TSR result is negative and the metric would be limited to a 100 percent result. Williams TSR during this period placed third among our peer companies resulting in an earned payout, subject to weighting, of 155.6 percent of target.
The 2019 performance-based award, which vested in February 2022, distributed 168.8 percent of the targeted number of RSUs awarded.
| Performance-based RSU Metrics | Weighting (%) | Threshold | Target | Stretch | Metric Result | Weighted Result | ||||||||||||||||||||
| 2021 ROCE | 50% | 7.30% | 8.20% | 8.70% | 182.0% | 91.0% | |||||||||||||||||||
| Actual: 8.61% | ||||||||||||||||||||||||||
Relative TSR | 50% | 10th | Median | 1st | 155.6% | 77.8% | ||||||||||||||||||||
| Actual: 3rd of 10 | ||||||||||||||||||||||||||
Final Result | 168.8% | |||||||||||||||||||||||||

This ROCE target for the 2019 award represented approximately an eight percent compounded annual growth rate from 2018 results and was aligned with the financial plan approved by the Board.
2019 Special Performance-based RSU Award. At the time of the 2019 annual equity award, four of the five current NEOs received an incremental performance-based equity award. This award measures 2021 Adjusted Earnings Per Share (“EPS”) against preestablished targets. While the performance period ended on December 31, 2021, any earned award would vest in 50 percent increments three and four years from the date of the award, in February 2022 and February 2023, respectively. While the award is performance-based, the extended vesting period was added for retentive purposes. Prior to the 2019 award, six of the nine original recipients of this award had been an executive officer with the Company for less than two years. Considering the progress associated with the reconstituted leadership group, the Committee sought to provide a common retentive award across the group while building in more significant retention.
| Performance-based RSU Metrics | Weighting (%) | Threshold | Target | Stretch | Result | |||||||||||||||
| 2021 Adjusted EPS | 100% | $0.99 | $1.07 | $1.23 | 200.0% | ||||||||||||||
| Actual: $1.36 | ||||||||||||||||||||
Final Result | 200.0% | |||||||||||||||||||

This Adjusted EPS target represented approximately a 35 percent total growth rate from 2018 Adjusted EPS results. The actual 2021 Adjusted EPS result is 72 percent above the 2018 Adjusted EPS result.
| WILLIAMS COMPANIES | 2023 PROXY STATEMENT | 69 |
Table of Contents
| Compensation Discussion and Analysis
|
Outstanding Performance-based RSUs
2020 Performance-based RSU Awards. The 2020 performance-based RSU awards, granted on February 24, 2020, utilize two equally weighted metrics to measure performance and can result in a payout range from 0 percent to 200 percent of target. ROCE is weighted at 50 percent and Debt to EBITDA Ratio is weighted at 50 percent and both are measured against preestablished targets. Additionally, the calculated result from these weighted financial metrics may be increased or decreased by 25 percent of the calculated result utilizing a relative TSR metric. If our TSR relative to our peer company group is in the top three companies, the calculated result will be increased by 25 percent, while the calculated result will be decreased by 25 percent if our TSR relative to our peer company group is in the bottom three companies. However, under no circumstance can the total calculated award exceed 200 percent of target.
2022 ROCE performance increased more than 42 percent from 2019 and 2022 Debt to EBITDA Ratio improved by more than 19 percent. Both metrics exceeded stretch targets. Williams TSR during this period placed second and in the top one-third of our peer companies. While this would normally increase the calculated payout by 25%, since the calculated result of the financial performance metrics was already at the 200% maximum payout, no adjustment was made.
The 2020 performance-based award, which vested in February 2023, distributed 200 percent of the targeted number of RSUs awarded.
| Performance-based RSU Metrics | Weighting (%) | Threshold | Target | Stretch | Metric Result | Weighted Result | ||||||||||||||||||||
| 2022 ROCE | 50% | 7.30% | 7.50% | 8.00% | 200.0% | 100.0% | |||||||||||||||||||
| Actual: 10.10% | ||||||||||||||||||||||||||
2022 Debt to EBITDA Ratio | 50% | 4.40x | 4.20x | 4.00x | 200.0% | 100.0% | ||||||||||||||||||||
| Actual: 3.55x | ||||||||||||||||||||||||||
| —Modifier may increase or decrease result by 25% +/-%— |
| +25%
|
|
| —
|
| ||||||||||||||||||||
Relative TSR | Actual: 2nd of 10 (top one-third) | |||||||||||||||||||||||||
Final Result | 200.0% | |||||||||||||||||||||||||

2021 and 2022 Performance-based RSU Awards. The 2021 and 2022 performance-based RSU awards, granted on February 24, 2021 and February 23, 2022 respectively, utilize two equally weighted metrics to measure performance against preestablished targets and can result in a payout range from 0 percent to 200 percent of target. ROCE and AFFO per share are each weighted at 50 percent. Additionally, consistent with the 2020 awards, relative TSR is utilized as a modifier and the calculated result from these weighted financial metrics may be increased or decreased by 25 percent. Beginning with the 2022 performance-based awards, cash dividend equivalents will accrue on any earned units during the vesting period. The cash dividend equivalent payment will only be made on earned units and will only be paid upon the vesting and distribution of the award.
| Performance-based RSU Metrics | Weighting (%) | Threshold | Target | Stretch | ||||||||
| 2023 ROCE | 50% | 8.00% | 8.30% | 8.70% | |||||||
2023 AFFO Per Share | 50% | $3.15 | $3.25 | $3.35 | ||||||||
Relative TSR | —Modifier may increase or decrease result by 25% +/-%— | |||||||||||

| Performance-based RSU Metrics | Weighting (%) | Threshold | Target | Stretch | ||||||||
| 2024 ROCE | 50% | 9.25% | 9.65% | 10.25% | |||||||
2024 AFFO Per Share | 50% | $3.75 | $3.87 | $4.05 | ||||||||
Relative TSR | —Modifier may increase or decrease result by 25% +/-%— | |||||||||||

| 70 |
Table of Contents
| Compensation Discussion and Analysis
|
2023 Performance-based RSU Awards. The 2023 performance-based RSU awards, granted on February 23, 2023, is consistent with the 2022 design and utilizes two equally weighted metrics to measure performance against preestablished targets and can result in a payout range from 0 percent to 200 percent of target. ROCE and AFFO per share are each weighted at 50 percent. Additionally, consistent with the 2020—2022 awards, relative TSR is utilized as a modifier and the calculated result from these weighted financial metrics may be increased or decreased by 25 percent. Cash dividend equivalents accrue on any earned units during the vesting period. The cash dividend equivalent payment will only be made on earned units and will only be paid upon the vesting and distribution of the award.
Time-based RSU Awards. We grant time-based RSUs to retain executives and to facilitate stock ownership. The use of time-based RSUs is also consistent with the practices of our comparator group of companies. Time-based RSUs accrue dividend equivalents which will be paid in cash only upon vesting and distribution of the award.
Stock Option Awards. For recipients, stock options have value only to the extent the price of our common stock is higher on the date the options are exercised than it was on the date the options were granted. While previous awards are still outstanding, stock options were last granted as part of our annual equity awards in 2018.
Grant Practices. The Committee typically approves our annual equity grant in February of each year, shortly after the annual earnings release to ensure the market has time to absorb material information disclosed in the earnings release and reflect that information in the stock price. The grant date for off-cycle grants for individuals who are not NEOs, for reasons such as retention or new hires, is generally the first business day of the month following the approval of the grant. By using this consistent approach, we remove grant timing from the influence of the release of material information.
Stock Ownership Guidelines. Our program provides stock ownership guidelines for each of our NEOs and our Board of Directors as shown in the table below:
Position | Ownership Multiple | As a Multiple of | Holding/Retention Requirement | |||
CEO | 6x | Base Pay | 50%, after taxes, until guidelines are met | |||
NEO | 3x | Base Pay | 50%, after taxes, until guidelines are met | |||
Board of Directors | 5x | Annual Cash Retainer | 60% until guidelines are met | |||
The Committee annually reviews the guidelines for competitiveness and alignment with best practices and monitors the NEOs’ progress toward compliance. WMB shares owned outright and outstanding time-based RSUs count as owned for purposes of the program. Stock options and performance-based equity are not included as owned for purposes of the program. NEOs must retain 50 percent of any vested equity awards, net of taxes, until their ownership guidelines are met. Board members must retain 60 percent of distributed vested equity awards until their ownership guidelines are met. At Williams, NEOs must hold at least 50 percent of any equity transaction if they have not met their ownership guideline regardless of their time in the role.
| WILLIAMS COMPANIES | 2023 PROXY STATEMENT | 71 |
Table of Contents
| Compensation Discussion and Analysis
|
Benefits
Consistent with our philosophy to emphasize pay for performance, our NEOs receive very few perquisites or supplemental benefits. They are as follows:
Retirement Restoration Benefits | NEOs participate in our qualified retirement program on the same terms as our other employees. We offer a retirement restoration plan to maintain a proportional level of pension benefits to our NEOs as provided to other employees. The Internal Revenue Code of 1986, as amended (“Internal Revenue Code”), limits qualified pension benefits based on an annual compensation limit. For 2022, the limit was $305,000. Any limitation in a NEO’s pension benefit in the tax-qualified pension plan due to this limit is made up for (subject to a cap) in the unfunded retirement restoration plan. Benefits for NEOs are not enhanced and are calculated using the same benefit formula as that used to calculate benefits for employees in the qualified pension plan. The compensation included in the retirement restoration benefit is consistent with pay considered for employees in the qualified pension plan. Equity compensation, including RSUs and stock options, is not considered. Additionally, we do not provide a nonqualified benefit related to our qualified 401(k) defined contribution retirement plan. | |
Financial Planning Allowance | We offer financial planning to provide expertise on current tax laws to assist NEOs with personal financial planning and preparations for contingencies such as death and disability. Covered services include estate planning, tax planning, tax return preparation, wealth accumulation planning, and other personal financial planning services. In addition, by working with a financial planner, NEOs gain a better understanding of and appreciation for the programs the Company provides, which helps to maximize the retention and engagement aspects of the dollars the Company spends on these programs. | |
Personal Use of Company Aircraft | The CEO is allowed, but not required, to use the Company’s private aircraft for personal travel. Our policy for all other executive officers is to discourage personal use of the aircraft, but the CEO retains discretion to permit its use when deemed appropriate, such as when the destination is not well served by commercial airlines, personal emergencies, and the aircraft is not being used for business purposes. To the extent that NEOs, including the CEO, use the Company’s private aircraft for personal travel, imputed income will be applied to the NEO, in compliance with Internal Revenue Code requirements. | |
Executive Physicals | The Committee requires annual physicals for the NEOs. Such physicals align with our wellness initiative as well as assist in mitigating risk. NEO physicals are intended to identify any health risks and medical conditions as early as possible in an effort to achieve more effective treatment and outcomes. | |
Event Center | We have a suite and club seats at certain event centers that were purchased for business purposes. If they are not being used for business purposes, we make them available to all employees, including our NEOs. This is not considered a perquisite to our NEOs because it is available to all employees. | |
Additional Components of Our Executive Compensation Program
In addition to establishing the pay elements described above, we have adopted a number of policies to further the goals of the executive compensation program, particularly with respect to strengthening the alignment of our NEOs’ interests with stockholder long-term interests.
Employment Agreements. Williams does not have employment agreements with our NEOs.
Termination and Severance Arrangements. The Executive Severance Pay Plan includes senior executive officers, which includes NEOs other than the CEO, in order to define a consistent approach of treatment in the event of a severance event. Under the plan, NEOs are eligible to receive a discretionary payment of 1.5 to 2.0 times the sum of the NEOs base salary and target annual bonus. Any severance payment is discretionary. Considerations include the NEO’s term of employment, past accomplishments, reasons for separation from the Company, and competitive market practice. The NEO can elect coverage under the Company’s medical benefits plans for 18 months from the termination in the same manner and at the same cost as similarly situated active employees for up to the first three months. Outplacement services are provided up to a maximum amount of $25,000.
| 72 |
Table of Contents
| Compensation Discussion and Analysis
|
Change in Control Agreements. Our change in control agreements, in conjunction with the NEOs’ equity award agreements, provide separation benefits for our NEOs. Our program includes a double trigger for benefits and equity vesting. This means there must be a Company change in control and the NEO must experience a qualifying termination of employment prior to receiving benefits under the agreement. This practice creates security for the NEOs but does not provide an incentive for the NEO to leave the Company. Our program is designed to encourage the NEOs to focus on the best interests of stockholders by alleviating their concerns about a possible detrimental impact to their compensation and benefits under a potential change in control, not to provide compensation advantages to NEOs for executing a transaction.
Our Committee reviews our change in control benefits periodically to ensure they are consistent with competitive practice and aligned with our compensation philosophy. As part of the review, calculations are performed to determine the overall program cost to the Company if a change in control event were to occur and all covered NEOs were terminated as a result. An assessment of competitive norms, including the reasonableness of the elements of compensation received, is used to validate benefit levels for a change in control. We do not offer a tax gross-up provision in our change in control agreements but instead include a ‘best net’ provision providing our NEOs with the better of their after-tax benefit capped at the safe harbor amount or their benefit paid in full, subjecting them to possible excise tax payments. The Committee continues to believe that offering a change in control program is appropriate and critical to attracting and retaining executive talent and keeping them aligned with stockholder interests in the event of a change in control.
The following chart details the benefits received if a NEO were to be terminated or resigned for a defined good reason following a change in control as well as an analysis of those benefits as it relates to the Company, stockholders, and the NEO:
Change in Control Benefit | What does the benefit provide to the Company and stockholders? | What does the benefit provide to the NEO? | ||
Multiple of 3x base pay plus annual cash incentive at target | Encourages NEOs to remain engaged and stay focused on successfully closing the transaction. | Financial security for the NEO equivalent to three-years of continued employment. | ||
Accelerated vesting of stock awards | An incentive to stay during and after a change in control. If there is risk of forfeiture, NEOs may be less inclined to stay or to support the transaction. | The NEOs are kept whole if they have a separation from service following a change in control. | ||
The value of 36 months of group medical, dental, and/or prescription drug plan benefits | This is a minimal cost to the Company that creates a competitive benefit. | Access to health coverage. | ||
Reimbursement of legal fees to enforce benefit | Keeps NEOs focused on the Company and not concerned about whether the acquiring company will honor contractual commitments after a change in control. | Security during an unstable period of time. | ||
Outplacement assistance | Keeps NEOs focused on supporting the transaction and less concerned about trying to secure another position. | Assists NEOs in finding a comparable executive position. | ||
‘Best Net’ provision |
Enables the change in control benefits to be delivered in as close a manner to the intended value of the benefits as possible. | Provides NEOs with the better of their after-tax benefit capped at the safe harbor amount or their benefit paid in full, which would subject them to possible excise tax payments. | ||
Derivative Transactions. Our policy on securities trading applies to transactions in positions or interests whose value is based on the performance or price of our common stock. Because of the inherent potential for abuse, Williams prohibits officers,
directors, and certain other employees from entering into short sales or using equivalent derivative securities in connection with Williams or its affiliates’ securities. Our policy on securities trading also prohibits holding Williams or its affiliates’ securities in a margin account or pledging them as collateral for a loan.
| WILLIAMS COMPANIES | 2023 PROXY STATEMENT | 73 |
Table of Contents
| Compensation Discussion and Analysis
|
MITIGATING RISK
No material adverse compensation-related risks were identified as top risks in the Company’s Strategic Risk Assessment Process as discussed in the “Board Structure and Oversight” section of this proxy statement addressing Strategic Planning and Strategic Risk Assessment. Our compensation plans are effectively designed and function to reward positive performance and motivate NEOs and employees to behave in a manner consistent with our stockholder interests, business strategies and objectives, ethical standards, and prudent business practices, along with our Core Values which are the foundation on which we conduct business. Our Core Values can be found on our website at www.williams.com from the Our Company tab. In fact, many elements of our executive pay program serve to mitigate excessive risk taking. For example:
Target Pay Mix. The target pay mix weighting of long-term incentives, annual cash incentives, and base pay is consistent with comparator company practices and avoids placing too much value on any one element of compensation, particularly the annual cash incentive. The mix of our pay program is intended to motivate NEOs to consider the impact of decisions on stockholders in the long-, intermediate-, and short-terms.
Annual Cash Incentive. Our annual cash incentive program does not allow for unlimited payouts. Calculated annual cash incentive payments for NEOs cannot exceed 200 percent of target levels.
Performance-based Awards
| • | Our annual cash incentive and long-term incentive programs include performance-based awards. The entire annual cash incentive award is measured against performance targets, while a significant portion of the long-term equity awards provided to NEOs is in the form of performance-based RSUs. Performance-based RSUs have no value unless we achieve pre-determined performance target thresholds. |
| • | To drive a long-term perspective, all 2022 RSU awards cliff vest three years from the date of grant rather than vesting ratably on an annual basis. Additionally, any earned cash dividend equivalents on time- and performance-based RSUs are not paid until the officer meets the vesting requirements and the award is distributed. Prior to the 2022 awards, cash dividend equivalents were not provided on performance-based RSU awards. |
| • | NEOs’ incentive compensation performance is measured at the enterprise level rather than on a business unit level to ensure a focus on the overall success of the Company. |
Stock Ownership Guidelines. As discussed in this CD&A, all NEOs, consistent with their responsibilities to stockholders, must hold an equity interest in the Company equal to a stated multiple of their base pay.
Recoupment Policy. In the event that financial results of the Company are restated due to fraud or intentional misconduct, the Board will review any performance-based incentive payments, including payments under the AIP and performance-based RSUs, paid to executive officers, who are found by the Board to be personally responsible for the fraud or intentional misconduct that caused the need for the restatement and will, to the extent permitted by applicable law, seek recoupment from all executive officers of any amounts paid in excess of the amounts that would have been paid based on the restated financial results. In addition, On October 26, 2022, the SEC published recoupment rules as part of the Dodd Frank Act of 2010. The rules are being reviewed and the Recoupment Policy will be updated to comply with the new requirements once the NYSE adopts listing standards to apply these new requirements.
Insider Trading Policy. Our insider trading policy prohibits NEOs and directors, directly or through family members or other persons or entities, from buying or selling Williams securities or engaging in any other action to take personal advantage of material nonpublic information. In addition, if during the course of working for the Company, the NEO or director learns of material nonpublic information about a competitor or a company with which Williams or an affiliate of Williams does or anticipates doing business with, he/she may not trade in that company’s securities until the information becomes public or is no longer material.
| 74 |
Table of Contents
| Compensation Discussion and Analysis
|
ACCOUNTING AND TAX TREATMENT
We consider the impact of accounting and tax treatment when designing all aspects of pay, but the primary driver of our program design is to support our business objectives.
Prior to 2018 and the implications of the tax reform legislation in late 2017, stock options and performance-based RSUs were intended to satisfy the requirements for performance-based compensation as defined in Section 162(m) of the Internal Revenue Code and were therefore considered a tax-deductible expense. Time-based RSUs did not qualify as performance-based and may not be fully deductible. Section 162(m) has been amended for taxable years after December 31, 2017, eliminating the performance-based compensation exception, except for certain grandfathered arrangements previously in place. The Company will generally not be entitled to a tax deduction for individual compensation in excess of $1 million for certain executive officers.
COMPENSATION AND MANAGEMENT DEVELOPMENT COMMITTEE REPORT ON EXECUTIVE COMPENSATION
We have reviewed and discussed the foregoing CD&A with management. Based on our review and discussions with management, we recommend to the Board that the CD&A be included in this proxy statement.
By the members of the Compensation and Management Development Committee of the Board:*
Stephen W. Bergstrom
Carri A. Lockhart
Richard E. Muncrief
Scott D. Sheffield
Murray D. Smith
William H. Spence
* Carri Lockhart joined our Board of Directors on February 10, 2023 and did not participate in any 2022 Compensation and Management Development Committee actions.
The Committee Report on Executive Compensation is not deemed filed with the SEC and shall not be deemed incorporated by reference into any prior or future filings made by Williams under the Securities Act or the Exchange Act, except to the extent that Williams specifically incorporates such information by reference.
| WILLIAMS COMPANIES | 2023 PROXY STATEMENT | 75 |
Table of Contents
| EXECUTIVE COMPENSATION |
| TABLES AND OTHER INFORMATION |
2022 SUMMARY COMPENSATION TABLE
The following table sets forth certain information with respect to the compensation of the NEOs earned during fiscal years 2022, 2021, and 2020:
Name and Principal Position | Year | Salary(1) | Bonus(2) | Stock Awards(3) | Non-Equity Incentive Plan Compensation(4) | Change in Earnings(5) | All Other Compensation(6) | Total | ||||||||||||||||||||||||
Alan S. Armstrong President and Chief Executive Officer |
| 2022 |
| $ | 1,340,000 |
| $ | — |
| $ | 9,300,000 |
| $ | 3,207,960 |
| $ | — |
| $ | 39,636 |
| $ | 13,887,596 |
| ||||||||
| 2021 |
|
| 1,333,846 |
|
| — |
|
| 9,000,015 |
|
| 3,398,640 |
|
| — |
|
| 27,032 |
|
| 13,759,533 |
| |||||||||
| 2020 |
|
| 1,335,577 |
|
| — |
|
| 7,500,010 |
|
| 2,343,938 |
|
| 943,581 |
|
| 48,852 |
|
| 12,171,958 |
| |||||||||
Micheal G. Dunn EVP and Chief Operating Officer |
| 2022 |
|
| 745,385 |
|
| — |
|
| 3,699,996 |
|
| 1,520,000 |
|
| — |
|
| 32,187 |
|
| 5,997,568 |
| ||||||||
| 2021 |
|
| 716,923 |
|
| — |
|
| 2,999,999 |
|
| 1,546,000 |
|
| 157,867 |
|
| 12,436 |
|
| 5,433,225 |
| |||||||||
| 2020 |
|
| 722,116 |
|
| — |
|
| 3,299,993 |
|
| 1,126,000 |
|
| 344,830 |
|
| 98,412 |
|
| 5,591,351 |
| |||||||||
Chad J. Zamarin EVP, Corporate Strategic Development |
| 2022 |
|
| 606,923 |
|
| 300,000 |
|
| 2,700,007 |
|
| 900,000 |
|
| — |
|
| 21,678 |
|
| 4,528,608 |
| ||||||||
| 2021 |
|
| 587,692 |
|
| — |
|
| 2,499,992 |
|
| 1,000,000 |
|
| 14,310 |
|
| 20,721 |
|
| 4,122,715 |
| |||||||||
| 2020 |
|
| 593,269 |
|
| — |
|
| 2,500,003 |
|
| 681,000 |
|
| 201,227 |
|
| 20,228 |
|
| 3,995,728 |
| |||||||||
John D. Porter SVP and Chief Financial Officer |
| 2022 |
|
| 550,000 |
|
| — |
|
| 2,400,017 |
|
| 850,000 |
|
| — |
|
| 39,678 |
|
| 3,839,695 |
| ||||||||
| 2021 |
|
| — |
|
| — |
|
| — |
|
| — |
|
| — |
|
| — |
|
| — |
| |||||||||
| 2020 |
|
| — |
|
| — |
|
| — |
|
| — |
|
| — |
|
| — |
|
| — |
| |||||||||
T. Lane Wilson SVP and General Counsel |
| 2022 |
|
| 537,693 |
|
| — |
|
| 1,600,002 |
|
| 755,000 |
|
| — |
|
| 34,921 |
|
| 2,927,616 |
| ||||||||
| 2021 |
|
| — |
|
| — |
|
| — |
|
| — |
|
| — |
|
| — |
|
| — |
| |||||||||
| 2020 |
|
| — |
|
| — |
|
| — |
|
| — |
|
| — |
|
| — |
|
| — |
| |||||||||
(1) Salary. Due to a payroll timing issue, the 2020 salary includes a 27th bi-weekly paycheck issued in the calendar year.
(2) Bonus. The Committee provided a $300,000 special bonus award to Mr. Zamarin in recognition of his role in the 2021 acquisitions and integration of Sequent and the Wamsutter and Haynesville upstream assets. Additionally, Mr. Zamarin played a key role in executing the 2022 acquisitions of NorTex, Trace Midstream, and MountainWest Pipeline, which closed in early 2023.
(3) Stock Awards. Awards were granted under the terms of the 2007 Incentive Plan and include time-based and performance-based RSUs. Amounts shown are the grant date fair value of awards computed in accordance with FASB ASC Topic 718. The assumptions used to value the stock awards can be found in our Annual Report on Form 10-K for the year-ended December 31, 2022.
The potential maximum values of the performance-based RSUs, subject to changes in performance outcomes, are as follows:
| 2022 Performance- based RSU Maximum Potential | |||||
Alan S. Armstrong | $ | 11,159,998 | |||
Micheal G. Dunn |
| 3,699,992 | |||
Chad J. Zamarin |
| 2,699,997 | |||
John D. Porter |
| 2,400,012 | |||
T. Lane Wilson |
| 1,600,030 | |||
| 76 |
Table of Contents
| Executive Compensation Tables and Other Information
|
(4) Non-Equity Incentive Plan. The maximum annual incentive pool funding for NEOs is 200 percent of target.
(5) Change in Pension Value and Nonqualified Deferred Compensation Earnings. The amount shown is the aggregate change from December 31, 2021 to December 31, 2022 in the actuarial present value of the accrued benefit under the qualified pension and non-qualified plan. The higher discount rates used to measure the present value of these benefits at the end of 2022 as compared to 2021 served to reduce the year end 2022 present values. The underlying design of these programs did not change from 2021 to 2022. Please refer to the “Pension Benefits” table for further details of the present value of the accrued benefit. Mr. Armstrong has a negative value of $1,510,850 for 2022 and $466,437 for 2021. Mr. Dunn has a negative value of $121,211 for 2022. Mr. Zamarin has a negative value of $203,211 for 2022. Mr. Porter has a negative value of $95,285 for 2022. Mr. Wilson has a negative value of $58,712 for 2022.
(6) All Other Compensation. Amounts shown represent payments made on behalf of the NEOs and include life insurance premiums, a 401(k)-matching contribution, and perquisites (if applicable). Perquisites may include financial planning services, mandated annual physical exams and personal use of the Company aircraft. If the NEO used the Company aircraft, the incremental cost method is used to calculate the value of the personal use of the Company aircraft. The incremental cost calculation includes items such as fuel, maintenance, weather and airport services, pilot meals, pilot overnight expenses, aircraft telephone, and catering. Amounts do not include arrangements that are generally available to our employees and do not discriminate in scope, terms, or operations in favor of our NEOs, such as medical, dental, and disability programs.
| • | Mr. Armstrong received 401(k) matching contributions in the amount of $18,300; reimbursement of financial planning services; reimbursement related to a mandated annual physical exam; personal usage of the Company aircraft in the amount of $11,704; and life insurance premiums. |
| • | Mr. Dunn received 401(k) matching contributions in the amount of $18,300; reimbursement of financial planning services; reimbursement related to a mandated annual physical exam; personal usage of the Company aircraft; and life insurance premiums. |
| • | Mr. Zamarin received 401(k) matching contributions in the amount of $18,300; reimbursement related to a mandated annual physical exam; and life insurance premiums. |
| • | Mr. Porter received 401(k) matching contributions in the amount of $18,300; reimbursement of financial planning services; reimbursement related to a mandated annual physical exam; personal usage of the Company aircraft in the amount of $10,804; and life insurance premiums. |
| • | Mr. Wilson received 401(k) matching contributions in the amount of $18,300; reimbursement of financial planning services; reimbursement related to a mandated annual physical exam; personal usage of the Company aircraft; and life insurance premiums. |
The Committee considers the compensation of CEOs from comparator companies when setting Mr. Armstrong’s pay. It is the competitive norm for CEOs to be paid more than other NEOs. In addition, the Committee believes the difference in pay between the CEO and other NEOs is consistent with our compensation philosophy (summarized in the CD&A), which considers the external market and internal value of each job to the Company along with the incumbent’s experience and performance of the job in setting pay. The CEO’s job is different from the other NEOs because the CEO has ultimate responsibility for performance results and is accountable to the Board and stockholders. Consequently, the Committee believes it is appropriate for the CEO’s pay to be higher.
| WILLIAMS COMPANIES | 2023 PROXY STATEMENT | 77 |
Table of Contents
| Executive Compensation Tables and Other Information
|
GRANTS OF PLAN BASED AWARDS
The following table sets forth certain information with respect to the grant of stock options, RSUs, and awards payable under the Company’s annual cash incentive plan during the last fiscal year to the NEOs:
Name | Grant Date | Estimated Future Payouts Under Non-Equity Incentive Plan Awards(1) | Estimated Future Payouts Under Equity Incentive Plan Awards(2) | All Other Stock Awards: Number of Shares of Stock or Units(3) | All Other Option Awards: Number of Securities Underlying Options | Exercise or Base Price of Option Awards | Grant Date Fair Value of Stock and Option Awards | ||||||||||||||||||||||||||||||||||||||||||||||||
| Threshold | Target | Maximum | Threshold | Target | Maximum | ||||||||||||||||||||||||||||||||||||||||||||||||||
Armstrong |
| 2/23/2022 | $ | — | $ | 1,876,000 | $ | 3,752,000 |
|
|
|
|
|
|
|
|
|
|
|
|
|
|
|
|
|
| $ | — | |||||||||||||||||||||||||||
| 2/23/2022 |
|
|
|
|
|
|
|
|
|
| — |
| 171,798 |
| 343,596 |
|
|
|
|
|
|
|
|
|
| 5,579,999 | ||||||||||||||||||||||||||||
| 2/23/2022 |
|
|
|
|
|
|
|
|
|
|
|
|
|
|
|
|
|
|
| 123,506 |
|
|
|
|
|
|
| 3,720,001 | ||||||||||||||||||||||||||
Dunn |
| 2/23/2022 |
| — |
| 819,923 |
| 1,639,846 |
|
|
|
|
|
|
|
|
|
|
|
|
|
|
|
|
|
|
| — | |||||||||||||||||||||||||||
| 2/23/2022 |
|
|
|
|
|
|
|
|
|
| — |
| 56,958 |
| 113,916 |
|
|
|
|
|
|
|
|
|
| 1,849,996 | ||||||||||||||||||||||||||||
| 2/23/2022 |
|
|
|
|
|
|
|
|
|
|
|
|
|
|
|
|
|
|
| 61,421 |
|
|
|
|
|
|
| 1,850,001 | ||||||||||||||||||||||||||
Zamarin |
| 2/23/2022 |
| — |
| 515,885 |
| 1,031,770 |
|
|
|
|
|
|
|
|
|
|
|
|
|
|
|
|
|
|
| — | |||||||||||||||||||||||||||
| 2/23/2022 |
|
|
|
|
|
|
|
|
|
| — |
| 41,564 |
| 83,128 |
|
|
|
|
|
|
|
|
|
| 1,349,999 | ||||||||||||||||||||||||||||
| 2/23/2022 |
|
|
|
|
|
|
|
|
|
|
|
|
|
|
|
|
|
|
| 44,821 |
|
|
|
|
|
|
| 1,350,009 | ||||||||||||||||||||||||||
Porter |
| 2/23/2022 |
| — |
| 495,000 |
| 990,000 |
|
|
|
|
|
|
|
|
|
|
|
|
|
|
|
|
|
|
| — | |||||||||||||||||||||||||||
| 2/23/2022 |
|
|
|
|
|
|
|
|
|
| — |
| 36,946 |
| 73,892 |
|
|
|
|
|
|
|
|
|
| 1,200,006 | ||||||||||||||||||||||||||||
| 2/23/2022 |
|
|
|
|
|
|
|
|
|
|
|
|
|
|
|
|
|
|
| 39,841 |
|
|
|
|
|
|
| 1,200,011 | ||||||||||||||||||||||||||
Wilson |
| 2/23/2022 |
| — |
| 430,154 |
| 860,308 |
|
|
|
|
|
|
|
|
|
|
|
|
|
|
|
|
|
|
| — | |||||||||||||||||||||||||||
| 2/23/2022 |
|
|
|
|
|
|
|
|
|
| — |
| 24,631 |
| 49,262 |
|
|
|
|
|
|
|
|
|
| 800,015 | ||||||||||||||||||||||||||||
| 2/23/2022 |
|
|
|
|
|
|
|
|
|
|
|
|
|
|
|
|
|
|
| 26,560 |
|
|
|
|
|
|
| 799,987 | ||||||||||||||||||||||||||
Note: Information provided is as of the close of market on December 30, 2022.
(1) Non-Equity Incentive Awards. Awards from the 2022 AIP are shown.
| • | Threshold: At threshold, the 2022 AIP awards are zero. |
| • | Target: The amount shown is based upon a business performance attainment of 100 percent. |
| • | Maximum: The maximum calculated result for the NEOs is 200 percent of their AIP target. |
(2) Represents performance-based RSUs granted in February 2022 under the 2007 Incentive Plan. Performance-based RSUs can be earned over a three year period only if the established performance target is met and the NEO is employed on the certification date, subject to certain exceptions such as the executive’s death, disability or retirement. Under any circumstances, these shares will be distributed no earlier than the third anniversary of the grant other than due to a termination upon a change in control. If performance plan goals are exceeded, the NEO can receive up to 200 percent of target. If plan threshold goals are not met, the NEO’s awards are cancelled in their entirety.
(3) Represents time-based RSUs granted under the 2007 Incentive Plan. Time-based units cliff vest 36 months from the respective grant date.
| 78 |
Table of Contents
| Executive Compensation Tables and Other Information
|
OUTSTANDING EQUITY AWARDS
The following table sets forth certain information with respect to the outstanding equity awards held by the NEOs at the end of 2022:
| Option Awards | Stock Awards | |||||||||||||||||||||||||||||||||||||||||||
Name | Grant Date | Number of Securities Underlying Unexercised Options Exercisable | Number of Securities Underlying Unexercised Options Unexercisable | Equity Incentive Plan Awards: Number of Securities Underlying Unexercised Unearned Options | Option Exercise Price | Expiration Date | Grant Date | Number of Shares or Units of Stock That Have Not Vested | Market Value of Shares or Units of Stock That Have Not Vested | Equity Incentive Plan Awards: Number of Unearned Shares, Units of Stock or Other Rights That Have Not Vested | Equity Incentive Plan Awards: Market or Payout Value of Unearned Shares, Units or Other Rights That Have Not Vested (4) | |||||||||||||||||||||||||||||||||
Armstrong |
| 2/20/2018 |
|
| 231,356 |
|
| — |
|
| — |
| $ | 29.09 |
|
| 2/18/2028 |
|
| 2/23/2022 | (1) |
| — |
|
| — |
|
| 123,506 |
| $ | 4,063,347 |
| |||||||||||
| 2/21/2017 |
|
| 188,935 |
|
| — |
|
| — |
|
| 28.87 |
|
| 2/19/2027 |
|
| 2/23/2022 | (2) |
| — |
|
| — |
|
| 171,798 |
|
| 5,652,154 |
| ||||||||||||
| 8/4/2016 |
|
| 145,570 |
|
| — |
|
| — |
|
| 24.98 |
|
| 8/4/2026 |
|
| 2/24/2021 | (1) |
| — |
|
| — |
|
| 150,565 |
|
| 4,953,589 |
| ||||||||||||
| 2/23/2015 |
|
| 153,177 |
|
| — |
|
| — |
|
| 49.15 |
|
| 2/21/2025 |
|
| 2/24/2021 | (2) |
| — |
|
| — |
|
| 257,511 |
|
| 8,472,112 |
| ||||||||||||
| 2/24/2014 |
|
| 133,080 |
|
| — |
|
| — |
|
| 41.77 |
|
| 2/23/2024 |
|
| 2/24/2020 | (1) |
| — |
|
| — |
|
| 147,059 |
|
| 4,838,241 |
| ||||||||||||
| 2/25/2013 |
|
| 147,545 |
|
| — |
|
| — |
|
| 33.57 |
|
| 2/24/2023 |
|
| 2/24/2020 | (2) |
| — |
|
| — |
|
| 277,094 |
|
| 9,116,393 |
| ||||||||||||
|
|
|
|
|
|
|
|
|
|
|
|
|
|
|
|
|
|
|
| 2/19/2019 | (3) |
| — |
|
| — |
|
| 170,206 |
|
| 5,599,777 |
| ||||||||||||
Dunn |
| 2/20/2018 |
|
| 109,130 |
|
| — |
|
| — |
|
| 29.09 |
|
| 2/18/2028 |
|
| 2/23/2022 | (1) |
| — |
|
| — |
|
| 61,421 |
|
| 2,020,751 |
| |||||||||||
| 2/27/2017 |
|
| 80,736 |
|
| — |
|
| — |
|
| 28.15 |
|
| 2/26/2027 |
|
| 2/23/2022 | (2) |
| — |
|
| — |
|
| 56,958 |
|
| 1,873,918 |
| ||||||||||||
|
|
|
|
|
|
|
|
|
|
|
|
|
|
|
|
|
|
|
| 2/24/2021 | (1) |
| — |
|
| — |
|
| 62,735 |
|
| 2,063,982 |
| ||||||||||||
|
|
|
|
|
|
|
|
|
|
|
|
|
|
|
|
|
|
|
| 2/24/2021 | (2) |
| — |
|
| — |
|
| 71,531 |
|
| 2,353,370 |
| ||||||||||||
|
|
|
|
|
|
|
|
|
|
|
|
|
|
|
|
|
|
|
| 2/24/2020 | (1) |
| — |
|
| — |
|
| 80,882 |
|
| 2,661,018 |
| ||||||||||||
|
|
|
|
|
|
|
|
|
|
|
|
|
|
|
|
|
|
|
| 2/24/2020 | (2) |
| — |
|
| — |
|
| 101,601 |
|
| 3,342,673 |
| ||||||||||||
|
|
|
|
|
|
|
|
|
|
|
|
|
|
|
|
|
|
|
| 2/19/2019 | (3) |
| — |
|
| — |
|
| 85,104 |
|
| 2,799,922 |
| ||||||||||||
Zamarin |
| 2/20/2018 |
|
| 80,029 |
|
| — |
|
| — |
|
| 29.09 |
|
| 2/18/2028 |
|
| 2/23/2022 | (1) |
| — |
|
| — |
|
| 44,821 |
|
| 1,474,611 |
| |||||||||||
|
|
|
|
|
|
|
|
|
|
|
|
|
|
|
|
|
|
|
| 2/23/2022 | (2) |
| — |
|
| — |
|
| 41,564 |
|
| 1,367,456 |
| ||||||||||||
|
|
|
|
|
|
|
|
|
|
|
|
|
|
|
|
|
|
|
| 2/24/2021 | (1) |
| — |
|
| — |
|
| 52,279 |
|
| 1,719,979 |
| ||||||||||||
|
|
|
|
|
|
|
|
|
|
|
|
|
|
|
|
|
|
|
| 2/24/2021 | (2) |
| — |
|
| — |
|
| 59,609 |
|
| 1,961,136 |
| ||||||||||||
|
|
|
|
|
|
|
|
|
|
|
|
|
|
|
|
|
|
|
| 2/24/2020 | (1) |
| — |
|
| — |
|
| 61,275 |
|
| 2,015,948 |
| ||||||||||||
|
|
|
|
|
|
|
|
|
|
|
|
|
|
|
|
|
|
|
| 2/24/2020 | (2) |
| — |
|
| — |
|
| 76,970 |
|
| 2,532,313 |
| ||||||||||||
|
|
|
|
|
|
|
|
|
|
|
|
|
|
|
|
|
|
|
| 2/19/2019 | (3) |
| — |
|
| — |
|
| 63,828 |
|
| 2,099,941 |
| ||||||||||||
Porter |
| 2/20/2018 |
|
| 5,820 |
|
| — |
|
| — |
|
| 29.09 |
|
| 2/18/2028 |
|
| 2/23/2022 | (1) |
| — |
|
| — |
|
| 39,841 |
|
| 1,310,769 |
| |||||||||||
| 2/21/2017 |
|
| 3,936 |
|
| — |
|
| — |
|
| 28.87 |
|
| 2/19/2027 |
|
| 2/23/2022 | (2) |
| — |
|
| — |
|
| 36,946 |
|
| 1,215,523 |
| ||||||||||||
| 8/4/2016 |
|
| 1,899 |
|
| — |
|
| — |
|
| 24.98 |
|
| 8/4/2026 |
|
| 2/24/2021 | (1) |
| — |
|
| — |
|
| 9,034 |
|
| 297,219 |
| ||||||||||||
| 2/23/2015 |
|
| 2,507 |
|
| — |
|
| — |
|
| 49.15 |
|
| 2/21/2025 |
|
| 2/24/2021 | (2) |
| — |
|
| — |
|
| 6,867 |
|
| 225,924 |
| ||||||||||||
| 2/24/2014 |
|
| 1,057 |
|
| — |
|
| — |
|
| 41.77 |
|
| 2/23/2024 |
|
| 2/24/2020 | (1) |
| — |
|
| — |
|
| 10,471 |
|
| 344,496 |
| ||||||||||||
| 2/25/2013 |
|
| 690 |
|
| — |
|
| — |
|
| 33.57 |
|
| 2/24/2023 |
|
| 2/24/2020 | (2) |
| — |
|
| — |
|
| 8,768 |
|
| 288,467 |
| ||||||||||||
Wilson |
| 2/20/2018 |
|
| 928 |
|
| — |
|
| — |
|
| 29.09 |
|
| 2/18/2028 |
|
| 2/23/2022 | (1) |
| — |
|
| — |
|
| 26,560 |
|
| 873,824 |
| |||||||||||
|
|
|
|
|
|
|
|
|
|
|
|
|
|
|
|
|
|
|
| 2/23/2022 | (2) |
| — |
|
| — |
|
| 24,631 |
|
| 810,360 |
| ||||||||||||
|
|
|
|
|
|
|
|
|
|
|
|
|
|
|
|
|
|
|
| 2/24/2021 | (1) |
| — |
|
| — |
|
| 29,276 |
|
| 963,180 |
| ||||||||||||
|
|
|
|
|
|
|
|
|
|
|
|
|
|
|
|
|
|
|
| 2/24/2021 | (2) |
| — |
|
| — |
|
| 33,381 |
|
| 1,098,235 |
| ||||||||||||
|
|
|
|
|
|
|
|
|
|
|
|
|
|
|
|
|
|
|
| 2/24/2020 | (1) |
| — |
|
| — |
|
| 34,314 |
|
| 1,128,931 |
| ||||||||||||
|
|
|
|
|
|
|
|
|
|
|
|
|
|
|
|
|
|
|
| 2/24/2020 | (2) |
| — |
|
| — |
|
| 43,103 |
|
| 1,418,089 |
| ||||||||||||
|
|
|
|
|
|
|
|
|
|
|
|
|
|
|
|
|
|
|
| 2/19/2019 | (3) |
| — |
|
| — |
|
| 31,914 |
|
| 1,049,971 |
| ||||||||||||
Note: Information provided is as of the close of market on December 30, 2022.
| WILLIAMS COMPANIES | 2023 PROXY STATEMENT | 79 |
Table of Contents
| Executive Compensation Tables and Other Information
|
Stock Awards
(1) The following table reflects the vesting dates for associated time-based RSU award grant dates:
Grant Date | Vesting Dates | |||||||||
2/23/2022 |
| 2/23/2025 |
|
|
| |||||
2/24/2021 |
| 2/24/2024 |
|
|
| |||||
2/24/2020 |
| 2/24/2023 |
|
|
| |||||
(2) Performance-based RSUs are subject to attainment of performance targets established by the Committee. If earned, these awards generally vest three years from the date of grant. The awards included on the table are outstanding as of December 31, 2022.
(3) An incremental 2019 performance-based RSU award was granted to select executive officers and was subject to attainment of performance targets established by the Committee. This performance-based RSU award measured adjusted earnings per share against predetermined targets and earned a 200 percent payout. These awards vested in one-half increments on the third and fourth anniversary of the award, February 19, 2022 and February 19, 2023.
(4) Values are based on a closing stock price of $32.90 on December 30, 2022.
OPTION EXERCISES AND STOCK VESTED
The following table sets forth certain information with respect to options exercised by the NEO and stock that vested during fiscal year 2022:
| Option Awards | Stock Awards | |||||||||||||||||||
Name | Number of Shares Acquired on Exercise | Value Realized on Exercise | Number of Shares Acquired on Vesting | Value Realized on Vesting | ||||||||||||||||
Alan S. Armstrong | 159,681 | $ | 176,448 | 492,598 | $ | 14,536,567 | ||||||||||||||
Micheal G. Dunn | — | — | 217,852 | 6,428,813 | ||||||||||||||||
Chad J. Zamarin | — | — | 158,648 | 4,681,702 | ||||||||||||||||
John D. Porter | — | — | 8,140 | 240,211 | ||||||||||||||||
T. Lane Wilson | 50,000 | 391,270 | 88,807 | 2,620,695 | ||||||||||||||||
| 80 |
Table of Contents
| Executive Compensation Tables and Other Information
|
RETIREMENT PLAN
The retirement plan for the Company’s NEOs consists of two plans: the pension plan and the retirement restoration plan as described below. Together these plans generally provide the same level of benefits to our executives as the pension plan provides to the majority of other employees of the Company. The retirement restoration plan was implemented to address the annual compensation limit of the Internal Revenue Code.
Pension Plan
Each of our NEOs have completed one year of service and participate in our pension plan. Our pension plan is a noncontributory, tax qualified defined benefit plan (with a cash balance design) subject to the Employee Retirement Income Security Act of 1974, as amended.
Each year, participants in the plan earn compensation credits that are posted to their cash balance account. The annual compensation credits are equal to the sum of a percentage of eligible pay (base pay and certain bonuses) and a percentage of eligible pay greater than the social security wage base. The percentage credited is based upon the participant’s age as shown in the following table:
Age as of 12/31/2019 | Percentage of Eligible Pay | Percent of Eligible Pay Greater than the Social Security Wage Base | ||||||||
40-49 | 8 | % | 3 | % | ||||||
50 or over | 10 | % | 5 | % | ||||||
For participants who were active employees and participants under the plan on March 31, 1998 and April 1, 1998, the percentage of eligible pay is increased by 0.3 percent multiplied by the participant’s total years of benefit service earned as of March 31, 1998.
In addition, interest is credited to account balances quarterly at a rate determined annually in accordance with the terms of the plan.
While a lump-sum benefit is also available, the monthly annuity available to those who take normal retirement is based on the participant’s account balance as of the date of commencement. Normal retirement age is 65. Early retirement eligibility begins at age 55. At retirement, participants may choose to receive a single-life annuity (for single participants), a qualified joint and survivor annuity (for married participants), or they may choose one of several other forms of payment having an actuarial value equal to that of the relevant annuity.
Retirement Restoration Plan
The Internal Revenue Code limits pension benefits, based on the annual compensation limit, which can be accrued in tax-qualified defined benefit plans, such as our pension plan. The annual compensation limit in 2022 was $305,000. Any reduction in an executive’s pension benefit accrual due to these limits will be compensated, subject to a cap, under an unfunded top hat plan — our retirement restoration plan.
The elements of compensation that are included in applying the payment and benefit formula for the retirement restoration plan are the same elements that are used, except for application of a cap, in the base pension plan for eligible employees. The elements of pay included in that definition are total base pay, including any overtime, base pay-reduction amounts, and cash bonus awards, if paid (unless specifically excluded under a written bonus or incentive-pay arrangement). Specifically excluded from the definition are severance pay, cost-of-living pay, housing pay, relocation pay (including mortgage interest differential), taxable and non-taxable fringe benefits, and all other extraordinary pay, including any amounts received from equity compensation awards.
With respect to bonuses, annual cash incentives are considered in determining eligible pay under the pension plan. Long-term equity compensation incentives are not considered.
| WILLIAMS COMPANIES | 2023 PROXY STATEMENT | 81 |
Table of Contents
| Executive Compensation Tables and Other Information
|
PENSION BENEFITS
The following table sets forth certain information with respect to the actuarial present value of the accrued benefit as of December 31, 2022 under the qualified pension plan and retirement restoration plan. All NEOs are fully vested in the benefits:
Name | Plan Name | Number of Years Credited Services | Present Value of Accrued Benefit(1) | Payments During Last Fiscal Year | |||||||||||||
Alan S. Armstrong | Pension Plan | 37 | $ | 875,663 | — | ||||||||||||
| Retirement Restoration Plan | 37 | 5,309,756 | — | ||||||||||||||
Micheal G. Dunn (2) | Pension Plan | 20 | 271,274 | — | |||||||||||||
| Retirement Restoration Plan | 20 | 910,399 | — | ||||||||||||||
Chad J. Zamarin | Pension Plan | 6 | 95,502 | — | |||||||||||||
| Retirement Restoration Plan | 6 | 371,891 | — | ||||||||||||||
John D. Porter | Pension Plan | 25 | 299,317 | — | |||||||||||||
| Retirement Restoration Plan | 25 | 127,659 | — | ||||||||||||||
T. Lane Wilson | Pension Plan | 6 | 145,535 | — | |||||||||||||
| Retirement Restoration Plan | 6 | 354,246 | — | ||||||||||||||
(1) The primary actuarial assumptions used to determine the present values include an annual interest credit to normal retirement age equal to 3.50 percent and a discount rate equal to 5.19 percent for the pension plan and a discount rate equal to 5.01 percent for the retirement restoration plan.
(2) Mr. Dunn rejoined the company in 2017. As a former employee, Mr. Dunn has prior years of vesting service under the Plans.
NONQUALIFIED DEFERRED COMPENSATION
We do not provide other nonqualified deferred compensation for any of our NEOs or other employees.
CHANGE IN CONTROL AGREEMENTS
We have entered into change in control agreements with each of our NEOs to facilitate continuity of management if there is a change in control of the Company.
If during the term of a change in control agreement, a “change in control” occurs and (i) the employment of any NEO is terminated other than for “cause,” “disability,” or death, or (ii) a NEO resigns for “good reason,” such NEO is entitled to the following:
| • | accrued but unpaid base salary, accrued but unpaid paid time off, and any other amounts or benefits due but not paid (lump sum payment); |
| • | within sixty days after the termination date or such later date required by section 409A of the Internal Revenue Code of 1986, as amended: |
| • | prorated annual cash incentive for the year of separation through the termination date (lump sum payment); |
| • | a severance amount equal to three times the sum of his or her base salary and target annual incentive bonus, as of the termination date (lump sum payment); and |
| • | an amount equal to the full monthly cost of group medical, dental, and/or prescription drug plan benefits multiplied by thirty-six (lump sum payment). |
| • | all equity awards will vest and will be paid out only in accordance with the terms of the respective plan and award agreements; |
| • | continued participation in the Company’s directors’ and officers’ liability insurance for six-years or any longer known applicable statute of limitations period; |
| • | indemnification as set forth under the Company’s By-laws; and |
| • | outplacement benefits for six months at a cost not exceeding $25,000 per NEO. |
| 82 |
Table of Contents
| Executive Compensation Tables and Other Information
|
We provide a ‘best net’ provision providing our NEOs with the better of their after-tax benefit capped at the safe harbor amount or their benefit paid in full, subjecting them to possible excise tax payments. If a NEO’s employment is terminated for “cause” during the period beginning upon a change of control and continuing for two-years or until the termination of the agreement, whichever happens first, the NEO is entitled to accrued but unpaid base salary, and unpaid paid time off, and any other amounts or benefits due but not paid (lump sum payment).
The agreements with our NEOs use the following definitions:
“Cause” generally means a NEO’s:
| • | conviction of or a plea of nolo contendere to a felony or a crime involving fraud, dishonesty, or moral turpitude; |
| • | misconduct in the performance of his or her duties that has a material adverse effect on Williams; |
| • | violation or disregard of the Code of Business Conduct that has a material adverse effect on Williams; |
| • | violation or disregard of a Company policy, standard or process that has a material adverse effect on Williams; or |
| • | habitual or gross neglect of his or her duties. |
Cause generally does not include bad judgment or negligence (other than habitual neglect or gross negligence); acts or omissions made in good faith after reasonable investigation by the NEO or acts or omissions with respect to which the Board could determine that the NEO had satisfied the standards of conduct for indemnification or reimbursement under the Company’s By-laws, indemnification agreement, or applicable law; or failure (despite good faith efforts) to meet performance goals, objectives, or measures for a period beginning upon a change of control and continuing for two years or until the termination of the agreement, whichever happens first. A NEO’s act or failure to act (except as relates to a conviction or plea of nolo contendere described above), when done in good faith and with a reasonable belief after reasonable investigation that such action or non-action was in the best interest of Williams or its affiliate or required by law shall not be cause if the NEO cures the action or non-action within ten days of notice. Furthermore, no act or failure to act will be cause if the NEO acted under the advice of Williams’ counsel or as required by the legal process.
“Change in control” means:
| • | any person, subject to certain exceptions, becomes a beneficial owner, as such term is defined under the Exchange Act, of 30 percent or more of the combined voting power of all securities entitled to vote generally in the election of directors (“Voting Securities”); |
| • | a majority of the members of the Board is replaced during any 12-month period by directors whose appointment or election is not approved by the majority of the members constituting the Board prior to the date of the appointment or election; |
| • | consummation of any reorganization, merger, consolidation, statutory share exchange or similar transaction (a “Reorganization”), the sale or disposition of all or substantially all of Williams’ assets (a “Sale”), or the acquisition of the assets or stock of another entity (an “Acquisition”) unless immediately following such Reorganization, Sale or Acquisition, (A) all or substantially all of the beneficial owners of the outstanding shares of Williams common stock and Williams Voting Securities immediately prior to such Reorganization, Sale or Acquisition beneficially own, directly or indirectly, more than 50% of, respectively, the then outstanding shares of common stock and the combined voting power of the then outstanding voting securities entitled to vote generally in the election of directors of the entity resulting from such Reorganization, Sale or Acquisition (the “Surviving Entity”) in substantially the same proportions as their ownership, immediately prior to such Reorganization, Sale or Acquisition and (B) no Person (other than Williams or any of its subsidiaries, the Surviving Entity or its ultimate parent, or any employee benefit plan sponsored or maintained by any of the foregoing) is the beneficial owner of 30% or more of the Voting Securities, and (C) at least a majority of the members of the board of directors or similar governing body of the Surviving Entity were members of the incumbent Board at the time of the execution of the initial agreement, or at the time of the action of the Board of Directors, providing for such Reorganization, Sale or Acquisition (any Reorganization, Sale or Acquisition); or |
| • | approval by the stockholders of Williams for a complete liquidation or dissolution of Williams. |
| WILLIAMS COMPANIES | 2023 PROXY STATEMENT | 83 |
Table of Contents
| Executive Compensation Tables and Other Information
|
“Disability” means the inability of NEO, as determined by the Board, to perform the essential functions of his or her regular duties and responsibilities, with or without reasonable accommodation, due to a medically determinable physical or mental illness which has lasted (or can reasonably be expected to last) for a period of 6 consecutive months.
“Good reason” means, generally, (i) the assignment of any duties inconsistent in any material respect with the NEO’s position, authority, duties or responsibilities as provided in the agreement or any other action that results in a material diminution in the NEO’s position, authority, duties or responsibilities, (ii) a reduction in the NEO’s base salary or annual bonus opportunity, (ii) required relocation to an office or location more than 50 miles for the NEO’s office or location as of the change in control, (iv) a successor company’s failure to honor the agreement, or (v) any other material breach of the Agreement not taken in good faith or not promptly remedied upon notice from the NEO.

The success of Williams requires a high-performing workforce where all people feel welcome, valued for their contributions and energized to achieve their full potential.
| 84 |
Table of Contents
| Executive Compensation Tables and Other Information
|
TERMINATION SCENARIOS
The following table sets forth circumstances that provide for payments to the NEOs following or in connection with a change in control of the Company or a NEO’s termination of employment for cause, upon retirement, upon death and disability, or not for cause. NEOs are generally eligible to retire at the earlier of age 55 and completion of three years of service or age 65.
All values are based on a hypothetical termination date of December 31, 2022 and a WMB closing stock price of $32.90 on such date. The values shown are intended to provide reasonable estimates of the potential benefits the NEOs would receive upon termination. The values are based on various assumptions and may not represent the actual amount a NEO would receive. In addition to the amounts disclosed in the following table, a departing NEO would retain the amounts he or she has earned over the course of his or her employment prior to the termination event, including accrued retirement benefits and previously vested stock options and restricted stock units.
Name | Payment | For Cause(1) | Retirement(2) | Death & Disability(3) | Not for Cause(4) | CIC(5) | ||||||||||||||
Armstrong | Stock awards | — | $ | 36,099,447 |
| $ | 36,099,447 |
| $ | 36,099,447 |
| $ | 44,426,989 |
| ||||||
AIP | — |
| 1,876,000 |
|
| 1,876,000 |
|
| 1,876,000 |
|
| 1,876,000 |
| |||||||
Cash Severance | — |
| — |
|
| — |
|
| — |
|
| 9,648,000 |
| |||||||
Outplacement | — |
| — |
|
| — |
|
| — |
|
| 25,000 |
| |||||||
Health & Welfare | — |
| — |
|
| — |
|
| — |
|
| 77,311 |
| |||||||
‘Best Net’ Provision | — |
| — |
|
| — |
|
| — |
|
| — |
| |||||||
Total | — |
| 37,975,447 |
|
| 37,975,447 |
|
| 37,975,447 |
|
| 56,053,299 |
| |||||||
Dunn | Stock awards | — |
| 12,696,065 |
|
| 15,285,085 |
|
| 15,285,085 |
|
| 17,925,969 |
| ||||||
AIP | — |
| 825,000 |
|
| 825,000 |
|
| 825,000 |
|
| 825,000 |
| |||||||
Cash Severance | — |
| — |
|
| — |
|
| 3,150,000 |
|
| 4,725,000 |
| |||||||
Outplacement | — |
| — |
|
| — |
|
| 25,000 |
|
| 25,000 |
| |||||||
Health & Welfare | — |
| — |
|
| — |
|
| 5,450 |
|
| 77,311 |
| |||||||
‘Best Net’ Provision | — |
| — |
|
| — |
|
| — |
|
| — |
| |||||||
Total | — |
| 13,521,065 |
|
| 16,110,085 |
|
| 19,290,535 |
|
| 23,578,280 |
| |||||||
Zamarin | Stock awards | — |
| — |
|
| 11,741,554 |
|
| 11,741,554 |
|
| 13,771,038 |
| ||||||
AIP | — |
| — |
|
| 518,500 |
|
| 518,500 |
|
| 518,500 |
| |||||||
Cash Severance | — |
| — |
|
| — |
|
| 2,257,000 |
|
| 3,385,500 |
| |||||||
Outplacement | — |
| — |
|
| — |
|
| 25,000 |
|
| 25,000 |
| |||||||
Health & Welfare | — |
| — |
|
| — |
|
| 5,775 |
|
| 85,323 |
| |||||||
‘Best Net’ Provision | — |
| — |
|
| — |
|
| — |
|
| — |
| |||||||
Total | — |
| — |
|
| 12,260,054 |
|
| 14,547,830 |
|
| 17,785,362 |
| |||||||
Porter | Stock awards | — |
| — |
|
| 2,867,712 |
|
| 2,867,712 |
|
| 3,894,837 |
| ||||||
AIP | — |
| — |
|
| 495,000 |
|
| 495,000 |
|
| 495,000 |
| |||||||
Cash Severance | — |
| — |
|
| — |
|
| 2,090,000 |
|
| 3,135,000 |
| |||||||
Outplacement | — |
| — |
|
| — |
|
| 25,000 |
|
| 25,000 |
| |||||||
Health & Welfare | — |
| — |
|
| — |
|
| 5,450 |
|
| 77,311 |
| |||||||
‘Best Net’ Provision | — |
| — |
|
| — |
|
| — |
|
| — |
| |||||||
Total | — |
| — |
|
| 3,362,712 |
|
| 5,483,161 |
|
| 7,627,147 |
| |||||||
Wilson | Stock awards | — |
| 5,383,346 |
|
| 6,531,783 |
|
| 6,531,783 |
|
| 7,696,907 |
| ||||||
AIP | — |
| — |
|
| 432,000 |
|
| 432,000 |
|
| 432,000 |
| |||||||
Cash Severance | — |
| — |
|
| — |
|
| 1,944,000 |
|
| 2,916,000 |
| |||||||
Outplacement | — |
| — |
|
| — |
|
| 25,000 |
|
| 25,000 |
| |||||||
Health & Welfare | — |
| — |
|
| — |
|
| 3,799 |
|
| 54,407 |
| |||||||
‘Best Net’ Provision | — |
| — |
|
| — |
|
| — |
|
| — |
| |||||||
Total | — |
| 5,383,346 |
|
| 6,963,783 |
|
| 8,936,582 |
|
| 11,124,314 |
| |||||||
(1) If a NEO is terminated for cause or leaves the company voluntarily, no additional benefits will be received.
| WILLIAMS COMPANIES | 2023 PROXY STATEMENT | 85 |
Table of Contents
| Executive Compensation Tables and Other Information
|
(2) Mr. Armstrong, Mr. Dunn, and Mr. Wilson are the only NEOs eligible to retire as of December 31, 2022. If a NEO retires, then the annual cash incentive for the year of separation is pro-rated to the retirement date and is paid when all active employees’ annual cash incentives are paid after the company performance is certified. A pro-rated portion of the unvested time-based restricted stock units will accelerate, and a pro-rated portion of any performance-based restricted stock units will vest on the original vesting date if the Compensation Committee certifies that the performance measures were met. Since Mr. Armstrong is over age 60 and has more than 10 years of service, any time-based RSU that has been outstanding at least six months would vest upon retirement. A pro-rated portion of the unvested 2019 incremental performance-based equity award will vest on the original vesting date since the Committee has certified that performance measures were met, and the retirement date is more than 30 months after the grant date. The annual cash incentive award amounts, as of December 31, 2022, are shown at target.
(3) If a NEO dies or becomes disabled, then the annual cash incentive for the year of separation is pro-rated through the separation or leave date and is paid when all active employees’ annual cash incentives are paid after the company performance is certified. All unvested time-based restricted stock units will fully accelerate, and a pro-rated portion of any performance-based restricted stock units will vest if the Compensation Committee certifies that the performance measures were met. The annual cash incentive award estimates, as of December 31, 2022, are shown at target.
(4) For a NEO who is involuntarily terminated and who receives severance or for a NEO whose termination is due to the sale of a business or outsourcing any portion of a business and for whom no comparable internal offer of employment is made, all unvested time-based restricted stock units will fully accelerate, and a pro-rated portion of any performance-based restricted stock units will vest if the Compensation Committee certifies that the performance measures were met. If this separation occurs during the last quarter of the fiscal year, the annual cash incentive for the year of separation is pro-rated through the separation or leave date and is paid when all active employees’ annual cash incentives are paid after the company performance is certified. The annual cash incentive award amounts, as of December 31, 2022, are shown at target.
(5) See “Change In Control Agreements” section.
Please note that we make no assumptions as to the achievement of performance goals as it relates to the performance-based RSUs for active NEOs. If an award is covered by Section 409A of the Internal Revenue Code, lump sum payments and equity award distributions occurring from these events will occur six months after the triggering event to the extent required by the Internal Revenue Code and our award agreements.
CEO PAY RATIO
Our CEO Pay Ratio was calculated in compliance with the requirements set forth in Item 402(u) of Regulation S-K. We are utilizing the same median employee disclosed in the 2021 and 2022 Proxy Statements. We identified this median employee using our employee population on October 1, 2020. We used a consistently applied compensation measure across our employee population to determine the median employee. For our consistently applied compensation measure, we used targeted total cash compensation which includes an employee’s base salary plus their annual incentive bonus opportunity at target. Due to the consistent use of base salaries and our annual incentive program across our population, targeted total cash compensation provides an accurate depiction of total earnings for the purpose of identifying our median employee. We then calculated the median employee’s compensation in the same manner as the named executive officers in the Summary Compensation Table.
Our median employee’s compensation was $129,286. Our CEO’s disclosed compensation amount was $13,887,596. Accordingly, our CEO Pay Ratio is 107:1.
It is important to note that 89 percent of our CEO’s compensation is at risk. Additionally, 67 percent of the amount disclosed as the CEO’s total compensation in the Summary Compensation Table is the grant date value of equity awards made during 2022. He has not earned any value from these awards to date.
| 86 |
Table of Contents
Executive Compensation Tables and Other Information |
PAY VERSUS PERFORMANCE
The table below provides additional information related to compensation for our named executive officers as required by Item 402(v) of Regulation
S-K.
The table includes a new calculated value titled “compensation actually paid” (“CAP”) for the Primary Executive Officer (“PEO”), our CEO, and for thenon-PEO
NEOs. It’s important to note the majority of the value displayed as CAP has in fact not been earned or paid and reflects updated values of outstanding equity awards that are still subject to vesting, and in some cases, performance requirements. The table also provides information on our cumulative TSR, the cumulativ
e TSR of the Bloomberg Americas Pipeline Index, GAAP net income and Adjusted EBITDA.Year | Summary Compensation Table Total for PEO ($) | Compensation Actually Paid to PEO ($) | Average Summary Compensation Table Total for Non-PEO Named Executive Officers ($) (a) | Average Compensation Actually Paid to Non-PEO Named Executive Officers ($) (a) | Value of Initial Fixed $100 Investment Based On: (b) | Net Income ($) in millions | Adjusted EBITDA (c) ($) in millions | |||||||||||||||||||||||||||||||||
Company TSR ($) | Bloomberg Americas Pipeline Index TSR ($) | |||||||||||||||||||||||||||||||||||||||
2022 | $ | 13,887,596 | $ | 36,717,682 | $ | 4,323,372 | $ | 9,088,871 | $ | 170.05 | $ | 122.58 | $ | 2,117 | $ | 6,418 | ||||||||||||||||||||||||
2021 | 13,759,533 | 32,332,070 | 4,036,788 | 9,626,605 | 127.92 | 106.10 | 1,562 | 5,635 | ||||||||||||||||||||||||||||||||
2020 | 12,171,958 | 12,835,709 | 4,007,220 | 4,308,244 | 92.40 | 79.13 | 198 | 5,105 | ||||||||||||||||||||||||||||||||
(a) The PEO for the disclosure is our CEO Mr. Armstrong. The
non-PEO
NEOs for 2020 and 2021 include Mr. Dunn, Mr. Zamarin, Mr. Chandler, and Mr. Bennett. Thenon-PEO
NEOs for 2022 include Mr. Dunn, Mr. Zamarin, Mr. Porter and Mr. Wilson.(b) The dollar amount represents the value of an initial $100 investment on December 31, 2019 assuming reinvestment of all dividends.
(c) Adjusted EBITDA is a
non-GAAP
measure. A reconciliation of thesenon-GAAP
financial measures to their nearest GAAP comparable financial measure is included in the appendix.The following tables detail the adjustments to the SCT total compensation value to reach the calculated CAP result. The equity award values are calculated in accordance with FASB ASC Topic 176 for each
year-end
value. For awards that vested within the applicable calendar year, the actual vesting date value is applied. The addition to the SCT value for pension benefits reflect the actual service cost applicable for the calendar year as opposed to the change in present value of the pension benefit used in the SCT. No prior service cost is included as there were no applicable plan amendments during this time.The PEO calculation of CAP:
Year | SCT Total Comp | Deductions from SCT Total for Equity Awards | Deductions from SCT for Pension Benefits | Additions for Equity Awards | Additions for Pension Benefits | CAP | ||||||||||||||||||||||||
2022 | $ | 13,887,596 | $ | (9,300,000 | ) | $ | — | $ | 31,567,125 | $ | 562,961 | $ | 36,717,682 | |||||||||||||||||
2021 | 13,759,533 | (9,000,015 | ) | — | 26,902,316 | 670,236 | 32,332,070 | |||||||||||||||||||||||
2020 | 12,171,958 | (7,500,010 | ) | (943,581 | ) | 8,421,513 | 685,829 | 12,835,709 | ||||||||||||||||||||||
The following details the sources of the CAP additions related to
the PE
O’s Equity Awards:Year | Fair Value of Current Year Awards Outstanding at Year End | Change in Value of Prior Years’ Awards Outstandng at Year End | Change in Value of Prior Years’ Awards That Vested in Year | Change in Value of Prior Years’ Awards That Failed to Meet Vesting Conditions | Value of Dividends or Other Earnings Paid on Equity Awards Not Otherwise Reflected in Fair Value or Total Compensation | Equity Value Included in CAP | ||||||||||||||||||||||||
2022 | $ | 10,498,900 | $ | 18,907,561 | $ | 1,709,315 | $ | — | $ | 451,349 | $ | 31,567,125 | ||||||||||||||||||
2021 | 10,126,728 | 16,198,513 | 332,207 | — | 244,868 | 26,902,316 | ||||||||||||||||||||||||
2020 | 8,504,268 | 1,767,331 | (2,062,071 | ) | — | 211,985 | 8,421,513 | |||||||||||||||||||||||
Note:
The increased equity value included in CAP in 2021 and 2022 is primarily due to more than a 64 percent increase in the stock price from December 31, 2020 to December 30, 2022 and increases in the estimated performance-based RSU results of outstanding awards. Performance-based RSUs make up the largest component of the PEO’s annual equity award.
| WILLIAMS COMPANIES | 2023 PROXY STATEMENT | 87 |
Executive Compensation Tables and Other Information |
The
Non-PEO
NEOs calculatio
n of CAP:Year | SCT Total Comp | Deductions from SCT Total for Equity Awards | Deductions from SCT for Pension Benefits | Additions for Equity Awards | Additions for Pension Benefits | CAP | ||||||||||||||||||||||||
2022 | $ | 4,323,372 | $ | (2,600,006 | ) | $ | — | $ | 7,220,623 | $ | 144,882 | $ | 9,088,871 | |||||||||||||||||
2021 | 4,036,788 | (2,275,002 | ) | (67,160 | ) | 7,718,867 | 213,112 | 9,626,605 | ||||||||||||||||||||||
2020 | 4,007,220 | (2,350,001 | ) | (258,967 | ) | 2,688,674 | 221,318 | 4,308,244 | ||||||||||||||||||||||
The following details the sources of the CAP additions related to the
Non-PEO
NEO’s Equity Awards:Year | Fair Value of Current Year Awards Outstanding at Year End | Change in Value of Prior Years’ Awards Outstanding at Year End | Change in Value of Prior Years’ Awards That Vested in Year | Change in Value of Prior Years’ Awards That Failed to Meet Vesting Conditions | Value of Dividends or Other Earnings Paid on Equity Awards Not Otherwise Reflected in Fair Value or Total Compensation | Equity Value Included in CAP | ||||||||||||||||||||||||
2022 | $ | 2,919,316 | $ | 3,759,353 | $ | 410,716 | $ | — | $ | 131,238 | $ | 7,220,623 | ||||||||||||||||||
2021 | 2,546,120 | 4,926,525 | 130,284 | — | 115,938 | 7,718,867 | ||||||||||||||||||||||||
2020 | 2,605,503 | 363,249 | (439,842 | ) | — | 159,764 | 2,688,674 | |||||||||||||||||||||||
The four metrics on the following table re
present an unra
nked list of the most important performance measures used by the Company to align compensation with Company performance.Most Important Performance Metrics in 2022 |
Adjusted EBITDA |
Available Funds From Operations (AFFO) Per Share |
Relative Total Shareholder Return (TSR) |
Return on Capital Employed (ROCE) |
The following su
pplem
ental charts demonstrate the signifi
cant growth in both Total Shareholder Return (
TSR) and in our financial performance over this three year period creating a strong relationship between performance and the SEC’s required calculation of CAP: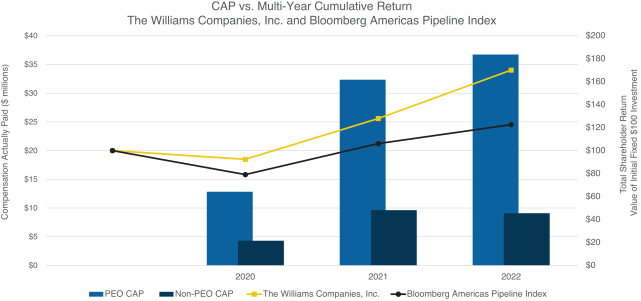
88 |
Executive Compensation Tables and Other Information |
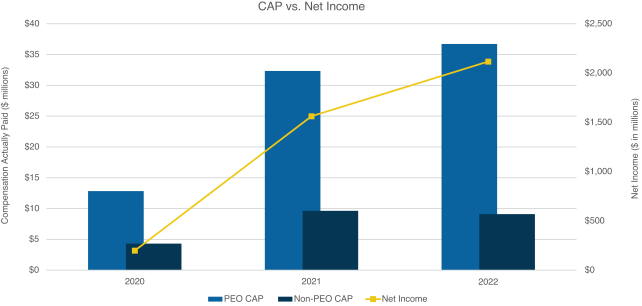
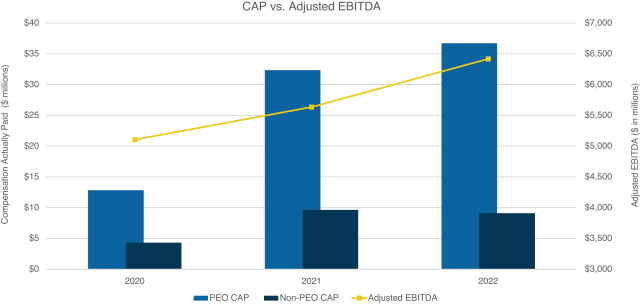
| WILLIAMS COMPANIES | 2023 PROXY STATEMENT | 89 |
Table of Contents
| Executive Compensation Tables and Other Information
|
SECURITIES AUTHORIZED FOR ISSUANCE UNDER EQUITY COMPENSATION PLANS
The following table provides information concerning Williams common stock that may be issued upon the exercise of options, warrants and rights under all of our existing equity compensation plans as of December 31, 2022, including The Williams Companies, Inc. 2007 Incentive Plan and 2007 Employee Stock Purchase Plan.
Plan Category | Number of Securities to be Issued upon Exercise of Outstanding Options, Warrants, and Rights(1) | Weighted-Average Price of Outstanding Options, Warrants, and Rights(2) | Number of Securities Remaining Available for Future Issuance Under Equity Compensation Plans (Excluding Securities Reflected in the First Column of This Table)(3) | ||||||||||||
Equity Compensation plans approved by security holders |
| 10,147,107 | $ | 34.32 |
| 16,242,232 | |||||||||
Equity Compensation plans not approved by security holders |
| — |
| — |
| — | |||||||||
Total |
| 10,147,107 | $ | 34.32 |
| 16,242,232 | |||||||||
(1) Includes 7,383,652 shares of RSUs, all of which were approved by security holders.
(2) Excludes the shares issuable upon the vesting of RSUs included in the first column of this table for which there is no weighted-average price.
(3) Includes 1,159,749 shares remaining to be issued out of the 2007 Employee Stock Purchase Plan.

Williams outpaced the industry in key sustainability rankings in 2022, validating the emphasis Williams places on reducing emissions, maintaining strong corporate governance, and providing metrics that highlight our focus on serving the long-term shareholder.
| 90 |
Table of Contents
|
| SECURITY OWNERSHIP OF CERTAIN BENEFICIAL OWNERS AND MANAGEMENT |
The following table sets forth information known to us concerning beneficial owners of more than five percent of our common stock as of February 24, 2023. Unless otherwise indicated, the persons named have sole voting and investment power with respect to the shares listed.
Title of Class | Name and Address of Beneficial Owner | Number of Shares of Common Stock | Percent of Class(1) | |||||||||
Common Stock | The Vanguard Group(2) |
| 127,907,931 |
| 10.49 | % | ||||||
Common Stock | BlackRock, Inc.(3) |
| 120,886,311 |
| 9.92 | % | ||||||
Common Stock | State Street Corporation(4) |
| 87,606,614 |
| 7.19 | % | ||||||
(1) Ownership percentage is reported based on 1,218,811,795 shares of common stock outstanding on February 24, 2023.
(2) According to a Schedule 13G/A filed with the SEC on February 9, 2023, The Vanguard Group, an investment advisor, may beneficially own the shares of common stock listed in the above table . The Vanguard 13G/A indicates that The Vanguard Group may have sole voting power over 0 shares of our common stock, sole dispositive power over 122,323,868 shares of our common stock, shared voting power over 2,244,843 shares of our common stock, and shared dispositive power over 5,584,063 shares of our common stock.
(3) According to a Schedule 13G/A filed with the SEC on January 30, 2023, Blackrock, Inc., an investment management corporation, may beneficially own the shares of common stock listed in the above table. The 13G/A indicates that BlackRock, Inc. may have sole voting power over 110,124,139 shares of common stock and sole dispositive power over 120,886,311 shares of our common stock.
(4) According to a Schedule 13G/A filed with the SEC on February 7, 2023, State Street Corporation, an investment management corporation, may beneficially own the shares of common stock listed in the above table. The 13G/A indicates that State Street Corporation may have shared voting power over 75,893,576 shares of our common stock and shared dispositive power over 87,580,239 shares of our common stock.
| WILLIAMS COMPANIES | 2023 PROXY STATEMENT | 91 |
Table of Contents
| Security Ownership of Certain Beneficial Owners and Management
|
The following table sets forth, as of February 24, 2023, the number of shares of our common stock beneficially owned by each of our directors and nominees for directors, the NEOs and all directors and executive officers as a group.
Name of Beneficial Owner | Shares of Williams Common Stock Owned Directly or Indirectly | Williams Shares Underlying Stock Option(1) | Williams Shares Underlying RSUs(2) | Total Shares Beneficially Owned | Percent of Class(3) | ||||||||||||||||||||||||
Alan S. Armstrong(4) |
| 1,603,525 |
| 852,118 |
| 544,390 |
| 3,000,033 | * | ||||||||||||||||||||
Stephen W. Bergstrom |
| 44,150 |
| 0 |
| 110,615 |
| 154,765 | * | ||||||||||||||||||||
Michael A. Creel(5) |
| 67,225 |
| 0 |
| 47,456 |
| 114,681 | * | ||||||||||||||||||||
Stacey H. Doré |
| 0 |
| 0 |
| 16,570 |
| 16,570 | * | ||||||||||||||||||||
Carri A. Lockhart |
| 0 |
| 0 |
| 0 |
| 0 | * | ||||||||||||||||||||
Richard E. Muncrief |
| 0 |
| 0 |
| 6,163 |
| 6,163 | * | ||||||||||||||||||||
Peter A. Ragauss |
| 3,428 |
| 0 |
| 42,140 |
| 45,568 | * | ||||||||||||||||||||
Rose M. Robeson |
| 0 |
| 0 |
| 17,554 |
| 17,554 | * | ||||||||||||||||||||
Scott D. Sheffield |
| 4,144 |
| 0 |
| 47,456 |
| 51,600 | * | ||||||||||||||||||||
Murray D. Smith(6) |
| 19,998 |
| 0 |
| 71,934 |
| 91,932 | * | ||||||||||||||||||||
William H. Spence |
| 10,500 |
| 0 |
| 53,462 |
| 63,962 | * | ||||||||||||||||||||
Jesse J. Tyson |
| 560 |
| 0 |
| 6,163 |
| 6,723 | * | ||||||||||||||||||||
Micheal G. Dunn |
| 437,811 |
| 189,866 |
| 150,042 |
| 777,719 | * | ||||||||||||||||||||
John D. Porter |
| 26,034 |
| 15,219 |
| 0 |
| 41,253 | * | ||||||||||||||||||||
T. Lane Wilson |
| 173,237 |
| 928 |
| 68,326 |
| 242,491 | * | ||||||||||||||||||||
Chad J. Zamarin |
| 344,836 |
| 80,029 |
| 18,787 |
| 443,652 | * | ||||||||||||||||||||
Directors and executive officers as a group (21 persons) |
| 3,008,750 |
| 1,142,533 |
| 1,201,058 |
| 5,352,341 | * | ||||||||||||||||||||
* Less than 1%
(1) The SEC deems a person to have beneficial ownership of all shares that the person has the right to acquire within 60 days. Amounts reflect shares that may be acquired upon the exercise of stock options granted under Williams equity plan that are currently exercisable, will become exercisable, or would become exercisable upon the voluntary retirement of such person within 60 days of February 24, 2023.
(2) The SEC deems a person to have beneficial ownership of all shares that the person has the right to acquire within 60 days. Amounts reflect shares that would be acquired upon the vesting of restricted stock units (“RSUs”) granted under Williams current or previous equity plans that will vest or that would vest upon the voluntary retirement of such person, within 60 days of February 24, 2023. RSUs have no voting or investment power.
(3) Ownership percentage is reported based on 1,218,811,795 shares of common stock outstanding on February 24, 2023, plus, as to the holder thereof only and no other person, the number of shares (if any) that the person has the right to acquire as of February 24, 2023, or within 60 days from the date, through the exercise of all options and other rights.
(4) Includes 34,264 shares held in the Alan and Shelly Armstrong Family Foundation dated December 16, 2015, Alan S. And Shelly S. Armstrong, Trustees.
(5) Includes 52,500 shares held in the B and B Living Trust dated February 2, 2021, Michael A. and Kathy R. Creel, Trustees.
(6) Includes 10,515 shares held by Murray D. Smith and Associates Limited dated January 1, 2012.
| 92 |
Table of Contents
| Security Ownership of Certain Beneficial Owners and Management
|
DELINQUENT SECTION 16(a) REPORTS
Section 16(a) of the Securities Exchange Act of 1934 requires the Company’s officers and directors, and persons who own more than ten percent of a registered class of the Company’s equity securities, to file reports with the SEC disclosing the amount and nature of their beneficial ownership in common stock, as well as changes in that ownership. Based solely on our review of reports filed with the SEC, or written representations received by the Company, the Company believes that for the year ended December 31, 2022, all required reports were timely filed with the exception of one Form 4 filed for Mary Hausman, our Vice President and Chief Accounting Officer. The Company inadvertently omitted this transaction, which was a disposition of shares withheld to cover taxes. The transaction was reported in her year-end report on Form 5, which was timely filed.
| WILLIAMS COMPANIES | 2023 PROXY STATEMENT | 93 |
Table of Contents
QUESTIONS AND ANSWERS |
ABOUT THE ANNUAL MEETING |
AND VOTING |
Q: WHY AM I RECEIVING THESE MATERIALS?
A: These materials are being made available to you because, at the close of business on February 24, 2023 (the “Record Date”), you owned shares of Williams common stock. Accordingly, our Board has made these materials available to you in connection with the Board’s solicitation of proxies for use at our Annual Meeting to be held virtually on Tuesday, April 25, 2023, at 2 p.m., Central Daylight Time. All stockholders of record on the Record Date are entitled to attend the Annual Meeting and are requested to vote on the items of business described in this proxy statement.
Q: WHY DID I RECEIVE A NOTICE IN THE MAIL REGARDING THE INTERNET AVAILABILITY OF PROXY MATERIALS INSTEAD OF A FULL SET OF PRINTED PROXY MATERIALS?
A: As permitted by SEC rules, we are providing access to our Notice of Internet Availability of Proxy Materials (“Notice”), our 2022 Annual Report, and this proxy statement (collectively the “proxy materials”) over the Internet through the notice and access process. Commencing on or about March 16, 2023, we sent the proxy materials or Notice to most of our stockholders. The Notice provides instructions for how to access the proxy materials on the Internet and how to request a printed set of the proxy materials. If you are requesting printed materials, you must submit your request by April 14, 2023. We encourage you to take advantage of the availability of the proxy materials on the Internet to help reduce the environmental impact and cost of the Annual Meeting. Stockholders may request to receive future proxy materials in printed or electronic form by calling 1-800-884-4225 or by accessing their account at www.computershare.com/investor.
Q: WHEN IS THE ANNUAL MEETING AND HOW CAN I ATTEND AND PARTICIPATE?
A: The Annual Meeting will be a completely virtual meeting conducted by live, audio webcast and will begin promptly on Tuesday, April 25, 2023, at 2 p.m., Central Daylight Time. We encourage you to access the meeting prior to the start time.
To attend the Annual Meeting, access the Internet and go to the following site: www.meetnow.global/MN2VXTR.
| • | If you are (i) a stockholder of record or (ii) a beneficial holder who has obtained a control number from Computershare (each of (i) and (ii) is a “Voting Eligible Party”), then select “Join Meeting Now,” enter your control number located on the Notice of Internet Availability of Proxy Materials, your proxy card, or received from Computershare and enter your first and last name and your email address. |
| • | If you are not a Voting Eligible Party, select “Guest,” enter your first and last name, and enter your email address. |
| • | To listen to the Annual Meeting, click on the broadcast bar (example shown below). |

If you are a Voting Eligible Party, you may participate in the Annual Meeting as follows:
| • | To cast a vote during the Annual Meeting, click on the “Vote” bar (example shown below). |

| • | To submit a comment or question during the Annual Meeting, click on the “Q&A” bar (example shown below). |

Please note that while all stockholders may attend the Annual Meeting, only Voting Eligible Parties may participate by asking questions and voting. If you are a beneficial holder and desire to obtain a control number from Computershare so that you can vote your shares at the Annual Meeting, please see the additional information under “I am a Beneficial Holder who wishes to vote during the Annual Meeting. What must I do to obtain a control number from Computershare and vote at the Annual Meeting?”
| 94 |
Table of Contents
| Questions And Answers About the Annual Meeting and Voting
|
Q: WHY IS THE ANNUAL MEETING BEING HELD IN A VIRTUAL-ONLY FORMAT?
A: The Board has determined to hold this year’s Annual Meeting virtually via live, audio webcast. We believe that a virtual annual meeting will provide expanded access, improved communication, and cost savings. We also believe that hosting a virtual annual meeting will enable more of our stockholders to attend and participate in the meeting because our stockholders can participate from any location with Internet access.
Q: WHAT TECHNICAL SUPPORT IS AVAILABLE PRIOR TO AND DURING THE ANNUAL MEETING?
A: The virtual meeting platform used to host the Annual Meeting is fully supported across browsers (MS Edge, Firefox, Chrome, and Safari) and devices (desktops, laptops, tablets, and cell phones) running the most up-to-date version of applicable software and plugins. Note: Internet Explorer is not a supported browser. Attendees should ensure that they have a strong Wi-Fi connection. We encourage you to access the Annual Meeting prior to the start time.
Once an attendee has accessed the Annual Meeting, if technical assistance is needed, please call 1-888-724-2416 for local assistance or 781-575-2748 for international assistance.
Q: HOW CAN I OBTAIN ELECTRONIC ACCESS TO THE PROXY MATERIALS?
A: Copies of the proxy materials are available for viewing at www.edocumentview.com/wmb.
Q: WILL STOCKHOLDERS HAVE AN OPPORTUNITY TO ASK QUESTIONS DURING THE ANNUAL MEETING?
A: Yes. A Voting Eligible Party may log in to the Annual Meeting by following the process described above under “When is the Annual Meeting and how can I attend and participate?” and submit a question.
Our Corporate Secretary will review all submitted comments or questions prior to being read aloud at the Annual Meeting. If our Corporate Secretary determines that a comment or question is improper for the orderly conduct of the Annual Meeting, then such comment or question will not be addressed at the Annual Meeting. In general, we will consider a comment or question improper if:
| • | It is not pertinent to the Company, the business conducted at the Annual Meeting, and all stockholders generally; |
| • | Is derogatory or related to a personal matter or grievance; or |
| • | It relates to pending or threatened litigation. |
To be in proper form, comments and questions must comply with the Annual Meeting Rules of Conduct that are available on the Annual Meeting site by clicking on the “Documents” tab (example shown below).

Questions must be succinct and cover only one topic per question. To allow us to answer questions from as many stockholders as possible, we will limit each stockholder to two questions. In addition, the maximum time for answering questions will be 15 minutes. We will make the questions and answers from the Annual Meeting accessible to all stockholders under the Investor Relation tab on the Company’s website.
| WILLIAMS COMPANIES | 2023 PROXY STATEMENT | 95 |
Table of Contents
| Questions And Answers About the Annual Meeting and Voting
|
Q: HOW DO I VOTE IF I AM A STOCKHOLDER OF RECORD?
A:
| By Internet | You may vote via the Internet at the following site: www.envisionreports.com/wmb. If you received a Notice, please follow the instructions found in the Notice. If you received printed copies of the proxy materials by mail, please follow the instructions on your proxy card. The Internet voting facilities for stockholders of record will be available 24 hours a day, seven days a week, until the polls close on April 25, 2023. | |
| By Telephone | Call toll-free 1-800-652-VOTE (8683) in the United States or Canada any time on a touch-tone telephone. Follow the instructions provided by the recorded message. The telephone voting facilities for stockholders of record will be available 24 hours a day, seven days a week, until the polls close on April 25, 2023. | |
| By Mobile Device | Scan the QR Code on your Proxy Card. | |
| By Mail | If you received a printed version of the proxy materials, you may vote by completing, signing, and dating the proxy card and returning it in the postage-paid envelop we have provided. If you vote by telephone or the Internet, please DO NOT mail back the proxy card. | |
| At the Annual Meeting | Once you have accessed the Annual Meeting, you may vote by clicking on the “Vote” tab. Doing so will take you to Computershare’s InvestorVote site where you will enter and submit your control number to access voting for the business brought before the Annual Meeting. | |
Q: WHAT BUSINESS WILL BE CONDUCTED AT THE ANNUAL MEETING, AND HOW DOES THE BOARD RECOMMEND THAT I VOTE?
A:
| Proposal | Board Recommendation | Page No. | ||||
| 1 | Elect 12 director nominees for a one-year term. | FOR each nominee | 8 | |||
| 2 | Ratify the selection of Ernst & Young LLP as the Company’s independent registered public accounting firm for the fiscal year ending December 31, 2023. | FOR | 47 | |||
| 3 | Approve, on an advisory basis, the compensation of our named executive officers. | FOR | 50 | |||
| 4 | Approve, on an advisory basis, the frequency of future advisory votes to approve the compensation of our named executive officers. | EVERY YEAR | 51 | |||
| 5 | Transact such other business as may properly come before the Annual Meeting or any adjournments or postponements thereof. |
|
| |||
You may vote FOR or AGAINST or indicate that you wish to ABSTAIN from voting for each director nominee, the appointment of Ernst & Young LLP as our independent auditors, or the advisory vote on executive compensation. You may vote “Every Year,” Every Two Years,” “Every Three Years” or indicate that you wish to ABSTAIN from the advisory vote on the frequency of future advisory votes on executive compensation. We are not aware of any matters to
be presented at the Annual Meeting that are not included in this proxy statement. However, your proxy authorizes the person named on the proxy card to take action on additional matters that may properly arise. These individuals will exercise their best judgment to vote on any other matter, including a question of adjourning the Annual Meeting. All votes are confidential unless disclosure is legally necessary.
| 96 |
Table of Contents
| Questions And Answers About the Annual Meeting and Voting
|
Q: WHAT IS THE VOTING REQUIREMENT TO APPROVE EACH PROPOSAL?
A:
| Proposal | Voting Requirements | Abstentions & Broker Non-Votes | ||||
| 1 | Elect 12 director nominees for a one-year term. | The director nominees receiving a majority of the votes cast FOR their election will be elected. | Abstentions and broker non-votes, if any, are not counted as votes cast and will have no effect on the outcome of this proposal. | |||
| 2 | Ratify the selection of Ernst & Young LLP as the Company’s independent registered public accounting firm for the fiscal year ending December 31, 2023. | To be approved by the stockholders, this proposal must receive the FOR vote of a majority of the votes cast. The results of this vote are not binding on the Board, whether or not the resolution is passed under these voting standards. | Abstentions and broker non-votes, if any, are not counted as votes cast and will have no effect on the outcome of this proposal. | |||
| 3 | Approve, on an advisory basis, the compensation of our named executive officers. | To be approved by the stockholders, this proposal must receive the FOR vote of a majority of the votes cast. The results of this vote are not binding on the Board, whether or not the resolution is passed under these voting standards. | Abstentions and broker non-votes, if any, are not counted as votes cast and will have no effect on the outcome of this proposal. | |||
| 4 | Approve, on an advisory basis, the frequency of future advisory votes to approve the compensation of our named executive officers. | To be approved by the stockholders, the frequency option (“Every Year,” Every Two Years,” “Every Three Years”) must receive the FOR vote of a majority of the votes cast. If none of the alternatives receives a majority of the votes cast, then the alternative receiving a plurality of the votes case will be deemed the preferred alternative of our stockholders. The results of this vote are not binding on the Board, whether or not the resolution is passed under these voting standards. | Abstentions and broker non-votes, if any, are not counted as votes cast and will have no effect on the outcome of this proposal. | |||
Other matters that may properly come before the Annual Meeting may require more than a majority vote pursuant to our By-laws, our Restated Certificate of Incorporation, Delaware law, or other applicable laws. Broker non-votes (i.e., shares held by brokers or nominees that cannot be voted because the beneficial owner did not provide specific voting instructions) will not be treated as a vote cast for any matter.
| WILLIAMS COMPANIES | 2023 PROXY STATEMENT | 97 |
Table of Contents
| Questions And Answers About the Annual Meeting and Voting
|
Q: WHAT IS THE DIFFERENCE BETWEEN A STOCKHOLDER OF RECORD AND A BENEFICIAL HOLDER?
A: If, as of the close of the business on the Record Date, your shares were registered in your name with our transfer agent, Computershare, then you are a stockholder of record, and the Notice or printed copies of our proxy materials were sent to you directly by Computershare.
If, as of the Record Date, you were not holding shares in your name but rather you were holding shares in an account at a broker, bank, or other nominee, then you are a beneficial holder, and your shares are held in street name. The stockholder of record for your shares, meaning the party who has the legal right to vote such shares at the Annual Meeting, is your broker, bank, or such other nominee. As the beneficial holder of the shares, the Notice or printed copies of the proxy materials were forwarded to you by your broker, bank, or other nominee and you have the right to direct such party to vote your shares. Such party should have provided you with instructions for directing it how to vote your shares. The Company urges you to instruct your broker, bank, or other nominee on how to vote your shares. As a beneficial holder, you may attend the Annual Meeting. However, since you are not the stockholder of record, you may not vote your shares at the Annual Meeting unless you request and obtain a valid proxy from the broker, bank, or other nominee. Please see “I am a Beneficial Holder who wishes to vote during the Annual Meeting. What must I do to obtain a control number from Computershare and vote at the Annual Meeting?” Please understand that, if you are a beneficial holder, the Company does not know that you are a stockholder or how many shares you own.
Q: HOW DO I VOTE IF I AM A BENEFICIAL HOLDER?
A: As a beneficial holder, you have the right to direct your broker, bank, or other nominee how to vote your shares by following the instructions sent to you by such party. You will receive proxy materials and voting instructions for each account you have with a broker, bank, or other nominee. If you wish to change the direction you provided your broker, bank, or other nominee, you should follow the instructions sent to you by such party. As a beneficial holder, you may attend the Annual Meeting. However, since you are not the stockholder of record, you may not vote your shares at the Annual Meeting unless you obtain a signed legal proxy from your broker, bank, or other nominee giving you the right to vote the shares.
Q: I AM A BENEFICIAL HOLDER WHO WISHES TO VOTE DURING THE ANNUAL MEETING. WHAT MUST I DO TO OBTAIN A CONTROL NUMBER FROM COMPUTERSHARE AND VOTE AT THE ANNUAL MEETING?
A: If you are a beneficial holder who wishes to vote during the Annual Meeting, you must register with Computershare and obtain a control number. Please note that banks, brokers, and other nominees typically provide their own control numbers to their account holders. These are not the same as a Computershare generated control number. A Computershare generated control number is required to be used to participate and vote at the Annual Meeting. To obtain a Computershare generated control number, you must submit proof to Computershare of your proxy power (“Legal Proxy”), which may be obtained from your broker, bank, or other nominee, and reflecting your Williams holdings along with your name and email address.
Requests to obtain a control number as set forth above must be labeled as “Legal Proxy” and be received no later than 4:00 p.m., Central Daylight Time, on April 20, 2023. You will receive a confirmation of your registration by email after Computershare receives your registrations materials. Requests for registration should be directed to the following:
By email:
Forward the email from your broker, bank, or other nominee granting you a Legal Proxy, or attach an image of your Legal Proxy, to: legalproxy@computershare.com.
By mail:
Computershare
The Williams Companies, Inc. Legal Proxy
P.O. Box 43006
Providence, RI 02940-3006
Once you obtain a control number from Computershare, you may participate and vote at the Annual Meeting. Please see the detailed instructions contained in “When is the Annual Meeting and how can I attend and participate?” Once you have accessed the Annual Meeting, you may vote by clicking on the “Vote” tab. Doing so will take you to Computershare’s InvestorVote site where you will enter and submit your control number to access voting for the business brought before the Annual Meeting.
| 98 |
Table of Contents
| Questions And Answers About the Annual Meeting and Voting
|
Q: AS A BENEFICIAL HOLDER, WILL MY SHARES HELD IN STREET NAME BE VOTED IF I DO NOT TELL MY BROKER, BANK, OR OTHER NOMINEE HOW I WANT THEM VOTED?
A: Pursuant to the New York Stock Exchange Listed Company Manual, if you are a beneficial holder, your broker, bank, or other nominee only has discretion to vote on certain “routine” matters without your voting instructions. The proposal to ratify the appointment of Ernst & Young LLP as our independent registered public accounting firm is considered a routine matter. The election of directors, the advisory vote to approve the compensation of our named executive officers, and the advisory vote on the frequency of future advisory votes to approve the compensation of our named executive officers are not considered routine matters. Accordingly, your broker, bank, or other nominee will not be permitted to vote your shares on such matters unless you provide proper voting instructions.
Q: HOW DO I VOTE IF I PARTICIPATE IN THE WILLIAMS INVESTMENT PLUS PLAN?
A: If you hold shares in The Williams Investment Plus Plan (“Investment Plus Plan”), Computershare sent you the Company’s proxy materials directly. You may direct the trustee of the Investment Plus Plan how to vote your Investment Plus Plan shares by calling the toll-free number shown on the proxy card, voting on the Internet on the website shown on the proxy card, or completing and returning the enclosed proxy cared in the postage-paid envelope. Please note that, to permit the trustee to tally and vote all shares of Williams’ common stock held in the Investment Plus Plan, your instructions, whether by Internet, by telephone, or by proxy card, must be completed and received prior to 1:00 a.m. Central Daylight Time on April 21, 2023. You may not change your vote related to the Investment Plus Plan shares after this deadline. If you do not instruct the trustee how to vote, your plan shares will be voted by the trustee in the same proportion that it votes shares in other plan accounts for which it did receive timely voting instructions. The proportional voting policy is detailed under the terms of the Investment Plus Plan and the trust agreement.
Q: WHAT SHARES ARE INCLUDED ON MY PROXY CARD?
A: If you receive printed copies of the proxy materials by mail, you will receive one proxy card for all shares of Williams’ common stock which you hold as a stockholder of record and in The Williams Investment Plus Plan. If you are a beneficial holder, you will receive voting instructions for each account you have with a broker, bank, or other nominee.
Q: WHAT IF I RETURN MY PROXY CARD BUT DO NOT SPECIFY HOW I WANT TO VOTE?
A: If you are a stockholder of record and sign and return the proxy card or complete the Internet or telephone voting procedures, but do not specify how you want to vote your shares, we will vote them as follows:
| • | FOR the election of each of the director nominees. |
| • | FOR the ratification of the appointment of Ernst & Young LLP as our independent registered public accounting firm for the fiscal year ending December 31, 2023. |
| • | FOR the approval, on an advisory basis, of the Company’s compensation of its named executive officers. |
| • | for EVERY YEAR, on an advisory basis, as the frequency of future advisory votes, to approve the compensation of the name executive officers. |
Q: CAN I CHANGE MY VOTE OR REVOKE MY PROXY?
A: If you are a stockholder of record, you can change your vote within the regular voting deadlines by voting again by telephone or on the Internet, executing and returning a later dated proxy card, or virtually attending the Annual Meeting and voting online. If you are a stockholder of record, you can revoke your proxy by delivering a written notice of your revocation to our Corporate Secretary at One Williams Center, MD 47, Tulsa, Oklahoma 74172.
Q: HOW MANY VOTES DO I HAVE?
A: Each stockholder will have one vote on each matter for every share of common stock owned on the Record Date. No shares have cumulative voting rights. On the Record Date, we had 1,218,811,795 shares of common stock outstanding. The shares held in our treasury are not considered outstanding and will not be voted or considered present at the Annual Meeting. Our Series B Preferred Stock does not have voting rights.
Q: WHO WILL COUNT THE VOTES?
A: A Computershare representative will serve as the inspector of elections and count the votes.
| WILLIAMS COMPANIES | 2023 PROXY STATEMENT | 99 |
Table of Contents
| Questions And Answers About the Annual Meeting and Voting
|
Q: WHAT IS THE QUORUM REQUIREMENT FOR THE ANNUAL MEETING FOR STOCKHOLDERS?
A: There must be a quorum to take action at the Annual Meeting (other than adjournment or postponement of the meeting). A quorum will exist if stockholders of record holding a majority of the shares entitled to vote at the meeting are present in person or by proxy. Abstentions are counted as “present” for determining a quorum. Uninstructed broker votes, also called “broker non-votes,” are also counted as “present” for determining a quorum if a broker may vote on at least one matter without specific instructions from a beneficial holder. See “As a beneficial holder, will my shares held in street name be voted if I do not tell my broker, bank, or other nominee how I want them voted?”.
Q: WHO IS PAYING FOR THIS PROXY SOLICITATION?
A: The Company pays all costs to solicit proxies on behalf of the Board and prepare, print, and distribute this proxy statement. Solicitations of proxies are being made through the mail and may also be made in person, by telephone, or by other electronic means by directors, director nominees, and employees of the Company. The Company requests brokers, banks, and other nominees forward soliciting materials to the beneficial holders of Company stock held of record by such persons, and the Company will reimburse them for their reasonable forwarding expenses. In addition, the Company has retained OKAPI Partners LLC (“OKAPI”), to assist with proxy solicitation. We anticipate that we will pay OKAPI a fee of approximately $16,000 plus reasonable expenses for these services.
Q: ARE YOU “HOUSEHOLDING” FOR STOCKHOLDERS OF RECORD SHARING THE SAME ADDRESS?
A: Yes. For those stockholders who elect to receive printed materials, the SEC’s rules permit us to deliver a single copy of this proxy statement, our 2022 Annual Report, and the Notice, as applicable, to an address shared by two or more stockholders. This method of delivery is referred to as “householding” and can significantly reduce our printing and mailing costs. It also reduces the volume of mail you receive. We will deliver only one proxy statement, our 2022 Annual Report, and the Notice, as applicable to multiple registered stockholders sharing an address, unless we receive instructions to the contrary from one or more of the stockholders. We will still send each stockholder who receives a printed version of these proxy materials an individual proxy card. If you would like to receive more than one copy of the proxy materials, you can call Computershare toll free at 1-800-884-4225 or write to Computer Share Investor Services at P.O. Box 43006, Providence, Rhode Island 02940-3006. You can use the same phone number or mailing address to notify us that you wish to receive a separate proxy statement, annual report, and the Notice, as applicable, in the future, or to request delivery of a single copy of any materials if you are receiving multiple copies now.
Q: WHERE CAN I FIND THE VOTING RESULTS OF THE ANNUAL MEETING?
A: We will announce the voting results at the Annual Meeting. We also will disclose the voting results in a current report on Form 8-K within four business days after the Annual Meeting.
Q: HOW CAN I COMMUNICATE WITH THE BOARD OF DIRECTORS?
A: Any stockholder or other interested party may communicate with our independent non-management directors, individually or as a group, by contacting our Corporate Secretary or Board Chair. The contact information is maintained through the Investors page on our website, www.williams.com, and is as follows:
The Williams Companies, Inc. One Williams Center, MD 49 Tulsa, Oklahoma 74172 Attn: Board Chair | The Williams Companies, Inc. One Williams Center, MD 47 Tulsa, Oklahoma 74172 Attn: Corporate Secretary | |
| 100 |
Table of Contents
| Questions And Answers About the Annual Meeting and Voting
|
Q: MAY I SUBMIT A PROPOSAL OR NOMINATE A DIRECTOR CANDIDATE FOR CONSIDERATION AT THE 2024 ANNUAL MEETING OF STOCKHOLDERS?
A:
Rule 14a-8 Stockholder Proposals. For your proposal to be considered for inclusion in our proxy statement for the 2024 annual meeting of stockholders in accordance with Rule 14a-8 under the Exchange Act, we must receive your proposal no later than November 17, 2023. Your proposal, including the manner in which you submit it, must comply with the eligibility, procedural, and all other requirements of Rule 14a-8.
Other Stockholder Proposals. If you wish to bring business before our 2024 annual meeting of stockholders other than through a stockholder proposal submitted pursuant to the SEC’s Rule 14a-8, we must receive a notice of the proposal, in proper written form as specified in our By-laws, no earlier than the close of business on December 27, 2023, and no later than the close of business on January 26, 2024. Your submission must meet the requirements set forth in our By-laws.
Stockholder Recommendations. Stockholders may recommend a candidate for consideration by the Governance and Sustainability Committee, by sending the candidate’s name and a detailed description of the candidate’s qualifications, a document indicating the candidate’s willingness to serve, and evidence of stock ownership to: The Williams Companies, Inc., One Williams Center, MD 47, Tulsa, Oklahoma 74172, Attn: Corporate Secretary.
Stockholder Nominations. Our By-laws also provide that a stockholder may nominate director candidates for election if the stockholder is a stockholder of record (1) when making a nomination and (2) on the record date for the determination of the stockholders entitled to vote at such annual meeting of stockholders. The stockholder must also satisfy the procedures provided in the By-laws, including providing notice of a nomination in proper written form. Our Corporate Secretary must receive the notice at our principal executive offices not later than the close of business on the 90th calendar day, nor earlier than the close of business on the
120th calendar day, prior to the anniversary of the date of the immediately preceding annual meeting of stockholders. To be timely for our 2024 annual meeting of stockholders, our Corporate Secretary must receive notices not earlier than December 27, 2023, and not later than January 26, 2024.
Proxy Access. Our By-laws contain a “proxy access” provision allowing stockholders to include in our proxy materials information regarding director candidates nominated by stockholders in certain circumstances. Under the proxy access option, our Corporate Secretary must receive the notice at our principal executive offices not later than the close of business on the 120th calendar day, nor earlier than the close of business on the 150th calendar day, prior to the anniversary of the date (as stated in our proxy materials) the definitive proxy statement was first released to stockholders in connection with the preceding year’s annual meeting of stockholders. For our 2024 annual meeting of stockholders, our Corporate Secretary must receive such notice not earlier than October 18, 2023, and not later than November 17, 2023.
Universal Proxy Cards. In addition to satisfying the deadlines in the advance notice provisions of our By-laws for stockholder nominations, a stockholder who intends to solicit proxies in support of nominees submitted under these advance notice provisions must provide the notice required under Rule 14a-19 of the Securities Exchange Act of 1934, as amended (the “Exchange Act”) to our Corporate Secretary no later than sixty days prior to the one-year anniversary of the previous annual meeting of stockholders. To be timely for our 2024 annual meeting of stockholders, our Corporate Secretary must receive such notice no later than February 26, 2024.
The above-described notice and procedures are summaries and are not complete. For further information, please refer to our By-laws, which are included as an exhibit to our annual report on Form 10-K filed with the SEC and available on our website at www.williams.com. All notices of proposals or director nominations should be addressed to our Corporate Secretary at One Williams Center, MD 47, Tulsa, Oklahoma, Oklahoma 74172.
| WILLIAMS COMPANIES | 2023 PROXY STATEMENT | 101 |
Table of Contents
| Questions And Answers About the Annual Meeting and Voting
|
Incorporation by Reference, Website Access to Reports, and Other Information
INCORPORATION BY REFERENCE
The Compensation and Management Development Committee Report on Executive Compensation and the Audit Committee Report are not deemed filed with the SEC and shall not be deemed incorporated by reference into any prior or future filings made by Williams under the Securities Act of 1933 or the Exchange Act, except to the extent that Williams specifically incorporates such information by reference. In addition, the website addresses contained in the proxy statement are intended to provide inactive, textual reference only. The information on these websites and in the Sustainability Report and Diversity and Inclusion Report referenced herein are not part of and shall not be deemed incorporated by reference into this proxy statement.
WEBSITE ACCESS TO REPORTS AND OTHER INFORMATION
We file our annual report on Form 10-K, quarterly reports on Form 10-Q, current reports on Form 8-K, proxy statements, and other documents electronically with the SEC under the Exchange Act. You may obtain such reports from the SEC’s website at www.sec.gov.
Our website is www.williams.com. We make available, free of charge through the Investors page of our website, our annual report on Form 10-K, quarterly reports on Form 10-Q, current reports on Form 8-K, proxy statements and amendments to those reports filed or furnished pursuant to Section 13(a) or 15(d) of the Exchange Act as soon as reasonably practicable after we electronically file such materials with, or furnish it to, the SEC. Our Corporate Governance Guidelines, Board committee charters, and the Williams Code of Business Conduct are also available on our website. We will provide, free of charge, a copy of any of our corporate documents listed above upon written request to our Corporate Secretary at Williams, One Williams Center, MD 47, Tulsa, Oklahoma 74172.
By Order of the Board of Directors,

Robert E. Riley, Jr.
Vice President and Assistant General
Counsel – Corporate Secretary and
Corporate Strategic Development
Tulsa, Oklahoma
March 16, 2023
| 102 |
Table of Contents
| APPENDIX | ||
NON-GAAP RECONCILIATIONS
The accompanying materials may include certain financial measures — Adjusted EBITDA, adjusted income (“earnings”), adjusted earnings per share, and available funds from operations — that are non-GAAP financial measures as defined under the rules of the SEC.
Our segment performance measure, Modified EBITDA, is defined as net income (loss) before income (loss) from discontinued operations, income tax expense, net interest expense, equity earnings from equity-method investments, other net investing income, impairments of equity investments and goodwill, depreciation and amortization expense, and accretion expense associated with asset retirement obligations for nonregulated operations. We also add our proportional ownership share (based on ownership interest) of Modified EBITDA of equity-method investments.
Adjusted EBITDA further excludes items of income or loss that we characterize as unrepresentative of our ongoing operations. Such items are also excluded from net income to determine adjusted income and adjusted earnings per share. Management believes these measures provide investors meaningful insight into results from ongoing operations.
Available funds from operations is defined as cash flow from operations excluding the effect of changes in working capital and certain other changes in noncurrent assets and liabilities, reduced by preferred dividends and net distributions to noncontrolling interests.
These materials are accompanied by a reconciliation of these non-GAAP financial measures to their nearest GAAP financial measures. Management uses these financial measures because they are accepted financial indicators used by investors to compare company performance. In addition, management believes that these measures provide investors an enhanced perspective of the operating performance of assets and the cash that the business is generating.
Neither Adjusted EBITDA, adjusted income, nor available funds from operations are intended to represent cash flows for the period, nor are they presented as an alternative to net income or cash flow from operations. They should not be considered in isolation or as substitutes for a measure of performance prepared in accordance with United States generally accepted accounting principles.
| WILLIAMS COMPANIES | 2022 PROXY STATEMENT | 103 |
Table of Contents
| Appendix
|
RECONCILIATION OF INCOME (LOSS) ATTRIBUTABLE TO THE WILLIAMS COMPANIES, INC. TO NON-GAAP ADJUSTED INCOME
(UNAUDITED)
| 2020 | 2021 | 2022 | ||||||||||
(Dollars in millions, except per-share amounts) | Year | Year | Year | |||||||||
Income (loss) attributable to The Williams Companies, Inc. available to common stockholders | $ | 208 | $ | 1,514 | $ | 2,046 | ||||||
Income (loss)—diluted earnings (loss) per common share | $ | 0.17 | $ | 1.24 | $ | 1.67 | ||||||
Adjustments: |
|
|
|
|
|
|
|
|
| |||
Transmission & Gulf of Mexico |
|
|
|
|
|
|
|
|
| |||
Impairment of certain assets | $ | 170 |
| $ | 2 |
| $ | — |
| |||
Northeast Supply Enhancement project development costs |
| 6 |
|
| — |
|
| — |
| |||
Pension plan settlement charge |
| 5 |
|
| — |
|
| — |
| |||
Adjustment of Transco’s regulatory asset for post-WPZ Merger state deferred income tax change consistent with filed rate case |
| 2 |
|
| — |
|
| — |
| |||
Benefit of change in employee benefit policy |
| (22 | ) |
| — |
|
| — |
| |||
Reversal of costs capitalized in prior periods |
| 11 |
|
| — |
|
| — |
| |||
Severance and related costs |
| 1 |
|
| — |
|
| — |
| |||
Regulatory liability charges associated with decrease in Transco’s estimated deferred state income tax rate |
| — |
|
| — |
|
| 15 |
| |||
Loss related to Eminence storage cavern abandonments and monitoring |
| — |
|
| — |
|
| 31 |
| |||
Total Transmission & Gulf of Mexico adjustments |
| 173 |
|
| 2 |
|
| 46 |
| |||
Northeast G&P |
|
|
|
|
|
|
|
|
| |||
Share of impairment of certain assets at equity-method investments |
| 47 |
|
| — |
|
| — |
| |||
Share of early debt retirement gain at equity-method investment |
| (5 | ) |
| — |
|
| — |
| |||
Impairment of certain assets |
| 12 |
|
| — |
|
| — |
| |||
Pension plan settlement charge |
| 1 |
|
| — |
|
| — |
| |||
Benefit of change in employee benefit policy |
| (9 | ) |
| — |
|
| — |
| |||
Total Northeast G&P adjustments |
| 46 |
|
| — |
|
| — |
| |||
West |
|
|
|
|
|
|
|
|
| |||
Trace acquisition costs |
| — |
|
| — |
|
| 8 |
| |||
Pension plan settlement charge |
| 1 |
|
| — |
|
| — |
| |||
Benefit of change in employee benefit policy |
| (9 | ) |
| — |
|
| — |
| |||
Total West adjustments |
| (8 | ) |
| — |
|
| 8 |
| |||
Gas & NGL Marketing Services |
|
|
|
|
|
|
|
|
| |||
Amortization of purchase accounting inventory fair value adjustment |
| — |
|
| 18 |
|
| 15 |
| |||
Impact of volatility on NGL linefill transactions(1) |
| — |
|
| — |
|
| 9 |
| |||
Net unrealized (gain) loss from derivative instruments |
| — |
|
| 106 |
|
| 274 |
| |||
Total Gas & NGL Marketing Services adjustments |
| — |
|
| 124 |
|
| 298 |
| |||
| WILLIAMS COMPANIES | 2023 PROXY STATEMENT | A-1 |
Table of Contents
| Appendix
|
RECONCILIATION OF INCOME (LOSS) ATTRIBUTABLE TO THE WILLIAMS COMPANIES, INC. TO NON-GAAP ADJUSTED INCOME
(UNAUDITED)
| 2020 | 2021 | 2022 | ||||||||||
(Dollars in millions, except per-share amounts) | Year | Year | Year | |||||||||
Other |
|
|
|
|
|
|
|
|
| |||
Regulatory liability charge associated with decrease in Transco’s estimated deferred state income tax rate |
| — |
|
| — |
|
| 5 |
| |||
Expenses associated with Sequent acquisition and transition |
| — |
|
| 5 |
|
| — |
| |||
Net unrealized (gain) loss from derivative instruments |
| — |
|
| — |
|
| (25 | ) | |||
Accrual for loss contingencies |
| 24 |
|
| 10 |
|
| 11 |
| |||
Regulatory asset reversals from impaired projects |
| 15 |
|
| — |
|
| — |
| |||
Reversal of costs capitalized in prior periods |
| 3 |
|
| — |
|
| — |
| |||
Pension plan settlement charge |
| 1 |
|
| — |
|
| — |
| |||
Total Other adjustments |
| 43 |
|
| 15 |
|
| (9 | ) | |||
Adjustments included in Modified EBITDA |
| 254 |
|
| 141 |
|
| 343 |
| |||
Adjustments below Modified EBITDA |
|
|
|
|
|
|
|
|
| |||
Accelerated depreciation for decommissioning assets |
| — |
|
| 33 |
|
| — |
| |||
Amortization of intangible assets from Sequent acquisition |
| — |
|
| 18 |
|
| 167 |
| |||
Impairment of equity-method investments |
| 1,046 |
|
| — |
|
| — |
| |||
Impairment of goodwill(2) |
| 187 |
|
| — |
|
| — |
| |||
Share of impairment of goodwill at equity-method investment |
| 78 |
|
| — |
|
| — |
| |||
Depreciation adjustment related to Eminence storage cavern abandonments |
| — |
|
| — |
|
| (1 | ) | |||
Allocation of adjustments to noncontrolling interests |
| (65 | ) |
| — |
|
| — |
| |||
|
|
| 1,246 |
|
| 51 |
|
| 166 |
| |||
Total adjustments |
| 1,500 |
|
| 192 |
|
| 509 |
| |||
Less tax effect for above items |
| (375 | ) |
| (48 | ) |
| (124 | ) | |||
Adjustments for tax-related items(3) |
| — |
|
| — |
|
| (203 | ) | |||
Adjusted income available to common stockholders | $ | 1,333 |
| $ | 1,658 |
| $ | 2,228 |
| |||
Adjusted income—diluted earnings per common share | $ | 1.10 |
| $ | 1.36 |
| $ | 1.82 |
| |||
Weighted-average shares—diluted (thousands) | 1,215,165 | 1,218,215 | 1,222,672 | |||||||||
(1) Had this adjustment been made in 2020 and 2021, the Gas & NGL Marketing segment would have included adjustments of $7 and ($34), respectively. This would have had no impact on the 2020 Adjusted income—diluted earnings per common share and would have reduced 2021 by $0.02.
(2) Our partner’s $65 million share of the first-quarter 2020 impairment of goodwill is reflected below in Allocation of adjustments to noncontrolling interests.
(3) 2022 includes ($134) unfavorable adjustment for the reversal of valuation allowance due to the expected utilization of certain deferred income tax assets and previously unrecognized tax benefits from the resolution of certain federal income tax audits. 2022 also includes a ($69) unfavorable adjustment to reverse the net benefit primarily associated with a significant decrease in our estimated deferred state income tax rate, partially offset by an unfavorable revision to a state net operating loss carryforward.
| A-2 |
Table of Contents
| Appendix
|
RECONCILIATION OF “NET INCOME (LOSS)” TO “MODIFIED EBITDA” AND NON-GAAP “ADJUSTED EBITDA”
(UNAUDITED)
| 2020 | 2021 | 2022 | ||||||||||
(Dollars in millions) | Year | Year | Year | |||||||||
Net income (loss) | $ | 198 |
| $ | 1,562 |
| $ | 2,117 |
| |||
Provision (benefit) for income taxes |
| 79 |
|
| 511 |
|
| 425 |
| |||
Interest expense |
| 1,172 |
|
| 1,179 |
|
| 1,147 |
| |||
Equity (earnings) losses |
| (328 | ) |
| (608 | ) |
| (637 | ) | |||
Impairment of goodwill |
| 187 |
|
| — |
|
| — |
| |||
Impairment of equity-method investments |
| 1,046 |
|
| — |
|
| — |
| |||
Other investing (income) loss - net |
| (8 | ) |
| (7 | ) |
| (16 | ) | |||
Proportional Modified EBITDA of equity-method investments |
| 749 |
|
| 970 |
|
| 979 |
| |||
Depreciation and amortization expenses |
| 1,721 |
|
| 1,842 |
|
| 2,009 |
| |||
Accretion expense associated with asset retirement obligations for nonregulated operations |
| 35 |
|
| 45 |
|
| 51 |
| |||
Modified EBITDA | $ | 4,851 | $ | 5,494 | $ | 6,075 | ||||||
Transmission & Gulf of Mexico | $ | 2,379 |
| $ | 2,621 |
| $ | 2,674 |
| |||
Northeast G&P |
| 1,489 |
|
| 1,712 |
|
| 1,796 |
| |||
West |
| 947 |
|
| 961 |
|
| 1,211 |
| |||
Gas & NGL Marketing Services |
| 51 |
|
| 22 |
|
| (40 | ) | |||
Other |
| (15 | ) |
| 178 |
|
| 434 |
| |||
Total Modified EBITDA | $ | 4,851 | $ | 5,494 | $ | 6,075 | ||||||
Adjustments(1): |
|
|
|
|
|
|
|
|
| |||
Transmission & Gulf of Mexico | $ | 173 |
| $ | 2 |
| $ | 46 |
| |||
Northeast G&P |
| 46 |
|
| — |
|
| — |
| |||
West |
| (8 | ) |
| — |
|
| 8 |
| |||
Gas & NGL Marketing Services(2) |
| — |
|
| 124 |
|
| 298 |
| |||
Other |
| 43 |
|
| 15 |
|
| (9 | ) | |||
Total Adjustments | $ | 254 |
| $ | 141 |
| $ | 343 |
| |||
Adjusted EBITDA: |
|
|
|
|
|
|
|
|
| |||
Transmission & Gulf of Mexico | $ | 2,552 |
| $ | 2,623 |
| $ | 2,720 |
| |||
Northeast G&P |
| 1,535 |
|
| 1,712 |
|
| 1,796 |
| |||
West |
| 939 |
|
| 961 |
|
| 1,219 |
| |||
Gas & NGL Marketing Services |
| 51 |
|
| 146 |
|
| 258 |
| |||
Other |
| 28 |
|
| 193 |
|
| 425 |
| |||
Total Adjusted EBITDA | $ | 5,105 |
| $ | 5,635 |
| $ | 6,418 |
| |||
(1) Adjustments by segment are detailed in the “Reconciliation of Income (Loss) Attributable to The Williams Companies, Inc. to Non-GAAP Adjusted Income,” which is also included in these materials.
(2) 2022 Adjustments for Gas & NGL Marketing Services includes the impact of volatility on NGL linefill transactions. Had this adjustment been made in 2020 and 2021, the Gas & NGL Marketing segment adjustments would have increased (decreased) by $7 and ($34), respectively.
| WILLIAMS COMPANIES | 2023 PROXY STATEMENT | A-3 |
Table of Contents
| Appendix
|
RECONCILIATION OF CASH FLOW FROM OPERATING ACTIVITIES TO AVAILABLE FUNDS FROM OPERATIONS (AFFO)
(UNAUDITED)
| 2020 | 2021 | 2022 | ||||||||||
(Dollars in millions, except coverage ratios) | Year | Year | Year | |||||||||
The Williams Companies, Inc. |
|
|
|
|
|
|
|
|
| |||
Reconciliation of GAAP “Net cash provided (used) by operating activities” to Non-GAAP “Available funds from operations” |
|
|
|
|
|
|
|
|
| |||
Net cash provided (used) by operating activities | $ | 3,496 |
| $ | 3,945 |
| $ | 4,889 |
| |||
Exclude: Cash (provided) used by changes in: |
|
|
|
|
|
|
|
|
| |||
Accounts receivable |
| 2 |
|
| 545 |
|
| 733 |
| |||
Inventories, including write-downs |
| 11 |
|
| 124 |
|
| (51 | ) | |||
Other current assets and deferred charges |
| (11 | ) |
| 63 |
|
| 33 |
| |||
Accounts payable |
| 7 |
|
| (643 | ) |
| (410 | ) | |||
Accrued and other current liabilities |
| 309 |
|
| (58 | ) |
| (209 | ) | |||
Changes in current and noncurrent derivative assets and liabilities |
| 4 |
|
| 277 |
|
| (94 | ) | |||
Other, including changes in noncurrent assets and liabilities |
| 1 |
|
| 1 |
|
| 216 |
| |||
Preferred dividends paid |
| (3 | ) |
| (3 | ) |
| (3 | ) | |||
Dividends and distributions paid to noncontrolling interests |
| (185 | ) |
| (187 | ) |
| (204 | ) | |||
Contributions from noncontrolling interests |
| 7 |
|
| 9 |
|
| 18 |
| |||
Available funds from operations | $ | 3,638 |
| $ | 4,073 |
| $ | 4,918 |
| |||
Common dividends paid | $ | 1,941 |
| $ | 1,992 |
| $ | 2,071 |
| |||
Coverage ratio: |
|
|
|
|
|
|
|
|
| |||
Available funds from operations divided by Common dividends paid |
| 1.87 |
|
| 2.04 |
|
| 2.37 |
| |||
| A-4 |
Table of Contents

Table of Contents
1 U P X 01—Alan S. Armstrong 04—Stacey H. Doré 07—Peter A. Ragauss For Against Abstain 10—Murray D. Smith 02—Stephen W. Bergstrom 05—Carri A. Lockhart 08—Rose M. Robeson For Against Abstain 11—William H. Spence 03—Michael A. Creel 06—Richard E. Muncrief 09—Scott D. Sheffield For Against Abstain 12—Jesse J. Tyson 4. Approve, on an advisory basis, the frequency of future advisory votes to approve the compensation of the Company’s named executive officers. Every Two Years Every Three Years Every Abstain Year Using a black ink pen, mark your votes with an X as shown in this example. Please do not write outside the designated areas. 03R2HE + + A Proposals — The Board of Directors recommend a vote “FOR” the election of each of the nominees listed below. 2. Ratify the selection of Ernst & Young LLP as the Company’s independent registered public accounting firm for the fiscal year ending December 31, 2023. 3. Approve, on an advisory basis, the compensation of our named executive officers. 1. Elect 12 director nominees for a one-year term. For Against Abstain q IF VOTING BY MAIL, SIGN, DETACH AND RETURN THE BOTTOM PORTION IN THE ENCLOSED ENVELOPE.q 2023 Annual Meeting Proxy Card The Board of Directors recommends a vote “FOR” proposals 2 and 3 and One Year for proposal 4. For Against Abstain 000004 MR A SAMPLE DESIGNATION (IF ANY) ADD 1 ADD 2 ADD 3 ADD 4 ADD 5 ADD 6 ENDORSEMENTLINE SACKPACK 1234 5678 9012 345 MMMMMMMMM MMMMMMMMMMMMMMM 5 6 6 2 3 4 MR A SAMPLE (THIS AREA IS SET UP TO ACCOMMODATE 140 CHARACTERS) MR A SAMPLE AND MR A SAMPLE AND MR A SAMPLE AND MR A SAMPLE AND MR A SAMPLE AND MR A SAMPLE AND MR A SAMPLE AND MR A SAMPLE AND C 1234567890 J N T C123456789 MMMMMMMMMMMM M MMMMMMM 000000000.000000 ext 000000000.000000 ext 000000000.000000 ext 000000000.000000 ext 000000000.000000 ext 000000000.000000 ext If no electronic voting, delete QR code and control # Δ â‰^ You may vote online or by phone instead of mailing this card. Online Go to www.envisionreports.com/wmb or scan the QR code — login details are located in the shaded bar below. Save paper, time and money! Sign up for electronic delivery at www.envisionreports.com/wmb Phone Call toll free 1-800-652-VOTE (8683) within the USA, US territories and Canada Participants in the Williams Investment Plus Plan must submit their vote by April 21, 2023 at 1:00 a.m. Central Daylight Time. Your vote matters – here’s how to vote!
Table of Contents
Small steps make an impact. Help the environment by consenting to receive electronic delivery, sign up at www.envisionreports.com/wmb Notice of 2023 Annual Meeting of Stockholders Proxy Solicited by Board of Directors for Annual Meeting — April 25, 2023 Alan S. Armstrong, Micheal G. Dunn, and T. Lane Wilson, (the “Proxies”) or any of them, each with the power of substitution, are hereby authorized to represent and vote the shares of the undersigned, with all the powers which the undersigned would possess if personally present, at the Annual Meeting of Stockholders of The Williams Companies, Inc. to be held on April 25, 2023 or at any postponement or adjournment thereof. Shares represented by this proxy will be voted as indicated by the stockholder. If no such directions are indicated, the Proxies will have authority to vote FOR the election of the Board of Directors, FOR items 2 and 3 and One Year for item 4. In their discretion, the Proxies are authorized to vote upon such other business as may properly come before the meeting. (Items to be voted appear on reverse side) The Williams Companies, Inc. q IF VOTING BY MAIL, SIGN, DETACH AND RETURN THE BOTTOM PORTION IN THE ENCLOSED ENVELOPE.q Change of Address — Please print new address below. Comments — Please print your comments below. C Non-Voting Items + + Please sign exactly as name(s) appears hereon. Joint owners should each sign. When signing as attorney, executor, administrator, corporate officer, trustee, guardian, or custodian, please give full title. Date (mm/dd/yyyy) — Please print date below. Signature 1 — Please keep signature within the box. Signature 2 — Please keep signature within the box. B Authorized Signatures — This section must be completed for your vote to count. Please date and sign below. The 2023 Annual Meeting of Stockholders of The Williams Companies, Inc. will be held on April 25, 2023 at 2:00pm CDT, conducted online via live webcast at www.meetnow.global/MN2VXTR. To access the virtual meeting, you must have the information that is printed in the shaded bar located on the reverse side of this form. Important notice regarding the Internet availability of proxy materials for the 2023 Annual Meeting of Stockholders. The 2022 Annual Report, which includes a copy of our annual report on Form 10-K for the fiscal year ended December 31, 2022, the Notice, and the 2023 Proxy Statement are available at: www.envisionreports.com/wmb