
Link to searchable text of slide shown above
Link to searchable text of slide shown above
Link to searchable text of slide shown above

Link to searchable text of slide shown above
Link to searchable text of slide shown above
Link to searchable text of slide shown above

Link to searchable text of slide shown above
Link to searchable text of slide shown above

Link to searchable text of slide shown above
Link to searchable text of slide shown above
Link to searchable text of slide shown above
Link to searchable text of slide shown above
Link to searchable text of slide shown above
Link to searchable text of slide shown above
Link to searchable text of slide shown above
Link to searchable text of slide shown above

Link to searchable text of slide shown above
Link to searchable text of slide shown above

Link to searchable text of slide shown above

Link to searchable text of slide shown above
Searchable text section of graphics shown above
IMPERIAL TOBACCO GROUP PLC
INTERIM REPORT 2003

CONTINUED
GROWTH…
[GRAPHIC]
IMPERIAL TOBACCO IS THE WORLD’S FOURTH LARGEST INTERNATIONAL TOBACCO COMPANY which manufactures and markets a range of cigarettes, tobaccos, rolling papers and cigars.
01 |
| OUR STRATEGY |
02 |
| CHAIRMAN’S STATEMENT |
06 |
| CAUTIONARY STATEMENT |
06 |
| INDEPENDENT REVIEW REPORT TO IMPERIAL TOBACCO GROUP PLC |
07 |
| CONSOLIDATED PROFIT AND LOSS ACCOUNT |
07 |
| STATEMENT OF TOTAL RECOGNISED GAINS AND LOSSES |
08 |
| CONSOLIDATED BALANCE SHEET |
09 |
| SUMMARY CONSOLIDATED CASH FLOW STATEMENT |
10 |
| NOTES TO THE INTERIM STATEMENT |
13 |
| SUMMARY OF DIFFERENCES BETWEEN UK AND US GENERALLY ACCEPTED ACCOUNTING PRINCIPLES (“GAAP”) |
16 |
| SHAREHOLDER INFORMATION |
Our Strategy
IMPERIAL TOBACCO’S BUSINESS STRATEGY IS TO CREATE SUSTAINABLE SHAREHOLDER VALUE BY GROWING OUR INTERNATIONAL OPERATIONS, BOTH ORGANICALLY AND THROUGH ACQUISITION, WHILE CONTINUING TO STRENGTHEN OUR HOME MARKET POSITIONS IN THE UK AND GERMANY.
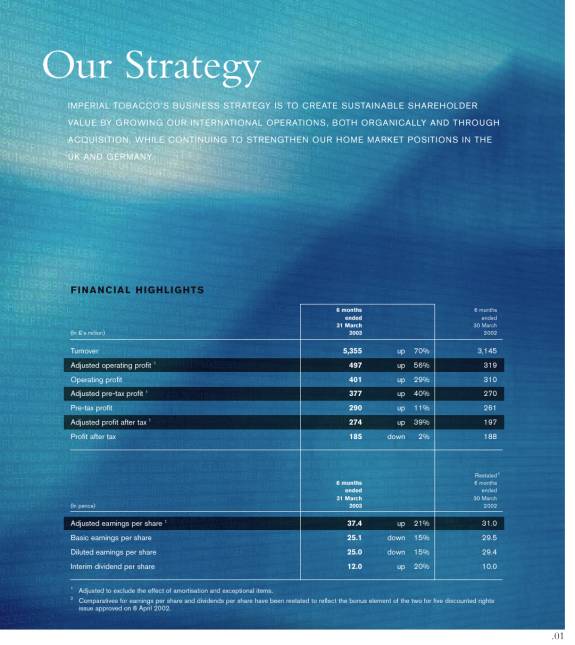
FINANCIAL HIGHLIGHTS
(In £’s million) |
| 6 months |
|
|
|
|
| 6 months |
|
|
|
|
|
|
|
|
|
|
|
Turnover |
| 5,355 |
| up |
| 70 | % | 3,145 |
|
Adjusted operating profit(1) |
| 497 |
| up |
| 56 | % | 319 |
|
Operating profit |
| 401 |
| up |
| 29 | % | 310 |
|
Adjusted pre-tax profit(1) |
| 377 |
| up |
| 40 | % | 270 |
|
Pre-tax profit |
| 290 |
| up |
| 11 | % | 261 |
|
Adjusted profit after tax(1) |
| 274 |
| up |
| 39 | % | 197 |
|
Profit after tax |
| 185 |
| down |
| 2 | % | 188 |
|
|
|
|
|
|
|
|
|
|
|
(In pence) |
| 6 months |
|
|
|
|
| Restated(2) |
|
|
|
|
|
|
|
|
|
|
|
Adjusted earnings per share(1) |
| 37.4 |
| up |
| 21 | % | 31.0 |
|
Basic earnings per share |
| 25.1 |
| down |
| 15 | % | 29.5 |
|
Diluted earnings per share |
| 25.0 |
| down |
| 15 | % | 29.4 |
|
Interim dividend per share |
| 12.0 |
| up |
| 20 | % | 10.0 |
|
(1) Adjusted to exclude the effect of amortisation and exceptional items.
(2) Comparatives for earnings per share and dividends per share have been restated to reflect the bonus element of the two for five discounted rights issue approved on 8 April 2002.
1
[GRAPHIC]
CHAIRMAN’S STATEMENT
Imperial Tobacco has again achieved record interim pre-tax profits, demonstrating the successful acquisition and integration of Reemtsma and the Group’s continued ability to deliver sustained profitable growth.
Adjusted operating profit in the half year to 31 March 2003 was £497m, up 56% on 2002, with turnover excluding duty up 89% to £1,503m. These results reflect progressive underlying trading trends, enhanced by six months contribution from Reemtsma (2002: nil), together with delivery of £45m of synergies in the first half. Group adjusted operating margins of 33% showed a decrease on 2002 from 40%, prior to the acquisition of Reemtsma, but already show a significant uplift on the proforma 29% margin of the enlarged group, highlighted at the time of acquisition.
Exchange movements in the first half of 2003 compared to 2002 have had a negligible effect on the total Group adjusted profit delivery, but have had an impact on some of the trading regions as mentioned in the segmental reports.
Adjusted profit before tax increased by 40% to £377m, after charging net interest of £120m (2002:£49m).The increase in interest charge is due mainly to the funding of the Reemtsma acquisition, offset by cash flow from operations.
In addition, profit has also been affected by £96m amortisation (2002: £9m), increased as a result of the Reemtsma acquisition, and £9m exceptional gain on the sale of the Dublin factory site. Of the £81m provision carried forward in respect of the integration of Reemtsma, £28m has been utilised in the period.
These results, after tax and minority interests, have delivered basic earnings per share of 25.1p (2002:29.5p) and adjusted earnings per share of 37.4p, an increase of 21% on 2002 (31.0p).
Your Directors have therefore declared a 20% increase (after adjusting for the bonus element of the rights issue) in the interim dividend to 12.0p per share, reflecting this half year’s encouraging performance.
The Group continues to deliver a high level of underlying cash conversion. In the half year to March 2003 the Group experienced the normal seasonal movement in UK debtors from their September lows to a more representative level. Also impacting the cash flow was the payment of an additional periodic VAT instalment which fell on the last day of March and the cash outflows associated with the utilisation of the integration provision noted above. These factors, combined with a significant exchange translation movement on net debt (£331m), have resulted in an increase in net debt to £4.3bn as at 31 March 2003.
2
[GRAPHICS]
|
| Turnover ex. Duty |
| Adjusted |
| Adjusted |
| ||||||||
|
| Half |
| Half |
| Half |
| Half |
| Half |
| Half |
| Proforma |
|
|
| £m |
| £m |
| £m |
| £m |
| % |
| % |
| % |
|
UK |
| 359 |
| 364 |
| 177 |
| 188 |
| 49.3 |
| 51.6 |
| 50 |
|
Germany |
| 298 |
| 33 |
| 102 |
| 6 |
| 34.2 |
| 18.2 |
| 25 |
|
Rest of Western Europe |
| 286 |
| 213 |
| 130 |
| 95 |
| 45.5 |
| 44.6 |
| 37 |
|
Rest of the World |
| 560 |
| 187 |
| 88 |
| 30 |
| 15.7 |
| 16.0 |
| 15 |
|
Total |
| 1,503 |
| 797 |
| 497 |
| 319 |
| 33.1 |
| 40.0 |
| 29 |
|
(1) Results, before amortisation and exceptional items, presented in the new regional format. Prior year numbers restated to reflect a change in the basis of overhead allocation.
(2) Proforma enlarged Group margins are based on the first half results for 2002 plus an estimated six months of Reemtsma and are in line with the proforma margin highlighted at the time of the Reemtsma acquisition.
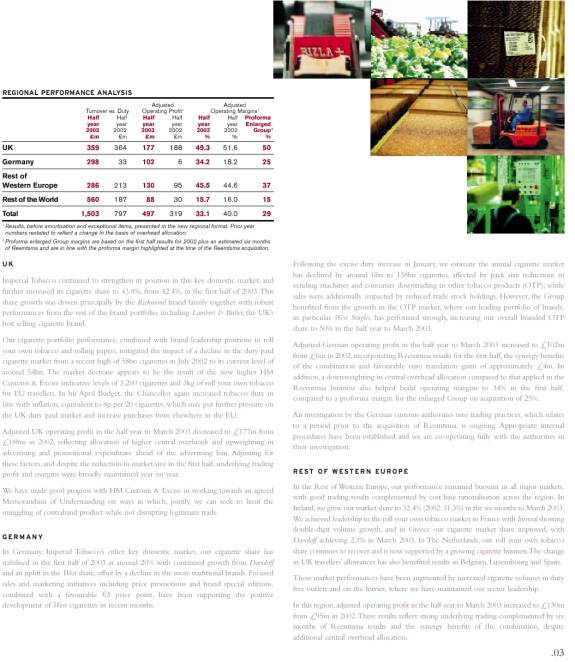
UK
Imperial Tobacco continued to strengthen its position in this key domestic market, and further increased its cigarette share to 43.8%, from 42.4%, in the first half of 2003. This share growth was driven principally by the Richmond brand family together with robust performances from the rest of the brand portfolio, including Lambert & Butler, the UK’s best selling cigarette brand.
Our cigarette portfolio performance, combined with brand leadership positions in roll your own tobacco and rolling papers, mitigated the impact of a decline in the duty paid cigarette market from a recent high of 58bn cigarettes in July 2002 to its current level of around 54bn. The market decrease appears to be the result of the new higher HM Customs & Excise indicative levels of 3,200 cigarettes and 3kg of roll your own tobacco for EU travellers. In his April Budget, the Chancellor again increased tobacco duty in line with inflation, equivalent to 8p per 20 cigarettes, which may put further pressure on the UK duty paid market and increase purchases from elsewhere in the EU.
Adjusted UK operating profit in the half year to March 2003 decreased to £177m from £188m in 2002, reflecting allocation of higher central overheads and upweighting in advertising and promotional expenditure ahead of the advertising ban. Adjusting for these factors, and despite the reduction in market size in the first half, underlying trading profit and margins were broadly maintained year on year.
We have made good progress with HM Customs & Excise in working towards an agreed Memorandum of Understanding on ways in which, jointly, we can seek to limit the smuggling of contraband product while not disrupting legitimate trade.
GERMANY
In Germany, Imperial Tobacco’s other key domestic market, our cigarette share has stabilised in the first half of 2003 at around 20% with continued growth from Davidoff and an uplift in the West share, offset by a decline in the more traditional brands. Focused sales and marketing initiatives including price promotions and brand special editions, combined with a favourable €3 price point, have been supporting the positive development of West cigarettes in recent months.
Following the excise duty increase in January, we estimate the annual cigarette market has declined by around 6bn to 138bn cigarettes, affected by pack size reductions in vending machines and consumer downtrading to other tobacco products (OTP); while sales were additionally impacted by reduced trade stock holdings. However, the Group benefited from the growth in the OTP market, where our leading portfolio of brands, in particular West Singles, has performed strongly, increasing our overall branded OTP share to 50% in the half year to March 2003.
Adjusted German operating profit in the half year to March 2003 increased to £102m from £6m in 2002, incorporating Reemtsma results for the first half, the synergy benefits of the combination and favourable euro translation gains of approximately £4m. In addition, a downweighting in central overhead allocation compared to that applied in the Reemtsma business also helped build operating margins to 34% in the first half, compared to a proforma margin for the enlarged Group on acquisition of 25%.
An investigation by the German customs authorities into trading practices, which relates to a period prior to the acquisition of Reemtsma, is ongoing. Appropriate internal procedures have been established and we are co-operating fully with the authorities in their investigation.
REST OF WESTERN EUROPE
In the Rest of Western Europe, our performance remained buoyant in all major markets, with good trading results complemented by cost base rationalisation across the region. In Ireland, we grew our market share to 32.4% (2002:31.3%) in the six months to March 2003. We achieved leadership in the roll your own tobacco market in France with Interval showing double-digit volume growth, and in Greece our cigarette market share improved, with Davidoff achieving 2.1% in March 2003. In The Netherlands, our roll your own tobacco share continues to recover and is now supported by a growing cigarette business. The change in UK travellers’ allowances has also benefited results in Belgium, Luxembourg and Spain.
These market performances have been augmented by increased cigarette volumes in duty free outlets and on the ferries, where we have maintained our sector leadership.
In this region, adjusted operating profit in the half year to March 2003 increased to £130m from £95m in 2002. These results reflect strong underlying trading complemented by six months of Reemtsma results and the synergy benefits of the combination, despite additional central overhead allocation.
3
CHAIRMAN'S
STATEMENT
(CONTINUED)
In addition a favourable euro translation gain of approximately £7m has enhanced reported profit. Operating margins have improved slightly to 46% in the first half of 2003 compared with 2002, and significantly against the proforma margin expected following the acquisition of Reemtsma of 37%.
REST OF THE WORLD
Our Central and Eastern European businesses performed robustly with strong growth in our international strategic brand portfolio, particularly West, supported by new brand initiatives including the launch of Route 66 in Poland, the Czech Republic and Slovenia and make your own tobacco products in Hungary.
Our market share in Poland has increased to around 19% although keen price competition has resulted in continued pressure on margins. Russia has seen growth in our international brands achieved through increasing market coverage, while in Ukraine we held our position as market leader.
In Africa, our Nigerian business continued to show strong market share growth, driven by improved distribution. In Madagascar, we saw sustained recovery following market instability last year. Meanwhile in the Ivory Coast, where distribution has been disrupted by the political situation, contingency supply arrangements have helped to mitigate our position, although cigarette volumes were down by 1bn in the first half year. Other markets in West Africa performed well, further enhanced by the recent launch of the West brand in Senegal. In the Middle East, Davidoff showed significant sales growth, up by 46% on the comparable period last year.
Within Asia, the Group’s market share in Taiwan stabilised in the first half at around 12% and by the end of the half year we were seeing share growth again from the Davidoff family, which is responding well to a more focused in-market approach. In Indo-China, our business in Vietnam and Laos performed ahead of expectations in terms of volume, share and profit. In Australia, our key cigarette brand families continued to perform well and results also benefited from our strong position in the growing roll your own tobacco market.
Our duty free business delivered strong volume and market share growth through capitalising on additional distribution achieved for our enhanced brand portfolio but we anticipate some slowdown in the second half of the year due to reduced travel levels, particularly in the Far East.
In the Rest of the World, adjusted operating profit in the half year to March 2003, increased to £88m from £30m in 2002. The results incorporate six months of Reemtsma and reflect encouraging trading performance across the region, despite volatility in some markets. The synergy delivery in the first half, however, has been offset by adverse currency translation losses of approximately £8m and a higher allocation of central overheads. Operating margins nevertheless improved slightly to 16% in the first half of 2003 against proforma margins, including the Reemtsma operations, of 15%.
INTEGRATION OF REEMTSMA
Following the successful conclusion of our negotiations with the works councils in Germany and across Western Europe we have made excellent progress with the integration of Reemtsma. The new organisation structure across the Group is established and fully operational, yielding synergies of £45m in the half year to March 2003 (production and purchasing efficiencies £10m, sales and marketing £22m, corporate and regional overheads £13m). We remain on track to meet our target of £140m in 2003 and at least £170m in 2004.
MANUFACTURING
The Group’s culture of seeking continuous productivity improvements has now been extended to cover all newly acquired manufacturing operations. Our focused and disciplined approach to reducing complexity through rationalisation of brands, packings and blend reductions is in hand. To date it has helped deliver overall productivity improvements of around 3% which are expected to rise significantly in the second half of the year as the full impact of synergy measures and headcount reductions agreed with works councils are implemented. All these measures are set to keep Imperial Tobacco at the forefront of manufacturing excellence.
OUTLOOK
Imperial Tobacco’s continued focus on developing its international business and strengthening its domestic market positions in the UK and Germany, while seeking appropriate acquisitions, has proved a highly effective strategy.
In the second half of the year the trading outlook for the Group continues to be positive, despite pressures in some markets. Our expectations for the full year trading performance as set out in November 2002 are unchanged. Looking further ahead, your Directors consider that the Group’s recently enhanced scale and the growth potential arising from a strengthened brand and market portfolio provide ample opportunity to continue to create significant value for shareholders.
/s/ Derek Bonham |
Derek Bonham |
Chairman |
4
5
All statements, other than statements of historical fact, included herein, are, or may be deemed to be, forward-looking statements within the meaning of section 21E of the Securities Exchange Act 1934, as amended. For a discussion of important factors that could cause actual results to differ materially from those discussed in such forward-looking statements please refer to Imperial Tobacco’s annual report on Form 20-F for the fiscal year ended 28 September 2002, filed with the Securities and Exchange Commission on 14 February 2003.
INDEPENDENT REVIEW REPORT TO
IMPERIAL TOBACCO GROUP PLC
Introduction
We have been instructed by the Company to review the financial information which comprise the consolidated profit and loss account, the statement of total recognised gains and losses, the consolidated balance sheet, the summary consolidated cash flow statement, the notes to the interim statement and the summary of differences between UK and US generally accepted accounting principles. We have read the other information contained in the interim report and considered whether it contains any apparent misstatements or material inconsistencies with the financial information.
Directors’ responsibilities
The interim report, including the financial information contained therein, is the responsibility of, and has been approved by the Directors. The Directors are responsible for preparing the interim report in accordance with the Listing Rules of the Financial Services Authority which require that the accounting policies and presentation applied to the interim figures should be consistent with those applied in preparing the preceding annual accounts except where any changes, and the reasons for them, are disclosed.
Review work performed
We conducted our review in accordance with guidance contained in Bulletin 1999/4 issued by the Auditing Practices Board for use in the United Kingdom. A review consists principally of making enquiries of Group management and applying analytical procedures to the financial information and underlying financial data and, based thereon, assessing whether the accounting policies and presentation have been consistently applied unless otherwise disclosed. A review excludes audit procedures such as tests of controls and verification of assets, liabilities and transactions. It is substantially less in scope than an audit performed in accordance with United Kingdom Auditing Standards and therefore provides a lower level of assurance than an audit. Accordingly we do not express an audit opinion on the financial information. This report has been prepared for and only for the Company for the purpose of the Listing Rules of the Financial Services Authority and for no other purpose. We do not, in producing this report, accept or assume responsibility for any other purpose or to any other person to whom this report is shown or in to whose hands it may come save where expressly agreed by our prior consent in writing.
Review conclusion
On the basis of our review we are not aware of any material modifications that should be made to the financial information as presented for the six months ended 31 March 2003.
PricewaterhouseCoopers LLP
Chartered Accountants
Bristol
6 May 2003
Notes:
(a) The maintenance and integrity of the Imperial Tobacco Group PLC website is the responsibility of the Directors; the work carried out by the auditors does not involve consideration of these matters and, accordingly, the auditors accept no responsibility for any changes that may have occurred to the interim report since it was initially presented on the website.
(b) Legislation in the United Kingdom governing the preparation and dissemination of financial information may differ from legislation in other jurisdictions.
6
CONSOLIDATED PROFIT AND LOSS ACCOUNT
for the six months ended 31 March 2003
(In £’s million) |
| Notes |
| 6 months |
| 6 months |
| Year |
| |
|
|
|
|
|
|
|
|
|
| |
Turnover |
| 2 |
| 5,355 |
| 3,145 |
| 8,296 |
| |
Duty in turnover |
| 2 |
| (3,852 | ) | (2,348 | ) | (6,077 | ) | |
Costs and overheads less other income |
|
|
| (1,102 | ) | (487 | ) | (1,616 | ) | |
|
|
|
|
|
|
|
|
|
| |
Operating profit |
| 2 |
| 401 |
| 310 |
| 603 |
| |
Group operating profit before amortisation and exceptional items |
|
|
| 497 |
| 319 |
| 789 |
| |
Amortisation |
|
|
| (96 | ) | (9 | ) | (83 | ) | |
Exceptional items |
|
|
| — |
| — |
| (103 | ) | |
Profit on disposal of fixed assets |
| 3 |
| 9 |
| — |
| — |
| |
|
|
|
|
|
|
|
|
|
| |
Profit on ordinary activities before interest and taxation |
|
|
| 410 |
| 310 |
| 603 |
| |
Interest and other finance charges |
|
|
| (120 | ) | (49 | ) | (180 | ) | |
Exceptional finance charges |
|
|
| — |
| — |
| (33 | ) | |
Other interest and finance charges |
|
|
| (120 | ) | (49 | ) | (147 | ) | |
Profit on ordinary activities before taxation |
|
|
| 290 |
| 261 |
| 423 |
| |
Taxation |
| 4 |
| (105 | ) | (73 | ) | (140 | ) | |
|
|
|
|
|
|
|
|
|
| |
Profit on ordinary activities after taxation |
|
|
| 185 |
| 188 |
| 283 |
| |
Equity minority interests |
|
|
| (3 | ) | (5 | ) | (11 | ) | |
|
|
|
|
|
|
|
|
|
| |
Profit attributable to shareholders |
|
|
| 182 |
| 183 |
| 272 |
| |
Dividends |
|
|
| (86 | ) | (62 | ) | (229 | ) | |
|
|
|
|
|
|
|
|
|
| |
Retained profit for the period |
|
|
| 96 |
| 121 |
| 43 |
| |
|
|
|
|
|
|
|
|
|
| |
|
|
|
|
|
| Restated |
|
|
| |
Earnings per ordinary share | – Basic |
| 5 |
| 25.1 | p | 29.5 | p | 41.0 | p |
| – Adjusted (before amortisation and exceptional items) |
| 5 |
| 37.4 | p | 31.0 | p | 68.4 | p |
| – Diluted |
| 5 |
| 25.0 | p | 29.4 | p | 40.8 | p |
Dividends per ordinary share | – Interim |
|
|
| 12.0 | p | 10.0 | p |
|
|
| – Total for 2002 |
|
|
|
|
|
|
| 33.0 | p |
The turnover and profit figures above are directly related to continuing operations. There is no difference between the profit as shown above and that calculated on an historical cost basis.
Comparatives for earnings per share and dividends per share for March 2002 have been restated to reflect the bonus element of the two for five discounted rights issue approved on 8 April 2002.
STATEMENT OF TOTAL RECOGNISED GAINS AND LOSSES
for the six months ended 31 March 2003
(In £’s million) |
| 6 months |
| 6 months |
| Year |
|
|
|
|
|
|
|
|
|
Profit attributable to shareholders |
| 182 |
| 183 |
| 272 |
|
Exchange movements on retranslation of net investments and related borrowings |
| 113 |
| (1 | ) | 10 |
|
Taxation credit on unhedged borrowings |
| 6 |
| 2 |
| 2 |
|
|
|
|
|
|
|
|
|
Total recognised gains for the period |
| 301 |
| 184 |
| 284 |
|
7
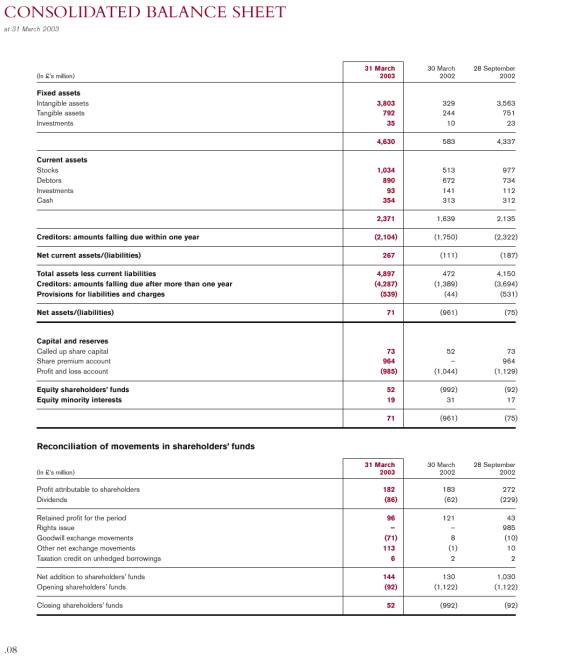
at 31 March 2003
(In £’s million) |
| 31 March |
| 30 March |
| 28 September |
|
|
|
|
|
|
|
|
|
Fixed assets |
|
|
|
|
|
|
|
Intangible assets |
| 3,803 |
| 329 |
| 3,563 |
|
Tangible assets |
| 792 |
| 244 |
| 751 |
|
Investments |
| 35 |
| 10 |
| 23 |
|
|
|
|
|
|
|
|
|
|
| 4,630 |
| 583 |
| 4,337 |
|
|
|
|
|
|
|
|
|
Current assets |
|
|
|
|
|
|
|
Stocks |
| 1,034 |
| 513 |
| 977 |
|
Debtors |
| 890 |
| 672 |
| 734 |
|
Investments |
| 93 |
| 141 |
| 112 |
|
Cash |
| 354 |
| 313 |
| 312 |
|
|
|
|
|
|
|
|
|
|
| 2,371 |
| 1,639 |
| 2,135 |
|
|
|
|
|
|
|
|
|
Creditors: amounts falling due within one year |
| (2,104 | ) | (1,750 | ) | (2,322 | ) |
|
|
|
|
|
|
|
|
Net current assets/(liabilities) |
| 267 |
| (111 | ) | (187 | ) |
|
|
|
|
|
|
|
|
Total assets less current liabilities |
| 4,897 |
| 472 |
| 4,150 |
|
Creditors: amounts falling due after more than one year |
| (4,287 | ) | (1,389 | ) | (3,694 | ) |
Provisions for liabilities and charges |
| (539 | ) | (44 | ) | (531 | ) |
|
|
|
|
|
|
|
|
Net assets/(liabilities) |
| 71 |
| (961 | ) | (75 | ) |
|
|
|
|
|
|
|
|
Capital and reserves |
|
|
|
|
|
|
|
Called up share capital |
| 73 |
| 52 |
| 73 |
|
Share premium account |
| 964 |
| — |
| 964 |
|
Profit and loss account |
| (985 | ) | (1,044 | ) | (1,129 | ) |
|
|
|
|
|
|
|
|
Equity shareholders’ funds |
| 52 |
| (992 | ) | (92 | ) |
Equity minority interests |
| 19 |
| 31 |
| 17 |
|
|
|
|
|
|
|
|
|
|
| 71 |
| (961 | ) | (75 | ) |
Reconciliation of movements in shareholders’ funds
(In £’s million) |
| 31 March |
| 30 March |
| 28 September |
|
|
|
|
|
|
|
|
|
Profit attributable to shareholders |
| 182 |
| 183 |
| 272 |
|
Dividends |
| (86 | ) | (62 | ) | (229 | ) |
|
|
|
|
|
|
|
|
Retained profit for the period |
| 96 |
| 121 |
| 43 |
|
Rights issue |
| — |
| — |
| 985 |
|
Goodwill exchange movements |
| (71 | ) | 8 |
| (10 | ) |
Other net exchange movements |
| 113 |
| (1 | ) | 10 |
|
Taxation credit on unhedged borrowings |
| 6 |
| 2 |
| 2 |
|
|
|
|
|
|
|
|
|
Net addition to shareholders’ funds |
| 144 |
| 130 |
| 1,030 |
|
Opening shareholders’ funds |
| (92 | ) | (1,122 | ) | (1,122 | ) |
|
|
|
|
|
|
|
|
Closing shareholders’ funds |
| 52 |
| (992 | ) | (92 | ) |
8
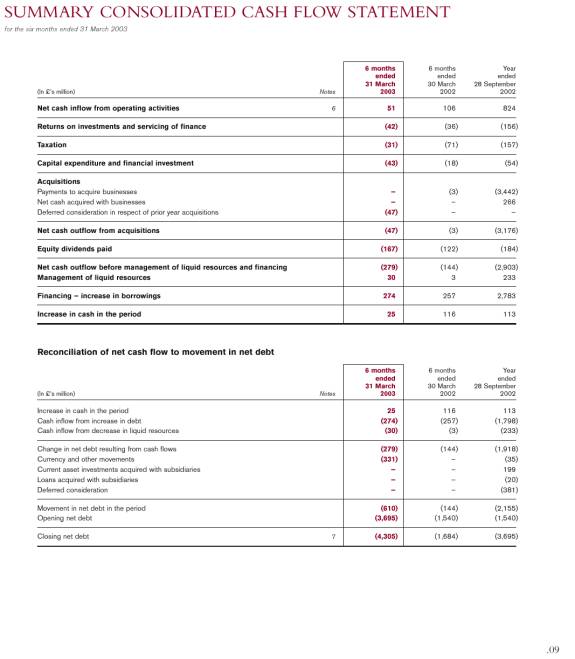
SUMMARY CONSOLIDATED CASH FLOW STATEMENT
for the six months ended 31 March 2003
(In £’s million) |
| Notes |
| 6 months |
| 6 months |
| Year |
|
|
|
|
|
|
|
|
|
|
|
Net cash inflow from operating activities |
| 6 |
| 51 |
| 106 |
| 824 |
|
|
|
|
|
|
|
|
|
|
|
Returns on investments and servicing of finance |
|
|
| (42 | ) | (36 | ) | (156 | ) |
|
|
|
|
|
|
|
|
|
|
Taxation |
|
|
| (31 | ) | (71 | ) | (157 | ) |
|
|
|
|
|
|
|
|
|
|
Capital expenditure and financial investment |
|
|
| (43 | ) | (18 | ) | (54 | ) |
|
|
|
|
|
|
|
|
|
|
Acquisitions |
|
|
|
|
|
|
|
|
|
Payments to acquire businesses |
|
|
| — |
| (3 | ) | (3,442 | ) |
Net cash acquired with businesses |
|
|
| — |
| — |
| 266 |
|
Deferred consideration in respect of prior year acquisitions |
|
|
| (47 | ) | — |
| — |
|
|
|
|
|
|
|
|
|
|
|
Net cash outflow from acquisitions |
|
|
| (47 | ) | (3 | ) | (3,176 | ) |
|
|
|
|
|
|
|
|
|
|
Equity dividends paid |
|
|
| (167 | ) | (122 | ) | (184 | ) |
|
|
|
|
|
|
|
|
|
|
Net cash outflow before management of liquid resources and financing |
|
|
| (279 | ) | (144 | ) | (2,903 | ) |
Management of liquid resources |
|
|
| 30 |
| 3 |
| 233 |
|
|
|
|
|
|
|
|
|
|
|
Financing – increase in borrowings |
|
|
| 274 |
| 257 |
| 2,783 |
|
|
|
|
|
|
|
|
|
|
|
Increase in cash in the period |
|
|
| 25 |
| 116 |
| 113 |
|
Reconciliation of net cash flow to movement in net debt
(In £’s million) |
| Notes |
| 6 months |
| 6 months |
| Year |
|
|
|
|
|
|
|
|
|
|
|
Increase in cash in the period |
|
|
| 25 |
| 116 |
| 113 |
|
Cash inflow from increase in debt |
|
|
| (274 | ) | (257 | ) | (1,798 | ) |
Cash inflow from decrease in liquid resources |
|
|
| (30 | ) | (3 | ) | (233 | ) |
|
|
|
|
|
|
|
|
|
|
Change in net debt resulting from cash flows |
|
|
| (279 | ) | (144 | ) | (1,918 | ) |
Currency and other movements |
|
|
| (331 | ) | — |
| (35 | ) |
Current asset investments acquired with subsidiaries |
|
|
| — |
| — |
| 199 |
|
Loans acquired with subsidiaries |
|
|
| — |
| — |
| (20 | ) |
Deferred consideration |
|
|
| — |
| — |
| (381 | ) |
|
|
|
|
|
|
|
|
|
|
Movement in net debt in the period |
|
|
| (610 | ) | (144 | ) | (2,155 | ) |
Opening net debt |
|
|
| (3,695 | ) | (1,540 | ) | (1,540 | ) |
|
|
|
|
|
|
|
|
|
|
Closing net debt |
| 7 |
| (4,305 | ) | (1,684 | ) | (3,695 | ) |
9
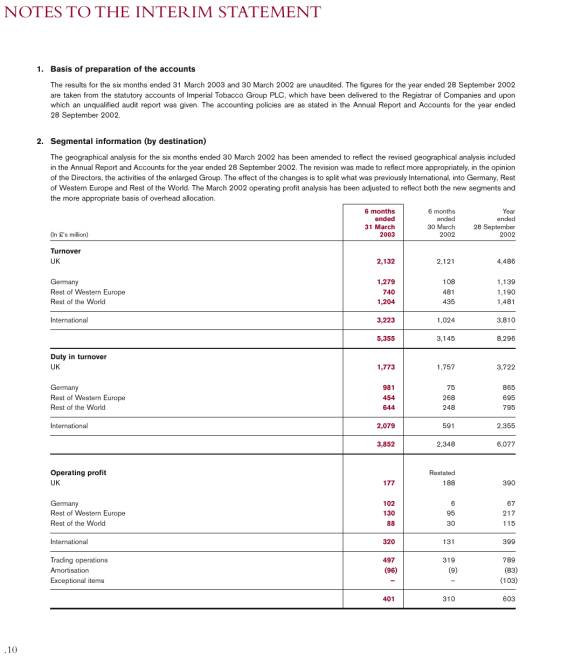
NOTES TO THE INTERIM STATEMENT
1. Basis of preparation of the accounts
The results for the six months ended 31 March 2003 and 30 March 2002 are unaudited. The figures for the year ended 28 September 2002 are taken from the statutory accounts of Imperial Tobacco Group PLC, which have been delivered to the Registrar of Companies and upon which an unqualified audit report was given. The accounting policies are as stated in the Annual Report and Accounts for the year ended 28 September 2002.
2. Segmental information (by destination)
The geographical analysis for the six months ended 30 March 2002 has been amended to reflect the revised geographical analysis included in the Annual Report and Accounts for the year ended 28 September 2002. The revision was made to reflect more appropriately, in the opinion of the Directors, the activities of the enlarged Group. The effect of the changes is to split what was previously International, into Germany, Rest of Western Europe and Rest of the World. The March 2002 operating profit analysis has been adjusted to reflect both the new segments and the more appropriate basis of overhead allocation.
(In £’s million) |
| 6 months |
| 6 months |
| Year |
|
|
|
|
|
|
|
|
|
Turnover |
|
|
|
|
|
|
|
UK |
| 2,132 |
| 2,121 |
| 4,486 |
|
|
|
|
|
|
|
|
|
Germany |
| 1,279 |
| 108 |
| 1,139 |
|
Rest of Western Europe |
| 740 |
| 481 |
| 1,190 |
|
Rest of the World |
| 1,204 |
| 435 |
| 1,481 |
|
|
|
|
|
|
|
|
|
International |
| 3,223 |
| 1,024 |
| 3,810 |
|
|
|
|
|
|
|
|
|
|
| 5,355 |
| 3,145 |
| 8,296 |
|
|
|
|
|
|
|
|
|
Duty in turnover |
|
|
|
|
|
|
|
UK |
| 1,773 |
| 1,757 |
| 3,722 |
|
|
|
|
|
|
|
|
|
Germany |
| 981 |
| 75 |
| 865 |
|
Rest of Western Europe |
| 454 |
| 268 |
| 695 |
|
Rest of the World |
| 644 |
| 248 |
| 795 |
|
|
|
|
|
|
|
|
|
International |
| 2,079 |
| 591 |
| 2,355 |
|
|
|
|
|
|
|
|
|
|
| 3,852 |
| 2,348 |
| 6,077 |
|
|
|
|
|
|
|
|
|
Operating profit |
|
|
| Restated |
|
|
|
UK |
| 177 |
| 188 |
| 390 |
|
|
|
|
|
|
|
|
|
Germany |
| 102 |
| 6 |
| 67 |
|
Rest of Western Europe |
| 130 |
| 95 |
| 217 |
|
Rest of the World |
| 88 |
| 30 |
| 115 |
|
|
|
|
|
|
|
|
|
International |
| 320 |
| 131 |
| 399 |
|
|
|
|
|
|
|
|
|
Trading operations |
| 497 |
| 319 |
| 789 |
|
Amortisation |
| (96 | ) | (9 | ) | (83 | ) |
Exceptional items |
| — |
| — |
| (103 | ) |
|
|
|
|
|
|
|
|
|
| 401 |
| 310 |
| 603 |
|
10
NOTES TO THE INTERIM STATEMENT
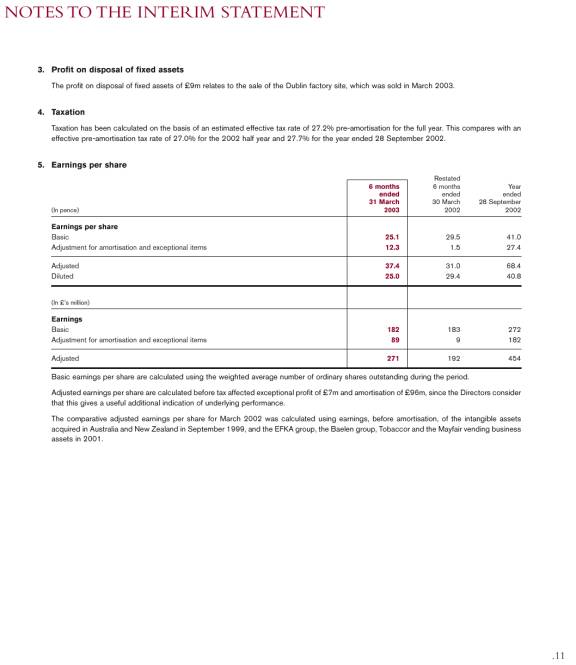
3. Profit on disposal of fixed assets
The profit on disposal of fixed assets of £9m relates to the sale of the Dublin factory site, which was sold in March 2003.
4. Taxation
Taxation has been calculated on the basis of an estimated effective tax rate of 27.2% pre-amortisation for the full year. This compares with an effective pre-amortisation tax rate of 27.0% for the 2002 half year and 27.7% for the year ended 28 September 2002.
5. Earnings per share
(In pence) |
| 6 months |
| Restated |
| Year |
|
|
|
|
|
|
|
|
|
Earnings per share |
|
|
|
|
|
|
|
Basic |
| 25.1 |
| 29.5 |
| 41.0 |
|
Adjustment for amortisation and exceptional items |
| 12.3 |
| 1.5 |
| 27.4 |
|
|
|
|
|
|
|
|
|
Adjusted |
| 37.4 |
| 31.0 |
| 68.4 |
|
Diluted |
| 25.0 |
| 29.4 |
| 40.8 |
|
|
|
|
|
|
|
|
|
(In £’s million) |
|
|
|
|
|
|
|
|
|
|
|
|
|
|
|
Earnings |
|
|
|
|
|
|
|
Basic |
| 182 |
| 183 |
| 272 |
|
Adjustment for amortisation and exceptional items |
| 89 |
| 9 |
| 182 |
|
|
|
|
|
|
|
|
|
Adjusted |
| 271 |
| 192 |
| 454 |
|
Basic earnings per share are calculated using the weighted average number of ordinary shares outstanding during the period.
Adjusted earnings per share are calculated before tax affected exceptional profit of £7m and amortisation of £96m, since the Directors consider that this gives a useful additional indication of underlying performance.
The comparative adjusted earnings per share for March 2002 was calculated using earnings, before amortisation, of the intangible assets acquired in Australia and New Zealand in September 1999, and the EFKA group, the Baelen group, Tobaccor and the Mayfair vending business assets in 2001.
11
NOTES TO THE INTERIM STATEMENT
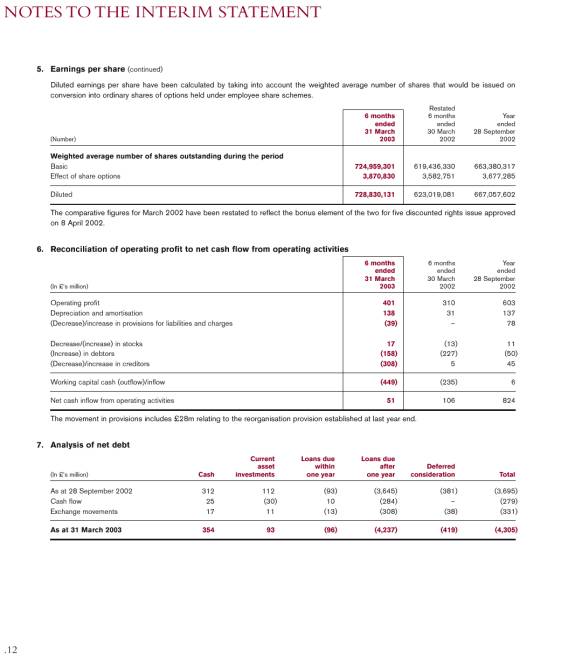
Diluted earnings per share have been calculated by taking into account the weighted average number of shares that would be issued on conversion into ordinary shares of options held under employee share schemes.
(Number) |
| 6 months |
| Restated |
| Year |
|
|
|
|
|
|
|
|
|
Weighted average number of shares outstanding during the period |
|
|
|
|
|
|
|
Basic |
| 724,959,301 |
| 619,436,330 |
| 663,380,317 |
|
Effect of share options |
| 3,870,830 |
| 3,582,751 |
| 3,677,285 |
|
|
|
|
|
|
|
|
|
Diluted |
| 728,830,131 |
| 623,019,081 |
| 667,057,602 |
|
The comparative figures for March 2002 have been restated to reflect the bonus element of the two for five discounted rights issue approved on 8 April 2002.
6. Reconciliation of operating profit to net cash flow from operating activities
(In £’s million) |
| 6 months |
| 6 months |
| Year |
|
|
|
|
|
|
|
|
|
Operating profit |
| 401 |
| 310 |
| 603 |
|
Depreciation and amortisation |
| 138 |
| 31 |
| 137 |
|
(Decrease)/increase in provisions for liabilities and charges |
| (39 | ) | — |
| 78 |
|
|
|
|
|
|
|
|
|
Decrease/(increase) in stocks |
| 17 |
| (13 | ) | 11 |
|
(Increase) in debtors |
| (158 | ) | (227 | ) | (50 | ) |
(Decrease)/increase in creditors |
| (308 | ) | 5 |
| 45 |
|
|
|
|
|
|
|
|
|
Working capital cash (outflow)/inflow |
| (449 | ) | (235 | ) | 6 |
|
|
|
|
|
|
|
|
|
Net cash inflow from operating activities |
| 51 |
| 106 |
| 824 |
|
The movement in provisions includes £28m relating to the reorganisation provision established at last year end.
7. Analysis of net debt
(In £’s million) |
| Cash |
| Current |
| Loans due |
| Loans due |
| Deferred |
| Total |
|
|
|
|
|
|
|
|
|
|
|
|
|
|
|
As at 28 September 2002 |
| 312 |
| 112 |
| (93 | ) | (3,645 | ) | (381 | ) | (3,695 | ) |
Cash flow |
| 25 |
| (30 | ) | 10 |
| (284 | ) | — |
| (279 | ) |
Exchange movements |
| 17 |
| 11 |
| (13 | ) | (308 | ) | (38 | ) | (331 | ) |
|
|
|
|
|
|
|
|
|
|
|
|
|
|
As at 31 March 2003 |
| 354 |
| 93 |
| (96 | ) | (4,237 | ) | (419 | ) | (4,305 | ) |
12
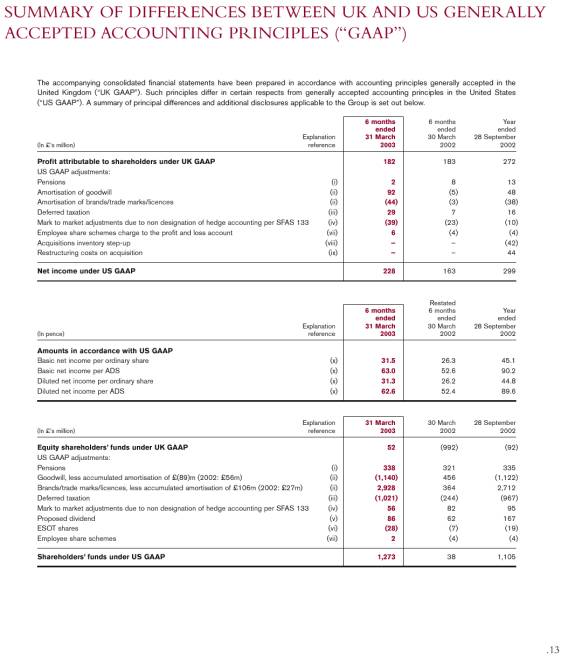
SUMMARY OF DIFFERENCES BETWEEN UK AND US GENERALLY ACCEPTED ACCOUNTING PRINCIPLES (“GAAP”)
The accompanying consolidated financial statements have been prepared in accordance with accounting principles generally accepted in the United Kingdom (“UK GAAP”). Such principles differ in certain respects from generally accepted accounting principles in the United States (“US GAAP”). A summary of principal differences and additional disclosures applicable to the Group is set out below.
(In £’s million) |
| Explanation |
| 6 months |
| 6 months |
| Year |
|
|
|
|
|
|
|
|
|
|
|
Profit attributable to shareholders under UK GAAP |
|
|
| 182 |
| 183 |
| 272 |
|
US GAAP adjustments: |
|
|
|
|
|
|
|
|
|
Pensions |
| (i) |
| 2 |
| 8 |
| 13 |
|
Amortisation of goodwill |
| (ii) |
| 92 |
| (5 | ) | 48 |
|
Amortisation of brands/trade marks/licences |
| (ii) |
| (44 | ) | (3 | ) | (38 | ) |
Deferred taxation |
| (iii) |
| 29 |
| 7 |
| 16 |
|
Mark to market adjustments due to non designation of hedge accounting per SFAS 133 |
| (iv) |
| (39 | ) | (23 | ) | (10 | ) |
Employee share schemes charge to the profit and loss account |
| (vii) |
| 6 |
| (4 | ) | (4 | ) |
Acquisitions inventory step-up |
| (viii) |
| — |
| — |
| (42 | ) |
Restructuring costs on acquisition |
| (ix) |
| — |
| — |
| 44 |
|
|
|
|
|
|
|
|
|
|
|
Net income under US GAAP |
|
|
| 228 |
| 163 |
| 299 |
|
|
|
|
|
|
|
|
|
|
|
(In pence) |
| Explanation |
| 6 months |
| Restated |
| Year |
|
|
|
|
|
|
|
|
|
|
|
Amounts in accordance with US GAAP |
|
|
|
|
|
|
|
|
|
Basic net income per ordinary share |
| (x) |
| 31.5 |
| 26.3 |
| 45.1 |
|
Basic net income per ADS |
| (x) |
| 63.0 |
| 52.6 |
| 90.2 |
|
Diluted net income per ordinary share |
| (x) |
| 31.3 |
| 26.2 |
| 44.8 |
|
Diluted net income per ADS |
| (x) |
| 62.6 |
| 52.4 |
| 89.6 |
|
|
|
|
|
|
|
|
|
|
|
(In £’s million) |
| Explanation |
| 31 March |
| 30 March |
| 28 September |
|
|
|
|
|
|
|
|
|
|
|
Equity shareholders’ funds under UK GAAP |
|
|
| 52 |
| (992 | ) | (92 | ) |
US GAAP adjustments: |
|
|
|
|
|
|
|
|
|
Pensions |
| (i) |
| 338 |
| 321 |
| 335 |
|
Goodwill, less accumulated amortisation of £(89)m (2002: £56m) |
| (ii) |
| (1,140 | ) | 456 |
| (1,122 | ) |
Brands/trade marks/licences, less accumulated amortisation of £106m (2002: £27m) |
| (ii) |
| 2,928 |
| 364 |
| 2,712 |
|
Deferred taxation |
| (iii) |
| (1,021 | ) | (244 | ) | (967 | ) |
Mark to market adjustments due to non designation of hedge accounting per SFAS 133 |
| (iv) |
| 56 |
| 82 |
| 95 |
|
Proposed dividend |
| (v) |
| 86 |
| 62 |
| 167 |
|
ESOT shares |
| (vi) |
| (28 | ) | (7 | ) | (19 | ) |
Employee share schemes |
| (vii) |
| 2 |
| (4 | ) | (4 | ) |
|
|
|
|
|
|
|
|
|
|
Shareholders’ funds under US GAAP |
|
|
| 1,273 |
| 38 |
| 1,105 |
|
13
SUMMARY OF DIFFERENCES BETWEEN UK AND US GENERALLY ACCEPTED ACCOUNTING PRINCIPLES (“GAAP”)
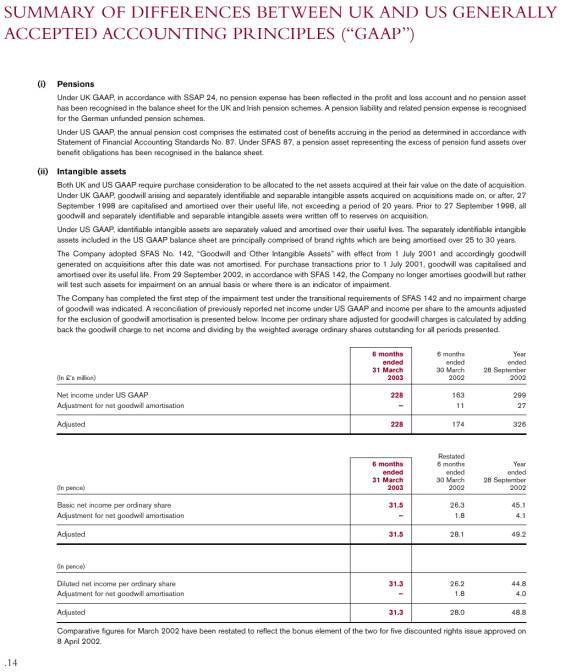
(i) Pensions
Under UK GAAP, in accordance with SSAP 24, no pension expense has been reflected in the profit and loss account and no pension asset has been recognised in the balance sheet for the UK and Irish pension schemes. A pension liability and related pension expense is recognised for the German unfunded pension schemes.
Under US GAAP, the annual pension cost comprises the estimated cost of benefits accruing in the period as determined in accordance with Statement of Financial Accounting Standards No. 87. Under SFAS 87, a pension asset representing the excess of pension fund assets over benefit obligations has been recognised in the balance sheet.
(ii) Intangible assets
Both UK and US GAAP require purchase consideration to be allocated to the net assets acquired at their fair value on the date of acquisition. Under UK GAAP, goodwill arising and separately identifiable and separable intangible assets acquired on acquisitions made on, or after, 27 September 1998 are capitalised and amortised over their useful life, not exceeding a period of 20 years. Prior to 27 September 1998, all goodwill and separately identifiable and separable intangible assets were written off to reserves on acquisition.
Under US GAAP, identifiable intangible assets are separately valued and amortised over their useful lives. The separately identifiable intangible assets included in the US GAAP balance sheet are principally comprised of brand rights which are being amortised over 25 to 30 years.
The Company adopted SFAS No. 142, “Goodwill and Other Intangible Assets” with effect from 1 July 2001 and accordingly goodwill generated on acquisitions after this date was not amortised. For purchase transactions prior to 1 July 2001, goodwill was capitalised and amortised over its useful life. From 29 September 2002, in accordance with SFAS 142, the Company no longer amortises goodwill but rather will test such assets for impairment on an annual basis or where there is an indicator of impairment.
The Company has completed the first step of the impairment test under the transitional requirements of SFAS 142 and no impairment charge of goodwill was indicated. A reconciliation of previously reported net income under US GAAP and income per share to the amounts adjusted for the exclusion of goodwill amortisation is presented below. Income per ordinary share adjusted for goodwill charges is calculated by adding back the goodwill charge to net income and dividing by the weighted average ordinary shares outstanding for all periods presented.
(In £’s million) |
| 6 months |
| 6 months |
| Year |
|
|
|
|
|
|
|
|
|
Net income under US GAAP |
| 228 |
| 163 |
| 299 |
|
Adjustment for net goodwill amortisation |
| — |
| 11 |
| 27 |
|
|
|
|
|
|
|
|
|
Adjusted |
| 228 |
| 174 |
| 326 |
|
(In pence) |
| 6 months |
| Restated |
| Year |
|
|
|
|
|
|
|
|
|
Basic net income per ordinary share |
| 31.5 |
| 26.3 |
| 45.1 |
|
Adjustment for net goodwill amortisation |
| — |
| 1.8 |
| 4.1 |
|
|
|
|
|
|
|
|
|
Adjusted |
| 31.5 |
| 28.1 |
| 49.2 |
|
|
|
|
|
|
|
|
|
(In pence) |
|
|
|
|
|
|
|
|
|
|
|
|
|
|
|
Diluted net income per ordinary share |
| 31.3 |
| 26.2 |
| 44.8 |
|
Adjustment for net goodwill amortisation |
| — |
| 1.8 |
| 4.0 |
|
|
|
|
|
|
|
|
|
Adjusted |
| 31.3 |
| 28.0 |
| 48.8 |
|
Comparative figures for March 2002 have been restated to reflect the bonus element of the two for five discounted rights issue approved on 8 April 2002.
14
SUMMARY OF DIFFERENCES BETWEEN UK AND US GENERALLY ACCEPTED ACCOUNTING PRINCIPLES (“GAAP”)
(iii) Deferred taxation
Under UK GAAP, deferred taxation is provided in full on all material timing differences. Deferred tax assets are recognised where their recovery is considered more likely than not.
US GAAP requires deferred taxation to be provided in full, using the liability method. In addition, US GAAP requires the recognition of the deferred tax consequences of differences between the assigned values and the tax bases of the identifiable intangible assets, with the exception of non tax-deductible goodwill, in a purchase business combination. Consequently, the deferred tax liability attributable to identifiable intangible assets has been recognised and is being amortised over the useful lives of the underlying intangible assets.
(iv) Derivative financial instruments
The Group has entered into certain swap transactions with contractual maturities exceeding those of the underlying debt being hedged, in anticipation of there being additional floating rate debt when the existing debt matures. Under UK GAAP, derivative financial instruments that reduce exposures on anticipated future transactions may be accounted for using hedge accounting.
US GAAP requires the Group to record all derivatives on the balance sheet at fair value. The Group has decided not to satisfy the SFAS 133 requirements to achieve hedge accounting for its derivatives, where permitted, and accordingly movements in the fair value of derivatives are recorded in the profit and loss account.
(v) Proposed dividends
Under UK GAAP, dividends paid and proposed are shown on the face of the profit and loss account as an appropriation of the current period’s earnings. Proposed dividends are provided on the basis of recommendation by the Directors.
Under US GAAP, dividends are recorded in the period in which they are formally declared.
(vi) Shares held by the Employee Share Ownership Trusts (ESOTs)
Under UK GAAP, shares held by the Trusts are recorded at cost and reflected as a fixed asset investment in the Group’s balance sheet.
Under US GAAP, these shares are recorded at cost and reflected as a deduction from shareholders’ funds.
(vii) Employee share schemes charge to the profit and loss account
Under UK GAAP, the cost of shares purchased by the ESOTs in conjunction with an employee share scheme are charged to the profit and loss account according to the book value of the shares at the date of purchase. The cost of employee share schemes not held under the ESOTs are charged using the quoted market price of shares at the date of grant. The charge is accrued over the vesting period of the shares in both cases.
Under US GAAP, the compensation cost is recognised for the difference between the exercise price of the share options granted and the quoted market price of the shares at the date of grant or measurement date and accrued over the vesting period of the options. For option plans which contain performance criteria, compensation cost is remeasured at each period end until all performance criteria have been met.
(viii) Inventory step-up
On acquisition under UK GAAP, the fair value of inventory is represented by the acquired companies’ current cost of reproducing that inventory.
On acquisition under US GAAP, the fair value represents the selling price less any further costs to be incurred to sale.
(ix) Restructuring costs
On acquisition under UK GAAP, restructuring provisions may only be recognised as a fair value adjustment, if the acquired company had an irrevocable commitment to restructure which was not conditional on the completion of the purchase.
On acquisition under US GAAP, restructuring liabilities relating solely to the acquired entity may be provided in the opening balance as a fair value exercise, if specific criteria about restructuring plans are met.
(x) Net income per ordinary share
Basic net income per ordinary share has been computed using US GAAP net income and weighted average ordinary shares. Diluted net income per ordinary share has been calculated by taking into account the weighted average number of shares that would be issued on conversion into ordinary shares of options held under employee share schemes. There would be no significant dilution of earnings if outstanding share options were exercised.
Each American Depositary Share (ADS) represents two Imperial Tobacco Group PLC ordinary shares.
Comparative figures have been restated to reflect the bonus element of the two for five discounted rights issue approved on 8 April 2002.
15
Financial calendar | Ex-dividend date for interim dividend | 9 July 2003 |
|
| Interim dividend record date | 11 July 2003 |
|
| Interim dividend payable | 8 August 2003 |
|
Shareholder enquiries
Enquiries about personal shareholdings – including change of address, loss of certificates, payments of dividends, amalgamation of accounts, certificate consolidation – should be directed to:
Lloyds TSB Registrars, The Causeway, Worthing, West Sussex BN99 6DA 0870 241 3932 (+44 121 433 8000 from outside the UK) (0870 600 3950 text phone for shareholders with hearing difficulties).
You can now find a number of shareholders’ services on-line. The portfolio service from Lloyds TSB Registrars gives you access to more information on your investments including balance movements, indicative share prices, and information on recent dividends. For more details on this and practical help on transferring shares or updating your details, visit www.shareview.co.uk This also gives you the opportunity to register an interest in receiving information from the Company electronically. If registering for the first time you will need your shareholder reference which can be found on your share certificate or dividend voucher.
Enquiries on ADR holdings should be made to the Depositary for American Depositary Receipts:
Citibank Shareholder Services, PO Box 2502, Jersey City, New Jersey 07303-2502, USA
877-CITI-ADR (877 248 4237) (toll free) Email: Citibank@em.fcnbd.com Internet address: www.citibank.com/adr
General enquiries on the Company and the apportionment of capital gains tax base cost should be made to the Company Secretary at: Imperial Tobacco Group PLC, PO Box 244, Upton Road, Bristol BS99 7UJ +44 (0) 117 963 6636 Email: itg@uk.imptob.com
Dividend Reinvestment Plan (DRIP)
Imperial Tobacco Group PLC has set up a DRIP to enable shareholders to use their cash dividend to buy further shares in the market through a dividend reinvestment plan. Further information can be obtained from Lloyds TSB Registrars, Share Dividend Operations, Worthing, West Sussex, BN99 6DA 0870 241 3018
International Direct Investment Program
Imperial Tobacco Group PLC American Depositary Shares have been included in the Citibank International Direct Investment Program. The International Direct Investment Program provides registered holders and interested investors with a convenient way to purchase and sell Imperial Tobacco Group PLC American Depositary Shares.
To obtain further information about the International Direct Investment Program, please call Citibank N.A., the administrator and sponsor at 800 808 8010
ISA
Investors in Imperial Tobacco Group PLC ordinary shares may take advantage of a low cost Individual Savings Account (ISA) dedicated to Imperial Tobacco Group shares operated by Lloyds TSB Bank plc. Details of the ISA, which offers competitive charges, can be obtained from Lloyds TSB Registrars, ISA Team, The Causeway, Worthing, West Sussex BN99 6UY 0870 242 4244
Share dealing facilities
A low cost, execution only, postal dealing service for the purchase and sale of Imperial Tobacco Group PLC shares has been set up by Hoare Govett Limited. Commission is 1% with a minimum charge of £12. For details please contact: Hoare Govett Limited, 250 Bishopsgate, London EC2M 4AA 020 7661 6617. This service is restricted to the UK residents only and transactions are limited to €15,000 (approximately £9,000).
Internet
Information on Imperial Tobacco Group PLC is available on our website: www.imperial-tobacco.com
16
Designed and produced by MAGEE
Printed by First Impression
17
| IMPERIAL TOBACCO GROUP PLC |
| PO BOX 244 |
SOUTHVILLE | |
BRISTOL BS99 7UJ | |
| www.imperial-tobacco.com |
18