Link to searchable text of slide shown above

Link to searchable text of slide shown above

Link to searchable text of slide shown above
Link to searchable text of slide shown above
Link to searchable text of slide shown above
Link to searchable text of slide shown above
Link to searchable text of slide shown above
Link to searchable text of slide shown above
Link to searchable text of slide shown above

Link to searchable text of slide shown above

Link to searchable text of slide shown above
Link to searchable text of slide shown above

Link to searchable text of slide shown above
Link to searchable text of slide shown above
Link to searchable text of slide shown above
Link to searchable text of slide shown above

Link to searchable text of slide shown above
Link to searchable text of slide shown above
Link to searchable text of slide shown above
Link to searchable text of slide shown above
Link to searchable text of slide shown above
Link to searchable text of slide shown above

Link to searchable text of slide shown above
Link to searchable text of slide shown above
Link to searchable text of slide shown above
Link to searchable text of slide shown above

Link to searchable text of slide shown above
Link to searchable text of slide shown above

Link to searchable text of slide shown above
Link to searchable text of slide shown above

Link to searchable text of slide shown above
Link to searchable text of slide shown above
Link to searchable text of slide shown above
Link to searchable text of slide shown above
Link to searchable text of slide shown above
Link to searchable text of slide shown above
Link to searchable text of slide shown above
Link to searchable text of slide shown above
Link to searchable text of slide shown above
Link to searchable text of slide shown above
Link to searchable text of slide shown above
Link to searchable text of slide shown above

Link to searchable text of slide shown above

Link to searchable text of slide shown above

Link to searchable text of slide shown above
Link to searchable text of slide shown above
Link to searchable text of slide shown above

Link to searchable text of slide shown above
Link to searchable text of slide shown above
Link to searchable text of slide shown above
Link to searchable text of slide shown above
Link to searchable text of slide shown above

Link to searchable text of slide shown above
Link to searchable text of slide shown above
Link to searchable text of slide shown above
Link to searchable text of slide shown above
Link to searchable text of slide shown above
Link to searchable text of slide shown above
Link to searchable text of slide shown above
Link to searchable text of slide shown above
Link to searchable text of slide shown above
Link to searchable text of slide shown above
Link to searchable text of slide shown above
Link to searchable text of slide shown above
Link to searchable text of slide shown above
Link to searchable text of slide shown above
Link to searchable text of slide shown above
Link to searchable text of slide shown above
Link to searchable text of slide shown above
Link to searchable text of slide shown above
Link to searchable text of slide shown above
Link to searchable text of slide shown above
Link to searchable text of slide shown above
Link to searchable text of slide shown above
Link to searchable text of slide shown above
Link to searchable text of slide shown above
Link to searchable text of slide shown above
Link to searchable text of slide shown above
Link to searchable text of slide shown above
Link to searchable text of slide shown above
Link to searchable text of slide shown above

Link to searchable text of slide shown above
Link to searchable text of slide shown above
Link to searchable text of slide shown above
Link to searchable text of slide shown above

Link to searchable text of slide shown above

Link to searchable text of slide shown above
Link to searchable text of slide shown above
Link to searchable text of slide shown above
Link to searchable text of slide shown above
Link to searchable text of slide shown above

Link to searchable text of slide shown above
Link to searchable text of slide shown above
Link to searchable text of slide shown above

Link to searchable text of slide shown above
Link to searchable text of slide shown above

Link to searchable text of slide shown above

Link to searchable text of slide shown above

Link to searchable text of slide shown above
Link to searchable text of slide shown above

Link to searchable text of slide shown above
Link to searchable text of slide shown above

Link to searchable text of slide shown above

Link to searchable text of slide shown above
Searchable text section of graphics shown above
IMPERIAL TOBACCO GROUP PLC
ANNUAL REPORT AND ACCOUNTS
[LOGO]
2003
| |
|
|
| |
|
|
| |
|
|
| |
|
|
| |
|
|
| |
|
|
| |
|
|
| |
|
|
| |
|
|
| |
|
|
| |
|
|
| |
|
|
| |
|
|
| |
|
|
| |
|
|
| INDEPENDENT AUDITORS’ REPORT TO THE MEMBERS OF IMPERIAL TOBACCO GROUP PLC |
|
|
| |
|
|
| |
|
|
| |
|
|
| |
|
|
| |
|
|
| |
|
|
| |
|
|
| |
|
|
|
Imperial Tobacco is the world’s fourth largest international tobacco company which manufactures, markets and sells a comprehensive range of cigarettes, tobaccos, rolling papers and cigars.
1
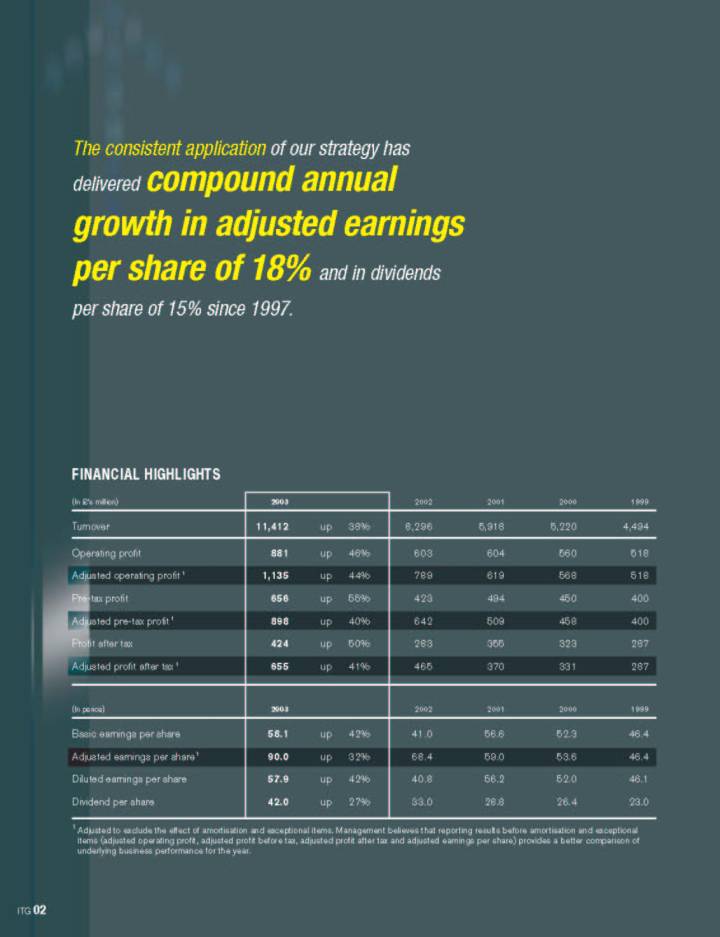
The consistent application of our strategy has delivered compound annual growth in adjusted earnings per share of 18% and in dividends per share of 15% since 1997.
(In £’s million) |
| 2003 |
|
|
|
|
| 2002 |
| 2001 |
| 2000 |
| 1999 |
|
|
|
|
|
|
|
|
|
|
|
|
|
|
|
|
|
Turnover |
| 11,412 |
| up |
| 38 | % | 8,296 |
| 5,918 |
| 5,220 |
| 4,494 |
|
|
|
|
|
|
|
|
|
|
|
|
|
|
|
|
|
Operating profit |
| 881 |
| up |
| 46 | % | 603 |
| 604 |
| 560 |
| 518 |
|
|
|
|
|
|
|
|
|
|
|
|
|
|
|
|
|
Adjusted operating profit (1) |
| 1,135 |
| up |
| 44 | % | 789 |
| 619 |
| 568 |
| 518 |
|
|
|
|
|
|
|
|
|
|
|
|
|
|
|
|
|
Pre-tax profit |
| 656 |
| up |
| 55 | % | 423 |
| 494 |
| 450 |
| 400 |
|
|
|
|
|
|
|
|
|
|
|
|
|
|
|
|
|
Adjusted pre-tax profit (1) |
| 898 |
| up |
| 40 | % | 642 |
| 509 |
| 458 |
| 400 |
|
|
|
|
|
|
|
|
|
|
|
|
|
|
|
|
|
Profit after tax |
| 424 |
| up |
| 50 | % | 283 |
| 355 |
| 323 |
| 287 |
|
|
|
|
|
|
|
|
|
|
|
|
|
|
|
|
|
Adjusted profit after tax (1) |
| 655 |
| up |
| 41 | % | 465 |
| 370 |
| 331 |
| 287 |
|
(In pence) |
| 2003 |
|
|
|
|
| 2002 |
| 2001 |
| 2000 |
| 1999 |
|
|
|
|
|
|
|
|
|
|
|
|
|
|
|
|
|
Basic earnings per share |
| 58.1 |
| up |
| 42 | % | 41.0 |
| 56.6 |
| 52.3 |
| 46.4 |
|
|
|
|
|
|
|
|
|
|
|
|
|
|
|
|
|
Adjusted earnings per share (1) |
| 90.0 |
| up |
| 32 | % | 68.4 |
| 59.0 |
| 53.6 |
| 46.4 |
|
|
|
|
|
|
|
|
|
|
|
|
|
|
|
|
|
Diluted earnings per share |
| 57.9 |
| up |
| 42 | % | 40.8 |
| 56.2 |
| 52.0 |
| 46.1 |
|
|
|
|
|
|
|
|
|
|
|
|
|
|
|
|
|
Dividend per share |
| 42.0 |
| up |
| 27 | % | 33.0 |
| 28.8 |
| 26.4 |
| 23.0 |
|
(1) Adjusted to exclude the effect of amortisation and exceptional items. Management believes that reporting results before amortisation and exceptional items (adjusted operating profit, adjusted profit before tax, adjusted profit after tax and adjusted earnings per share) provides a better comparison of underlying business performance for the year.
2
Adjusted earnings per share
+32%
IMPERIAL TOBACCO’S STRATEGY is to create sustainable shareholder value by growing our international operations, both organically and through acquisition, while continuing to strengthen our core market positions in the UK and Germany.
3
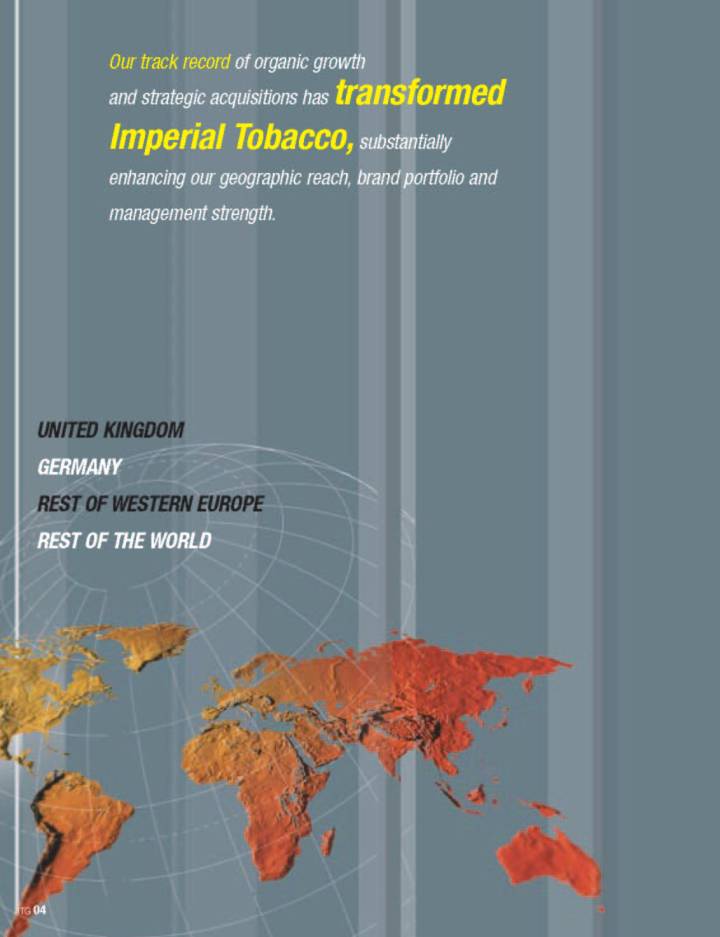
Our track record of organic growth and strategic acquisitions has transformed Imperial Tobacco, substantially enhancing our geographic reach, brand portfolio and management strength.
UNITED KINGDOM
GERMANY
REST OF WESTERN EUROPE
REST OF THE WORLD
[GRAPHIC]
4
OUR SUCCESSFUL INTERNATIONAL EXPANSION accelerated following our Listing in 1996 and we have increased our volumes from 42 billion cigarette equivalents in 1997 to over 220 billion in 2003. Our products are now sold in over 130 countries.
Our strength in Western Europe is complemented by a portfolio of markets spanning Central and Eastern Europe, Africa, the Middle East, Asia and Australasia.
5
We focus on low cost, high quality production, while safeguarding our reputation for flexibility and innovation.
WE SEEK OPPORTUNITIES to drive cost reductions through all aspects of the business, while continuing to invest in our brands and markets.
6
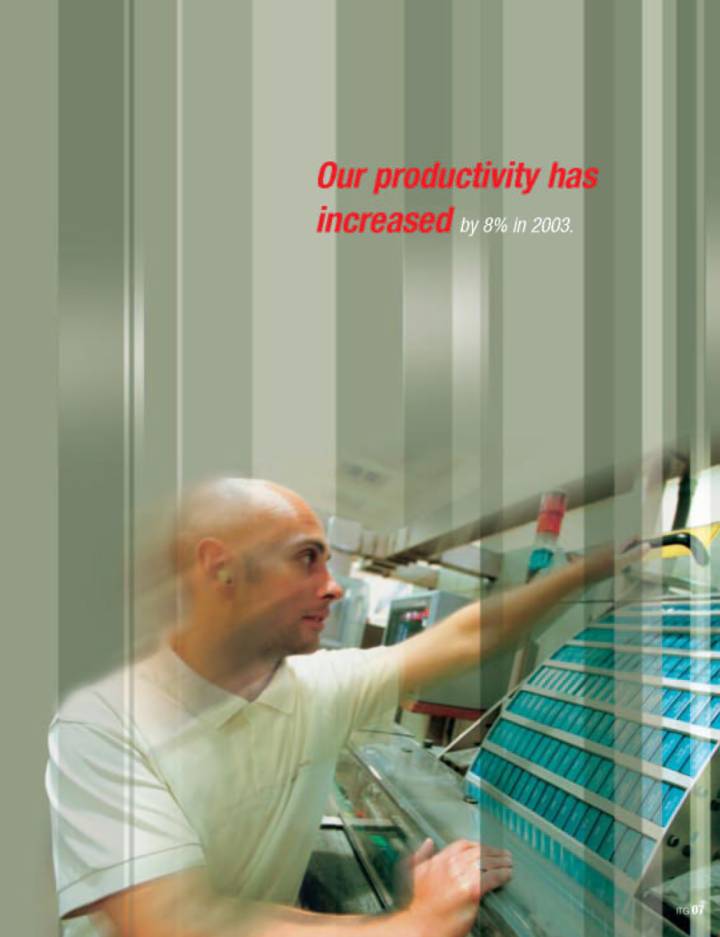
Our productivity has increased by 8% in 2003.
[GRAPHIC]
7
We produce a comprehensive range of cigarettes and other tobacco products. Our strategy for brand management is centred on growing brand equity and profitability.
[LOGO]
8
[LOGO]
OUR STRENGTH LIES IN DEVELOPING OUR BRANDS TO PROVIDE CUSTOMERS WITH CHOICE, HIGH QUALITY AND GOOD VALUE.
The 2002 acquisition of Reemtsma gave us a number of excellent brands including West and Davidoff that significantly extended our international reach. These brands complement our world leadership positions in other tobacco products with Drum roll your own tobacco and Rizla rolling papers.
9
ACQUISITIONS
We have a proven track record of successfully integrating our acquisitions and rapidly generating enhanced returns to create sustainable shareholder value.
10
IN MAY 2002, we completed the acquisition of Reemtsma which was a step change in the strategic evolution of our business, transforming us into the world’s fourth largest international tobacco company.
The inherent profit potential continues to be realised with synergies of some £150 million delivered in 2003, increasing to a full year benefit of around £210 million in 2004.
[GRAPHIC]
11
CHAIRMAN’S STATEMENT
In a year of transformation for Imperial Tobacco, following the step change in the scale and potential of the business resulting from the acquisition of Reemtsma in 2002, I am very pleased to be reporting yet another excellent set of results.
[PHOTO]
Derek Bonham
Chairman
Our track record of organic growth and strategic acquisitions has taken us from a strong UK base to become the world’s fourth largest international tobacco company with our products sold in over 130 countries. We have increased and internationalised our cigarette portfolio, we are the world’s leading manufacturer of roll your own tobacco and rolling papers, and we have seen our volumes grow from 42 billion cigarette equivalents in 1997 to over 220 billion cigarette equivalents today.
Our performance in 2003 maintains an unbroken track record of strong earnings and dividend growth, and clearly demonstrates our consistent ability to create sustainable shareholder value.
2003 PERFORMANCE
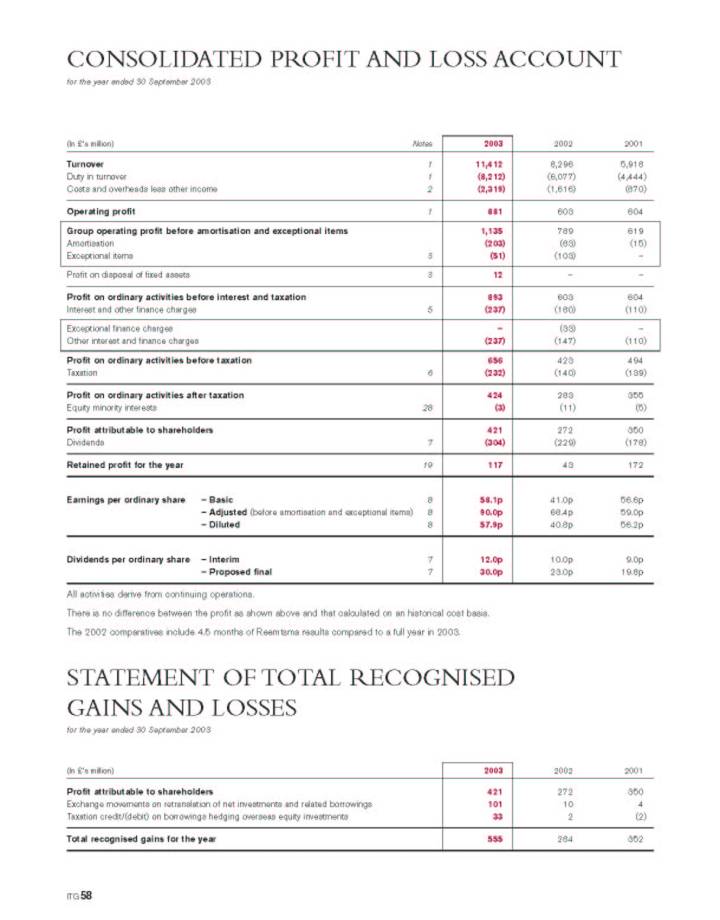
In the first full year of the enlarged business, adjusted operating profit before amortisation and exceptional items was up 44 per cent on 2002 to over £1.1 billion, with turnover excluding duty also up 44 per cent to £3.2 billion. Operating profit, after amortisation and exceptional items, was up 46 per cent to £881 million (2002: £603 million). These results reflect organic growth trends across many of our key markets, together with the delivery of some £150 million synergies generated following the Reemtsma acquisition, and a full year’s contribution from that business.
The adjusted profit on ordinary activities before tax was up 40 per cent to £898 million (2002: £642 million), after charging £237 million net interest (2002: £147 million). The interest charge includes the full year effect of financing the Reemtsma acquisition.
This performance has delivered basic earnings per share of 58.1 pence (2002: 41.0 pence) and adjusted earnings per share of 90.0 pence, an increase of 32 per cent on 2002.
DIVIDEND
Your Directors are recommending a final dividend of 30.0 pence per share, making a total dividend for the year of 42.0 pence. This represents an increase of 9.0 pence per share, or 27 per cent on the total 2002 dividend.
The dividend will be paid on 20 February 2004 to shareholders on the register at the close of business on 23 January 2004.
12
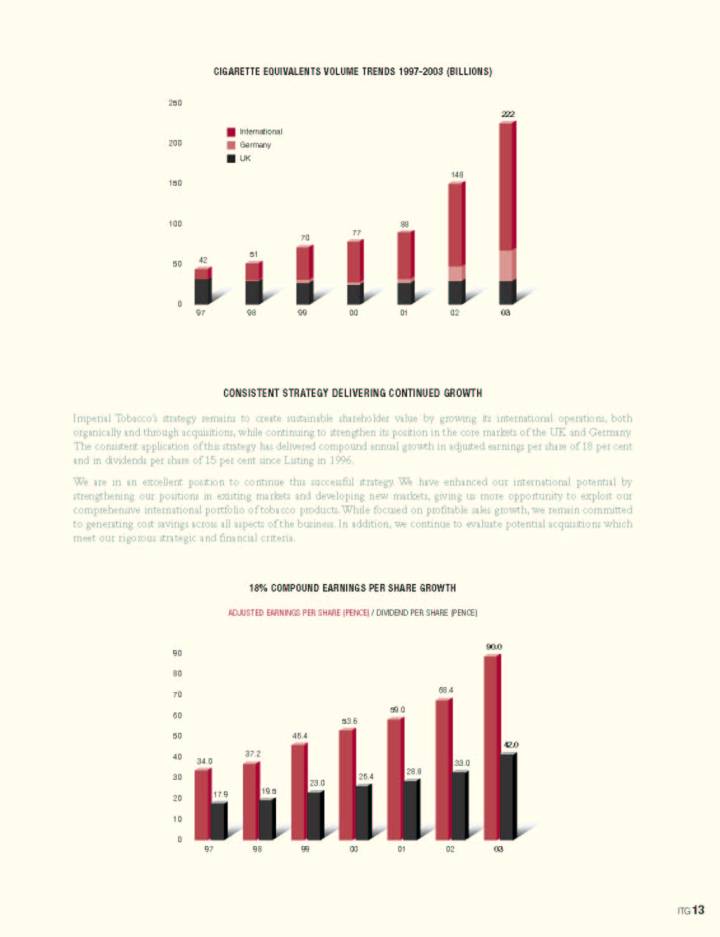
CIGARETTE EQUIVALENTS VOLUME TRENDS 1997-2003 (BILLIONS)
[CHART]
CONSISTENT STRATEGY DELIVERING CONTINUED GROWTH
Imperial Tobacco’s strategy remains to create sustainable shareholder value by growing its international operations, both organically and through acquisitions, while continuing to strengthen its position in the core markets of the UK and Germany. The consistent application of this strategy has delivered compound annual growth in adjusted earnings per share of 18 per cent and in dividends per share of 15 per cent since Listing in 1996.
We are in an excellent position to continue this successful strategy. We have enhanced our international potential by strengthening our positions in existing markets and developing new markets, giving us more opportunity to exploit our comprehensive international portfolio of tobacco products. While focused on profitable sales growth, we remain committed to generating cost savings across all aspects of the business. In addition, we continue to evaluate potential acquisitions which meet our rigorous strategic and financial criteria.
18% COMPOUND EARNINGS PER SHARE GROWTH
ADJUSTED EARNINGS PER SHARE (PENCE) / DIVIDEND PER SHARE (PENCE)
[CHART]
13
SENIOR MANAGEMENT
Recognising the transformation in the scale of the business, I am delighted to welcome David Cresswell as Manufacturing Director, Frank Rogerson as Corporate Affairs Director and Bruce Davidson as Sales and Marketing Director to the Board. The Sales and Marketing operation has subsequently been reorganised into seven areas of operation: Western Europe, Central Europe, Eastern Europe, Africa and the Middle East, Asia Pacific, Australasia and Global Duty Free/Travel Retail.
Further strengthening the management overview of the strategic direction and operations of the Group, the senior management steering group, the Chief Executive’s Committee, was expanded in June to include Alison Cooper, Director of Finance and Planning and Kathryn Brown, Group Human Resources Director, who join the Executive Directors on the Committee.
Ludger Staby resigned from his position as a Non-Executive Director of the Company and from the Supervisory Board of Reemtsma. The Board also accepted the resignation of Manfred Häussler, Sales and Marketing Director, from the PLC Board and as Speaker of the Vorstand, Reemtsma Germany’s Board of Directors.
CORPORATE RESPONSIBILITY
The Board takes its obligations as a responsible corporate citizen seriously and is committed to high standards of corporate governance ensuring this is reflected across all aspects of the business.
Governments around the world are pursuing in varying degrees the further regulation of tobacco products. We continue to manage these challenges and seek to engage with governments to find workable, practical solutions to changing regulations.
In particular, in the UK, we were pleased to sign a Memorandum of Understanding with HM Customs & Excise in July 2003, formalising jointly developed protocols to combat the smuggling of tobacco products. We have also supplied information to the Office of Fair Trading in relation to certain of its enquiries into the operations of the UK tobacco supply chain. Investigations by the German authorities into Reemtsma trading practices which relate to a period prior to acquisition, are ongoing. We continue to co-operate fully with the authorities in their investigations, which in some instances could last several years.
The operating environment section on pages 30 to 33 in this report reviews our progress in meeting the expectations of a wide range of stakeholders and a more detailed review of our activities will be published on our website in December 2003: www.imperial-tobacco.com
OUTLOOK
It has been a year of transformation and strong profit delivery, following the acquisition of Reemtsma in May 2002. The two businesses have proved to be an excellent fit, providing a much stronger platform for future growth and enhanced profitability. This inherent growth potential continues to be realised with synergies of some £150 million delivered in 2003, rising to a full year delivery of around £210 million in 2004, ahead of the £170 million forecast at the time of the acquisition.
The search to improve profitability throughout the business continues and the ongoing review of manufacturing capacity, together with other initiatives, will generate further cost savings on an ongoing basis. These cost savings will not only support margin improvements, but will release funds for investment in brands and markets, driving forward the sustained profit development of the business.
As we move into the next phase of our development, we are seeing the transfer of skills, experience and best practice across the Group. It is testimony to the strength and commitment of all our employees that, in a year of such significant change, we have delivered yet another strong set of results.
While external regulatory, economic and political pressures will continue, I believe we have never been better placed to continue to create long-term value for our shareholders.
/s/ Derek Bonham |
|
Derek Bonham | |
Chairman | |
14
CHIEF EXECUTIVE’S COMMITTEE
[PHOTO]
GARETH DAVIS
Chief Executive
[PHOTO]
ROBERT DYRBUS
Finance Director
[PHOTO]
ALISON COOPER
Director of Finance and Planning
[PHOTO]
KATHRYN BROWN
Group Human Resources Director
[PHOTO]
FRANK ROGERSON
Corporate Affairs Director
[PHOTO]
DAVID CRESSWELL
Manufacturing Director
[PHOTO]
BRUCE DAVIDSON
Sales and Marketing Director
[PHOTO]
RICHARD HANNAFORD
Company Secretary
15
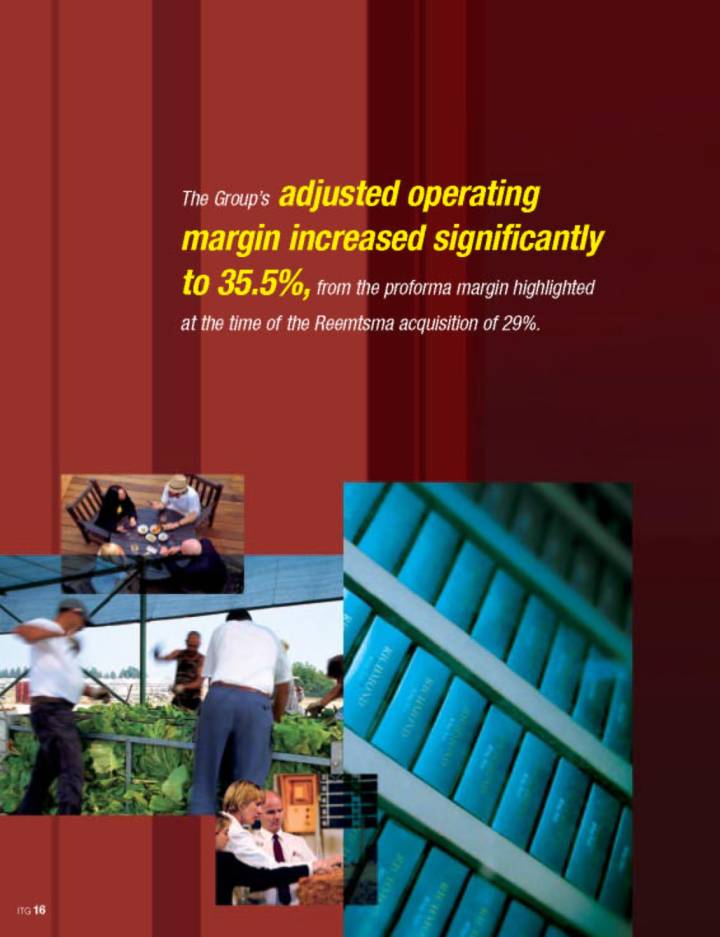
The Group’s adjusted operating margin increased significantly to 35.5%, from the proforma margin highlighted at the time of the Reemtsma acquisition of 29%.
[GRAPHIC]
16
OPERATING AND FINANCIAL REVIEW
2003
ANOTHER EXCELLENT YEAR
GROUP OPERATING PERFORMANCE
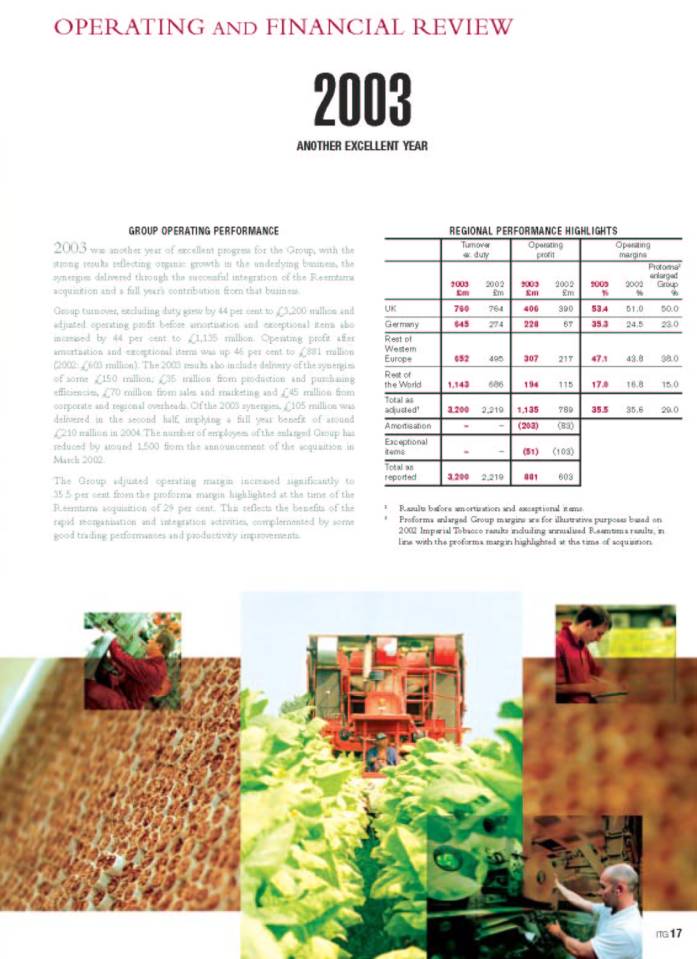
2003 was another year of excellent progress for the Group, with the strong results reflecting organic growth in the underlying business, the synergies delivered through the successful integration of the Reemtsma acquisition and a full year’s contribution from that business.
Group turnover, excluding duty, grew by 44 per cent to £3,200 million and adjusted operating profit before amortisation and exceptional items also increased by 44 per cent to £1,135 million. Operating profit after amortisation and exceptional items was up 46 per cent to £881 million (2002: £603 million). The 2003 results also include delivery of the synergies of some £150 million; £35 million from production and purchasing efficiencies, £70 million from sales and marketing and £45 million from corporate and regional overheads. Of the 2003 synergies, £105 million was delivered in the second half, implying a full year benefit of around £210 million in 2004. The number of employees of the enlarged Group has reduced by around 1,500 from the announcement of the acquisition in March 2002.
The Group adjusted operating margin increased significantly to 35.5 per cent from the proforma margin highlighted at the time of the Reemtsma acquisition of 29 per cent. This reflects the benefits of the rapid reorganisation and integration activities, complemented by some good trading performances and productivity improvements.
REGIONAL PERFORMANCE HIGHLIGHTS
|
| Turnover |
| Operating |
| Operating |
| ||||||||
|
| 2003 |
| 2002 |
| 2003 |
| 2002 |
| 2003 |
| 2002 |
| Proforma(2) |
|
UK |
| 760 |
| 764 |
| 406 |
| 390 |
| 53.4 |
| 51.0 |
| 50.0 |
|
Germany |
| 645 |
| 274 |
| 228 |
| 67 |
| 35.3 |
| 24.5 |
| 23.0 |
|
Rest of Western Europe |
| 652 |
| 495 |
| 307 |
| 217 |
| 47.1 |
| 43.8 |
| 38.0 |
|
Rest of the World |
| 1,143 |
| 686 |
| 194 |
| 115 |
| 17.0 |
| 16.8 |
| 15.0 |
|
Total as adjusted(1) |
| 3,200 |
| 2,219 |
| 1,135 |
| 789 |
| 35.5 |
| 35.6 |
| 29.0 |
|
Amortisation |
| — |
| — |
| (203 | ) | (83 | ) |
|
|
|
|
|
|
Exceptional items |
| — |
| — |
| (51 | ) | (103 | ) |
|
|
|
|
|
|
Total as reported |
| 3,200 |
| 2,219 |
| 881 |
| 603 |
|
|
|
|
|
|
|
(1) Results before amortisation and exceptional items.
(2) Proforma enlarged Group margins are for illustrative purposes based on 2002 Imperial Tobacco results including annualised Reemtsma results, in line with the proforma margin highlighted at the time of acquisition.
[GRAPHIC]
17
UK operating profit in the year increased to £406 million from £390 million in 2002 and margins were up to 53.4 per cent (2002: 51 per cent). These increases reflect share growth, the benefits of manufacturer’s price increases and a reduced cost base, partly offset by downtrading effects.
Operating profit in Germany rose to £228 million in 2003 from £67 million in 2002. This result incorporates a full year of Reemtsma results, a positive overall trading performance, synergy benefits and a favourable euro exchange gain of approximately £20 million. In addition, a reduced cost base compared to that applied in the previous Reemtsma business helped the significant uplift in operating margins to 35.3 per cent in the year, compared to a proforma margin for the enlarged Group of 23 per cent.
In the Rest of Western Europe, operating profit in the year grew to £307 million from £217 million in 2002. These results reflect strong underlying trading together with the first full year of Reemtsma results and the synergy benefits from the combination, with local cost savings being partly offset by an additional central overhead allocation. In addition, a favourable euro exchange gain of approximately £30 million further enhanced reported profit. Operating margins improved to 47.1 per cent compared with 43.8 per cent in 2002.
In the Rest of the World, operating profit in the year increased to £194 million from £115 million in 2002. This increase incorporates a full year of Reemtsma results and reflects some encouraging performances despite challenging conditions in certain markets, notably those impacted by SARS, political unrest and the conflict in the Middle East. The expected synergies have been achieved, but these have been partly offset by currency losses of approximately £27 million. Operating margins nevertheless have shown a good improvement to 17 per cent in the year from the proforma margins of 15 per cent for the enlarged Group.
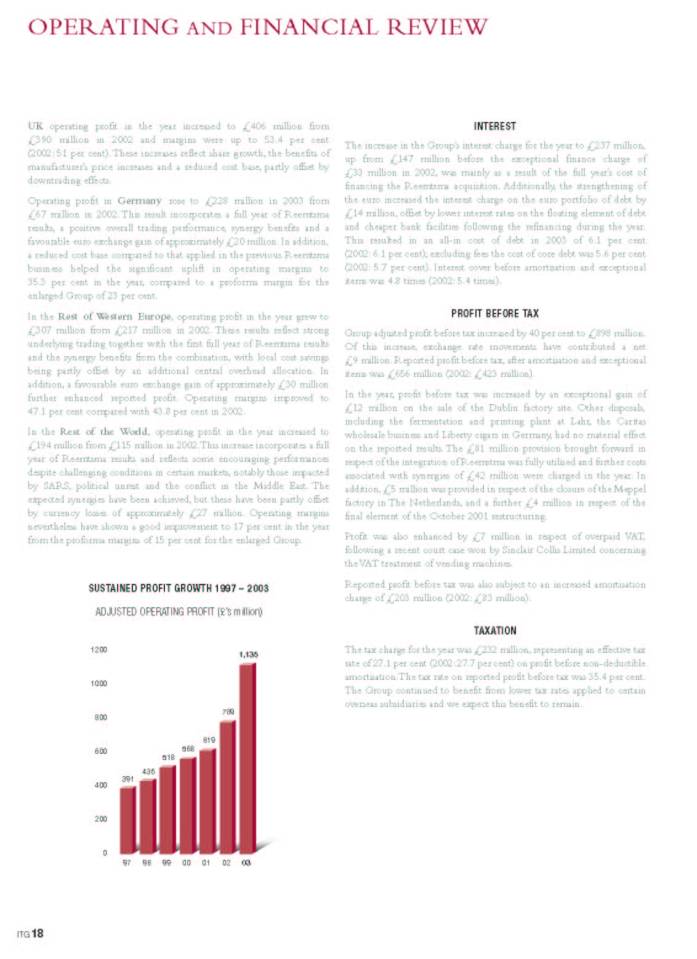
SUSTAINED PROFIT GROWTH 1997 – 2003
ADJUSTED OPERATING PROFIT (£’s million)
[CHART]
INTEREST
The increase in the Group’s interest charge for the year to £237 million, up from £147 million before the exceptional finance charge of £33 million in 2002, was mainly as a result of the full year’s cost of financing the Reemtsma acquisition. Additionally, the strengthening of the euro increased the interest charge on the euro portfolio of debt by £14 million, offset by lower interest rates on the floating element of debt and cheaper bank facilities following the refinancing during the year. This resulted in an all-in cost of debt in 2003 of 6.1 per cent (2002: 6.1 per cent); excluding fees the cost of core debt was 5.6 per cent (2002: 5.7 per cent). Interest cover before amortisation and exceptional items was 4.8 times (2002: 5.4 times).
PROFIT BEFORE TAX
Group adjusted profit before tax increased by 40 per cent to £898 million. Of this increase, exchange rate movements have contributed a net £9 million. Reported profit before tax, after amortisation and exceptional items was £656 million (2002: £423 million).
In the year, profit before tax was increased by an exceptional gain of £12 million on the sale of the Dublin factory site. Other disposals, including the fermentation and printing plant at Lahr, the Caritas wholesale business and Liberty cigars in Germany, had no material effect on the reported results. The £81 million provision brought forward in respect of the integration of Reemstma was fully utilised and further costs associated with synergies of £42 million were charged in the year. In addition, £5 million was provided in respect of the closure of the Meppel factory in The Netherlands, and a further £4 million in respect of the final element of the October 2001 restructuring.
Profit was also enhanced by £7 million in respect of overpaid VAT, following a recent court case won by Sinclair Collis Limited concerning the VAT treatment of vending machines.
Reported profit before tax was also subject to an increased amortisation charge of £203 million (2002: £83 million).
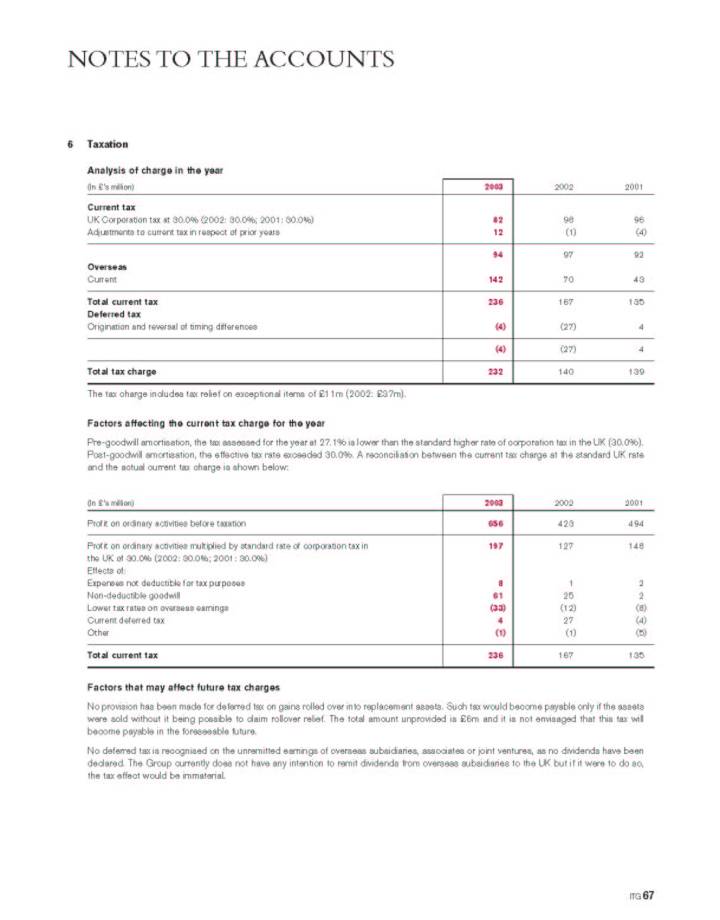
TAXATION
The tax charge for the year was £232 million, representing an effective tax rate of 27.1 per cent (2002: 27.7 per cent) on profit before non-deductible amortisation. The tax rate on reported profit before tax was 35.4 per cent. The Group continued to benefit from lower tax rates applied to certain overseas subsidiaries and we expect this benefit to remain.
18
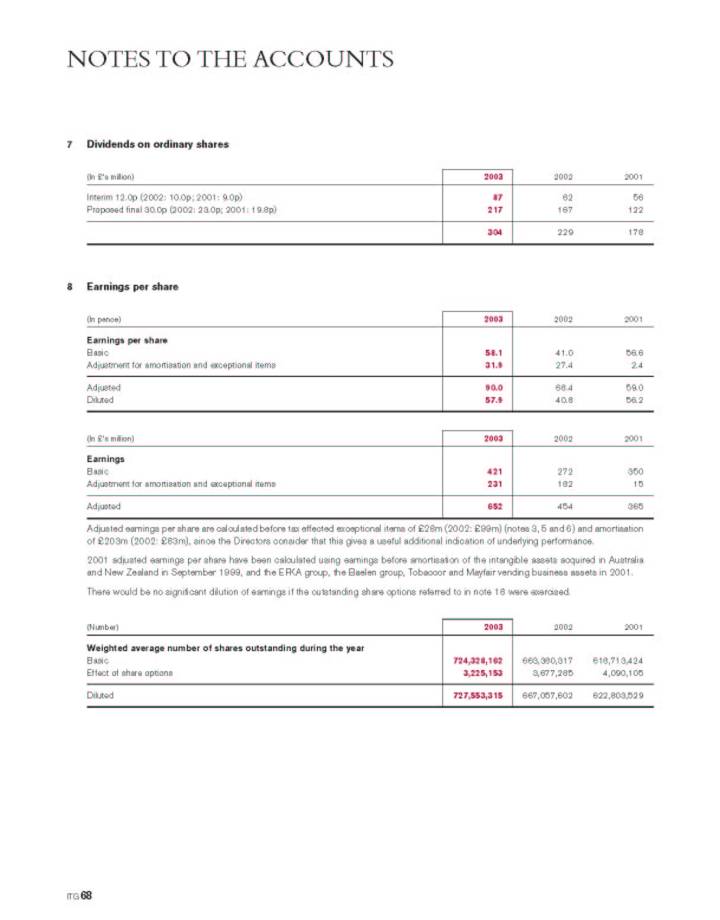
EARNINGS AND DIVIDENDS
In 2003, the Group has delivered basic earnings per share of 58.1 pence (2002: 41.0 pence) and adjusted earnings per share of 90.0 pence (2002:68.4 pence), an increase of 32 per cent . The proposed final dividend for 2003 is 30.0 pence per share, bringing the total dividend for the year to 42.0 pence per share, a 27 per cent increase. This is consistent with the Group’s dividend policy of growing dividends broadly in line with earnings, but allowing for the cash impact of restructuring in the year.
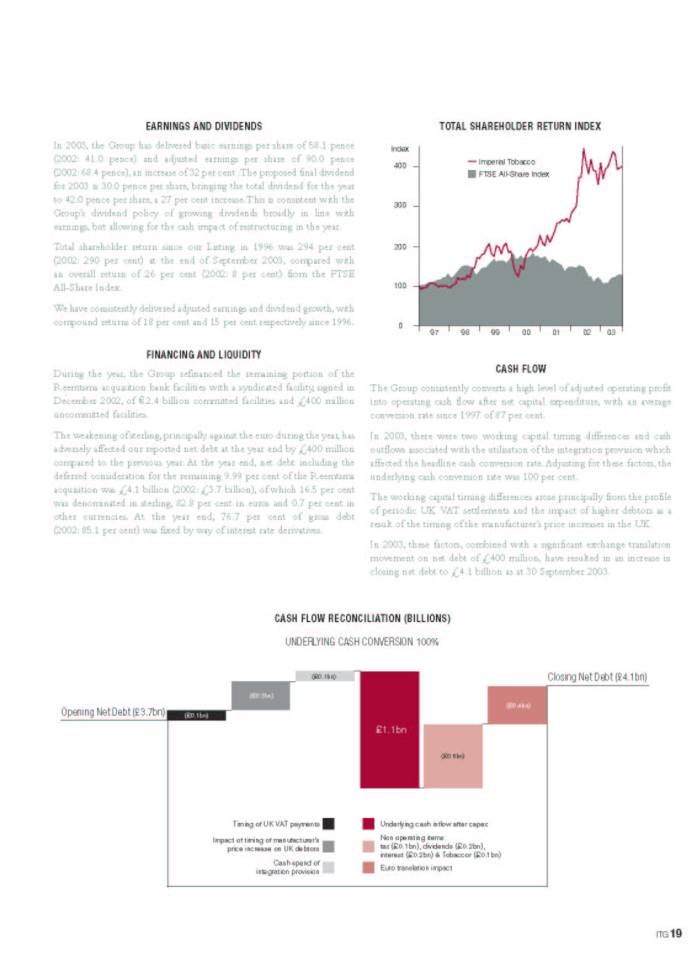
Total shareholder return since our Listing in 1996 was 294 per cent (2002: 290 per cent) at the end of September 2003, compared with an overall return of 26 per cent (2002: 8 per cent) from the FTSE All-Share Index.
We have consistently delivered adjusted earnings and dividend growth, with compound returns of 18 per cent and 15 per cent respectively since 1996.
FINANCING AND LIQUIDITY
During the year, the Group refinanced the remaining portion of the Reemtsma acquisition bank facilities with a syndicated facility, signed in December 2002, of €2.4 billion committed facilities and £400 million uncommitted facilities.
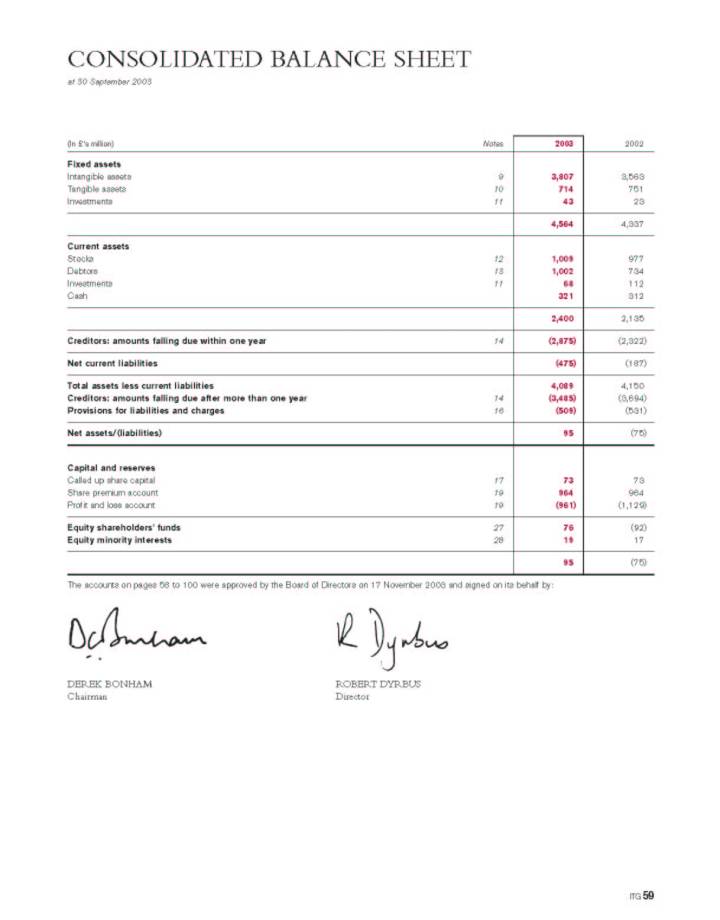
The weakening of sterling, principally against the euro during the year, has adversely affected our reported net debt at the year end by £400 million compared to the previous year. At the year end, net debt including the deferred consideration for the remaining 9.99 per cent of the Reemtsma acquisition was £4.1 billion (2002: £3.7 billion), of which 16.5 per cent was denominated in sterling, 82.8 per cent in euros and 0.7 per cent in other currencies. At the year end, 76.7 per cent of gross debt (2002: 85.1 per cent) was fixed by way of interest rate derivatives.
TOTAL SHAREHOLDER RETURN INDEX
[CHART]
CASH FLOW
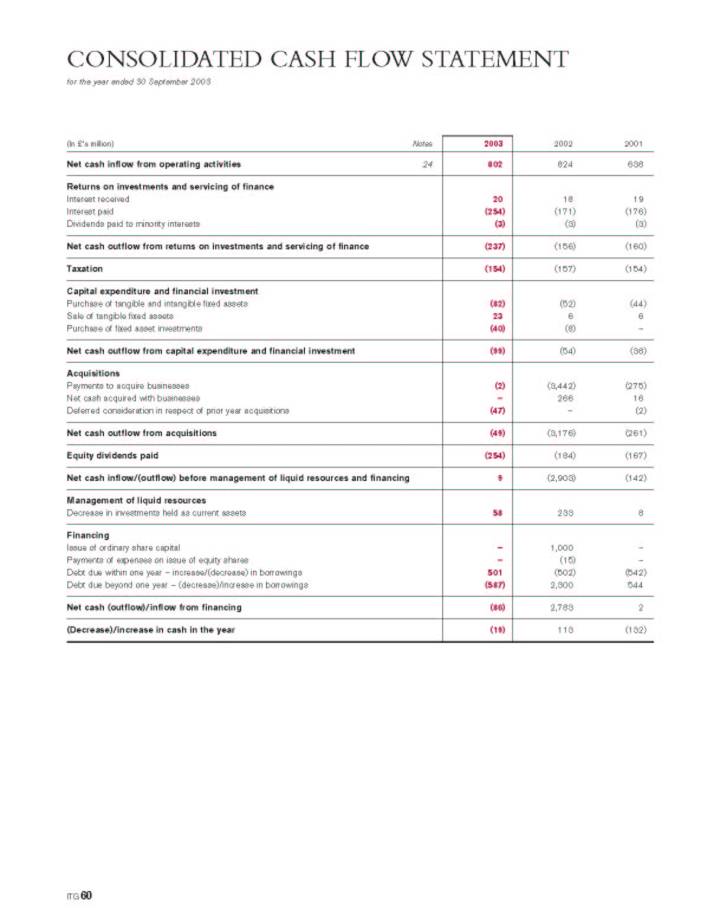
The Group consistently converts a high level of adjusted operating profit into operating cash flow after net capital expenditure, with an average conversion rate since 1997 of 87 per cent.
In 2003, there were two working capital timing differences and cash outflows associated with the utilisation of the integration provision which affected the headline cash conversion rate. Adjusting for these factors, the underlying cash conversion rate was 100 per cent.
The working capital timing differences arose principally from the profile of periodic UK VAT settlements and the impact of higher debtors as a result of the timing of the manufacturer’s price increases in the UK.
In 2003, these factors, combined with a significant exchange translation movement on net debt of £400 million, have resulted in an increase in closing net debt to £4.1 billion as at 30 September 2003.
CASH FLOW RECONCILIATION (BILLIONS)
UNDERLYING CASH CONVERSION 100%
[CHART]
19
OPERATING AND FINANCIAL REVIEW
UNITED KINGDOM
The United Kingdom continues to make a significant contribution to the performance of the Group generating 36 per cent of adjusted operating profit in 2003.
The UK Government announcement in October 2002 of increased duty-paid indicative levels for EU travellers, from 800 cigarettes to 3,200, prompted an initial decline in the size of the UK duty-paid market. However, the market stabilised towards the end of the year, and we estimate the UK duty-paid cigarette market averaged 54 billion cigarettes in the year to September 2003 (2002: 56 billion) with a roll your own tobacco market of 2,800 tonnes (2002: 2,800 tonnes).
We had another successful year in the UK, with our branded cigarette market share continuing to grow from an average of 42.9 per cent in 2002 to 44 per cent in 2003, further extending our market leadership.
Lambert & Butler, the top selling UK cigarette brand family, grew market share to 16.2 per cent in September 2003. Richmond continued to strengthen and remains the second largest selling brand family in the UK with market share consistently growing in the four years since its launch to 12.2 per cent in September 2003. In the premium sector, Embassy has delivered another robust performance, closing the year with market share of 3.9 per cent.
In our second year of distributing the Marlboro brand family on behalf of Philip Morris, we have increased retail distribution such that its market share reached 7.5 per cent in September 2003.
Our strong position in the roll your own tobacco market was maintained with a market share of over 64 per cent, with Golden Virginia retaining clear leadership of the category. Drum and Drum Gold, now available in new resealable pouches, strengthened their positions to 15.8 per cent market share at the end of the year.
Rizla continued to hold over three-quarters of the rolling papers market and in September, we announced the introduction of Rizla Silver, a premium ultra-fine rolling paper. Our cigar range, including Classic, Panama and King Edward Coronets, had a good year with market share growing to 38.6 per cent of the small cigar sector.
In light of UK legislation, which significantly restricted tobacco advertising and sponsorship, we have strengthened our brand availability and visibility at the point-of-sale. Our focus has been on developing a leading position in the supply of merchandising display furniture to retail outlets. We have over 33,000 units installed in the various retail channels in the UK.
In July 2003, Imperial Tobacco was voted ‘Supplier of the Year’ by retailers from the convenience sector, beating more than 60 leading branded grocery and drinks manufacturers.
In the UK, our key integration actions are now complete, with the closure of the former Reemtsma company offices. Manufacturing of a range of private label products has been transferred to the UK, sales of which have not been included in the Group’s market share.
The size of the market will continue to be a key factor affecting our UK profit delivery. In the context of moderate market decline, we see opportunities to improve profits further through effective management of the brand portfolio and cost efficiencies. We will continue to transfer expertise gained through our extensive UK operations to other similar markets, such as those in the Rest of Western Europe, ensuring that we share and build best practice and skills across the Group.
UNITED KINGDOM HIGHLIGHTS
|
| 2003 |
| 2002 |
|
|
|
|
|
|
|
Turnover ex. duty (£m) |
| 760 |
| 764 |
|
Operating profit (£m) |
| 406 |
| 390 |
|
|
|
|
|
|
|
Cigarette volumes (bn)(1) |
| 29.8 |
| 29.3 |
|
Roll your own (000’s tonnes) |
| 1.8 |
| 1.8 |
|
(1) includes 4.5 billion (2002: 4.1 billion)
Marlboro and Raffles volumes
We had another successful year in the UK, with our branded cigarette market share continuing to grow from an average of 42.9 per cent in 2002 to 44 per cent in 2003, further extending our market leadership.
20
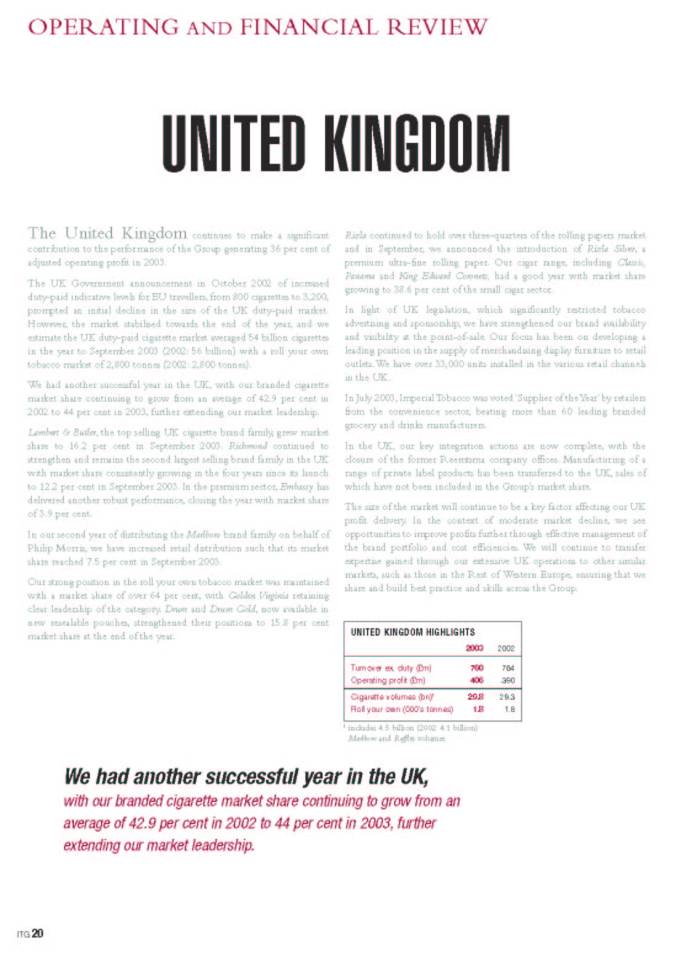
• WE WILL CONTINUE TO TRANSFER EXPERTISE GAINED THROUGH OUR EXTENSIVE UK OPERATIONS TO OTHER SIMILAR MARKETS, SUCH AS THOSE IN THE REST OF WESTERN EUROPE, ENSURING THAT WE SHARE AND BUILD BEST PRACTICE AND SKILLS ACROSS THE GROUP.
[GRAPHIC]
21
OPERATING AND FINANCIAL REVIEW
GERMANY
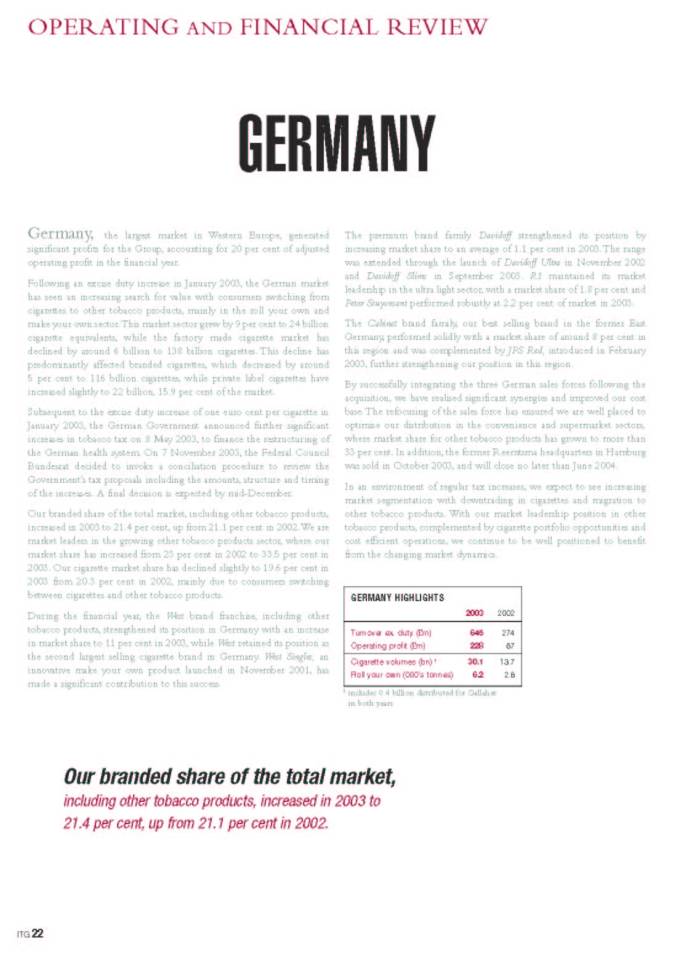
Germany, the largest market in Western Europe, generated significant profits for the Group, accounting for 20 per cent of adjusted operating profit in the financial year.
Following an excise duty increase in January 2003, the German market has seen an increasing search for value with consumers switching from cigarettes to other tobacco products, mainly in the roll your own and make your own sector. This market sector grew by 9 per cent to 24 billion cigarette equivalents, while the factory made cigarette market has declined by around 6 billion to 138 billion cigarettes. This decline has predominantly affected branded cigarettes, which decreased by around 5 per cent to 116 billion cigarettes, while private label cigarettes have increased slightly to 22 billion,15.9 per cent of the market.
Subsequent to the excise duty increase of one euro cent per cigarette in January 2003, the German Government announced further significant increases in tobacco tax on 8 May 2003, to finance the restructuring of the German health system. On 7 November 2003, the Federal Council Bundesrat decided to invoke a conciliation procedure to review the Government’s tax proposals including the amounts, structure and timing of the increases. A final decision is expected by mid-December.
Our branded share of the total market, including other tobacco products, increased in 2003 to 21.4 per cent, up from 21.1 per cent in 2002. We are market leaders in the growing other tobacco products sector, where our market share has increased from 23 per cent in 2002 to 33.5 per cent in 2003. Our cigarette market share has declined slightly to 19.6 per cent in 2003 from 20.3 per cent in 2002, mainly due to consumers switching between cigarettes and other tobacco products.
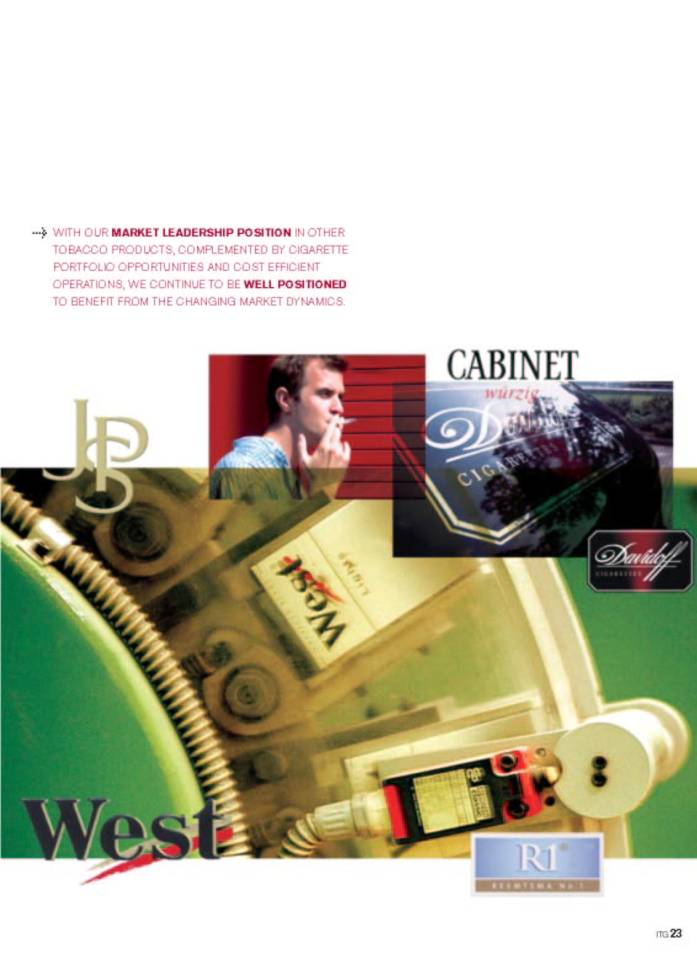
During the financial year, the West brand franchise, including other tobacco products, strengthened its position in Germany with an increase in market share to 11 per cent in 2003, while West retained its position as the second largest selling cigarette brand in Germany. West Singles, an innovative make your own product launched in November 2001, has made a significant contribution to this success.
The premium brand family Davidoff strengthened its position by increasing market share to an average of 1.1 per cent in 2003. The range was extended through the launch of Davidoff Ultra in November 2002 and Davidoff Slims in September 2003. R1 maintained its market leadership in the ultra light sector, with a market share of 1.8 per cent and Peter Stuyvesant performed robustly at 2.2 per cent of market in 2003.
The Cabinet brand family, our best selling brand in the former East Germany, performed solidly with a market share of around 8 per cent in this region and was complemented by JPS Red, introduced in February 2003, further strengthening our position in this region.
By successfully integrating the three German sales forces following the acquisition, we have realised significant synergies and improved our cost base. The refocusing of the sales force has ensured we are well placed to optimise our distribution in the convenience and supermarket sectors, where market share for other tobacco products has grown to more than 33 per cent. In addition, the former Reemtsma headquarters in Hamburg was sold in October 2003, and will close no later than June 2004.
In an environment of regular tax increases, we expect to see increasing market segmentation with downtrading in cigarettes and migration to other tobacco products. With our market leadership position in other tobacco products, complemented by cigarette portfolio opportunities and cost efficient operations, we continue to be well positioned to benefit from the changing market dynamics.
GERMANY HIGHLIGHTS
|
| 2003 |
| 2002 |
|
|
|
|
|
|
|
Turnover ex. duty (£m) |
| 645 |
| 274 |
|
Operating profit (£m) |
| 228 |
| 67 |
|
|
|
|
|
|
|
Cigarette volumes (bn)(1) |
| 30.1 |
| 13.7 |
|
Roll your own (000’s tonnes) |
| 6.2 |
| 2.6 |
|
(1) includes 0.4 billion distributed for Gallaher in both years
Our branded share of the total market, including other tobacco products, increased in 2003 to 21.4 per cent, up from 21.1 per cent in 2002.
22
• WITH OUR MARKET LEADERSHIP POSITION IN OTHER TOBACCO PRODUCTS, COMPLEMENTED BY CIGARETTE PORTFOLIO OPPORTUNITIES AND COST EFFICIENT OPERATIONS, WE CONTINUE TO BE WELL POSITIONED TO BENEFIT FROM THE CHANGING MARKET DYNAMICS.
[GRAPHIC]
23
OPERATING AND FINANCIAL REVIEW
REST OF WESTERN EUROPE
The Rest of Western Europe has again delivered a strong performance. Good domestic results in a number of markets were enhanced by benefits from increased indicative levels available to UK travellers within the EU.
In France, a significant tax increase in January 2003 has led to a market decline of 7.6 per cent between January and September 2003. In spite of the adverse external environment, we have succeeded in achieving improved margins in cigarettes, and in May 2003, West was launched in France, achieving widespread national distribution. In addition, we have grown our roll your own tobacco market share to 30 per cent, driven by the successful performance of Interval, averaging 13.5 per cent in the year.
Our business in Southern Europe has made significant progress. Our greater focus on Italy has resulted in a strong performance for the combined portfolio assisted by the launch of Route 66 and benefiting from improved distribution and trade marketing structures. Volume and market share have increased in Spain, up to 4.2 per cent in September 2003 (2002: 3.7 per cent), and in Greece a record 6.9 per cent market share in 2003 was driven by the performance of Davidoff.
In Belgium and Luxembourg, we have grown Interval and Route 66 while our key domestic brand Bastos performed robustly. Distribution agreements with Altadis in Belgium and Luxembourg were terminated in July 2003.
In the face of overall cigarette market decline in Ireland, we have succeeded in growing market share, achieving 31.5 per cent in 2003 (2002: 31 per cent). In The Netherlands, despite some adverse trends in the roll your own tobacco market, Drum was stable at 24 per cent market share and Van Nelle grew to 25.5 per cent in September 2003. In the growing cigarette market, our share has increased to 2.7 per cent (2002: 2.4 per cent), supported by good performances from Davidoff and West.
After a strong start to the year, sales in the important registered mobile operator sector, which includes cross-channel ferries, Eurotunnel shops and French and Spanish airports, have been tempered in some outlets by the impact of French domestic price increases in January 2003.
During the year, the integration of Reemtsma has delivered substantial infrastructure savings and improved supply chain efficiencies throughout the region, following a programme of distributor rationalisation.
Rising taxes in a number of markets will encourage cross border shopping within the EU. The next few years will be challenging but we believe we are well placed to meet these challenges. We are looking to benefit from the strength of the enlarged brand portfolio, by leveraging existing market positions and infrastructure, and continuing our focused approach to marketing expenditure.
REST OF WESTERN EUROPE HIGHLIGHTS
|
| 2003 |
| 2002 |
|
|
|
|
|
|
|
Turnover ex. duty (£m) |
| 652 |
| 495 |
|
Operating profit (£m) |
| 307 |
| 217 |
|
|
|
|
|
|
|
Cigarette volumes (bn) |
| 19.7 |
| 14.2 |
|
Roll your own (000’s tonnes) |
| 16.7 |
| 17.1 |
|
During the year, the integration of Reemtsma has delivered substantial infrastructure savings and improved supply chain efficiencies throughout the region, following a programme of distributor rationalisation.
24
• GOOD DOMESTIC RESULTS IN A NUMBER OF MARKETS WERE ENHANCED BY BENEFITS FROM INCREASED INDICATIVE LEVELS AVAILABLE TO UK TRAVELLERS WITHIN THE EU.
[GRAPHIC]
25
OPERATING AND FINANCIAL REVIEW
REST OF THE WORLD
Central and Eastern Europe, Australasia, Asia Pacific, the Middle East and Africa, Global Duty Free
The Rest of the World remains a strong volume generator for the Group accounting for 50 per cent of volumes with improving profitability.
Our strategy for Central and Eastern Europe continues to be focused on strengthening our international strategic brands, particularly Davidoff and West, and expanding our presence in key markets while seeking to improve profitability.
In Poland, historically high tobacco tax increases have led to an overall tobacco market decline and an erosion of industry margins. In July 2003, prices were increased but the market continues to be highly competitive. Against this background, the increase in our market share from 17.9 per cent to 19.3 per cent was driven by growth in Mocne and West and the launch of Route 66.
Our total sales volumes in the Ukraine exceeded last year, due to the strong development of Prima and R1, with R1 growing by 30 per cent since launch. We also increased prices in the Ukraine, delivering improved margins.
We continued to grow market share in Russia for the third consecutive year, rising to 5.1 per cent in September 2003. This was driven by the continuing development of Davidoff, West and R1, supported by the successfully established brand Maxim Classic. Davidoff shipment volumes grew by 24 per cent during the period, and the brand has gained strength from the increased demand for Davidoff Slims. In the highly competitive environment of the low and mid-priced segment, Maxim was launched in a round-cornered pack in April 2003, and has been well received.
In a year characterised by an increasingly competitive environment in Australia, cigarette volumes grew and share was broadly held at just under 18 per cent on the back of improvements driven by Superkings and Peter Stuyvesant. Roll your own tobacco volumes have also grown and our share has reached 62.4 per cent (2002: 61.4 per cent) through the exceptional performance of the Champion brand.
In Asia Pacific, the world economic slowdown has adversely affected most Asian economies and the SARS outbreak especially impacted Taiwan, China, Singapore and Hong Kong.
In Taiwan, these factors and a general destocking across the market have led to a decline in total market volumes from 42 billion to 39 billion cigarettes. Consequently, our volumes and market share have been under pressure, particularly due to our premium portfolio bias. In the last few months of the financial year we have seen a recovery in volumes, and market share appears to be stabilising, closing the year at 11.2 per cent (2002: 13 per cent). The implementation of a new sales and distribution organisation should further assist recovery.
Our businesses in Vietnam and Laos continue to perform beyond expectations. Bastos enjoyed strong growth in Vietnam with an increase in volume of over 30 per cent during the year, taking our share to 8.6 per cent (2002: 8 per cent). In Laos our volumes have more than doubled over the past year.
In China, our co-operation with the State Tobacco Monopoly Administration and the negotiations with the Yuxi Hongta Group, resulted in the signing of a formal contract for local production and distribution. Production of West is expected to start in December 2003.
REST OF THE WORLD HIGHLIGHTS
|
| 2003 |
| 2002 |
|
|
|
|
|
|
|
Turnover ex. duty (£m) |
| 1,143 |
| 686 |
|
Operating profit (£m) |
| 194 |
| 115 |
|
|
|
|
|
|
|
Cigarette volumes (bn) |
| 111.7 |
| 62.5 |
|
Roll your own (000’s tonnes) |
| 2.1 |
| 2.2 |
|
We see many growth opportunities for the Group in the Rest of the World. We will continue to concentrate on growing our volumes and profitability in existing markets, looking for opportunities in new markets and making focused investments where we see long-term potential.
26
[GRAPHIC]
In the Middle East, growth continues to be driven by the excellent performance of Davidoff across the region, including the key markets of Saudi Arabia, the United Arab Emirates, Kuwait and Lebanon.
In Africa, the political situation in the Ivory Coast appears to have stabilised and sales volumes are currently around two-thirds of their pre-crisis levels. Both Burkina Faso and Senegal have performed well during the year with improved volumes and market shares, and the West launch into the Senegalese market has made encouraging progress. There has been an excellent performance in Madagascar which has returned to pre-conflict levels of profitability and Nigeria has made good progress in the year with volumes up 15 per cent on last year.
In the Global Duty Free business, significant progress has been made with the enhanced portfolio, with over 180 new product listings; prices have increased and distributor arrangements rationalised.
The key UK duty-free market continues to perform well in both volume and share terms. Market share has grown to 38.3 per cent in 2003 (2002: 33.8 per cent), securing our leading position.
The conflict in the Middle East along with the outbreak of SARS has had an adverse effect on the number of travellers this year, which has particularly impacted upon duty-free market volumes in Asia where Davidoff has a strong brand presence.
We see many growth opportunities for the Group in the Rest of the World, although the region is inherently more volatile than other regions in which we operate. We will continue to concentrate on growing our volumes and profitability in existing markets, looking for opportunities in new markets and making focused investments where we see long-term potential.
27
OPERATING AND FINANCIAL REVIEW
MANUFACTURING
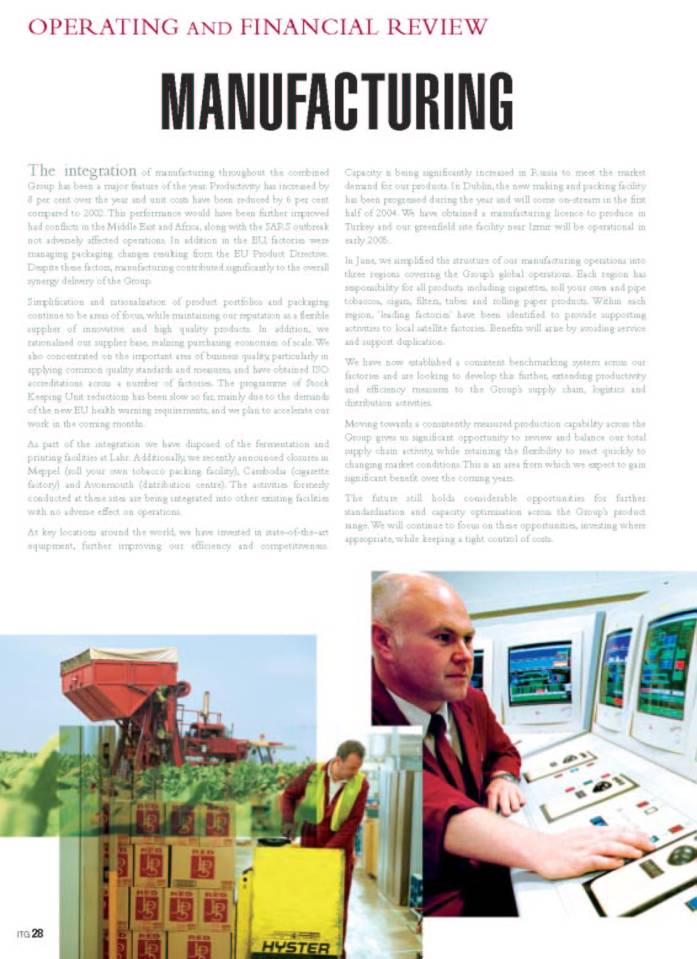
The integration of manufacturing throughout the combined Group has been a major feature of the year. Productivity has increased by 8 per cent over the year and unit costs have been reduced by 6 per cent compared to 2002. This performance would have been further improved had conflicts in the Middle East and Africa, along with the SARS outbreak not adversely affected operations. In addition in the EU, factories were managing packaging changes resulting from the EU Product Directive. Despite these factors, manufacturing contributed significantly to the overall synergy delivery of the Group.
Simplification and rationalisation of product portfolios and packaging continue to be areas of focus, while maintaining our reputation as a flexible supplier of innovative and high quality products. In addition, we rationalised our supplier base, realising purchasing economies of scale. We also concentrated on the important area of business quality, particularly in applying common quality standards and measures, and have obtained ISO accreditations across a number of factories. The programme of Stock Keeping Unit reductions has been slow so far, mainly due to the demands of the new EU health warning requirements, and we plan to accelerate our work in the coming months.
As part of the integration we have disposed of the fermentation and printing facilities at Lahr. Additionally, we recently announced closures in Meppel (roll your own tobacco packing facility), Cambodia (cigarette factory) and Avonmouth (distribution centre). The activities formerly conducted at these sites are being integrated into other existing facilities with no adverse effect on operations.
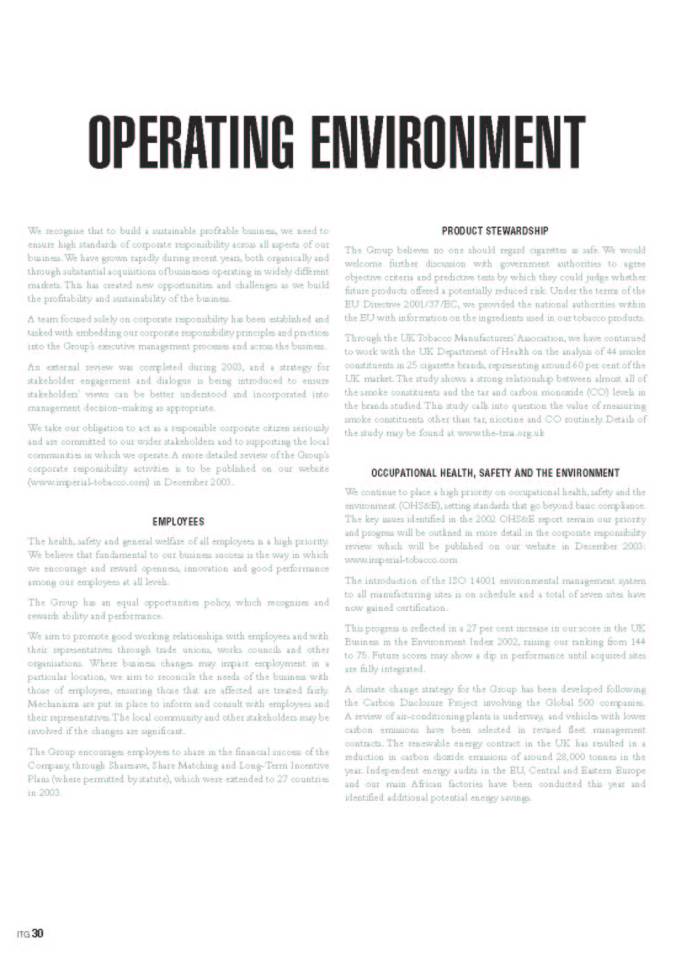
At key locations around the world, we have invested in state-of-the-art equipment, further improving our efficiency and competitiveness.
Capacity is being significantly increased in Russia to meet the market demand for our products. In Dublin, the new making and packing facility has been progressed during the year and will come on-stream in the first half of 2004. We have obtained a manufacturing licence to produce in Turkey and our greenfield site facility near Izmir will be operational in early 2005.
In June, we simplified the structure of our manufacturing operations into three regions covering the Group’s global operations. Each region has responsibility for all products including cigarettes, roll your own and pipe tobaccos, cigars, filters, tubes and rolling paper products. Within each region, ‘leading factories’ have been identified to provide supporting activities to local satellite factories. Benefits will arise by avoiding service and support duplication.
We have now established a consistent benchmarking system across our factories and are looking to develop this further, extending productivity and efficiency measures to the Group’s supply chain, logistics and distribution activities.
Moving towards a consistently measured production capability across the Group gives us significant opportunity to review and balance our total supply chain activity, while retaining the flexibility to react quickly to changing market conditions. This is an area from which we expect to gain significant benefit over the coming years.
The future still holds considerable opportunities for further standardisation and capacity optimisation across the Group’s product range. We will continue to focus on these opportunities, investing where appropriate, while keeping a tight control of costs.
[GRAPHIC]
28
[GRAPHIC]
29
OPERATING ENVIRONMENT
We recognise that to build a sustainable profitable business, we need to ensure high standards of corporate responsibility across all aspects of our business. We have grown rapidly during recent years, both organically and through substantial acquisitions of businesses operating in widely different markets. This has created new opportunities and challenges as we build the profitability and sustainability of the business.
A team focused solely on corporate responsibility has been established and tasked with embedding our corporate responsibility principles and practices into the Group’s executive management processes and across the business.
An external review was completed during 2003, and a strategy for stakeholder engagement and dialogue is being introduced to ensure stakeholders’ views can be better understood and incorporated into management decision-making as appropriate.
We take our obligation to act as a responsible corporate citizen seriously and are committed to our wider stakeholders and to supporting the local communities in which we operate. A more detailed review of the Group’s corporate responsibility activities is to be published on our website (www.imperial-tobacco.com) in December 2003.
EMPLOYEES
The health, safety and general welfare of all employees is a high priority. We believe that fundamental to our business success is the way in which we encourage and reward openness, innovation and good performance among our employees at all levels.
The Group has an equal opportunities policy, which recognises and rewards ability and performance.
We aim to promote good working relationships with employees and with their representatives through trade unions, works councils and other organisations. Where business changes may impact employment in a particular location, we aim to reconcile the needs of the business with those of employees, ensuring those that are affected are treated fairly. Mechanisms are put in place to inform and consult with employees and their representatives. The local community and other stakeholders may be involved if the changes are significant.
The Group encourages employees to share in the financial success of the Company, through Sharesave, Share Matching and Long-Term Incentive Plans (where permitted by statute), which were extended to 27 countries in 2003.
PRODUCT STEWARDSHIP
The Group believes no one should regard cigarettes as safe. We would welcome further discussion with government authorities to agree objective criteria and predictive tests by which they could judge whether future products offered a potentially reduced risk. Under the terms of the EU Directive 2001/37/EC, we provided the national authorities within the EU with information on the ingredients used in our tobacco products.
Through the UK Tobacco Manufacturers’ Association, we have continued to work with the UK Department of Health on the analysis of 44 smoke constituents in 25 cigarette brands, representing around 60 per cent of the UK market. The study shows a strong relationship between almost all of the smoke constituents and the tar and carbon monoxide (CO) levels in the brands studied. This study calls into question the value of measuring smoke constituents other than tar, nicotine and CO routinely. Details of the study may be found at www.the-tma.org.uk
OCCUPATIONAL HEALTH, SAFETY AND THE ENVIRONMENT
We continue to place a high priority on occupational health, safety and the environment (OHS&E), setting standards that go beyond basic compliance. The key issues identified in the 2002 OHS&E report remain our priority and progress will be outlined in more detail in the corporate responsibility review which will be published on our website in December 2003: www.imperial-tobacco.com
The introduction of the ISO 14001 environmental management system to all manufacturing sites is on schedule and a total of seven sites have now gained certification.
This progress is reflected in a 27 per cent increase in our score in the UK Business in the Environment Index 2002, raising our ranking from 144 to 75. Future scores may show a dip in performance until acquired sites are fully integrated.
A climate change strategy for the Group has been developed following the Carbon Disclosure Project involving the Global 500 companies. A review of air-conditioning plants is underway, and vehicles with lower carbon emissions have been selected in revised fleet management contracts. The renewable energy contract in the UK has resulted in a reduction in carbon dioxide emissions of around 28,000 tonnes in the year. Independent energy audits in the EU, Central and Eastern Europe and our main African factories have been conducted this year and identified additional potential energy savings.
30
Around 60 per cent of non-hazardous solid waste produced by sites in the Group able to report data was recycled. Less than 0.3 per cent of the total was classed as hazardous, as defined in local regulations.
The Group has commissioned a biodiversity impact assessment across all operations. In Madagascar, plans for the operation to be self-sufficient in wood in 2007 remain on target and native hardwood is being planted in addition to fast-growing eucalyptus. Improved curing barns are being introduced which will be more sustainable and fuel-efficient.
SOCIAL AND COMMUNITY INVESTMENT
We purchase over 95 per cent of our tobacco from leaf suppliers and grow the remainder, primarily in Madagascar. We are a significant employer in Madagascar, both directly and indirectly. Employees have benefited from the Group securing electricity and food supplies, as well as making contributions towards local healthcare provision.
In 2003, we extended the Social Responsibility in Tobacco Production programme across all our operations to ensure high standards for the cultivation and purchase of tobacco leaf. The programme covers integrated crop management, tobacco processing and socio-economic issues. It involves self-assessment, continual improvement and verification visits on an intended three-year cycle.
The Board has decided that the Group will be guided on human rights issues by the Organisation for Economic Co-operation and Development guidelines for multinational enterprises, and a programme of social audit and performance improvement has been established.
As a matter of policy, the Group does not employ children and our supplier policy promotes compliance with international standards on child labour. We are an active member of the Eliminating Child Labour in Tobacco Foundation (www.endchildlabour.org).
The Group has long supported community activities in the geographical areas of its operations and, in 2003, our total charitable donations were £575,000.
We support and encourage employees to participate in community activities and to raise money for charitable causes, and in many cases we match the money raised. We also match donations made by employees under the Give As You Earn scheme, administered through the Charities Aid Foundation.
TOBACCO INDUSTRY ISSUES
Regulatory pressures on the industry have continued in 2003.
In May 2003, the World Health Organisation’s Framework Convention on Tobacco Control (FCTC) was adopted at the 56th World Health Assembly. We agree with several aspects of the Convention, most notably the need to prevent youth smoking and the urgent need to stamp out both smuggling and counterfeiting of tobacco products. However, the FCTC also includes measures more appropriately dealt with by other relevant authorities, and some that we believe are inappropriate. The Convention needs to be ratified by 40 countries before it comes into effect, 90 days after the fortieth country has done so.
In 2001, the EU passed a Directive on the manufacture, presentation and sale of tobacco products. Imperial Tobacco, together with British American Tobacco, challenged it on the grounds that it violated several principles of European law. In December 2002, the European Court of Justice ruled that the Directive was valid.
The Directive has now been transposed into national regulations in all Member States. Several EU accession countries are also starting to implement the Directive prior to their accession in May 2004. By actively sharing best practice and information across the Group, we are seeking to ensure we are in a strong position to meet these regulations.
The most visible requirements of the Directive are the larger health warnings required for all tobacco products and the removal of descriptors such as ‘light’ and ‘mild’. In September 2003, the EU Commission adopted a Decision which outlines the use of pictorial health warnings that may replace the warnings on the back of the pack, should a Member State choose to require them. It is unlikely that the precise details of the warnings will be known until September 2004.
The Directive also required manufacturers and importers to submit details of all ingredients used in tobacco products to each Member State, along with any available toxicological data. In December 2002, we submitted ingredient information and toxicological data in all Member States, even in the absence of national regulations. The format in which the ingredient information was submitted has been accepted by most Member States.
31
However, The Netherlands has rejected this format, and required the submission and publication of the detailed recipes of all tobacco products sold in the Dutch market. The Group believes that the Tobacco (Lists of Ingredients) Regulation 2003, which provides for publication of ingredients and formulae of tobacco products, goes beyond what is allowed by the EU Directive on which the Dutch regulation is based. Like any company, we have concerns about revealing unique product formulae and, together with other leading tobacco manufacturers, we began legal procedures in September 2003. Belgium has also expressed concerns about the format of the ingredients information but as yet there has been no similar action.
In December 2002, the Council of EU Health Ministers adopted a Recommendation on the prevention of smoking and on initiatives to improve tobacco control (2003/54/EC). The Recommendation is non-binding to the Member States and includes restrictions on vending machines, a ban on packs of less than 19 cigarettes and the prohibition of promotional items bearing tobacco brand names.
The EU also passed a new Advertising and Sponsorship Directive in May 2003. Whilst the new Directive is narrower in scope than its predecessor, which was annulled by the European Court of Justice in October 2000, we believe it contains several flaws. Germany recognised this and voted against it, and is now challenging the Directive in the European Court of Justice.
In the UK, the Advertising & Sponsorship Act came into force in February 2003. All advertising is now prohibited except at the point-of-sale, which may also be severely restricted if the draft regulations notified to the European Commission come into force. Sponsorship is also banned but there is an exemption for world events such as Formula 1 and the Embassy World Snooker Championships until July 2005, in line with the dates set by the EU Advertising Directive.
In Ireland, the Office of Tobacco Control has been established and the draft Public Health (Tobacco) Bill has been notified to the EU Commission. The Bill prohibits cigarette packs containing less than 20 cigarettes and the display of tobacco products at the point-of-sale. The Irish Government also intends to introduce a ban on smoking in public places from early February 2004. There is considerable opposition to this ban from the hospitality sector concerned at its effect on trade.
The debate on smoking in public places continues in many countries. To date, the UK Government has indicated that it prefers to proceed with voluntary restrictions on smoking, working with the hospitality industry rather than introducing legislation.
We remain committed to continuing to work constructively with individual governments and other regulatory bodies to ensure the sensible and proportionate regulation of tobacco products.
TAXATION
We have seen the announcement of a number of significant tax increases across Western Europe during 2003, particularly in France, The Netherlands and Belgium, with the most notable being proposed in Germany. On 7 November 2003, the Federal Council Bundesrat decided to invoke a conciliation procedure to review the Government’s tax proposals including the amounts, structure and timing of the increases. A final decision is expected in mid-December. We remain concerned that continued tax increases will fuel the level of illegal cross-border trade.
The fall in the smuggling of Imperial Tobacco’s brands back into the UK has been significant and encouraging. An investigation by the German authorities into Reemtsma trading practices, which relates to a period prior to the acquisition, is ongoing. In July 2003, we signed a Memorandum of Understanding with HM Customs & Excise in the UK, formalising the adoption of jointly developed protocols to combat the smuggling and counterfeiting of tobacco products. We continue our dialogue with governments in other markets to explore opportunities for the possible extension of protocols.
TOBACCO RELATED LITIGATION
The one legal action in England and Wales, in which Imperial Tobacco was involved, has been dismissed.
In Scotland, Imperial Tobacco is currently involved in 11 separate cases, where individual claimants are seeking damages for alleged smoking-related health effects. Of these cases, nine have been stayed. In one of the other cases, commenced by Alfred McTear in 1993, the trial started on 7 October 2003 and is scheduled to last until March 2004. In the other case, the claimant is representing himself and there has been no activity since July 2001.
32
In the Republic of Ireland, the number of active individual claims against Imperial Tobacco currently stands at 45. Statements of claims have been served in 42 of these cases. Since 1997, 351 claims against Imperial Tobacco and other tobacco companies have been dismissed, discontinued or confirmed as not proceeding. No trial dates have been set in any of the claims against Imperial Tobacco.
In The Netherlands, Imperial Tobacco has received claim letters on behalf of 44 individuals, although 15 of those individuals have now withdrawn. Other tobacco companies have received similar letters. Testimony has been taken from a majority of the claimants at preliminary hearings but no actual proceedings have been commenced against Imperial Tobacco or any of its subsidiaries in The Netherlands.
In Germany, one individual claimant had served proceedings on Imperial Tobacco. On 14 November 2003, the German court rejected this claim as being without merit.
In Poland, one individual claimant has served proceedings on Imperial Tobacco. There have been several preliminary hearings with further hearings anticipated during 2004.
In Australia, an individual claimant has served proceedings on seven tobacco companies including Imperial Tobacco. A statement of claim has been served.
To date, no judgment has been entered against Imperial Tobacco and no action has been settled in favour of a claimant in any tobacco-related litigation involving Imperial Tobacco or any of its subsidiaries. Imperial Tobacco has been advised by its lawyers that it has meritorious defences to the legal proceedings in which individuals are seeking damages for alleged smoking-related health effects and to threatened actions of a similar nature.
We take our obligation to act as a responsible corporate citizen seriously. We are committed to our wider stakeholders and to supporting the local communities in which we operate.
33
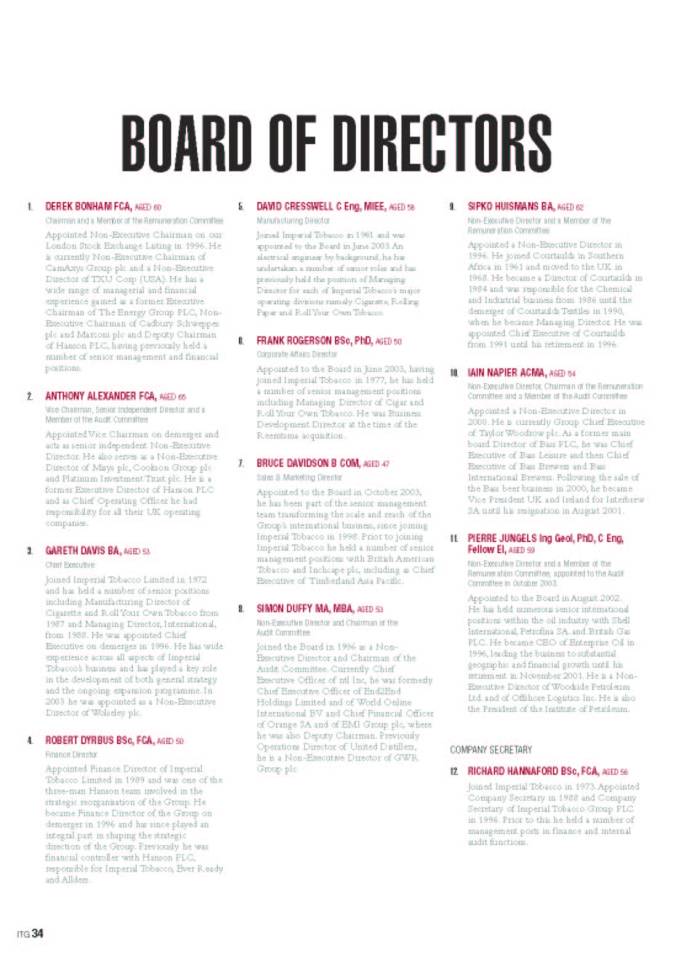
BOARD OF DIRECTORS
1. DEREK BONHAM FCA, AGED 60
Chairman and a Member of the Remuneration Committee
Appointed Non-Executive Chairman on our London Stock Exchange Listing in 1996. He is currently Non-Executive Chairman of CamAxys Group plc and a Non-Executive Director of TXU Corp (USA). He has a wide range of managerial and financial experience gained as a former Executive Chairman of The Energy Group PLC, Non-Executive Chairman of Cadbury Schweppes plc and Marconi plc and Deputy Chairman of Hanson PLC, having previously held a number of senior management and financial positions.
2. ANTHONY ALEXANDER FCA, AGED 65
Vice Chairman, Senior Independent Director and a Member of the Audit Committee
Appointed Vice Chairman on demerger and acts as senior independent Non-Executive Director. He also serves as a Non-Executive Director of Misys plc, Cookson Group plc and Platinum Investment Trust plc. He is a former Executive Director of Hanson PLC and as Chief Operating Officer he had responsibility for all their UK operating companies.
3. GARETH DAVIS BA, AGED 53
Chief Executive
Joined Imperial Tobacco Limited in 1972 and has held a number of senior positions including Manufacturing Director of Cigarette and Roll Your Own Tobacco from 1987 and Managing Director, International, from 1988. He was appointed Chief Executive on demerger in 1996. He has wide experience across all aspects of Imperial Tobacco’s business and has played a key role in the development of both general strategy and the ongoing expansion programme. In 2003 he was appointed as a Non-Executive Director of Wolseley plc.
4. ROBERT DYRBUS BSc, FCA, AGED 50
Finance Director
Appointed Finance Director of Imperial Tobacco Limited in 1989 and was one of the three-man Hanson team involved in the strategic reorganisation of the Group. He became Finance Director of the Group on demerger in 1996 and has since played an integral part in shaping the strategic direction of the Group. Previously he was financial controller with Hanson PLC, responsible for Imperial Tobacco, Ever Ready and Allders.
5. DAVID CRESSWELL C Eng, MIEE, AGED 58
Manufacturing Director
Joined Imperial Tobacco in 1961 and was appointed to the Board in June 2003. An electrical engineer by background, he has undertaken a number of senior roles and has previously held the position of Managing Director for each of Imperial Tobacco’s major operating divisions namely Cigarette, Rolling Paper and Roll Your Own Tobacco.
6. FRANK ROGERSON BSc, PhD, AGED 50
Corporate Affairs Director
Appointed to the Board in June 2003, having joined Imperial Tobacco in 1977, he has held a number of senior management positions including Managing Director of Cigar and Roll Your Own Tobacco. He was Business Development Director at the time of the Reemtsma acquisition.
7. BRUCE DAVIDSON B COM, AGED 47
Sales & Marketing Director
Appointed to the Board in October 2003, he has been part of the senior management team transforming the scale and reach of the Group’s international business, since joining Imperial Tobacco in 1998. Prior to joining Imperial Tobacco he held a number of senior management positions with British American Tobacco and Inchcape plc, including as Chief Executive of Timberland Asia Pacific.
8. SIMON DUFFY MA, MBA, AGED 53
Non-Executive Director and Chairman of the Audit Committee
Joined the Board in 1996 as a Non-Executive Director and Chairman of the Audit Committee. Currently Chief Executive Officer of ntl Inc, he was formerly Chief Executive Officer of End2End Holdings Limited and of World Online International BV and Chief Financial Officer of Orange SA and of EMI Group plc, where he was also Deputy Chairman. Previously Operations Director of United Distillers, he is a Non-Executive Director of GWR Group plc.
9. SIPKO HUISMANS BA, AGED 62
Non-Executive Director and a Member of the Remuneration Committee
Appointed a Non-Executive Director in 1996. He joined Courtaulds in Southern Africa in 1961 and moved to the UK in 1968. He became a Director of Courtaulds in 1984 and was responsible for the Chemical and Industrial business from 1986 until the demerger of Courtaulds Textiles in 1990, when he became Managing Director. He was appointed Chief Executive of Courtaulds from 1991 until his retirement in 1996.
10. IAIN NAPIER ACMA, AGED 54
Non-Executive Director, Chairman of the Remuneration Committee and a Member of the Audit Committee
Appointed a Non-Executive Director in 2000. He is currently Group Chief Executive of Taylor Woodrow plc. As a former main board Director of Bass PLC, he was Chief Executive of Bass Leisure and then Chief Executive of Bass Brewers and Bass International Brewers. Following the sale of the Bass beer business in 2000, he became Vice President UK and Ireland for Interbrew SA until his resignation in August 2001.
11. PIERRE JUNGELS Ing Geol, PhD, C Eng, Fellow El, AGED 59
Non-Executive Director and a Member of the Remuneration Committee; appointed to the Audit Committee in October 2003.
Appointed to the Board in August 2002. He has held numerous senior international positions within the oil industry with Shell International, Petrofina SA and British Gas PLC. He became CEO of Enterprise Oil in 1996, leading the business to substantial geographic and financial growth until his retirement in November 2001. He is a Non-Executive Director of Woodside Petroleum Ltd. and of Offshore Logistics Inc. He is also the President of the Institute of Petroleum.
COMPANY SECRETARY
12. RICHARD HANNAFORD BSc, FCA, AGED 56
Joined Imperial Tobacco in 1973. Appointed Company Secretary in 1988 and Company Secretary of Imperial Tobacco Group PLC in 1996. Prior to this he held a number of management posts in finance and internal audit functions.
34
[PHOTOS]
35
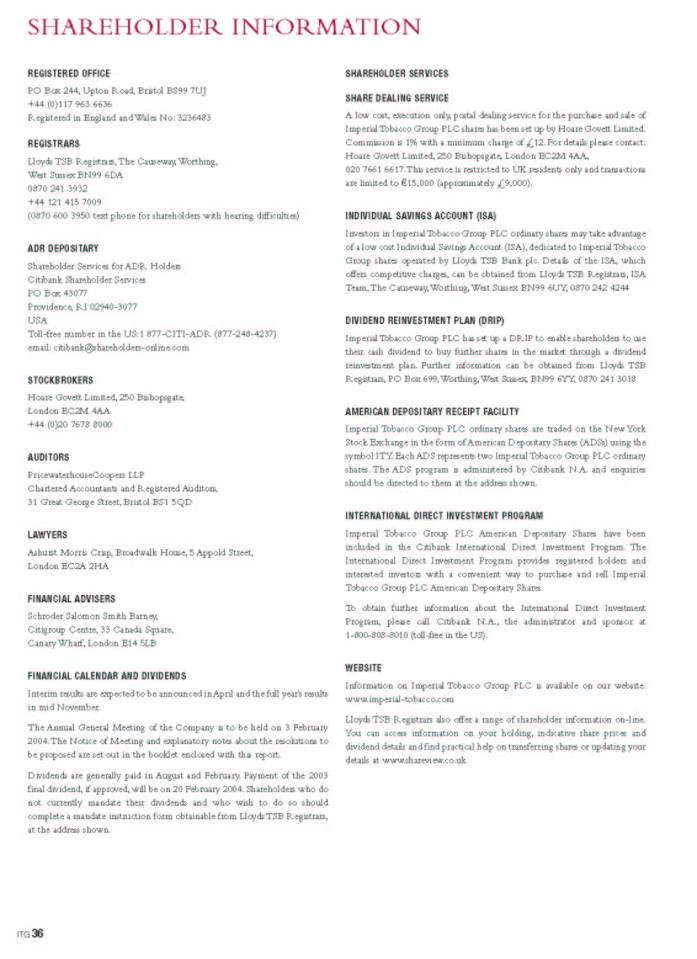
SHAREHOLDER INFORMATION
REGISTERED OFFICE
PO Box 244, Upton Road, Bristol BS99 7UJ
+44 (0)117 963 6636
Registered in England and Wales No: 3236483
REGISTRARS
Lloyds TSB Registrars, The Causeway, Worthing,
West Sussex BN99 6DA
0870 241 3932
+44 121 415 7009
(0870 600 3950 text phone for shareholders with hearing difficulties)
ADR DEPOSITARY
Shareholder Services for ADR Holders
Citibank Shareholder Services
PO Box 43077
Providence, RI 02940-3077
USA
Toll-free number in the US:1 877-CITI-ADR (877-248-4237)
email: citibank@shareholders-online.com
STOCKBROKERS
Hoare Govett Limited, 250 Bishopsgate,
London EC2M 4AA
+44 (0)20 7678 8000
AUDITORS
PricewaterhouseCoopers LLP
Chartered Accountants and Registered Auditors,
31 Great George Street, Bristol BS1 5QD
LAWYERS
Ashurst Morris Crisp, Broadwalk House, 5 Appold Street,
London EC2A 2HA
FINANCIAL ADVISERS
Schroder Salomon Smith Barney,
Citigroup Centre, 33 Canada Square,
Canary Wharf, London E14 5LB
FINANCIAL CALENDAR AND DIVIDENDS
Interim results are expected to be announced in April and the full year’s results in mid November.
The Annual General Meeting of the Company is to be held on 3 February 2004. The Notice of Meeting and explanatory notes about the resolutions to be proposed are set out in the booklet enclosed with this report.
Dividends are generally paid in August and February. Payment of the 2003 final dividend, if approved, will be on 20 February 2004. Shareholders who do not currently mandate their dividends and who wish to do so should complete a mandate instruction form obtainable from Lloyds TSB Registrars, at the address shown.
SHAREHOLDER SERVICES
SHARE DEALING SERVICE
A low cost, execution only, postal dealing service for the purchase and sale of Imperial Tobacco Group PLC shares has been set up by Hoare Govett Limited. Commission is 1% with a minimum charge of £12. For details please contact: Hoare Govett Limited, 250 Bishopsgate, London EC2M 4AA, 020 7661 6617. This service is restricted to UK residents only and transactions are limited to €15,000 (approximately £9,000).
INDIVIDUAL SAVINGS ACCOUNT (ISA)
Investors in Imperial Tobacco Group PLC ordinary shares may take advantage of a low cost Individual Savings Account (ISA), dedicated to Imperial Tobacco Group shares operated by Lloyds TSB Bank plc. Details of the ISA, which offers competitive charges, can be obtained from Lloyds TSB Registrars, ISA Team, The Causeway, Worthing, West Sussex BN99 6UY, 0870 242 4244
DIVIDEND REINVESTMENT PLAN (DRIP)
Imperial Tobacco Group PLC has set up a DRIP to enable shareholders to use their cash dividend to buy further shares in the market through a dividend reinvestment plan. Further information can be obtained from Lloyds TSB Registrars, PO Box 699, Worthing, West Sussex, BN99 6YY, 0870 241 3018
AMERICAN DEPOSITARY RECEIPT FACILITY
Imperial Tobacco Group PLC ordinary shares are traded on the New York Stock Exchange in the form of American Depositary Shares (ADSs) using the symbol ITY. Each ADS represents two Imperial Tobacco Group PLC ordinary shares. The ADS program is administered by Citibank N.A. and enquiries should be directed to them at the address shown.
INTERNATIONAL DIRECT INVESTMENT PROGRAM
Imperial Tobacco Group PLC American Depositary Shares have been included in the Citibank International Direct Investment Program. The International Direct Investment Program provides registered holders and interested investors with a convenient way to purchase and sell Imperial Tobacco Group PLC American Depositary Shares.
To obtain further information about the International Direct Investment Program, please call Citibank N.A., the administrator and sponsor at 1-800-808-8010 (toll-free in the US).
WEBSITE
Information on Imperial Tobacco Group PLC is available on our website: www.imperial-tobacco.com
Lloyds TSB Registrars also offer a range of shareholder information on-line. You can access information on your holding, indicative share prices and dividend details and find practical help on transferring shares or updating your details at www.shareview.co.uk
36
REPORT OF THE DIRECTORS
ACCOUNTS FOR 2003
The Directors submit their report together with the audited consolidated financial statements for the Group for the year to 30 September 2003.
Review of activities and future developments
The Group remains highly focused on its core business - the manufacture, marketing and sale of tobacco and tobacco-related products.
A review of the various activities and future developments is included on pages 17 to 33. Note 1 to the financial statements gives an analysis of turnover, duty in turnover, operating profit and capital employed.
The principal operating subsidiaries within the Group are shown on pages 99 and 100.
Financial results and dividends
The profit attributable to shareholders for the financial year was £421 million as shown in the consolidated profit and loss account set out on page 58. An operating and financial review is included on pages 17 to 29.
The Directors have declared dividends as follows:
(In £’s million) |
| 2003 |
| 2002 |
|
|
|
|
|
|
|
Ordinary shares |
|
|
|
|
|
Interim paid, 12.0p per share (2002: 10.0p) |
| 87 |
| 62 |
|
Proposed final, 30.0p per share (2002: 23.0p) |
| 217 |
| 167 |
|
Total ordinary dividends, 42.0p (2002: 33.0p) |
| 304 |
| 229 |
|
The final dividend, if approved, will be paid on 20 February 2004 to shareholders whose names are on the Register of Members at the close of business on 23 January 2004.
Share capital
Details of the share capital are shown in note 17 to the financial statements. At 13 November 2003 the Company has been notified that the following persons had interests in 3 per cent or more of the Company’s issued share capital.
|
| Number of |
| Percentage of |
|
|
|
|
|
|
|
Legal & General Investment Management Limited |
| 22 |
| 3.01 |
|
The Company has not received notification that any other person holds 3 per cent or more of the Company’s issued share capital.
Board of Directors
Mr D Cresswell and Dr F A Rogerson joined the Board as Manufacturing Director and Corporate Affairs Director respectively on 1 June 2003. Mr B C Davidson also joined the Board subsequent to the year end as Sales and Marketing Director on 1 October 2003.
On 9 July 2003, the Board accepted the resignations from the Board of Directors of Messrs M A Häussler and L W Staby.
The current Directors of the Company are shown on pages 34 and 35. In accordance with Articles 106 and 110 of the Company’s Articles of Association, Messrs S Huismans, I J G Napier, D Cresswell, B C Davidson and Dr F A Rogerson retire at the Annual General Meeting and being eligible, offer themselves for re-election.
37
Employees
The Group’s employment policies are designed to attract, retain and motivate the very best people, recognising that this can be achieved only through offering equal opportunities regardless of gender, race, religion or disability.
To ensure employees can share in our success, the Group offers competitive pay and benefit packages and, wherever possible, links rewards to individual and team performance. Employees are encouraged to build a stake in the Company through ownership of Imperial Tobacco Group PLC shares. A further opportunity to join the Sharesave Scheme was offered during the year and 73 per cent of eligible UK employees now participate. International employees were also offered a further opportunity to join the International Sharesave Plan and 23 per cent of eligible international employees now participate.
The Group is committed to providing an environment which encourages the continuous development of our employees through skills enhancement and comprehensive training programmes.
Each of the Group’s businesses is encouraged to make its employees aware of the financial and economic factors affecting the performance of their employing company using their own consultative and communication methods. To progress this aim further, employee representatives are briefed on pan-European issues through a European Employee Forum.
Information concerning employees and their remuneration is given in note 4 to the accounts.
Charitable and political donations
During the year the Group made charitable donations in the UK of £464,000 (2002: £663,000), much of which was distributed through the Charities Aid Foundation in accordance with the Group’s charities policy.
No political donations or expenditure were made or incurred by the Company or its subsidiaries during the year (2002: £10,200).
Creditor payment policy
The Company’s current policy concerning the payment of the majority of its trade creditors is to follow the CBI’s Prompt Payers Code (copies are available from the CBI, Centre Point, 103 New Oxford Street, London WC1A 1DU). For other suppliers, the Company’s policy is to:
a) settle the terms of payment with those suppliers when agreeing the terms of each transaction;
b) ensure that those suppliers are made aware of the terms of payment by inclusion of the relevant terms in contracts; and
c) pay in accordance with its contractual and other legal obligations.
The payment policy applies to all payments to creditors for revenue and capital supplies of goods and services without exception. Wherever possible, UK subsidiaries follow the same policy and international subsidiaries are encouraged to adopt similar policies, by applying local best practices.
The number of days’ purchases outstanding as at 30 September 2003 for Imperial Tobacco Group PLC was 31 days.
Research and development
The Group recognises the importance of investing in research and development, which brings innovative improvements to the Group, both in the products supplied to the consumer and in production and marketing techniques.
Auditors
Our Auditors, PricewaterhouseCoopers became a Limited Liability Partnership (LLP) during the year, following which PricewaterhouseCoopers resigned and the Directors appointed the new partnership PricewaterhouseCoopers LLP, as Auditors. A resolution to reappoint PricewaterhouseCoopers LLP as Auditors to the Company will be proposed at the Annual General Meeting.
Annual General Meeting
Full details of the Annual General Meeting to be held on 3 February 2004, and explanations of the resolutions to be proposed at the Meeting, appear in the Notice of Meeting enclosed with this report.
By order of the Board
/s/ R.C. Hannaford |
|
|
|
R.C. HANNAFORD, Company Secretary | |
| |
17 November 2003 | |
38
CORPORATE GOVERNANCE
The Board of Imperial Tobacco Group PLC remains committed to the highest standards of corporate governance, which it sees as a cornerstone in managing the business affairs of the Group and a fundamental part of discharging its stewardship responsibilities. Accordingly, throughout the year under review and up to the date of approval of the Annual Report, it has complied with the best practice governance provisions as set out in Section 1 of Part 2 of the Combined Code on Corporate Governance (the Code).
In addition it is addressing actively those few issues where it does not yet fully meet the recent further governance provisions of the New Combined Code (the New Code), which will formally apply to the Group only after 1 October 2004.
Corporate governance compliance
The Board recognises it is accountable to the Group’s shareholders for the Group’s standard of governance and this statement, together with the Remuneration Report, seeks to demonstrate how the principles of good governance, advocated by the Code, are applied in practice within Imperial Tobacco Group PLC.
During the course of the financial year there has been significant and continuing change in the way the Group manages its activities, arising principally from the acquisition and integration of Reemtsma Cigarettenfabriken GmbH (Reemtsma) in May 2002. Notwithstanding this change in the scale, geographic spread and management cultures, the Board has continued to keep under review the Group’s whole system of internal control, encompassing not just financial but also operational controls, compliance and risk management.
Across the Group, formal procedures, blended with well established and embedded internal controls have been developed further over the course of the current year. These measures, together with continuing regular, formal reporting to the Audit Committee, have ensured the maintenance of a strong procedural framework for the ongoing identification, evaluation and management of the significant areas of risk to achievement of the Group’s strategic objectives.
Prior to the acquisition of Reemtsma, an extensive due diligence review covering financial, operational, legal and environmental matters was performed which led us to believe that the Company was well controlled and managed. Further high level reviews of procedures to identify any requirements necessary to align more closely Reemtsma’s policies and procedures with the Group’s standards of corporate governance have since been undertaken such that the Board is satisfied that appropriate internal controls are now in place across the whole Group.
During January 2003 German authorities conducted a significant search of certain Group premises, including Reemtsma’s headquarters in Hamburg, as part of wide-ranging investigations into alleged foreign trading and related violations by Reemtsma during a period prior to its acquisition by the Group. As a result of their enquiries, a number of Reemtsma employees were named in search orders. A Board Committee under the Chairmanship of Mr A G L Alexander was established to monitor on a regular basis the progress and conduct of the investigations and the Group’s responses, on behalf of the Board. From its review of the current operations of the Reemtsma businesses, the Committee is satisfied that, since the acquisition, the Group has not been involved in any activities of a nature similar to those alleged by the authorities. We continue to cooperate fully with the authorities.
Whilst the Group can confirm that no charges have been brought against these employees or Reemtsma Cigarettenfabriken GmbH in relation to these investigations, since they could take several years to be concluded, the Board, in the interests of good corporate governance, required that the named employees be suspended on full pay for the duration of the investigations.
In the light of this, Mr M A Häussler, Sales & Marketing Director for the Group, one of the named employees, also tendered his resignation as a Director of Imperial Tobacco Group PLC and from his position as Speaker of the Vorstand, the Board of Directors of Reemtsma Cigarettenfabriken GmbH.
Given that it could not be excluded that the investigations might eventually bring about a conflict of interest between Imperial Tobacco Group and Mr L W Staby, a Non-Executive Director of Imperial Tobacco Group PLC and formerly Chief Executive of Tchibo, the company from whom the Group acquired Reemtsma, the Board thought it appropriate that he step down and accordingly accepted his resignation in July 2003.
During the course of the year, more detailed business reviews of the Group’s operations, performed as part of the Group Compliance Function’s normal programme, identified certain relatively minor weaknesses and failures in systems of control at the location level. From the resulting investigations into these matters, it has been concluded that neither individually nor collectively did they have a material impact on the results or performance of the Group for the year.
39
Board and Board Committees
The Board of Imperial Tobacco Group PLC, which meets at least five times a year, currently comprises six Non-Executive Directors and five Executive Directors, with a clear separation of the roles of Chairman and Chief Executive to ensure an appropriate balance of power and authority. Mr A G L Alexander is Vice Chairman and the recognised senior independent Non-Executive Director to whom any concerns can be conveyed. All of the Non-Executive Directors, in the opinion of the Board, are independent of management and free from any business or other relationship that could materially interfere with the exercise of their independent judgement. During the year, and prior to their resignations, it should be noted that Mr M A Häussler and Mr L W Staby were excluded from those parts of Board and Board Committees’ meetings at which the progress of the German investigations was reviewed.
During the year Dr F A Rogerson was appointed to the Board as Corporate Affairs Director to reflect the importance of the fierce regulatory environment in which the Group now operates, while Mr D Cresswell’s appointment as Manufacturing Director underlines the significance of the Group’s worldwide manufacturing and supply chain network and the risks and opportunities arising. Both appointments were effective from 1 June 2003.
At the same time, to further formalise and enhance the process of control and management of the larger and more complex Group, the Chief Executive’s Committee comprising the then Executive Directors and certain senior executives, including the Managing Director International, the Director of Finance and Planning and Group Human Resources Director, was formed. This is not only providing strong support to the Executive Directors but will also assist in the process of succession planning within the Group’s enlarged pool of management talent.
Further to this, at the end of September it was announced that Mr B C Davidson would join the Board as Sales & Marketing Director, with responsibility for the Group’s global sales and marketing activities across Europe, Africa, the Middle East, Asia Pacific and Australasia. This appointment was effective from 1 October 2003.
Directors’ biographies, appearing on page 34, demonstrate a detailed knowledge of the tobacco industry together with a range of business and financial experience, vital to the management of an expanding international company.
The full Board manages overall control of the Group’s affairs by the schedule of matters reserved for its decision. These include responsibility for the Group’s commercial strategy, the approval of financial statements, major acquisitions and disposals, authority levels for expenditure, treasury and risk management policies and succession plans for senior executives. It also has procedures in place to allow Directors to seek both independent professional advice, at the Company’s expense, and the advice and services of the Company Secretary in order to fulfil their duties.
All Directors are equally accountable under the law for the proper stewardship of the Group’s affairs, with the Non-Executive Directors having a particular responsibility for ensuring strategies proposed for the development of the business are critically reviewed. This ensures they act in the best long term interest of shareholders, take account of the wider community of interests represented by employees, customers and suppliers and that social, environmental and ethical issues are fully integrated into the Group’s risk assessment processes.
The Board regularly reviews the strategy and operating results of the business, as well as approving annual budgets and medium-term plans. Actual results of the Group are reviewed at each Board meeting, with monthly reports, including detailed commentary and analysis, being provided in the intervening periods. This ensures the Board is supplied with information on the progress of the business in a timely manner.
Within the framework of the Chief Executive’s Committee, the Board delegates day-to-day and business control matters to the Chief Executive and Executive Directors who, with the executive management, are responsible for implementing Group policy and monitoring the detailed performance of all aspects of the business, including post event reviews of major projects. They have full power to act subject to the reserved powers and sanctioning limits laid down by the Board and the Group’s standards and policy guidelines.
The Non-Executive Directors also play a leading role in corporate accountability and governance through their membership of the Remuneration Committee, the Nominations Committee and the Audit Committee. The membership and remit of each Committee is considered below.
Remuneration Committee
The Remuneration Committee, consisting exclusively of Non-Executive Directors, Mr D C Bonham, Mr S Huismans and Dr P H Jungels, meets at least twice a year under the chairmanship of Mr I J G Napier. It is responsible for setting salaries, incentives and other benefit arrangements of the Executive Directors and senior management, and overseeing the Group’s employee share schemes. Members of the Remuneration Committee do not participate in decisions concerning their own remuneration.
The Chief Executive attends by invitation to respond to questions raised by the Committee. However, he is specifically excluded from any matter concerning the details of his own remuneration.
40
Since Listing in 1996, all increases in the remuneration of Non-Executive Directors have been taken in the form of the Company’s shares, with the exception of the Chairman and Vice Chairman, where the requirement to reinvest fee increases net of tax was waived, following their increases in October 2002, given their continuing high level of investment in the Group. With the increase in fees of other Non-Executive Directors from 1 October 2003 from £35,000 to £40,000, it has been agreed that the salary threshold after which their fees are required to be reinvested in shares of the Group be increased from £25,000 to £30,000.
The Remuneration Report, which outlines remuneration strategy and policy and includes full details of Directors’ emoluments, has been approved by the Board and appears in this year’s Annual Report and Accounts on page 45.
Nominations Committee
The Nominations Committee comprising all the Non-Executive Directors and the Chief Executive with Mr D C Bonham as chairman, meets when necessary to formulate succession plans and recommendations to the Board for the appointment of Directors. New Directors appointed by the Board must submit themselves for re-election by shareholders at the Annual General Meeting following their appointment. Thereafter all Directors, in accordance with the Code, are subject to re-election at least every three years. The training needs in respect of new appointments to the Board are assessed and arrangements put in place, as appropriate.
Audit Committee
The Audit Committee, consisting exclusively of independent Non-Executive Directors, Mr A G L Alexander and Mr I J G Napier, met under the chairmanship of Mr S P Duffy, three times during the year. All of its members were qualified accountants, or have held senior finance positions in publicly quoted companies, and are therefore well qualified to discharge the responsibilities that Audit Committee membership entails. After the year end Dr P H Jungels was invited to join the Committee to replace Mr L W Staby who resigned during the year. The Committee’s terms of reference cover the points recommended by the Code. Its duties include monitoring internal control throughout the Group, approving the Group’s accounting policies and reviewing the interim and annual financial statements before submission to the full Board. It is also intended, in line with the New Code, that the Committee formally reviews all statements containing financial information and in particular, the requirement to review Form 20-F, prior to Board approval, is to be incorporated into the Committee’s annual programme.
The Committee also reviews and approves the scope and content of the risk assessment and compliance programme implemented by the Control and Compliance function and, as part of the annual assessment of the need for a formal internal audit function, critically reviews the resource allocated to this activity. The Finance Director, other financial management and the Group’s compliance manager attend by invitation. The Group’s Auditors also attend each meeting and have direct access to the Committee without the presence of any Executive Director, or manager, providing a direct line of communication between the Auditors and Non-Executive Directors. An opportunity for the Group’s compliance manager to meet formally with the Committee at least annually, without management being present, is also being arranged to meet the New Code requirements.
The Group has always maintained a policy of strict separation between the auditing and consultancy functions of its external Auditors. However at the beginning of this financial year, in order to continue to meet best practice in the light of new regulations and legislation, the Group strengthened this policy with the introduction of a formal Auditor Independence policy document. This provides clear definitions of services that the external Auditors may and may not provide such that their independence and objectivity is not impaired, as well as establishing a formal authorisation process, including the tendering and preapproval by the Audit Committee for allowable non-audit work that they may perform. The Audit Committee has also carried out six-monthly reviews of the remuneration received by PricewaterhouseCoopers LLP for non-audit work, with the aim of seeking to balance objectivity, value for money and compliance with this policy. The fees for non-audit work have arisen principally as a result of tax advisory work associated with reorganisation of legal entities within the Group following the acquisition of Reemtsma, together with some due diligence activity. The outcome of the reviews was that no conflict of interest exists between PricewaterhouseCoopers LLP audit and non-audit work, and that this was the most cost effective way of conducting the Group’s business. In other situations, proposed assignments are subject to independent tendering and decisions taken on the basis of competence and cost effectiveness.
Internal control
The Board acknowledges responsibility for the Group’s system of internal control. The Audit Committee on behalf of the Board, reviews the effectiveness of the system in accordance with the guidance set out in “Internal Control: Guidance for Directors on the Combined Code” (the Turnbull guidance) from information and regular reports provided by management, the internally independent compliance function and external Auditors. However, given the size and complexity of the Group’s operations, such a system can provide only reasonable and not absolute assurance of meeting internal control objectives, by managing rather than eliminating risk.
The Board, either directly, or through the Audit Committee which regularly reports its findings for consideration by the Board, has reviewed the effectiveness of the key procedures which have been established to provide internal control and confirms that an ongoing process for identifying, evaluating and managing the Group’s significant risks has operated throughout the year.
41
The following key features have operated to provide reassurance of both the reliability of information and the safeguarding of assets:
• Risk assessment:
• The Group clearly sets out its strategic objectives as part of its medium-term planning process. These objectives are then incorporated as part of the budgeting and planning cycle and are supported by the use of both financial and non-financial key performance indicators.
• A detailed assessment of strategic risks is undertaken by the Executive Directors as part of the medium-term planning, annual budgeting and the monthly reporting and forecasting cycles.
• All areas of the business are required to undertake a risk profiling exercise to review formally their principal areas of risk so that all major risks are reviewed at all levels across the Group. This formal system is based on the annual submission of risk assessment reviews from each business unit for the measurement and assessment of risk areas, together with the controls embedded in the business processes to mitigate such risks. This review is ongoing throughout all the business operations of the Group, to ensure there continues to be clear and consistent procedures for monitoring, updating and implementing appropriate controls to minimise the risk exposure so identified.
• The Audit Committee has delegated responsibility for considering Group-wide operational, financial and compliance risks on a regular basis. Regular reporting by the Control and Compliance function supports the Audit Committee and the Board in assessing the effectiveness of internal controls at each business unit, through a programme of regular reviews. In this way, it seeks to minimise the risks identified and satisfies itself that the levels of retained risk are acceptable to the Group.
• Control environment and control activities:
• The Group consists of a number of manufacturing and trading operations each with its own management and control structures which satisfy the Group’s accounting policies and local control responsibilities.
• The Board continues to review the organisational structure to ensure that clearly defined lines of responsibility, delegation of authority and segregation of duties, with staff of the necessary calibre to fulfil their allotted roles, remain in place. These procedures for delegated authority ensure that decisions, significant either because of the value or the impact on other parts of the Group, are taken at an appropriate level. The full Board has formally adopted a schedule of matters of a strategic, financial, operational or compliance nature which are required to be brought to it for decision.
• Imperial Tobacco Group has a framework of policies and procedures laid down by the Board and personnel are required to comply with these procedures. Reemtsma also had a similar framework of procedures to which its employees were required to comply. Since the acquisition, these existing policies and procedures which cover key issues such as authorisation levels, segregation of duties, an international marketing code, ethical compliance matters and legislation, physical and data security as well as regulatory, governance, and health, safety and environmental issues, are being integrated. A consolidated framework of policies and procedures is being issued with consistent communication being cascaded down throughout the enlarged Group by the end of 2003.
• The Group has an established and consistent methodology for identifying and ranking business risks and has implemented appropriate strategies to deal with each significant risk that has been identified. These strategies include not only internal controls but other approaches, such as insurance and dual sourcing of supplies.
This methodology is reviewed on an ongoing basis to ensure it continues to reflect accurately the relevant risks and takes into account necessary movements in the Group’s risk profile consequent upon changes in the business operations.
• There are well-defined procedures for appraisal, approval, control and review of capital and strategic expenditure including acquisitions.
• The Group’s treasury function operates within the defined policy designed to control the Group’s financing arrangements and to minimise its exposure to interest rate and foreign exchange risks through specialised treasury instruments.
42
• Information and communication:
• Operating companies are required to produce detailed operating budgets prior to the start of each financial year, which are reviewed for robustness and realism.
• A comprehensive system of budgetary controls, including monthly and regular periodic performance reviews for each business unit, are in place to ensure that major variances are promptly and thoroughly investigated. These reviews are conducted at a detailed level within each business unit and at a high level by the Executive Directors.
• On a monthly basis, the achievement of business objectives, both financial and non-financial, is assessed using a range of key performance indicators. These indicators are reviewed to ensure that they remain relevant and reliable.
• Monitoring:
• A range of procedures is used to review the risk profile and monitor the effective application of internal control in the Group. These include self assessment of controls and annual certification of compliance with the Group’s financial and operational procedures (including compliance with environmental, health and safety and business conduct standards) by both the managing director or senior executive and the senior finance manager of each business unit and function, together with independent reviews by the Control and Compliance function.
• The Control and Compliance function’s responsibilities include reporting to the Audit Committee on the effectiveness of internal control systems, focusing on those areas with the greatest perceived risk to the Group. This compliance programme is currently being developed further to review controls across key areas of risk annually to meet new US compliance legislation.
• Follow-up procedures ensure there is an appropriate response to recommendations for any enhancement to risk controls identified by reviews from the Control and Compliance function.
The Audit Committee confirms it has reviewed and reported to the Board on the system of internal control for the year ended 30 September 2003. Through the procedural and reporting framework for monitoring business risks and controls, as set out above, and review of the Group’s financial statements, it is satisfied there is sufficient information to enable it to review the effectiveness of the Group’s system of internal control.
Going concern
The Directors are satisfied that the Group has adequate resources to meet its operational needs for the foreseeable future and accordingly they continue to adopt the going concern basis in preparing the financial statements.
Pension fund
Imperial Tobacco Group PLC’s main pension fund, the Imperial Tobacco Pension Fund, is not controlled by the Board, but by Trustees, consisting of five nominees from the Company, one member chosen by employees and two by current and deferred pensioners. The Trustees look after the assets of the pension fund, which are held separately from those of the Company and are managed by independent fund managers. The pension scheme funds can only be used in accordance with its rules and for no other purpose.
Communication with shareholders
Communication with all shareholders is given a high priority and a number of methods are used to promote greater understanding and dialogue with investment audiences.
The Group’s Annual Review, a summary financial statement, provides shareholders with the material information concerning Imperial Tobacco Group in a form more readily assimilated than the full Annual Report and Accounts. Shareholders can also request the full report and Form 20-F. At the half year an Interim Report is published. All of these documents are available on-line through the Imperial Tobacco website (www.imperial-tobacco.com), together with all announcements, investor presentations and share price information.
During the year shareholders are kept informed of the progress of the Group through trading statements and other announcements of significant developments that are released through the London Stock Exchange and other news services. There is regular dialogue with institutional shareholders and participation in sector conferences. This is being extended to ensure Non-Executive Directors on appointment also meet with major shareholders and that the Senior Non-Executive Director attends regular meetings with major investors.
Additionally, there is an opportunity at the Annual General Meeting for individual shareholders to question the Chairman and the chairmen of the Audit, Remuneration and Nominations Committees. It is the Company’s practice to make arrangements to send the Report and Accounts to shareholders at least 20 working days prior to the Annual General Meeting. The Company indicates the level of proxy votes lodged in respect of each resolution proposed at its Annual General Meeting following each vote on a show of hands. Details of abstentions are also disclosed.
43
Statement of Directors’ responsibilities
Company law requires the Directors to prepare financial statements for each financial year which give a true and fair view of the state of affairs of the Company and the Group at the balance sheet date and of the profit or loss and the cash flows of the Group for that period.
The Directors consider that suitable accounting policies have been used and applied consistently. They also confirm that reasonable judgements and estimates have been made in preparing the financial statements for the year ended 30 September 2003 and that applicable Accounting Standards have been followed.
The Directors are responsible for keeping proper accounting records that disclose, with reasonable accuracy, at any time the financial position of the Company and the Group and enable them to ensure that the financial statements comply with the Companies Act 1985. They are also responsible for safeguarding the assets of the Company and the Group, and hence for taking reasonable steps for the prevention and detection of fraud and other irregularities.
The Directors are also responsible for the maintenance and integrity of the Group’s website. Information published on the Internet is accessible in many countries with different legal requirements. Legislation in the United Kingdom governing the preparation and dissemination of financial statements may differ from legislation in other jurisdictions.
Statement of Auditors’ responsibilities
Imperial Tobacco Group PLC’s Registered Auditors, PricewaterhouseCoopers LLP, are responsible for forming an independent opinion on the financial statements of the Group as presented by the Directors, and for reporting their opinion to shareholders. Their report is set out on page 57.
By order of the Board | |
| |
/s/ R.C. Hannaford |
|
| |
R.C. HANNAFORD, Company Secretary | |
| |
17 November 2003 | |
44
DIRECTORS’ REMUNERATION REPORT
This Report has been prepared by the Remuneration Committee, in accordance with the Directors’ Remuneration Report Regulations 2002 (“the Regulations”) which introduced new statutory requirements for the disclosure of directors’ remuneration, and to meet the relevant requirements of the Listing Rules of the UK Listing Authority. In particular, it describes how the Board has applied the principles of good governance relating to directors’ remuneration set out in the Combined Code.
The Regulations require the Auditors to report to the Company’s shareholders on the “audited information” within the Directors’ Remuneration Report (“the Report”) and to state whether in their opinion, that part of the Report has been prepared in accordance with the Companies Act 1985 (as amended by the Regulations). Their opinion is set out on page 57 and those aspects of the Report which have been subject to audit have been clearly marked.
Remuneration Committee
The Board considers itself ultimately responsible for the framework and cost of executive remuneration, but has delegated responsibility for determining the remuneration levels and conditions of service for Executive Directors of the Company and Group senior executives to the Remuneration Committee. The Committee’s approach is fully consistent with the Group’s overall philosophy that all employees should be competitively rewarded to attract and retain their valued skills in the business, as well as supporting corporate strategy, by directly aligningexecutive management with the Group’s strategic business goals.
The Remuneration Committee is comprised exclusively of independent Non-Executive Directors of the Company who have no personal financial interest, other than as shareholders, in the matters to be decided. The members of the Committee throughout the year were:
Mr I J G Napier (chairman);
Mr D C Bonham;
Mr S Huismans;
Dr P H Jungels.
The Chief Executive attends by invitation to respond to questions raised by the Committee. However, he is specifically excluded from any matter concerning the details of his own remuneration.
The Committee sets the remuneration package for each senior executive after taking advice principally from external sources including remuneration consultants, Towers Perrin and Hewitt, Bacon & Woodrow, who were appointed by the Committee. Hewitt, Bacon & Woodrow were appointed during the year to review the Group’s principles and practices against corporate governance best practice. Executive remuneration surveys published by Monks Partnership and William M Mercer are also used to assist in the benchmarking process. Mr G Davis, Chief Executive, Mr R C Hannaford, Company Secretary (who acts as Secretary to the Committee) and Mr D P Cuthbert, Group Compensation and Benefits Manager, also provide internal support and advice.
The Committee, which operates under clear written terms of reference, confirms formally that its constitution and operation comply with the principles set out in the Combined Code on Corporate Governance and has applied the principles in Section 1 of that Code throughout the year.
Remuneration strategy
Imperial Tobacco Group PLC operates in an increasingly competitive, international environment. For the Group to continue to compete successfully it is essential that the level of remuneration and benefits offered achieves the objectives of attracting, developing, retaining and motivating the necessary high quality pool of talented employees, at all levels, across the Group. The Group therefore sets out to provide competitive remuneration to all its employees, appropriate to the business environment in those countries in which it operates.
As the Group continues to develop internationally and integrate acquisitions, it is having increasing regard to the need to relocate employees from country to country as the requirements of the business dictate, and develop its remuneration arrangements accordingly. The remuneration strategy is therefore designed, not only to align with the Group’s fundamental values of fairness, competitiveness and equity, but also to support the Group’s corporate strategy, as a significant contributor to its competitive advantage. A cohesive reward structure across the Group - with a timely pay review process, consistently applied to all employees and well communicated to ensure each element of the package is understood with links to corporate performance recognised - - is seen as critical in ensuring all employees can associate with and “buy into” the attainment of the Group’s strategic goals.
The Group also seeks to align the interests of shareholders and employees at all levels by giving employees opportunities and encouragement to build up a shareholding in Imperial Tobacco Group PLC. Through a series of share plan initiatives, under the UK Sharesave Scheme, the International Sharesave Plan and Share Matching arrangements, the majority of eligible employees of the Company and its subsidiaries have been offered participation in equity-based plans with a significant number taking advantage of the invitations.
Executive remuneration policy
The remuneration package for Executive Directors and senior executives, as determined by the Remuneration Committee, is intended to attract and retain high quality executives, induce loyalty and motivate them to achieve a high level of corporate performance in line with the best interests of shareholders, while not being excessive. The package is also in line with the Group’s overall policy on pay and benefits and, as the Group extends its business internationally, it takes account of market practices outside the UK where the scope of a particular executive’s role warrants this approach.
45
The ongoing policy combines short-term and long-term rewards, including performance-related elements that take into account individual, business unit and corporate performance. The main components are base salary, an annual cash bonus, a Share Matching Scheme (SMS), a Long-Term Incentive Plan (LTIP) and pension benefits, with a significant weighting towards performance-related variable reward elements. In the current year base salary typically represented around a third of total remuneration, for those Directors who served throughout the year, with annual bonus and awards vesting under SMS and LTIP schemes making up around two-thirds of total pay. This policy is set to provide base salary at the median level of its comparator group, while providing the Directors with the capacity to earn upper quartile total cash compensation on a superior performance basis.
Percentage of Total Remuneration
[CHART]
Note: Mr D Cresswell and Dr F A Rogerson were appointed during the year, after vesting of their SMS and LTIP awards in January 2003.
In order to continue to meet corporate governance best practice, for the financial year to September 2004 more stringent performance criteria will be applied to the performance-related elements as detailed in the LTIP section on page 50 which forms part of this policy statement. In addition, it is proposed that, in advance of the expiry of authority for the Group’s existing share schemes, a comprehensive review of executive remuneration will be undertaken during 2004 and, where appropriate, shareholder approval sought at the 2005 Annual General Meeting.
Base salary
Base salary is reviewed annually and is determined by reference to individual responsibilities, performance and external market data. Therefore it is set within a range around the market median for similar sized, publicly quoted companies to reflect the experience, responsibility, effectiveness and market value of the executive. The comparator group of companies chosen is the FTSE 50 excluding companies in the Financial and Pharmaceutical sectors. Base salary is the only element of the package used to determine pensionable earnings.
Annual cash bonus
For each financial year to September 2003, Executive Directors could earn annual bonuses up to a maximum of two-thirds base salary, by reference to performance against financial targets determined by the Committee.
During the period under review, bonus targets related principally to the achievement of Group profit objectives. Performance in the year has resulted in bonuses as detailed in the table on page 49 being awarded. A cash bonus was also earned by other senior executives for achieving performance targets for the year to 30 September 2003.
For the year to 30 September 2004, bonus performance criteria will again relate to Group profit growth, however the specific targets are not disclosed since they are considered to be commercially confidential. To align the Executive Directors bonuses more closely to market levels, the potential maximum bonus has been increased from 662/3 per cent to 100 per cent for the Chief Executive and Finance Director and 75 per cent for other Executive Directors. However, attainment of these increased bonus levels is subject to achievement of stretching, incremental profit-based performance criteria.
Under the Share Matching Scheme, Executive Directors and management may elect to invest any proportion up to a maximum of 100 per cent of their gross bonus in Imperial Tobacco Group PLC ordinary shares to be held by the Employee Benefit Trust. Provided that the shares lodged are left in the Trust for three years the participant will receive the original shares plus additional shares equal in number to the original shares. In respect of investments made by Executive Directors under the SMS from their bonus payable in December 2003, a performance criterion will now be applied to the matched shares such that matching will only occur if the Group has achieved an average of 3 per cent real increase in EPS per annum over the three year retention period, being an indicator of sustained ongoing profit delivery. It will be based upon the same protocol as that applying to the Long-Term Incentive Plan. There will be no opportunity to re-test if this performance criterion is not met.
Benefits
The principal taxable benefits for Executive Directors are the provision of cars and health insurance, but in the case of Mr M A Häussler also included relocation costs associated with his move to the UK.
46
Remuneration from other Non-Executive Directorships
The Company recognises that external non-executive directorships are beneficial for both the Executive Director concerned and the Company. Executive Directors are permitted, at the discretion of the Board, to retain any fees received in respect of any such non-executive directorships. Any serving Executive Director is restricted to one external non-executive directorship and may not serve as chairman of a FTSE 100 company.
During the year Mr G Davis was appointed to the Board of Wolseley plc and currently receives fees of £33,000 per annum.
Executive Directors Service contracts
It is the Group’s policy to appoint Executive Directors under service agreements terminable by either party giving 52 weeks notice, as shown in the table below.
There are no predetermined provisions for compensation on termination within Executive Directors’ service agreements. However, the Group is unequivocally against rewards for failure and generally believes that severance arrangements should be restricted to basic pay and consequential payments such as earned bonus and pension accrual. Nevertheless, the circumstances of the termination and the individual’s duty and opportunity to mitigate loss would be taken into account.
Under the rules of the LTIP and Share Matching Scheme outstanding awards vest on termination on a time-related pro-rata basis. If, however, the termination is by resignation or dismissal for misconduct, the full award lapses.
|
| Date of contract |
| Expiry date |
|
|
|
|
|
|
|
Executive Directors |
|
|
|
|
|
G Davis, Chief Executive |
| 21 August 1996 |
| Terminable on 52 weeks’ notice |
|
R Dyrbus, Finance Director |
| 21 August 1996 |
| Terminable on 52 weeks’ notice |
|
M A Häussler, Sales and Marketing Director |
| 19 December 2002 |
| Note(1) |
|
D Cresswell, Manufacturing Director |
| 30 May 2003 |
| Terminable on 52 weeks’ notice |
|
F A Rogerson, Corporate Affairs Director |
| 30 May 2003 |
| Terminable on 52 weeks’ notice |
|
B C Davidson, Sales and Marketing Director (appointed 1 October 2003) |
| 1 October 2003 |
| Terminable on 52 weeks’ notice |
|
(1) Before Mr Häussler’s resignation as a Director, the Remuneration Committee had exceptionally agreed that the requisite notice period at the commencement of his appointment was 104 weeks. This was reducing at the rate of two weeks per calendar month until such time as the notice period reached 52 weeks. The initial longer notice period on first appointment was deemed essential to retain his services, which involved him in international relocation and foregoing the five-year fixed term contract he enjoyed within the Reemtsma Group of companies. The arrangement matched the notice period arrangements granted to Imperial Tobacco Group PLC’s Directors upon Listing in 1996.
Non-Executive Directors’ letters of appointment
The Non-Executive Directors do not have service contracts with the Company. However, the terms of their appointments are reviewed annually and upon them reaching 65 years of age. These terms were reviewed for all Non-Executive Directors and confirmed on 3 February 2003 and in respect of Mr A G L Alexander again on 2 May 2003 following his 65th birthday. Under the terms of the Articles of Association of the Company Non-Executive Directors stand for reappointment at the first Annual General Meeting following appointment, are subject to triennial reappointment by shareholders and retire at the Annual General Meeting following their reaching 70 years of age. There are no provisions in their letters of appointment regarding notice periods or compensation on early termination. Although there is no current maximum term of appointment for Non-Executive Directors, the Board is currently considering adopting the best practice provisions outlined in the Higgs Report.
Remuneration policy for Non-Executive Directors
Fees for Non-Executive Directors are determined by the Board as a whole with regard to market practice within the restrictions contained in the Articles of Association. The Non-Executive Directors do not take part in discussions on their own remuneration. They receive no other material pay or benefits (with the exception of reimbursement of expenses incurred in connection with their Directorship of the Company and provision of administration support including the use of Company offices by the Chairman and Vice Chairman) and do not participate in the Company’s share schemes, bonus schemes or incentive plans and are not eligible for pension scheme membership.
To align further the interest of the Non-Executive Directors with those of shareholders it was agreed that a proportion of their fees be applied, after tax, to purchase shares in Imperial Tobacco Group PLC. These shares are to be held by a nominee during the term of each Non-Executive Directorship. Exceptionally in respect of Mr D C Bonham and Mr A G L Alexander, this provision has been waived due to their substantial shareholdings detailed on page 50.
Mr S Huismans is, and Mr L W Staby was, until his resignation, a member of Supervisory Boards within the Reemtsma Group for which they received additional remuneration.
Remuneration arrangements for former Directors
Following his retirement in May 2000, Mr S T Painter entered into a consultancy agreement with Imperial Tobacco Limited, the Group’s principal operating company. The agreement, as amended in October 2001, runs for four years to June 2004. Under the terms of the agreement he provides consultancy services as required and receives fees at a day rate of £1,000 with a minimum fee based on 100 days services for each 12 month period ending on 30 June. Mr S T Painter is also entitled to reimbursement for the use of his car.
47
Mr S T Painter is also a member of Supervisory Boards within the Reemtsma Group for which he receives additional remuneration.
Following the acceptance by the Board, on 9 July 2003, of the resignation of Mr L W Staby, it was agreed that his remuneration continue until the expiry of this term of office on 1 February 2004.
Similarly the Company has agreed that remuneration attributable to his duties on the Supervisory Board of Reemtsma companies will continue to be paid on a similar basis.
On 14 January 2003, following the successful attainment of LTIP performance criterion, Mrs S Inston, the widow of Mr C A C Inston, was granted shares under the Company’s LTIP.
Subsequent to his resignation as a Director of the Company with effect from 9 July 2003, Mr M A Häussler remains an employee receiving his full contractual remuneration.
DIRECTORS’ EMOLUMENTS FOR THE YEAR ENDED 30 SEPTEMBER 2003
(audited)
|
| 2003 |
| 2002 |
|
|
| £’000 |
| £’000 |
|
|
|
|
|
|
|
Executive Directors |
|
|
|
|
|
Salary |
| 1,444 |
| 1,021 |
|
Benefits |
| 141 |
| 26 |
|
Bonus |
| 955 |
| 680 |
|
LTIP annual vesting(1) |
| 937 |
| 649 |
|
LTIP vesting on retirement(1) |
| 0 |
| 376 |
|
SMS vesting(2) |
| 902 |
| 839 |
|
|
| 4,379 |
| 3,591 |
|
|
|
|
|
|
|
Non-Executive Directors |
|
|
|
|
|
Fees |
| 457 |
| 362 |
|
Benefits |
| 5 |
| 4 |
|
Reemtsma Supervisory Boards |
| 41 |
| 10 |
|
|
| 503 |
| 376 |
|
|
|
|
|
|
|
Former Directors |
|
|
|
|
|
Consultancy fees to former Executive Director |
| 100 |
| 128 |
|
Reemtsma Supervisory Boards |
| 23 |
| 5 |
|
Salary of former Executive Director |
| 86 |
| 0 |
|
Bonus |
| 56 |
| 0 |
|
Benefits |
| 2 |
| 0 |
|
LTIP vesting on retirement |
| 5 |
| 0 |
|
|
| 272 |
| 133 |
|
|
|
|
|
|
|
Fees of Former Non-Executive Directors |
|
|
|
|
|
Company |
| 8 |
| 0 |
|
Reemtsma Supervisory Boards |
| 5 |
| 0 |
|
|
| 13 |
| 0 |
|
|
|
|
|
|
|
Total remuneration |
| 5,167 |
| 4,100 |
|
(1) Value of LTIP shares vesting in the year, based on the closing share price on the day of vesting.
(2) Value of SMS shares vesting on maturity based on the closing share price on the day of vesting.
48
Emoluments by individual Director
(audited)
|
| Base |
| Fees |
| Supervisory |
| Bonus |
| Benefits |
| Sub |
| LTIP (2) |
| SMS (2) |
| Total |
| Total |
|
|
| £’000 |
| £’000 |
| £’000 |
| £’000 |
| £’000 |
| £’000 |
| £’000 |
| £’000 |
| £’000 |
| £’000 |
|
|
|
|
|
|
|
|
|
|
|
|
|
|
|
|
|
|
|
|
|
|
|
Executive Directors |
|
|
|
|
|
|
|
|
|
|
|
|
|
|
|
|
|
|
|
|
|
G Davis, Chief Executive |
| 600 |
| — |
| — |
| 400 |
| 12 |
| 1,012 |
| 590 |
| 551 |
| 2,153 |
| 1,605 |
|
R Dyrbus, Finance Director |
| 380 |
| — |
| — |
| 253 |
| 14 |
| 647 |
| 347 |
| 351 |
| 1,345 |
| 1,046 |
|
C A C Inston, |
| — |
| — |
| — |
| — |
| — |
| — |
| — |
| — |
| — |
| 843 |
|
M A Häussler, |
| 298 |
| — |
| — |
| 190 |
| 105 |
| 593 |
| — |
| — |
| 593 |
| 97 |
|
D Cresswell, |
| 83 |
| — |
| — |
| 56 |
| 5 |
| 144 |
| — |
| — |
| 144 |
| — |
|
F A Rogerson, |
| 83 |
| — |
| — |
| 56 |
| 5 |
| 144 |
| — |
| — |
| 144 |
| — |
|
|
| 1,444 |
| — |
| — |
| 955 |
| 141 |
| 2,540 |
| 937 |
| 902 |
| 4,379 |
| 3,591 |
|
|
|
|
|
|
|
|
|
|
|
|
|
|
|
|
|
|
|
|
|
|
|
Non-Executive Directors |
|
|
|
|
|
|
|
|
|
|
|
|
|
|
|
|
|
|
|
|
|
D C Bonham, Chairman |
| — |
| 220 |
| — |
| — |
| 1 |
| 221 |
| — |
| — |
| 221 |
| 180 |
|
A G L Alexander, Vice Chairman |
| — |
| 70 |
| — |
| — |
| 4 |
| 74 |
| — |
| — |
| 74 |
| 69 |
|
S P Duffy |
| — |
| 35 |
| — |
| — |
| — |
| 35 |
| — |
| — |
| 35 |
| 35 |
|
S Huismans |
| — |
| 35 |
| 23 |
| — |
| — |
| 58 |
| — |
| — |
| 58 |
| 40 |
|
P H Jungels |
| — |
| 35 |
| — |
| — |
| — |
| 35 |
| — |
| — |
| 35 |
| 6 |
|
I J G Napier |
| — |
| 35 |
| — |
| — |
| — |
| 35 |
| — |
| — |
| 35 |
| 35 |
|
L W Staby (4) |
| — |
| 27 |
| 18 |
| — |
| — |
| 45 |
| — |
| — |
| 45 |
| 11 |
|
|
| — |
| 457 |
| 41 |
| — |
| 5 |
| 503 |
| — |
| — |
| 503 |
| 376 |
|
|
|
|
|
|
|
|
|
|
|
|
|
|
|
|
|
|
|
|
|
|
|
Former Directors |
|
|
|
|
|
|
|
|
|
|
|
|
|
|
|
|
|
|
|
|
|
S T Painter (3) |
| — |
| 100 |
| 23 |
| — |
| — |
| 123 |
| — |
| — |
| 123 |
| 133 |
|
M A Häussler (4) & (8) |
| 86 |
| — |
| — |
| 56 |
| 2 |
| 144 |
| — |
| — |
| 144 |
| — |
|
L W Staby (4) |
| — |
| 8 |
| 5 |
| — |
| — |
| 13 |
| — |
| — |
| 13 |
| — |
|
C A C Inston (5) |
| — |
| — |
| — |
| — |
| — |
| — |
| 5 |
| — |
| 5 |
| — |
|
|
| 86 |
| 108 |
| 28 |
| 56 |
| 2 |
| 280 |
| 5 |
| — |
| 285 |
| 133 |
|
|
| 1,530 |
| 565 |
| 69 |
| 1,011 |
| 148 |
| 3,323 |
| 942 |
| 902 |
| 5,167 |
| 4,100 |
|
Note:
(1) Benefits in kind principally include the provision of a Company car and health insurance.
(2) LTIP and SMS represent the value of awards vesting and LTIP options exercised in the year both on annual vesting and retirement.
(3) Mr S T Painter retired from the Board on 31 May 2000 but receives fees on a consultancy basis and in connection with his appointments to Supervisory Boards within the Reemtsma Group.
(4) Mr M A Häussler and Mr L W Staby resigned from the Board on 9 July 2003.
(5) Mr C A C Inston retired on grounds of ill-health on 14 December 2001.
(6) Mr D Cresswell and Dr F A Rogerson were appointed to the Board on 1 June 2003.
(7) Benefits in kind include relocation assistance of £102,000 in respect of Mr M A Häussler.
(8) Base salary of Mr M A Häussler includes the payment of a pension allowance of £14,000 which is neither eligible for bonus nor share schemes and is not pensionable.
(9) No sums were paid to any Director by way of taxable expenses allowances.
(10) Mr B C Davidson was appointed to the Board on 1 October 2003 at a base salary of £300,000 per annum with the same terms and notice period as Mr D Cresswell and Dr F A Rogerson.
49
Directors’ interests in shares (beneficial and family interests)
(audited)
|
| Ordinary shares |
| Sharesave options |
| Contingent rights to |
| ||||||||
|
| 29/9/02(1) |
| 30/9/03(2) |
| 14/11/03 |
| 29/9/02(1) |
| 30/9/03(2) |
| 29/9/02(1) |
| 30/9/03(2) |
|
|
|
|
|
|
|
|
|
|
|
|
|
|
|
|
|
Executive Directors |
|
|
|
|
|
|
|
|
|
|
|
|
|
|
|
G Davis |
| 260,982 |
| 263,366 |
| 263,366 |
| 3,489 |
| 1,979 |
| 343,288 |
| 307,747 |
|
R Dyrbus |
| 184,993 |
| 186,603 |
| 186,603 |
| 2,412 |
| 1,477 |
| 210,329 |
| 190,157 |
|
M A Häussler |
| 17,850 |
| 18,265 |
| 18,265 |
| — |
| — |
| — |
| 46,786 |
|
D Cresswell |
| 69,374 |
| 69,385 |
| 69,385 |
| 2,008 |
| 2,008 |
| 75,940 |
| 75,940 |
|
F A Rogerson |
| 66,270 |
| 66,270 |
| 66,270 |
| 2,008 |
| 2,008 |
| 80,904 |
| 80,904 |
|
|
|
|
|
|
|
|
|
|
|
|
|
|
|
|
|
Non-Executive Directors |
|
|
|
|
|
|
|
|
|
|
|
|
|
|
|
D C Bonham |
| 131,468 |
| 131,468 |
| 131,468 |
| — |
| — |
| — |
| — |
|
A G L Alexander |
| 132,710 |
| 132,710 |
| 132,710 |
| — |
| — |
| — |
| — |
|
S P Duffy |
| 6,707 |
| 7,442 |
| 7,445 |
| — |
| — |
| — |
| — |
|
S Huismans |
| 4,312 |
| 4,929 |
| 4,929 |
| — |
| — |
| — |
| — |
|
P H Jungels |
| 854 |
| 1,471 |
| 1,471 |
| — |
| — |
| — |
| — |
|
I J G Napier |
| 1,874 |
| 2,491 |
| 2,491 |
| — |
| — |
| — |
| — |
|
L W Staby |
| — |
| — |
| — |
| — |
| — |
| — |
| — |
|
(1) Or date of appointment if later
(2) Or date of resignation if earlier
Apart from the dividend reinvestment in respect of the PEPs of Mr S P Duffy there have been no changes in these holdings since 30 September 2003.
Executive share retention
To ensure the interests of management remain aligned with those of shareholders, Executive Directors and senior executives are required to meet minimum shareholding guidelines by building a stake in the Group to a current minimum value broadly equivalent to twice their base salary. At a more junior level, executives are expected to invest at a level equivalent to their base salary. These levels will be reviewed as part of the remuneration review planned for 2004.
Long-Term Incentive Plan (LTIP)
Each year since demerger in 1996, annual awards, worth 75 per cent of basic salary, have been made to Executive Directors under the LTIP. The awards, which vest three years after grant, are subject to the satisfaction of an applicable performance criterion, as set out below, over a three-year performance period. It is anticipated that a further conditional award worth 75 per cent of basic salary will be made during November 2003.
The performance criterion, imposed on awards made under the LTIP up to and including December 1999, was based on a sliding scale depending on total shareholder return (TSR) achieved over the period of the award. No vesting of the award occurred unless the Company’s total shareholder return exceeds that of 50 per cent of the companies constituting the FTSE 100 Index. At this performance threshold 30 per cent of the provisional award vested. If the return exceeds 80 per cent of the Index, the award vested in full. Between these thresholds the award vested on a straight-line basis. The TSR calculations use share prices averaged over a month to determine initial and closing prices rather than those ruling on a single day. It is also assumed that the cash flow of dividend payments is recognised on the date the shares are declared “ex-dividend”. This method is considered to give a fairer and less volatile result since improved performance has to be sustained for several weeks before it effectively impacts on the TSR calculations. The TSR calculations themselves have been performed independently by Alithos Limited (appointed by the Company but who perform no other services for the Group) and were approved by the Remuneration Committee. The final award which was based on the TSR performance criterion, vested in January 2003. On vesting a participant is granted a “nil cost” option to acquire the relevant number of shares. The option may be exercised at any time up to the seventh anniversary of its date of grant.
The Committee recognises that it is never easy to set meaningful long-term performance targets in a rapidly changing business environment and in the context of volatile stock markets. The Committee therefore regularly reviews the appropriateness of the performance conditions under the LTIP to ensure they remain demanding, yet realistic, and effectively incentivise participants to perform at the highest level. In December 2000, in consultation with Towers Perrin, it was decided that total shareholder return no longer represented the most appropriate performance criterion for measuring future performance.
For the December 2000 and future awards, the Committee replaced total shareholder return with earnings per share (EPS) growth as the new performance criterion. This was seen as enhancing the incentive effect of the Plan by focusing on the financial performance of the business, over which Directors and executives have power to influence, rather than linking awards to a volatile share price unduly influenced by short-term sector sentiment. The Committee nevertheless retains absolute discretion to ensure that the EPS performance criterion fully reflects the underlying performance of the Group before any awards vest, including maintenance of long-term return on capital employed.
50
Awards vest on a sliding scale depending on average growth in basic EPS based on an agreed protocol to allow appropriate adjustments for amortisation, exceptional and extraordinary items. The adjustments are confirmed by the Auditors after adjusting for inflation over the period of the award. No vesting occurs unless the Company’s average real EPS growth is positive. Full vesting occurs if real EPS growth is equal to or exceeds 10 per cent. Between these two points the award vests on a straight-line basis. In order to ensure that performance criterion remains challenging for the proposed award, in 2003 and for future awards vesting will only occur if the average real EPS growth exceeds 3 per cent per annum. The upper threshold of 10 per cent real EPS growth will remain unchanged.
There is no opportunity to retest if the performance criterion is not achieved.
Executive Directors’ conditional share awards under the Long-Term Incentive Plan
(audited)
|
|
|
|
|
| Market |
|
|
|
|
|
|
| Amount |
|
|
|
|
| ||
|
| Balance |
| Granted |
| price |
|
|
| Vested |
| Market price |
| realised |
| Balance |
|
|
| ||
|
| at |
| during |
| at date |
| Date of |
| during |
| at date of |
| on |
| at |
|
|
| ||
|
| 29/9/02(1) |
| year |
| of grant |
| grant |
| year |
| vesting |
| exercise |
| exercise |
| 30/9/03(2) |
| Performance period |
|
|
|
|
|
|
| £ |
|
|
|
|
| £ |
| £ |
| £’000 |
|
|
|
|
|
|
|
|
|
|
|
|
|
|
|
|
|
|
|
|
|
|
|
|
|
|
|
G Davis |
| 63,226 |
| — |
| 5.55 |
| 29/11/99 |
| (63,226 | ) | 10.55 |
| 9.335 |
| 590 |
| — |
| December 1999 – December 2002 |
|
|
| 61,871 |
| — |
| 6.18 |
| 27/11/00 |
| — |
| — |
| — |
| — |
| 61,871 |
| November 2000 – November 2003 |
|
|
| 57,884 |
| — |
| 7.12 |
| 26/11/01 |
| — |
| — |
| — |
| — |
| 57,884 |
| November 2001 – November 2004 |
|
|
| — |
| 46,923 |
| 9.59 |
| 25/11/02 |
| — |
| — |
| — |
| — |
| 46,923 |
| November 2002 – November 2005 |
|
|
| 182,981 |
| 46,923 |
|
|
|
|
| (63,226 | ) |
|
|
|
|
|
| 166,678 |
|
|
|
|
|
|
|
|
|
|
|
|
|
|
|
|
|
|
|
|
|
|
|
|
|
R Dyrbus |
| 37,152 |
| — |
| 5.55 |
| 29/11/99 |
| (37,152 | ) | 10.55 |
| 9.335 |
| 347 |
| — |
| December 1999 – December 2002 |
|
|
| 38,214 |
| — |
| 6.18 |
| 27/11/00 |
| — |
| — |
| — |
| — |
| 38,214 |
| November 2000 – November 2003 |
|
|
| 36,309 |
| — |
| 7.12 |
| 26/11/01 |
| — |
| — |
| — |
| — |
| 36,309 |
| November 2001 – November 2004 |
|
|
| — |
| 29,718 |
| 9.59 |
| 25/11/02 |
| — |
| — |
| — |
| — |
| 29,718 |
| November 2002 – November 2005 |
|
|
| 111,675 |
| 29,718 |
|
|
|
|
| (37,152 | ) |
|
|
|
|
|
| 104,241 |
|
|
|
|
|
|
|
|
|
|
|
|
|
|
|
|
|
|
|
|
|
|
|
|
|
M A Häussler |
| — |
| 28,936 |
| 9.59 |
| 25/11/02 |
| — |
| — |
| — |
| — |
| 28,936 |
| November 2002 – November 2005 |
|
|
|
|
| 28,936 |
|
|
|
|
|
|
|
|
|
|
|
|
| 28,936 |
|
|
|
|
|
|
|
|
|
|
|
|
|
|
|
|
|
|
|
|
|
|
|
|
|
D Cresswell |
| 12,131 |
| — |
| 6.18 |
| 27/11/00 |
| — |
| — |
| — |
| — |
| 12,131 |
| November 2000 – November 2003 |
|
|
| 11,225 |
| — |
| 7.12 |
| 26/11/01 |
| — |
| — |
| — |
| — |
| 11,225 |
| November 2001 – November 2004 |
|
|
| 9,906 |
| — |
| 9.59 |
| 25/11/02 |
| — |
| — |
| — |
| — |
| 9,906 |
| November 2002 – November 2005 |
|
|
| 33,262 |
|
|
|
|
|
|
|
|
|
|
|
|
|
|
| 33,262 |
|
|
|
|
|
|
|
|
|
|
|
|
|
|
|
|
|
|
|
|
|
|
|
|
|
F A Rogerson |
| 12,939 |
| — |
| 6.18 |
| 27/11/00 |
| — |
| — |
| — |
| — |
| 12,939 |
| November 2000 – November 2003 |
|
|
| 11,926 |
| — |
| 7.12 |
| 26/11/01 |
| — |
| — |
| — |
| — |
| 11,926 |
| November 2001 – November 2004 |
|
|
| 10,427 |
| — |
| 9.59 |
| 25/11/02 |
| — |
| — |
| — |
| — |
| 10,427 |
| November 2002 – November 2005 |
|
|
| 35,292 |
|
|
|
|
|
|
|
|
|
|
|
|
|
|
| 35,292 |
|
|
|
(1) or date of appointment if later
(2) or date of resignation if earlier
51
During the year, the December 1999 – December 2002 award vested in full. The total shareholder return over the period exceeded that of all the FTSE 100 companies, thereby exceeding the performance of the bottom 80 of the FTSE 100 Index, the threshold at which the award maximised.
In respect of the November 2000 – November 2003 award, based on earnings per share to the end of the financial year, 100 per cent of the award will vest on 27 November 2003. For illustrative purposes only, the share price on 13 November 2003, being the latest practicable date prior to publication, was £10.085 valuing the awards as follows:
|
| Award lapsing |
| Award vesting |
| Award vesting |
|
|
|
|
|
|
|
|
|
G Davis |
| — |
| 61,871 |
| 624 |
|
R Dyrbus |
| — |
| 38,214 |
| 385 |
|
D Cresswell |
| — |
| 12,131 |
| 122 |
|
F A Rogerson |
| — |
| 12,939 |
| 130 |
|
The value of any awards vesting could vary significantly from the above due to share price movements.
The Remuneration Committee regards the November 2001 – November 2004 and the November 2002 – November 2005 awards to be too distant from maturity to be included in the value projected above. However, in respect of these awards, earnings per share have grown by more than 10 per cent in real terms in the financial year and therefore, if this performance is maintained over the relevant performance periods both awards would vest in full. Evidence of the Group’s sustained performance on a TSR basis when compared with the FTSE 100 Index is set out below.
Total return indices – Imperial Tobacco and FTSE 100
[CHART]
The FTSE 100 Index is seen to provide the most appropriate and most widely recognised index for benchmarking the corporate performance of the Company which is a constituent of that index.
Share Matching Scheme (SMS)
Centenary Scheme
To encourage employees to acquire and retain a shareholding, and to mark the centenary of the founding of The Imperial Tobacco Company (of Great Britain and Ireland) Limited, all employees of the Company and its wholly owned subsidiaries employed on 10 December 2001, the date of the centenary, were invited to purchase up to £3,000 worth of Imperial Tobacco Group PLC ordinary shares and lodge them with the Employee Benefit Trust. Provided these shares are left in the Trust, the lodged shares will be matched on a sliding scale from 20 per cent for one year’s retention to a maximum of 100 per cent if they are retained for five years.
Annual Scheme
As detailed under “Annual cash bonus” on page 46, the Scheme also allows Executive Directors and most of the Group’s management to take their bonus in shares, which are matched 1:1 over a three-year period.
The Executive Directors’ rights to shares arising under both SMS schemes are set out on page 53.
52
Executive Directors’ contingent rights to shares under the Share Matching Scheme
(audited)
|
| Balance |
| Contingent |
| Market |
| Vested |
| Market |
| Balance |
| Expected |
|
|
|
|
|
|
| £ |
|
|
| £ |
|
|
|
|
|
|
|
|
|
|
|
|
|
|
|
|
|
|
|
|
|
G Davis |
| 58,852 |
| — |
| — |
| (58,852 | ) | 9.355 |
| — |
| January 2003 |
|
|
| 56,802 |
| — |
| — |
| — |
| — |
| 56,802 |
| January 2004 |
|
|
| 44,359 |
| — |
| — |
| — |
| — |
| 44,359 |
| January 2005 |
|
|
| 294 |
| — |
| — |
| — |
| — |
| 294 |
| August 2007 |
|
|
| — |
| 39,614 |
| 9.255 |
| — |
| — |
| 39,614 |
| January 2006 |
|
|
| 160,307 |
| 39,614 |
| — |
| (58,852 | ) | — |
| 141,069 |
|
|
|
|
|
|
|
|
|
|
|
|
|
|
|
|
|
|
|
R Dyrbus |
| 37,586 |
| — |
| — |
| (37,586 | ) | 9.355 |
| — |
| January 2003 |
|
|
| 33,377 |
| — |
| — |
| — |
| — |
| 33,377 |
| January 2004 |
|
|
| 27,397 |
| — |
| — |
| — |
| — |
| 27,397 |
| January 2005 |
|
|
| 294 |
| — |
| — |
| — |
| — |
| 294 |
| August 2007 |
|
|
| — |
| 24,848 |
| 9.255 |
| — |
| — |
| 24,848 |
| January 2006 |
|
|
| 98,654 |
| 24,848 |
| — |
| (37,586 | ) | — |
| 85,916 |
|
|
|
|
|
|
|
|
|
|
|
|
|
|
|
|
|
|
|
M A Häussler |
| — |
| 17,850 |
| 9.255 |
| — |
| — |
| 17,850 |
| January 2006 |
|
|
| — |
| 17,850 |
| — |
| — |
| — |
| 17,850 |
|
|
|
|
|
|
|
|
|
|
|
|
|
|
|
|
|
|
|
D Cresswell |
| 16,577 |
| — |
| — |
| — |
| — |
| 16,577 |
| January 2004 |
|
|
| 13,706 |
| — |
| — |
| — |
| — |
| 13,706 |
| January 2005 |
|
|
| 294 |
| — |
| — |
| — |
| — |
| 294 |
| August 2007 |
|
|
| 12,101 |
| — |
| — |
| — |
| — |
| 12,101 |
| January 2006 |
|
|
| 42,678 |
| — |
| — |
| — |
| — |
| 42,678 |
|
|
|
|
|
|
|
|
|
|
|
|
|
|
|
|
|
|
|
F A Rogerson |
| 17,841 |
| — |
| — |
| — |
| — |
| 17,841 |
| January 2004 |
|
|
| 14,620 |
| — |
| — |
| — |
| — |
| 14,620 |
| January 2005 |
|
|
| 294 |
| — |
| — |
| — |
| — |
| 294 |
| August 2007 |
|
|
| 12,857 |
| — |
| — |
| — |
| — |
| 12,857 |
| January 2006 |
|
|
| 45,612 |
| — |
| — |
| — |
| — |
| 45,612 |
|
|
|
(1) or date of appointment if later
(2) or date of resignation if earlier
During the year, annual bonuses earned in 1998/99 and lodged under the Scheme for a three-year period matured in January 2003, providing matched shares for participants on a 1:1 basis.
In respect of annual bonuses earned in 2001/2002, the Executive Directors elected to take the majority of their bonus in the form of Imperial Tobacco Group PLC ordinary shares to be held by the Employee Benefit Trust under the Scheme. These will be matched with additional shares, equal in number to the original shares, provided they are left in the Trust for three years. These additional shares are shown within contingent rights above.
In respect of Directors holding office at the year-end, there have been no further changes since 30 September 2003.
The Company’s middle market share price at the close of business on 30 September 2000 was £9.81 and the range of the middle market price during the year was £9.09 to £11.10.
53
Share options
The Company does not operate an executive share option scheme. However, Executive Directors are eligible to participate in Imperial Tobacco Group PLC’s savings-related Sharesave Scheme. Under this Scheme, options are granted at a discount of up to 20 per cent of the closing middle market price on the day prior to invitation, to participants who have contracted to save up to £250 per month over a period of three or five years.
Executive Directors’ share options
(audited)
|
| Balance at |
| Granted |
| Exercised |
| Market |
| Balance |
| Exercise |
| Range of exercisable |
| Gains on |
| 2002 |
|
|
|
|
|
|
|
|
| £ |
|
|
| £ |
|
|
| £’000 |
| £’000 |
|
|
|
|
|
|
|
|
|
|
|
|
|
|
|
|
|
|
|
|
|
G Davis |
| 2,284 |
| — |
| (2,284 | ) | 10.80 |
| — |
| 3.02 |
| 01/07/2003 – 31/12/2003 |
| 18 |
| 30 |
|
|
| 1,205 |
|
|
| — |
| — |
| 1,205 |
| 8.24 |
| 01/08/2007 – 31/01/2008 |
|
|
|
|
|
|
| — |
| 774 |
| — |
| — |
| 774 |
| 8.22 |
| 01/08/2008 – 31/01/2009 |
|
|
|
|
|
|
| 3,489 |
| 774 |
| (2,284 | ) | — |
| 1,979 |
|
|
|
|
| 18 |
| 30 |
|
|
|
|
|
|
|
|
|
|
|
|
|
|
|
|
|
|
|
|
|
R Dyrbus |
| 1,610 |
| — |
| (1,610 | ) | 9.80 |
| — |
| 3.61 |
| 01/08/2003 – 31/01/2004 |
| 10 |
| — |
|
|
| 802 |
| — |
| — |
| — |
| 802 |
| 4.83 |
| 01/08/2004 – 31/01/2005 |
|
|
|
|
|
|
| — |
| 675 |
| — |
| — |
| 675 |
| 8.22 |
| 01/08/2006 – 31/01/2007 |
|
|
|
|
|
|
| 2,412 |
| 675 |
| (1,610 | ) | — |
| 1,477 |
|
|
|
|
| 10 |
| — |
|
|
|
|
|
|
|
|
|
|
|
|
|
|
|
|
|
|
|
|
|
M A Häussler |
| — |
| 1,125 |
| — |
| — |
| 1,125 |
| 8.22 |
| 01/08/2006 – 31/01/2007 |
|
|
|
|
|
|
| — |
| 1,125 |
| — |
| — |
| 1,125 |
|
|
|
|
| — |
| — |
|
|
|
|
|
|
|
|
|
|
|
|
|
|
|
|
|
|
|
|
|
D Cresswell |
| 2,008 |
| — |
| — |
| — |
| 2,008 |
| 8.24 |
| 01/08/2007 – 31/01/2008 |
|
|
|
|
|
|
| 2,008 |
| — |
| — |
| — |
| 2,008 |
|
|
|
|
| — |
| — |
|
|
|
|
|
|
|
|
|
|
|
|
|
|
|
|
|
|
|
|
|
F A Rogerson |
| 2,008 |
| — |
| — |
| — |
| 2,008 |
| 8.24 |
| 01/08/2007 – 31/01/2008 |
|
|
|
|
|
|
| 2,008 |
| — |
| — |
| — |
| 2,008 |
|
|
|
|
| — |
| — |
|
(1) or date of appointment if later
(2) or date of resignation if earlier
(3) gains made on exercise, calculated as the difference between the exercise price and the market price on the date of exercise.
Aggregate gains during the year £27,735 (2002: £29,916).
There have been no changes since 30 September 2003.
Full details are available for inspection in the Register of Directors’ Interests at the Company’s registered office.
54
Employee Benefit Trust
The Imperial Tobacco Group Employee and Executive Benefit Trust and the Imperial Tobacco Group PLC 2001 Employee Benefit Trust have been established to acquire ordinary shares in the Company, by subscription or purchase, from funds provided by the Group to satisfy rights to shares arising on the exercise of share options and on the vesting of the share matching and performance-related share awards. As potential beneficiaries of the Employee and Executive Benefit Trust, each of the Executive Directors is deemed to have a contingent interest in the 801,838 ordinary shares of the Company held by that Trust at 30 September 2003.
The Company’s policy has always been, and continues to be, to satisfy all awards under its share schemes from market purchased shares through the Trust. The Trust Deed and the rules of all schemes contain provisions limiting awards to 5 per cent in 5 years and 10 per cent in 10 years for all employee schemes with an additional restriction to 5 per cent in 10 years for executive schemes. Currently an aggregate of only 0.9 per cent of the Company’s issued share capital is subject to awards under the Group’s share schemes.
Directors’ pensions
The Executive Directors are all members of the Imperial Tobacco Pension Fund, the principal defined benefit scheme operated by the Group. For members who joined prior to 1 April 2002, the fund is non-contributory and fully funded with a normal retirement age of 60. The fund allows members to achieve the maximum pension of two-thirds of their salary at normal retirement age after 32 years’ service. For members joining on or after 1 April 2002 (“New Members”), including Mr M A Häussler, employee contributions of 5 per cent of pensionable salary are payable, the normal retirement age is 65 and maximum pension is achieved after 40 years service. Pension commutation to enable participants to receive a lump sum on retirement is permitted within Inland Revenue limits.
For death before retirement, a capital sum equal to four times salary is payable together with a spouse’s pension of two-thirds (half for New Members) of the member’s expected pension at retirement. For death in retirement, a spouse’s pension of two-thirds (half for New Members) of the member’s pre-commutation pension is payable. Dependant children will also receive allowances.
Other than for New Members, whose pensions after retirement increase by the lesser of 5 per cent and the increase in the general index of retail prices (“RPI”), pensions increase by the lesser of 10 per cent and the increase in RPI, together with an option under the rules to surrender part of a pension for pension increases in line with the general index of retail prices of up to 15 per cent.
All Executive Directors earn benefits on the standard scale with a normal retirement age of 60 except Mr M A Häussler, whose normal retirement age is 63.
In addition to the pension arrangement above, Mr M A Häussler’s service contract contains a provision that he will receive a similar benefit to that he would have received had he remained in his former Reemtsma plan. Under his former, non-contributory, plan he would have received 42 per cent of his final salary upon retirement at age 63. Upon retirement Mr M A Häussler will receive his accrued pension from the Reemtsma plan and the Imperial Tobacco Pension Fund. The Company has undertaken to provide for any shortfall between the pensions payable from the above plans and the agreed benefit. The Company has been advised by its actuary that the estimated actuarial present value of this shortfall will be in the order of £1.2 million.
In previous years, details of Directors’ pension benefits have been reported in accordance with the Listing Rules of the UK Listing Authority. However, the Directors’ Remuneration Report Regulations 2002 have introduced the requirement to disclose additional information for Directors’ pension benefits under defined benefit schemes.
The following table provides the information required on both bases and gives details for each Director of:
• the annual accrued pension payable from normal retirement age, calculated as if he had left service at the year end;
• the increase in accrued pension during the year, excluding any increases for inflation in respect of the disclosure required under the Listing Rules;
• the transfer value of the increase in accrued pension calculated in accordance with the actuarial guidance note GN11.
None of the Directors have made additional voluntary contributions.
55
(audited)
|
|
|
|
|
| Disclosures required under Directors’ Remuneration Report Regulations 2002 |
| Listing Rules |
| ||||||||||||||
|
| Age at |
| Pensionable |
| Accrued pension |
| Transfer value |
| Increase |
| Transfer |
| ||||||||||
at |
| Increase |
| at |
| at |
| Increase |
| Director’s |
| at | |||||||||||
|
|
|
|
|
|
|
|
|
|
|
|
|
|
|
|
|
|
|
| £’000 |
| £’000 |
|
|
|
|
|
|
|
|
|
|
|
|
|
|
|
|
|
|
|
|
|
|
|
|
|
G Davis |
| 53 |
| 31 |
| 369 |
| 34 |
| 403 |
| 3,822 |
| 968 |
| — |
| 4,790 |
| 23 |
| 283 |
|
R Dyrbus |
| 50 |
| 21 |
| 149 |
| 23 |
| 172 |
| 1,234 |
| 437 |
| — |
| 1,671 |
| 19 |
| 184 |
|
M A Häussler |
| 57 |
| 13 |
| 96 |
| 14 |
| 110 |
| 769 |
| 365 |
| 10 |
| 1,144 |
| 14 |
| 137 |
|
D Cresswell(1) |
| 58 |
| 41 |
| 107 |
| 33 |
| 140 |
| 1,719 |
| 767 |
| — |
| 2,486 |
| 20 | (1) | 355 |
|
F A Rogerson(1) |
| 50 |
| 26 |
| 92 |
| 30 |
| 122 |
| 757 |
| 414 |
| — |
| 1,171 |
| 16 | (1) | 157 |
|
(1) The increase in accrued pension disclosed under the requirements of the Listing Rules in respect of Mr D Cresswell and Dr F A Rogerson has been calculated over the period since their appointment to the Board on 1 June 2003.
The transfer values disclosed above do not represent a sum paid or payable to the individual director. Instead they represent a potential liability of the pension scheme.
56
INDEPENDENT AUDITORS’ REPORT TO THE MEMBERS OF IMPERIAL TOBACCO GROUP PLC
We have audited the financial statements which comprise the consolidated profit and loss account, statement of total recognised gains and losses, consolidated balance sheet, consolidated cash flow statement, accounting policies, notes to the accounts and the Imperial Tobacco Group PLC balance sheet and related notes. We have also audited the disclosures required by Part 3 of Schedule 7A to the Companies Act 1985 contained in the Directors’ remuneration report (‘the auditable part’).
Respective responsibilities of Directors and Auditors
The Directors’ responsibilities for preparing the Annual Report and financial statements in accordance with applicable United Kingdom law and Accounting Standards are set out in the Statement of Directors’ responsibilities. The Directors are also responsible for preparing the Directors’ remuneration report.
Our responsibility is to audit the financial statements and the auditable part of the Directors’ remuneration report in accordance with relevant legal and regulatory requirements and United Kingdom Auditing Standards issued by the Auditing Practices Board. This report, including the opinion, has been prepared for and only for the Company’s members as a body in accordance with Section 235 of the Companies Act 1985 and for no other purpose. We do not, in giving this opinion, accept or assume responsibility for any other purpose or to any other person to whom this report is shown or into whose hands it may come save where expressly agreed by our prior consent in writing.
We report to you our opinion as to whether the financial statements give a true and fair view and whether the financial statements and the auditable part of the Directors’ remuneration report have been properly prepared in accordance with the Companies Act 1985. We also report to you if, in our opinion, the Report of the Directors is not consistent with the financial statements, if the Company has not kept proper accounting records, if we have not received all the information and explanations we require for our audit, or if information specified by law regarding Directors’ remuneration and transactions is not disclosed.
We read the other information contained in the Annual Report and consider the implications for our report if we become aware of any apparent misstatements or material inconsistencies with the financial statements. The other information comprises only the Chairman’s statement, operating and financial review, the corporate governance statement and the unaudited part of the Directors’ remuneration report.
We review whether the corporate governance statement reflects the Company’s compliance with the seven provisions of the Combined Code specified for our review by the Listing Rules of the Financial Services Authority, and we report if it does not. We are not required to consider whether the Board’s statements on internal control cover all risks and controls, or to form an opinion on the effectiveness of the Company’s or Group’s corporate governance procedures or its risk and control procedures.
Basis of audit opinion
We conducted our audit in accordance with Auditing Standards issued by the United Kingdom Auditing Practices Board and with the Auditing Standards generally accepted in the United States. An audit includes examination, on a test basis, of evidence relevant to the amounts and disclosures in the financial statements and the auditable part of the Directors’ remuneration report. It also includes an assessment of the significant estimates and judgements made by the Directors in the preparation of the financial statements, and of whether the accounting policies are appropriate to the Group’s circumstances, consistently applied and adequately disclosed.
We planned and performed our audit so as to obtain all the information and explanations which we considered necessary in order to provide us with sufficient evidence to give reasonable assurance that the financial statements and the auditable part of the Directors’ remuneration report are free from material misstatement, whether caused by fraud or other irregularity or error. In forming our opinion we also evaluated the overall adequacy of the presentation of information in the financial statements.
United Kingdom opinion
In our opinion the financial statements give a true and fair view of the state of affairs of the Company and the Group at 30 September 2003 and of the profit and cash flows of the Group for the year then ended and have been properly prepared in accordance with the Companies Act 1985, and those parts of the Directors’ remuneration report required by Part 3 of Schedule 7A to the Companies Act 1985 have been properly prepared in accordance with the Companies Act 1985.
United States opinion
In our opinion the financial statements present fairly, in all material respects, the consolidated financial position of the Group at 30 September 2003 and 28 September 2002 and the results of its operations and its cash flows for the years ended 30 September 2003, 28 September 2002 and 29 September 2001 in conformity with accounting principles generally accepted in the United Kingdom. These principles differ in certain respects from accounting principles generally accepted in the United States. The effect of the differences in the determination of net income, shareholders’ equity and cash flows is shown in note 29 to the financial statements.
/s/ PricewaterhouseCoopers LLP |
| |
|
| |
PricewaterhouseCoopers LLP |
| |
Chartered Accountants and Registered Auditors | ||
Bristol |
| |
17 November 2003 |
| |
57
CONSOLIDATED PROFIT AND LOSS ACCOUNT
for the year ended 30 September 2003
(In £’s million) |
| Notes |
| 2003 |
| 2002 |
| 2001 |
| ||
|
|
|
|
|
|
|
|
|
| ||
Turnover |
| 1 |
| 11,412 |
| 8,296 |
| 5,918 |
| ||
Duty in turnover |
| 1 |
| (8,212 | ) | (6,077 | ) | (4,444 | ) | ||
Costs and overheads less other income |
| 2 |
| (2,319 | ) | (1,616 | ) | (870 | ) | ||
Operating profit |
| 1 |
| 881 |
| 603 |
| 604 |
| ||
Group operating profit before amortisation and exceptional items |
|
|
| 1,135 |
| 789 |
| 619 |
| ||
Amortisation |
|
|
| (203 | ) | (83 | ) | (15 | ) | ||
Exceptional items |
| 3 |
| (51 | ) | (103 | ) | — |
| ||
Profit on disposal of fixed assets |
| 3 |
| 12 |
| — |
| — |
| ||
Profit on ordinary activities before interest and taxation |
|
|
| 893 |
| 603 |
| 604 |
| ||
Interest and other finance charges |
| 5 |
| (237 | ) | (180 | ) | (110 | ) | ||
Exceptional finance charges |
|
|
| — |
| (33 | ) | — |
| ||
Other interest and finance charges |
|
|
| (237 | ) | (147 | ) | (110 | ) | ||
Profit on ordinary activities before taxation |
|
|
| 656 |
| 423 |
| 494 |
| ||
Taxation |
| 6 |
| (232 | ) | (140 | ) | (139 | ) | ||
Profit on ordinary activities after taxation |
|
|
| 424 |
| 283 |
| 355 |
| ||
Equity minority interests |
| 28 |
| (3 | ) | (11 | ) | (5 | ) | ||
Profit attributable to shareholders |
|
|
| 421 |
| 272 |
| 350 |
| ||
Dividends |
| 7 |
| (304 | ) | (229 | ) | (178 | ) | ||
Retained profit for the year |
| 19 |
| 117 |
| 43 |
| 172 |
| ||
|
|
|
|
|
|
|
|
|
| ||
Earnings per ordinary share | – Basic |
| 8 |
| 58.1 | p | 41.0 | p | 56.6 | p | |
|
| – Adjusted (before amortisation and exceptional items) |
| 8 |
| 90.0 | p | 68.4 | p | 59.0 | p |
|
| – Diluted |
| 8 |
| 57.9 | p | 40.8 | p | 56.2 | p |
|
|
|
|
|
|
|
|
|
|
|
|
Dividends per ordinary share |
| – Interim |
| 7 |
| 12.0 | p | 10.0 | p | 9.0 | p |
|
| – Proposed final |
| 7 |
| 30.0 | p | 23.0 | p | 19.8 | p |
All activities derive from continuing operations.
There is no difference between the profit as shown above and that calculated on an historical cost basis.
The 2002 comparatives include 4.5 months of Reemtsma results compared to a full year in 2003.
STATEMENT OF TOTAL RECOGNISED GAINS AND LOSSES
for the year ended 30 September 2003
(In £’s million) |
| 2003 |
| 2002 |
| 2001 |
|
|
|
|
|
|
|
|
|
Profit attributable to shareholders |
| 421 |
| 272 |
| 350 |
|
Exchange movements on retranslation of net investments and related borrowings |
| 101 |
| 10 |
| 4 |
|
Taxation credit/(debit) on borrowings hedging overseas equity investments |
| 33 |
| 2 |
| (2 | ) |
|
|
|
|
|
|
|
|
Total recognised gains for the year |
| 555 |
| 284 |
| 352 |
|
58
CONSOLIDATED BALANCE SHEET
at 30 September 2003
(In £’s million) |
| Notes |
| 2003 |
| 2002 |
|
|
|
|
|
|
|
|
|
Fixed assets |
|
|
|
|
|
|
|
Intangible assets |
| 9 |
| 3,807 |
| 3,563 |
|
Tangible assets |
| 10 |
| 714 |
| 751 |
|
Investments |
| 11 |
| 43 |
| 23 |
|
|
|
|
| 4,564 |
| 4,337 |
|
Current assets |
|
|
|
|
|
|
|
Stocks |
| 12 |
| 1,009 |
| 977 |
|
Debtors |
| 13 |
| 1,002 |
| 734 |
|
Investments |
| 11 |
| 68 |
| 112 |
|
Cash |
|
|
| 321 |
| 312 |
|
|
|
|
| 2,400 |
| 2,135 |
|
Creditors: amounts falling due within one year |
| 14 |
| (2,875 | ) | (2,322 | ) |
Net current liabilities |
|
|
| (475 | ) | (187 | ) |
Total assets less current liabilities |
|
|
| 4,089 |
| 4,150 |
|
Creditors: amounts falling due after more than one year |
| 14 |
| (3,485 | ) | (3,694 | ) |
Provisions for liabilities and charges |
| 16 |
| (509 | ) | (531 | ) |
Net assets/(liabilities) |
|
|
| 95 |
| (75 | ) |
Capital and reserves |
|
|
|
|
|
|
|
Called up share capital |
| 17 |
| 73 |
| 73 |
|
Share premium account |
| 19 |
| 964 |
| 964 |
|
Profit and loss account |
| 19 |
| (961 | ) | (1,129 | ) |
Equity shareholders’ funds |
| 27 |
| 76 |
| (92 | ) |
Equity minority interests |
| 28 |
| 19 |
| 17 |
|
|
|
|
| 95 |
| (75 | ) |
The accounts on pages 58 to 100 were approved by the Board of Directors on 17 November 2003 and signed on its behalf by:
/s/ Derek Bonham |
| /s/ Robert Dyrbus |
|
|
| ||
DEREK BONHAM | ROBERT DYRBUS | ||
Chairman | Director | ||
59
CONSOLIDATED CASH FLOW STATEMENT
for the year ended 30 September 2003
(In £’s million) |
| Notes |
| 2003 |
| 2002 |
| 2001 |
|
|
|
|
|
|
|
|
|
|
|
Net cash inflow from operating activities |
| 24 |
| 802 |
| 824 |
| 638 |
|
Returns on investments and servicing of finance |
|
|
|
|
|
|
|
|
|
Interest received |
|
|
| 20 |
| 18 |
| 19 |
|
Interest paid |
|
|
| (254 | ) | (171 | ) | (176 | ) |
Dividends paid to minority interests |
|
|
| (3 | ) | (3 | ) | (3 | ) |
Net cash outflow from returns on investments and servicing of finance |
|
|
| (237 | ) | (156 | ) | (160 | ) |
Taxation |
|
|
| (154 | ) | (157 | ) | (154 | ) |
Capital expenditure and financial investment |
|
|
|
|
|
|
|
|
|
Purchase of tangible and intangible fixed assets |
|
|
| (82 | ) | (52 | ) | (44 | ) |
Sale of tangible fixed assets |
|
|
| 23 |
| 6 |
| 6 |
|
Purchase of fixed asset investments |
|
|
| (40 | ) | (8 | ) | — |
|
Net cash outflow from capital expenditure and financial investment |
|
|
| (99 | ) | (54 | ) | (38 | ) |
Acquisitions |
|
|
|
|
|
|
|
|
|
Payments to acquire businesses |
|
|
| (2 | ) | (3,442 | ) | (275 | ) |
Net cash acquired with businesses |
|
|
| — |
| 266 |
| 16 |
|
Deferred consideration in respect of prior year acquisitions |
|
|
| (47 | ) | — |
| (2 | ) |
Net cash outflow from acquisitions |
|
|
| (49 | ) | (3,176 | ) | (261 | ) |
Equity dividends paid |
|
|
| (254 | ) | (184 | ) | (167 | ) |
Net cash inflow/(outflow) before management of liquid resources and financing |
|
|
| 9 |
| (2,903 | ) | (142 | ) |
Management of liquid resources |
|
|
|
|
|
|
|
|
|
Decrease in investments held as current assets |
|
|
| 58 |
| 233 |
| 8 |
|
Financing |
|
|
|
|
|
|
|
|
|
Issue of ordinary share capital |
|
|
| — |
| 1,000 |
| — |
|
Payments of expenses on issue of equity shares |
|
|
| — |
| (15 | ) | — |
|
Debt due within one year - increase/(decrease) in borrowings |
|
|
| 501 |
| (502 | ) | (542 | ) |
Debt due beyond one year - (decrease)/increase in borrowings |
|
|
| (587 | ) | 2,300 |
| 544 |
|
Net cash (outflow)/inflow from financing |
|
|
| (86 | ) | 2,783 |
| 2 |
|
(Decrease)/increase in cash in the year |
|
|
| (19 | ) | 113 |
| (132 | ) |
60
ACCOUNTING POLICIES
The accounts have been prepared in accordance with Accounting Standards currently applicable in the United Kingdom. The principal accounting policies, which have been applied consistently, are set out below.
Basis of accounting
The accounts have been prepared in accordance with the historical cost convention.
Basis of consolidation
The consolidated accounts incorporate the audited accounts of Imperial Tobacco Group PLC and all its subsidiary undertakings.
The results of businesses are included from the effective date of acquisition and businesses sold are included up to the date of disposal.
The principal operating subsidiary undertakings are listed on pages 99 and 100.
US filing and corresponding amounts
The financial statements incorporate the financial information required to satisfy the Company’s US Form 20-F filing requirements which includes three year profit and loss account and cash flow statement information.
Intangible fixed assets – goodwill
Businesses acquired have been dealt with in the consolidated accounts using acquisition accounting. Upon the acquisition of a business, the fair values that reflect the condition at the date of acquisition are attributed to the identifiable assets and liabilities acquired. Adjustments are also made to bring the accounting policies of the businesses acquired into alignment with those of the Group. Where the consideration paid exceeds the fair value of the net assets acquired, the difference is treated as goodwill.
Goodwill arising on acquisitions made on or after 27 September 1998 is capitalised and amortised on a straight line basis over its useful economic life, a period not exceeding 20 years. Previously all goodwill was written off against reserves in the period of acquisition. On the subsequent disposal or termination of a previously acquired business, the profit or loss on disposal is determined after including the attributable amount of purchased goodwill previously written off to reserves.
Intangible fixed assets – trade marks and licences
Trade marks and licences are included at cost and amortised in annual equal instalments over a period which does not exceed 20 years.
Tangible fixed assets
Tangible fixed assets are shown at cost less depreciation. No depreciation is provided on freehold land. Depreciation of other fixed assets is calculated to write off their cost less residual values over their expected useful lives as follows:
Freehold and leasehold buildings |
| up to 50 years |
| (straight line) |
Plant and equipment |
| 2 to 20 years |
| (straight line/reducing balance) |
Fixtures and motor vehicles |
| 3 to 14 years |
| (straight line) |
Impairment of fixed assets
The carrying value of fixed assets is subject to periodic review and any impairment is charged to the profit and loss account.
Stocks
Stocks are stated at the lower of cost and net realisable value. Cost is determined by the first-in, first-out (FIFO) method. Cost includes an addition for overheads where appropriate.
Deferred taxation
Deferred taxation is provided in full on all material timing differences. Deferred tax assets are recognised where their recovery is considered more likely than not. Deferred tax assets and liabilities have not been discounted.
Turnover
Turnover represents the amount charged to customers in respect of goods supplied, exclusive of VAT but inclusive of excise duty.
61
Foreign currencies
Transactions in foreign currencies are translated at the exchange rate ruling at the date of the transaction, or where forward cover contracts have been arranged, at the contracted rates. Monetary assets and liabilities denominated in foreign currencies, where a contracted rate does not apply, are retranslated at the exchange rates ruling at the balance sheet date and any exchange differences are taken to the profit and loss account.
The profit and loss accounts of overseas subsidiaries are translated at the average rate of exchange ruling during the year. The balance sheets of the overseas subsidiaries are translated into sterling at the rates of exchange ruling at the balance sheet date. Differences between the profit and loss accounts translated at average rates and at balance sheet rates are shown as a movement in reserves and in the statement of total recognised gains and losses.
The Group’s significant overseas equity investments are hedged by borrowings in the currencies in which those assets are denominated. Exchange differences arising on the retranslation of the overseas net investments, including goodwill, less exchange differences on the borrowings, to the extent that they finance those investments, are taken to reserves through the statement of total recognised gains and losses. Other exchange gains and losses are dealt with in the profit and loss account.
Derivative financial instruments
Derivative financial instruments are used to manage exposure to foreign exchange and interest rate risks. Instruments qualify for hedge accounting where the underlying asset or liability has characteristics which can be directly related to the instrument transacted. The gains and losses on those instruments, qualifying for hedge accounting, are recognised in the financial statements over the life of the transaction. All current derivative financial instruments qualify for hedge accounting under UK GAAP.
The Group excludes all short-term debtors and creditors from its derivatives and financial instrument disclosures, other than those on currency risks relating to monetary assets and liabilities.
Pension costs
The cost of providing pensions is charged to the profit and loss account over employees’ service lives. Variances arising from actuarial valuations are charged or credited to profit over the estimated remaining service lives of the employees to the extent that any resulting credit does not exceed the regular cost.
Leases
Rental costs in respect of operating leases are charged to the profit and loss account on a straight line basis over the lease term.
Interest
Interest payable and receivable is recognised in the profit and loss account on an accruals basis. Derivative transactions, principally interest rate swaps, are used to reduce exposure to interest rate movements on a proportion of floating rate debt. Hedge accounting is applied to these transactions and as a result the interest differentials under these transactions are recognised in the financial statements by adjustment of interest payable (and receivable) over the life of the transactions.
62
NOTES TO THE ACCOUNTS
1 Segmental information
The Group is engaged in only one class of business; the manufacture, marketing and sale of tobacco products and tobacco related accessories.
The geographical analysis of turnover, duty in turnover, operating profit and capital employed was as follows:
(In £’s million) |
| 2003 |
| 2002 |
| 2001 |
|
|
|
|
|
|
|
|
|
Turnover |
|
|
|
|
|
|
|
By destination |
|
|
|
|
|
|
|
UK |
| 4,568 |
| 4,486 |
| 4,053 |
|
|
|
|
|
|
|
|
|
Germany |
| 2,765 |
| 1,139 |
| 157 |
|
Rest of Western Europe |
| 1,635 |
| 1,190 |
| 975 |
|
Rest of the World |
| 2,444 |
| 1,481 |
| 733 |
|
International |
| 6,844 |
| 3,810 |
| 1,865 |
|
|
| 11,412 |
| 8,296 |
| 5,918 |
|
By origin |
|
|
|
|
|
|
|
UK |
| 5,350 |
| 5,136 |
| 4,623 |
|
|
|
|
|
|
|
|
|
Germany |
| 3,002 |
| 1,282 |
| 164 |
|
Rest of Western Europe |
| 2,260 |
| 1,399 |
| 1,027 |
|
Rest of the World |
| 2,070 |
| 1,264 |
| 642 |
|
International |
| 7,332 |
| 3,945 |
| 1,833 |
|
|
|
|
|
|
|
|
|
To Group companies |
| (1,270 | ) | (785 | ) | (538 | ) |
|
| 11,412 |
| 8,296 |
| 5,918 |
|
(In £’s million) |
| 2003 |
| 2002 |
| 2001 |
|
|
|
|
|
|
|
|
|
Duty in turnover |
|
|
|
|
|
|
|
By destination |
|
|
|
|
|
|
|
UK |
| 3,808 |
| 3,722 |
| 3,362 |
|
|
|
|
|
|
|
|
|
Germany |
| 2,120 |
| 865 |
| 95 |
|
Rest of Western Europe |
| 983 |
| 695 |
| 546 |
|
Rest of the World |
| 1,301 |
| 795 |
| 441 |
|
International |
| 4,404 |
| 2,355 |
| 1,082 |
|
|
| 8,212 |
| 6,077 |
| 4,444 |
|
63
(In £’s million) |
| 2003 |
| 2002 |
| 2001 |
|
|
|
|
|
|
|
|
|
Operating profit |
|
|
|
|
|
|
|
By destination |
|
|
|
|
|
|
|
UK |
| 406 |
| 390 |
| 353 |
|
|
|
|
|
|
|
|
|
Germany |
| 228 |
| 67 |
| 10 |
|
Rest of Western Europe |
| 307 |
| 217 |
| 193 |
|
Rest of the World |
| 194 |
| 115 |
| 63 |
|
International |
| 729 |
| 399 |
| 266 |
|
Trading operations |
| 1,135 |
| 789 |
| 619 |
|
Amortisation |
| (203 | ) | (83 | ) | (15 | ) |
Exceptional items |
| (51 | ) | (103 | ) | — |
|
|
| 881 |
| 603 |
| 604 |
|
By origin |
|
|
|
|
|
|
|
UK |
| 545 |
| 483 |
| 455 |
|
|
|
|
|
|
|
|
|
Germany |
| 233 |
| 93 |
| 18 |
|
Rest of Western Europe |
| 237 |
| 121 |
| 109 |
|
Rest of the World |
| 120 |
| 92 |
| 37 |
|
International |
| 590 |
| 306 |
| 164 |
|
Trading operations |
| 1,135 |
| 789 |
| 619 |
|
Amortisation |
| (203 | ) | (83 | ) | (15 | ) |
Exceptional items |
| (51 | ) | (103 | ) | — |
|
|
| 881 |
| 603 |
| 604 |
|
(In £’s million) |
| 2003 |
| 2002 |
|
|
|
|
|
|
|
Capital employed |
|
|
|
|
|
By location (based on origin) |
|
|
|
|
|
UK |
| 227 |
| (100 | ) |
|
|
|
|
|
|
Germany |
| 64 |
| (1 | ) |
Rest of Western Europe |
| 119 |
| 99 |
|
Rest of the World |
| 311 |
| 339 |
|
International |
| 494 |
| 437 |
|
|
| 721 |
| 337 |
|
Capital employed is reconciled to the consolidated balance sheet as follows: |
|
|
|
|
|
Net assets/(liabilities) |
| 95 |
| (75 | ) |
Intangible fixed assets |
| (3,807 | ) | (3,563 | ) |
Taxation |
| 148 |
| 113 |
|
Net debt |
| 4,068 |
| 3,695 |
|
Dividend payable |
| 217 |
| 167 |
|
|
| 721 |
| 337 |
|
64
2 Costs and overheads less other income
(In £’s million) |
| 2003 |
| 2002 |
| 2001 |
| |
|
|
|
|
|
|
|
| |
Changes in stocks of finished goods and work in progress (excluding excise duty) |
| 6 |
| 9 |
| 13 |
| |
Raw materials and consumables (excluding excise duty) |
| 693 |
| 480 |
| 241 |
| |
Employment costs (note 4) |
| 487 |
| 301 |
| 184 |
| |
Depreciation and amortisation |
| 286 |
| 137 |
| 49 |
| |
Operating lease charges | – plant and machinery |
| 1 |
| 1 |
| — |
|
| – other assets |
| 9 |
| 6 |
| 3 |
|
Exceptional operating costs (note 3) |
| 51 |
| 103 |
| — |
| |
Other operating charges |
| 786 |
| 579 |
| 380 |
| |
|
| 2,319 |
| 1,616 |
| 870 |
| |
(In £’s million) |
| 2003 |
| 2002 |
| 2001 |
|
|
|
|
|
|
|
|
|
Other operating charges above include: |
|
|
|
|
|
|
|
Auditors’ fees and expenses |
| 2.1 |
| 2.3 |
| 0.8 |
|
|
| 2.1 |
| 2.3 |
| 0.8 |
|
Non-audit fees paid: |
|
|
|
|
|
|
|
In the UK |
| 1.7 |
| 4.3 |
| 1.7 |
|
Overseas |
| 0.6 |
| 0.5 |
| 0.4 |
|
|
| 2.3 |
| 4.8 |
| 2.1 |
|
|
| 4.4 |
| 7.1 |
| 2.9 |
|
In accordance with best practice guidelines issued during the year, the following further disclosures are given:
(In £’s million) |
| 2003 |
| 2002 |
| 2001 |
| |
|
|
|
|
|
|
|
| |
Audit fees: |
|
|
|
|
|
|
| |
Statutory audit |
| 2.1 |
| 2.3 |
| 0.8 |
| |
Audit related regulatory work |
| 0.1 |
| 1.0 |
| 0.1 |
| |
|
| 2.2 |
| 3.3 |
| 0.9 |
| |
Non-audit fees: |
|
|
|
|
|
|
| |
Audit related services |
| 0.3 |
| 1.0 |
| 1.4 |
| |
|
|
|
|
|
|
|
| |
Tax services | – Compliance |
| 0.2 |
| 0.1 |
| 0.1 |
|
| – Consultancy |
| 1.7 |
| 2.7 |
| 0.5 |
|
|
| 1.9 |
| 2.8 |
| 0.6 |
| |
|
| 4.4 |
| 7.1 |
| 2.9 |
| |
3 Exceptional items
Exceptional operating costs of £51m comprise £42m in respect of the reorganisation of the Group, announced in September 2002, to integrate Reemtsma with the Group’s existing businesses, £5m in respect of the closure of the Meppel factory in The Netherlands and a further £4m to finalise the streamlining of the Group’s operations announced in October 2001. These provisions relate primarily to termination of employment.
The profit on disposal of fixed assets of £12m relates to the sale of the Dublin factory site, which was sold in March 2003.
The tax relief on exceptional items is disclosed in note 6.
In 2002 the exceptional operating costs of £103m comprised £9m in respect of the streamlining announced in October 2001 and £94m in respect of the reorganisation of the Group, following the Reemtsma acquisition. These costs related primarily to termination of employment.
The 2002 exceptional finance charge is explained in note 5.
65
(In £’s million) |
| 2003 |
| 2002 |
| 2001 |
|
|
|
|
|
|
|
|
|
Employment costs |
|
|
|
|
|
|
|
Wages and salaries |
| 406 |
| 259 |
| 159 |
|
Social security costs |
| 47 |
| 29 |
| 18 |
|
Pension costs (note 23) |
| 34 |
| 13 |
| 7 |
|
|
| 487 |
| 301 |
| 184 |
|
Details of Directors’ emoluments and interests are provided within the remuneration report on pages 45 to 56. These disclosures form part of the financial statements. The highest paid Director during the year was Mr G Davis and details of his emoluments are shown on pages 49 to 56.
Average number of persons employed by the Group during the year
(Number) |
| 2003 |
| 2002 |
| 2001 |
|
|
|
|
|
|
|
|
|
UK |
| 2,821 |
| 2,791 |
| 2,810 |
|
|
|
|
|
|
|
|
|
Germany |
| 3,096 |
| 1,514 |
| 379 |
|
Rest of Western Europe |
| 1,739 |
| 1,650 |
| 1,475 |
|
Rest of the World |
| 9,148 |
| 5,485 |
| 1,696 |
|
International |
| 13,983 |
| 8,649 |
| 3,550 |
|
|
| 16,804 |
| 11,440 |
| 6,360 |
|
The average number of employees has increased as a result of the full year impact of the 2002 acquisition of Reemtsma.
5 Interest and other finance charges
(In £’s million) |
| 2003 |
| 2002 |
| 2001 |
|
|
|
|
|
|
|
|
|
Interest payable |
|
|
|
|
|
|
|
On bank loans and overdrafts |
| 46 |
| 50 |
| 41 |
|
On other loans |
| 212 |
| 118 |
| 90 |
|
|
| 258 |
| 168 |
| 131 |
|
Interest capitalised |
| — |
| — |
| (1 | ) |
|
| 258 |
| 168 |
| 130 |
|
Interest receivable |
| (21 | ) | (21 | ) | (20 | ) |
Net interest |
| 237 |
| 147 |
| 110 |
|
Exceptional finance charges |
| — |
| 33 |
| — |
|
|
| 237 |
| 180 |
| 110 |
|
During 2002 the Group negotiated new bank facilities in order to finance the acquisition of Reemtsma Cigarettenfabriken GmbH. This incurred one-off facility arrangement fees of £45m which were fully expensed in the period as exceptional finance charges, partially offset by a £12m foreign exchange gain resulting from hedging arrangements to exchange the sterling equity issuance into euros.
66
6 Taxation
Analysis of charge in the year
(In £’s million) |
| 2003 |
| 2002 |
| 2001 |
|
|
|
|
|
|
|
|
|
Current tax |
|
|
|
|
|
|
|
UK Corporation tax at 30.0% (2002: 30.0%; 2001: 30.0%) |
| 82 |
| 98 |
| 96 |
|
Adjustments to current tax in respect of prior years |
| 12 |
| (1 | ) | (4 | ) |
|
| 94 |
| 97 |
| 92 |
|
Overseas |
|
|
|
|
|
|
|
Current |
| 142 |
| 70 |
| 43 |
|
Total current tax |
| 236 |
| 167 |
| 135 |
|
Deferred tax |
|
|
|
|
|
|
|
Origination and reversal of timing differences |
| (4 | ) | (27 | ) | 4 |
|
|
| (4 | ) | (27 | ) | 4 |
|
Total tax charge |
| 232 |
| 140 |
| 139 |
|
The tax charge includes tax relief on exceptional items of £11m (2002: £37m).
Factors affecting the current tax charge for the year
Pre-goodwill amortisation, the tax assessed for the year at 27.1% is lower than the standard higher rate of corporation tax in the UK (30.0%). Post-goodwill amortisation, the effective tax rate exceeded 30.0%. A reconciliation between the current tax charge at the standard UK rate and the actual current tax charge is shown below:
(In £’s million) |
| 2003 |
| 2002 |
| 2001 |
|
|
|
|
|
|
|
|
|
Profit on ordinary activities before taxation |
| 656 |
| 423 |
| 494 |
|
Profit on ordinary activities multiplied by standard rate of corporation tax in the UK of 30.0% (2002: 30.0%; 2001: 30.0%) |
| 197 |
| 127 |
| 148 |
|
Effects of: |
|
|
|
|
|
|
|
Expenses not deductible for tax purposes |
| 8 |
| 1 |
| 2 |
|
Non-deductible goodwill |
| 61 |
| 25 |
| 2 |
|
Lower tax rates on overseas earnings |
| (33 | ) | (12 | ) | (8 | ) |
Current deferred tax |
| 4 |
| 27 |
| (4 | ) |
Other |
| (1 | ) | (1 | ) | (5 | ) |
Total current tax |
| 236 |
| 167 |
| 135 |
|
Factors that may affect future tax charges
No provision has been made for deferred tax on gains rolled over into replacement assets. Such tax would become payable only if the assets were sold without it being possible to claim rollover relief. The total amount unprovided is £6m and it is not envisaged that this tax will become payable in the foreseeable future.
No deferred tax is recognised on the unremitted earnings of overseas subsidiaries, associates or joint ventures, as no dividends have been declared. The Group currently does not have any intention to remit dividends from overseas subsidiaries to the UK but if it were to do so, the tax effect would be immaterial.
67
7 Dividends on ordinary shares
(In £’s million) |
| 2003 |
| 2002 |
| 2001 |
|
|
|
|
|
|
|
|
|
Interim 12.0p (2002: 10.0p; 2001: 9.0p) |
| 87 |
| 62 |
| 56 |
|
Proposed final 30.0p (2002: 23.0p; 2001: 19.8p) |
| 217 |
| 167 |
| 122 |
|
|
| 304 |
| 229 |
| 178 |
|
8 Earnings per share
(In pence) |
| 2003 |
| 2002 |
| 2001 |
|
|
|
|
|
|
|
|
|
Earnings per share |
|
|
|
|
|
|
|
Basic |
| 58.1 |
| 41.0 |
| 56.6 |
|
Adjustment for amortisation and exceptional items |
| 31.9 |
| 27.4 |
| 2.4 |
|
Adjusted |
| 90.0 |
| 68.4 |
| 59.0 |
|
Diluted |
| 57.9 |
| 40.8 |
| 56.2 |
|
(In £’s million) |
| 2003 |
| 2002 |
| 2001 |
|
|
|
|
|
|
|
|
|
Earnings |
|
|
|
|
|
|
|
Basic |
| 421 |
| 272 |
| 350 |
|
Adjustment for amortisation and exceptional items |
| 231 |
| 182 |
| 15 |
|
Adjusted |
| 652 |
| 454 |
| 365 |
|
Adjusted earnings per share are calculated before tax effected exceptional items of £28m (2002: £99m) (notes 3, 5 and 6) and amortisation of £203m (2002: £83m), since the Directors consider that this gives a useful additional indication of underlying performance.
2001 adjusted earnings per share have been calculated using earnings before amortisation of the intangible assets acquired in Australia and New Zealand in September 1999, and the EFKA group, the Baelen group, Tobaccor and Mayfair vending business assets in 2001.
There would be no significant dilution of earnings if the outstanding share options referred to in note 18 were exercised.
(Number) |
| 2003 |
| 2002 |
| 2001 |
|
|
|
|
|
|
|
|
|
Weighted average number of shares outstanding during the year |
|
|
|
|
|
|
|
Basic |
| 724,328,162 |
| 663,380,317 |
| 618,713,424 |
|
Effect of share options |
| 3,225,153 |
| 3,677,285 |
| 4,090,105 |
|
Diluted |
| 727,553,315 |
| 667,057,602 |
| 622,803,529 |
|
68
9 Intangible fixed assets
(In £’s million) |
| Trade marks, |
| Goodwill |
| Total |
|
|
|
|
|
|
|
|
|
Cost |
|
|
|
|
|
|
|
As at 29 September 2002 |
| 124 |
| 3,548 |
| 3,672 |
|
Exchange movements |
| 19 |
| 401 |
| 420 |
|
Acquisition related (note 20) |
| — |
| 47 |
| 47 |
|
As at 30 September 2003 |
| 143 |
| 3,996 |
| 4,139 |
|
Accumulated amortisation |
|
|
|
|
|
|
|
As at 29 September 2002 |
| 25 |
| 84 |
| 109 |
|
Exchange movements |
| 4 |
| 16 |
| 20 |
|
Charge for the year |
| 9 |
| 194 |
| 203 |
|
As at 30 September 2003 |
| 38 |
| 294 |
| 332 |
|
Net book value |
|
|
|
|
|
|
|
As at 30 September 2003 |
| 105 |
| 3,702 |
| 3,807 |
|
As at 28 September 2002 |
| 99 |
| 3,464 |
| 3,563 |
|
10 Tangible fixed assets
(In £’s million) |
| Land and |
| Plant and |
| Fixtures and |
| Total |
|
|
|
|
|
|
|
|
|
|
|
Cost |
|
|
|
|
|
|
|
|
|
As at 29 September 2002 |
| 245 |
| 692 |
| 105 |
| 1,042 |
|
Exchange movements |
| 12 |
| 41 |
| 11 |
| 64 |
|
Reclassifications |
| 1 |
| 2 |
| (3 | ) | — |
|
Acquisition related (note 20) |
| — |
| (57 | ) | — |
| (57 | ) |
Additions |
| 18 |
| 45 |
| 19 |
| 82 |
|
Disposals |
| (15 | ) | (26 | ) | (5 | ) | (46 | ) |
As at 30 September 2003 |
| 261 |
| 697 |
| 127 |
| 1,085 |
|
Accumulated depreciation |
|
|
|
|
|
|
|
|
|
As at 29 September 2002 |
| 25 |
| 236 |
| 30 |
| 291 |
|
Exchange movements |
| 6 |
| 21 |
| 2 |
| 29 |
|
Charge for the year |
| 10 |
| 51 |
| 22 |
| 83 |
|
Disposals |
| (5 | ) | (26 | ) | (1 | ) | (32 | ) |
As at 30 September 2003 |
| 36 |
| 282 |
| 53 |
| 371 |
|
Net book value |
|
|
|
|
|
|
|
|
|
As at 30 September 2003 |
| 225 |
| 415 |
| 74 |
| 714 |
|
As at 28 September 2002 |
| 220 |
| 456 |
| 75 |
| 751 |
|
69
Land and buildings at net book value:
(In £’s million) |
| 2003 |
| 2002 |
|
|
|
|
|
|
|
Freehold |
| 202 |
| 185 |
|
Long leasehold |
| 19 |
| 17 |
|
Short leasehold |
| 4 |
| 18 |
|
|
| 225 |
| 220 |
|
11 Investments
(In £’s million) |
| Own shares |
| Other |
| Total |
|
|
|
|
|
|
|
|
|
Fixed asset investments |
|
|
|
|
|
|
|
As at 29 September 2002 |
| 19 |
| 4 |
| 23 |
|
Additions |
| — |
| 3 |
| 3 |
|
Net investment in own shares in the year |
| 22 |
| — |
| 22 |
|
Amortisation charge in the year |
| (5 | ) | — |
| (5 | ) |
As at 30 September 2003 |
| 36 |
| 7 |
| 43 |
|
Own shares
The investment in own shares represents shares in Imperial Tobacco Group PLC held by the Imperial Tobacco Group PLC Employee Benefit Trusts (note 18). The market value of the shares at 30 September 2003 was £54m (2002: £39m).
(In £’s million) |
| 2003 |
| 2002 |
|
|
|
|
|
|
|
Current asset investments |
|
|
|
|
|
Short-term deposits |
| 32 |
| 51 |
|
Other liquid assets |
| 36 |
| 61 |
|
|
| 68 |
| 112 |
|
12 Stocks
(In £’s million) |
| 2003 |
| 2002 |
|
|
|
|
|
|
|
Raw materials |
| 431 |
| 489 |
|
Work in progress |
| 19 |
| 18 |
|
Finished stock |
| 453 |
| 363 |
|
Other stock |
| 106 |
| 107 |
|
|
| 1,009 |
| 977 |
|
Other stock comprises mainly duty-paid tax stamps.
70
(In £’s million) |
| 2003 |
| 2002 |
|
|
|
|
|
|
|
Amounts falling due within one year |
|
|
|
|
|
Trade debtors |
| 858 |
| 608 |
|
Corporate taxes |
| 33 |
| 38 |
|
Deferred tax |
| 10 |
| — |
|
Other debtors and prepayments |
| 100 |
| 85 |
|
|
| 1,001 |
| 731 |
|
Amounts falling due after more than one year |
|
|
|
|
|
Other debtors and prepayments |
| 1 |
| 3 |
|
|
| 1,002 |
| 734 |
|
14 Creditors
(In £’s million) |
| 2003 |
| 2002 |
|
|
|
|
|
|
|
Amounts falling due within one year |
|
|
|
|
|
Borrowings (note 15) |
| 605 |
| 93 |
|
Trade creditors |
| 154 |
| 170 |
|
Corporate taxes |
| 141 |
| 92 |
|
Other taxes, duties and social security contributions |
| 1,063 |
| 1,151 |
|
Deferred consideration |
| 425 |
| 426 |
|
Other creditors |
| 86 |
| 50 |
|
Accruals and deferred income |
| 184 |
| 173 |
|
Proposed dividend |
| 217 |
| 167 |
|
|
| 2,875 |
| 2,322 |
|
(In £’s million) |
| 2003 |
| 2002 |
|
|
|
|
|
|
|
Amounts falling due after more than one year |
|
|
|
|
|
Borrowings (note 15) |
| 3,427 |
| 3,645 |
|
Deferred consideration |
| 57 |
| 46 |
|
Accruals and deferred income |
| 1 |
| 3 |
|
|
| 3,485 |
| 3,694 |
|
71
15 Borrowings and financial instruments
The Group operates a centralised treasury function that is responsible for the management of the financial risks of the Group, together with its financing and liquidity requirements. It does not operate as a profit centre, nor does it enter into speculative transactions, and is subject to policies and procedures approved by the Board. On a frequent basis, the Group Treasurer discusses matters with a treasury sub-committee, consisting of senior executives, including the Finance Director. The Group Treasurer reports on a regular basis to the Board, including provision of monthly treasury summaries and an annual review of strategy.
The following table analyses the Group’s financial liabilities at the balance sheet date:
(In £’s million) |
| 2003 |
| 2002 |
| ||
|
|
|
|
|
| ||
Amounts falling due within one year |
|
|
|
|
| ||
Bank loans and overdrafts |
| 106 |
| 57 |
| ||
Other loans |
| 499 |
| 36 |
| ||
|
| 605 |
| 93 |
| ||
|
|
|
|
|
| ||
Amounts falling due after more than one year |
|
|
|
|
| ||
Bank loans |
| – between one and two years |
| 2 |
| 2 |
|
Other loans |
| – between one and two years |
| 635 |
| 456 |
|
Bank loans |
| – between two and five years |
| 287 |
| 339 |
|
Other loans |
| – between two and five years |
| 1,748 |
| 2,133 |
|
Other loans |
| – after five years |
| 755 |
| 715 |
|
|
| 3,427 |
| 3,645 |
| ||
Total borrowings |
| 4,032 |
| 3,738 |
| ||
Loans amounting to £8m (2002: £9m) are secured by charges, mortgages or liens on certain fixed assets.
In addition to the bank loans maturing between two and five years, there are €610m of bank guarantees issued to support the future purchase of 9.99% of Reemtsma Cigarettenfabriken GmbH.
The loans maturing after five years are the US $600m global bond (which matures in April 2009), and the £350m sterling bond (which matures in June 2012).
(i) Interest rate risk profile of financial liabilities
The Group is exposed to fluctuations in interest rates on its borrowings and surplus cash. In order to manage interest rate risk, the Group maintains both fixed and floating rate debt and uses derivatives, including interest rate and cross currency swaps, to vary the mix.
The following table analyses the currency and interest composition of the Group’s financial liabilities at the balance sheet date.
|
|
|
|
|
| Fixed rate financial liabilities |
| ||||
|
| Total |
| Floating rate |
| Fixed rate |
| Weighted |
| Weighted |
|
Currency |
| 2003 |
| 2003 |
| 2003 |
| 2003 |
| 2003 |
|
(In £’s million) |
|
|
|
|
|
|
|
|
|
|
|
|
|
|
|
|
|
|
|
|
|
|
|
Sterling |
| 772 |
| 322 |
| 450 |
| 6.0 |
| 6.5 |
|
Euro |
| 3,111 |
| 541 |
| 2,570 |
| 4.5 |
| 2.6 |
|
Australian dollar |
| 114 |
| 56 |
| 58 |
| 5.0 |
| 1.9 |
|
US dollar |
| 11 |
| 11 |
| — |
| n/a |
| n/a |
|
Other |
| 24 |
| 8 |
| 16 |
| 10.2 |
| 2.1 |
|
|
| 4,032 |
| 938 |
| 3,094 |
| 4.8 |
| 3.2 |
|
72
|
|
|
|
|
| Fixed rate financial liabilities |
| ||||
Currency |
| Total |
| Floating rate |
| Fixed rate |
| Weighted |
| Weighted |
|
(In £’s million) |
|
|
|
|
|
|
|
|
|
|
|
|
|
|
|
|
|
|
|
|
|
|
|
Sterling |
| 475 |
| 25 |
| 450 |
| 6.6 |
| 4.5 |
|
Euro |
| 3,117 |
| 409 |
| 2,708 |
| 4.4 |
| 2.9 |
|
Australian dollar |
| 98 |
| 73 |
| 25 |
| 5.3 |
| 2.3 |
|
US dollar |
| 31 |
| 31 |
| — |
| n/a |
| n/a |
|
Other |
| 17 |
| — |
| 17 |
| 10.3 |
| 3.2 |
|
|
| 3,738 |
| 538 |
| 3,200 |
| 4.7 |
| 3.1 |
|
The floating rate financial liabilities comprise of bank borrowings and capital market issuance. The majority of bank borrowings bear interest at rates fixed in advance for periods of one month by reference to LIBOR (in the case of sterling borrowings) and EURIBOR (in the case of euro borrowings). The capital market issuance in place at the year end bears interest (post interest and currency swaps) at rates fixed in advance for six months by reference to LIBOR (in the case of the US dollar bond), for three months by reference to EURIBOR (in the case of the sterling bond and some of the euro bonds) and for three months by reference to Australian dollar bank bills (in the case of one of the euro bonds).
The figures shown in the tables above take into account various interest rate and currency swaps. Hence the US dollar denominated bond issued in 1999 is shown within the sterling balance, and the sterling bond issued in 2002 is shown in the euro balance. The fixed rate financial liabilities do not take into account forward start swaps, which may become effective after the balance sheet date.
(ii) Currency risk disclosure
The Group is exposed to the translation of the results of overseas subsidiaries into sterling, as well as the impact of trading transactions in foreign currencies. On significant acquisitions of overseas companies, borrowings are raised in the local currency to minimise the translation risk. For transaction risk, where necessary, forward foreign exchange deals are entered into to hedge a proportion of the forecast foreign currency cash flows. At the year end, £47.7m notional of forward foreign exchange deals were outstanding (2002: £32.6m).
The tables below show the extent to which Group companies have monetary assets and liabilities in currencies other than their local currency, at the balance sheet date:
|
| Net foreign currency monetary assets / (liabilities) |
| ||||||||||
Functional currency |
| Sterling |
| Euro |
| US dollars |
| Australian |
| Other |
| Total |
|
(In £’s million) |
|
|
|
|
|
|
|
|
|
|
|
|
|
|
|
|
|
|
|
|
|
|
|
|
|
|
|
Sterling |
| — |
| 918 |
| 5 |
| (118 | ) | 17 |
| 822 |
|
Euro |
| 640 |
| — |
| 19 |
| 12 |
| 2 |
| 673 |
|
Other |
| (1 | ) | (32 | ) | (33 | ) | — |
| 26 |
| (40 | ) |
|
| 639 |
| 886 |
| (9 | ) | (106 | ) | 45 |
| 1,455 |
|
73
|
| Net foreign currency monetary assets / (liabilities) |
| ||||||||||
Functional currency |
| Sterling |
| Euro |
| US dollars |
| Australian |
| Other |
| Total |
|
(In £’s million) |
|
|
|
|
|
|
|
|
|
|
|
|
|
|
|
|
|
|
|
|
|
|
|
|
|
|
|
Sterling |
| — |
| 1,061 |
| (3 | ) | 21 |
| 26 |
| 1,105 |
|
Euro |
| 43 |
| — |
| 13 |
| 3 |
| 262 |
| 321 |
|
Other |
| 30 |
| (40 | ) | (26 | ) | — |
| 14 |
| (22 | ) |
|
| 73 |
| 1,021 |
| (16 | ) | 24 |
| 302 |
| 1,404 |
|
The figures shown in the previous tables take into account the effect of the currency swaps held as shown in the analysis on pages 78 and 79.
(iii) Borrowing facilities
The Group has various borrowing facilities available to it. The undrawn committed facilities which are all available at a floating rate, as at 30 September 2003 in respect of which all conditions precedent have been met at that date were as follows:
(In £’s million) |
| 2003 |
| 2002 |
|
|
|
|
|
|
|
Expiring in one year or less |
| 84 |
| 71 |
|
Expiring in more than one year but not more than two years |
| 420 |
| — |
|
Expiring between two to five years |
| 549 |
| 537 |
|
|
| 1,053 |
| 608 |
|
In addition to the above committed facilities there are other uncommitted facilities available to the Group.
(iv) Fair values of derivative financial instruments
A comparison by category of the fair values and book values of the Group’s financial liabilities is set out below:
(In £’s million) |
| Positive |
| Negative |
| Fair value |
| Book value |
|
|
|
|
|
|
|
|
|
|
|
Derivative financial instruments held to manage the interest and currency profile |
|
|
|
|
|
|
|
|
|
Interest rate swaps and similar instruments |
| 154 |
| (151 | ) | 3 |
| — |
|
Currency swaps |
| 42 |
| (32 | ) | 10 |
| — |
|
(In £’s million) |
| Positive |
| Negative |
| Fair value |
| Book value |
|
|
|
|
|
|
|
|
|
|
|
Derivative financial instruments held to manage the interest and currency profile |
|
|
|
|
|
|
|
|
|
Interest rate swaps and similar instruments |
| 111 |
| (116 | ) | (5 | ) | — |
|
Currency swaps |
| 100 |
| — |
| 100 |
| — |
|
The figures shown in the tables above for derivative financial instruments have been derived from third party valuations as at the balance sheet date.
74
(v) Detailed analysis of financial assets and financial liabilities
The following table shows the financial assets and financial liabilities held by the Group, their maturities and weighted average interest rates as at 30 September 2003:
Maturity date and weighted average interest rate | ||||||||||||||||||||||||||||||
(In £’s million unless |
| 2004 |
| (%) |
| 2005 |
| (%) |
| 2006 |
| (%) |
| 2007 |
| (%) |
| 2008 |
| (%) |
| There- |
| (%) |
| Total |
| Fair |
| |
|
|
|
|
|
|
|
|
|
|
|
|
|
|
|
|
|
|
|
|
|
|
|
|
|
|
|
|
|
| |
Assets / (liabilities) (all at floating rates after cross currency swaps before the effect of interest rate swaps) |
|
|
|
|
|
|
|
|
|
|
|
|
|
|
|
|
|
|
|
|
|
|
|
|
|
|
|
|
| |
Cash deposits | Sterling |
| 102 |
| 3.6 |
|
|
|
|
|
|
|
|
|
|
|
|
|
|
|
|
|
|
|
|
| 102 |
| 102 |
|
| Euro |
| 169 |
| 1.8 |
|
|
|
|
|
|
|
|
|
|
|
|
|
|
|
|
|
|
|
|
| 169 |
| 169 |
|
| Other |
| 118 |
| 4.6 |
|
|
|
|
|
|
|
|
|
|
|
|
|
|
|
|
|
|
|
|
| 118 |
| 118 |
|
Total cash deposits |
| 389 |
|
|
|
|
|
|
|
|
|
|
|
|
|
|
|
|
|
|
|
|
|
|
| 389 |
| 389 |
| |
Weighted average receivable interest rate (%) |
|
|
| 3.1 |
|
|
|
|
|
|
|
|
|
|
|
|
|
|
|
|
|
|
|
|
| 3.1 |
|
|
| |
Short-term debt | Sterling |
| (157 | ) | 4.1 |
|
|
|
|
|
|
|
|
|
|
|
|
|
|
|
|
|
|
|
|
| (157 | ) | (159 | ) |
| Euro |
| (420 | ) | 2.9 |
|
|
|
|
|
|
|
|
|
|
|
|
|
|
|
|
|
|
|
|
| (420 | ) | (424 | ) |
| United States dollars |
| (11 | ) | 1.5 |
|
|
|
|
|
|
|
|
|
|
|
|
|
|
|
|
|
|
|
|
| (11 | ) | (11 | ) |
| Other |
| (17 | ) | 7.6 |
|
|
|
|
|
|
|
|
|
|
|
|
|
|
|
|
|
|
|
|
| (17 | ) | (17 | ) |
Total short-term debt |
| (605 | ) |
|
|
|
|
|
|
|
|
|
|
|
|
|
|
|
|
|
|
|
|
|
| (605 | ) | (611 | ) | |
Long-term debt | Sterling |
|
|
|
|
|
|
|
|
|
|
|
|
|
|
|
|
| (246 | ) | 4.3 |
| (369 | ) | 5.0 |
| (615 | ) | (664 | ) |
| Euro |
|
|
|
|
| (635 | ) | 3.2 |
| (588 | ) | 3.1 |
| (1,047 | ) | 3.4 |
| (35 | ) | 2.8 |
| (386 | ) | 3.4 |
| (2,691 | ) | (2,825 | ) |
| Australian dollars |
|
|
|
|
|
|
|
|
| (114 | ) | 5.0 |
|
|
|
|
|
|
|
|
|
|
|
|
| (114 | ) | (114 | ) |
| Other |
|
|
|
|
| (2 | ) | 8.7 |
| (2 | ) | 8.6 |
| (1 | ) | 8.6 |
| (2 | ) | 9.3 |
|
|
|
|
| (7 | ) | (7 | ) |
Total long-term debt |
|
|
|
|
| (637 | ) |
|
| (704 | ) |
|
| (1,048 | ) |
|
| (283 | ) |
|
| (755 | ) |
|
| (3,427 | ) | (3,610 | ) | |
Weighted average payable interest rate (%) |
|
|
| 3.3 |
|
|
| 3.2 |
|
|
| 3.4 |
|
|
| 3.4 |
|
|
| 4.1 |
|
|
| 4.2 |
| 3.6 |
|
|
| |
The cash deposits earn interest at floating rates of interest and are comprised mainly of short-term money market deposits with a maturity date not exceeding one year.
Credit risks on the amounts due from counterparties, in relation to cash deposits and other financial instruments, are managed by limiting the aggregate amount of exposure to any one counterparty, based on their credit rating.
75
The following table shows the financial assets and financial liabilities held by the Group, their maturities and weighted average interest rates as at 28 September 2002:
|
| Maturity date and weighted average interest rate |
| |||||||||||||||||||||||||||
(In £’s million unless |
| 2003 |
| (%) |
| 2004 |
| (%) |
| 2005 |
| (%) |
| 2006 |
| (%) |
| 2007 |
| (%) |
| There- |
| (%) |
| Total |
| Fair |
| |
|
|
|
|
|
|
|
|
|
|
|
|
|
|
|
|
|
|
|
|
|
|
|
|
|
|
|
|
|
| |
Assets / (liabilities) (all at floating rates after cross currency swaps before the effect of interest rate swaps) |
|
|
|
|
|
|
|
|
|
|
|
|
|
|
|
|
|
|
|
|
|
|
|
|
|
|
|
|
| |
Cash deposits | Sterling |
| 134 |
| 3.3 |
|
|
|
|
|
|
|
|
|
|
|
|
|
|
|
|
|
|
|
|
| 134 |
| 134 |
|
| Euro |
| 248 |
| 3.1 |
|
|
|
|
|
|
|
|
|
|
|
|
|
|
|
|
|
|
|
|
| 248 |
| 248 |
|
| Other |
| 42 |
| 4.5 |
|
|
|
|
|
|
|
|
|
|
|
|
|
|
|
|
|
|
|
|
| 42 |
| 42 |
|
Total cash deposits |
| 424 |
|
|
|
|
|
|
|
|
|
|
|
|
|
|
|
|
|
|
|
|
|
|
| 424 |
| 424 |
| |
Weighted average receivable interest rate (%) |
|
|
| 3.3 |
|
|
|
|
|
|
|
|
|
|
|
|
|
|
|
|
|
|
|
|
| 3.3 |
|
|
| |
Short-term debt | Sterling |
| (26 | ) | 4.3 |
|
|
|
|
|
|
|
|
|
|
|
|
|
|
|
|
|
|
|
|
| (26 | ) | (26 | ) |
| Euro |
| (29 | ) | 4.0 |
|
|
|
|
|
|
|
|
|
|
|
|
|
|
|
|
|
|
|
|
| (29 | ) | (29 | ) |
| United States dollars |
| (31 | ) | 2.5 |
|
|
|
|
|
|
|
|
|
|
|
|
|
|
|
|
|
|
|
|
| (31 | ) | (31 | ) |
| Other |
| (7 | ) | 11.9 |
|
|
|
|
|
|
|
|
|
|
|
|
|
|
|
|
|
|
|
|
| (7 | ) | (7 | ) |
Total short-term debt |
| (93 | ) |
|
|
|
|
|
|
|
|
|
|
|
|
|
|
|
|
|
|
|
|
|
| (93 | ) | (93 | ) | |
Long-term debt | Sterling |
|
|
|
|
| (80 | ) | 5.0 |
|
|
|
|
|
|
|
|
|
|
|
|
| (369 | ) | 5.7 |
| (449 | ) | (484 | ) |
| Euro |
|
|
|
|
| (376 | ) | 4.1 |
| (567 | ) | 4.4 |
| (523 | ) | 4.5 |
| (1,276 | ) | 4.6 |
| (346 | ) | 4.6 |
| (3,088 | ) | (3,197 | ) |
| Australian dollars |
|
|
|
|
|
|
|
|
|
|
|
|
| (98 | ) | 5.0 |
|
|
|
|
|
|
|
|
| (98 | ) | (98 | ) |
| Other |
|
|
|
|
| (2 | ) | 10.0 |
|
|
|
|
|
|
|
|
| (8 | ) | 8.5 |
|
|
|
|
| (10 | ) | (10 | ) |
Total long-term debt |
|
|
|
|
| (458 | ) |
|
| (567 | ) |
|
| (621 | ) |
|
| (1,284 | ) |
|
| (715 | ) |
|
| (3,645 | ) | (3,789 | ) | |
Weighted average payable interest rate (%) |
|
|
| 4.2 |
|
|
| 4.3 |
|
|
| 4.4 |
|
|
| 4.6 |
|
|
| 4.6 |
|
|
| 5.2 |
| 4.6 |
|
|
| |
The cash deposits earn interest at floating rates of interest and are comprised mainly of short-term money market deposits with a maturity date not exceeding one year.
76
An analysis of the unrecognised gains and losses on hedges at the year end is set out below.
(In £’s million) |
| Gains |
| Losses |
| Gains |
| Losses |
|
|
|
|
|
|
|
|
|
|
|
Unrecognised gains and losses on hedges at beginning of year |
| 211 |
| (116 | ) | 133 |
| (28 | ) |
Gains and losses arising in previous years recognised in the year |
| (6 | ) | 4 |
| (14 | ) | 1 |
|
Gains and losses arising before the start of the year not recognised in the year |
| 205 |
| (112 | ) | 119 |
| (27 | ) |
Gains and losses arising in the year not recognised in the year |
| (9 | ) | (71 | ) | 92 |
| (89 | ) |
Unrecognised gains and losses on hedges at end of year |
| 196 |
| (183 | ) | 211 |
| (116 | ) |
Of which: |
|
|
|
|
|
|
|
|
|
Gains and losses expected to be recognised in the next year |
| 16 |
| (12 | ) | 6 |
| (4 | ) |
Gains and losses expected to be recognised in the years following next year |
| 180 |
| (171 | ) | 205 |
| (112 | ) |
77
(vii) Derivative financial instruments
The following table sets out the derivative financial instruments held by the Group at 30 September 2003. The table presents the nominal value of such investments used to calculate the contractual payments under such contracts, analysed by maturity date, together with the related weighted average interest rate where relevant. Some of the interest rate swaps have embedded options and assumptions have been made based on third party valuations at the balance sheet date to determine whether such options are likely to be exercised in order to determine the probable maturity date.
|
| Accounting year ending in |
| There- |
| Total |
| Fair |
| ||||||||
(in £’s million unless otherwise indicated) |
| 2004 |
| 2005 |
| 2006 |
| 2007 |
| 2008 |
|
|
| ||||
Sterling interest rate derivatives |
|
|
|
|
|
|
|
|
|
|
|
|
|
|
|
|
|
Interest rate swaps – pay fixed, receive variable: |
|
|
|
|
|
|
|
|
|
|
|
|
|
|
|
|
|
Notional amount |
| 75 |
|
|
|
|
| 50 |
| 120 |
| 230 | (1) | 475 |
| (36 | ) |
Weighted average interest rate to pay (%) |
| 7.6 |
|
|
|
|
| 6.6 |
| 6.4 |
| 5.1 |
| 6.0 |
|
|
|
Interest rate swaps – pay variable, receive fixed: |
|
|
|
|
|
|
|
|
|
|
|
|
|
|
|
|
|
Notional amount |
| 80 |
|
|
|
|
|
|
|
|
|
|
| 80 |
| 2 |
|
Weighted average interest rate to receive (%) |
| 7.4 |
|
|
|
|
|
|
|
|
|
|
| 7.4 |
|
|
|
Weighted average margin over LIBOR to pay (%) |
| 0.8 |
|
|
|
|
|
|
|
|
|
|
| 0.8 |
|
|
|
Euro interest rate derivatives |
|
|
|
|
|
|
|
|
|
|
|
|
|
|
|
|
|
Interest rate swaps – pay fixed, receive variable: |
|
|
|
|
|
|
|
|
|
|
|
|
|
|
|
|
|
Notional amount |
| 580 | (2) | 592 |
| 74 | (3) | 1,030 |
| 63 |
| 231 |
| 2,570 |
| (115 | ) |
Weighted average interest rate to pay (%) |
| 4.2 |
| 4.5 |
| 2.4 |
| 4.8 |
| 3.1 |
| 4.9 |
| 4.5 |
|
|
|
Interest rate swaps – pay variable, receive variable: |
|
|
|
|
|
|
|
|
|
|
|
|
|
|
|
|
|
Notional amount |
| 35 | (4) |
|
|
|
|
|
|
|
|
|
| 35 |
| — |
|
Interest rate swaps – pay variable, receive fixed: |
|
|
|
|
|
|
|
|
|
|
|
|
|
|
|
|
|
Notional amount |
| 280 |
| 526 |
| 701 |
| 1,051 |
|
|
|
|
| 2,558 |
| 152 |
|
Weighted average interest rate to receive (%) |
| 5.6 |
| 5.6 |
| 6.1 |
| 6.1 |
|
|
|
|
| 5.9 |
|
|
|
Weighted average margin over EURIBOR to pay (%) |
| 0.7 |
| 1.1 |
| 1.0 |
| 1.2 |
|
|
|
|
| 1.1 |
|
|
|
Caps purchased: |
|
|
|
|
|
|
|
|
|
|
|
|
|
|
|
|
|
Notional amount |
| 140 |
|
|
| 140 |
|
|
|
|
|
|
| 280 |
| — |
|
Weighted average strike price (%) |
| 5.5 |
|
|
| 5.5 |
|
|
|
|
|
|
| 5.5 |
|
|
|
Australian dollar interest rate derivatives |
|
|
|
|
|
|
|
|
|
|
|
|
|
|
|
|
|
Interest rate swaps – pay fixed, receive variable: |
|
|
|
|
|
|
|
|
|
|
|
|
|
|
|
|
|
Notional amount |
|
|
| 29 |
| 29 |
|
|
|
|
|
|
| 58 |
| — |
|
Weighted average interest rate to pay (%) |
|
|
| 5.3 |
| 4.7 |
|
|
|
|
|
|
| 5.0 |
|
|
|
Currency swaps |
|
|
|
|
|
|
|
|
|
|
|
|
|
|
|
|
|
Notional amount |
|
|
|
|
|
|
|
|
|
|
| 370 | (5) | 370 |
| 40 |
|
US dollar interest rate to receive (%) |
|
|
|
|
|
|
|
|
|
|
| 7.1 |
| 7.1 |
|
|
|
Sterling interest margin over LIBOR to pay (%) |
|
|
|
|
|
|
|
|
|
|
| 1.3 |
| 1.3 |
|
|
|
Notional amount |
| 60 | (5) | 100 | (5) |
|
|
|
|
|
| 350 | (5) | 510 |
| (28 | ) |
Sterling interest rate to receive (%) |
| 7.4 |
| 6.0 |
|
|
|
|
|
|
| 6.7 |
| 6.7 |
|
|
|
Interest margin over EURIBOR to pay (%) |
| 0.9 |
| 1.0 |
|
|
|
|
|
|
| 1.3 |
| 1.2 |
|
|
|
Notional amount |
| 114 | (5),(6) |
|
|
|
|
|
|
|
|
|
| 114 |
| (2 | ) |
The Group has entered into certain swap transactions with contractual maturities exceeding those of the underlying debt being hedged, in anticipation of there being additional floating rate debt when the existing debt matures.
(1) The following trades are included within this balance:
£25m forward start five-year swaption starting October 2006 at 5.5% at the counterparties option.
£50m swaps maturing in October 2006 at 5.5% with the counterparties option to extend for a further five years.
£95m swaps maturing in 2031 where the counterparty has the option to cancel every three months throughout the life of the trade . These trades are expected to be cancelled between December 2008 and December 2030.
£25m swap maturing in 2041 where the counterparty has the option to cancel every five years throughout the life of the trade. This trade is expected to be cancelled in January 2026.
(2) Included within this balance is a EUR35m swap maturing in April 2006 where the counterparty has the option to cancel every three months throughout the life of the trade. This trade is expected to be cancelled in June 2004.
(3) Included within this balance is a EUR35m swap maturing in April 2006 where the counterparty has the option to cancel every three months throughout the life of the trade. This trade is expected to be cancelled in December 2005.
(4) Margins (over EURIBOR in the case of interest receivable, and over average EURIBOR in the case of interest payable) are less than 0.04%.
(5) Principal amounts under these cross currency swaps are exchanged at the start and maturity of these trades.
(6) Margins (over EURIBOR in the case of interest receivable, and over AUD bank bills in the case of interest payable) are less than 0.06%.
78
The following table presents the derivative financial instruments held by the Group at 28 September 2002.
(in £’s million unless otherwise indicated) |
|
|
|
|
|
|
| Fair value |
| ||||||||
| Accounting year ending in |
|
|
|
|
|
| ||||||||||
| 2003 |
| 2004 |
| 2005 |
| 2006 |
| 2007 |
| Thereafter |
| Total |
|
| ||
Sterling interest rate derivatives |
|
|
|
|
|
|
|
|
|
|
|
|
|
|
|
|
|
Interest rate swaps – pay fixed, receive variable: |
|
|
|
|
|
|
|
|
|
|
|
|
|
|
|
|
|
Notional amount |
|
|
| 75 |
|
|
| 25 | (2) | 50 |
| 325 | (1) | 475 |
| (38 | ) |
Weighted average interest rate to pay (%) |
|
|
| 7.6 |
|
|
| 4.3 |
| 6.6 |
| 5.6 |
| 6.0 |
|
|
|
Interest rate swaps – pay variable, receive fixed: |
|
|
|
|
|
|
|
|
|
|
|
|
|
|
|
|
|
Notional amount |
|
|
| 80 |
|
|
|
|
|
|
|
|
| 80 |
| 9 |
|
Weighted average interest rate to receive (%) |
|
|
| 7.4 |
|
|
|
|
|
|
|
|
| 7.4 |
|
|
|
Weighted average margin over LIBOR to pay (%) |
|
|
| 0.8 |
|
|
|
|
|
|
|
|
| 0.8 |
|
|
|
Euro interest rate derivatives |
|
|
|
|
|
|
|
|
|
|
|
|
|
|
|
|
|
Interest rate swaps – pay fixed, receive variable: |
|
|
|
|
|
|
|
|
|
|
|
|
|
|
|
|
|
Notional amount |
| 582 |
| 498 |
| 531 |
|
|
| 924 |
| 173 |
| 2,708 |
| (78 | ) |
Weighted average interest rate to pay (%) |
| 4.0 |
| 4.3 |
| 4.4 |
|
|
| 4.7 |
| 5.1 |
| 4.4 |
|
|
|
Interest rate swaps – pay variable, receive fixed: |
|
|
|
|
|
|
|
|
|
|
|
|
|
|
|
|
|
Notional amount |
|
|
| 252 |
| 471 |
| 629 |
| 943 |
|
|
| 2,295 |
| 102 |
|
Weighted average interest rate to receive (%) |
|
|
| 5.6 |
| 5.6 |
| 6.1 |
| 6.1 |
|
|
| 5.9 |
|
|
|
Weighted average margin over EURIBOR to pay (%) |
|
|
| 0.7 |
| 1.1 |
| 1.0 |
| 1.2 |
|
|
| 1.1 |
|
|
|
Caps purchased: |
|
|
|
|
|
|
|
|
|
|
|
|
|
|
|
|
|
Notional amount |
|
|
| 126 |
|
|
| 126 |
|
|
|
|
| 252 |
| — |
|
Weighted average strike price (%) |
|
|
| 5.5 |
|
|
| 5.5 |
|
|
|
|
| 5.5 |
|
|
|
Australian dollar interest rate derivatives |
|
|
|
|
|
|
|
|
|
|
|
|
|
|
|
|
|
Interest rate swaps – pay fixed, receive variable: |
|
|
|
|
|
|
|
|
|
|
|
|
|
|
|
|
|
Notional amount |
|
|
|
|
| 25 |
|
|
|
|
|
|
| 25 |
| — |
|
Weighted average interest rate to receive (%) |
|
|
|
|
| 5.3 |
|
|
|
|
|
|
| 5.3 |
|
|
|
Currency swaps |
|
|
|
|
|
|
|
|
|
|
|
|
|
|
|
|
|
Notional amount |
|
|
|
|
|
|
|
|
|
|
| 370 | (3) | 370 |
| 68 |
|
US dollar interest rate to receive (%) |
|
|
|
|
|
|
|
|
|
|
| 7.1 |
| 7.1 |
|
|
|
Sterling interest margin over LIBOR to pay (%) |
|
|
|
|
|
|
|
|
|
|
| 1.3 |
| 1.3 |
|
|
|
Notional amount |
| 6 | (3) | 60 | (3) | 100 | (3) |
|
|
|
| 350 | (3) | 516 |
| 26 |
|
Sterling interest rate to receive (%) |
|
|
| 7.4 |
| 6.0 |
|
|
|
|
| 6.7 |
| 6.7 |
|
|
|
Interest margin over LIBOR to receive (%) |
| 0.5 |
|
|
|
|
|
|
|
|
|
|
| 0.5 |
|
|
|
Interest margin over EURIBOR to pay (%) |
| 0.6 |
| 0.9 |
| 1.0 |
|
|
|
|
| 1.3 |
| 1.2 |
|
|
|
Notional amount |
| 98 | (3),(4) |
|
|
|
|
|
|
|
|
|
| 98 |
| 6 |
|
The Group has entered into certain swap transactions with contractual maturities exceeding those of the underlying debt being hedged, in anticipation of there being additional floating rate debt when the existing debt matures.
(1) The following trades are included within this balance:
£25m forward start five-year swaption starting October 2006 at 5.5% at the counterparties option.
£50m forward start five-year swaps starting October 2001 at 5.5% with the counterparties option to extend for a further five years.
£70m swaps maturing April 2003 at 6.0% with the counterparties option to extend for a further five years.
£95m swaps maturing in 2031 where the counterparty has the option to cancel every three months throughout the life of the trade. These trades are expected to be cancelled between July 2008 and January 2013.
(2) £25m swaps maturing in 2041 where the counterparty has the option to cancel every five years throughout the life of the trade. This trade is expected to be cancelled in April 2006.
(3) Principal amounts under these cross currency swaps are exchanged at the start and maturity of these trades.
(4) Margins (over EURIBOR in the case of interest receivable, and over AUD bank bills in the case of interest payable) are less than 0.05%.
79
16 Provisions for liabilities and charges
(In £’s million) |
| Reorganisation |
| Unfunded |
| Deferred |
| Other |
| Total |
|
|
|
|
|
|
|
|
|
|
|
|
|
As at 29 September 2002 |
| 113 |
| 301 |
| 59 |
| 58 |
| 531 |
|
Exchange movements |
| 9 |
| 35 |
| 3 |
| 12 |
| 59 |
|
Acquisition related (note 20) |
| — |
| — |
| (19 | ) | — |
| (19 | ) |
Provided/(released) in the year |
| 51 |
| 30 |
| (7 | ) | 6 |
| 80 |
|
Utilised in the year |
| (117 | ) | (20 | ) | 4 |
| (19 | ) | (152 | ) |
Classified as a debtor |
| — |
| — |
| 10 |
| — |
| 10 |
|
As at 30 September 2003 |
| 56 |
| 346 |
| 50 |
| 57 |
| 509 |
|
The reorganisation and rationalisation provision relates to the restructuring following the acquisition of Reemtsma in 2002, the closure of the Meppel factory in The Netherlands and the streamlining of operations announced in October 2001. The additional amounts provided in the year relate primarily to termination of employment. The balance of the provision will mainly be utilised by the end of 2004.
Unfunded pension obligations relate to pension schemes in Germany. The Group’s main pension schemes are held in separately administered funds and are described in note 23.
Other provisions principally relate to a long-term marketing contract which will be utilised by October 2006.
The amounts provided for deferred taxation and the amounts unprovided were as follows:
|
| Provided |
| Unprovided |
| ||||
(In £’s million) |
| 2003 |
| 2002 |
| 2003 |
| 2002 |
|
|
|
|
|
|
|
|
|
|
|
Excess of capital allowances |
| 78 |
| 96 |
| — |
| — |
|
Chargeable gains on property |
| 3 |
| — |
| 6 |
| 6 |
|
Short-term timing differences |
| (31 | ) | (37 | ) | — |
| (1 | ) |
Other |
| — |
| — |
| — |
| 3 |
|
Deferred tax provision |
| 50 |
| 59 |
| 6 |
| 8 |
|
Deferred tax asset (note 13) |
| 10 |
| — |
| 4 |
| 1 |
|
17 Called up share capital
(In £’s million) |
| 2003 |
| 2002 |
|
|
|
|
|
|
|
Authorised |
|
|
|
|
|
1,000,000,000 ordinary shares of 10p each |
| 100 |
| 100 |
|
|
|
|
|
|
|
Issued and fully paid |
|
|
|
|
|
729,200,921 ordinary shares of 10p each |
| 73 |
| 73 |
|
80
18 Share options
The following options and conditional awards over ordinary shares have been granted and are outstanding at the end of the year:
Date of grant |
| Date exercisable/ |
| Option |
|
|
|
|
| Lapsed or |
| Outstanding at |
|
Number of shares | |||||||||||||
Granted |
| Exercised | |||||||||||
|
|
|
| £ |
|
|
|
|
|
|
|
|
|
|
|
|
|
|
|
|
|
|
|
|
|
|
|
Sharesave Options |
|
|
|
|
|
|
|
|
|
|
|
|
|
UK |
|
|
|
|
|
|
|
|
|
|
|
|
|
6 December 1996 |
| 1/3/2000-31/8/2002 |
| 2.45 |
| 2,050,580 |
| (1,760,105 | ) | (290,475 | ) | — |
|
9 June 1997 |
| 1/7/2000-31/12/2002 |
| 2.70 |
| 505,614 |
| (410,467 | ) | (95,147 | ) | — |
|
12 June 1998 |
| 1/7/2001-31/12/2003 |
| 3.02 |
| 796,221 |
| (660,796 | ) | (122,864 | ) | 12,561 |
|
9 June 1999 |
| 1/8/2002-31/1/2005 |
| 4.59 |
| 599,862 |
| (175,650 | ) | (274,124 | ) | 150,088 |
|
5 June 2000 |
| 1/8/2003-31/1/2006 |
| 3.61 |
| 1,203,945 |
| (732,991 | ) | (103,324 | ) | 367,630 |
|
7 June 2001 |
| 1/8/2004-31/1/2007 |
| 4.83 |
| 758,286 |
| (13,512 | ) | (81,296 | ) | 663,478 |
|
31 May 2002 |
| 1/8/2005-31/1/2008 |
| 8.24 |
| 820,132 |
| (3,211 | ) | (69,025 | ) | 747,896 |
|
4 June 2003 |
| 1/8/2006-31/1/2009 |
| 8.22 |
| 638,919 |
| — |
| (11,274 | ) | 627,645 |
|
International: |
|
|
|
|
|
|
|
|
|
|
|
|
|
France |
|
|
|
|
|
|
|
|
|
|
|
|
|
21 June 1999 |
| 1/8/2002-31/1/2003 |
| 4.76 |
| 15,349 |
| (7,459 | ) | (7,890 | ) | — |
|
16 June 2000 |
| 1/8/2003-31/1/2004 |
| 4.03 |
| 9,214 |
| (7,217 | ) | (1,100 | ) | 897 |
|
18 June 2001 |
| 1/8/2004-31/1/2005 |
| 5.22 |
| 3,676 |
| — |
| (209 | ) | 3,467 |
|
18 June 2002 |
| 1/8/2005-31/1/2006 |
| 8.76 |
| 2,989 |
| — |
| (604 | ) | 2,385 |
|
17 June 2003 |
| 1/8/2006-31/1/2007 |
| 8.57 |
| 25,906 |
| — |
| (917 | ) | 24,989 |
|
Ireland |
|
|
|
|
|
|
|
|
|
|
|
|
|
5 June 2000 |
| 1/8/2003-31/1/2004 |
| 3.61 |
| 158,733 |
| (129,156 | ) | (12,745 | ) | 16,832 |
|
7 June 2001 |
| 1/8/2004-31/1/2005 |
| 4.83 |
| 9,564 |
| — |
| (322 | ) | 9,242 |
|
4 June 2003 |
| 1/8/2006-31/1/2007 |
| 8.22 |
| 68,955 |
| — |
| — |
| 68,955 |
|
Other |
|
|
|
|
|
|
|
|
|
|
|
|
|
21 June 1999 |
| 1/8/2002-31/1/2003 |
| 4.59 |
| 189,858 |
| (116,234 | ) | (73,624 | ) | — |
|
20 January 2000 |
| 1/3/2003-31/8/2003 |
| 4.44 |
| 57,067 |
| (20,983 | ) | (8,280 | ) | 27,804 |
|
16 June 2000 |
| 1/8/2003-31/1/2004 |
| 3.61 |
| 132,042 |
| (83,821 | ) | (12,708 | ) | 35,513 |
|
18 June 2001 |
| 1/8/2004-31/1/2005 |
| 4.83 |
| 51,148 |
| (3,614 | ) | (9,328 | ) | 38,206 |
|
18 June 2002 |
| 1/8/2005-31/1/2006 |
| 8.24 |
| 62,908 |
| (204 | ) | (10,276 | ) | 52,428 |
|
17 June 2003 |
| 1/8/2006-31/1/2007 |
| 8.22 |
| 544,718 |
| — |
| (12,258 | ) | 532,460 |
|
|
|
|
| (in US dollars) |
|
|
|
|
|
|
|
|
|
US(1) |
|
|
|
|
|
|
|
|
|
|
|
|
|
16 June 2000 |
| 1/8/2003-31/1/2004 |
| 5.47 |
| 6,076 |
| — |
| (922 | ) | 5,154 |
|
18 June 2001 |
| 1/8/2004-31/1/2005 |
| 6.96 |
| 1,266 |
| — |
| — |
| 1,266 |
|
18 June 2002 |
| 1/8/2005-31/1/2006 |
| 12.34 |
| 1,866 |
| — |
| — |
| 1,866 |
|
17 June 2003 |
| 1/8/2006-31/1/2007 |
| 12.14 |
| 7,028 |
| — |
| — |
| 7,028 |
|
|
|
|
|
|
| 8,721,922 |
| (4,125,420 | ) | (1,198,712 | ) | 3,397,790 |
|
(1) Granted as American Depositary Shares representing two ordinary shares.
Conditional awards |
| See details overleaf |
|
|
|
|
|
|
|
|
|
|
|
28 January 2000 |
|
|
|
|
| 804,370 |
| (692,704 | ) | (111,666 | ) | — |
|
29 January 2001 |
|
|
|
|
| 673,244 |
| (55,399 | ) | (69,670 | ) | 548,175 |
|
29 January 2002 |
|
|
|
|
| 650,767 |
| (21,557 | ) | (53,057 | ) | 576,153 |
|
12 August 2002 – Centenary Scheme |
|
|
|
|
| 231,941 |
| (909 | ) | (9,582 | ) | 221,450 |
|
29 January 2003 |
|
|
|
|
| 762,883 |
| (902 | ) | (10,609 | ) | 751,372 |
|
|
|
|
|
|
| 3,123,205 |
| (771,471 | ) | (254,584 | ) | 2,097,150 |
|
Long-Term Incentive Plan |
|
|
|
|
|
|
|
|
|
|
|
|
|
29 November 1999 |
| Dec 1999-Dec 2002 |
|
|
| 400,920 |
| (351,877 | ) | (49,043 | ) | — |
|
27 November 2000 |
| Nov 2000-Nov 2003 |
|
|
| 394,625 |
| (28,341 | ) | (47,369 | ) | 318,915 |
|
26 November 2001 |
| Nov 2001-Nov 2004 |
|
|
| 384,376 |
| (10,721 | ) | (45,381 | ) | 328,274 |
|
26 November 2002 |
| Nov 2002-Nov 2005 |
|
|
| 474,547 |
| (956 | ) | (21,971 | ) | 451,620 |
|
|
|
|
|
|
| 1,654,468 |
| (391,895 | ) | (163,764 | ) | 1,098,809 |
|
Total options/awards |
|
|
|
|
| 13,499,595 |
| (5,288,786 | ) | (1,617,060 | ) | 6,593,749 |
|
81
UK Sharesave Scheme
Under the terms of the Imperial Tobacco Group PLC Sharesave Scheme the Board may offer options to purchase ordinary shares in the Company to UK employees who enter into an Inland Revenue approved Save As You Earn (SAYE) savings contract. The price at which options may be offered is up to 20% less than the mid-market price of an Imperial Tobacco Group PLC share on the London Stock Exchange on the day prior to the invitation. The options may normally be exercised during the period of six months after the expiry of the SAYE contract, either three or five years after entering the Scheme.
International Sharesave Plan
Under the Plan the Board may offer options to purchase ordinary shares or American Depositary Shares (ADSs) in the Company to non-UK employees who enter into a savings contract. The price at which options may be offered varies depending on local laws, but for ordinary shares will not be less than 80% of the mid-market price of an Imperial Tobacco Group PLC share on the London Stock Exchange on the day prior to invitation. In respect of ADSs the price will not be less than 80% of the closing price on the New York Stock Exchange on the same day. Options may normally be exercised during the six months after expiry of the savings contract, three years after entering the Plan.
Long-Term Incentive Plan
In respect of the performance period ending in December 2002, the Company’s total shareholder return exceeded that of all the companies in the FTSE 100 Index. By exceeding the bottom 80 per cent of the companies in the Index, the award vested in full on 6 January 2003.
In respect of the November 2000 – November 2003 award, based on earnings per share to the end of the financial year, 100% of the award will vest, on 27 November 2003.
Share Matching Scheme
The Share Matching Scheme is designed to encourage employees to acquire and retain Imperial Tobacco Group PLC ordinary shares. There was an initiative in 2002 to mark the centenary of the founding of The Imperial Tobacco Company (of Great Britain and Ireland) Limited. All employees of the Company and its wholly owned subsidiaries employed on 10 December 2001, the date of the centenary, were invited to purchase up to £3,000 worth of Imperial Tobacco Group PLC ordinary shares and lodge them with the Employee Benefit Trusts. Provided these shares are left in the Trusts, the lodged shares will be matched on a sliding scale from 20% for one year’s retention to a maximum of 100% if they are retained for five years.
For Executive Directors and selected management, individuals may elect to invest any proportion up to a maximum of 100% of their gross bonus in Imperial Tobacco Group PLC ordinary shares to be held by the Employee Benefit Trusts. Provided that the shares elected for are left in the Trusts for three years, and the individual remains in employment with the Group, the participant would receive the original shares plus additional shares. The matching ratio for bonuses is 1:1 to encourage Directors and managers to build a meaningful shareholding in the Group.
Employee Share Ownership Trusts (ESOTs)
The Imperial Tobacco Group PLC Employee and Executive Benefit Trust and the Imperial Tobacco Group PLC 2001 Employee Benefit Trust have been established to acquire ordinary shares in Imperial Tobacco Group PLC, by subscription or purchase, from funds provided by the Group to satisfy rights to shares arising on the exercise of share options and on the vesting of the share matching and performance-related share awards. At 30 September 2003, the Trusts held 5.5m (2002: 3.9m) ordinary shares, with a nominal value of £552,042, all acquired in the open market at a cost of £49.1m (2002: £26.7m). These were financed by a gift of £1.7m and an interest free loan of £47.4m. None of the ESOT shares have been allocated to employees or Directors as at 30 September 2003. All finance costs and administration expenses connected with the ESOTs are charged to the profit and loss account as they accrue. The cost of the shares is being amortised over the performance period of the associated schemes. The Trusts have waived their rights to dividends and the shares held by the Trusts are excluded from the calculation of basic earnings per share.
82
19 Reserves
(In £’s million) |
| Share |
| Profit and |
|
|
|
|
|
|
|
As at 29 September 2001 |
| — |
| (1,174 | ) |
Premium on rights issue shares |
| 979 |
| — |
|
Issue costs of rights issue |
| (15 | ) | — |
|
Profit for the year |
| — |
| 43 |
|
Goodwill exchange movements |
| — |
| (10 | ) |
Other net exchange movements |
| — |
| 10 |
|
Taxation credit on borrowings hedging overseas equity investments |
| — |
| 2 |
|
As at 28 September 2002 |
| 964 |
| (1,129 | ) |
Profit for the year |
| — |
| 117 |
|
Goodwill exchange movements |
| — |
| (83 | ) |
Other net exchange movements |
| — |
| 101 |
|
Taxation credit on borrowings hedging overseas equity investments |
| — |
| 33 |
|
As at 30 September 2003 |
| 964 |
| (961 | ) |
The cumulative amount of goodwill written off against the Group’s reserves, net of goodwill relating to undertakings disposed of, is £2,437m (2002: £2,354m).
Included in other net exchange movements are exchange losses of £338m (2002: £36m) arising on borrowings denominated in foreign currencies designated as hedges of foreign net investments.
20 Acquisitions
Reemtsma. During 2002 the Group acquired a 90.01% interest in Reemtsma Cigarettenfabriken GmbH and entered into an Option Agreement enabling the acquisition of the outstanding 9.99%. The Group also entered into a Profit Pooling Agreement whereby the holders of the outstanding 9.99% surrendered their interests in the equity and results of Reemtsma in exchange for a fixed return. As a result the Group has consolidated 100% of the results and net assets of Reemtsma and have reflected a liability to the holders of the 9.99%. The acquisition method has been adopted. Provisional fair valuations included in the 2002 Group financial statements have, in accordance with FRS 7 “Fair values in acquisition accounting”, been finalised resulting in a decrease in net assets acquired of £47m, and a corresponding increase in purchased goodwill which has been incorporated into the 2003 Group financial statements.
The principal adjustments have been a £57m reduction on plant and machinery following completion of a comprehensive review of the assets acquired, together with a £19m decrease in associated deferred taxation liability.
83
Capital commitments
(In £’s million) |
| 2003 |
| 2002 |
|
|
|
|
|
|
|
Contracted but not provided for |
| 7 |
| 5 |
|
Operating lease annual commitments
(In £’s million) |
| Land and |
| Other |
| Land and |
| Other |
|
|
|
|
|
|
|
|
|
|
|
Leases expiring |
|
|
|
|
|
|
|
|
|
Within one year |
| 1 |
| 1 |
| 1 |
| 1 |
|
Between one and five years |
| 1 |
| 2 |
| 2 |
| 1 |
|
After five years |
| 4 |
| 1 |
| 1 |
| — |
|
22 Legal proceedings
The Group is currently involved in a number of legal cases in which claimants are seeking damages for alleged smoking-related health effects. In the opinion of the Group’s lawyers, the Group has meritorious defences to these actions, all of which are being vigorously contested. Although it is not possible to predict the outcome of the pending litigation, the Directors believe that the pending actions will not have a material adverse effect upon the results of the operations, cash flow or financial condition of the Group.
23 Pensions
The Group operates pension schemes in the UK and overseas, principally those operated by Imperial Tobacco Limited, John Player & Sons Limited, Reemtsma Holding GmbH & Co. KG, Reemtsma Cigarettenfabriken GmbH and Badische Tabakmanufaktur Roth-Händle GmbH (BTM). The main schemes are of the defined benefit type and the assets are held in trustee administered funds, apart from the German schemes which are unfunded.
The principal Group scheme, covering UK employees, is the Imperial Tobacco Pension Fund (‘the Scheme’). An actuarial valuation of the Scheme was made at 31 March 2001. The assumptions which had the most significant effect when valuing the Scheme’s liabilities were those relating to the rate of investment return earned on the Scheme’s existing assets and the rates of increase in pay and pensions. It was assumed that the future investment returns relative to market values at the valuation date would be 5% per annum and that pay and pension increases would average 4.25% and 2.5% per annum respectively. The assets were brought into account at their market value.
At 31 March 2001, the market value of the assets of the Scheme was £2,439m. The total assets were sufficient to cover 111% of the benefits that had accrued to members for past service, after allowing for expected future pay increases. Group contributions to the Scheme remain suspended having regard to the surplus disclosed in this valuation.
There was no pension cost to disclose in respect of the Scheme for the year ended 30 September 2003. The pension cost has been assessed in accordance with the advice of Watson Wyatt LLP, actuaries and consultants, using the projected unit method. There were no outstanding or prepaid contributions at the balance sheet date.
Since the date of the last formal actuarial valuation of the Scheme, stock markets have fallen significantly, impacting the valuation of the assets of the Scheme. The pension cost will be reassessed following the next formal valuation as at 31 March 2004. This valuation is not expected to have a material effect on the future profits of the Group.
Actuarial valuations of the pension liabilities of the Reemtsma Holding GmbH & Co. KG, Reemtsma Cigarettenfabriken GmbH and BTM pension schemes were undertaken at 28 September 2002 and 30 September 2003. These quantified unfunded past service liabilities of £291m at 28 September 2002 and £337m at 30 September 2003, which has been recognised in the accounts, together with the other German unfunded schemes. The assumptions which had the most significant effect when valuing the Scheme’s liabilities were those relating to the rates of increase in pay and pensions. These would be in the range of 2.8% to 2.9% for the increase in pay and 1.5% to 1.6% for the increase in pensions.
The pension cost relating to foreign schemes is calculated in accordance with local accounting principles. The pension cost for foreign schemes in the year was £34m (2002: £13m).
84
FRS 17 disclosures for the year to 30 September 2003
The Group has continued to account for pensions in accordance with SSAP 24. Full implementation of FRS 17 “Retirement benefits”, which was to be mandatory for the Group for the year ended September 2003, has been deferred by the Accounting Standards Board until accounting periods commencing on or after 1 January 2005. However, the following transitional disclosures are still required.
The results of the most recent available actuarial valuations for the principal Group schemes have been updated to 30 September 2003 by Watson Wyatt LLP, actuaries and consultants.
The main financial assumptions used in the valuation of the Schemes’ liabilities under FRS 17 are:
|
| At |
| At |
| At |
|
|
| % p.a. |
| % p.a. |
| % p.a. |
|
|
|
|
|
|
|
|
|
Inflation |
| 2.6 |
| 2.3 |
| 2.5 |
|
Rate of increase in salaries |
| 2.8 to 4.4 |
| 3.0 to 4.1 |
| 3.0 to 4.5 |
|
Rate of increase of pensions in payment |
| 1.5 to 2.6 |
| 2.0 to 2.4 |
| 1.5 to 2.5 |
|
Discount rate |
| 4.2 to 5.5 |
| 4.5 to 5.8 |
| 5.5 to 7.5 |
|
The scheme assets and the expected rate of return were:
|
| Expected rate |
| At |
| Expected rate |
| At |
| Expected rate |
| At |
|
|
| % p.a. |
| (In £’s million) |
| % p.a. |
| (In £’s million) |
| % p.a. |
| (In £’s million) |
|
|
|
|
|
|
|
|
|
|
|
|
|
|
|
Equities |
| 6.9 to 8.3 |
| 1,365 |
| 6.3 to 8.8 |
| 1,199 |
| 7.5 to 9.5 |
| 1,323 |
|
Bonds |
| 2.9 to 5.6 |
| 614 |
| 4.0 to 6.5 |
| 623 |
| 3.8 to 6.5 |
| 673 |
|
Others |
| 3.8 to 7.1 |
| 308 |
| 5.0 to 7.0 |
| 299 |
| 5.0 to 6.5 |
| 365 |
|
|
|
|
| 2,287 |
|
|
| 2,121 |
|
|
| 2,361 |
|
The following amounts at 30 September 2003 were measured in accordance with the requirements of FRS 17:
(In £’s million) |
| At |
| At |
|
|
|
|
|
|
|
Fair value of scheme assets |
| 2,287 |
| 2,121 |
|
Actuarial value of scheme liabilities |
| (2,693 | ) | (2,389 | ) |
Assets less liabilities |
| (406 | ) | (268 | ) |
Less: irrecoverable surplus in respect of the closed New Zealand Scheme |
| (1 | ) | (1 | ) |
Pension liability under FRS 17 |
| (407 | ) | (269 | ) |
Related deferred tax asset |
| 157 |
| 111 |
|
Net pension liability under FRS 17 |
| (250 | ) | (158 | ) |
Net pension liability recognised in net assets/(liabilities) |
| (208 | ) | (181 | ) |
Net pension (liability)/asset not recognised in net assets/(liabilities) |
| (42 | ) | 23 |
|
The valuation identified overall liabilities of £407m (2002: £269m) which comprised £1m (2002: £43m) in respect of schemes with a surplus, less £408m (2002: £312m) in respect of schemes with a deficit.
85
If the above amounts had been recognised in the financial statements, the Group’s net assets/(liabilities) and profit and loss account at 30 September 2003 would be as follows:
(In £’s million) |
| At |
| At |
|
|
|
|
|
|
|
Net assets/(liabilities) as reported |
| 95 |
| (75 | ) |
Add back: unfunded pension provision included in net assets |
| 346 |
| 301 |
|
Less: recognised deferred tax asset |
| (138 | ) | (120 | ) |
Net pension liability under FRS 17 |
| (250 | ) | (158 | ) |
Total FRS 17 pension adjustment |
| (42 | ) | 23 |
|
Net asset/(liability) including net pension liability under FRS 17 |
| 53 |
| (52 | ) |
Profit and loss account as reported |
| (961 | ) | (1,129 | ) |
Total FRS 17 pension adjustment |
| (42 | ) | 23 |
|
Profit and loss account including net pension liability under FRS 17 |
| (1,003 | ) | (1,106 | ) |
86
The following amounts would have been recognised in the performance statements in the year to 30 September 2003 under the requirements of FRS 17:
(In £’s million) |
| 2003 |
| 2002 |
|
|
|
|
|
|
|
Operating profit: |
|
|
|
|
|
Current service cost |
| (35 | ) | (27 | ) |
Past service cost |
| (3 | ) | (2 | ) |
Curtailment loss |
| (11 | ) | — |
|
Total operating charge |
| (49 | ) | (29 | ) |
Other finance income: |
|
|
|
|
|
Expected return on pension scheme assets |
| 141 |
| 152 |
|
Interest on pension scheme liabilities |
| (133 | ) | (123 | ) |
Net return |
| 8 |
| 29 |
|
Net impact on profit and loss before taxation |
| (41 | ) | — |
|
Pension cost recognised in the profit and loss before taxation |
| (34 | ) | (13 | ) |
Pension cost not recognised in the profit and loss before taxation |
| (7 | ) | 13 |
|
Statement of total recognised gains and losses (STRGL): |
|
|
|
|
|
Actual return less expected return on pension scheme assets |
| 124 |
| (282 | ) |
Experience (loss)/gain arising on the scheme liabilities |
| (66 | ) | 15 |
|
Loss on changes in assumptions underlying the present value of the scheme liabilities |
| (144 | ) | (66 | ) |
Currency loss |
| (35 | ) | (2 | ) |
Change in irrecoverable surplus in respect of New Zealand scheme |
| — |
| 1 |
|
Actuarial loss recognised in STRGL |
| (121 | ) | (334 | ) |
Movement in deficit during the year: |
|
|
|
|
|
(Deficit)/surplus in schemes at beginning of year |
| (269 | ) | 344 |
|
Contributions |
| 24 |
| 11 |
|
Current service cost |
| (35 | ) | (27 | ) |
Past service cost |
| (3 | ) | (2 | ) |
Curtailment loss |
| (11 | ) | — |
|
Acquisition |
| — |
| (289 | ) |
Other finance income |
| 8 |
| 29 |
|
Actuarial loss |
| (86 | ) | (334 | ) |
Currency loss |
| (35 | ) | (2 | ) |
Change in irrecoverable surplus in respect of New Zealand scheme |
| — |
| 1 |
|
Deficit in schemes at end of year |
| (407 | ) | (269 | ) |
Pension provision recognised in net assets |
| (346 | ) | (301 | ) |
Deficit in schemes at end of year not recognised in net assets |
| (61 | ) | 32 |
|
87
The details of experience gains and losses under FRS 17 for the year to 30 September 2003 are as follows:
|
| 2003 |
| 2002 |
|
|
|
|
|
|
|
Difference between the expected and actual return on scheme assets: |
|
|
|
|
|
Amount (£’s million) |
| 124 |
| (282 | ) |
Percentage of scheme assets |
| 5.4 | % | -13.3 | % |
Experience (loss)/gain on scheme liabilities: |
|
|
|
|
|
Amount (£’s million) |
| (66 | ) | 15 |
|
Percentage of the present value of the scheme liabilities |
| -2.5 | % | 0.6 | % |
Total amount recognised in statement of total recognised gains and losses: |
|
|
|
|
|
Amount (£’s million) |
| (121 | ) | (334 | ) |
Percentage of the present value of the scheme liabilities |
| -4.5 | % | -14.0 | % |
24 Reconciliation of operating profit to net cash flow from operating activities
(In £’s million) |
| 2003 |
| 2002 |
| 2001 |
|
|
|
|
|
|
|
|
|
Operating profit |
| 881 |
| 603 |
| 604 |
|
Depreciation and amortisation |
| 286 |
| 137 |
| 49 |
|
(Decrease)/increase in provisions for liabilities and charges |
| (69 | ) | 78 |
| (4 | ) |
|
|
|
|
|
|
|
|
Decrease in stocks |
| 62 |
| 11 |
| 17 |
|
Increase in debtors |
| (233 | ) | (50 | ) | (162 | ) |
(Decrease)/increase in creditors |
| (125 | ) | 45 |
| 134 |
|
Working capital cash (outflow)/inflow |
| (296 | ) | 6 |
| (11 | ) |
Net cash inflow from operating activities |
| 802 |
| 824 |
| 638 |
|
25 Reconciliation of net cash flow to movement in net debt
(In £’s million) |
| 2003 |
| 2002 |
| 2001 |
|
|
|
|
|
|
|
|
|
(Decrease)/increase in cash in the year |
| (19 | ) | 113 |
| (132 | ) |
Cash outflow/(inflow) from decrease/(increase) in debt |
| 86 |
| (1,798 | ) | (2 | ) |
Cash inflow from decrease in liquid resources |
| (58 | ) | (233 | ) | (8 | ) |
Change in net debt resulting from cash flows |
| 9 |
| (1,918 | ) | (142 | ) |
Currency and other movements |
| (382 | ) | (35 | ) | (5 | ) |
Current asset investments acquired with subsidiary |
| — |
| 199 |
| — |
|
Loans acquired with subsidiary |
| — |
| (20 | ) | (10 | ) |
Deferred consideration |
| — |
| (381 | ) | — |
|
Movement in net debt in the year |
| (373 | ) | (2,155 | ) | (157 | ) |
Opening net debt |
| (3,695 | ) | (1,540 | ) | (1,383 | ) |
Closing net debt |
| (4,068 | ) | (3,695 | ) | (1,540 | ) |
88
26 Analysis of net debt
(In £’s million) |
| Cash |
| Current |
| Loans due |
| Loans due |
| Deferred |
| Total |
|
|
|
|
|
|
|
|
|
|
|
|
|
|
|
As at 29 September 2001 |
| 198 |
| 143 |
| (496 | ) | (1,385 | ) | — |
| (1,540 | ) |
Cash flow |
| 113 |
| (233 | ) | 502 |
| (2,300 | ) | — |
| (1,918 | ) |
Acquisitions |
| — |
| 199 |
| (19 | ) | (1 | ) | — |
| 179 |
|
Exchange movements |
| 1 |
| 3 |
| (80 | ) | 41 |
| — |
| (35 | ) |
Deferred consideration |
| — |
| — |
| — |
| — |
| (381 | ) | (381 | ) |
As at 28 September 2002 |
| 312 |
| 112 |
| (93 | ) | (3,645 | ) | (381 | ) | (3,695 | ) |
Cash flow |
| (19 | ) | (58 | ) | (501 | ) | 587 |
| — |
| 9 |
|
Exchange movements |
| 28 |
| 14 |
| (11 | ) | (369 | ) | (44 | ) | (382 | ) |
As at 30 September 2003 |
| 321 |
| 68 |
| (605 | ) | (3,427 | ) | (425 | ) | (4,068 | ) |
27 Reconciliation of movements in shareholders’ funds
(In £’s million) |
| 2003 |
| 2002 |
|
|
|
|
|
|
|
Profit attributable to shareholders |
| 421 |
| 272 |
|
Dividends |
| (304 | ) | (229 | ) |
Retained profit for the year |
| 117 |
| 43 |
|
Rights issue |
| — |
| 985 |
|
Goodwill exchange movements |
| (83 | ) | (10 | ) |
Other net exchange movements |
| 101 |
| 10 |
|
Taxation credit on borrowings hedging overseas equity investments |
| 33 |
| 2 |
|
Net addition to shareholders’ funds |
| 168 |
| 1,030 |
|
Opening shareholders’ funds |
| (92 | ) | (1,122 | ) |
Closing shareholders’ funds |
| 76 |
| (92 | ) |
28 Equity minority interests
(In £’s million) |
| 2003 |
| 2002 |
|
|
|
|
|
|
|
Balance at beginning of year |
| 17 |
| 21 |
|
Exchange movements |
| 2 |
| — |
|
Acquisitions |
| — |
| 7 |
|
Dividends declared |
| (3 | ) | (3 | ) |
Purchase of shares from minorities |
| — |
| (19 | ) |
Share of profit |
| 3 |
| 11 |
|
Balance at end of year |
| 19 |
| 17 |
|
89
29 Summary of differences between UK and US generally accepted accounting principles (“GAAP”)
The accompanying consolidated financial statements have been prepared in accordance with accounting principles generally accepted in the United Kingdom (“UK GAAP”). Such principles differ in certain respects from generally accepted accounting principles in the United States (“US GAAP”). A summary of principal differences and additional disclosures applicable to the Group is set out below.
(In £’s million) |
| Explanation |
| 2003 |
| 2002 |
| 2001 |
|
|
|
|
|
|
|
|
|
|
|
Profit attributable to shareholders under UK GAAP |
|
|
| 421 |
| 272 |
| 350 |
|
US GAAP adjustments: |
|
|
|
|
|
|
|
|
|
Pensions |
| (i) |
| 2 |
| 13 |
| 45 |
|
Amortisation of goodwill |
| (ii) |
| 194 |
| 48 |
| (14 | ) |
Amortisation of brands/trade marks/licences |
| (ii) |
| (102 | ) | (38 | ) | (8 | ) |
Deferred taxation |
| (iii) |
| 57 |
| 16 |
| (45 | ) |
Mark to market adjustments – reversal of derivatives beyond committed debt |
| (iv) |
| — |
| — |
| 1 |
|
Mark to market adjustments due to non designation of hedge accounting per SFAS 133 |
| (iv) |
| (82 | ) | (10 | ) | 105 |
|
Employee share schemes charge to the profit and loss account |
| (vii) |
| 6 |
| (4 | ) | — |
|
Acquisitions inventory step-up |
| (viii) |
| — |
| (42 | ) | (8 | ) |
Restructuring costs on acquisition |
| (ix) |
| — |
| 44 |
| — |
|
Net income under US GAAP |
|
|
| 496 |
| 299 |
| 426 |
|
(In pence) |
| Explanation |
| 2003 |
| 2002 |
| 2001 |
|
|
|
|
|
|
|
|
|
|
|
Amounts in accordance with US GAAP |
|
|
|
|
|
|
|
|
|
Basic net income per ordinary share |
| (x) |
| 68.5 |
| 45.1 |
| 68.9 |
|
Basic net income per ADS |
| (x) |
| 137.0 |
| 90.2 |
| 137.8 |
|
Diluted net income per ordinary share |
| (x) |
| 68.2 |
| 44.8 |
| 68.4 |
|
Diluted net income per ADS |
| (x) |
| 136.4 |
| 89.6 |
| 136.8 |
|
(In £’s million) |
| Explanation |
| 2003 |
| 2002 |
|
|
|
|
|
|
|
|
|
Equity shareholders’ funds under UK GAAP |
|
|
| 76 |
| (92 | ) |
US GAAP adjustments: |
|
|
|
|
|
|
|
Pensions |
| (i) |
| 345 |
| 335 |
|
Goodwill, less accumulated amortisation of £(190)m (2002: £4m) |
| (ii) |
| (1,060 | ) | (1,122 | ) |
Brands/trade marks/licences, less accumulated amortisation of £162m (2002: £62m) |
| (ii) |
| 2,921 |
| 2,712 |
|
Deferred taxation |
| (iii) |
| (1,008 | ) | (967 | ) |
Mark to market adjustments due to non designation of hedge accounting per SFAS 133 |
| (iv) |
| 13 |
| 95 |
|
Proposed dividend |
| (v) |
| 217 |
| 167 |
|
ESOT shares |
| (vi) |
| (36 | ) | (19 | ) |
Employee share schemes |
| (vii) |
| 2 |
| (4 | ) |
Shareholders’ funds under US GAAP |
|
|
| 1,470 |
| 1,105 |
|
The preparation of financial statements requires management to make estimates and assumptions that affect the reported amounts of assets and liabilities, disclosure of contingent assets and liabilities at the date of the financial statements, and the reported amounts of revenues and expenses during the reported period. Actual results could differ from those estimates.
90
Under UK GAAP, pension costs are accounted for under the rules set out in Statement of Standard Accounting Practice No. 24 (SSAP 24). Its objectives and principles are broadly in line with those set out in the US accounting standard for pensions, Statement of Financial Accounting Standard No. 87, “Employers’ Accounting for Pensions” (SFAS 87). However, SSAP 24 is less prescriptive in the application of the actuarial method and assumptions to be applied in the calculation of pension costs.
Group contributions to the Imperial Tobacco Pension Fund (‘the Scheme’) are suspended as a result of the surplus disclosed in note 23. Under UK GAAP, in accordance with SSAP 24, no pension expense has been reflected in the profit and loss account and no pension asset has been recognised in the balance sheet for the UK and Irish pension schemes. A pension liability and related pension expense is recognised for the German unfunded pension schemes, in accordance with SSAP 24.
Under US GAAP, the annual pension cost comprises the estimated cost of benefits accruing in the period as determined in accordance with SFAS 87. Under SFAS 87, a pension asset representing the excess of Scheme assets over benefit obligations has been recognised in the balance sheet.
(ii) Intangible assets
Both UK and US GAAP require purchase consideration to be allocated to the net assets acquired at their fair value on the date of acquisition. Under UK GAAP, goodwill arising and separately identifiable and separable intangible assets acquired on acquisitions made on, or after, 27 September 1998 are capitalised and amortised over their useful life, not exceeding a period of 20 years. Prior to 27 September 1998, all goodwill and separately identifiable and separable intangible assets were written off to reserves on acquisition.
Under US GAAP, identifiable intangible assets are separately valued and amortised over their useful lives. The separately identifiable intangible assets included in the US GAAP balance sheet are principally comprised of brand rights which are being amortised over 25 to 30 years.
The Company adopted SFAS 142, “Goodwill and Other Intangible Assets” with effect from 1 July 2001 and accordingly goodwill generated on acquisitions after this date was not amortised. For purchase transactions prior to 1 July 2001, goodwill was capitalised and amortised over its useful life. From 29 September 2002, in accordance with SFAS 142, the Company no longer amortises goodwill but rather tests such assets for impairment on an annual basis or where there is an indicator of impairment.
The Company has completed the first step of the impairment test under the transitional requirements of SFAS 142 and an annual impairment review as of 30 September 2003. No impairment charge of goodwill was indicated. A reconciliation of previously reported net income under US GAAP and income per share to the amounts adjusted for the exclusion of goodwill amortisation is presented below. Income per ordinary share adjusted for goodwill charges is calculated by adding back the goodwill charge to net income and dividing by the weighted average ordinary shares outstanding for all periods presented.
(In £’s million) |
| 2003 |
| 2002 |
| 2001 |
|
|
|
|
|
|
|
|
|
Net income under US GAAP |
| 496 |
| 299 |
| 426 |
|
Adjustment for net goodwill amortisation |
| — |
| 27 |
| 22 |
|
Adjusted |
| 496 |
| 326 |
| 448 |
|
(In pence) |
| 2003 |
| 2002 |
| 2001 |
|
|
|
|
|
|
|
|
|
Basic net income per ordinary share |
| 68.5 |
| 45.1 |
| 68.9 |
|
Adjustment for net goodwill amortisation |
| — |
| 4.1 |
| 3.6 |
|
Adjusted |
| 68.5 |
| 49.2 |
| 72.5 |
|
(In pence) |
|
|
|
|
|
|
|
|
|
|
|
|
|
|
|
Diluted net income per ordinary share |
| 68.2 |
| 44.8 |
| 68.4 |
|
Adjustment for net goodwill amortisation |
| — |
| 4.0 |
| 3.5 |
|
Adjusted |
| 68.2 |
| 48.8 |
| 71.9 |
|
91
(iii) Deferred taxation
Under UK GAAP, deferred taxation is provided in full on all material timing differences. Deferred tax assets are recognised where their recovery is considered more likely than not.
US GAAP requires deferred taxation to be provided in full, using the liability method. In addition, US GAAP requires the recognition of the deferred tax consequences of differences between the assigned values and the tax bases of the identifiable intangible assets, with the exception of non tax-deductible goodwill, in a purchase business combination. Consequently, the deferred tax liability attributable to identifiable intangible assets has been recognised and is being amortised over the useful economic lives of the underlying intangible assets.
(iv) Derivative financial instruments
The Group has entered into certain swap transactions with contractual maturities exceeding those of the underlying debt being hedged, in anticipation of there being additional floating rate debt when the existing debt matures. Under UK GAAP, derivative financial instruments that reduce exposures on anticipated future transactions may be accounted for using hedge accounting.
US GAAP requires the Group to record all derivatives on the balance sheet at fair value. The Group has decided not to satisfy the SFAS 133 requirements to achieve hedge accounting for its derivatives, where permitted, and accordingly movements in the fair value of derivatives are recorded in the profit and loss account.
(v) Proposed dividends
Under UK GAAP, dividends paid and proposed are shown on the face of the profit and loss account as an appropriation of the current year’s earnings. Proposed dividends are provided on the basis of recommendation by the Directors and are subject to subsequent approval by shareholders.
Under US GAAP, dividends are recorded in the period in which they are approved by the shareholders.
(vi) Shares held by the Employee Share Ownership Trusts (ESOTs)
Under UK GAAP, shares held by the Trusts are recorded at cost and reflected as a fixed asset investment in the Group’s balance sheet.
Under US GAAP, these shares are recorded at cost and reflected as a deduction from shareholders’ funds.
(vii) Employee share schemes charge to the profit and loss account
Under UK GAAP, the cost of shares purchased by the ESOTs in conjunction with an employee share scheme are charged to the profit and loss account according to the book value of the shares at the date of purchase. The cost of employee share schemes not held under the ESOTs are charged using the quoted market price of shares at the date of grant. The charge is accrued over the vesting period of the shares in both cases.
Under US GAAP, the compensation cost is recognised for the difference between the exercise price of the share options granted and the quoted market price of the shares at the date of grant or measurement date and accrued over the vesting period of the options. For option plans which contain performance criteria, compensation cost is remeasured at each period end until all performance criteria have been met.
(viii) Inventory step-up
On acquisition under UK GAAP, the fair value of inventory is represented by the acquired companies’ current cost of reproducing that inventory.
On acquisition under US GAAP, the fair value represents the selling price less any further costs to be incurred to sale.
92
(ix) Restructuring costs
On acquisition under UK GAAP, restructuring provisions may only be recognised as a fair value adjustment, if the acquired company had an irrevocable commitment to restructure which was not conditional on the completion of the purchase.
On acquisition under US GAAP, restructuring liabilities relating solely to the acquired entity may be provided in the opening balance as a fair value exercise, if specific criteria about restructuring plans are met.
(x) Net income per share
The following table sets forth the computation of basic and diluted net income per ordinary share in accordance with SFAS 128.
(In £’s million) |
| 2003 |
| 2002 |
| 2001 |
|
|
|
|
|
|
|
|
|
Numerator: |
|
|
|
|
|
|
|
Numerator for basic and diluted net income per ordinary share |
| 496 |
| 299 |
| 426 |
|
Denominator (number of shares): |
|
|
|
|
|
|
|
Denominator for basic net income per ordinary share |
| 724,328,162 |
| 663,380,317 |
| 618,713,424 |
|
Effect of Common Stock Equivalents (number of shares): |
|
|
|
|
|
|
|
Employees share options |
| 3,225,153 |
| 3,677,285 |
| 4,090,105 |
|
Denominator for diluted net income per ordinary share |
| 727,553,315 |
| 667,057,602 |
| 622,803,529 |
|
Basic net income per ordinary share |
| 68.5 | p | 45.1 | p | 68.9 | p |
Diluted net income per ordinary share |
| 68.2 | p | 44.8 | p | 68.4 | p |
Basic net income per ADS |
| 137.0 | p | 90.2 | p | 137.8 | p |
Diluted net income per ADS |
| 136.4 | p | 89.6 | p | 136.8 | p |
Each American Depositary Share (ADS) represents two Imperial Tobacco Group PLC ordinary shares.
(xi) US GAAP equity roll forward
Shareholders’ equity roll forward prepared in accordance with US GAAP is as follows:
(In £’s million) |
| 2003 |
| 2002 |
|
|
|
|
|
|
|
Balance at beginning of year |
| 1,105 |
| (1 | ) |
Net income |
| 496 |
| 299 |
|
Rights issue |
| — |
| 985 |
|
Dividends |
| (254 | ) | (184 | ) |
ESOT shares |
| (17 | ) | (6 | ) |
Net exchange movements |
| 140 |
| 12 |
|
Balance at end of year |
| 1,470 |
| 1,105 |
|
93
(xii) Cash flow statements
The consolidated cash flow statements have been prepared under UK GAAP in accordance with FRS 1 (revised) and present substantially the same information as required under SFAS 95. There are certain differences between FRS 1 (revised) and SFAS 95 with regard to classification of items within the cash flow statement.
In accordance with FRS 1 (revised), cash flows are prepared separately for operating activities, returns on investments and servicing of finance, taxation, capital expenditure and financial investment, acquisitions and disposals, equity dividends paid, management of liquid resources and financing. Under SFAS 95, cash flows are classified under operating activities, investing activities and financing activities. Under FRS 1 (revised), cash is defined as cash in hand and deposits repayable on demand, less overdrafts repayable on demand. Under SFAS 95, cash and cash equivalents are defined as cash and investments with original maturities of three months or less.
A summary of the Group’s cash flows from operating, investing and financing activities classified in accordance with SFAS 95 is presented below. For the purposes of this summary, the Group considers all highly liquid investments with a maturity of three months or less at the time of purchase to be cash equivalents.
(In £’s million) |
| 2003 |
| 2002 |
| 2001 |
|
|
|
|
|
|
|
|
|
Net cash provided by operating activities |
| 411 |
| 511 |
| 324 |
|
Net cash used in investing activities |
| (108 | ) | (3,023 | ) | (299 | ) |
Net cash (used in)/provided by financing activities |
| (380 | ) | 2,591 |
| (165 | ) |
Net (decrease)/increase in cash and cash equivalents |
| (77 | ) | 79 |
| (140 | ) |
Effect of exchange rate changes on cash and cash equivalents |
| 42 |
| 4 |
| 1 |
|
Cash and cash equivalents at beginning of year |
| 424 |
| 341 |
| 480 |
|
Cash and cash equivalents at end of year |
| 389 |
| 424 |
| 341 |
|
Cash and cash equivalents at end of year are: |
|
|
|
|
|
|
|
Cash at bank and in hand |
| 321 |
| 312 |
| 198 |
|
Current asset investments |
| 68 |
| 112 |
| 143 |
|
94
(xiii) Impact of new accounting standards
In April 2003, the Financial Accounting Standards Board (FASB) issued SFAS 149 “Amendment of Statement 133 on Derivative Instruments and Hedging Activities”. SFAS 149 amends and clarifies financial accounting and reporting for derivative instruments, including certain derivative instruments embedded in other contracts (collectively referred to as derivatives) and for hedging activities under SFAS 133. This statement is effective for contracts entered into or modified after 30 June 2003 and for hedging relationships designated after 30 June 2003. The adoption of this statement is not expected to have a material effect on the Company’s results.
In May 2003, the FASB issues SFAS 150, “Accounting for Certain Financial Instruments with Characteristics of both Liabilities and Equity”. SFAS 150 establishes standards on how a company classifies and measures certain financial instruments with characteristics of both liabilities and equity. It requires that a company classify a financial instrument that is within its scope as a liability (or an asset in some circumstances). Many of those instruments were previously classified as equity. This statement is effective for financial instruments entered into or modified after 31 May 2003 and otherwise is effective for the first fiscal period beginning after 15 December 2003. The adoption of this statement is not expected to have a material effect on the Company’s results.
In January 2003, the FASB issued FIN No. 46, “Consolidation of Variable Interest Entities, an Interpretation of Accounting Research Bulletin No. 51.” FIN No. 46 requires certain variable interest entities, or VIEs, to be consolidated by the primary beneficiary of the entity if the equity investors in the entity do not have the characteristics of a controlling financial interest or do not have sufficient equity at risk for the entity to finance its activities without additional subordinated financial support from other parties. FIN No. 46 is effective for all VIEs created or acquired after 31 January 2003. For VIEs created or acquired prior to 1 February 2003, the provisions of FIN No. 46 must be applied for the first interim or annual period beginning after 15 December 2003. The Group currently have no contractual relationship or other business relationship with a variable interest entity and, therefore, the Group does not expect the adoption of FIN No. 46 to have a material effect on its consolidated financial position, results of operations or cash flows.
95
IMPERIAL TOBACCO GROUP PLC
BALANCE SHEET
at 30 September 2003
(In £’s million) |
| Notes |
| 2003 |
| 2002 |
|
|
|
|
|
|
|
|
|
Tangible fixed assets |
|
|
|
|
|
|
|
Investments |
| (i) |
| 1,035 |
| 1,035 |
|
Current assets |
|
|
|
|
|
|
|
Debtors |
| (ii) |
| 491 |
| 479 |
|
Cash |
|
|
| — |
| 9 |
|
|
|
|
| 491 |
| 488 |
|
Creditors: amounts falling due within one year |
| (iii) |
| (345 | ) | (274 | ) |
Net current assets |
|
|
| 146 |
| 214 |
|
Total assets less current liabilities |
|
|
| 1,181 |
| 1,249 |
|
Net assets |
|
|
| 1,181 |
| 1,249 |
|
|
|
|
|
|
|
|
|
Capital and reserves |
|
|
|
|
|
|
|
Called up share capital |
| (iv) |
| 73 |
| 73 |
|
Share premium account |
| (v) |
| 964 |
| 964 |
|
Profit and loss account |
| (v) |
| 144 |
| 212 |
|
Equity shareholders’ funds |
|
|
| 1,181 |
| 1,249 |
|
/s/ Derek Bonham |
|
| /s/ Robert Dyrbus |
|
|
|
| ||
|
|
| ||
DEREK BONHAM |
| ROBERT DYRBUS | ||
Chairman |
| Director | ||
96
NOTES TO THE IMPERIAL TOBACCO GROUP PLC
BALANCE SHEET
(i) Investments held as fixed assets
(In £’s million) |
| 2003 |
| 2002 |
|
|
|
|
|
|
|
Cost of shares in Imperial Tobacco Holdings Limited |
| 1,035 |
| 1,035 |
|
A list of the principal subsidiaries of the Company is shown on pages 99 and 100.
(ii) Debtors: amounts falling due within one year
(In £’s million) |
| 2003 |
| 2002 |
|
|
|
|
|
|
|
Amounts owed by Group undertakings |
| 490 |
| 478 |
|
Other debtors and prepayments |
| 1 |
| 1 |
|
|
| 491 |
| 479 |
|
(iii) Creditors: amounts falling due within one year
(In £’s million) |
| 2003 |
| 2002 |
|
|
|
|
|
|
|
Bank overdrafts |
| 10 |
| — |
|
Amounts owed to Group undertakings |
| 117 |
| 94 |
|
Other creditors |
| 1 |
| 13 |
|
Proposed dividend |
| 217 |
| 167 |
|
|
| 345 |
| 274 |
|
(iv) Called up share capital
(In £’s million) |
| 2003 |
| 2002 |
|
|
|
|
|
|
|
Authorised |
|
|
|
|
|
1,000,000,000 ordinary shares of 10p each |
| 100 |
| 100 |
|
Issued and fully paid |
|
|
|
|
|
729,200,921 ordinary shares of 10p each |
| 73 |
| 73 |
|
97
(v) Reserves
(In £’s million) |
| Share |
| Profit and |
|
|
|
|
|
|
|
As at 29 September 2002 |
| 964 |
| 212 |
|
Retained loss for the year |
| — |
| (68 | ) |
As at 30 September 2003 |
| 964 |
| 144 |
|
As permitted by section 230(3) of the Companies Act 1985, the profit and loss account of the Company is not presented. The profit attributable to shareholders, dealt with in the accounts of the Company, is £235m (2002: £339m).
(vi) Contingent liabilities
Imperial Tobacco Group PLC has guaranteed various borrowings and liabilities of certain UK and overseas subsidiary undertakings, including its Dutch and Irish subsidiaries. At 30 September 2003, the contingent liability totalled £4,547m (2002: £4,342m).
The guarantees include the Dutch subsidiaries which, in accordance with Book 2, Article 403 of The Netherlands Civil Code, do not file separate accounts with the Chamber of Commerce. Under the same article, Imperial Tobacco Group PLC has issued declarations to assume any and all liability for any and all debts of the Dutch subsidiaries.
The guarantees also cover the Irish subsidiaries, all of which are included in the consolidated balance sheet as at 30 September 2003. The Irish companies, namely John Player & Sons Limited, John Player Distributors Limited and Van Nelle (Ireland) have therefore availed themselves of the exemption provided by section 17 of the Irish Companies (Amendment) Act 1986 in respect of documents required to be attached to the annual returns for such companies.
98
PRINCIPAL SUBSIDIARIES
The principal wholly owned subsidiaries of the Group held throughout the year, all of which are unlisted, are shown below:
Registered in England and Wales
Name |
| Principal activity |
|
|
|
Imperial Tobacco Limited |
| Manufacture, marketing and sale of tobacco products in the UK |
Imperial Tobacco Finance PLC |
| Finance company |
Imperial Tobacco Holdings Limited |
| Holding investments in subsidiary companies |
Imperial Tobacco International Limited |
| Export and marketing of tobacco products |
Rizla UK Limited |
| Manufacture of rolling papers in the UK |
Incorporated overseas
Name and country of incorporation |
| Principal activity |
|
|
|
Badische Tabakmanufaktur Roth-Händle GmbH, Germany |
| Manufacture, marketing and sale of tobacco products in Germany |
Ets. L. Lacroix Fils N.V. (Rizla Belgium N.V.), Belgium |
| Manufacture of rolling papers and accessories and marketing and sale of tobacco products in Belgium |
Imperial Tobacco (Asia) Pte. Ltd., Singapore |
| Marketing and sale of cigarettes in South East Asia |
Imperial Tobacco Australia Limited, Australia |
| Marketing and sale of tobacco products in Australia |
Imperial Tobacco New Zealand Limited, New Zealand |
| Manufacture, marketing and sale of tobacco products in New Zealand |
Imperial Tobacco Overseas B.V., The Netherlands |
| Finance company |
John Player & Sons Limited, Republic of Ireland |
| Manufacture, marketing and sale of tobacco products in the Republic of Ireland |
Reemtsma Debreceni Dohánigyàr Kft, Hungary |
| Manufacture, marketing and sale of cigarettes in Hungary |
John Player S.A., Spain |
| Marketing and sale of cigarettes in Spain |
Imperial Tobacco (Asia) Ptd. Ltd., China |
| Marketing of cigarettes in China |
Reemtsma International Praha spol s.r.o., Czech Republic |
| Marketing and sale of cigarettes in the Czech Republic |
Reemtsma Kiev Tyutyunova Fabrika, Ukraine |
| Manufacture of cigarettes in the Ukraine |
Reemtsma Ukraine, Ukraine |
| Marketing and sale of cigarettes in the Ukraine |
OOO Reemtsma Volga Tabakfabrik, Russia |
| Manufacture of tobacco products in Russia |
OOO Reemtsma, Russia |
| Marketing and sale of cigarettes in Russia |
Slovak International Tabac a.s., Slovak Republic |
| Manufacture, marketing and sale of tobacco products in the Slovak Republic |
Van Nelle Tabak Nederland B.V., The Netherlands |
| Manufacture of roll your own and pipe tobaccos and marketing and sale of tobacco products in The Netherlands |
Van Nelle Tobacco International Holdings B.V., The Netherlands |
| Sale of roll your own and pipe tobaccos |
99
The principal partly owned subsidiaries of the Group, held throughout the year, are shown below. All are unlisted unless otherwise indicated:
Incorporated overseas
Name and country of incorporation |
| Principal activity |
| Percentage |
|
|
|
|
|
|
|
CINTA Compagnie Indépendente des Tabacs S.A., Belgium |
| Marketing and sale of tobacco products in Belgium |
| 75 |
|
Dunkerquoise des Blends S.A., France |
| Tobacco processing |
| 100 |
|
Reemtsma Cigarettenfabriken GmbH, Germany |
| Manufacture, marketing and sale of tobacco products in Germany and export of cigarettes |
| 90 |
|
Reemtsma Kyrgyzstan AO, Kyrgyzstan |
| Manufacture, marketing and sale of tobacco products in Kyrgyzstan |
| 99 |
|
Reemtsma Polska S.A., Poland |
| Manufacture, marketing and sale of tobacco products in Poland |
| 96 |
|
Societe Ivoirienne des Tabacs S.A.(1), Cote d’Ivoire |
| Manufacture, marketing and sale of tobacco products in the Ivory Coast |
| 73 |
|
Tobaccor S.A., France |
| Holding investments in subsidiary companies |
| 86 |
|
Tobačna Ljubljana d.o.o, Slovenia |
| Manufacture, marketing and sale of tobacco products in Slovenia |
| 76 |
|
(1) Listed on the Cote d’Ivoire Stock Exchange
In addition the Group also wholly owns the following partnerships:
Name and country |
| Principal activity |
|
|
|
Imperial Tobacco (EFKA) GmbH & Co. KG, Germany |
| Manufacture of tubes in Germany |
|
|
|
Reemtsma Holding GmbH & Co. KG, Germany |
| Holding investments in subsidiary companies |
* The percentage of issued share capital held by immediate parent and the effective voting rights of the Group are the same, with the exception of Tobačna Ljubljana d.o.o. in which the Group holds 99% of the voting rights.
The consolidated Group financial statements include all the subsidiary undertakings and entities shown above. With the exception of Imperial Tobacco Holdings Limited, which is wholly owned by the Company, none of the shares in the subsidiaries are held by the Company. A full list of subsidiaries is attached to the Annual Return of the Company.
100
[GRAPHIC]
[GRAPHIC]
IMPERIAL TOBACCO GROUP PLC
PO BOX 244
SOUTHVILLE
BRISTOL BS99 7UJ
www.imperial-tobacco.com